
Comparative Study on Carbon Emission of the Cyanobacteria Mud Disposal Process
National Engineering Research Center of Dredging, Shanghai 200082, China
*
Author to whom correspondence should be addressed.
Water 2023, 15(3), 528; https://doi.org/10.3390/w15030528
Submission received: 10 December 2022
/
Revised: 19 January 2023
/
Accepted: 20 January 2023
/
Published: 28 January 2023
(This article belongs to the Special Issue Biological Treatment of Sewage and Resource Utilization of Sludge)
Abstract
:Endogenous pollutants such as cyanobacteria have an essential impact on the global carbon cycle and climate. Finding a reasonable way to dispose of them has become an urgent task for current watershed management and ecological restoration. According to the engineering practice of cyanobacteria treatment by aerobic fermentation, the carbon emissions of three typical cyanobacterial resource utilization processes, aerobic fermentation without auxiliary materials, aerobic fermentation with auxiliary materials, and incineration for power generation, are compared in this paper, using the mandatory guidelines by the Intergovernmental Panel on Climate Change (IPCC). The results show that the treatment of cyanobacterial mud through aerobic fermentation without auxiliary materials can realize the goal of the harmless recycling of cyanobacterial resources with less carbon emissions, at 175.3 kg CO2·t−1. In addition, each link’s impact on the overall carbon emission process was analyzed. In aerobic fermentation with auxiliary materials, the carbon emissions were significantly contributed by the auxiliary materials, which was accounted for 46.3% of the carbon emission of the whole process and 32.77% of the drying-incineration process. In contrast, with the lowest carbon emission level, aerobic fermentation without auxiliary materials can avoid the production of carbon emissions caused by auxiliary fermentation materials.
1. Introduction
In the past few decades, human productive activities have caused an increase in the amount of exogenous nutrients in lakes, resulting in these lakes’ eutrophication and Cyanophyta bloom. Among them, the outbreak of cyanobacteria in lakes threatens the survival of aquatic animals [1,2,3], and it even poses risks to humans [4,5]. In addition, the rapid growth of cyanobacteria results in a significant increase in the amount of dissolved organic carbon in water [6,7], which in turn leads to the deposition of organic carbon, and finally, influences global carbon cycling and climate change [8,9,10]. Taking Taihu Lake, Chaohu Lake, and the Dian Lake as examples, the salvage of Cyanophyta water exceeded 8 million tons in 2020 [11,12]. The salvage, dehydration, landfill, treatment, and disposal of algal water will lead to different amounts of carbon emissions. Currently, there is no papers focusing on calculating the carbon emissions of the cyanobacterial recycling process. Aerobic fermentation is a typical process for cyanobacterial treatment, and this paper calculates the amount of carbon emission based on the engineering example of cyanobacteria treated in the aerobic fermentation process. In addition, the carbon emissions in the dry incineration process are also compared to realize carbon identification and the carbon assessment of each disposal process.
At present, the outbreak of cyanobacteria in large watersheds in China is still severe. Taking Taihu Lake as an example, the salvage of cyanobacteria in Taihu Lake in Wuxi reached 1.6985 million tons in 2020, according to the Jiangsu Provincial Department of Finance. The cyanobacteria that were not treated in time will release carcinogenic cyanotoxins, endanger the underground water sources, and harm the human body and surrounding animals and plants [13,14,15,16,17,18]. Therefore, the timely and effective treatment of salvaged cyanobacteria is an essential guarantee for realizing the goal of controlling the endogenous pollution of lakes.
Researchers have completed a lot of work on the treatment and comprehensive utilization of cyanobacteria. Aerobic fermentation, anaerobic fermentation, incineration for power generation, and the extraction of active substances are effective ways to harmlessly recycle cyanobacteria, and these methods realize the regeneration and utilization of resources [19,20,21]. However, some methods still have problems, such as high costs, and there are only a few engineering applications, which makes it difficult to use them in practical applications. In recent years, the typical ways to achieve cyanobacteria recycling in China have been incineration for power generation and aerobic fermentation [22,23].
The dry incineration of cyanobacteria is a recycling method that uses cyanobacteria to generate electricity. After the cyanobacteria are salvaged, they are separated from the cyanophyta water and become cyanobacterial mud. When the moisture content is reduced to 40%, the cyanobacterial mud is transferred to the incinerator to generate electricity. The dry incineration treatment is a basic and harmless exploration of cyanobacteria recycling. Studies have shown that the heat loss due to direct incineration is relatively significant. For each ton of cyanobacterial mud with a moisture content of 80%, the plant needs to consume an additional 91.4 kg of standard coal [24], so this method is considered to have the problems of high energy consumption and high carbon emission rates.
Because of the easy operation and low cost of it, aerobic fermentation is used for cyanobacteria cycling. After the cyanobacteria mud is transported to the recycling plant, it will enter a fermentation process that lasts for 7–15 days [25]. According to the fermentation method and whether supplementary materials are needed or not, aerobic fermentation is divided into aerobic fermentation with supplementary materials and synergistic aerobic fermentation without supplementary materials. The greenhouse gases emitted during this process mainly occur due to the indirect emission of fuel oil in the process of transportation, the indirect emission of electricity and chemicals during mechanical dehydration, the indirect emission of electricity, and the direct emission of greenhouse gases in the fermentation process, and the purification carbon emission of the tailwater.
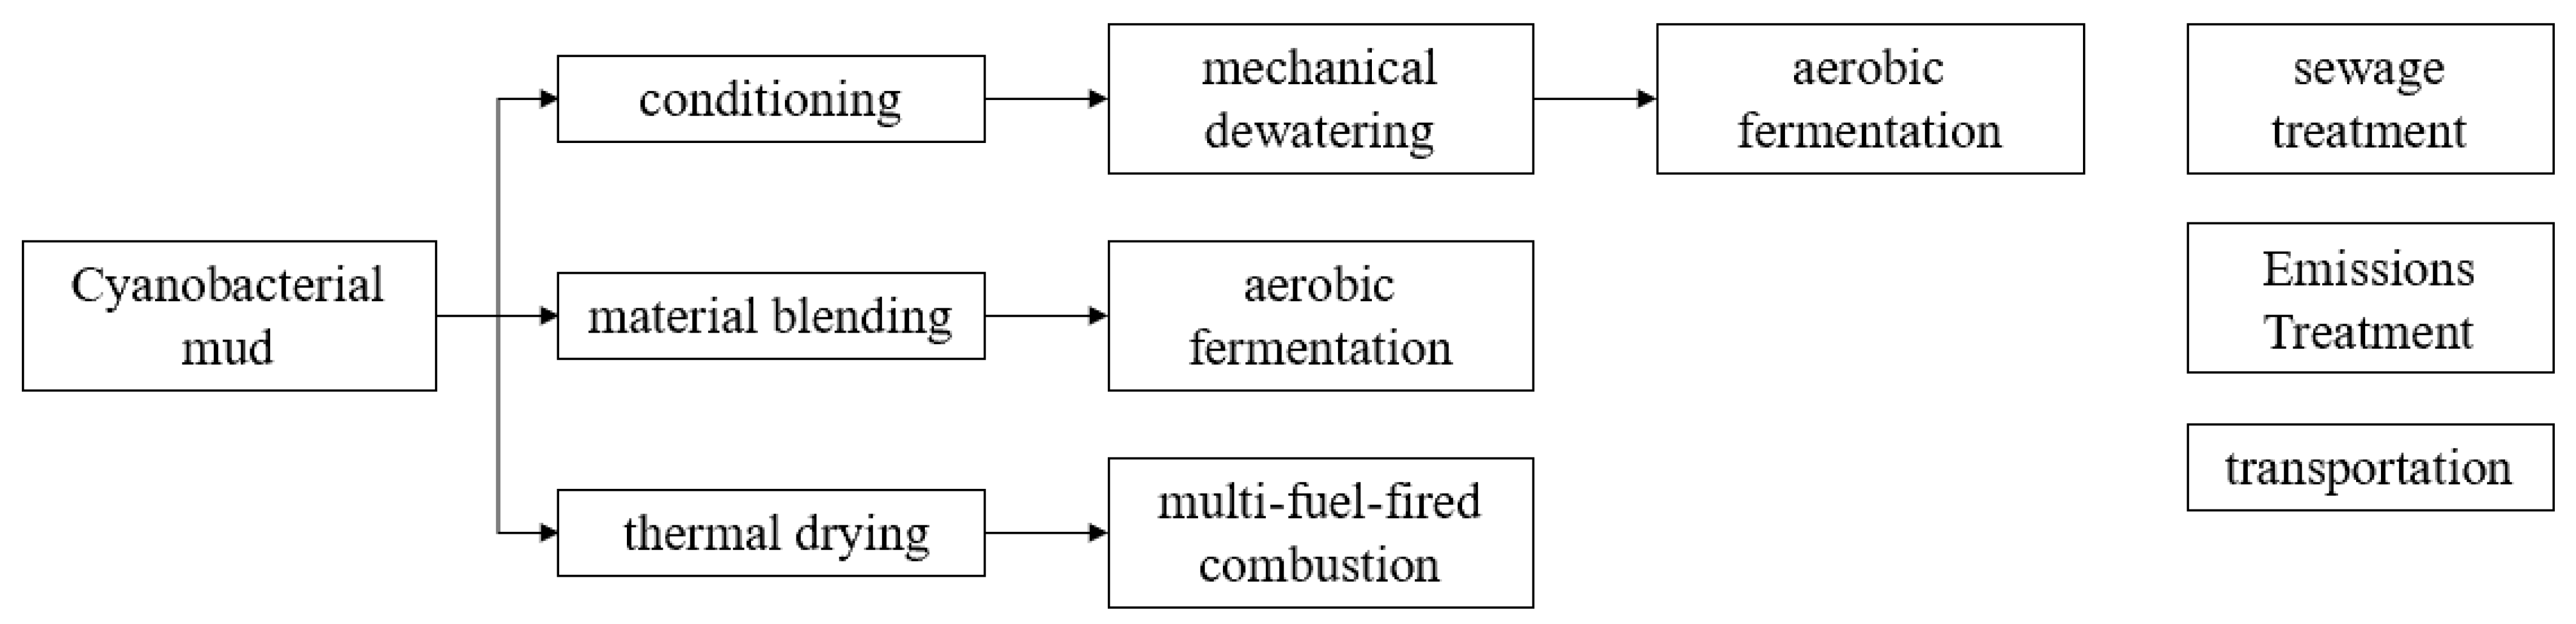
To facilitate the comparison of the carbon emission levels of the cyanobacteria treatment options, this paper uniformly takes cyanobacterial mud (a water content of 85%) as the research object. Briefly, the process and main carbon emission units of the three harmless cyanobacteria resources studied in this paper are shown in the process flowchart in Figure 1. Notably, other greenhouse gases such as methane and nitrogen oxides generated during cyanobacteria treatment and disposal are converted into carbon dioxide emission equivalents according to the 100 year global warming potential.
2. Materials and Methods
2.1. Study Site and Sample Collection
The cyanobacteria used in this study are from initially de-watered cyanobacterial mud obtained from the waters near Zhangjia Bay (31°08′55.9″ N, 120°16′9.3″ E) in Taihu Lake, and the fermentation process was conducted at the plant for the resource utilization of cyanobacteria (31°11′25.8″ N, 20°39′27.0″ E), which is about 50 km away from Zhangjia Bay. Influenced by the prevailing summer monsoon, many cyanobacteria are trapped by the emergent plants in the nearshore areas that have extremely large cyanobacteria accumulations [26], which has frequently occurred Taihu Lake since the 1990s. And the location is indicated in Figure 2. To obtain cyanobacteria for fermentation experiments, from May to September 2022, the cyanobacteria were continuously collected using ships and a nearshore cyanobacteria pipeline that is 15 cm below the water surface on the shore of Zhangjia Bay. Then, the salvaged cyanobacteria were initially mechanically de-watered in the algae water separation station, and then transported to the aerobic fermentation plant.
2.2. Auxin-Free Aerobic Fermentation Experiment
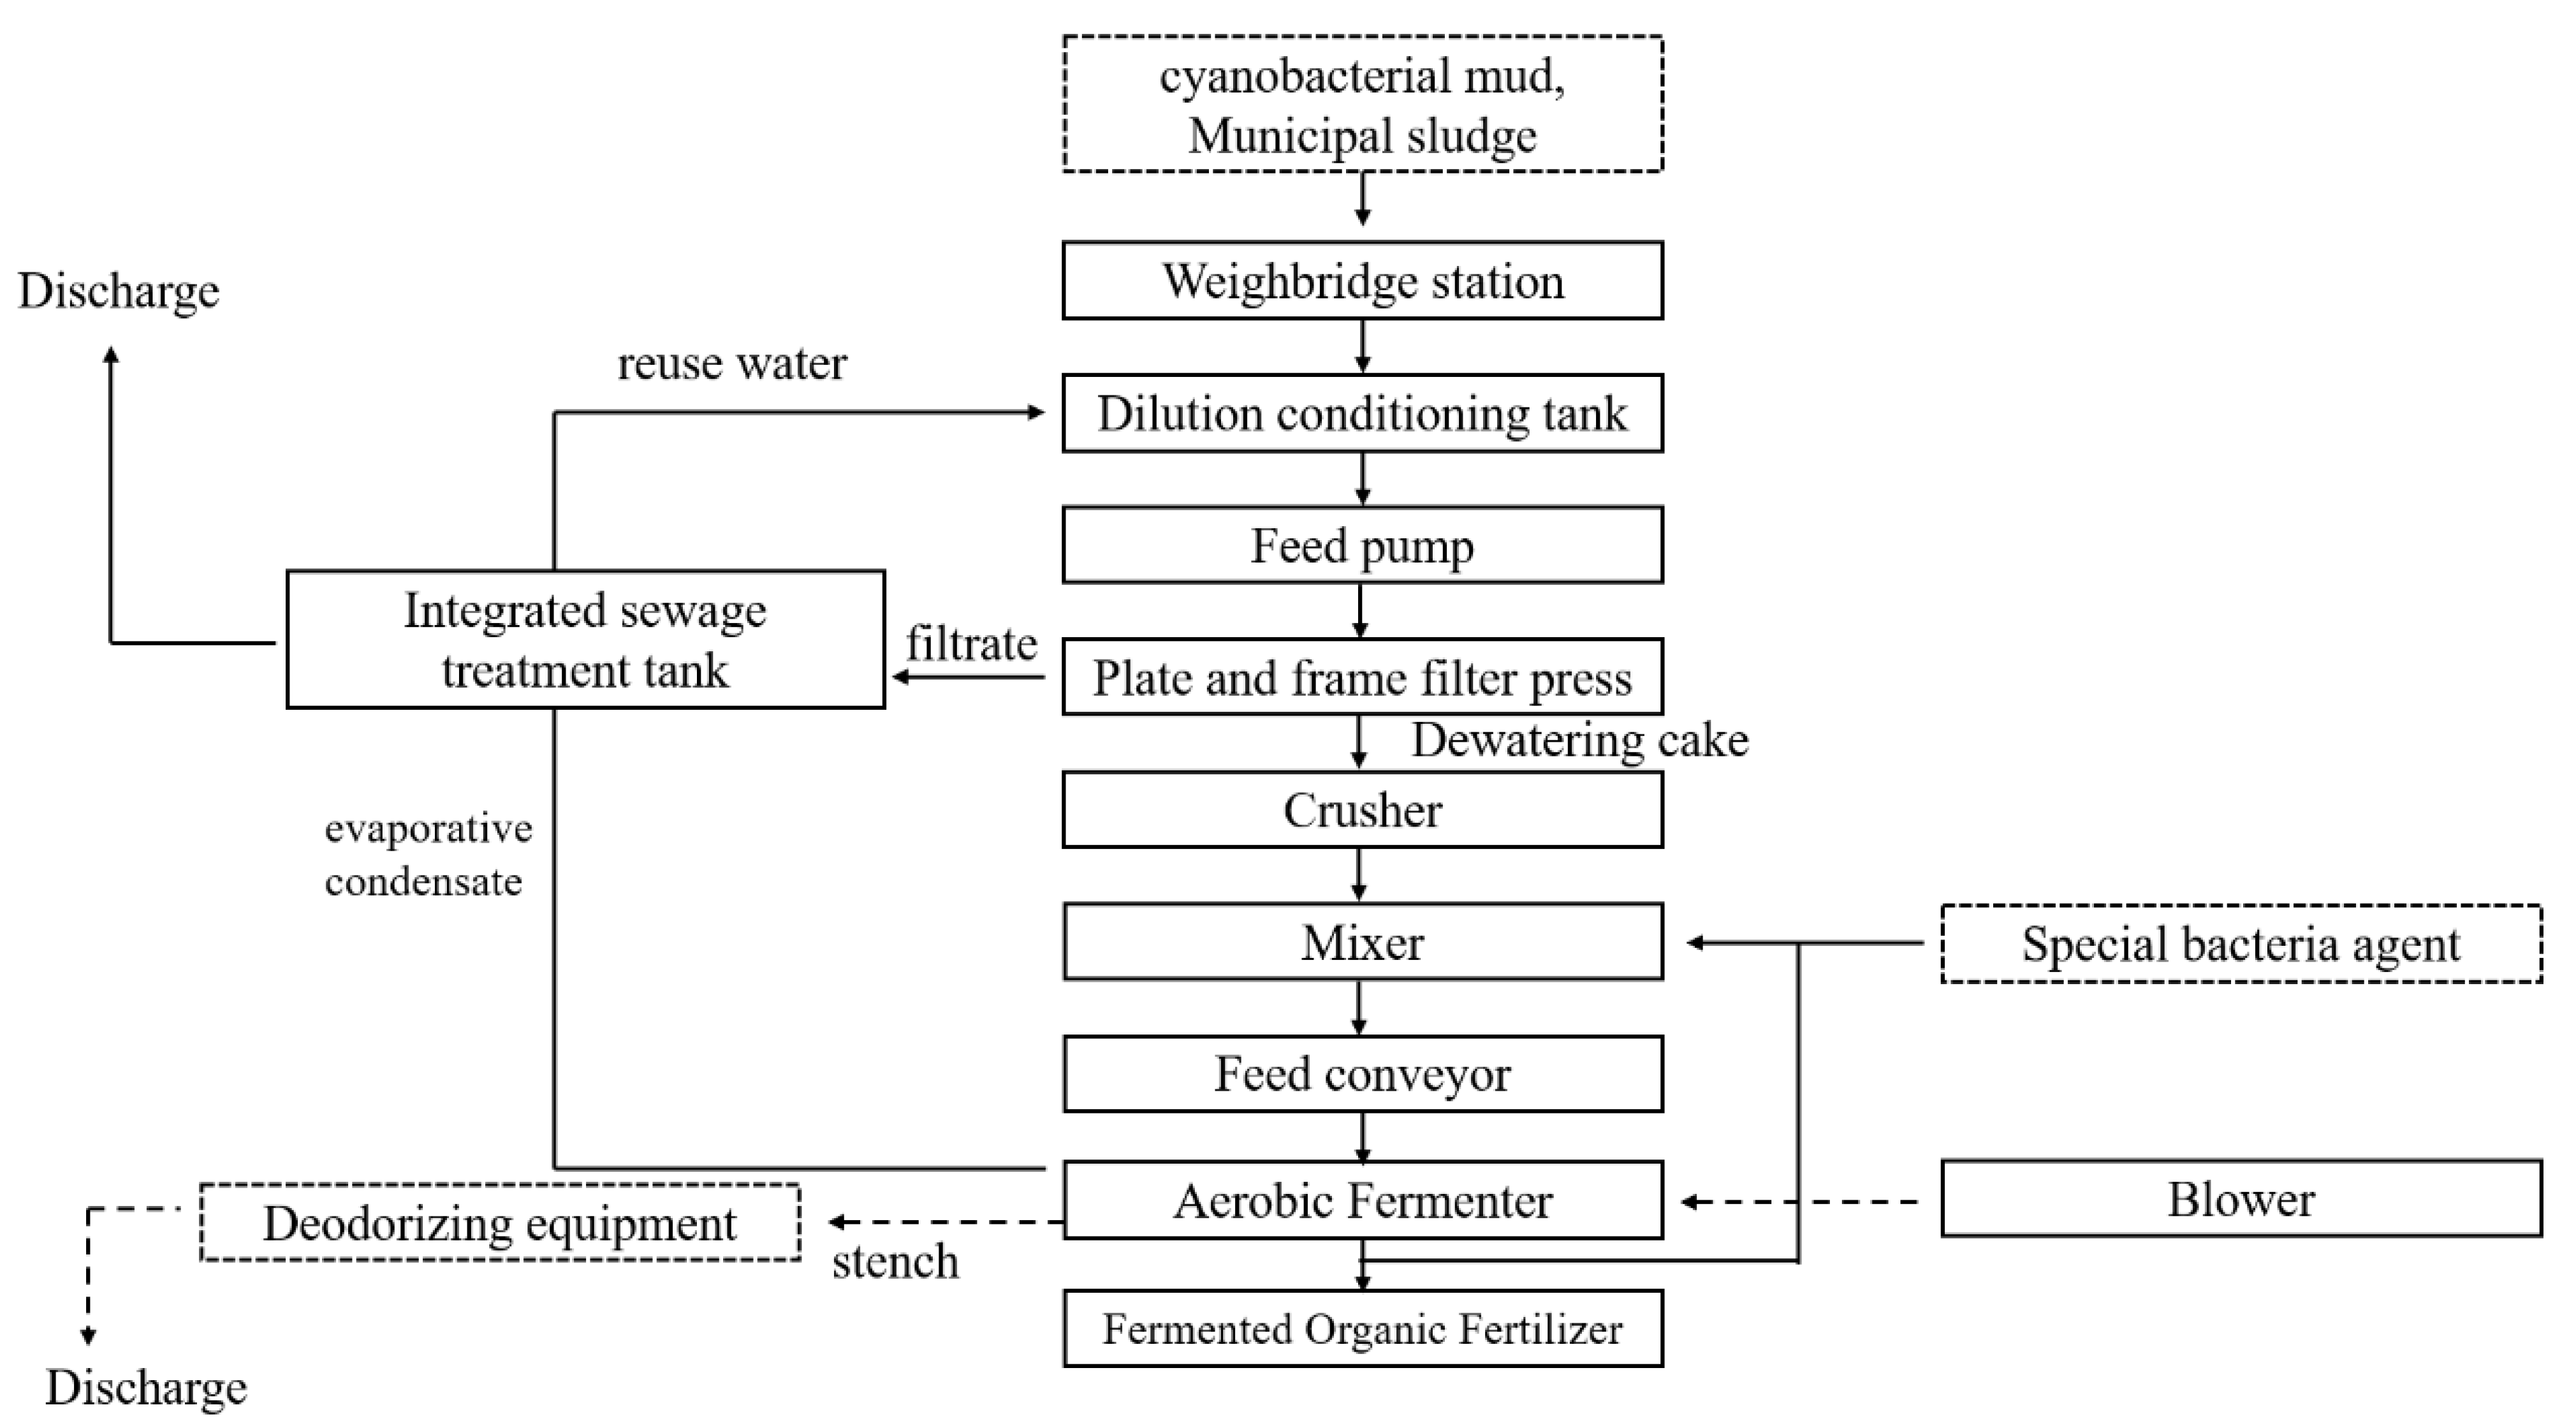
As shown in Figure 3, the auxin-free aerobic fermentation technology route is adopted.
The conditioning of Cyanobacterial mud. The cyanobacterial mud (with an 85% water content) was weighed using a weighbridge and transported to the conditioning tank. Firstly, every 160 kg of PFS solution (15 wt.%) was dispersed into every ton of cyanobacterial mud. The mixed material was stirred for about 30 min using an agitator blade to ensure the homogeneous dispersion of the raw materials.
Mechanical de-watering of mixed material. The homogeneous mixture was pumped into the plate and frame filter press using plunger pumps, and then squeezed continuously at 1.2 MPa for 75 min, with the filtrate entering the effluent purification unit simultaneously. The filter cake was transported by conveyor belts to the crusher to be crushed into 1–2 cm pieces with a moisture content of about 60%.
Aerobic fermentation. The crushed filter cake was fed by a bucket elevator into a closed compost reactor for aerobic fermentation. During the time, an aerobic bacterium of one-thousandth of the filter cake mass was added. The closed compost reactor was fed and discharged daily to ensure continuous production, and the daily feed would be entirely decomposed after about 10–15 days. The AI program automatically controlled the aeration volume, aeration duration, and stirring rate during fermentation according to the fermentation parameters to ensure that the fermentation temperature was in the range of 50–65 °C. The fermentation products were transported to the aging workshop via a chain conveyor.
Data acquisition. An oven drying method was employed to investigate the water content of materials at 105 °C on a Halogen Moisture Analyzer. The consumption data of diesel, agentia, electricity, and auxiliary materials were obtained from the production records.
2.3. Data Analysis
Carbon emission from the salvage dehydration process. The cyanobacteria were salvaged ashore and initially de-watered to cyanobacterial mud with an 85% water content in the algae water separation station. This process mainly indirectly releases carbon emissions, which come from the fuel carbon emissions of the transport ships, the indirect carbon emission from the use of reagents, and the carbon emission from the electricity consumption of equipment, such as stirring and filter pressing, during the separation of the algae water.
- (1)
- Fuel consumption: the carbon emission produced by the consumption of diesel fuel when the ship collects cyanobacteria.
- (2)
- Electricity consumption: the carbon emission generated by electricity consumption when we were salvaging the cyanobacteria:
- (3)
- Drug consumption: the carbon emission from drug consumption.
is the carbon emissions released by drug consumption, kg; is the amount of drug consumption in different links, kg, including the Cyanophyta watering conditioning, the tail water treatment, and the deodorization dosage. is the carbon emission factor of the chemical. The factor of PFS is 1.61 tPFS, and that of NaOH is 1.602 tNaOH.
The carbon emission during the collection and transportation process. The carbon emissions during the collection and transportation processes are mainly from the transfer of the cyanobacterial mud collected by heavy trucks from each Cyanophyta water separation station to the recycling plant and the cyanobacterial mud in the recycling plant. The carbon emissions in this process are released indirectly, mainly from fuel combustion, including transport vehicles and forklifts that are fueled by diesel.
where is the carbon emissions released during transportation, kg; W is the total amount of cyanobacteria mud collected and transported, kg; is the load of the transporter; S represents the distance, and in this study, S is 92 km; is the units of diesel consumption by the trucks, which is 0.17 kg/km; α is the emission factor of diesel, which is 3.10 kg·L−1 in this study.
Carbon emissions released during the aerobic fermentation process. The carbon emissions are mainly released during the fermentation process due to the consumption of power by the equipment and other greenhouse gas emissions. The centralized composting process must be equipped with power-consuming equipment such as fermentation tanks, forced ventilation, and deodorization equipment. The emissions caused by the equipment consuming power are:
is the emissions produced by electricity consumption during the aerobic fermentation of cyanobacteria, kg; is the unit power consumption of the aerobic fermentation process. Currently, the number of cyanobacterial aerobic fermentation projects in actual domestic operations is limited. Based on the field investigation of cyanobacterial aerobic fermentation in Suzhou (20 tons/day), the amount of power consumed is 28.4 kWh·t−1, which is slightly lower than that of sludge composting (40~80 kWh·t−1); β is the emission factor of electricity, which is taken as 0.921 kg·(kWh)−1.
Due to the limitations such as those during the process and equipment, in aerobic composting, a local anaerobic environment is easily formed, so a small number of greenhouse gases, such as methane and N2O are generated, which are not easy to collect. The carbon emissions due to CH4 and N2O are:
is the total amount of carbon emissions of CH4 and N2O, kg; is the mass of dehydrated cyanobacterial mud used for aerobic fermentation, kg; is related to the emission factors for aerobic fermentation treatment. Referring to the IPCC database, combined with the engineering practice, the emission factor of CH4 is 2.00 g·kg−1 cyanobacterial mud, and the emission factor of N2O is 0.10 g·kg−1 algae mud; is the conversion coefficients of CH4 or N2O, which are taken as 21 and 310 in this study, respectively.
Carbon emission of cyanobacterial mud during mechanical dehydration, deodorization, and tail water treatment processes. Taking Suzhou’s 20 tons/day cyanobacteria aerobic fermentation project as an example, there is sets of deodorization equipment and tail water treatment equipment in the fermentation workshop, which can ensure that the air quality near the factory area meets the standard and the sewage discharged from the factory area meets the relevant national standard. Carbon emissions from deodorization and tail water treatment processes mainly include the indirectly released carbon emissions from chemicals and the indirectly released carbon emission from electricity consumption.
- (1)
- Drug consumption: the carbon emission from drug consumption
- (2)
- Electricity consumption
3. Controlled Studies
To horizontally compare the carbon emission levels of the three cyanobacteria resource recovery processes, data models are based on the accounting guidelines given in the 2006 IPCC Guidelines for National Greenhouse Gas Inventories [27] regarding the whole life cycle assessment concept.
3.1. Carbon Emission Calculation of Aerobic Fermentation Process with Auxiliary Materials
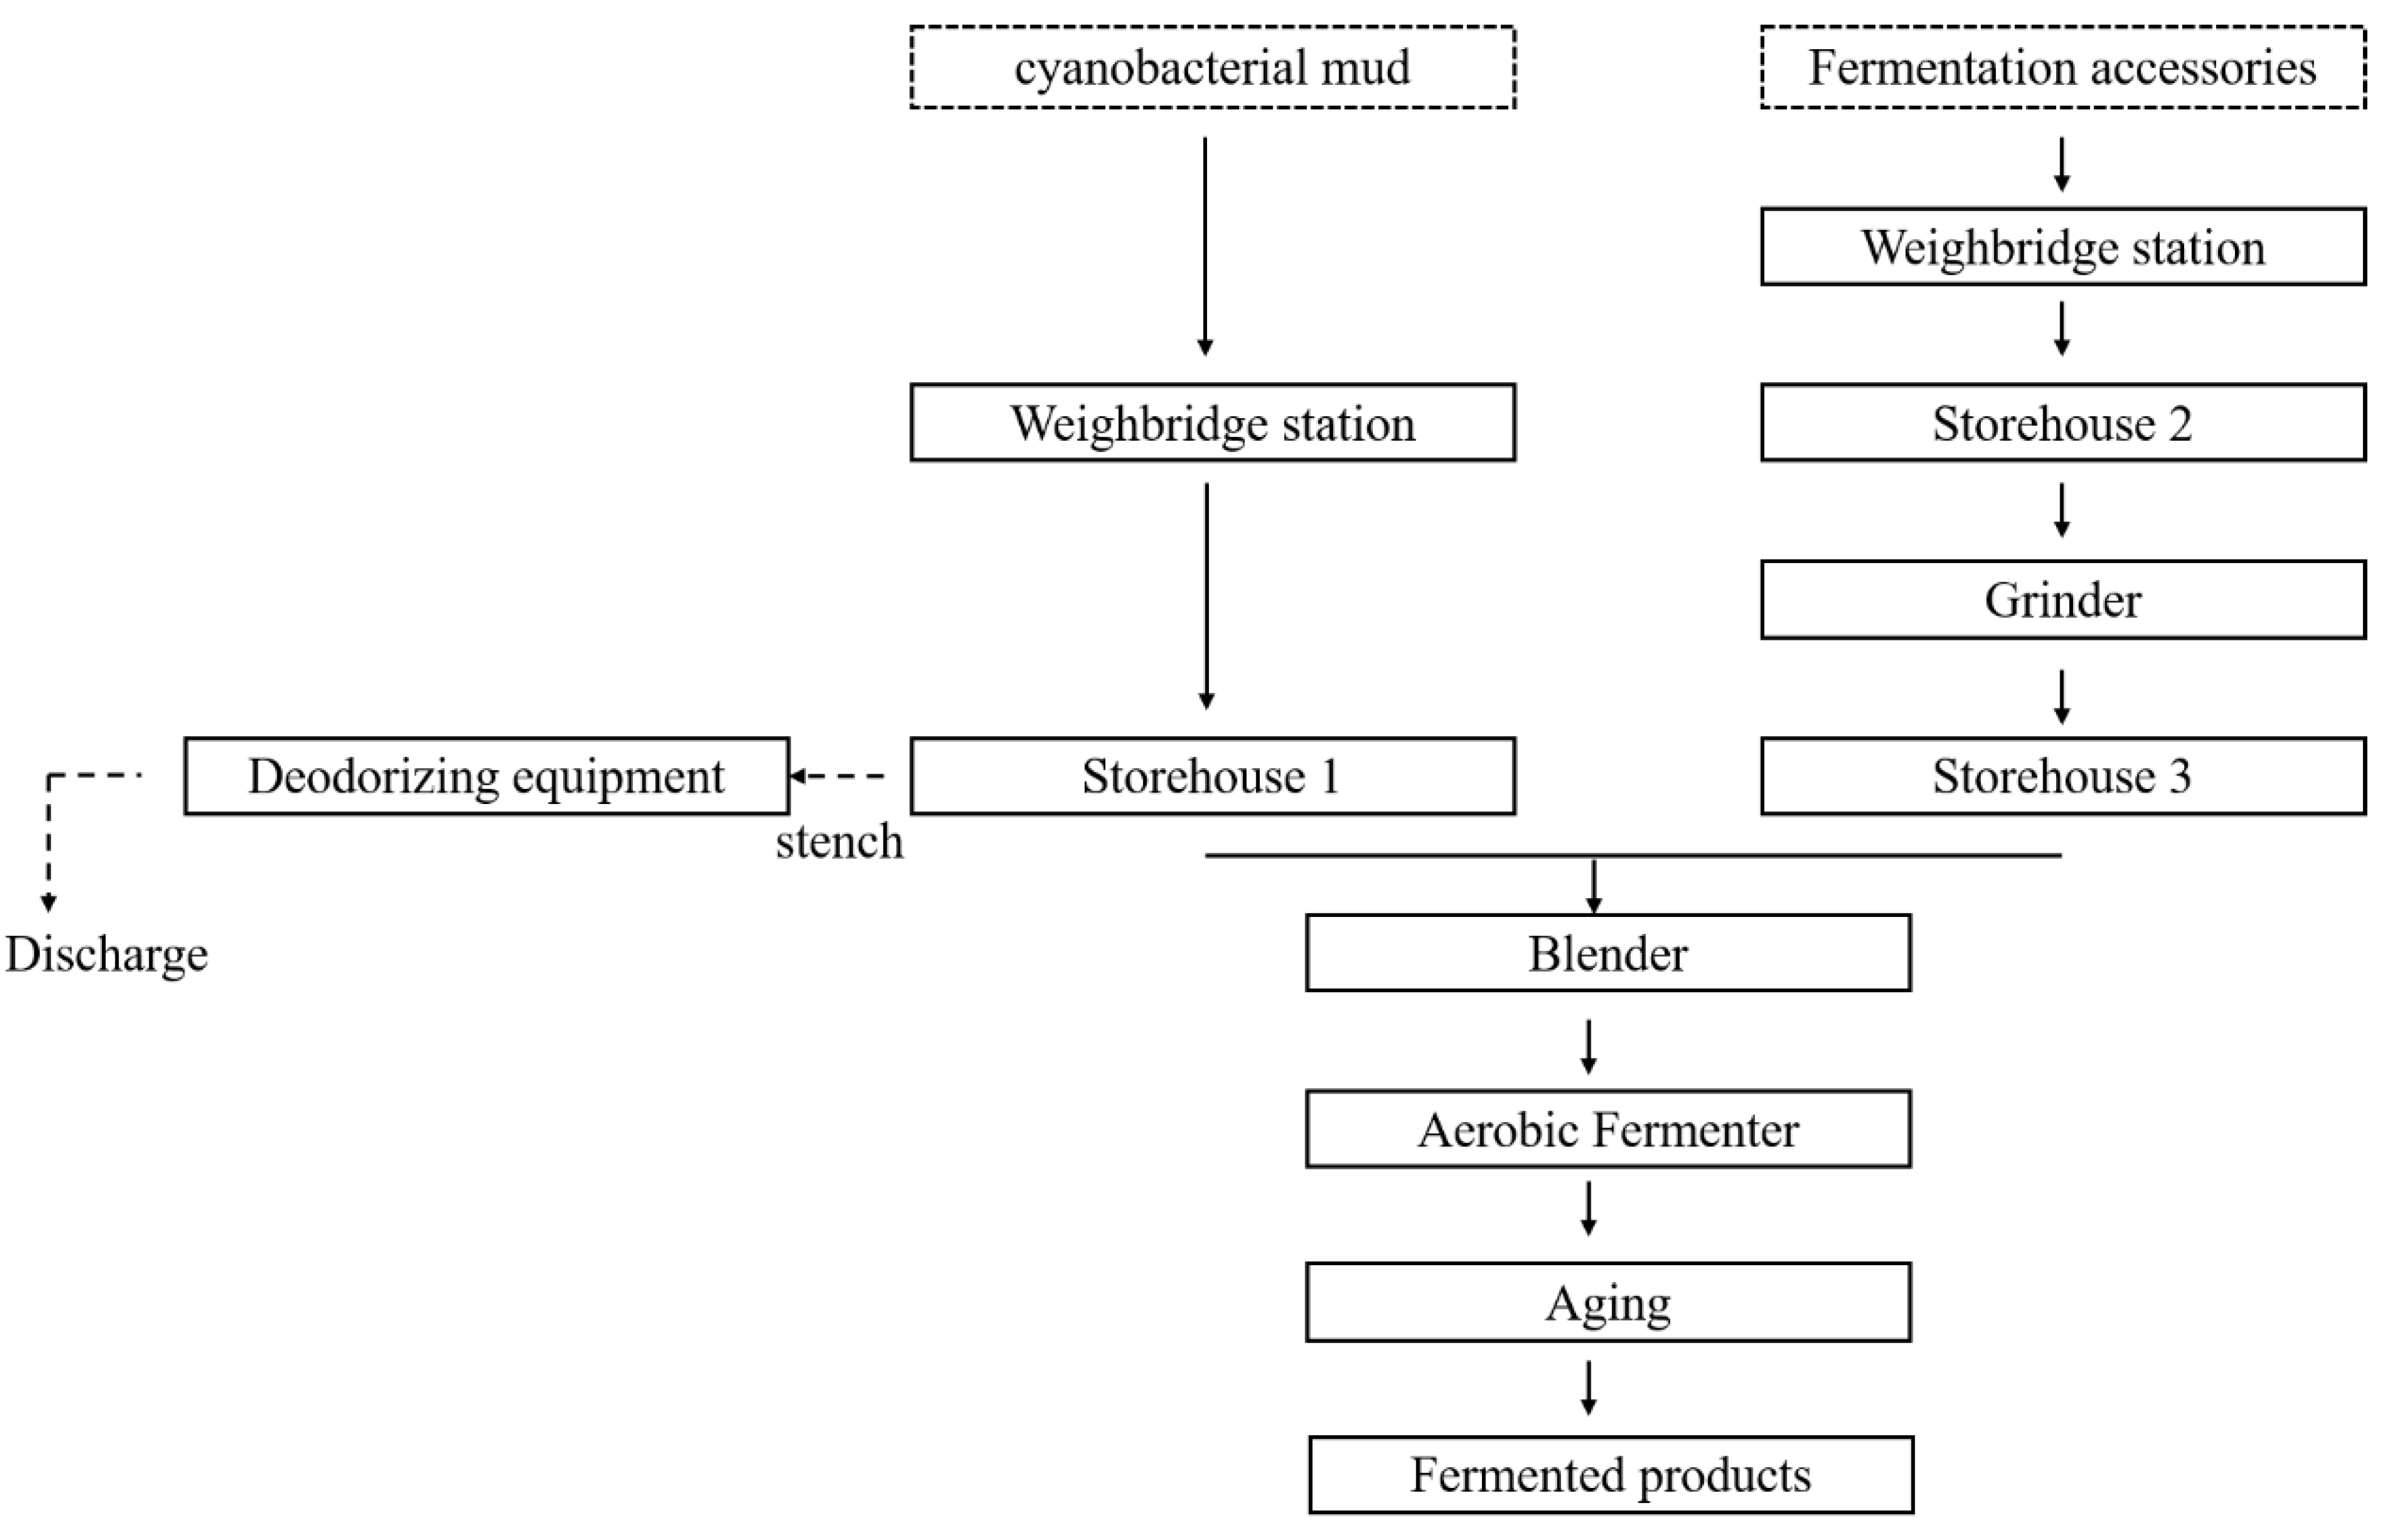
The process flow of the aerobic fermentation with auxiliary materials is shown in the Figure 4. The aerobic fermentation process with auxiliary materials involves mechanically crushing the dry organic matter with a moisture content of about 10~20%, such as straw, sawdust, and mushroom residue, and adding them to the algae mud with a moisture content of 85%. After mechanically mixing them, the carbon-nitrogen ratio and the moisture content of the material are adjusted, and then the material is transported to the fermentation equipment to complete the aerobic fermentation process. The primary carbon emissions are mainly caused by transportation and fermentation. However, due to the addition of auxiliary materials, the consumption of power during the aerobic fermentation of algal slime and the amount of methane and N2O directly emitted during the fermentation process increase proportionally. The total proportion of auxiliary materials, such as straw and sawdust, is 45–55%. In this study, the proportion of auxiliary materials added is 50%, and the main compositions of the auxiliary materials and their ratios by weight are shown in Table 1.
In particular, the carbon emissions of the auxiliary materials added during the aerobic fermentation process during transportation should be calculated separately, and the calculation method is the same as that for the transportation of cyanobacteria algae mud. Aerobic fermentation with auxiliary materials mainly adjusts the moisture content of the materials by adding auxiliary materials, which is usually the mechanical dehydration of algal mud without sewage treatment equipment. This study adopts the scheme of a no tail water treatment for the measurement.
Due to the addition of auxiliary materials, the amount of waste gas generated during aerobic fermentation increases, and so does the amount of greenhouse gases such as CH4 and N2O. The carbon emissions released due to CH4 and N2O during fermentation can be calculated by:
where is the total amount of carbon emissions of CH4 and N2O, kg; is the mass of the added excipients, kg; is related to emission factors for the aerobic fermentation treatment. Referring to the IPCC database, combined with the engineering practice, the emission factor of CH4 is 6.00 g·kg−1 cyanobacterial mud, and the emission factor of N2O is 0.40 g·kg−1 algae mud; is the conversion coefficients of CH4 or N2O, which are taken as 21 and 310 in this study, respectively.
3.2. Calculation of Carbon Emission in the Process of Cyanobacteria Drying and Incineration
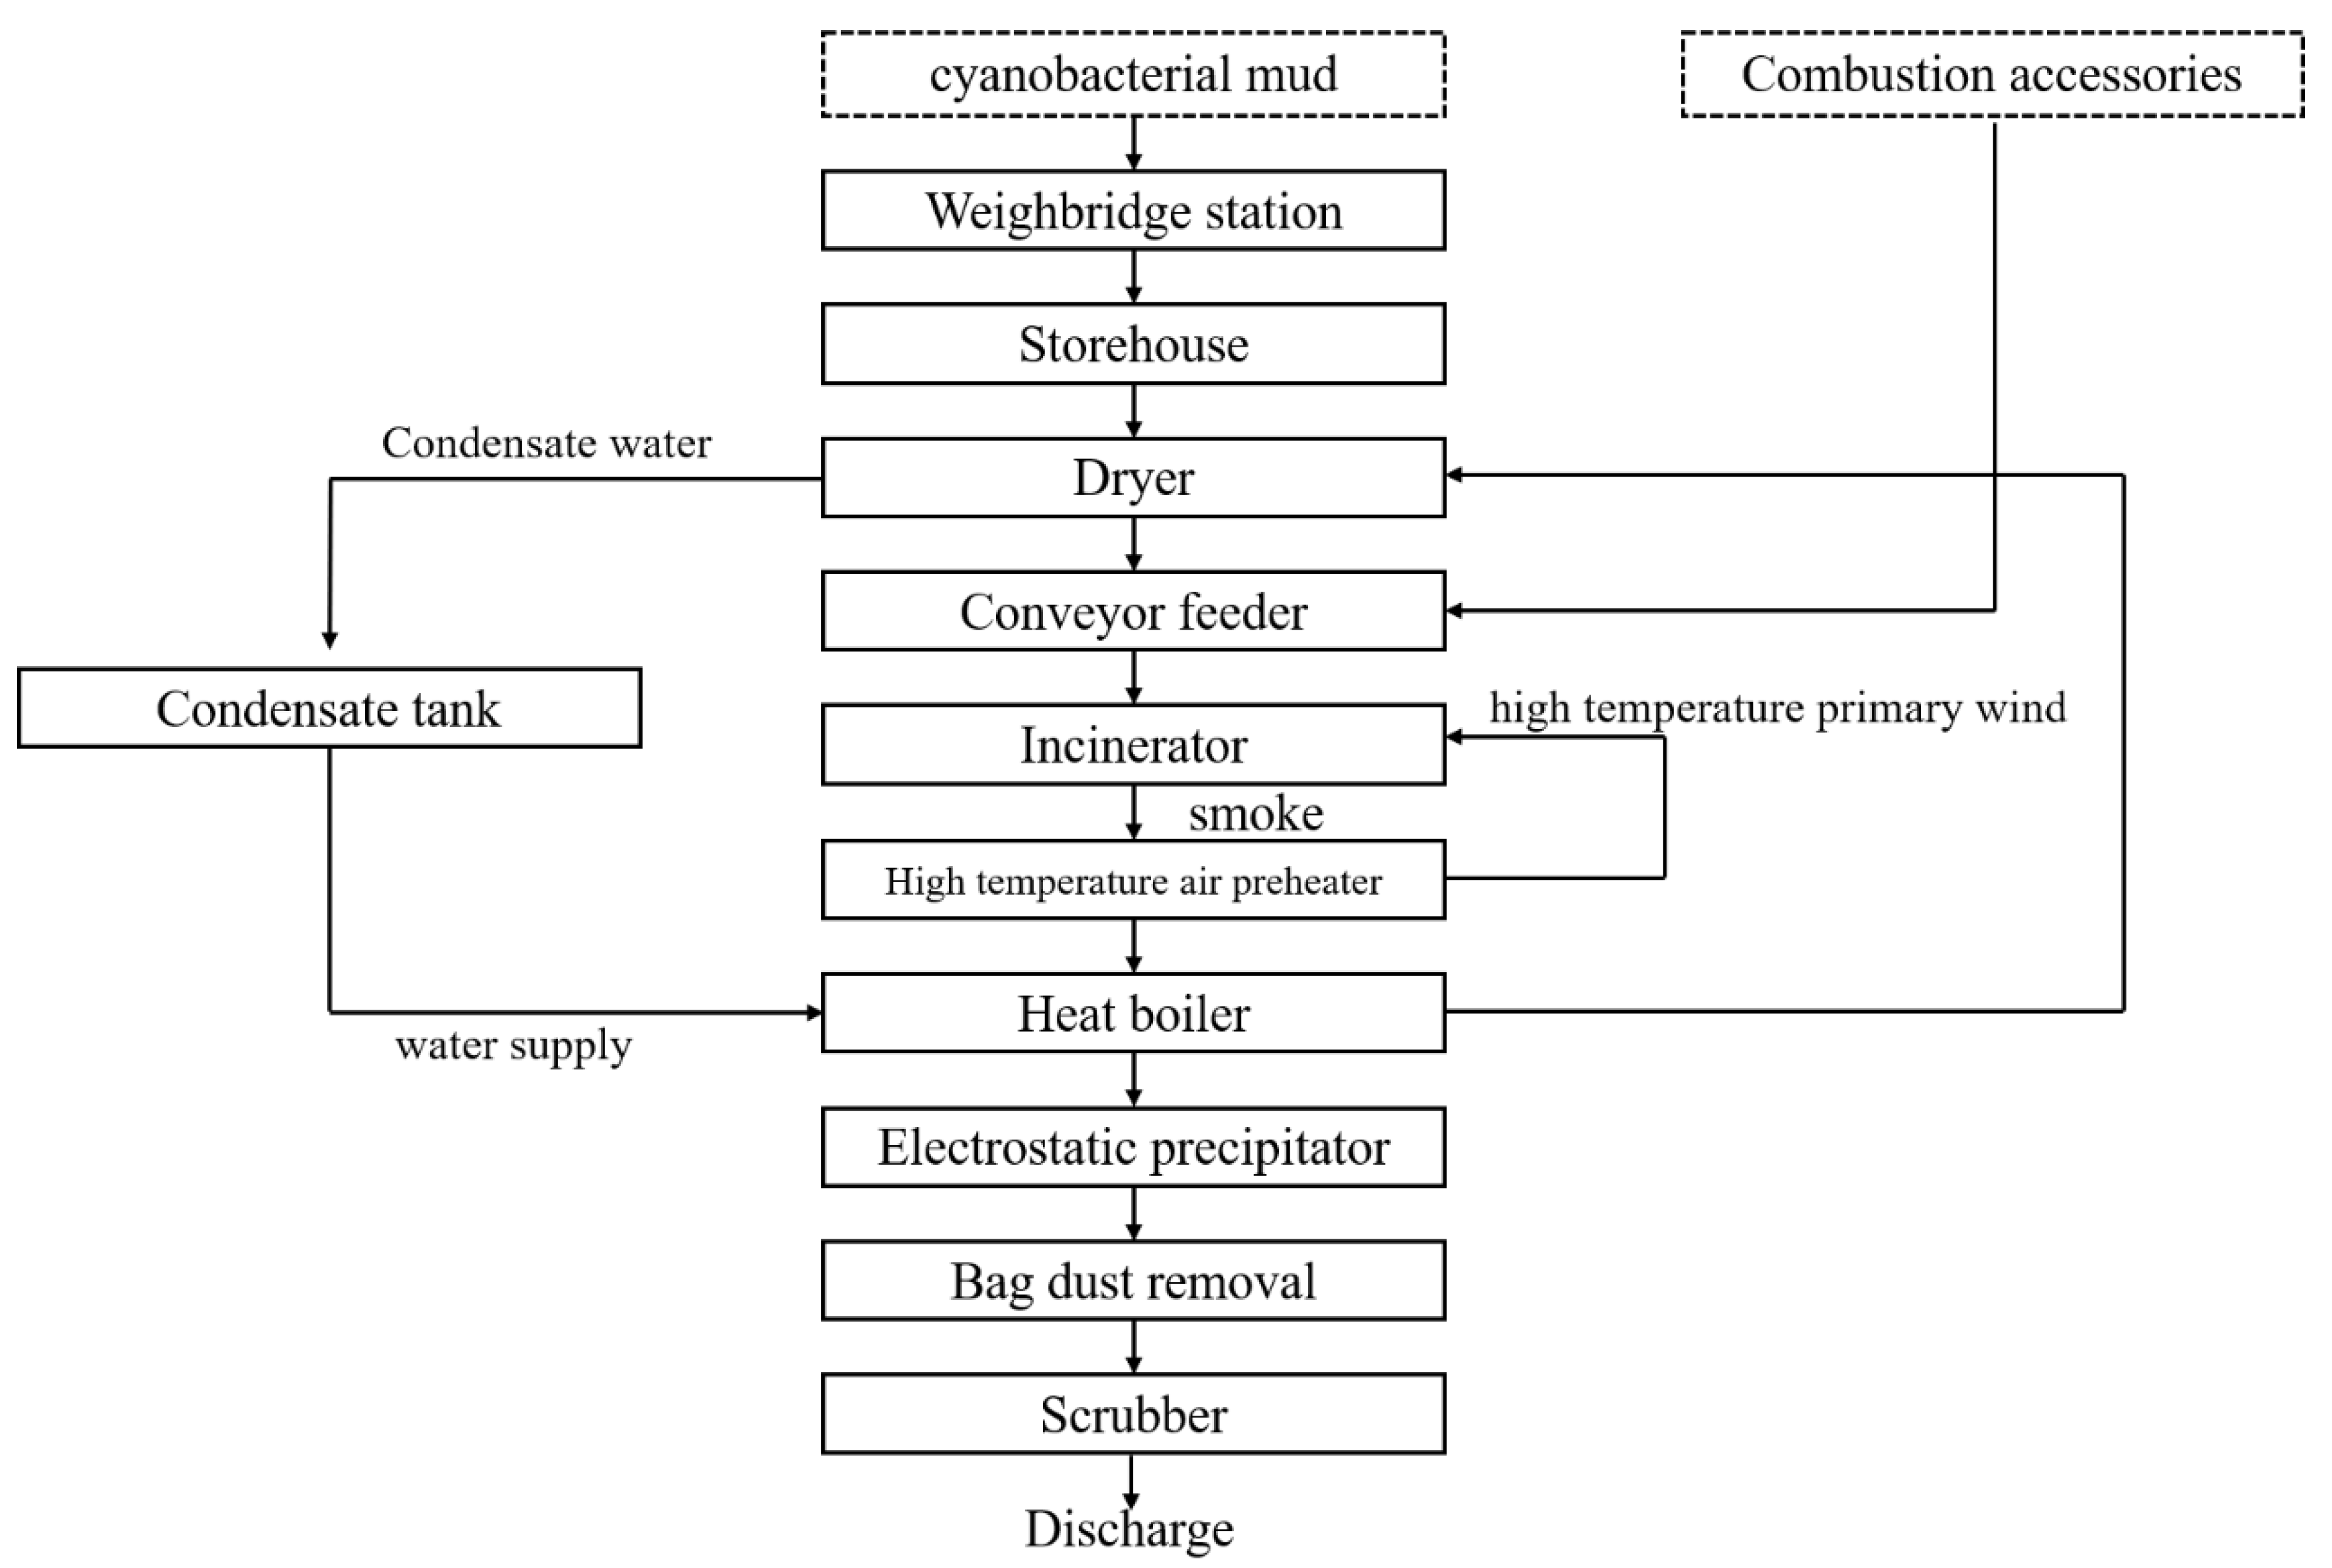
As shown in Figure 5, the primary process of cyanobacteria drying and incineration is that after the cyanobacteria is salvaged, the algae water is separated into cyanobacterial mud (water content 80~85%). The cyanobacterial mud will be transported to the thermal power plant by a particular transport vehicle, and the cyanobacterial mud is dried into dry cyanobacterial mud (moisture content of 9.49%), and then sent to the incinerator for incineration to generate electricity.
Currently, the number of cyanobacterial drying and incineration projects that are in actual domestic operation is small. Since the properties of cyanobacterial mud and municipal sludge are similar, and the sludge composting process is similar to that of cyanobacterial mud composting, the carbon emission of the dry incineration of municipal sludge can be approximated. In 2022, according to the accounting guidelines given by the United Nations Intergovernmental Panel on Climate Change (IPCC), combined with the life cycle assessment, Wang Lin et al. [28] published in “Environmental Science in China.” It conducted a comprehensive review of the direct emissions, indirect emissions, and carbon emission reductions and analyzed the impact of the sensitive factor sludge organic matter content. Coupled with the current situation of cyanobacteria dry incineration projects mostly being integrated with coal-fired power plants for thermal dry incineration, the power consumption parameter of dry incineration of cyanobacterial mud was 150 kWh/(tDS) in this study.
Carbon emission of material transportation. The main transportation carbon emission links are cyanobacterial mud and combustion ash transportation. The calculation method is as follows:
where is the carbon emission during transportation, kg; W is the total amount of materials, kg; is the load of the transporter; S represents the distance (50 km); is the unit diesel consumption of trucks, which is 0.17 kg/km; α is the emission factor of diesel, which is 3.10 kg·L−1 in this study.
Carbon emission of cyanobacteria drying. The cyanobacterial mud transported to the thermal power plant possesses a high water content, and it cannot be directly used for combustion and power generation. It is necessary to transport the cyanobacterial mud to the drying furnace to use the heat of fuel combustion to dry it into dry cyanobacterial mud before it can be used for combustion power generation. The carbon emission of this process is mainly caused by heat consumption:
where is the carbon emissions due to heat consumption, kg; is the heat consumption of cyanobacterial mud drying, which is calculated as standard coal, kJ; is the low calorific value of standard coal, 29,300 kJ/kg; =80%, is the standard coal carbon emission factor.
The consumption of power in the drying process of cyanobacterial mud is calculated as follows:
where is carbon emission caused by electricity consumption, kg; is the consumption of power during drying, kWh. is the power carbon emission factor, and we used 0.921 kg · (kWh)−1 in this study.
Carbon emission of sewage treatment. The sewage generated during the treatment process needs to be returned to the sewage treatment plant for treatment, and the carbon emission generated in this part should be calculated independently from the carbon emission of the sewage treatment unit of the sewage treatment plant.
where is carbon emission caused by the sewage treatment, kg; is the total mass of the sewage treatment, kg; is the COD content in the dried sewage (2000 mg/L); is the carbon emission factor for removing the COD in the sewage (0.63 kg/kg).
Carbon emission of cyanobacteria combustion. The heat generated by the incineration of cyanobacteria can be recovered to offset the heat required by other links. Among them, the comprehensive heat loss caused by unburned gases and solids, the heat loss from incinerators, and the heat loss through flue gas and ash are calculated as 15% of the input heat, and the carbon emission reduction of heat recovery is replaced by standard coal [29]. In a coal-fired power plant, the carbon emissions caused by the cyanobacteria incineration process are calculated as follows:
where is the carbon emissions caused by cyanobacterial incineration, kg; is the incineration heat of dry cyanobacterial mud; is the combustion heat of auxiliary fuel, which is calculated as standard coal in this study; is the incineration amount of dry cyanobacterial mud, kg; is the incineration amount of auxiliary fuel, kg, and in this study, it equals 50% of the incineration amount of dry cyanobacterial mud; is the calorific value of dry cyanobacterial mud (2090 Kcal/kg); q is the calorific value of standard coal.
The heat generated by the incineration cyanobacterial mud in coal-fired power plants can be recovered to generate electricity. The carbon reduction calculation method is as follows:
where λi is the comprehensive heat utilization efficiency, which is 36~41% in coal-fired power plants.
4. Results and Discussion
4.1. Total Carbon Emission Calculation Results
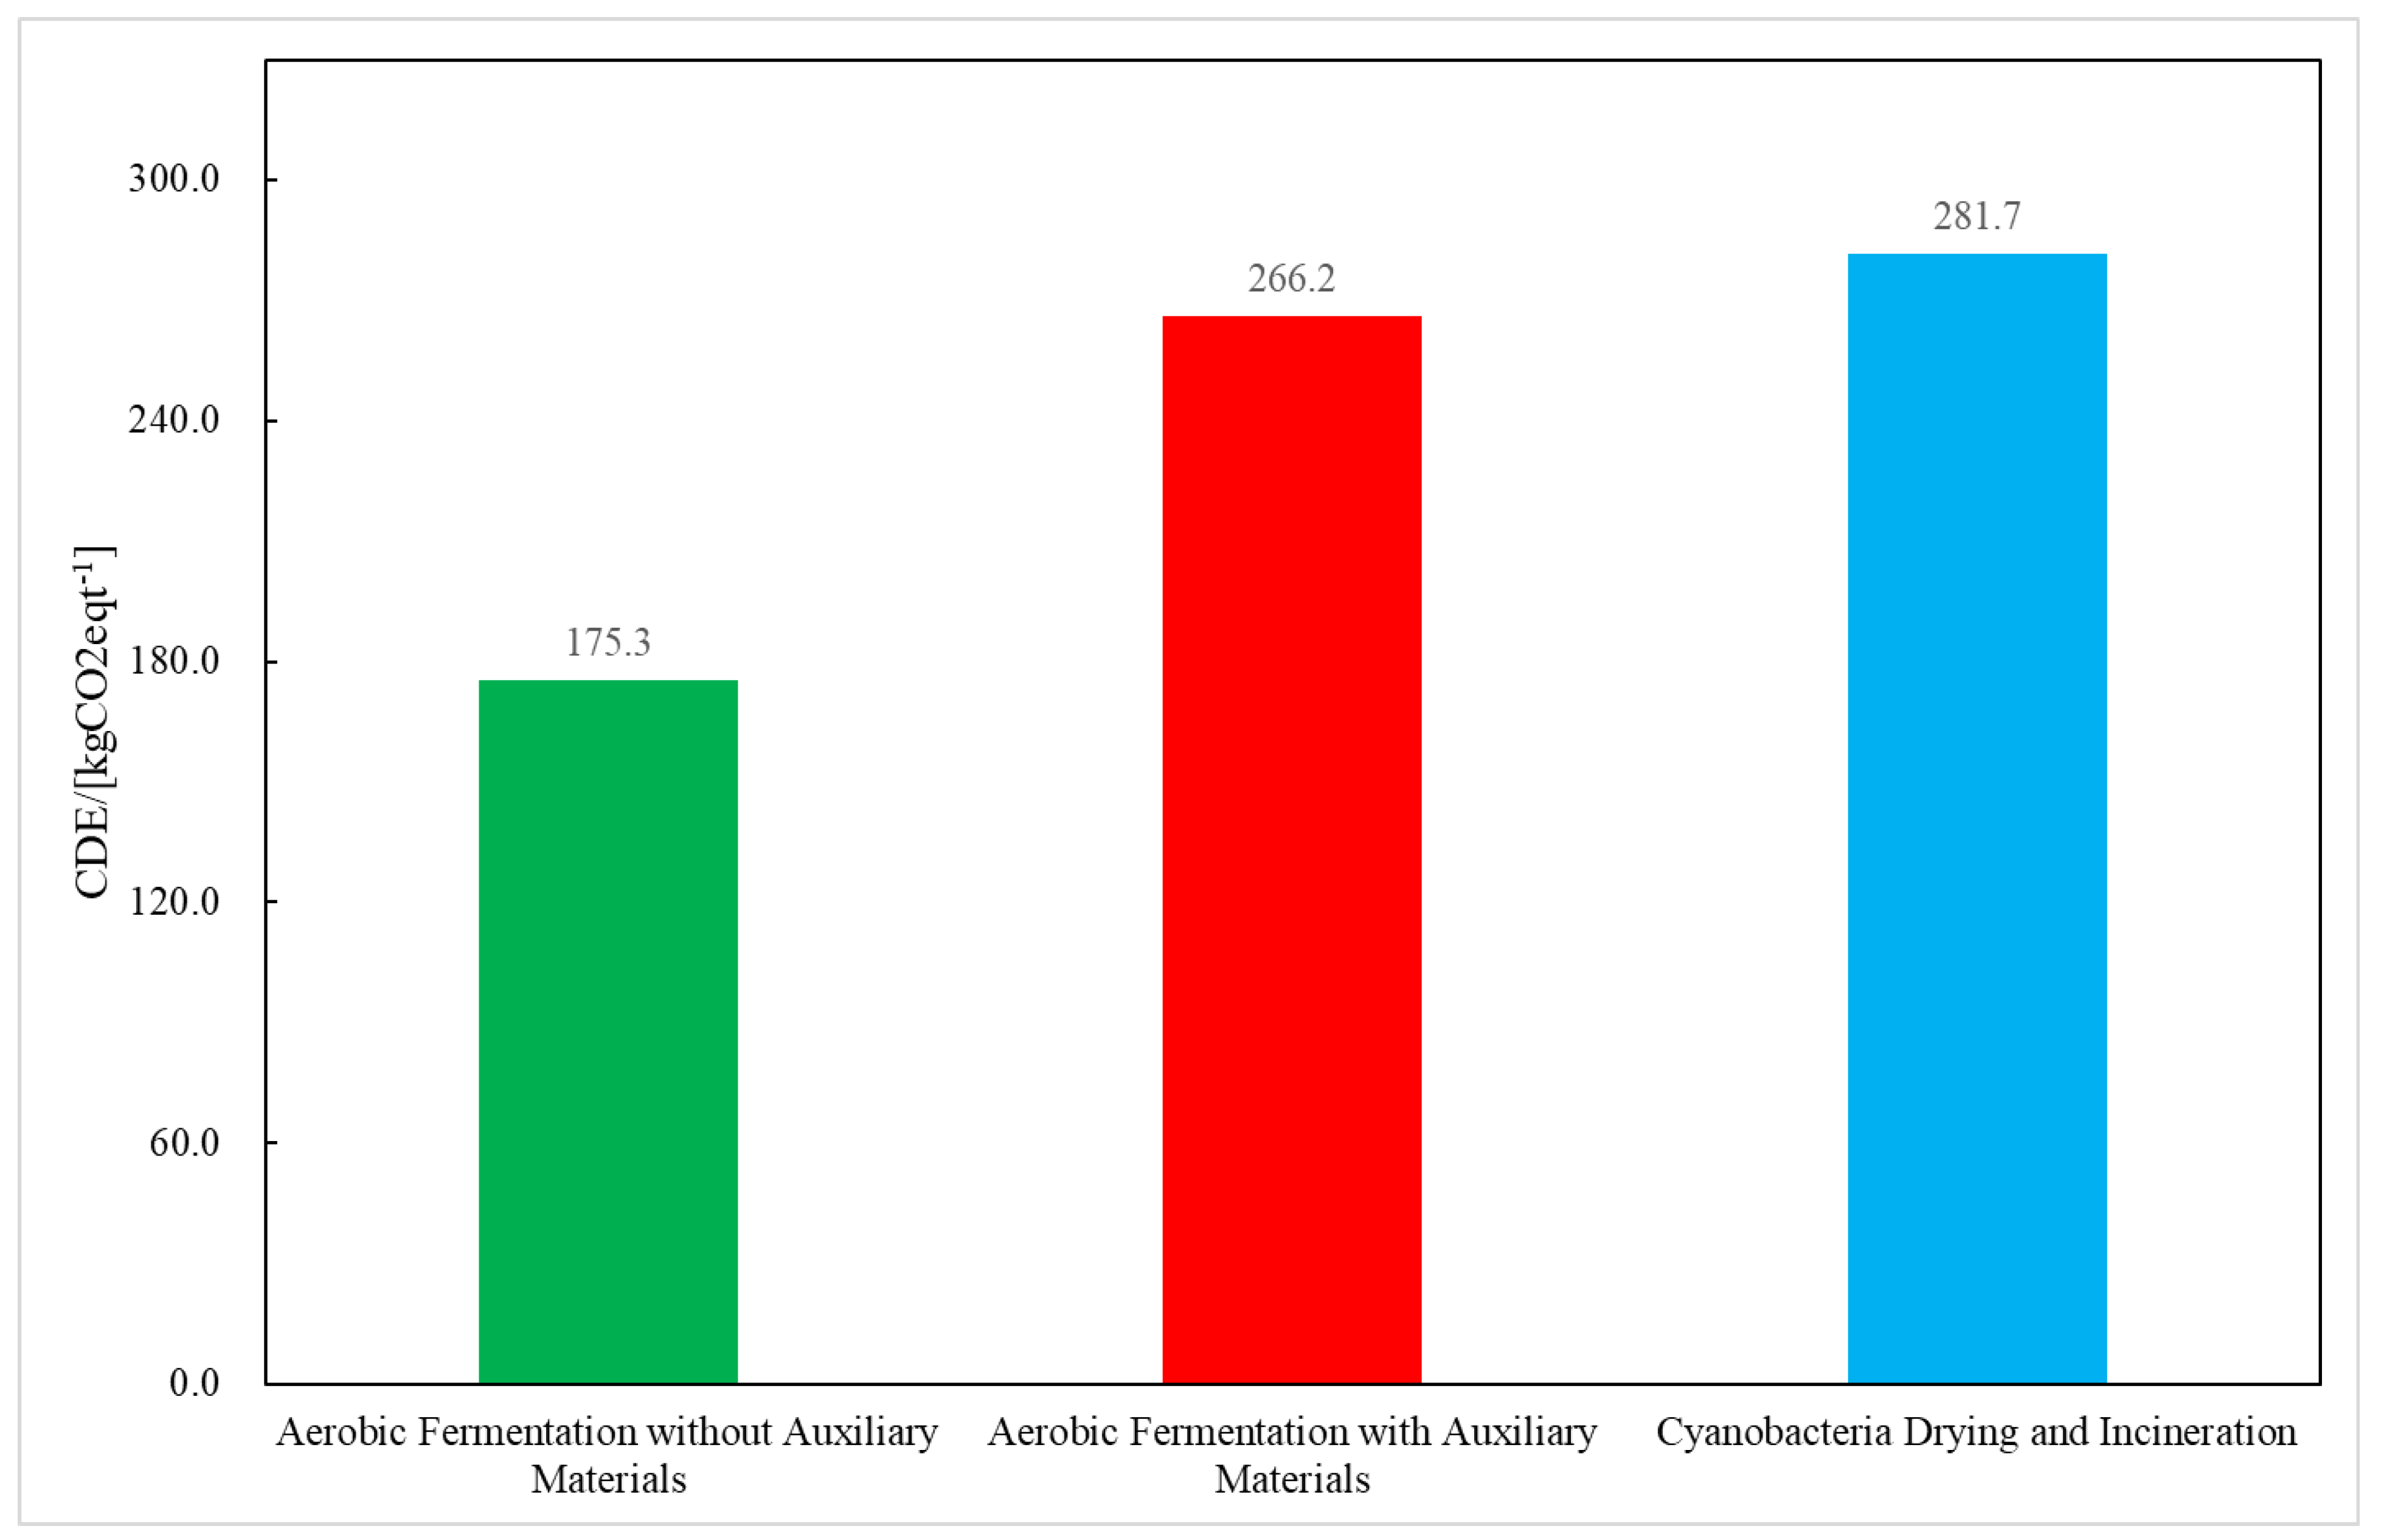
As shown in Figure 6, from the perspective of net emission, the dry incineration process possesses the highest carbon dioxide equivalent (CDE for short) among the three treatment processes, reaching 281.7 kg CO2·t−1. The amount of carbon dioxide emissions caused by the aerobic fermentation process is the lowest: it is only 175.3 kg CO2·t−1. Among the three treatment processes, since the auxiliary materials contain a large amount of volatile organic carbon, the organic carbon in the aerobic fermentation process produces the unorganized escape of CH4 and N2O, so the amount of carbon emissions of the aerobic fermentation process with auxiliary materials is greater than that of the aerobic fermentation process without auxiliary materials. Cyanobacterial mud’s drying and incineration process require thermal drying, which consumes a large amount of heat and fossil energy auxiliary fuel during the incineration process, leading to lots of carbon being emitted.
4.2. Comparison of Carbon Emission by Cyanobacteria Recycling
- (1)
- Comparison of aerobic fermentation without excipients and aerobic fermentation with excipients
According to Figure 7, the following results can be obtained from the analysis. Using the same collection procedure of cyanobacterial mud, the advantage of carbon emission reduction using aerobic fermentation technology without auxiliary materials is more evident than that of aerobic fermentation technology with auxiliary materials in treating the unit weight of cyanobacterial mud. In aerobic fermentation without excipients, there is no need to transport the fermentation excipients with a low moisture content. The fuel carbon emission caused by the transportation of excipients is reduced. However, the aerobic fermentation technology without excipients requires more chemicals than the aerobic fermentation with auxiliary materials does to dry and dehydrate the cyanobacteria mud, thus increasing the amount of indirect carbon emissions from the reagents, and at the same time, when the materials are pretreated in the aerobic fermentation process with auxiliary materials, they need to be entirely crushed and blended, and the power consumption is significant, and thus more carbon is indirectly emitted. During the fermentation process, auxiliary materials are decomposed into small molecules by the fermented bacteria, causing more greenhouse gas emissions. In addition, due to the limitations of the equipment and technology, the aerobic fermentation process will inevitably cause a local anaerobic environment, producing CH4 and N2O, which are non-negligible and challenging to collect. In the aerobic fermentation process with auxiliary materials, adding additional materials will produce more CH4 and N2O than those that would be created in aerobic fermentation without auxiliary materials, so each ton of cyanobacterial mud treatment will lead to more carbon emissions.
- (2)
- Analysis of carbon emission in each link of cyanobacterial mud drying and incineration process
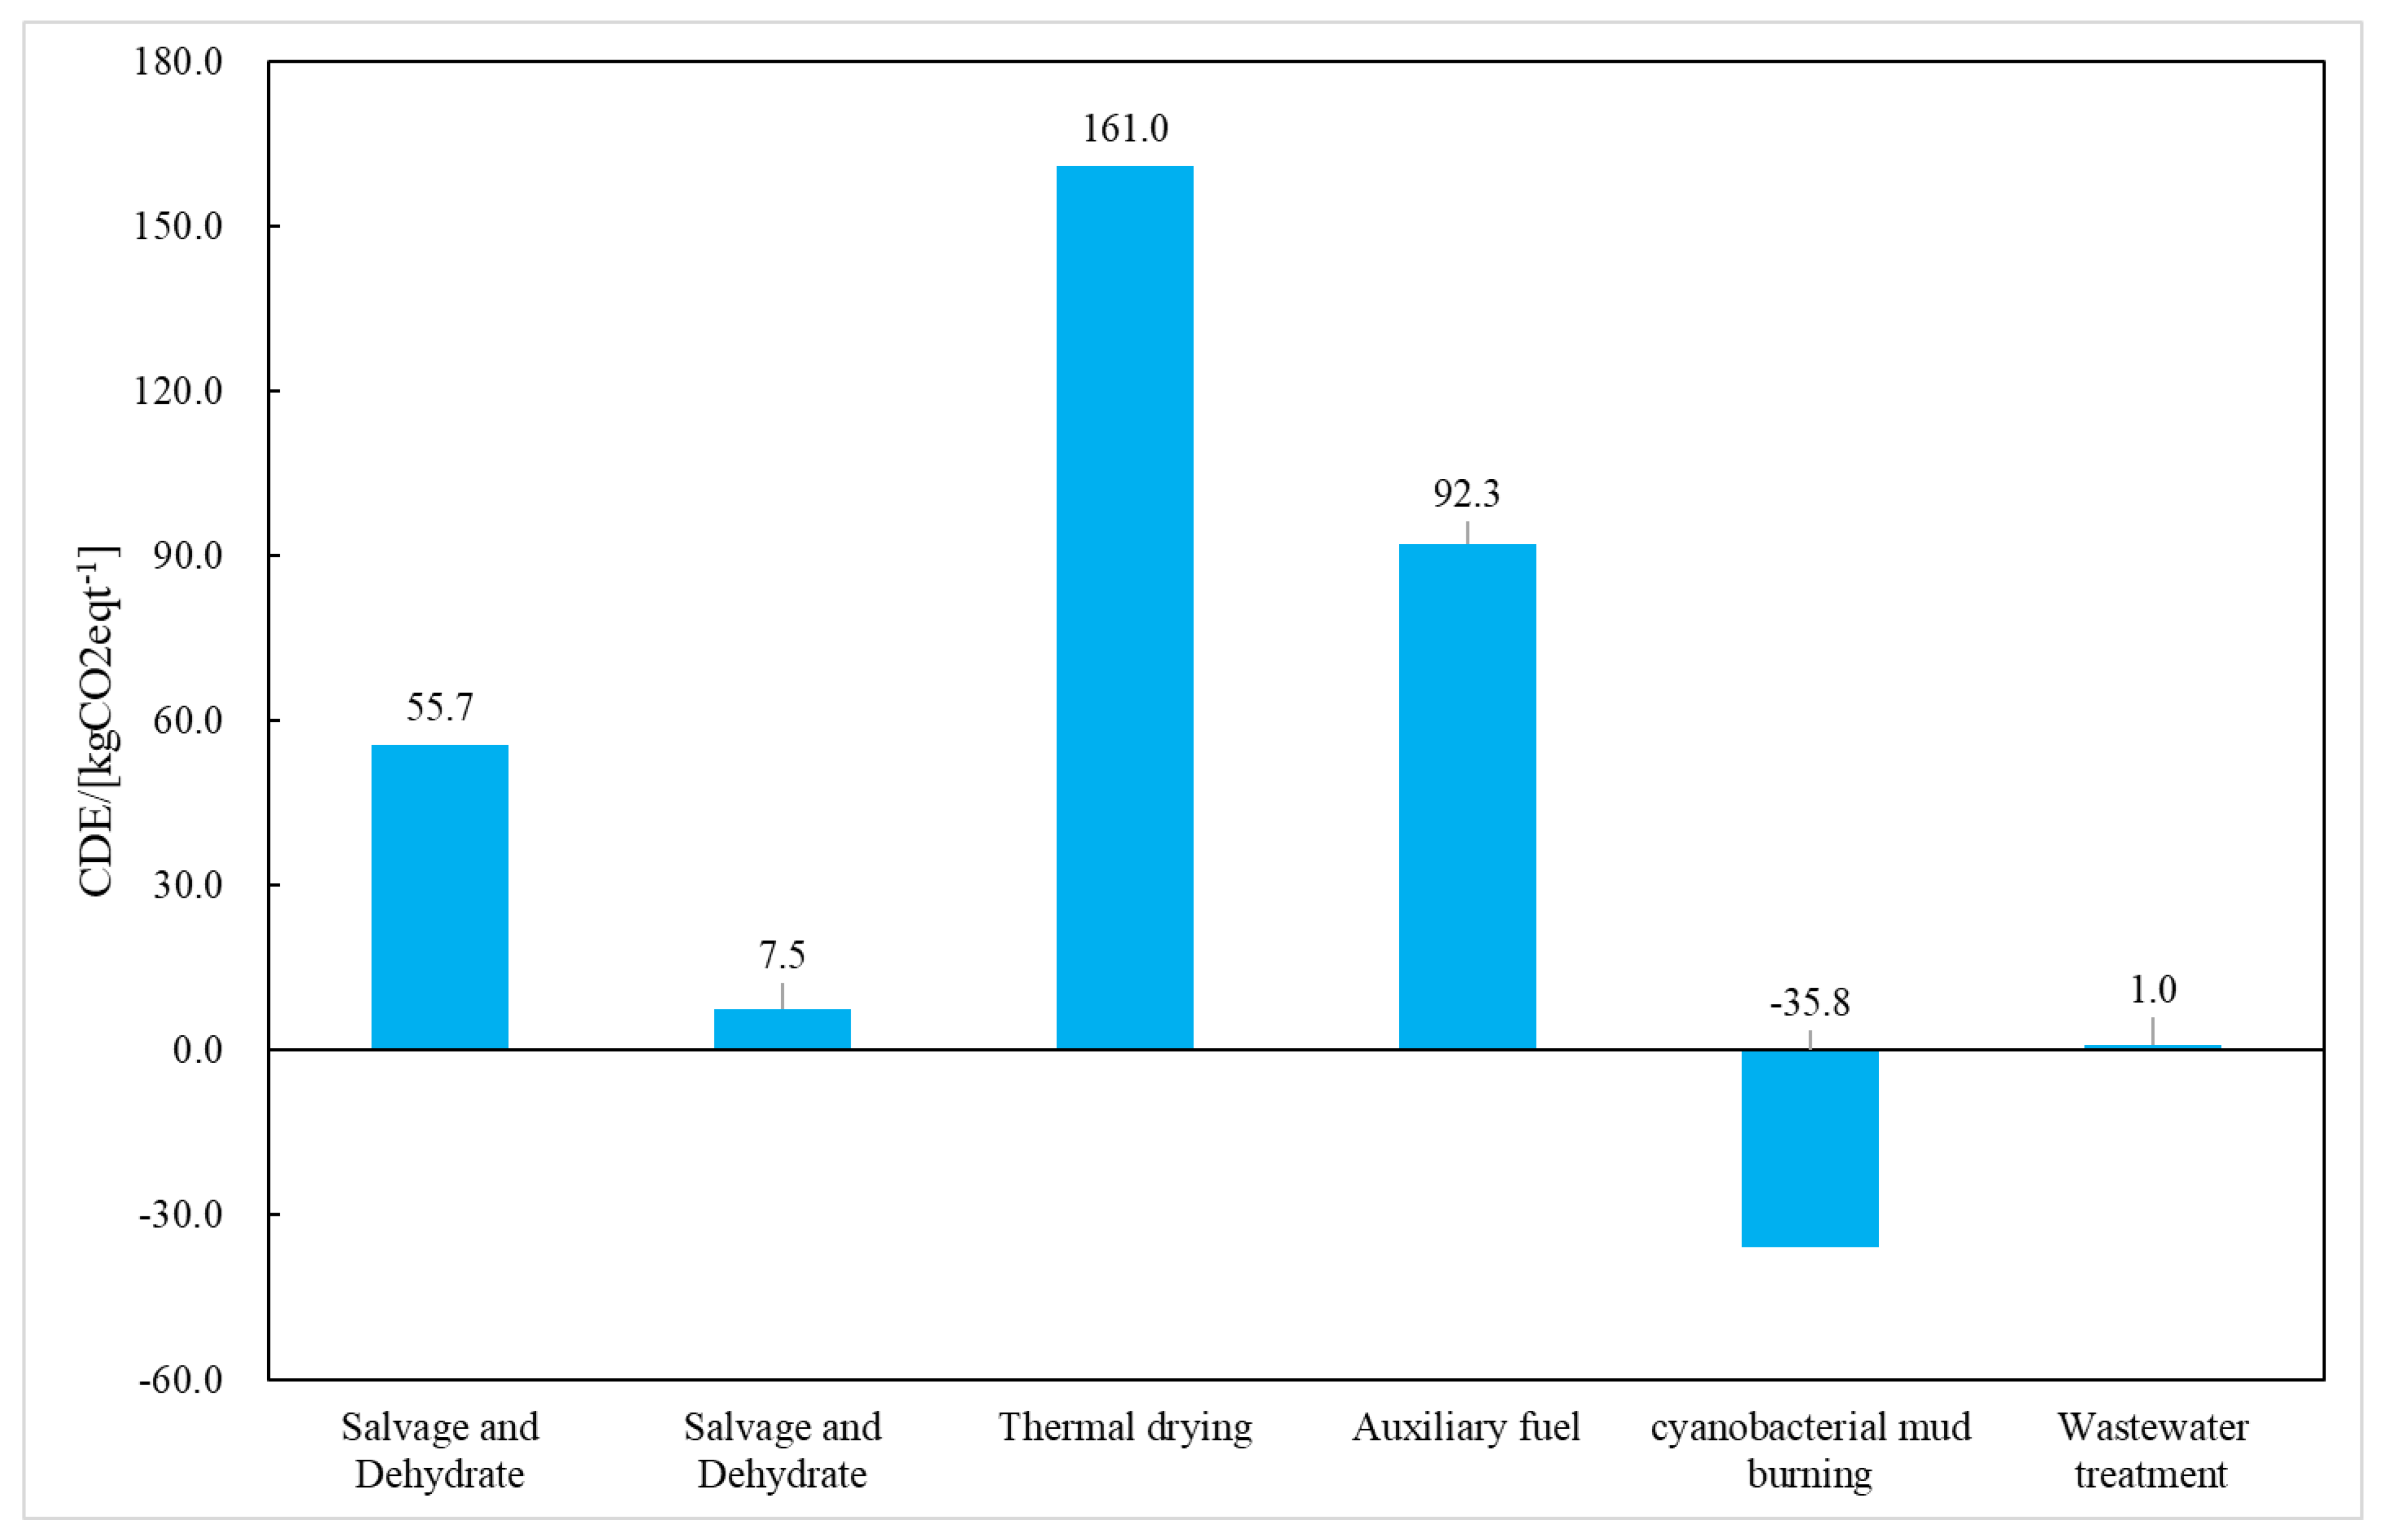
In the cyanobacteria drying incineration process, except for the moisture content of the cyanobacterial mud, some process parameters (such as the drying energy consumption and the type and amount of auxiliary combustion materials) will also have a significant effect on the amount of carbon emissions producing during the cyanobacterial mud drying and incineration processes. In this study, the drying process needs to consume a lot of electricity and heat, resulting in more net carbon emissions. In addition, since the cyanobacterial mud is not easy to burn, a large amount of auxiliary fuel must be added, further aggravating the carbon emission during the treatment process. After drying, the cyanobacteria are burned as fuel for power generation. The higher the total heat utilization rate is, then the more significant the carbon emission reduction of Cyanophyta slime combustion for power generation is.
Through the above research, we have only analyzed the carbon emission equivalent of the processing unit weight of cyanobacterial mud from the perspective of carbon emissions. And the results are shown in the Figure 8. Cyanobacteria drying and incineration treatments have caused the emission of lots of carbon. In actual production, the reasonable use of waste heat resources such as coal-fired power plants and incineration plants can reduce the energy consumption of the cyanobacterial mud drying process, thereby reducing the treatment of this path. For the aerobic fermentation process of Cyanophyta, the electricity consumption required for stirring and aeration during the aerobic fermentation process is the primary source of carbon emission of nitrogen. However, the compost after fermentation contains a high content, which can replace chemical fertilizers and return to the land. According to the current results, this route is a low-level carbon emission process.
5. Conclusions and Challenges
In conclusion, among the three cyanobacterial mud treating processes discussed in this paper, the carbon emission per unit of cyanobacterial mud treated by aerobic fer-mentation without auxiliary materials is the lowest, but this treating method is highly affected by seasonal fluctuations in cyanobacteria, which may lead to a shortage of raw materials [30,31]. The carbon emission of aerobic fermentation with auxiliary materials is at an intermediate level. Compared with aerobic fermentation without auxiliary materials, the increase in the amount of carbon emissions was significantly caused by the auxiliary materials. This method can dispose of a variety of organic solid wastes at the same time, and the fermentation products can be used as fertilizer, but this method slower than the other two methods used to disposal cyanobacterial mud are, and they require more floor space, and they emit more bad smells [32,33]. The carbon emission level of dry incineration is the highest, and it will emit flue gas pollutants at the same time, but it is also the most thorough way to dispose of cyanobacterial mud, which can minimize the volume of cyanobacterial mud [34].
Because of factors such as process maturity, this paper has not studied the carbon emission of new cyanobacteria and resource-recycling processes using cyanobacteria as raw materials, such as the production of biofuel and alcohols, isoprenoids, biopolymers, recombinant proteins by cyanobacteria. However, the innovative exploration of new technologies for understanding cyanobacteria’s harmlessness and resource utilization is still worthy of encouragement.
Under the threat of global warming, the increasingly severe eutrophication of waters in China, and the “carbon neutrality” target required at present, the carbon emissions caused by the treatment of cyanobacterial mud will be included in the comprehensive evaluation as an essential indicator. In future research work, it is an urgent research interest how to improve the technological process and parameters, while ensuring a low carbon emission level, to effectively reduce the loss of nitrogen in the cyanobacterial composting process, thereby further increasing the degradation rate of microcystin in the cyanobacterial composting process and eliminating the environmental impact. However, it still needs to be explained that carbon emissions are not the only evaluation index, and decision makers should take measures according to local conditions and fully consider the various factors, such as local economic development and water eutrophication. We need to introduce cyanobacterial drying and incineration technology and utilize waste heat resources such as coal-fired power plants, cement kilns, and incineration plants to reasonably achieve the dry incineration of cyanobacterial mud.
Author Contributions
Conceptualization, L.W. and Q.Z.; methodology, L.W.; software, Y.L.; validation, L.W. and Y.L.; formal analysis, L.W.; investigation, Y.L.; resources, Q.Z. and L.W.; data curation, Y.L.; writing—original draft preparation, Y.L.; writing—review and editing, L.W.; visualization, Y.L.; supervision, Q.Z.; project administration, L.W.; funding acquisition, Q.Z. and L.W. All authors have read and agreed to the published version of the manuscript.
Funding
This research received no external funding.
Data Availability Statement
The data that support the findings of this study are available in Intergovernmental Panel on Climate Change at http://www.ipcc.ch/SPM040507.pdf (accessed on 1 December 2022). These data were derived from the following resources available in the public domain: https://www.ipcc.ch/ (accessed on 1 December 2022). Additionally, due to commercial restrictions, a portion of the production data in this study are not publicly available.
Acknowledgments
This work was supported by CCCC Dredging (Group) Co., Ltd. The authors would like to thank Ji Li of the College of Resources and Environmental Sciences of China Agricultural University for helpful discussions on topics related to this work.
Conflicts of Interest
The authors declare no conflict of interest.
References
- Walker, H.W. Harmful Algae Blooms in Drinking Water: Removal of Cyanobacterial Cell Sand Toxins; CRC Press: Boca Raton, FL, USA, 2014. [Google Scholar]
- Best, J.H.; Eddy, F.B.; Codd, G.A. Effects of Microcystis cells, cell extracts and lipopolysaccharide on drinking and liver function in rainbow trout Oncorhynchus mykiss Walbaum. Aquat. Toxicol. 2003, 64, 419–426. [Google Scholar] [CrossRef]
- Whitton, B.A.; Potts, M. The Ecology of Cyanobacteria: Their Diversity in Time and Space; Springer Science & Business Media: Dordrecht, The Netherlands, 2007. [Google Scholar]
- Meng, G.; Sun, Y.; Fu, W.; Guo, Z.; Xu, L. Microcystin-LR induces ceramide to regulate PP2A and destabilize cytoskeleton in HEK293 cells. Toxicology 2011, 290, 218–229. [Google Scholar] [CrossRef]
- Chen, L.; Chen, J.; Zhang, X.; Xie, P. A review of reproductive toxicity of microcystins. J. Hazard. Mater. 2016, 301, 381–399. [Google Scholar] [CrossRef]
- Pacheco, F.S.; Roland, F.; Downing, J.A. Eutrophication reverses whole-lake carbon budgets. Inland Waters 2014, 4, 41–48. [Google Scholar] [CrossRef]
- Song, K.; Wen, Z.; Shang, Y.; Yang, H.; Lyu, L.; Liu, G.; Fang, C.; Du, J.; Zhao, Y. Quantification of dissolved organic carbon (DOC) storage in lakes and reservoirs of mainland China. J. Environ. Manag. 2018, 217, 391–402. [Google Scholar] [CrossRef]
- Massicotte, P.; Asmala, E.; Stedmon, C.; Markager, S. Global distribution of dissolved organic matter along the aquatic continuum: Across rivers, lakes and oceans. Sci. Total Environ. 2017, 609, 180–191. [Google Scholar] [CrossRef] [PubMed] [Green Version]
- Crowther, T.W.; Todd-Brown, K.E.; Rowe, C.W.; Wieder, W.R.; Carey, J.C.; Machmuller, M.B.; Snoek, B.L.; Fang, S.; Zhou, G.; Allison, S.D.; et al. Quantifying global soil carbon losses in response to warming. Nature 2016, 540, 104–108. [Google Scholar] [CrossRef] [PubMed] [Green Version]
- Santoso, A.B.; Hamilton, D.P.; Schipper, L.A.; Ostrovsky, I.S.; Hendy, C.H. High contribution of methane in greenhouse gas emission from a eutrophic lake: A mass balance synthesis. N. Z. J. Mar. Freshw. Res. 2021, 55, 411–430. [Google Scholar] [CrossRef]
- Chaohu Lake Management Bureau of Anhui Province. The Health Status Report of Chaohu Lake (2020) [EB/OL]. 2021. Available online: http://chglj.hefei.gov.cn/chgsw/18182427.html (accessed on 1 October 2022).
- Svirčev, Z.; Chen, L.; Sántha, K.; Backović, D.D.; Šušak, S.; Vulin, A.; Malešević, T.P.; Codd, G.A.; Meriluoto, J. A review and assessment of cyanobacterial toxins as cardiovascular health hazards. Arch. Toxicol. 2022, 96, 2829–2863. [Google Scholar] [CrossRef] [PubMed]
- Chen, J.; Xie, P.; Li, L.; Xu, J. First Identification of the Hepatotoxic Microcystins in the Serum of a Chronically Exposed Human Population Together with Indication of Hepatocellular Damage. Toxicol. Sci. 2009, 108, 81–89. [Google Scholar] [CrossRef]
- Hitzfeld, B.C.; Höger, S.J.; Dietrich, D.R. Cyanobacterial Toxins: Removal during Drinking Water Treatment, and Human Risk Assessment. Environ. Health Perspect. 2000, 108, 113–122. [Google Scholar] [PubMed] [Green Version]
- The People’s Government of Tianjin City. Wuxi Yearbook 2021; Publishing House of Local Records: Beijing, China, 2021; 374p. [Google Scholar]
- Jibiao, Z.; Zheng, Z.; Guo, Z.; Yang, G.; Tie, J.; Jiang, F. Review on microcystins treatment. Environ. Pollut. Control 2005, 27, 355–358. [Google Scholar]
- Wiegand, C.; Pflugmacher, S. Ecotoxicological effects of selected cyanobacterial secondary metabolites a short review. Toxicol. Appl. Pharmacol. 2005, 203, 201–218. [Google Scholar] [CrossRef]
- Dittmann, E.; Wiegand, C. Cyanobacterial toxins—Occurrence, biosynthesis and impact on human affairs. Mol. Nutr. Food Res. 2006, 50, 7–17. [Google Scholar] [CrossRef] [PubMed]
- Parmar, A.; Singh, N.K.; Pandey, A.; Gnansounou, E.; Madamwar, D. Cyanobacteria and microalgae: A positive prospect for biofuels. Bioresour. Technol. 2011, 102, 10163–10172. [Google Scholar] [CrossRef] [PubMed]
- Hosetti, B.B.; Frost, S. A review of the sustainable value of effluents and sludges from sewage stabilization ponds. Ecol. Eng. 1995, 5, 421–431. [Google Scholar] [CrossRef]
- Ma, Y.; Liu, Y. Turning food waste to energy and resources towards a great environmental and economic sustainability: An innovative integrated biological approach. Biotechnol. Adv. 2019, 37, 107414. [Google Scholar] [CrossRef]
- Cao, Z.; Wang, X. Selection of Sludge Treatment and Disposal Scheme in a Municipal Sewage Treatment Plant. China Water Sew. 2013, 29, 13–15. [Google Scholar]
- Fu, R.; Yang, H.; Gan, M. Sludge Disposal in Chinese Urban Sewage Treatment Plant: Present Status and Future. Environ. Sci. Technol. 2004, 27, 108–110. [Google Scholar]
- Fytili, D.; Zabaniotou, A. Utilization of sewage sludge in EU application of old and new methods—A review. Renew. Sustain. Energy Rev. 2008, 12, 116–140. [Google Scholar] [CrossRef]
- Syed-Hassan, S.S.A.; Wang, Y.; Hu, S.; Su, S.; Xiang, J. Thermochemical processing of sewage sludge to energy and fuel: Fundamentals, challenges and considerations. Renew. Sustain. Energy Rev. 2017, 80, 888–913. [Google Scholar] [CrossRef]
- Zhang, S.; Zhao, Y.; Zhou, C.; Duan, H.; Wang, G. Dynamic sulfur–iron cycle promoted phosphorus mobilization in sediments driven by the algae decomposition. Ecotoxicology 2021, 30, 1662–1671. [Google Scholar] [CrossRef] [PubMed]
- IPCC. Intergovernmental Panel on Climate Change Working Group III, Fourth Assessment Report (2007). Climate Change 2007: Mitigation of Climate Change [EB/OL]. Available online: https://www.ipcc.ch/report/ar4/syr/ (accessed on 23 July 2010).
- Callegari, A.; Bolognesi, S.; Cecconet, D.; Capodaglio, A.G. Production technologies, current role, and future prospects of biofuels feedstocks: A state-of-the-art review. Crit. Rev. Environ. Sci. Technol. 2020, 50, 384–436. [Google Scholar] [CrossRef]
- Guideline on Best Available Technologies of Pollution Prevention and Control for Treatment and Disposal of Sludge from Municipal Sewage Treatment Plant (on Trial); Ministry of Ecology and Environment of the People’s Republic of China: Beijing, China, 2010.
- Ren, Y.; Cui, C.; Liu, F.; Zhan, X.; Zhou, L. Study on Composting of Cyanobacteria Amended with Different N Loss Inhibitor. Environ. Sci. 2012, 33, 1760–1766. [Google Scholar]
- Guo, K.; Gao, B.; Yue, Q. Research status and prospect of the comprehensive utilization of paper mill sludge. J. Civ. Environ. Eng. 2021, 43, 118–131. [Google Scholar]
- Hu, P.; Hou, F.; Fan, Y.; Liu, C.; Chen, L.; Lu, X.; Zhou, X. Aerobic Fermentation Process of Deep Dewatering Sludge. China Water Wastewater 2021, 37, 74–77. [Google Scholar]
- Wei, L.L.; Zhu, F.Y.; Li, Q.Y.; Xue, C.; Xia, X.; Yu, H.; Zhao, Q.; Jiang, J.; Bai, S. Development, current state and future trends of sludge management in China: Based on exploratory data and CO2-equivalent emissions analysis. Environ. Int. 2020, 144, 106093. [Google Scholar] [CrossRef]
- Chai, C.Y.; Zhang, D.W.; Yu, Y.L.; Feng, Y.; Wong, M.S. Carbon footprint analyses of mainstream wastewater treatment technologies under different sludge treatment scenarios in China. Water 2015, 7, 918–938. [Google Scholar] [CrossRef]
Figure 1.
The brief process flowchart and the main carbon emission units.

Figure 2.
Position map with sampling point and disposal point.

Figure 3.
Schematic diagram of the process flow of aerobic fermentation without auxiliary materials.
Figure 3.
Schematic diagram of the process flow of aerobic fermentation without auxiliary materials.

Figure 4.
Process flowchart of aerobic fermentation with auxiliary materials.

Figure 5.
Process flowchart of cyanobacteria drying and incineration.

Figure 6.
Effects of different cyanobacterial treatments on carbon emission.

Figure 7.
Carbon emission in each link of the aerobic fermentation process.

Figure 8.
Carbon emission in each link of the cyanobacteria drying incineration process.


Table 1.
Ingredient lists.
| Materials | Cyanobacterial Mud | Spent Mushroom Compost | Crops Straw | Livestock Manure | Liquid Compound Bacterium Agent |
|---|---|---|---|---|---|
| ratios by weight /% | 1.0 | 0.4 | 0.3 | 0.3 | 0.002 |
| moisture content /% | 85 | 25 | 20 | 80 | 99 |
Disclaimer/Publisher’s Note: The statements, opinions and data contained in all publications are solely those of the individual author(s) and contributor(s) and not of MDPI and/or the editor(s). MDPI and/or the editor(s) disclaim responsibility for any injury to people or property resulting from any ideas, methods, instructions or products referred to in the content. |
© 2023 by the authors. Licensee MDPI, Basel, Switzerland. This article is an open access article distributed under the terms and conditions of the Creative Commons Attribution (CC BY) license (https://creativecommons.org/licenses/by/4.0/).
Share and Cite
MDPI and ACS Style
Wang, L.; Li, Y.; Zhang, Q. Comparative Study on Carbon Emission of the Cyanobacteria Mud Disposal Process. Water 2023, 15, 528. https://doi.org/10.3390/w15030528
AMA Style
Wang L, Li Y, Zhang Q. Comparative Study on Carbon Emission of the Cyanobacteria Mud Disposal Process. Water. 2023; 15(3):528. https://doi.org/10.3390/w15030528
Chicago/Turabian StyleWang, Liying, Youcai Li, and Qingbo Zhang. 2023. "Comparative Study on Carbon Emission of the Cyanobacteria Mud Disposal Process" Water 15, no. 3: 528. https://doi.org/10.3390/w15030528
Note that from the first issue of 2016, this journal uses article numbers instead of page numbers. See further details here.