
Characteristics and Source Analysis of High-Arsenic Groundwater in Typical Watershed Areas of Tibet, China
by
Zhongwei Zhang
1,2,3, 
Liangjing Zhou
1,2,3,
Yunjiao He
1,2,3,
Zhaohui Luo
4,* and
Sibao Chen
1,2,3,* 1
Key Laboratory of Changjiang Regulation and Protection of Ministry of Water Resources, Wuhan 430010, China
2
Hubei Key Laboratory of Basin Water Security, Hubei Provincial Engineering Research Center for Comprehensive Water Environment Treatment in the Yangtze River Basin, Wuhan 430010, China
3
Changjiang Survey Planning Design and Research, Co., Ltd., Wuhan 430010, China
4
School of Environmental Studies, China University of Geosciences, Wuhan 430074, China
*
Authors to whom correspondence should be addressed.
Water 2023, 15(3), 533; https://doi.org/10.3390/w15030533
Submission received: 23 December 2022
/
Revised: 25 January 2023
/
Accepted: 27 January 2023
/
Published: 29 January 2023
(This article belongs to the Special Issue Impact of Geological Uncertainty on Geological Hazards and Groundwater Environment Assessments)
Abstract
:High-arsenic water limits the utilization and development of water resources in Tibet, and high-arsenic groundwater is one of the major sources of arsenic input to surface water in the area. In this work, the characteristics of groundwater and the source and formation of arsenic in a typical watershed in Tibet (the lower tributaries of the Angqu River) were investigated using systematic surveys, ionic ratios, Gibbs diagrams, in combination with isotopic and heat storage calculation methods. The studies show that the chemical composition of the water in the study area is mainly determined by the rock weathering of carbonate and silicate rocks. The average recharge elevation levels of hot spring water are 4874.1 m, 4058.1 m, and 4745.0 m, respectively. Deep hot water is the main source of arsenic in the spring water, and its arsenic flux accounts for 98.44–99.77% of the measured flux in the spring water.
1. Introduction
The discharge of groundwater with high arsenic content into surface water is one of the main sources of arsenic in the aquatic environment, especially in areas with geothermal systems [1,2]. The high arsenic content in surface water severely limits the development and utilization of water resources in these areas [3,4]. High arsenic groundwater also has a greater impact on human life safety in areas where groundwater is the primary water source [5,6].
Numerous studies have been conducted on the investigation, distribution, cause, transformation and migration mechanism, pathology, and treatment and disposal measures of high-arsenic groundwater [7,8,9,10,11,12,13,14,15]. Bhattacharyya et al. among other researchers, presented the mobilization, metabolism and mitigation of arsenic in groundwater in the Bengal Delta plain [7]. Reducing the ingested inorganic arsenic level and introducing newer treatment options to ensure safe water supply were proposed. Rodríguez-Lado et al. developed a statistical risk model that classified safe and unsafe areas in terms of geogenic arsenic contamination in China [8]. Wang et al. [9] and Li et al. [10] studied the distribution and genesis mechanisms of high-arsenic groundwater at basin level. The relationship between the groundwater distribution and its impacts on groundwater arsenic enrichment and variation were studied by Wei et al. [14]. Mukherjee et al. compared the differences between the Huhhot basin and the West Bengal basin (India) with high-arsenic groundwater from the perspective of chemical reactions [15].
The relationship between human health and arsenic-containing groundwater has been studied by many scientists from the standpoints of water chemistry, isotopy, and use and utilization. Podgorski and Berg pointed out the global threat of arsenic in groundwater [16]. Guo et al. comprehensively analyzed the distribution, characteristics, and geochemical processes of high-arsenic groundwater on both the mainland and Taiwan in China [17]. Many researchers have also studied the occurrence, distribution, and management of high-arsenic groundwater based on other chemical characteristics, such as groundwater with high fluorine content, iron ions, and isotopes [18,19,20,21,22,23]. Smith et al. [24] noted that excessive pumping can lead to a threat of arsenic in groundwater in California. In addition, the purification of high-arsenic groundwater and emergency management measures are also important. Some progress has already been made in this field [25,26,27].
Research on the groundwater environment and high-arsenic groundwater in Tibet is also a research priority [28,29]. Scientists have conducted a variety of investigations and analyses of arsenic in rocks, soil, waters, and sediments in Tibet. High numbers of anomalies may come mainly from the geothermal system and groundwater in this system [30,31,32]. The distribution of arsenic can be affected by surface water and the construction of dams in the region of Tibet [33,34]. It has been found that arsenic can be enriched in surface water, river sediments, and soil in Tibet [35]. It has also been reported that geothermal springs are one of the causes of arsenic contamination in river water on the southern Tibetan Plateau [36]. Studies in areas with similar geological conditions as Tibet have shown that tectonic movements, sedimentation, and the hydrological cycle are three important factors affecting the migration and transformation of arsenic in groundwater [37].
The Angqu River is the main tributary of the upper reaches of the Lancang River and has abundant water resources and a large hydropower capacity. However, there are numerous arsenic anomalies in many springs and geological features in the Angqu River basin, which affect the water quality in the lower reaches of the river. In this paper, two typical watersheds of Mangdaqu and Endaqu on the lower reaches of Angqu River were taken as research objects, and the groundwater characteristics and arsenic sources in the two typical watersheds (mainly springs) were analyzed.
2. Background Conditions of the Study Area
2.1. Geographic Conditions
The Angqu River is a tributary of the Lancang River with a catchment area of 17,715 km2 and a length of 499.3 km. The study area includes the Endaqu River and Mangdaqu River drainage basins downstream of the Angqu River and is about 50 km from Changdu City. The Endaqu River is located on the right bank of the Angqu River with a river length of 15 km and a catchment area of about 306 km2; the Mangdaqu River is located on the left bank with a river length of 18 km and a catchment area of 258 km2.
The study area is located in the east of the Qinghai–Tibet Plateau, a highly compressed geological–tectonic deformation area, and the terrain slopes from northwest to southeast. The lowest elevation of the study area is 3450 m, and the highest peak is Zalama Peak of the watershed in the west, with an elevation of 5308 m and a relative elevation difference of about 2000 m. The bedrock is exposed in most sections of the area, the slopes on both banks are steep, and vegetation is scarce.
The study area belongs to the temperate semi-arid monsoon climate zone of the plateau. The average annual temperature is 7.8 °C and the lowest temperature is −20.7 °C. The average annual precipitation and evaporation values are 491 mm and 1597 mm, respectively. In total, 74.9% of precipitation falls from June to September.
2.2. Geological Conditions
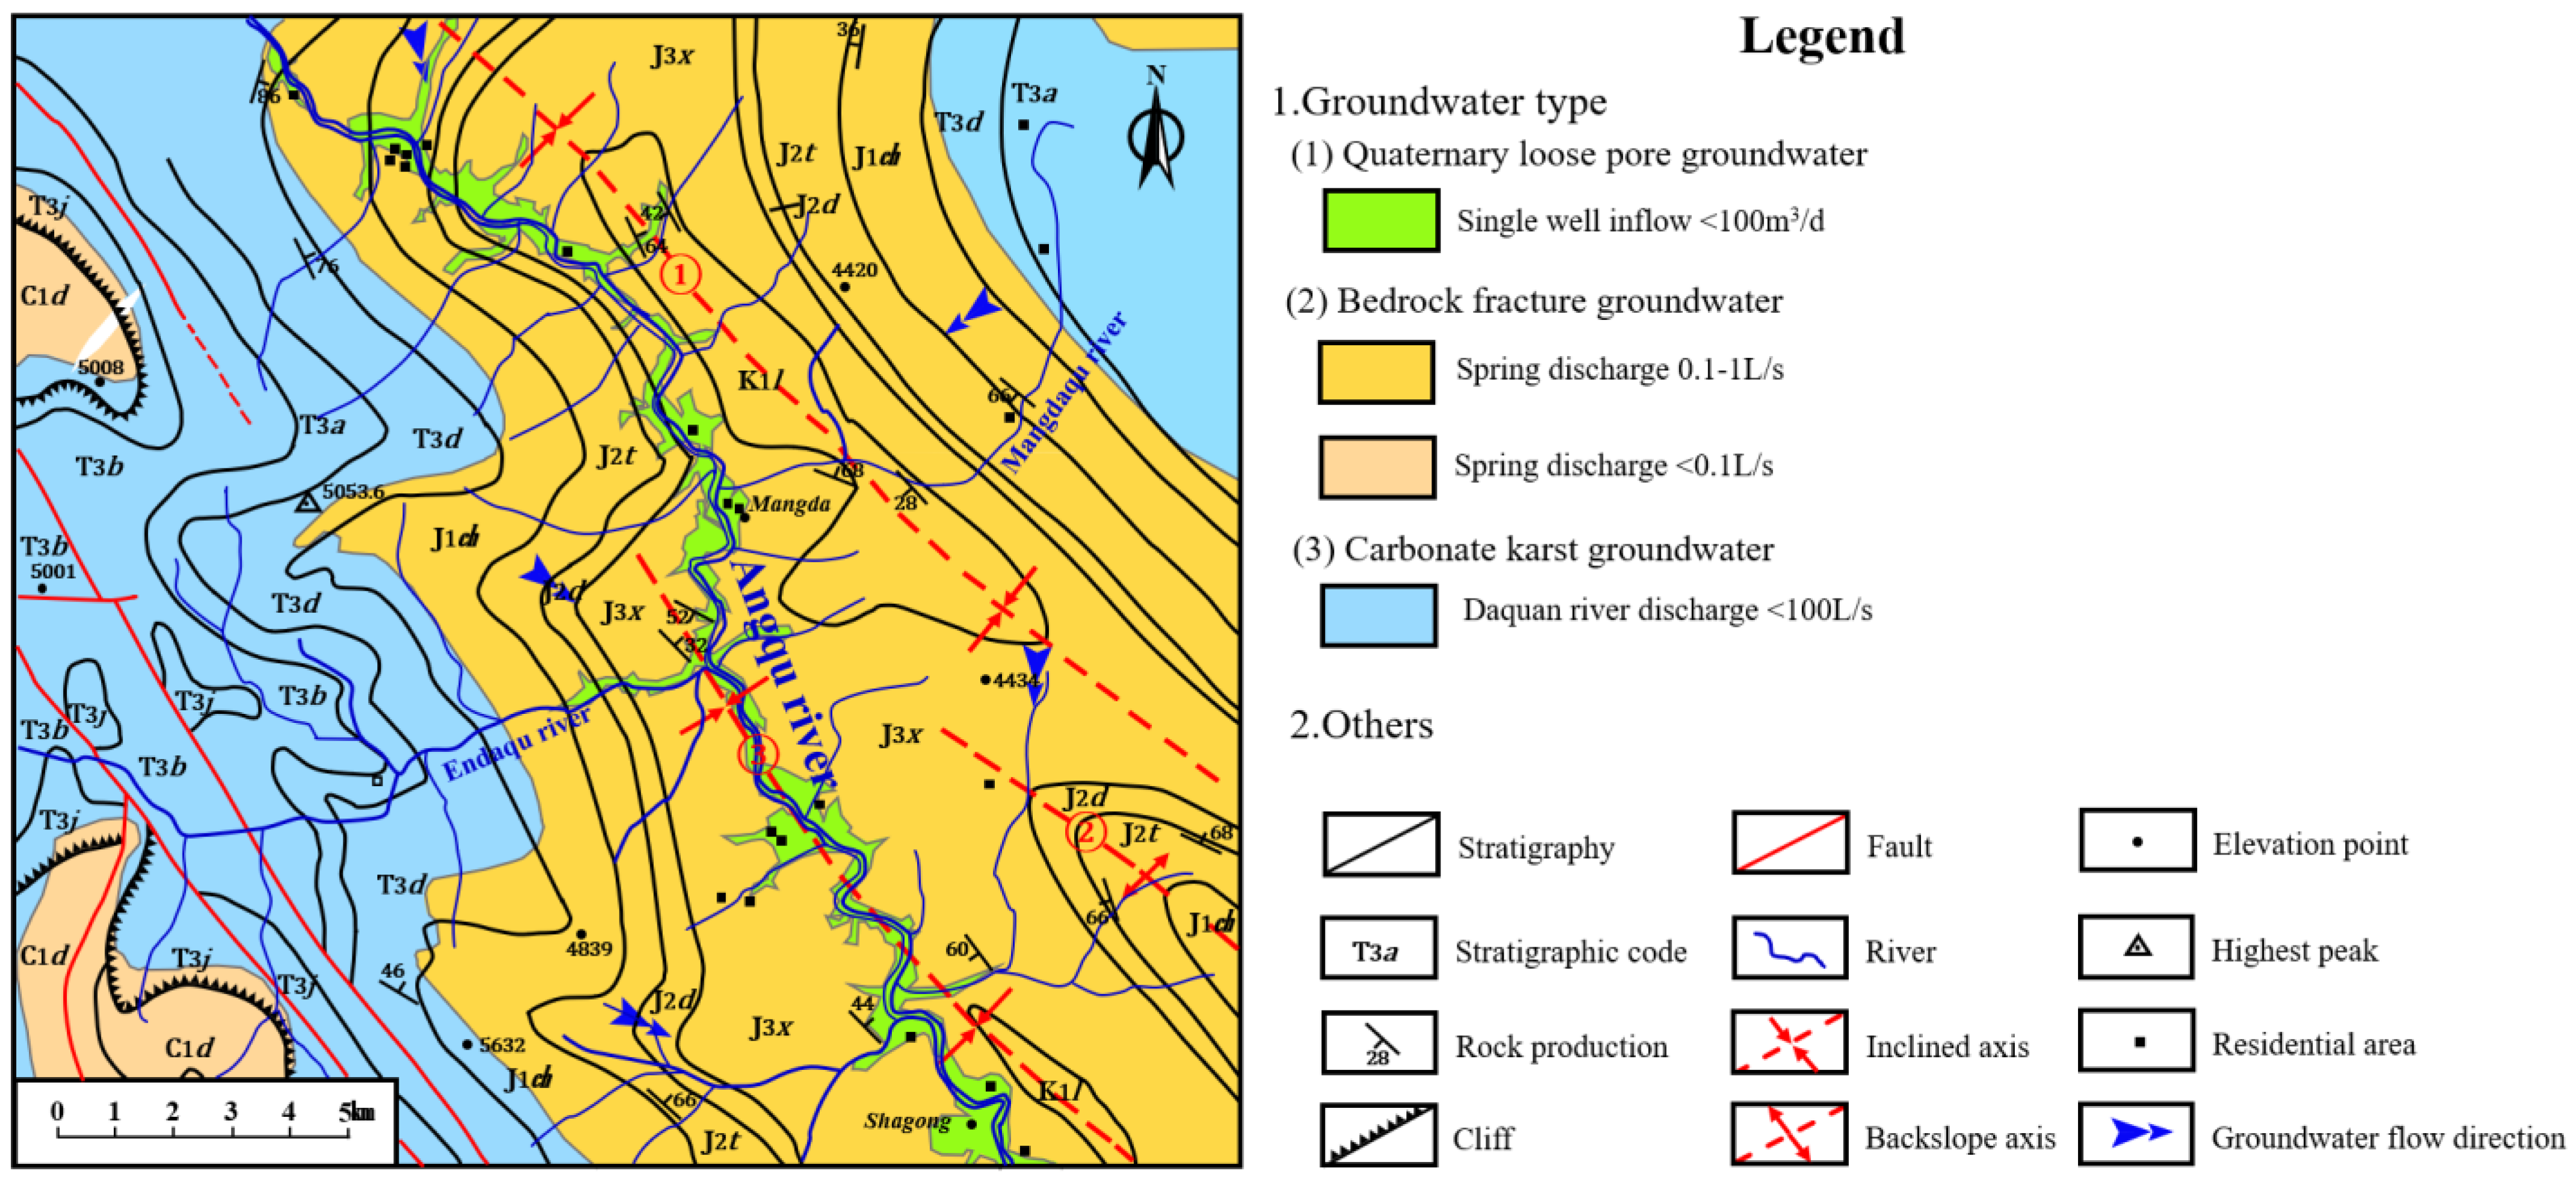
The strata in the region range from Carboniferous to Quaternary, with Mesozoic (Triassic, Jurassic, and Cretaceous) being the most widespread (Figure 1). The Carboniferous and Permian strata are distributed only in a small area, mainly in the western part near the watershed. The Carboniferous and Middle/Lower Permian strata are dominated by limestone, while the upper Permian strata are dominated by shale, sandstone, volcanic breccia, and tuff interbedded with coal seams. The upper Triassic strata are distributed mainly in the upper part of the watershed on both sides of the Angqu Valley. The upper Triassic strata are divided into four formations, namely, the Kapila Formation, the Bolila Formation, the Adula Formation, and the Dougaila Formation. The Bolila Formation is composed of dolomite and limestone, while the other three formations are mainly quartz sandstone and shale with some limestone or coal layers. The Jurassic and Cretaceous systems are distributed on both sides of the Angqu River valley and are mainly composed of mudstone and sandstone, with some limestone layers in between. Most sedimentary strata older than the Jurassic system are metamorphic to varying degrees in this area. Volcanic activities in this area include the Variscan, Indosinian, and Yanshan phases, and the distribution area of intrusive igneous rocks is limited.
The study area is part of the Manda syncline, which is located between the villages of Manda and Shagong and rises from southeast to northwest. The youngest layer in the core of the syncline is the sandstone of the Laoran Formation of Lower Cretaceous age. The wings are Jurassic purple sandy mudstone, Triassic carbonate, and clastic rocks. The faults also trend northwest–south and are extensive. The youngest activity of these faults is in the Quaternary period. The hot springs in the area are located near these faults.
2.3. Hydrogeological Conditions
Groundwater in the study area is subdivided according to burial conditions and the type of water-bearing medium, which is mainly pore groundwater from Quaternary unconsolidated sediments, fracture groundwater from bedrock, and karst-fracture groundwater (Figure 1).
Quaternary pore groundwater is most common in floodplains and river terraces where there is a small exposed area and a low water volume. Clastic fracture groundwater occurs mainly in Jurassic, Cretaceous, Carboniferous, and Upper Permian strata and has a poor fracture formation and low water volume. It is influenced by the atmospheric precipitation recharge and lateral recharge of surrounding shallow groundwater. The maximum discharge of the fracture springs (Q1–Q16) is less than 1 L/s.
The karst-fracture groundwater is mainly distributed in the upstream part of the two tributaries with weak to moderate flow, and the aquifer of the Triassic Adiula Formation (T3a) and Bolila Formation (T3b) has higher flow than others. The Triassic aquifer also concentrates most of the hot springs in the area. Karst spring discharges can reach 200 L/s (Endaqu Cool Spring), especially near the faults.
The alpine climate results in weak and slow karst processing in this area. There are rarely large karst caves or typical karst landscapes, but karst traces and gullies are widespread.
2.4. Hot Springs
Geothermal activity is extremely high in the Angqu Basin. Three hot springs, including the Endaqu Hot Spring (EHS), the Mangdaqu Left Spring (MLS), and the Mangdaqu Right Spring (MRS, spring with seasonal discharge), are located in both the Endaqu River and Mangdaqu River basins. The Endaqu Cool Spring (ECS), whose temperature is well above the local average temperature, also discharges groundwater into the Endaqu basin. In addition, Yiri Hot Spring (YHS) and Zhugu Temple Hot Spring (ZHS) exist near the study area. The hot springs are medium- to low-temperature springs with a water temperature of about 15–40 °C. Figure 2 shows an overview of the hot springs.
3. Research Methods and Sample Collection
Sampling and Monitoring Plan
In 2017–2019, the arsenic content of rock, soil, surface water and groundwater were monitored and analyzed by intermittent sampling, and some indicators were monitored continuously for a longer period of time.
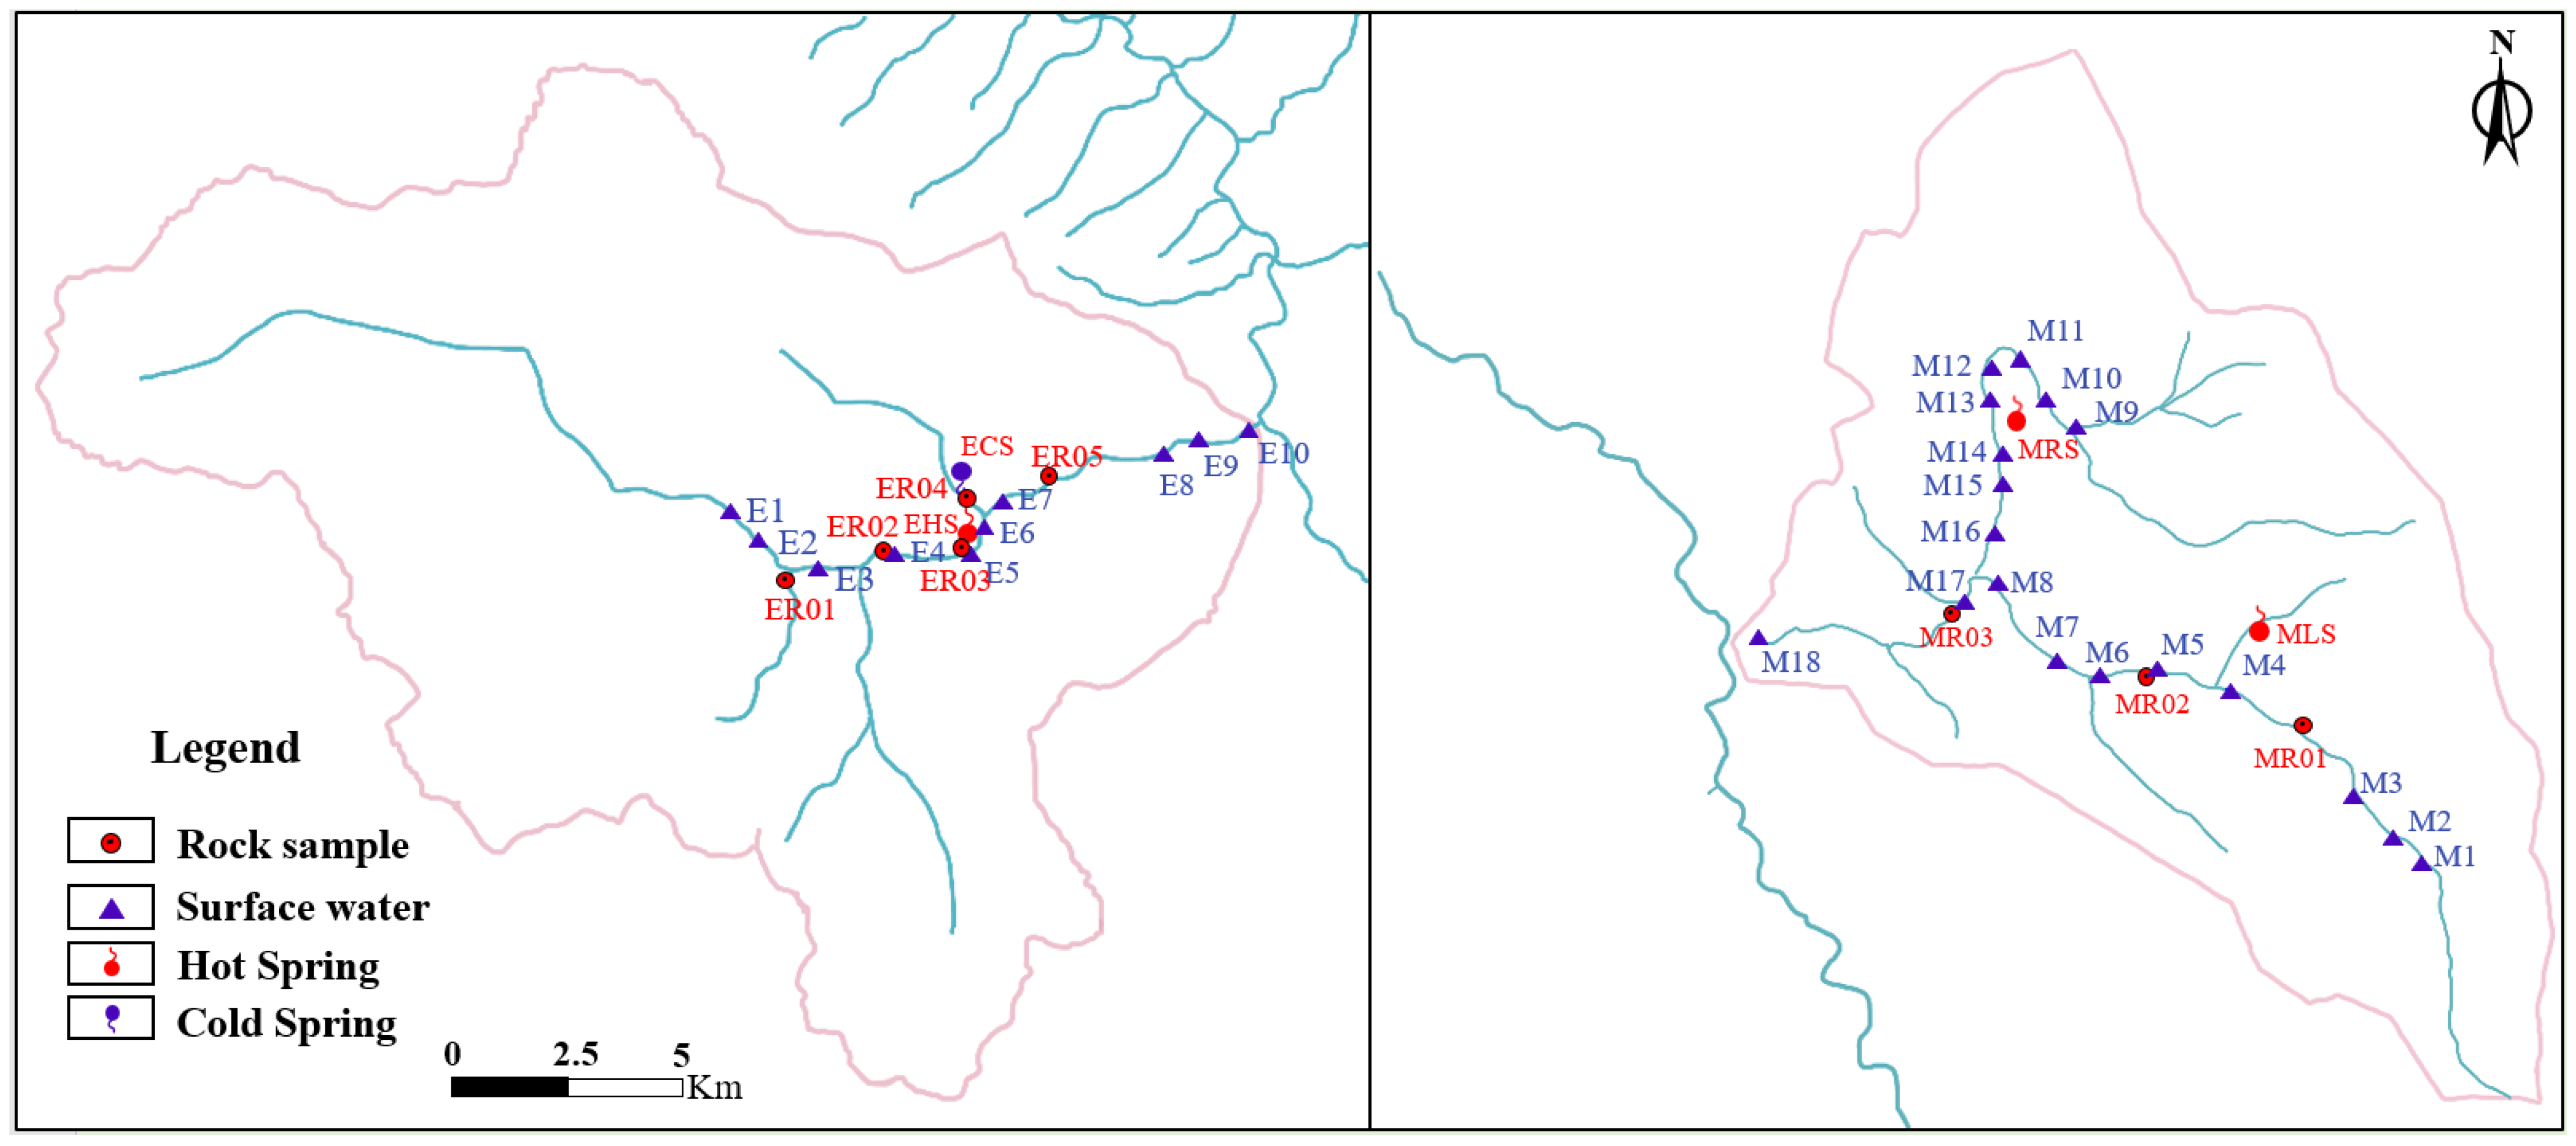
Rock and soil samples were collected mainly from Triassic and Jurassic strata. Groundwater samples were collected mainly from springs, including hot and cold springs. Surface water samples were collected from the Endaqu and Mangdaqu Rivers and included the representative location of the Angqu River. To investigate the enrichment conditions and origin of the springs, D-isotope and 18O samples of springs were collected from three hot springs (Endaqu Hot Spring, Endaqu Cool Spring, and Mangdaqu Left Spring), five descending springs (no hot springs, as an elevation reference) in the Jurassic area, and river water samples from the Angqu River between the two tributaries. A total of 10 isotope monitoring points were set up. The arrangement of sampling sites is shown in Figure 2 and the isotope sampling sites are listed in Table 1.
Arsenic contents were monitored 4 times (the annual dry season—November and the rainy season—July) in surface water from 2017 to 2018. A total of 28 monitoring points for surface water were set up. Arsenic in groundwater were monitored 11 times from 2017 to 2019 (January, March, July and November in 2017 and 2018; March, July and November in 2019). A total of 4 groundwater quality monitoring points were set up. Rock/soil samples were collected from each layer in the study area, including 5 rock samples and 5 soil samples in the Endaqu watershed and 3 in the Mangdaqu watershed. Hot springs, including the nearby Yiri Hot Spring and Zhugusi Hot Spring, and samples of river water and estuarine ditch water were collected in late November 2019 to test for anions, cations, soluble SiO2, and other indicators.
4. Results and Discussion
4.1. Arsenic Properties of Groundwater
The water parameters, according to the monitoring results of 2017–2019, are summarized as shown in Table 2.
The arsenic concentration in the hot springs in the study area is 104.5~1933.0 μg/L, and the average value is 685.5 μg/L. Both values are far above the limit of Class V groundwater standards in China (50 μg/L). The arsenic concentration in Jurassic springs is 0.2~28.9 μg/L with an average value of 8.5 μg/L, which is obviously lower than that in hot springs.
The discharge of ECS changes greatly, while EHS and MLS are relatively stable. Most Jurassic springs have a discharge of less than 0.5 L/s with temperatures lower than 2.5 °C; MLS shows more or less agreement with other springs with a high conductivity of 1750~2000 μS/cm and a high arsenic concentration of 1.0~2.0 mg/L.
The hydrochemical characteristics of the springs in the study area belong to different genetic types [38]. Through comparative analysis, it can be tentatively concluded that the ECS is strongly influenced by atmospheric precipitation and has a low circulation depth. It is characterized by large runoff fluctuations, low temperature, and a low arsenic concentration; the EHS is apparently a runoff that participates in deeper circulation and is characterized by stable runoff, high temperature, and a relatively high arsenic concentration. However, the MLS has completely different characteristics, with a high conductivity and arsenic concentration and low pH, indicating a long discharge path or mixing with geothermal fluid and it is probably a deeply circulating groundwater with fault origin. The discharge, temperature, and arsenic content of Jurassic springs are very low, indicating that it is a surface spring originating from a shallow fissure aquifer.
The arsenic content of rock/soil samples collected from Triassic and Jurassic strata in the two tributaries shows that the arsenic content is 5.96–131.01 mg/kg, and the average content in limestone is 99.55 mg/kg, 7.07 mg/kg in quartz sandstone, and 6.92 mg/kg in mudstone and claystone, and the arsenic content in limestone is much higher than in sandstone and mudstone by about 6–20 times.
4.2. Hydrochemical Characteristics and Arsenic Source Indications
The analysis of the chemical characteristics of groundwater can provide us with a rough understanding of the development of groundwater, along with clues to the arsenic source [39].
4.2.1. Hydrochemical Characteristics Indicating the Origin of Groundwater
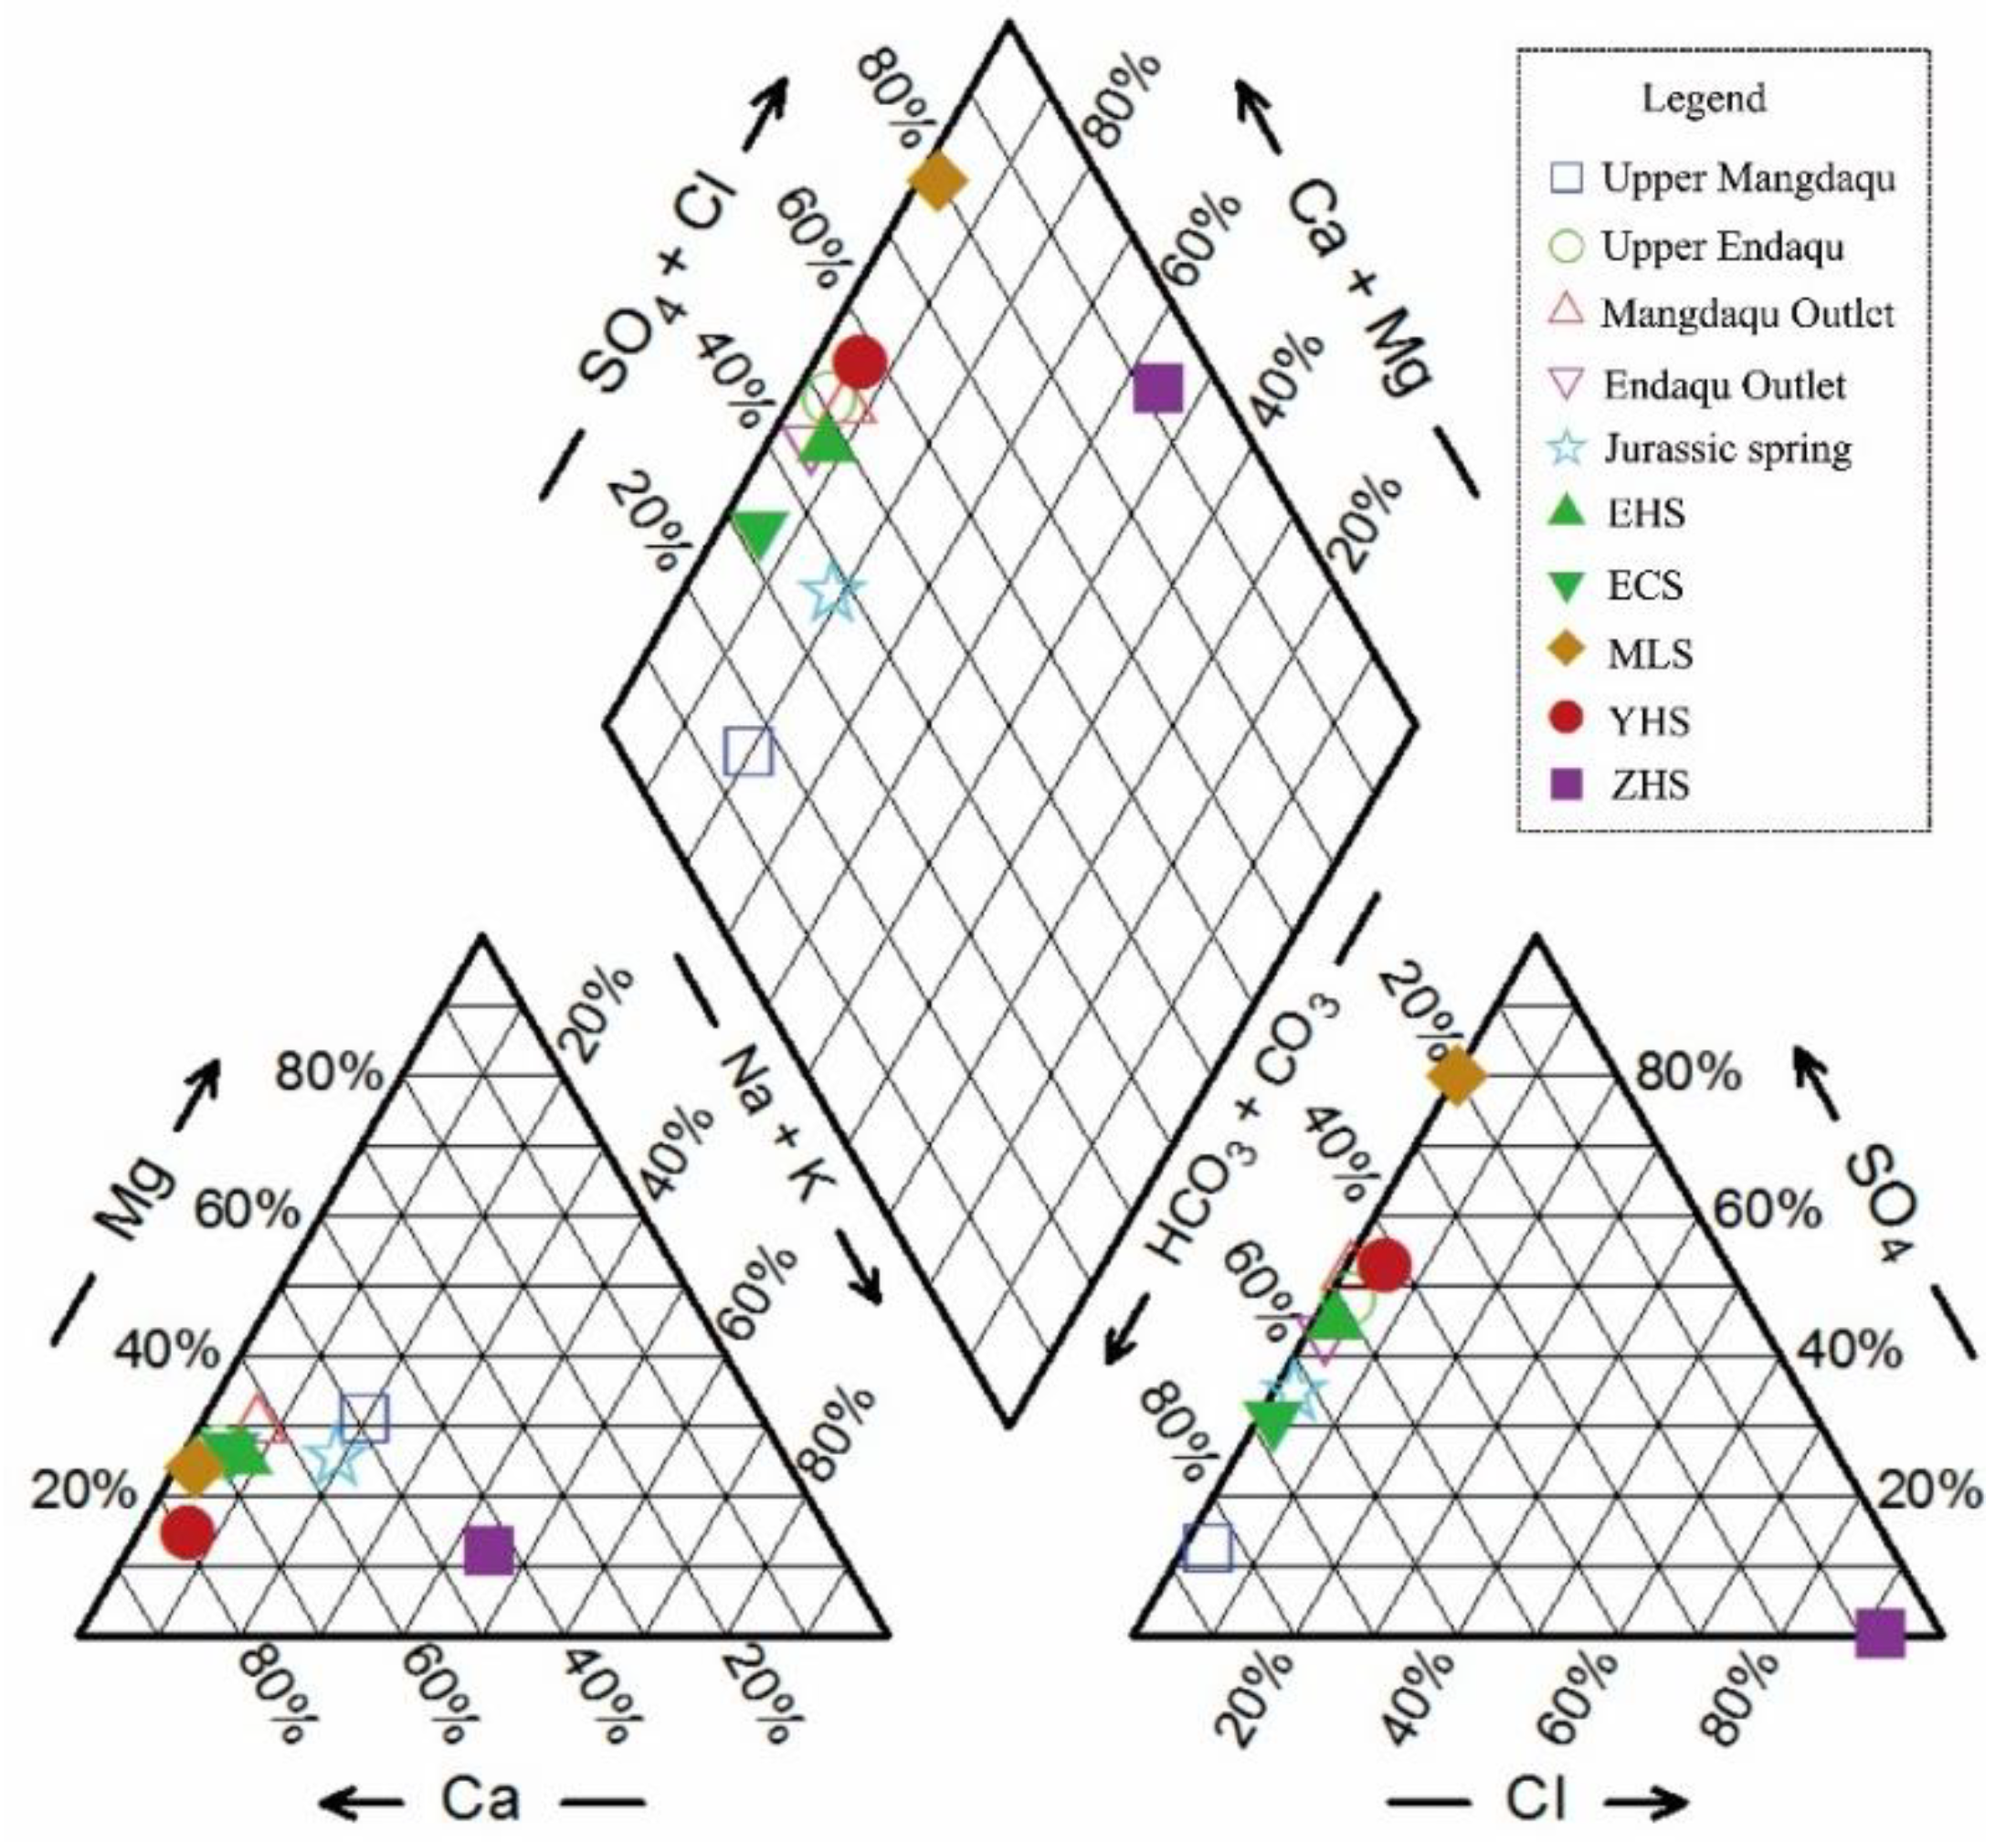
According to the Shchukarev classification, the samples of surface water and groundwater in the study area are mainly of the HCO3-SO4-Ca-Mg type. The Piper three-line diagram of anions and cations was used (Figure 3), which can directly reflect the relative content and distribution of major ions in the water body, and accordingly classify the hydrochemical types of the water body and distinguish the sources of major and minor ions in the water body. When the pure carbonate rock interacts with water, the dominant anion in the water is HCO3− and the samples in the diagram should be near the HCO3− peak [14,39]. However, when the carbonate rock is eroded by sulfuric acid and travertine is deposited, eventually releasing CO2, the data points generally fall within the middle range; when weathering of evaporite and sulfuric acid intrusion into silicate rock are involved, the projection of the individual points is generally at the SO42− end [17]. Similarly, the peak of Ca2+ leads to interactions of limestone or gypsum with water. The center line of Mg2+ − Ca2+ (Ca: Mg = 1:1) signifies the dissolution of dolomite in water, while weathering of silicate rock tends to occur at the K+ + Na+ end.
It can be seen that the anions of the water sample are mainly distributed at the HCO3− and SO42− ends, while the cations are mainly distributed at the Ca2+ end, indicating that the hydrochemical components are mainly controlled by the dissolution of limestone and gypsum. The ZHS shows a completely different situation to other sources. Due to the strong reduction environment (ORP is −92 mv), SO42− is reduced to H2S and disappears into the water. SO42− accounts for 70% of the total anions; Cl− 30% and the cation are mainly Ca2+ in MLS, which could indicate the dissolution of gypsum. Other water samples are concentrated in a small zone of anions and cations, with similar hydrochemical characteristics. The cations are mainly Ca2+ and Mg2+ and the anions are mainly HCO3− and SO42−, which are controlled by carbonate rock and gypsum.
Therefore, the interaction between groundwater and rock and the weathering of hot water in EHS, ECS, and YHS are mainly due to the dissolution of carbonate rocks, mainly the Triassic Borila Formation (T3b). The surrounding rocks of the underground thermal reservoir in MLS could be rich in gypsum, while the surrounding rocks of ZHS consist of claystone and sandstone, the Triassic Duogaila Formation (T3d2), with high Na+ and Cl− content in the water, indicating the possible involvement of rock salt in the formation.
4.2.2. Processing-Based Analysis of Hydrochemical Properties
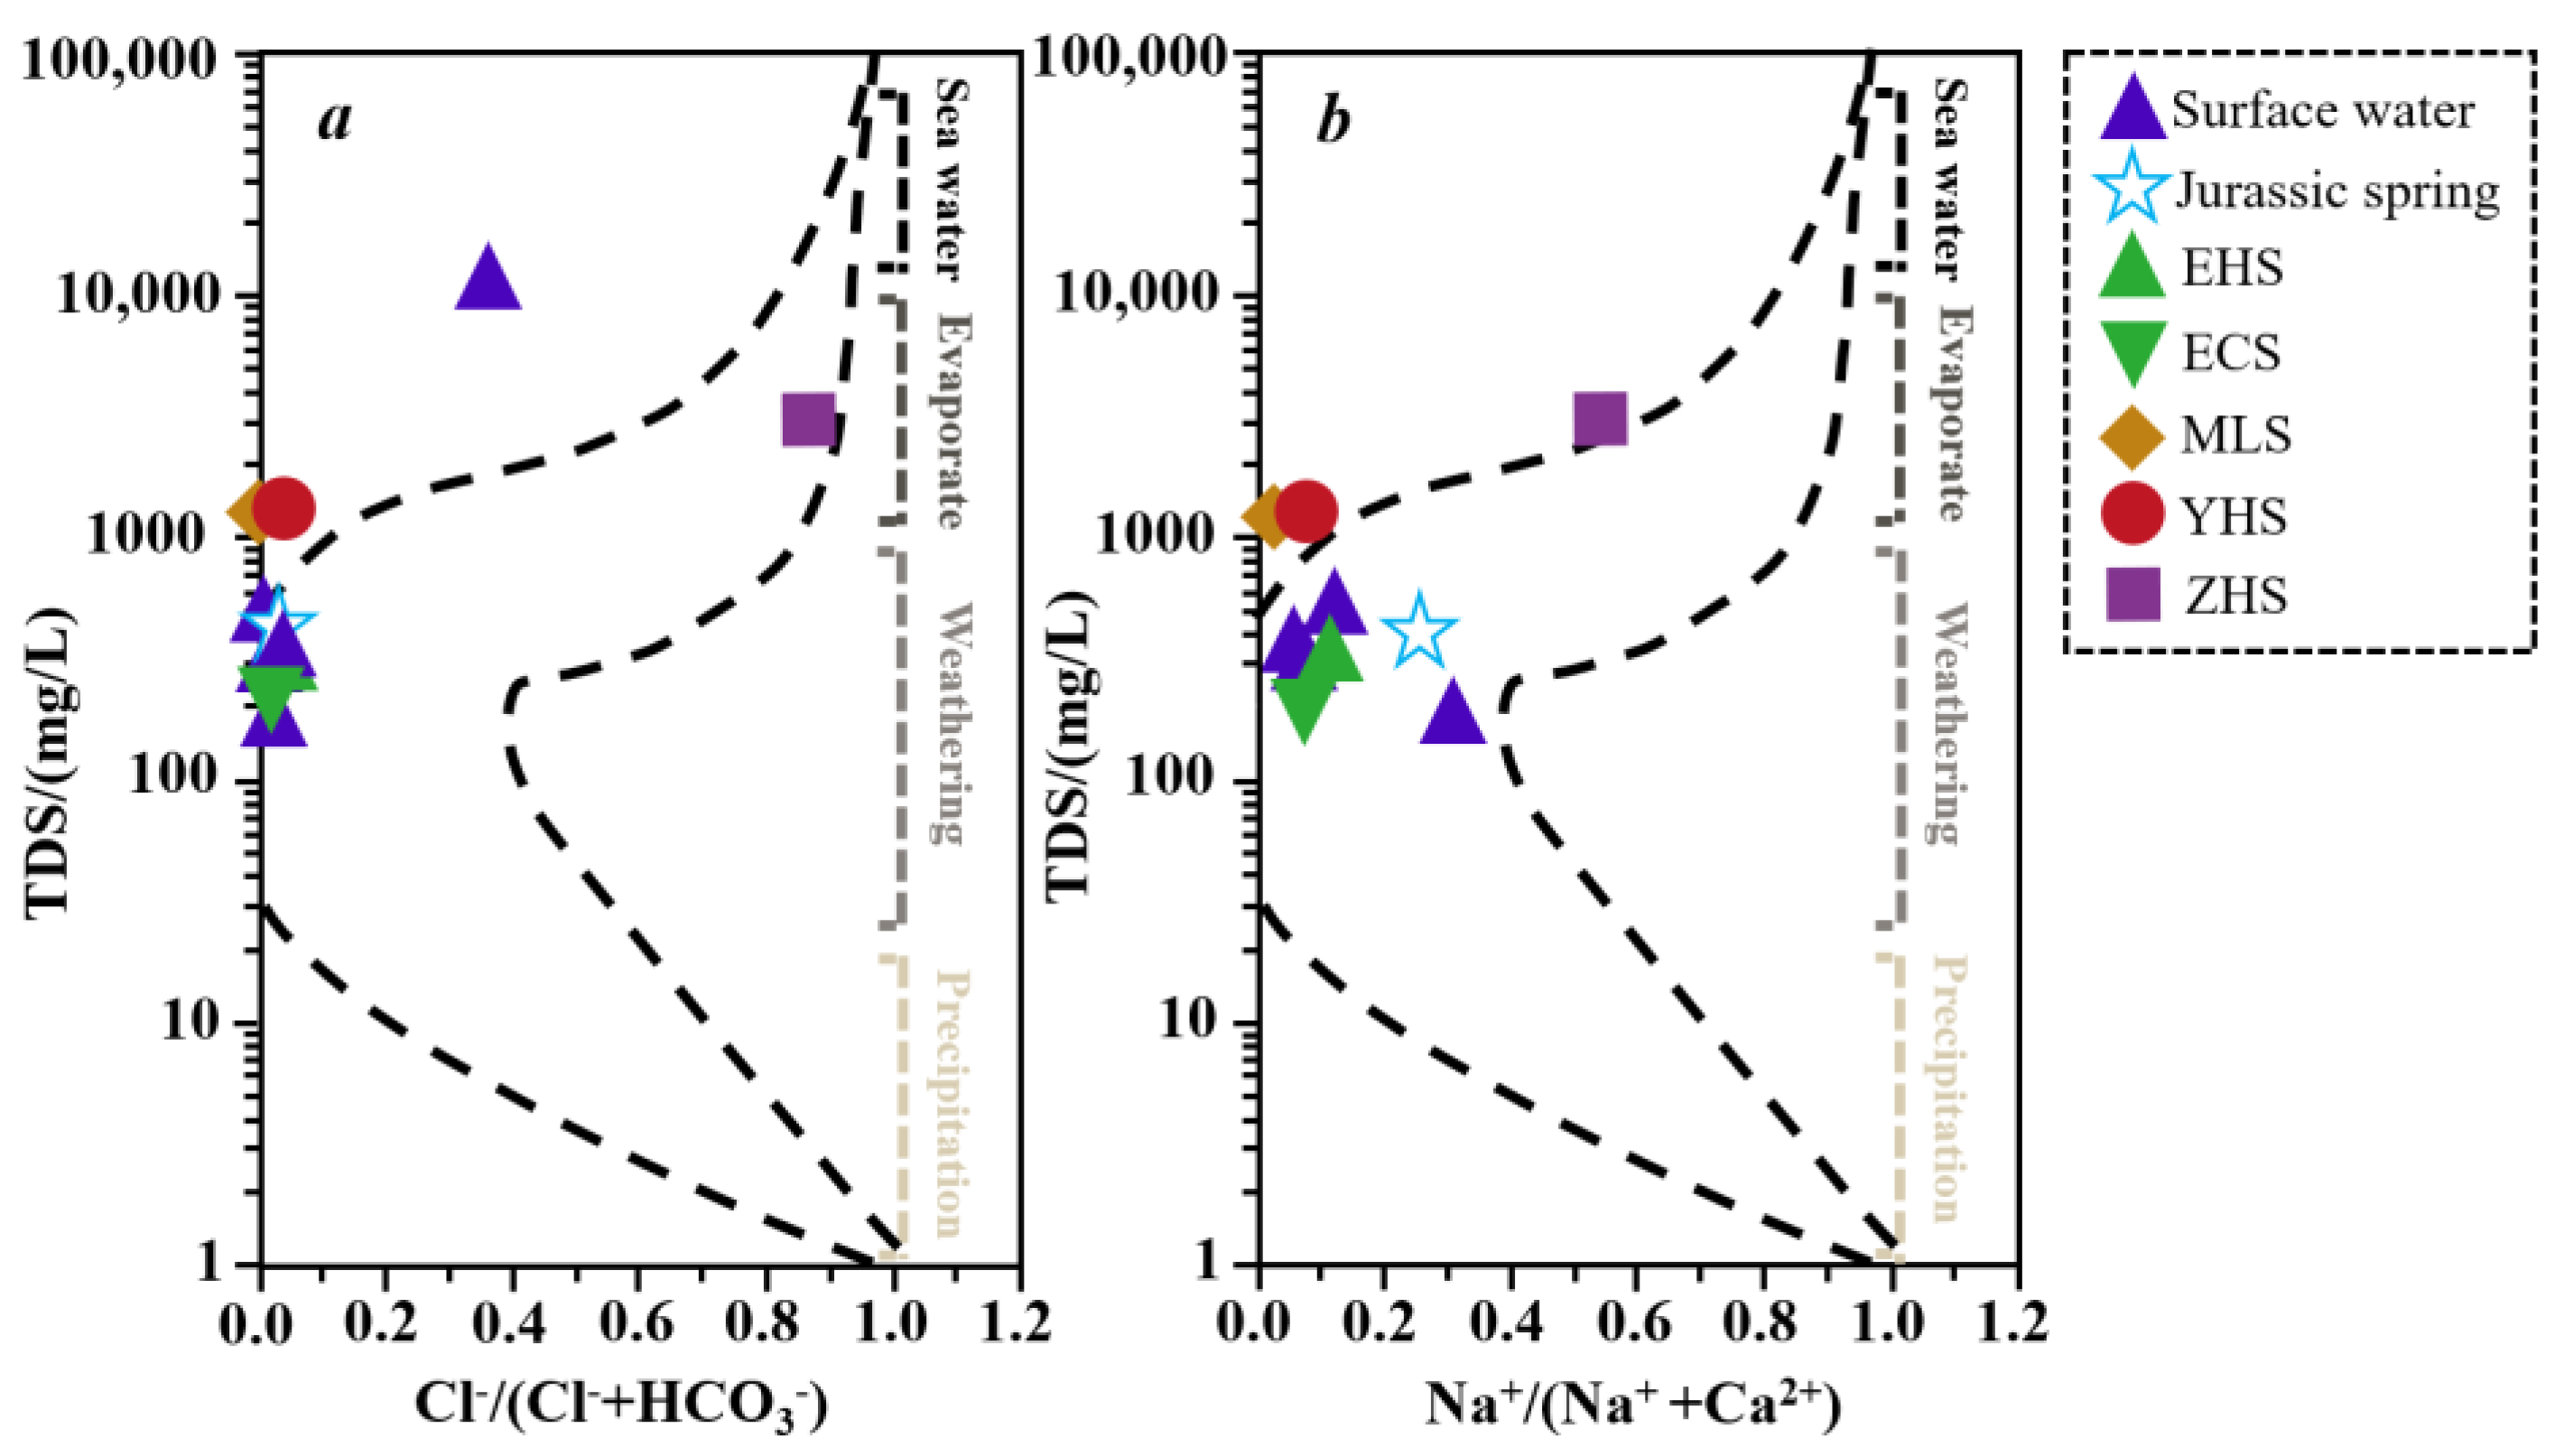
The Gibbs model for the origin of natural water quality can reveal the main controlling processes of the chemical composition of water in the basin (Figure 4). The model divides the processes controlling the chemical composition of water into four types: seawater, evaporative crystallization, rock weathering (i.e., water–rock interaction), and atmospheric precipitation based on the relationship diagram between TDS and (Na+ + Ca2+) and Cl−/(Cl− + HCO3−) [40].
As shown in Figure 4, the Na+/(Na+ + Ca2+) values of all water samples are below 0.4 and the Cl−/(Cl− + HCO3−) values are below 0.1, except for ZHS. The hydrochemical composition may be controlled by evaporative crystallization because of the large influence of geothermal activity on MLS, YHS, and ZHS beyond the dashed line. All other ratios fall within the control range of rock weathering, indicating that the hydrochemical composition of the study area is mainly controlled by rock weathering (groundwater–rock interaction).
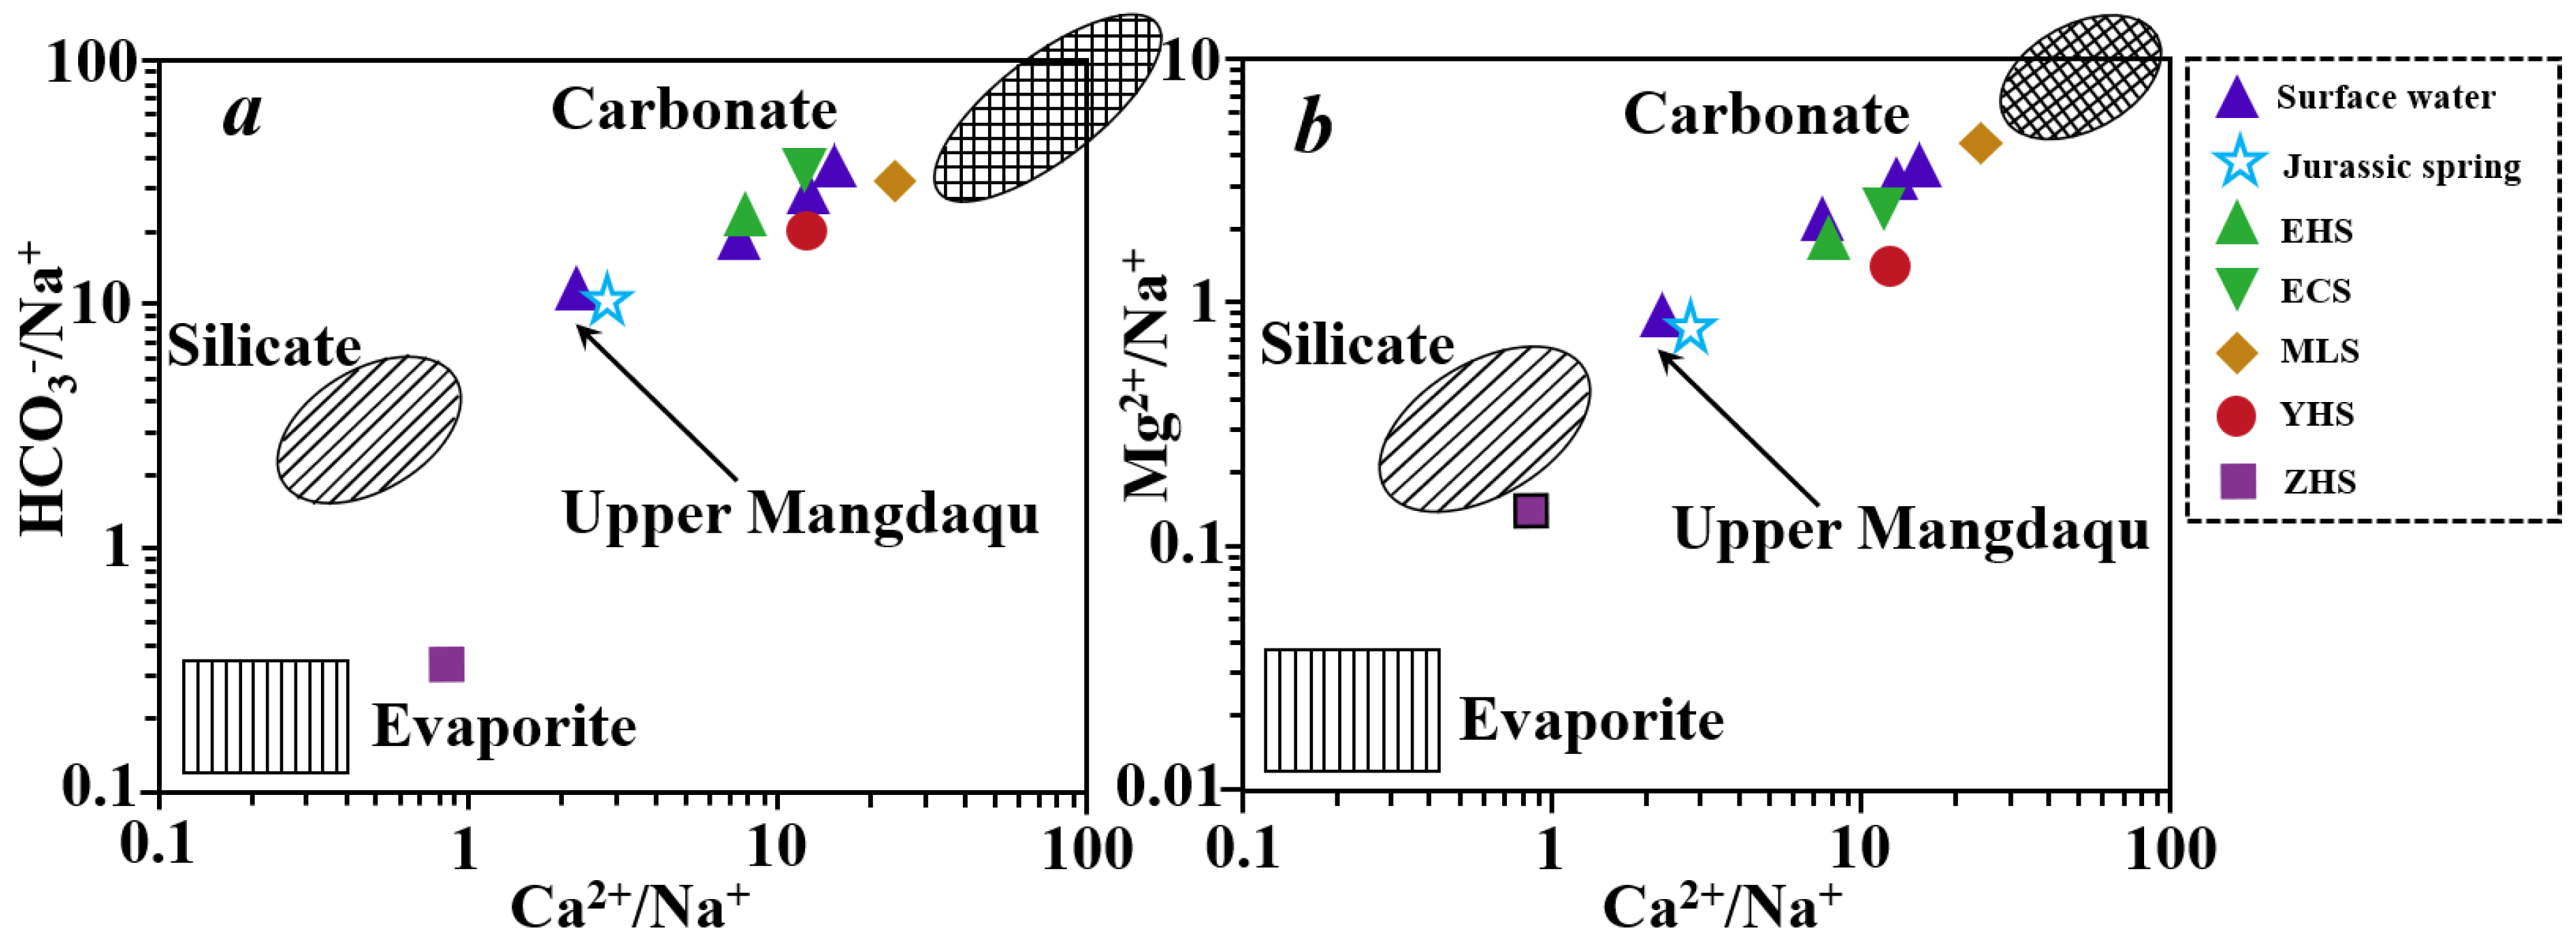
The location of the ratios of HCO3−/Na+ and Mg2+/Na+ to Ca2+/Na+ in the lithologic elemental map can further determine the different rock weathering types in the watershed. Almost all water samples in the study area fall between carbonate and silicate rocks (Figure 5), indicating that they are mainly controlled by the weathering of carbonate and silicate rocks. The upper Mangdaqu River water and Jurassic springs are closer to the silicate element, suggesting that silicates are the main controlling factors for rock weathering, followed by the carbonate element, which is related to the occurrence of Jurassic springs in sandstone strata. Other samples are closer to the carbonate rocks, suggesting that they are mainly controlled by carbonate weathering. The ZHS again shows the divergence to be on the other side of the silicate and evaporite element, suggesting that it is controlled by silicate and more or less evaporite, consistent with the above conclusions from the Piper three-line diagram [41].
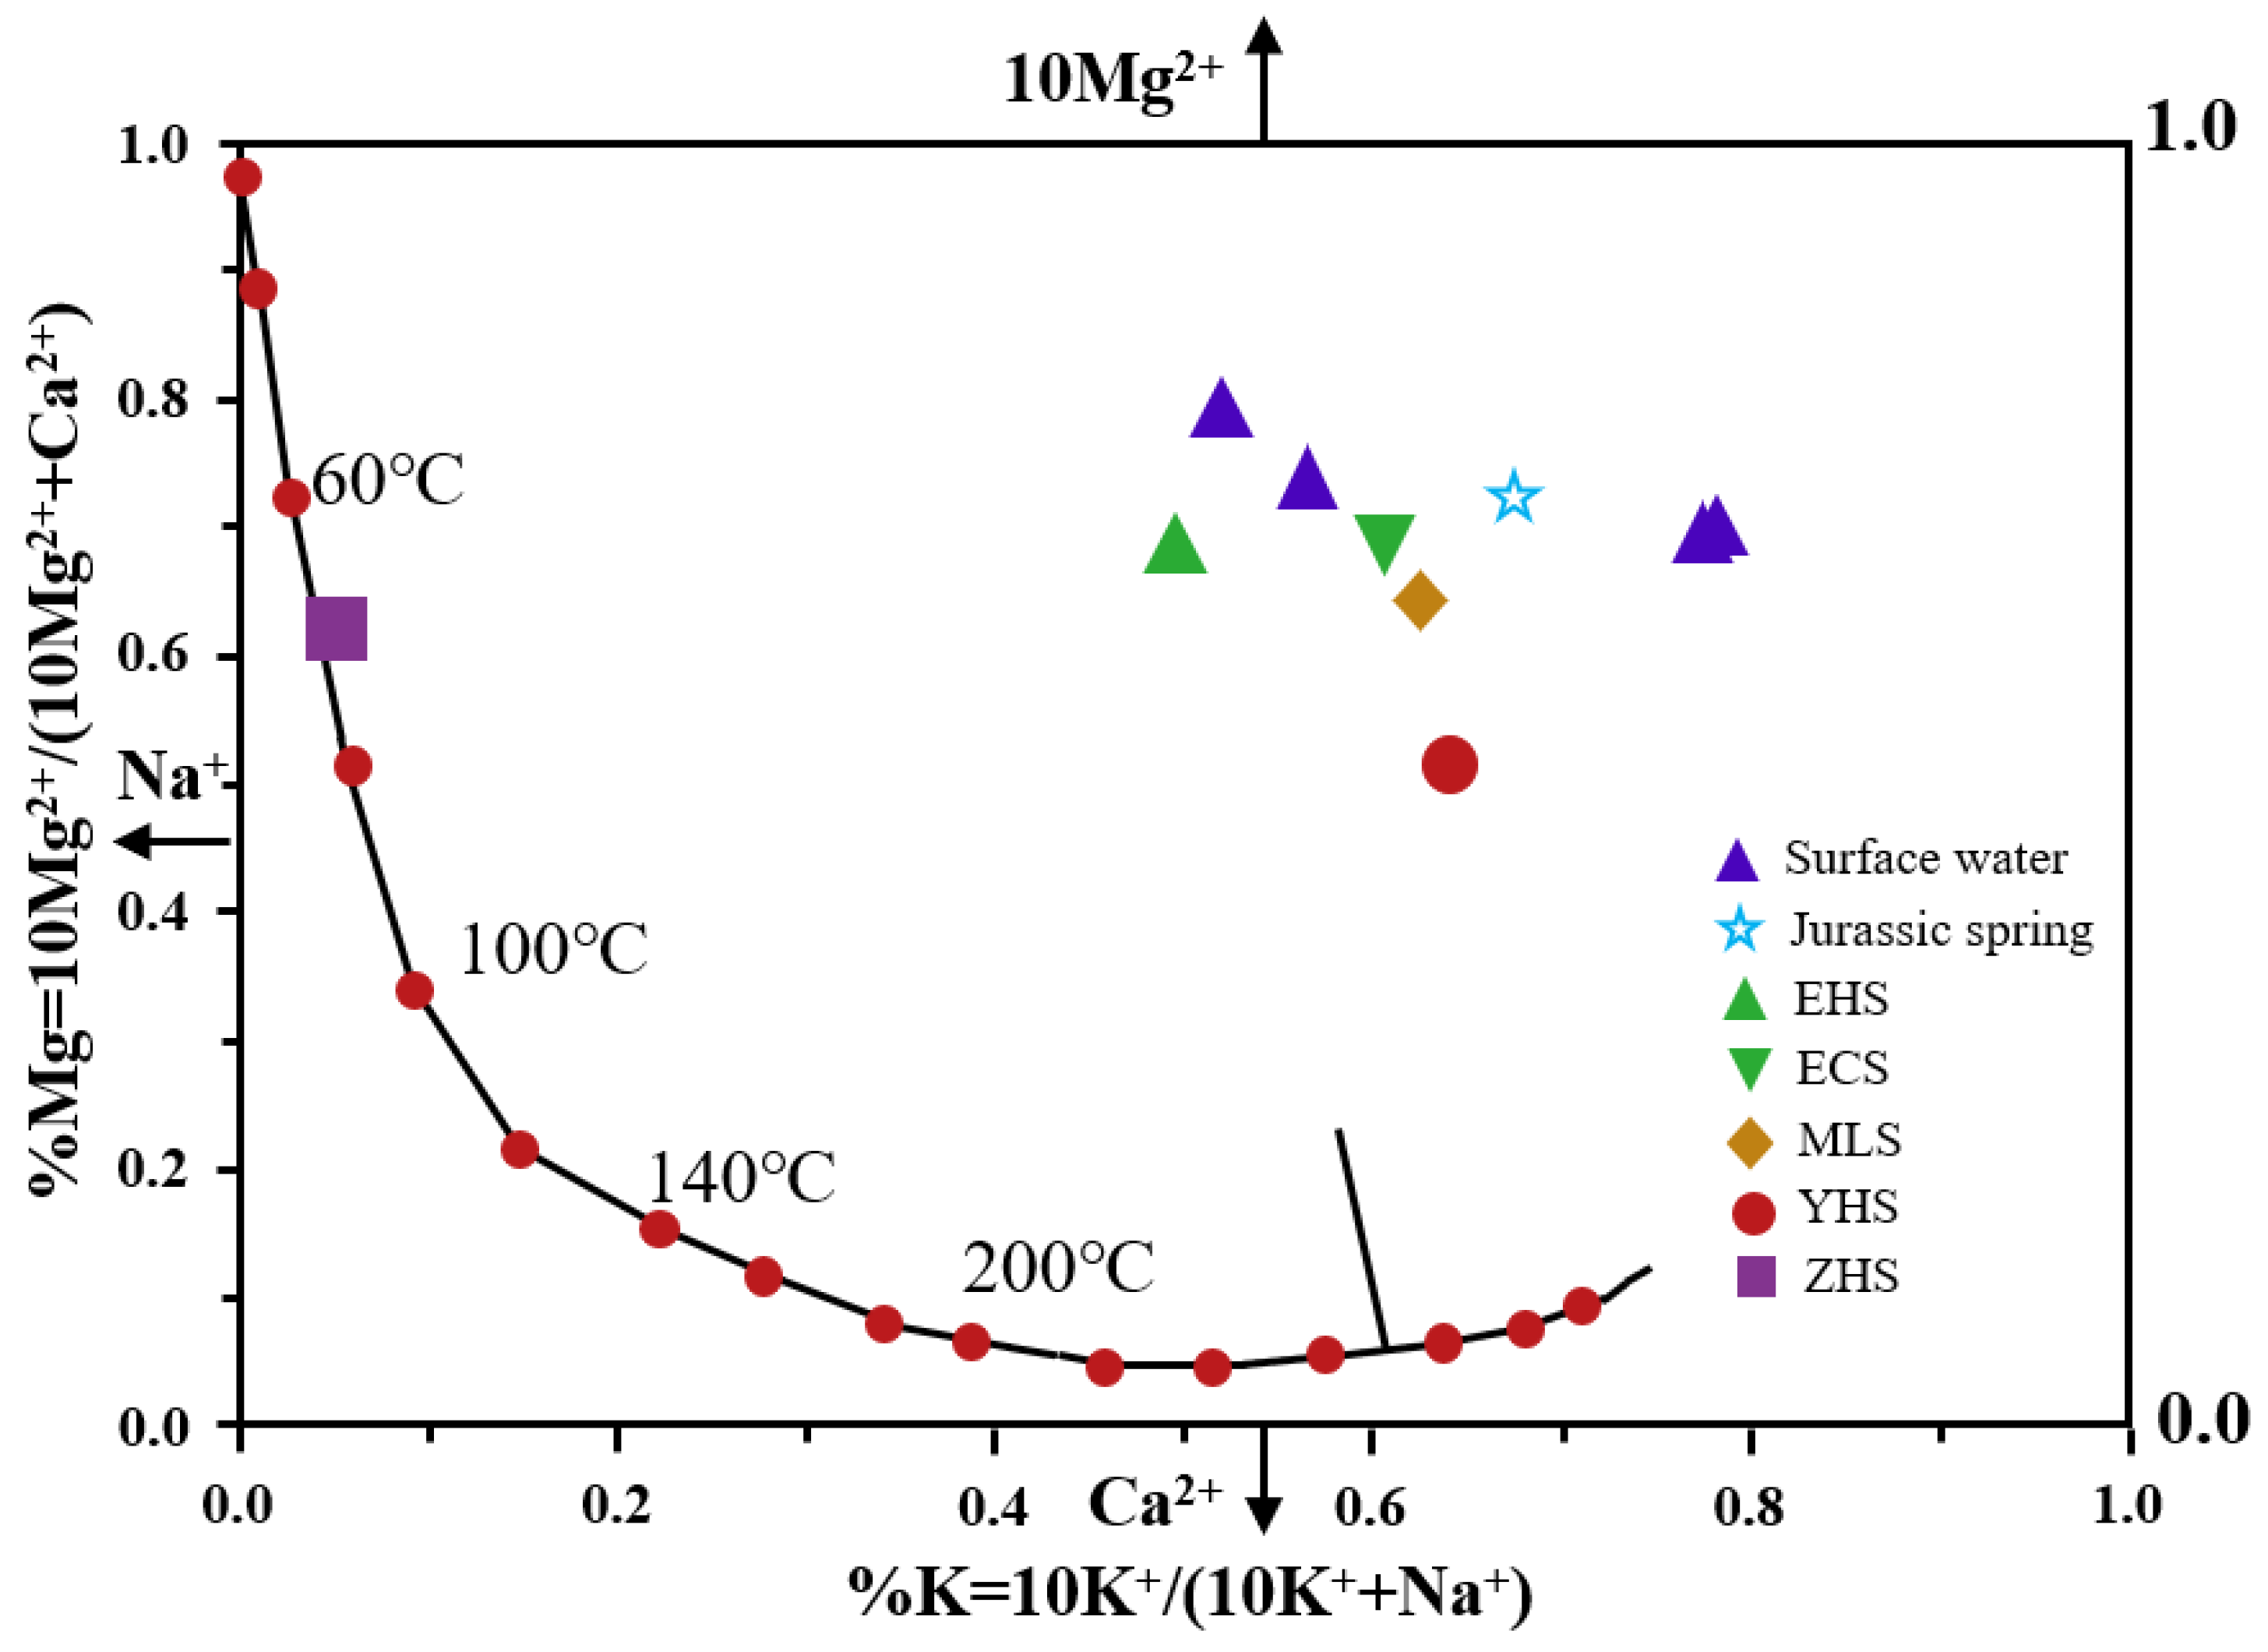
The graphical model based on the cation ratio used to reflect the equilibrium of water–rock interaction is the Na-K-Mg-Ca diagram proposed by Giggenbach. Figure 6 shows the Na-K-Mg-Ca diagram calculated by the water–rock interaction equilibrium model based on the hydrochemical data of the water samples in the area. It shows the relationship between 10 Mg2+/(10 Mg2+ + Ca2+) and 10 K+/(l0 K+ + Na+) in all samples. It can be seen that the water samples, except ZHS, are far from the complete equilibrium line of water–rock interaction, indicating a non-equilibrium state. ZHS shows a complete equilibrium state of water–rock interaction and is far from the other water samples, indicating a different process or mechanism.
4.2.3. Relationship between Components and Arsenic
If the arsenic content in the water environment has a good correlation with other hydrochemical parameters, this indicates that the arsenic may have the same source or undergo the same migration and transformation process as this indicator. The correlation between water chemistry parameters in the study area is shown in Table 3.
Arsenic in water is significantly positively correlated with temperature, conductivity, and Ca2+, Mg2+, K+, F−, and Cl− at the 0.01 level (both sides), indicating that arsenic has a similar release mechanism to K+, Ca2+, Mg2+, F−, and Cl−. The significant negative correlation with ORP at the 0.01 level (both sides) indicates that deep hot water in the reduction environment has a high arsenic content and arsenic in groundwater is diluted by shallow cold water in the oxidation environment [42].
4.3. Genesis of the Hot Spring and Recharge–Discharge Mode
4.3.1. Recharge Elevation
The four springs in the Endaqu and Mangdaqu watersheds are the concentrated discharge points of arsenic in the groundwater. Based on the monitoring data, we can understand spring genesis and the characteristics of the recharge, discharge and discharge of the groundwater system [40]. Also, the relationship between the groundwater and surface can be studied.
To determine the possible recharge range of the springs, the isotopes of D and 18O were detected in the four hot springs in the study area and in five fractured Jurassic springs, river water, and snow water. The statistical data of Lhasa station (3649 m above sea level) from 1986 to 1992 in the GNIP database of the International Atomic Energy Commission (IAEA) are used in this analysis to determine the precipitation line in the study area (Figure 7).
The D-18O isotopes of groundwater, river water, and snow water in the study area are distributed near the atmospheric precipitation line of Lhasa, indicating that their recharge is directly or indirectly due to the infiltration of local atmospheric precipitation.
The elevation effect of 18O can be used to calculate the area of groundwater recharge that is replenished by atmospheric precipitation. According to the results of Yang Xiaoxin et al. in the adjacent areas, the elevation effect of precipitation calculated in the pre-monsoon, monsoon, post-monsoon and western periods in this area is about −0.14~−0.21‰/100 m. Taking −0.15‰/100 m for the monsoon and westerly periods (corresponding to the time of sampling in this study), the average accumulation heights of EHS, ECS and MLS are 4913.3 m, 4175.7 m and 4973.1 m, respectively. At the same time, according to the regression calculation of Q1–Q14 (local precipitation-rich fission sources), the formula for the height effect is y = −545.79x − 4683.8, and the average recharge elevations of EHS, ECS and MLS are 4874.1 m, 4058.1 m and 4745.0 m, respectively. Assuming that the hot springs water is fed mainly by atmospheric precipitation, the latter may be more reasonable given the actual terrain data around the springs and the range of relative elevations.
The exposed elevations of the EHS, ECS, and MLS are 3668 m, 3670 m, and 4034 m, respectively. The relative elevations between the recharge area and the source are 1206.1 m, 388.1 m, and 711.0 m, respectively. This circulation path is also confirmed by the circulation depths of the hot and cold springs, which were determined using the hydrochemical indicators mentioned above.
4.3.2. Thermal Storage Temperature and Depth
The geothermal temperature scale is often used to calculate thermal storage temperature. There are two main types of geothermal temperature scales: the SiO2 scale and the cation scale. The conditions of the thermal system must be analyzed carefully to choose the appropriate scale for estimating the thermal storage temperature [43].
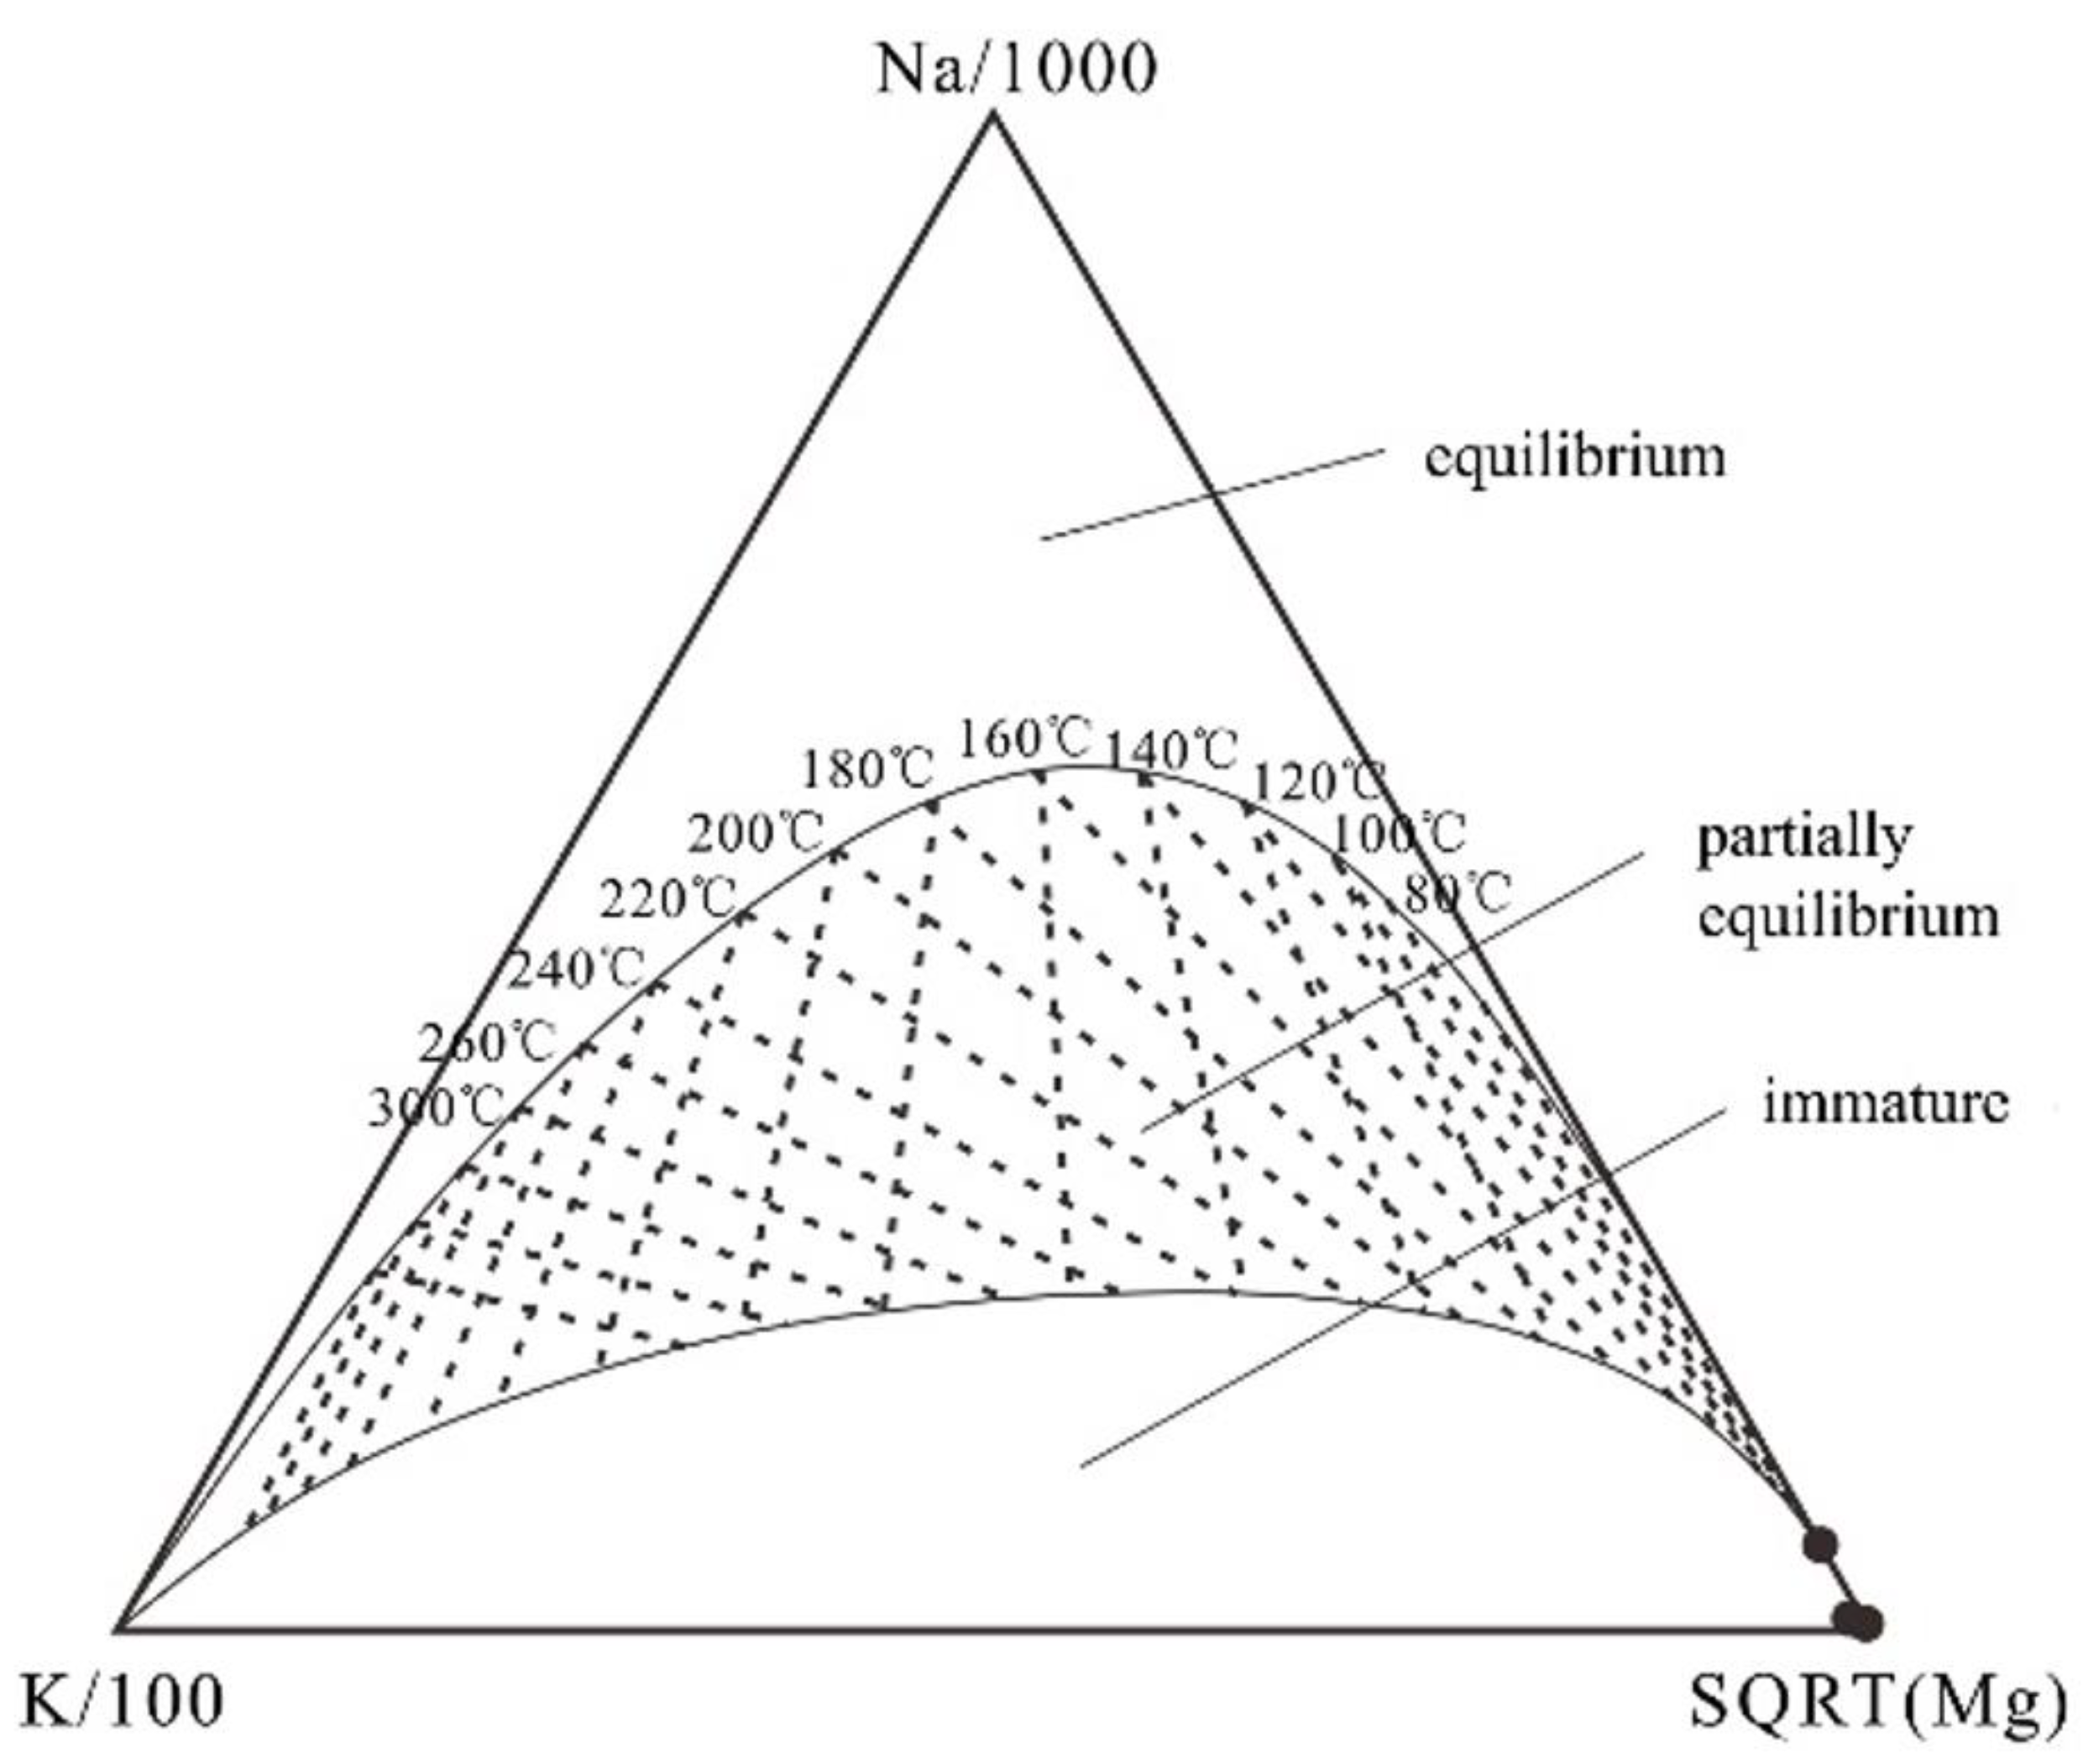
The cation scale can only be used in a thermal equilibrium system. The Na-K-Mg three-line diagram was proposed by Giggenbach in 1988 and is widely used to evaluate the water–rock equilibrium state and distinguish different types of water samples [9]. It is divided into three sections: equilibrium, partial equilibrium and immature water. Obviously, not all hot springs, including YHS and ZHS, are in full equilibrium, so the deep thermal storage temperature cannot be calculated using the cation temperature scale (Figure 8).
The SiO2 temperature scale includes mainly quartz and chalcedony temperature scales. Since most hot springs in the study area are low-temperature sources that do not exceed the local boiling point (93 °C), the formula without vapor loss can be selected for the calculation of thermal storage temperature using the quartz and chalcedony temperature scales. The calculation results are shown in Table 4.
Quartz temperature scale:
Chalcedony temperature scale:
The thermal storage temperature calculated with the chalcedony temperature scale is lower than the measured temperature, so the chalcedony scale is not appropriate for this area. The thermal storage temperature calculated with the quartz temperature scale in the study area is 39.93–82.60 °C. Since the method of the quartz temperature scale belongs to the SiO2 scale, the calculated temperature is the lower limit of the storage temperature.
The circulation depth of groundwater is calculated based on the calculated storage temperature. The formula is as follows:
where T is the thermal storage temperature (°C); Δh is the thermal reservoir depth (m); ΔT is the soil temperature gradient (°C/m), for which 4 °C/100 m is chosen; Tα is the local annual average or constant zone temperature (°C), 7.8 °C; and t = 0.5 °C (temperature loss per 100 m rise in thermal fluid).
The thermal storage temperature calculated with the quartz temperature scale is 39.93–82.60 °C, and the corresponding thermal storage depth is 918–2137 m.
4.3.3. Mixing Ratio of Hot and Cold Water
The water samples in the study area are in a non-equilibrium state in the Na-K-Mg three-line diagram. It is believed that the geothermal water mixes with some cold water as it rises to the surface.
The mixing of hot and cold water causes the initial enthalpy and SiO2 content of the deep hot water to drop to the final enthalpy and SiO2 content in the spring. When the dissolved SiO2 in deep hot water is in a saturated state, the spring temperature and SiO2 content are two different functions of the initial energy of the deep hot water. When the proportion of the mixed cold water to the spring water is X, the relationship between the initial energy and SiO2 content in the deep hot water and the final enthalpy and SiO2 content of the spring water can be written into an equation according to the conservation of mass:
where Sc is the enthalpy of cold water (J/g); Ss is the final enthalpy of spring water (J/g); Sh is the initial enthalpy of deep hot water (J/g); SiO2c is the SiO2 content (mg/L) of cold water. SiO2s is the content in the source water (mg/L); and SiO2h is the initial SiO2 content (mg/L) of deep hot water. X is the mixing ratio of the cold water.
By solving Equation (4), we obtain:
The upstream surface water of the MLS with a water temperature of 4 °C and SiO2 content of 7.65 mg/L was used as cold water. The enthalpy of saturated water below 100 °C is equal to the temperature in degrees Celsius of the water, and the relationship between temperature and enthalpy of saturated water above 100 °C can be obtained from Table 5.
A series of X1 and X2 is calculated, and two curves can be drawn for the mixing ratio X of the cold water and the temperature of the hot water at a lower depth (Figure 9). The temperature value at the intersection of the two curves is the more accurate value.
The mixing ratio of the cold water for each hot spring is shown in Figure 9. The proportion of EHS mixed into the cold water is 89%, the temperature of the hot water before mixing is 100 °C, and the proportion and temperature are 68% and 58 °C, respectively, for ECS, but 62% and 92 °C, respectively, for MLS.
Comparing the storage temperature calculated with the SiO2 scale, we find that the temperature of hot water before mixing calculated with silicon enthalpy is higher than that calculated with the SiO2 scale [44]. This is because the mixing effect of cold water is not considered in the temperature scale method, and the mixing of cold water dilutes the SiO2 concentration of the deep hot water, so the calculated heat storage temperature is low, while the silicon enthalpy diagram method eliminates the influence of the mixing of cold water and reflects the maximum temperature of the deep thermal storage.
From the above results, the arsenic sources in the well mainly include deep groundwater (hot water) and shallow groundwater (cold water). According to the arsenic mass conservation before and after mixing hot and cold water:
where Y1 is the mixing ratio of cold water (%); Y2 is the ratio of hot water (%); Cc is the arsenic concentration in cold water (μg/L); Ch is the arsenic concentration in hot water (μg/L); and C is the actual arsenic concentration of the source water (μg/L).
The average arsenic concentration in cold water was 10.92 μg/L in five Jurassic springs (Q1, Q3, Q4−1, Q6, and Q14) in the study area in January 2019. The arsenic concentration of the spring was measured in November 2019. The arsenic concentration of the deep geothermal water is calculated and presented in Table 6.
The calculated arsenic concentration of the deep geothermal water is 785.9~5602.6 μg/L, the proportion of the arsenic flux of the shallow cold water to the arsenic flux of the source is 0.23~1.56%, and the proportion of the flux of the deep geothermal water is 98.44~99.77%. It can be seen that the main source of arsenic in the source water is the thermal reservoir or deep hydrothermal spring, which is in equilibrium with the surrounding rock.
4.3.4. Origin of Geothermal Water
The hot springs in the study area all occur in Triassic strata with large discharge, which are located near regional faults. EHS, ECS, and YHS are located near the F25 fault of the Huoyexiong fault zone. The fault runs in a northwesterly direction and dips to the west with a dip angle of 50°~60°. There are a large number of springs along the fault. The MLS is located near the F39 fault of the Xiangda fault zone. The fault is relatively steep, with a dip angle of 55°~70°. There are mineralizations of limonite, realgar and orpiment in the fault zone [45]. It is believed that the groundwater is recharged by the infiltration of atmospheric precipitation, and then some of the groundwater enters deep circulation. After being heated at depth or mixed with hydrothermal fluid with high arsenic content, the water rises through the fault or other conductive channels and emerges in the form of low-temperature hot springs after being mixed with shallow cold water.
5. Conclusions
The characteristics of groundwater and the source and formation of arsenic in a typical watershed in Tibet (Mangdaqu and Endaqu area) were investigated using systematic surveys, ionic ratios, Gibbs diagrams, and other water chemistry analysis methods in combination with isotope and heat storage calculation methods. The groundwater hydrochemical type in the study area is mainly HCO3·SO4-Ca·Mg, and the hydrochemical composition is mainly controlled by rock weathering. For the Jurassic spring, the silicate element is the main controlling factor for rock weathering, followed by the carbonate element. The ZHS is controlled by the silicate end element, while others are mainly controlled by the carbonate element.
The results of deuterium–oxygen isotope analysis of hot spring water indicate that the source of enrichment is infiltration of atmospheric precipitation heated by subsurface circulation through deep thermal storage and then rising to the surface through faults to form hot springs. The average recharge elevation levels of hot spring water are 4874.1 m, 4058.1 m, and 4745.0 m, respectively, which are 1206.1 m, 388.1 m, and 711.0 m, respectively, above the discharge elevation. Deep hot water is the main source of arsenic in the spring water, and its arsenic flux accounts for 98.44–99.77% of the measured flux in the spring water.
Arsenic in water is significantly positively correlated with temperature, conductivity, and K+, Ca2+, Mg2+, F−, and Cl−, suggesting that arsenic has a release mechanism similar to these. The significant negative correlation with redox potential indicates that deep hot water in a reducing environment has a high arsenic content. The method used in this work can be applied to similar investigations and research in Tibet, and the conclusions reached provide technical support for the removal of arsenic in high-arsenic groundwater in this area.
Author Contributions
Conceptualization, Z.Z. and L.Z; methodology, Y.H. and Z.L; software, L.Z. and S.C.; validation, Z.Z. and Z.L.; formal analysis, Y.H.; investigation, Z.L. and S.C.; resources, Z.Z.; data curation, Z.Z.; writing—original draft preparation, Z.Z., Z.L. and S.C.; writing—review and editing, Z.Z., Z.L. and S.C.; visualization, L.Z.; project administration, Z.Z.; funding acquisition, Z.Z. and Z.L. All authors have read and agreed to the published version of the manuscript.
Funding
This work was supported by the National Key Research and Development Program of China [Grant number. 2019YFC1804302]; the National Natural Science Foundation of China [Grant number. 41877171].
Data Availability Statement
Please contact Author if one need detailed data information.
Conflicts of Interest
The authors declare that they have no known competing financial interests or personal relationships that could have appeared to influence the work reported in this paper.
References
- Julia, L.B.; Pamela, A.R. Chapter 4: Arsenic in Groundwater: A Summary of Sources and the Biogeochemical and Hydrogeologic Factors Affecting Arsenic Occurrence and Mobility. In Current Perspectives in Contaminant Hydrology and Water Resources Sustainability; Paul, M.B., Ed.; IntechOpen: Rijeka, Croatia, 2013; pp. 83–116. [Google Scholar]
- Winkel, L.H.E.; Trang, P.T.K.; Lan, V.M.; Stengela, C.; Aminia, M.; Hac, N.T.; Vietb, P.H.; Berg, M. Arsenic pollution of groundwater in Vietnam exacerbated by deep aquifer exploitation for more than a century. Proc. Natl. Acad. Sci. USA 2011, 108, 1246–1251. [Google Scholar] [CrossRef] [Green Version]
- Chakraborti, D.; Singh, S.K.; Rahman, M.M.; Dutta, R.N.; Mukherjee, S.C.; Pati, S.; Kar, P.B. Groundwater Arsenic Contamination in the Ganga River Basin: A Future Health Danger. Int. J. Environ. Res. Public Health 2018, 15, 180. [Google Scholar] [CrossRef] [Green Version]
- Kumar, S.; Pati, J. Assessment of groundwater arsenic contamination using machine learning in Varanasi, Uttar Pradesh, India. J. Water Health 2022, 20, 829–848. [Google Scholar] [CrossRef]
- Thakur, J.K.; Thakur, R.K.; Ramanathan, A.; Kumar, M.; Singh, S.K. Arsenic Contamination of Groundwater in Nepal—An Overview. Water 2011, 3, 1–20. [Google Scholar] [CrossRef]
- Michael, H.A.; Voss, C.I. Evaluation of the sustainability of deep groundwater as an arsenic-safe resource in the Bengal Basin. Proc. Natl. Acad. Sci. USA 2008, 105, 8531–8536. [Google Scholar] [CrossRef] [Green Version]
- Bhattacharyya, R.; Chatterjee, D.; Nath, B.; Jana, J.; Jacks, G.; Vahter, M. High arsenic groundwater: Mobilization, metabolism and mitigation–an overview in the Bengal Delta Plain. Mol. Cell. Biochem. 2003, 253, 347–355. [Google Scholar] [CrossRef]
- Rodríguez-Lado, L.; Sun, G.; Berg, M.; Zhang, Q.; Xue, H.; Zheng, Q.; Johnson, C.A. Groundwater arsenic contamination throughout China. Science 2013, 341, 866–868. [Google Scholar] [CrossRef]
- Wang, Z.; Guo, H.; Xiu, W.; Wang, J.; Shen, M. High arsenic groundwater in the Guide basin, northwestern China: Distribution and genesis mechanisms. Sci. Total Environ. 2018, 640, 194–206. [Google Scholar] [CrossRef] [PubMed]
- Li, L.; Wang, Y.; Gu, H.; Lu, L.; Li, L.; Pang, J.; Chen, F. The Genesis Mechanism and Health Risk Assessment of High Boron Water in The Zhaxikang Geothermal Area, South Tibet. Water 2022, 14, 3243. [Google Scholar] [CrossRef]
- Smedley, P.L.; Kinniburgh, D.G. A review of the source, behaviour and distribution of arsenic in natural waters. Appl. Geochem. 2002, 17, 517–568. [Google Scholar] [CrossRef]
- Shankar, S.; Shanker, U. Arsenic contamination of groundwater: A review of sources, prevalence, health risks, and strategies for mitigation. Sci. World J. 2014, 2014, 304524. [Google Scholar] [CrossRef] [PubMed]
- Litter, M.I.; Ingallinella, A.M.; Olmos, V.; Savio, M.; Difeo, G.; Botto, L.; Ahmad, A. Arsenic in Argentina: Occurrence, human health, legislation and determination. Sci. Total Environ. 2019, 676, 756–766. [Google Scholar] [CrossRef]
- Wei, M.; Wu, J.; Li, W.; Zhang, Q.; Su, F.; Wang, Y. Groundwater Geochemistry and its Impacts on Groundwater Arsenic Enrichment, Variation, and Health Risks in Yongning County, Yinchuan Plain of Northwest China. Expo Health 2022, 14, 219–238. [Google Scholar] [CrossRef]
- Mukherjee, A.; Bhattacharya, P.; Shi, F.; Fryar, A.E.; Mukherjee, A.B.; Xie, Z.M.; Bundschuh, J. Chemical evolution in the high arsenic groundwater of the Huhhot basin (Inner Mongolia, PR China) and its difference from the western Bengal basin (India). Appl. Geochem. 2009, 24, 1835–1851. [Google Scholar] [CrossRef]
- Podgorski, J.; Berg, M. Global threat of arsenic in groundwater. Science 2020, 368, 845–850. [Google Scholar] [CrossRef]
- Guo, H.; Wen, D.; Liu, Z.; Jia, Y.; Guo, Q. A review of high arsenic groundwater in Mainland and Taiwan, China: Distribution, characteristics and geochemical processes. Appl. Geochem. 2014, 41, 196–217. [Google Scholar] [CrossRef]
- Fan, H.; Su, C.; Wang, Y.; Yao, J.; Zhao, K.; Wang, Y.; Wang, G. Sedimentary arsenite-oxidizing and arsenate-reducing bacteria associated with high arsenic groundwater from Shanyin, Northwestern China. J. Appl. Microbiol. 2008, 105, 529–539. [Google Scholar] [CrossRef] [PubMed]
- Deng, Y.; Wang, Y.; Ma, T. Isotope and minor element geochemistry of high arsenic groundwater from Hangjinhouqi, the Hetao Plain, Inner Mongolia. Appl. Geochem. 2009, 24, 587–599. [Google Scholar] [CrossRef]
- Guo, H.; Liu, C.; Lu, H.; Wanty, R.B.; Wang, J.; Zhou, Y. Pathways of coupled arsenic and iron cycling in high arsenic groundwater of the Hetao basin, Inner Mongolia, China: An iron isotope approach. Geochim. Cosmochim. Acta 2013, 112, 130–145. [Google Scholar] [CrossRef]
- He, X.; Li, P.; Ji, Y.; Wang, Y.; Su, Z.; Elumalai, V. Groundwater arsenic and fluoride and associated arsenicosis and fluorosis in China: Occurrence, distribution and management. Expo. Health 2020, 12, 355–368. [Google Scholar] [CrossRef]
- Qiao, W.; Guo, H.; He, C.; Shi, Q.; Zhao, B. Unraveling roles of dissolved organic matter in high arsenic groundwater based on molecular and optical signatures. J. Hazard. Mater. 2021, 406, 124702. [Google Scholar] [CrossRef]
- He, X.; Li, P.; Wu, J.; Wei, M.; Ren, X.; Wang, D. Poor groundwater quality and high potential health risks in the Datong Basin, northern China: Research from published data. Environ. Geochem. Health 2021, 43, 791–812. [Google Scholar] [CrossRef]
- Smith, R.; Knight, R.; Fendorf, S. Over pumping leads to California groundwater arsenic threat. Nat. Commun. 2018, 9, 2089. [Google Scholar] [CrossRef] [Green Version]
- Fang, Y.; Qian, B.; Yang, Y.; Song, Y.; Yang, Z.; Li, H. Purification of high-arsenic groundwater by magnetic bimetallic MOFs coupled with PMS: Balance of catalysis and adsorption and promotion mechanism of PMS. Chem. Eng. J. 2022, 432, 134417. [Google Scholar] [CrossRef]
- Cao, W.; Gao, Z.; Guo, H.; Pan, D.; Qiao, W.; Wang, S.; Li, Z. Increases in groundwater arsenic concentrations and risk under decadal groundwater withdrawal in the lower reaches of the Yellow River basin, Henan Province, China. Environ. Pollut. 2022, 296, 118741. [Google Scholar] [CrossRef] [PubMed]
- Singh, P.; Pal, P.; Mondal, P.; Saravanan, G.; Nagababu, P.; Majumdar, S.; Bhowmick, S. Kinetics and mechanism of arsenic removal using sulfide-modified nanoscale zerovalent iron. Chem. Eng. J. 2021, 412, 128667. [Google Scholar] [CrossRef]
- Luo, Y.; Xiao, Y.; Hao, Q.; Zhang, Y.; Zhao, Z.; Wang, S.; Dong, G. Groundwater geochemical signatures and implication for sustainable development in a typical endorheic watershed on Tibetan plateau. Environ. Sci. Pollut. Res. 2021, 28, 48312–48329. [Google Scholar] [CrossRef]
- Zeng, D.; Chen, G.; Zhou, P.; Xu, H.; Qiong, A.; Duo, B.; Lu, X.; Wang, Z.; Han, Z. Factors influencing groundwater contamination near municipal solid waste landfill sites in the Qinghai-Tibetan plateau. Ecotoxicol. Environ. Saf. 2021, 211, 111913. [Google Scholar] [CrossRef]
- Zhang, J.W.; Yan, Y.N.; Zhao, Z.Q.; Li, X.D.; Guo, J.Y.; Ding, H.; Cui, L.F.; Meng, J.L.; Liu, C.Q. Spatial and seasonal variations of dissolved arsenic in the Yarlung Tsangpo River, southern Tibetan Plateau. Sci. Total Environ. 2021, 760, 143416. [Google Scholar] [CrossRef] [PubMed]
- Zhou, L.; Xu, Z.; Zhou, J.; Fan, P. Natural arsenic source, migration, and flux in a catchment on the Southern Tibetan Plateau. Sci. Total Environ. 2022, 838, 155898. [Google Scholar] [CrossRef]
- Yu, C.; Hua, K.; Huang, C.S.; Jin, H.; Sun, Y.; Yu, Z. Spatiotemporal characteristics of arsenic and lead with seasonal freeze-thaw cycles in the source area of the Yellow River Tibet Plateau, China. J. Hydrol. Reg. Stud. 2022, 44, 101210. [Google Scholar] [CrossRef]
- Yu, C.; Sun, Y.; Zhong, X.; Yu, Z.; Li, X.; Yi, P.; Jin, H.; Luo, D. Arsenic in permafrost-affected rivers and lakes of Tibetan Plateau, China. Environ. Pollut. Bioavailab. 2019, 31, 226–232. [Google Scholar] [CrossRef]
- Zhao, Z.; Li, S.; Xue, L.; Liao, J.; Zhao, J.; Wu, M.; Wang, M.; Sun, J.; Zheng, Y.; Yang, Q. Effects of dam construction on arsenic mobility and transport in two large rivers in Tibet, China. Sci. Total Environ. 2020, 741, 140406. [Google Scholar] [CrossRef] [PubMed]
- Li, S.; Wang, M.; Yang, Q.; Wang, H.; Zhu, J.; Zheng, B.; Zheng, Y. Enrichment of arsenic in surface water, stream sediments and soils in Tibet. J. Geochem. Explor. 2013, 135, 104–116. [Google Scholar] [CrossRef] [PubMed] [Green Version]
- Li, C.; Kang, S.; Chen, P.; Zhang, Q.; Mi, J.; Gao, S.; Sillanpää, M. Geothermal spring causes arsenic contamination in river waters of the southern Tibetan Plateau, China. Environ. Earth Sci. 2014, 71, 4143–4148. [Google Scholar] [CrossRef]
- Mukherjee, A.; Verma, S.; Gupta, S.; Henke, K.R.; Bhattacharya, P. Influence of tectonics, sedimentation and aqueous flow cycles on the origin of global groundwater arsenic: Paradigms from three continents. J. Hydrol. 2014, 518, 284–299. [Google Scholar] [CrossRef]
- He, S.; Li, P. A MATLAB based graphical user interface (GUI) for quickly producing widely used hydrogeochemical diagrams. Geochemistry 2020, 80, 125550. [Google Scholar] [CrossRef]
- Ren, X.; Li, P.; He, X.; Su, F.; Elumalai, V. Hydrogeochemical Processes Affecting Groundwater Chemistry in the Central Part of the Guanzhong Basin, China. Arch. Environ. Contam. Toxicol. 2021, 80, 74–91. [Google Scholar] [CrossRef]
- Duan, R.; Li, P.Y.; Wang, L.; He, X.; Zhang, L. Hydrochemical characteristics, hydrochemical processes and recharge sources of the geothermal systems in Lanzhou City, northwestern China. Urban Clim. 2022, 43, 101152. [Google Scholar] [CrossRef]
- Verma, S.; Mukherjee, A.; Mahanta, C.; Choudhury, R.; Badoni, R.P.; Joshi, G. Arsenic fate in the Brahmaputra river basin aquifers: Controls of geogenic processes, provenance and water-rock interactions. Appl. Geochem. 2019, 107, 171–186. [Google Scholar] [CrossRef]
- Price, R.E.; Pichler, T. Abundance and mineralogical association of arsenic in the Suwannee Limestone (Florida): Implications for arsenic release during water–rock interaction. Chem. Geol. 2006, 228, 44–56. [Google Scholar] [CrossRef]
- Bonte, M.; van Breukelen, B.M.; Stuyfzand, P.J. Temperature-induced impacts on groundwater quality and arsenic mobility in anoxic aquifer sediments used for both drinking water and shallow geothermal energy production. Water Res. 2013, 47, 5088–5100. [Google Scholar] [CrossRef]
- Possemiers, M.; Huysmans, M.; Batelaan, O. Influence of Aquifer Thermal Energy Storage on groundwater quality: A review illustrated by seven case studies from Belgium. J. Hydrol. Reg. Stud. 2014, 2, 20–34. [Google Scholar] [CrossRef]
- Goodsell, T.H.; Carling, G.T.; Aanderud, Z.T.; Nelson, S.T.; Fernandez, D.P.; Tingey, D.G. Thermal groundwater contributions of arsenic and other trace elements to the middle Provo River, Utah, USA. Environ. Earth Sci. 2017, 76, 268. [Google Scholar] [CrossRef]
Figure 1.
Hydrogeological map of study area.

Figure 2.
Distribution of samples in Endaqu tributary (left) Mangdaqu tributary (right).

Figure 3.
Piper three-line diagram of water samples in the study area.

Figure 4.
Gibbs diagram of anion (a) and cation (b) of water samples.

Figure 5.
Relationships of (a) HCO3−/Na+ and Ca2+/Na+; (b) Mg2+/Na+ and Ca2+/Na+.

Figure 6.
Na-K-Mg-Ca groundwater–rock balance diagram.

Figure 7.
Relationship between D-18O of water samples in the study area.

Figure 8.
Na-K-Mg three-line diagram of hot spring water chemistry in the study area.

Figure 9.
Scale diagram of the temperature of the hot deep water of the individual hot springs—mixed with cold water.
Figure 9.
Scale diagram of the temperature of the hot deep water of the individual hot springs—mixed with cold water.


Table 1.
List of isotopic sampling points.
| Exposed Stratum | Flow (L/s) | Elevation (m) | Coordinate (°) | ||
|---|---|---|---|---|---|
| Latitude | Longitude | ||||
| Q1 | J3x | 0.1 | 3421.0 | 31.39404732 | 96.87404919 |
| Q3 | J3x | 0.2 | 3683.4 | 31.52550351 | 96.78638578 |
| Q4 | J3x | 0.4 | 3641.8 | 31.39326667 | 96.85236389 |
| Q6 | J3x | 0.3 | 3554.8 | 31.49029722 | 96.80910278 |
| Q14 | J3x | 0.5 | 4073.6 | 31.22312778 | 96.93929444 |
| EHS | T3b | 50.0 | 3668.0 | 31.45893541 | 96.73557212 |
| ECS | T3b | 180.0 | 3670.0 | 31.46821501 | 96.73596142 |
| MLS | T3b | 10.0 | 4034.0 | 31.50596799 | 96.95658855 |
| Angqu river (Mangda Bridge) | / | / | 3465.0 | 31.51475212 | 96.80958127 |
| Snow water | / | / | 4034.0 | 31.22569246 | 96.94655959 |
Note: EHS: Endaqu Hot Spring; ECS: Endaqu Cool Spring; MLS: Mangdaqu Left Spring.
Table 2.
Monitoring results of springs in the study area.
| Statistical Data | Measured Discharge (m3/s) | Temperature (°C) | pH | Conductivity (μs/cm) | Arsenic Concentration (μg/L) | |
|---|---|---|---|---|---|---|
| EHS (n = 11) | Range | 0.039~0.06 | 18.9~30.4 | 7.32~8.05 | 425~533 | 344.6~642.1 |
| ± SD | 0.050 ± 0.0072 | 23.56 ± 3.87 | 7.56 ± 0.26 | 470 ± 35 | 483.0 ± 88.3 | |
| ECS (n = 11) | Range | 0.109~0.28 | 10.8~15 | 7.36~8.45 | 248~540 | 104.5~271.2 |
| ± SD | 0.184 ± 0.062 | 13.6 ± 1.2 | 7.87 ± 0.37 | 405 ± 92 | 179.9 ± 50.6 | |
| MLS (n = 11) | Range | 0.002~0.018 | 25.3~32.4 | 6.44~7.26 | 542~2287 | 1139.4~1933.0 |
| ± SD | 0.010 ± 0.006 | 30.3 ± 2.5 | 6.8 ± 0.2 | 1787 ± 458 | 1433.0 ± 270.0 | |
| MRS (n = 11) | Range | 0~0.012 | 17.5 (n = 1) | 7.01~7.87 | 1577~1802 | 373.6~563.9 |
| ± SD | 0.011 ± 0.002 | 17.5 (n = 1) | 7.4 ± 0.61 | 1690 ± 159 | 468.8 ± 0.134.6 | |
| Jurassic Springs (n = 5) | Range | 0.0001~0.0005 | 1.4~2.5 | 7.88~8.36 | 364~561 | 0.2~28.9 |
| ± SD | 0.0003 ± 0.0002 | 1.9 ± 0.4 | 8.14 ± 0.20 | 454 ± 75 | 8.5 ± 13.7 | |
| Total hot springs (n = 44) | Range | 0~0.28 | 10.8~32.4 | 6.44~8.45 | 248~2287 | 104.5~1933.0 |
| ± SD | 0.077 ± 0.08 | 22.3 ± 0.54 | 7.41 ± 0.54 | 933 ± 703 | 685.5 ± 551.9 |
Table 3.
Correlation analysis of water parameters.
| Index | Temperature | pH | ORP | Conductivity | As | K+ | Na+ | Ca2+ | Mg2+ | HCO3− | F− | Cl− | SO42− |
|---|---|---|---|---|---|---|---|---|---|---|---|---|---|
| temperature | 1 | −0.92 ** | −0.77 ** | 0.75 * | 0.77 ** | 0.90 ** | 0.31 | 0.79 ** | 0.48 | 0.64 * | 0.90 ** | 0.46 | 0.44 |
| pH | 1 | 0.59 | −0.58 | −0.62 | −0.85 ** | −0.34 | −0.72 * | −0.23 | −0.74 * | −0.82 ** | −0.22 | −0.57 | |
| ORP | 1 | −0.88 ** | −0.77 ** | −0.88 ** | −0.25 | −0.77 ** | −0.71 * | −0.39 | −0.91 ** | −0.70 * | −0.20 | ||
| conductivity | 1 | 0.92 ** | 0.84 ** | 0.18 | 0.83 ** | 0.90 ** | 0.18 | 0.90 ** | 0.89 ** | 0.16 | |||
| As | 1 | 0.80 ** | −0.05 | 0.88 ** | 0.78 ** | 0.16 | 0.86 ** | 0.78 ** | 0.38 | ||||
| K+ | 1 | 0.38 | 0.93 ** | 0.53 | 0.66 * | 0.99 ** | 0.51 | 0.54 | |||||
| Na+ | 1 | 0.24 | 0.002 | 0.64 * | 0.26 | −0.05 | 0.15 | ||||||
| Ca2+ | 1 | 0.54 | 0.52 | 0.92 ** | 0.53 | 0.67 * | |||||||
| Mg2+ | 1 | −0.23 | 0.62 | 1.00 ** | −0.23 | ||||||||
| HCO3− | 1 | 0.55 | −0.26 | 0.68 * | |||||||||
| F− | 1 | 0.61 | 0.46 | ||||||||||
| Cl− | 1 | −0.24 | |||||||||||
| SO42− | 1 | ||||||||||||
| SiO2 |
Note: ** Significant correlation at 0.01 level (both sides). * Significant correlation at 0.05 level (both sides).
Table 4.
Calculation results of thermal storage temperature of hot springs.
| Equation (1) | Equation (2) | |||
|---|---|---|---|---|
| Storage Temperature (°C) | Circulation Depth (m) | Storage Temperature (°C) | Circulation Depth (m) | |
| EHS | 45.37 | 1074 | 12.76 | 141.59 |
| ECS | 39.93 | 918 | 7.21 | −16.92 |
| MLS | 63.68 | 1596 | 31.61 | 680.36 |
| YHS | 82.60 | 2137 | 51.43 | 1246.51 |
| ZHS | 52.32 | 1272 | 19.88 | 345.15 |
Table 5.
Relationship between hot water temperature, enthalpy and SiO2 content.
| Temperature(°C) | Enthalpy (×4.1868 J/g) | SiO2 Content (mg/L) | Temperature (°C) | Enthalpy (×4.1868 J/g) | SiO2 Content (mg/L) |
|---|---|---|---|---|---|
| 50 | 50.0 | 13.5 | 200 | 203.6 | 265 |
| 75 | 75.0 | 26.6 | 225 | 230.9 | 365 |
| 100 | 100.1 | 48 | 250 | 259.2 | 486 |
| 125 | 125.4 | 80 | 275 | 289.0 | 614 |
| 150 | 151.0 | 125 | 300 | 321.0 | 692 |
| 175 | 177.0 | 185 |
Table 6.
Arsenic concentration and flux in deep geothermal water.
| EHS | ECS | MLS | YHS | |
|---|---|---|---|---|
| Y1 (%) | 89 | 68 | 62 | 62 |
| Y2 (%) | 11 | 32 | 38 | 38 |
| C (μg/L) | 642.10 | 271.20 | 1832.40 | 643.50 |
| Ch (μg/L) | 5602.64 | 785.88 | 4774.79 | 1646.11 |
| Flow Q (m3/s) | 0.050 | 0.109 | 0.002 | / |
| Cold water arsenic flux (mg/s) | 0.487 | 0.382 | 0.0083 | / |
| Hot water arsenic flux (mg/s) | 30.814 | 27.411 | 3.628 | / |
| Proportion of cold water arsenic flux in total arsenic flux (%) | 1.56% | 1.38% | 0.23% | / |
| Proportion of hot water arsenic flux in total arsenic flux (%) | 98.44% | 98.62% | 99.77% | / |
Disclaimer/Publisher’s Note: The statements, opinions and data contained in all publications are solely those of the individual author(s) and contributor(s) and not of MDPI and/or the editor(s). MDPI and/or the editor(s) disclaim responsibility for any injury to people or property resulting from any ideas, methods, instructions or products referred to in the content. |
© 2023 by the authors. Licensee MDPI, Basel, Switzerland. This article is an open access article distributed under the terms and conditions of the Creative Commons Attribution (CC BY) license (https://creativecommons.org/licenses/by/4.0/).
Share and Cite
MDPI and ACS Style
Zhang, Z.; Zhou, L.; He, Y.; Luo, Z.; Chen, S. Characteristics and Source Analysis of High-Arsenic Groundwater in Typical Watershed Areas of Tibet, China. Water 2023, 15, 533. https://doi.org/10.3390/w15030533
AMA Style
Zhang Z, Zhou L, He Y, Luo Z, Chen S. Characteristics and Source Analysis of High-Arsenic Groundwater in Typical Watershed Areas of Tibet, China. Water. 2023; 15(3):533. https://doi.org/10.3390/w15030533
Chicago/Turabian StyleZhang, Zhongwei, Liangjing Zhou, Yunjiao He, Zhaohui Luo, and Sibao Chen. 2023. "Characteristics and Source Analysis of High-Arsenic Groundwater in Typical Watershed Areas of Tibet, China" Water 15, no. 3: 533. https://doi.org/10.3390/w15030533
Note that from the first issue of 2016, this journal uses article numbers instead of page numbers. See further details here.