
Performance Evaluation of Large-Scale Green Roofs Based on Qualitative and Quantitative Runoff Modeling Using MUSICX


1
Institute for Sustainable Industries & Liveable Cities, Victoria University, PO Box 14428, Melbourne, VIC 8001, Australia
2
College of Engineering and Science, Victoria University, PO Box 14428, Melbourne, VIC 8001, Australia
3
E2DesignLab, PO Box 19, Darling South VIC 3145, Australia
*
Author to whom correspondence should be addressed.
Water 2023, 15(3), 549; https://doi.org/10.3390/w15030549
Submission received: 25 December 2022
/
Revised: 25 January 2023
/
Accepted: 27 January 2023
/
Published: 30 January 2023
(This article belongs to the Special Issue Urban Green and Blue Infrastructure: Current Issues, Challenges, and Opportunities)
Abstract
:Green roofs (GR) are known as one of the most effective water-sensitive urban design (WSUD) strategies to deal with numerous environmental and social issues that urbanized cities face today. The overall quality of research on GRs has significantly improved and an increasing trend is observed in the amount of research over the last decade. Among several approaches, the application of modeling tools is observed to be an effective method to simulate and evaluate the performance of GRs. Given that studies on GRs at a catchment scale are limited, this paper aims to provide a simple but effective framework for estimating the catchment-scale impacts of GR on runoff quantity and quality. MUSICX, an Australian-developed software that possesses the advantages of a conceptual model, is chosen as the modeling tool in this study. While MUSICX has built-in meteorological templates for Australian regions, this tool also supports several climate input file formats for application by modelers in other parts of the world. This paper presents two different modeling approaches using the Land Use node and Bioretention node in MUSICX. The steps used for model calibration are also provided in this paper. The modeling results present the annual reductions in runoff volume, total suspended solid (TSS), total phosphate (TP), and total nitrogen (TN) load. The largest reductions of roughly 30% per year were observed in runoff volume and TN load. The annual runoff reduction rate reported in this study is close to that of other published results. Similar research outcomes quantifying the benefits of GRs play a major role in facilitating the widespread implementation of GRs due to the awareness of both positive and negative impacts of GRs. Future studies are recommended to concentrate on modeling the impacts of implementing GRs at a large scale (i.e., scales exceeding the single-building scale) to fill the research gaps and enhance the modeling accuracy.
1. Introduction
Rapid urbanization and population growth have become rising global concerns. They challenge the existing urban infrastructure and cause several social and environmental issues. One of the most pronounced impacts is the significant increase in the impervious surface in built-up areas. In terms of stormwater management, it causes more flash flooding in terms of increasing frequency and intensity and the pollution of stormwater runoff to receiving water channels. Additionally, the reduction in vegetation cover results in the urban heat island (UHI) effect due to more significant solar heat absorption, the degradation of natural habitat, and loss of biodiversity. As a result, an appropriate solution is required to address the concerning situation.
Among various green infrastructure (GI) practices, green roofs (GR), also known as living roofs, which have recently been introduced, offer a variety of ecosystem services. The temperature and stormwater runoff volume reductions have been widely documented as GR benefits [1,2,3]. Other GR services include enhancing runoff quality, mitigating air and noise pollution, recovering urban ecology, and improving social and economic aspects. GRs are generally divided into two main groups: intensive green roofs (IGR) and extensive green roofs (EGR) with a substrate depth of more than 30 cm and less than 15 cm, respectively [1,2]. Each type of GR is suitable for specific purposes and site conditions based on their different advantages. While IGRs support a wide range of plants and prevail over EGRs in terms of ecosystem services, EGRs are a lighter system that can be widely implemented due to their affordability, less maintenance, and easy installation without structural reinforcement [2,4,5,6]. Semi-intensive green roofs (SIGRs), which have a 15 cm to 30 cm substrate thickness, are a combined GR system that takes advantage of both EGR and IGR [1].
Some attempts have been made to integrate GR with other systems. This combined system is described as “hybrid GR” in this paper. One of the noteworthy hybrid GR systems is the photovoltaic GR (PV GR), which was studied by Hui and Chan [7] and Chemisana and Lamnatou [8]. Whereas Hui and Chan [7] found the surface temperature (Ts) of a PV GR was 5 °C cooler than that of the traditional GR due to the shading effect of the PV panels, a substantial difference of 14 °C between the PV GR and the concrete roof was monitored by Chemisana and Lamnatou [8]. An improved electricity productivity from the PV panels, which is believed to be due to the cooling effect of the GR, was also detected. Another integrated GR system is the blue GR initially introduced in South Korea. This system has the same design as the conventional GR except for a larger storage layer. The runoff outflow from the blue GR was 0.1 L/s compared to 0.3 L/s from the normal roof in the study of Shafique, et al. [9]. Additionally, the combination of GR and green wall brings outstanding thermal and energy reductions as compared to stand-alone GR systems [10,11,12,13]. In spite of the above-mentioned improvements, studies on GRs are insufficient and further research is required before making firm conclusions regarding their use.
Though GRs have been well-studied for decades to quantify the numerous ecosystem services that they provide, the implementation of GRs still remain restricted by barriers and challenges. More specifically, the lack of local GR research, especially in developing countries due to costly GR installation, could make building owners and authorities unaware of GRs’ benefits [1]. Another noticeable constraint is the safety concern regarding the weight of a GR system. Given that most of the urban area consists of existing buildings, the retrofitting of GRs must be carried out by considering whether any structural reinforcements are required or not. Moreover, there exist many ambiguities and uncertainties about the capabilities of GRs. Nguyen, Muttil, Tariq and Ng [3] pointed out that published results of GR services were inconsistent in different studies. Those issues need to be resolved by future research that is conducted locally to match with specific climate characteristics. Valuable information from local research is prerequisite to motivate policy makers issuing financial incentives regarding GR application. Addressing all of the discussed problems contributes to the feasibility of the widespread implementation of GR.
Applying simulation tools is a well-known approach to investigate the effectiveness of a GR system before the actual implementation at a building scale or even at a catchment scale. They inform investors and other stakeholders about what gains and losses GRs can generate and then contribute to the decision-making process. Simulation tools are extensively used to study the relationship between GR parameters. They are also able to model building-scale GR behaviors as compared to its actual performance to analyze the model accuracy. In contrast, a relatively smaller number of studies were conducted to assess the effectiveness of GR at large scales [3]. In this study, the term “large-scale” refers to studies considering the application of GRs at scales that exceed the single-building scale, such as the city-wide scale, municipal scale, or catchment scale. Significant efforts are required to stimulate the thorough adoption of the GR concept as a part of water-sensitive urban design (WSUD).
Existing models are generally distinguished according to different approaches including the empirical-based rainfall–runoff (R–R) relationships and conceptual physics-based numerical models [14,15]. Each of them has its own advantages and disadvantages and requires a comprehensive understanding to apply them in particular circumstances and purposes. The principle of the conceptual model is the conceptualization of physical rainfall–runoff processes; hence, each parameter is responsible for components of the physical process. Therefore, conceptual models are suitable for different levels of users primarily due to their simplicity [14]. However, the limitation of conceptual models is that they need to be properly calibrated to produce accurate results. On the other hand, physics-based models such as HYDRUS are more complicated with a significant number of parameters; thus, they produce outputs at a high level of accuracy. Nevertheless, the complexity of these models leads to several computational constraints and difficulties for non-modeling users [16,17]. While they are ideally suited for detailed design, conceptual models are preferably used for conceptual-level planning [18]. In general, none of the models clearly prevail over others and the vast majority of them must be well calibrated against climate conditions in the area of interest [16].
Among several available tools, the Model for Urban Stormwater Improvement Conceptualization (MUSIC) is Australia’s most popular stormwater management tool [18]. In spite of MUSIC’s extensive use in Australia, the application of this tool for GR research is limited. Table 1 illustrates some recent studies that have used MUSIC, with only two of them simulating GRs. This could be because of MUSIC’s lack of a built-in module for modeling GRs. Some recent studies include those undertaken by Hannah, et al. [19] and Liebman, et al. [20], which provide valuable information and a foundation for future studies. MUSIC with built-in Australian meteorological and climate data is suitable to assess impacts of WSUD systems as part of preliminary design at a catchment scale [16]. MUSIC, a conceptual model, has advantages over complex physics-based models due to its simplicity and low computational requirements, allowing modeling of large-scale GRs and long-term continuous simulations [17,21]. Although MUSIC is designed with in-built meteorological data templates for Australian regions, it can also be applied anywhere in the world where appropriate climatic data are available. This includes sub-daily rainfall data (ideally at a 6 min timestep but other timesteps including 5 min, 10 min and hourly are available). The model has been applied in Singapore, Israel, China, Malaysia, and other countries (personal communication, Dale Browne, 2022). Therefore, MUSIC models can be applied internationally with appropriate local climatic data.
Considering the above-discussed gaps, many opportunities exist for future research, which motivates the present study. This research aims to test the performance of green roofs using available industry software (namely MUSICX, which is an upgraded version of MUSIC) to deliver on relevant stormwater management objectives at a campus level. Specifically, MUSICX models are developed to evaluate the effectiveness of installing GRs on all building rooftops at the Footscray Park campus of Victoria University (VU), Melbourne. The performance of large-scale campus-wide implementation of GRs was assessed through the reduction objectives for runoff volume and runoff quality as set out in the Environment Protection Authority (EPA) Victoria guidelines. EGRs are chosen in this study due to numerous well-documented benefits provided by the widespread implementation of such GRs. Although eWater MUSICX can model the stormwater runoff from many types of urban surfaces such as paved roads, roofs, and landscapes, there is no built-in module or package in MUSICX to model GRs. Subsequently, the outcomes of this study will contribute to understanding the impact of GRs in terms of runoff quantity and quality at a catchment scale. The widespread application of GRs would cost a lot in terms of effort and investment; consequently, it requires sufficient technical information from such studies to foresee the potential gains and losses [22]. Given that MUSICX has some limitations due to its conceptual nature [18], the selection of this tool is mainly based on the primary research aim of introducing a simple approach to assess the impacts of GRs that can provide accurate results, especially at the initial stage of conceptual design. Moreover, the framework proposed in this paper could be easily included in decision-support tools that can be used by different stages of decision making [23].

Table 1.
A summary of application of MUSIC in recent studies.
| Study | Location | Type of WSUD Treatments | Reduction in TSS/TP/TN (%) | Flow Reduction (%) |
|---|---|---|---|---|
| Zhang, Bach, Mathios, Dotto and Deletic [21] | Brisbane/Melbourne/Perth, Australia | Bio-retention cells, wetlands, and ponds | 85/60/45 | N/A |
| Ghofrani, et al. [24] | Tarwin Lower, South Gippsland, Victoria, Australia | Rainwater tanks, bio-retention cells, vegetative swales, and infiltration systems | 94.4 | 16 |
| Noh, et al. [25] | Cameron Highlands, Pahang, Malaysia | Wetlands, bio-retention cells, on-site detention, sediment basin, and gross pollutant traps | 65–83/52–78/40–66 | N/A |
| Schubert, et al. [26] | Little Stringybark Creek (LSC) watershed, Melbourne, Victoria, Australia | Rainwater tank, infiltration systems, and bio-retention cells | N/A | 60 for storms ≤2 h and 30 for storms >2 h and ≤12 h |
| Montaseri, et al. [27] | ACT, Australia | Swales, rainwater tanks, bio-retention cells, infiltration system, and wetlands | 80/75/70 | N/A |
| Hannah, Wicks, O’Sullivan and de Vries [19] | Bannockburn, Central Otago, New Zealand | Green roof | 73.9/–12.9/87 | 62 |
| Liebman, Wark and Mackay [20] | Western Sydney, Australia | Green roof | N/A | 22 and 56 for 12.5% and 37.5% GR coverage, respectively |
2. Methodology
2.1. Site Description
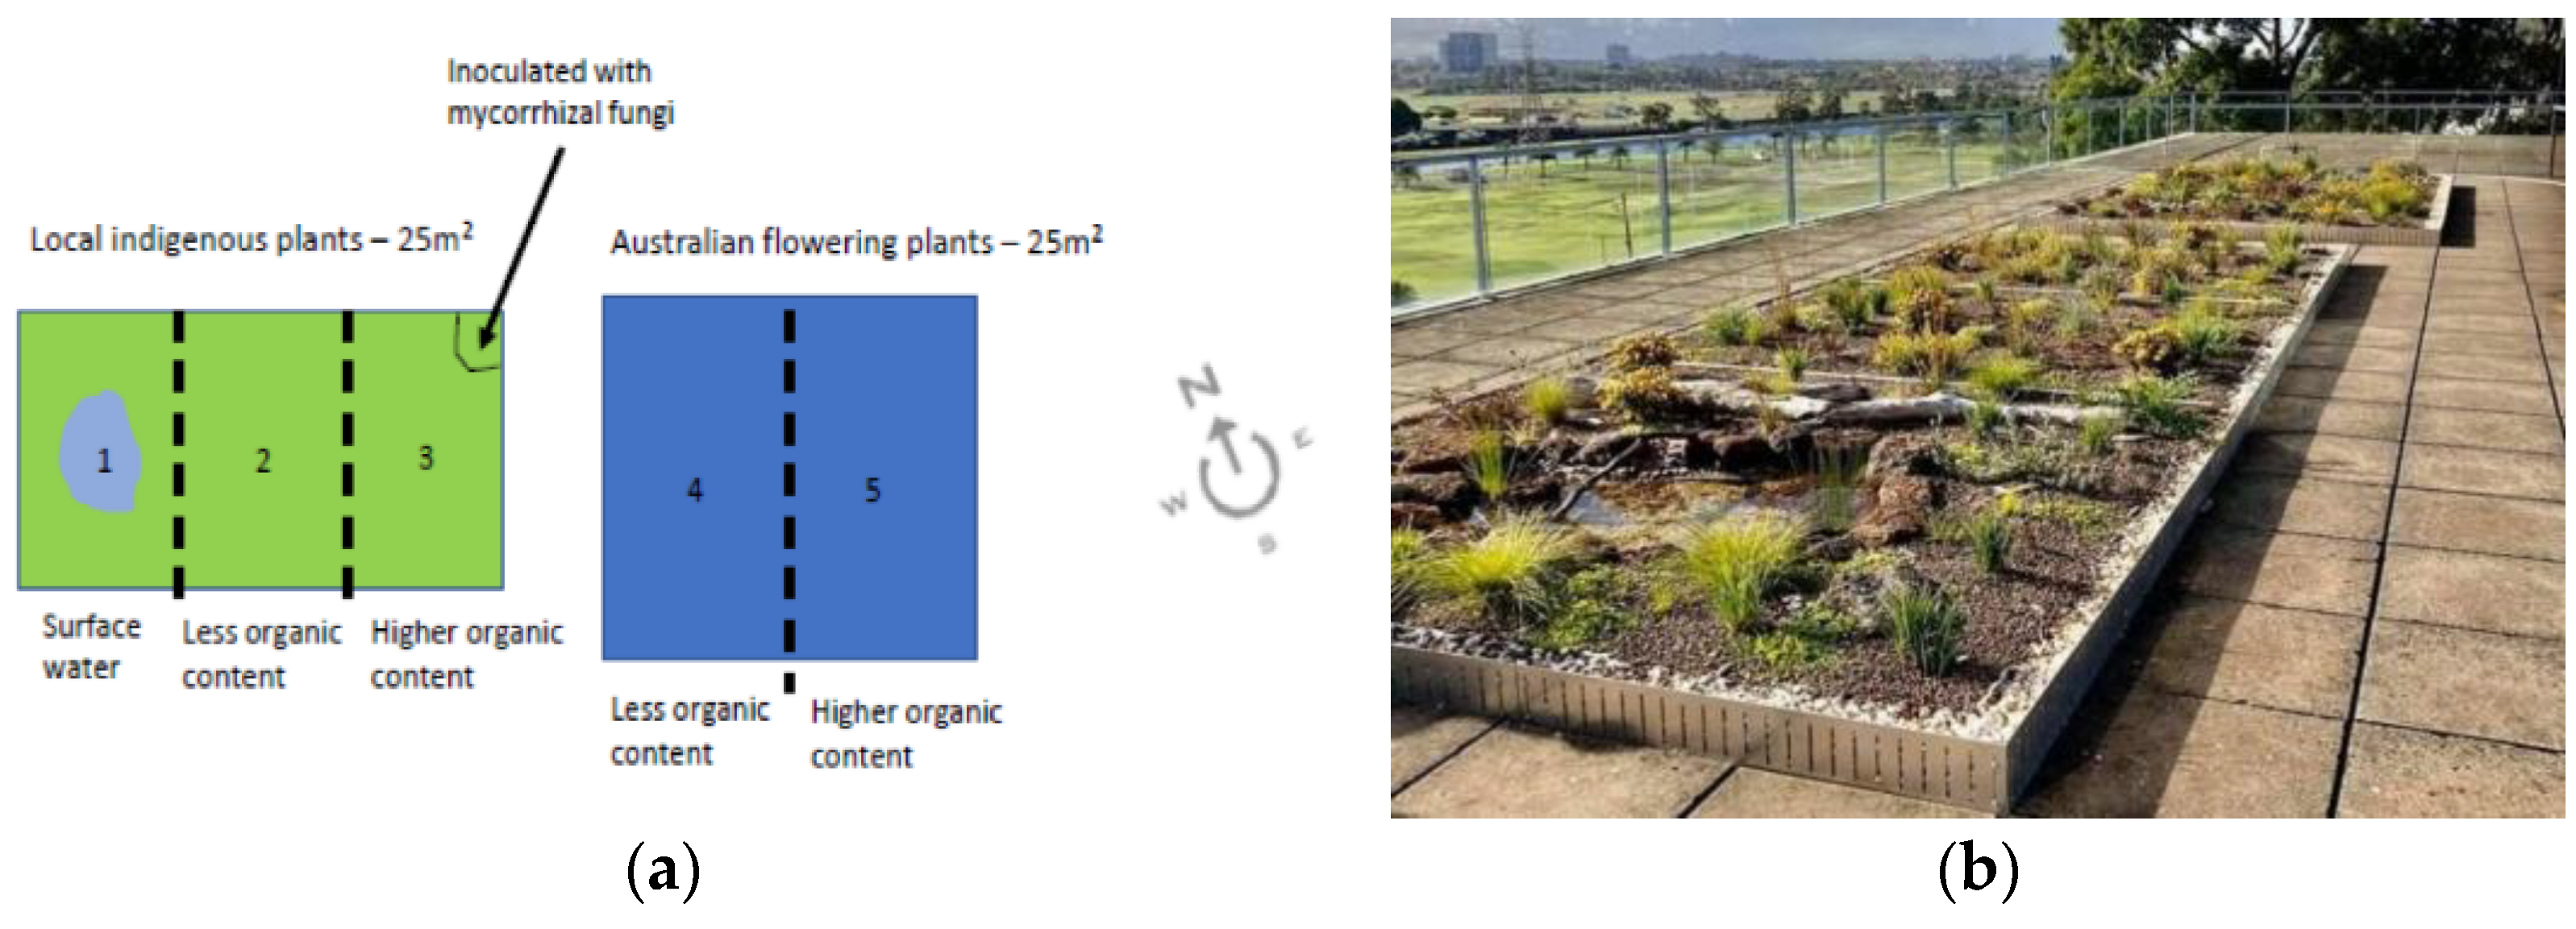
Victoria University’s (VU) Footscray Park campus is located in the western suburbs of Melbourne. The city of Melbourne has a temperate oceanic climate (Köppen climate classification Cfb). It has warm summers and mild winters with an average annual precipitation of around 600 mm. Experimental GR plots were successfully constructed on the roof of Building M at VU’s Footscray Park campus during the end of 2020. These GRs are an initial stage of a project aimed at developing the university into a green, sustainable, and climate-smart campus. Figure 1 illustrates the GR plots, indicating the area, layout, types of vegetation, content of the growing media, and the constructed green roof itself. Specifications of these actual GRs will be taken for modeling purposes (details of which are presented later). Though some hydrologic parameters of the plots cannot be determined, this research attempts to calibrate the MUSICX model as close as possible to the actual constructed GR.
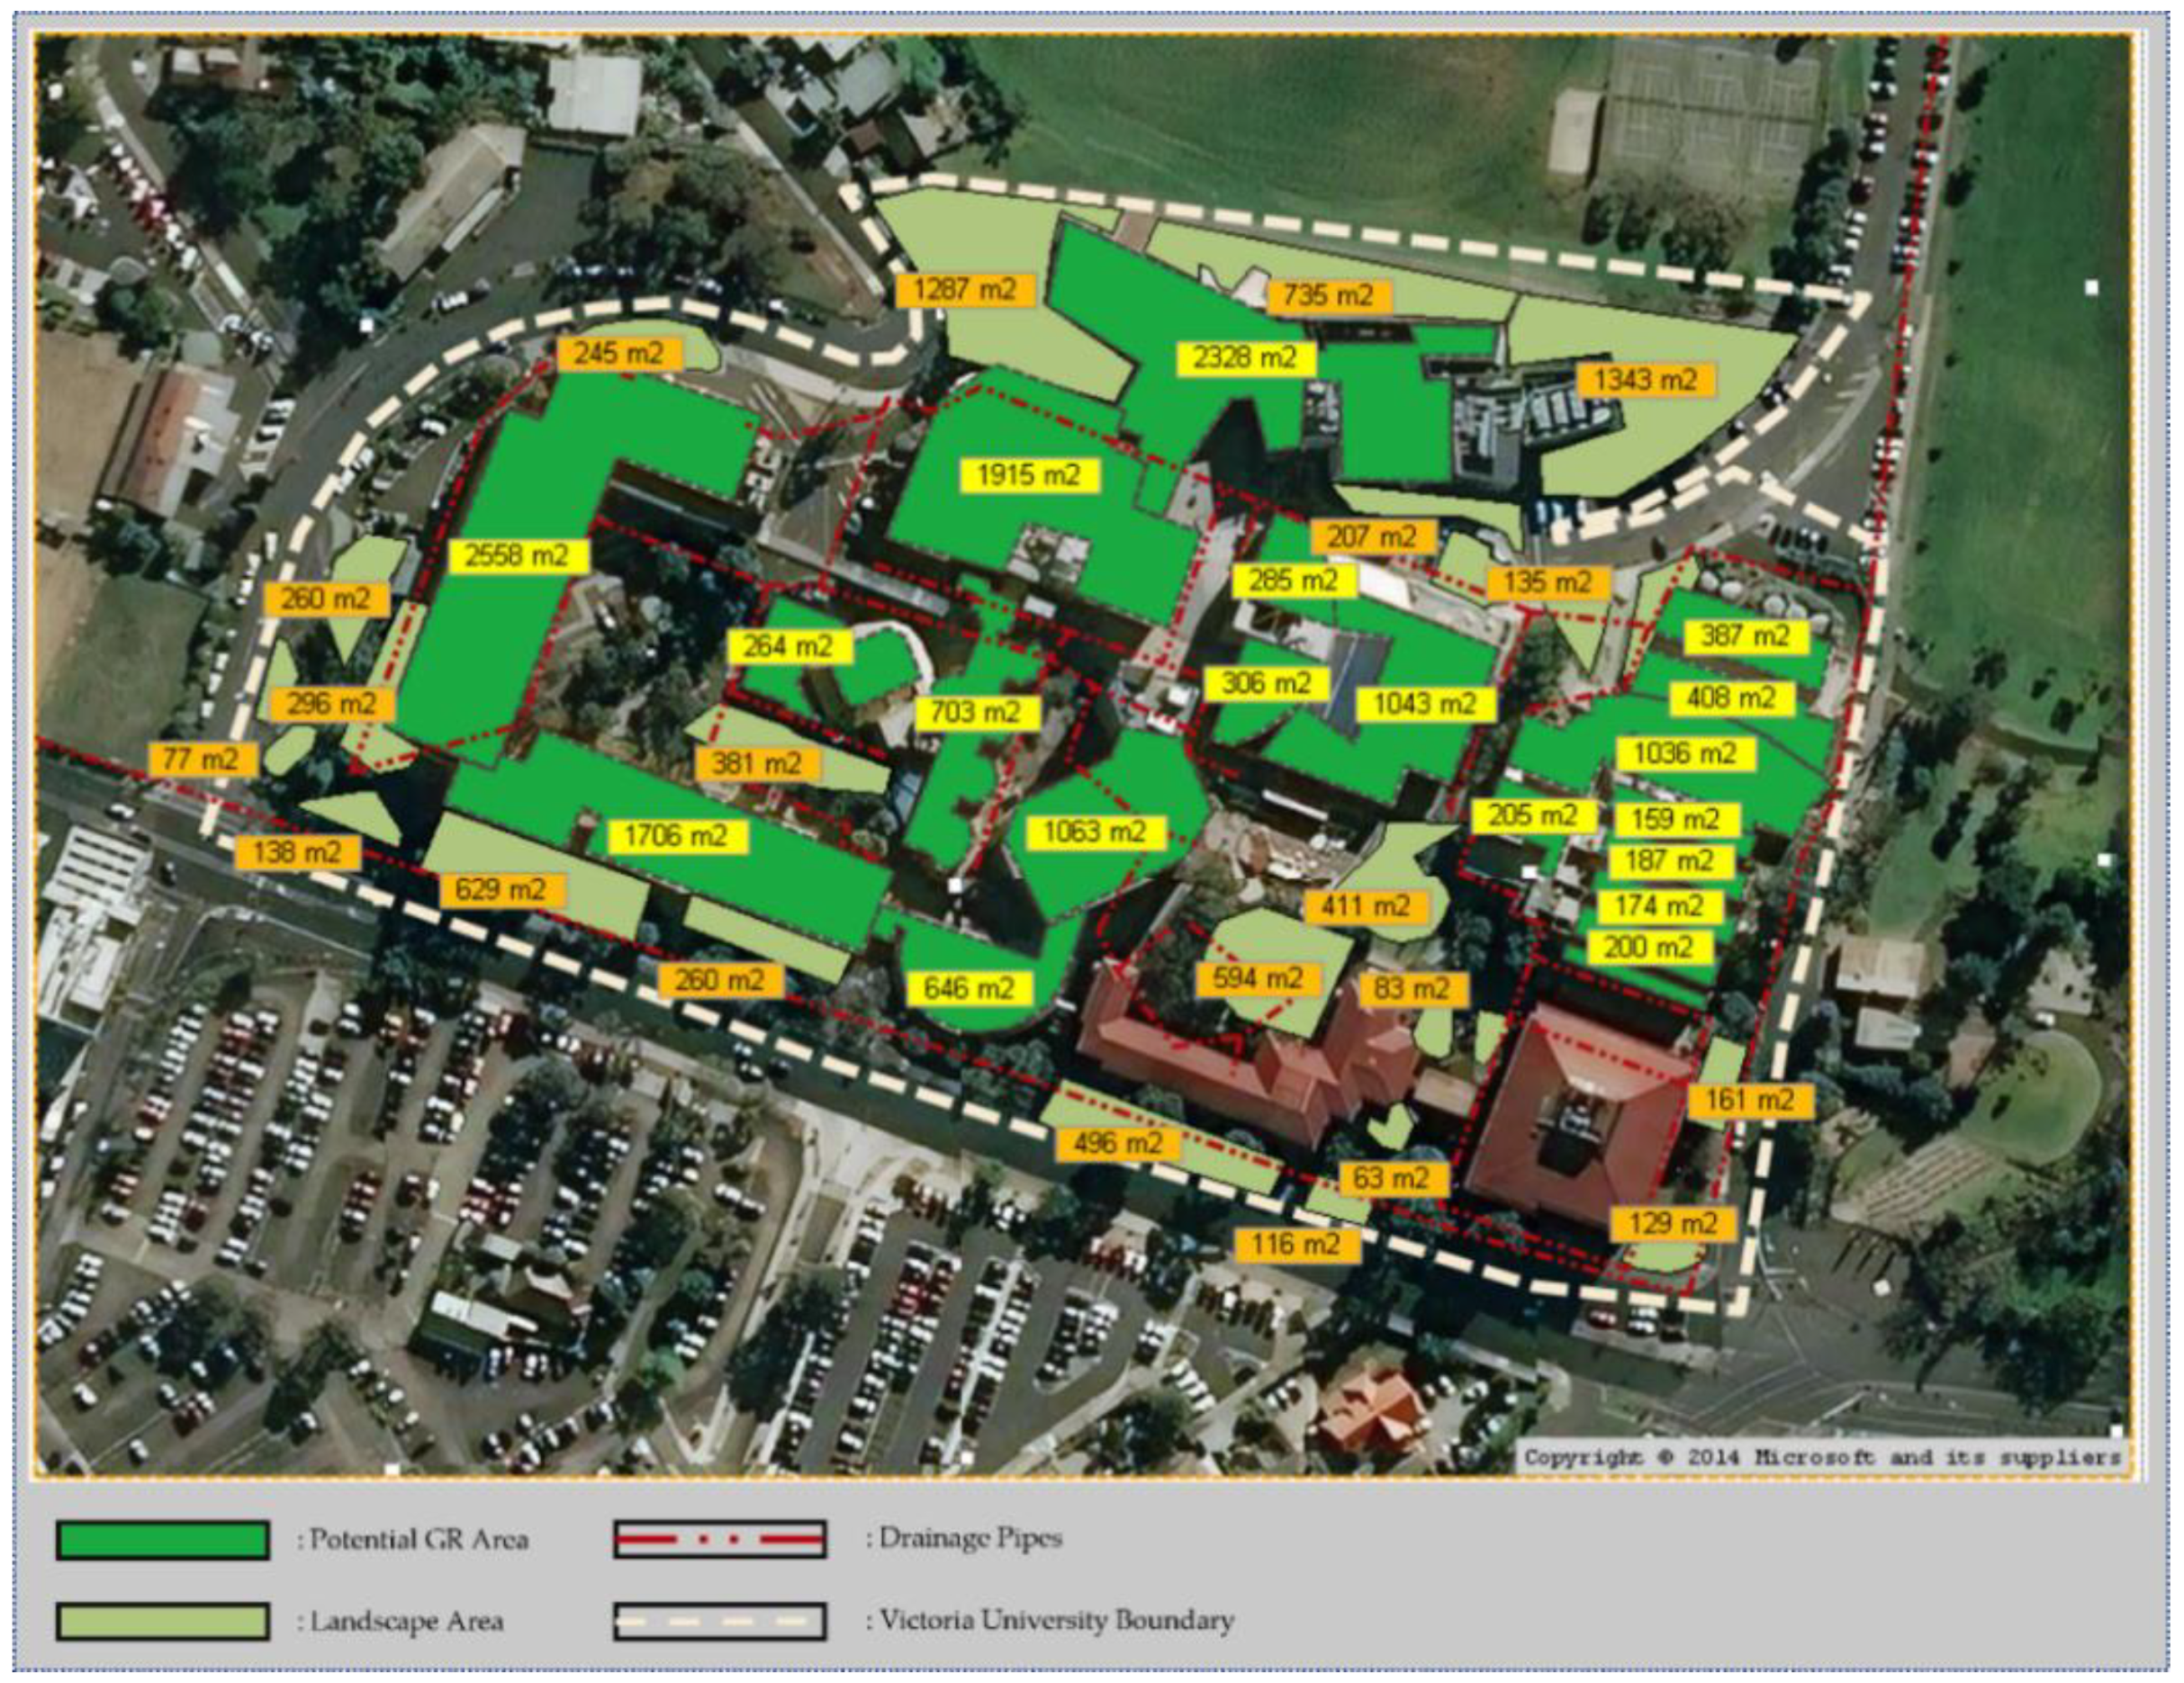
Table 2 provides detailed information about the VU campus’s catchment characteristics. Figure 2 further describes the VU campus’s existing plan by providing information about flat roof area, landscape area, and the existing stormwater drainage system. The VU campus has a total roof area of 22,018 m2; however, only 13,159.5 m2 are available for potential GR installation. The estimation of the potential GR area is based on the aerial image provided by the Google Earth database. Only flat roof areas are considered as potential GR areas. The area suitable for GR is further calculated by considering existing fixtures and footpaths for GR maintenance access. Effective impervious area (EIA), which is an important parameter in MUSICX, is the impervious area effectively connected to a drainage system. EIA is recommended to be adequately estimated with accurate drainage-system details. Since such data are missing, the EIA value of 0.7 for education public use zones from the MUSIC guidelines of Melbourne Water [28] was used.
2.2. Data Collection
Though MUSICX has a built-in rainfall template for Melbourne, it is strongly recommended to use local climate data for accurate modeling. Melbourne Water [28] suggested the input of pluvial data at a 6 min timestep for a minimum of 10 years. The average monthly potential evapotranspiration (PET) data are also an input into MUSICX. The pluvial data are collected at the Melbourne Regional Office—weather station 86071 (37.81° S, 144.97° E), which is 6 km away from the area of interest, VU Footscray Park campus. The required PET data were extracted from the closest grid to the coordinates of station 86071 to match the 6 min pluvial data at the previous step. The spatial resolution of the gridded PET data is 0.1 degrees or approximately 10 km. Pluvial and PET data for 50 years from 1960 to 2010 were taken to ensure 100% of the data availability.
2.3. Proposed Framework
Figure 3 presents the proposed framework for developing a GR model using eWater MUSICX for evaluating the performance of GRs at a large scale in terms of runoff quantity and quality parameters.
The following sections explain the required input data, the data sources, and the identification of parameters for model calibration.
2.3.1. Simulation Settings
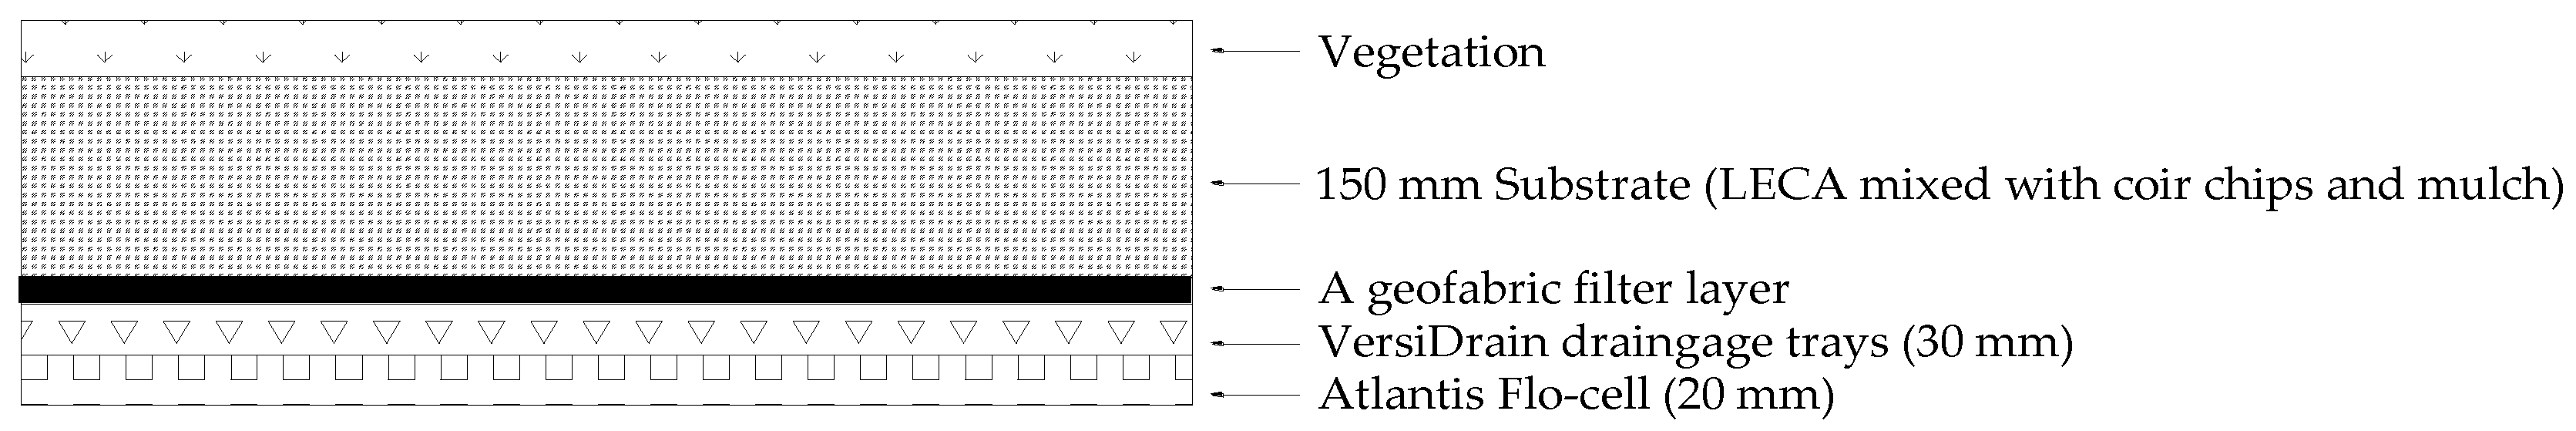
As indicated earlier, MUSICX with numerous improvements in the modeling algorithms when compared to the classic MUSIC version was chosen to be used in this study. There exist no obvious advantages of a model over another, and the accuracy of both conceptual and physical hydrological models must be assured by proper calibrations [16]. On the other hand, among existing GR plots at the VU campus, the chosen one has a 150 mm substrate; a mixed substrate of Light Expanded Clay Aggregate (LECA) (80%), mulch (15%), and coir chips (5%); a geofabric filter layer; and a drainage layer comprising VersiDrain drainage trays and Atlantis Flo-cell. Figure 4 illustrates a cross-section of the VU GR system used for modeling inputs. The VU GR is designed to be a lightweight system with innovative products. LECA is a lightweight material with a high capacity of water absorption. Atlantis Flo-cell is a light-weight product to provide structural support and water storage. The light-weight VersiDrain trays enhance the drainage layer by storing more than 11 L of water per square meter.
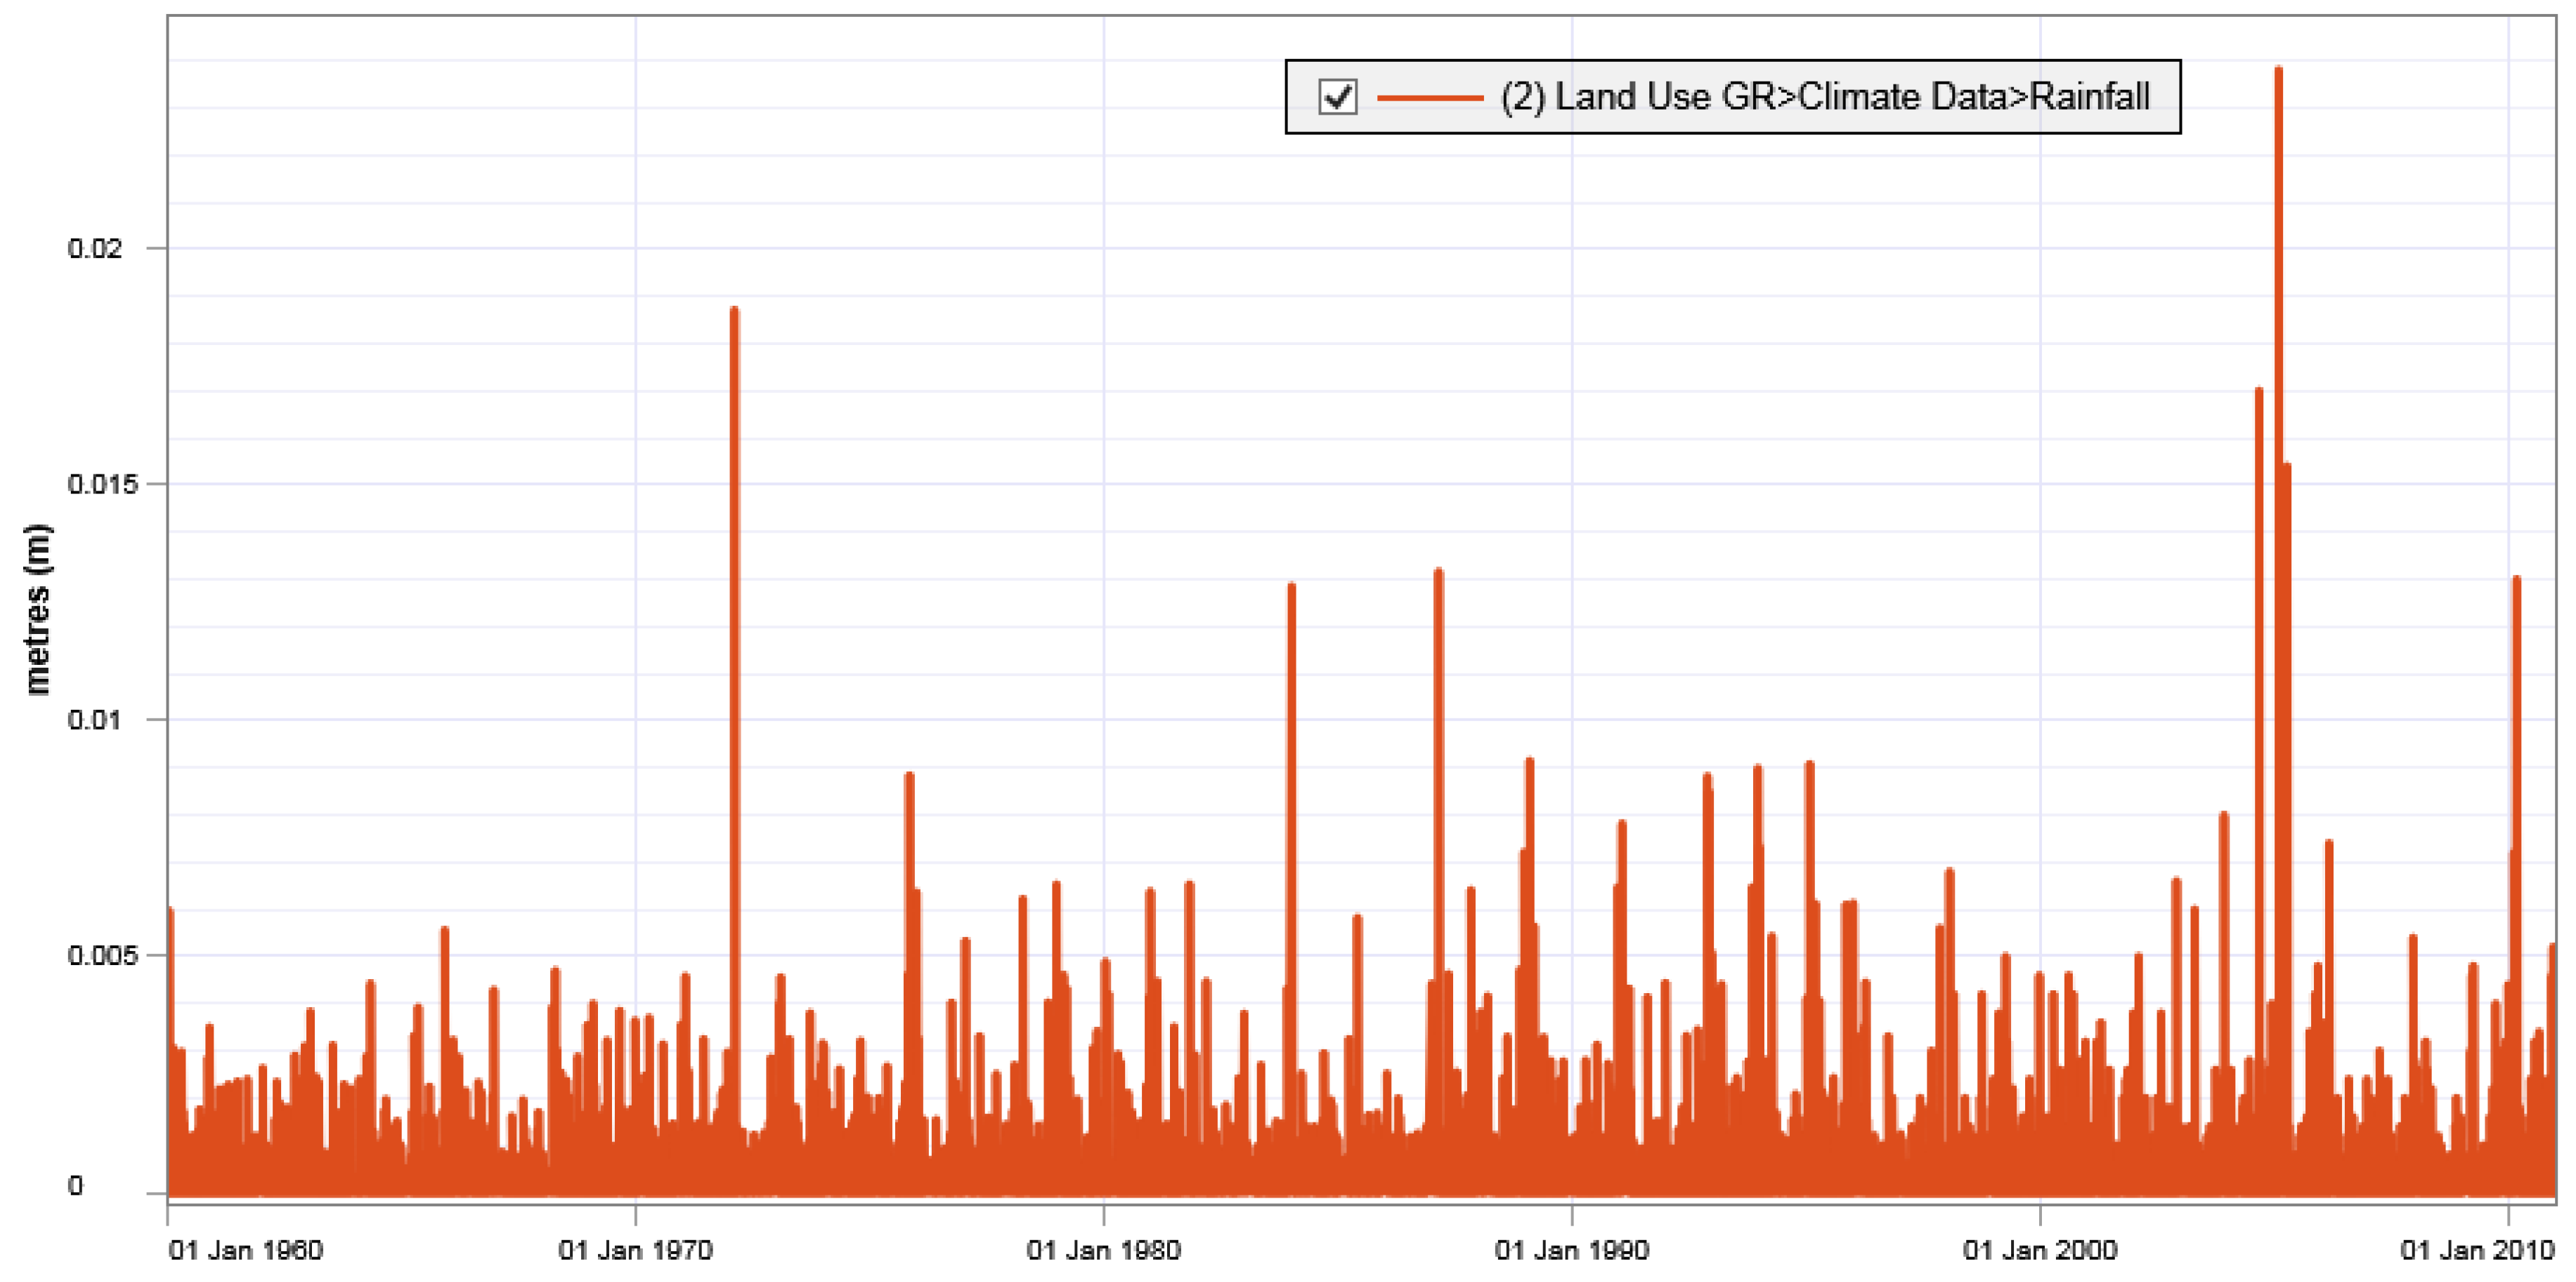
The 50-year rainfall and PET data from 1 January 1960 to 31 December 2010 were selected for the simulation. This period meets the requirements of Melbourne Water [28] MUSIC guidelines in terms of data quality, data availability, and minimum data period. The 6 min rainfall data from BoM for the chosen period are shown in Figure 5. The following sections describe the calibration process of the model through a variety of guidelines and values reported by other scholars. The flow data and substrate hydraulic characteristics obtained from soil testing are missing in the present study and would be part of future work that would be undertaken to improve the model’s validity.
2.3.2. Land Use Node Approach
A land use node is a basic node in MUSIC. This type of node is not a treatment node and cannot be used to treat stormwater runoff. The reason for choosing this node to model GRs is its capability to modify the physical characteristics of the GR substrate. More particularly, its setting allows users to input parameters to reflect the hydrological performance of the substrate used, such as the field capacity (FC) and soil storage capacity (SSC).
The calibration of the pervious area parameters based on soil properties (Table 3) for MUSIC inputs is guided by Macleod [29]. This study has become a useful guideline for calibrating soil-related parameters in MUSIC at a base level in the case of unavailable on-site flow data [20,30]. The soil information in Macleod [29] was obtained from in-field tests and available soil data from previously published results.
The substrate used for GR plots at the VU campus has a thickness of 150 mm and is a mix of Light Expanded Clay Aggregate (LECA), coir chips, and mulch. LECA is a light-weight material with a high capacity for water absorption. SSC and FC are computed with respect to “Light Clay”, which is dominant in the VU GR substrate. A value of 200 mm/day for the coefficient “a” is the MUSIC default value and is suitable for the moderately-structured clay. A value of 3 for “b” is used, corresponding to the single-grained light clay. The daily recharge rate indicates the percentage of excess water above FC that is drained to the layer below the substrate (drainage layer of GR) on a given day. A daily recharge rate value of 90% of “a” is suitable for GRs with a shallow and rapidly-drained substrate. The daily baseflow rate describes the percentage of groundwater (water in the drainage layer of GR) that flows into local water bodies daily. Given that soil textures identify “b” values from Macleod [29] and the definition of “b” is not developed for a non-soil drainage layer of GR, a very small value of 5% is used to present no outflows unless the drainage storage is full of water.
Since there are no modifications for the nutrient content of the GR substrate in the land use node, the only solution to produce reliable runoff quality results is to input the pollutant concentration data for the urban surface type of landscape. Pollutant concentration parameters of the GR land use node are taken from the Melbourne Water [28] MUSIC guidelines. Other important pervious and impervious parameters for the Melbourne area are also obtained from the same guidelines.
2.3.3. Bioretention Node Approach
In general, GR and bioretention systems share a similar concept and design. They both have water surface storage, a planted soil layer, and a drainage layer [31]. They also provide huge benefits for stormwater absorption and filtration [32,33]. Bioretention has a thick substrate and a great detention depth with 0.1–0.15 m of topsoil layer above 1–1.25 m of engineered substrate layer [34]. Conversely, GR, especially EGR, has a nominal detention depth and a shallow substrate, which are only favorable for the growth of drought-tolerant plants. Though the bioretention node is the closest available treatment node to GR, this node requires extensive modifications to reflect the hydrological performance of a typical GR.
TN and orthophosphate are not only essential for plant establishment but also the source of pollutants leaching from the GR or bioretention systems. Payne, et al. [35] recommend limiting the content of TN and orthophosphate below 1000 mg/kg and 80 mg/kg, respectively. Without soil nutrient information, TN and orthophosphate contents of 400 mg/kg and 40 mg/kg were considered sufficient by Mainwright and Weber [36]. These minimal values could interfere with the establishment of plants within a bioretention system. Nevertheless, they would probably be adequate for GRs, largely due to their lower organic content. The nutritional characteristics of GR substrates used in other studies were also found and are summarized in Table 4 for further justification. The nutrient content values were chosen within the range reported in Table 4 and appropriate for the VU GR substrate composition (no added fertilizer and minimal compost by hardwood mulch). It is noteworthy that the GAF substrate in [37] contains a very high initial P concentration. Additionally, the substrates used in [38,39] have high TP values caused by the high percentage of compost from animal waste.
The saturated hydraulic conductivity (SHC) for a bioretention system ranges from 100–300 mm/h in the Facility for Advancing Water Biofiltration (FAWB) guidelines [35]. Given that the growing medium gradually becomes compacted and accumulates sediments, 50% of the recommended SHC should be applied [36]. However, GR is a very shallow substrate with a far higher SHC than bioretention. Numerous papers reporting SHC values of different substrates were identified to justify the calibration of SHC for modeling GR in MUSIC (Table 5). Most of them are derived from laboratory experiments. Considering expanded clay as the dominant part in the VU substrate mix and its reduction over time, 700 mm/h of SHC was inputted into MUSIC modeling. The SHC value for GR is remarkably higher than that for bioretention, which facilitates water infiltration to avoid water flow and ponding on the surface even in heavy rainfall [40,41,42]. A value of 700 mm/h is within the range of 36 to 4200 mm/h recommended by the FLL German guidelines [43], whereas 150 to 2500 mm/h is the satisfactory range for a GR substrate [44].
Table 4.
Nutritional characteristics of green roof substrates reported in other studies.
| Study | Total Nitrogen (mg/kg) | Total Phosphorous (mg/kg) | Substrate Composition |
|---|---|---|---|
| Kotsiris, Nektarios, Ntoulas and Kargas [38] | 132/250/36 | 56.68/202.8/8.90 | Pumice, peat, and clinoptilolite zeolite (65:30:5)/pumice, compost, and zeolite (65:30:5)/sandy loam soil, perlite, and zeolite (30:65:5) |
| Nektarios, Amountzias, Kokkinou and Ntoulas [39] | 180/240 | 116.6/125.1 | Pumice, perlite, compost, and clinoptilolite zeolite (50:20:20:10)/Soil, pumice, perlite, compost, and clinoptilolite zeolite (15:40:20:20:5) |
| Harper, Limmer, Showalter and Burken [37] | NA | 60/46 and 219/212 (Fresh/9 months old) | Arkalyte/GAF |
| Arellano-Leyva, et al. [45] | NA | 23.50/37.10 | Gravel, volcanic rock mixed with clay, coconut fiber, compost, and soil with sandy loam texture |
Other parameters were adjusted to properly model GR, including the lined base, zero exfiltration rate, underdrain present, minimal extended detention depth, and unlined filter media perimeter. From MUSIC V6 and MUSICX, a new algorithm using a ratio called “PET scaling factor” has been developed based on field experiments on biofilters. This ratio allows the precise prediction of PET values, which vary seasonally. The MUSIC default value of the PET scaling factor is 2.1, which is taken from Carex in greenhouse conditions. A smaller ratio of 1.5 was selected in this study to correspond to low-water-use plants on GRs. Table 6 describes the input values for the bioretention node representing the GR.
3. Results
3.1. GR Land Use Node
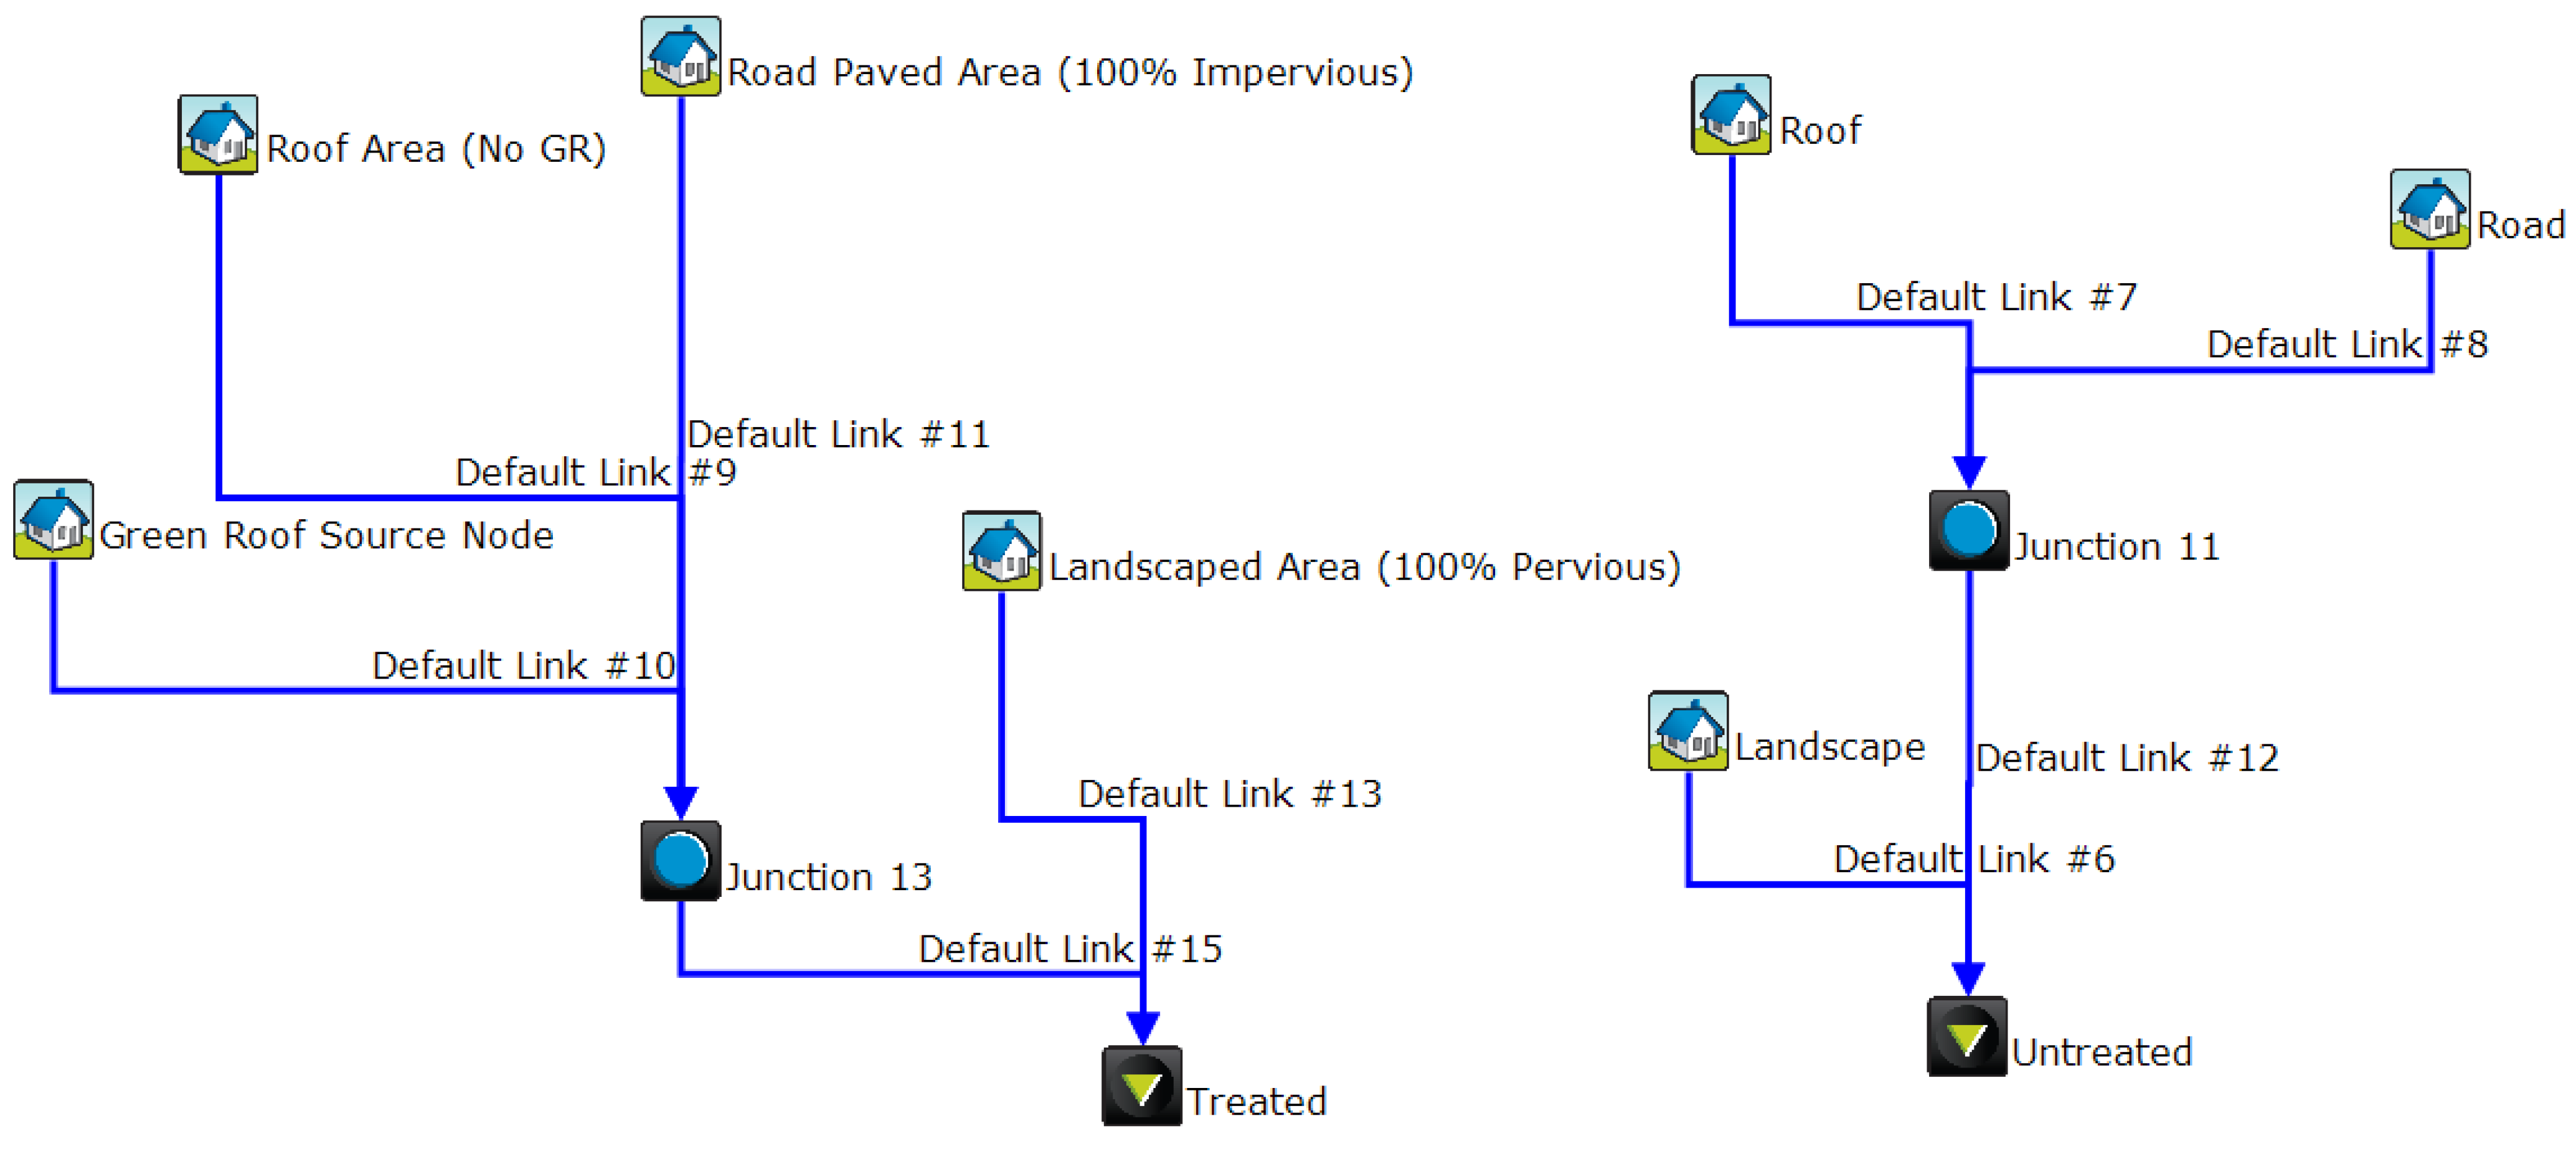
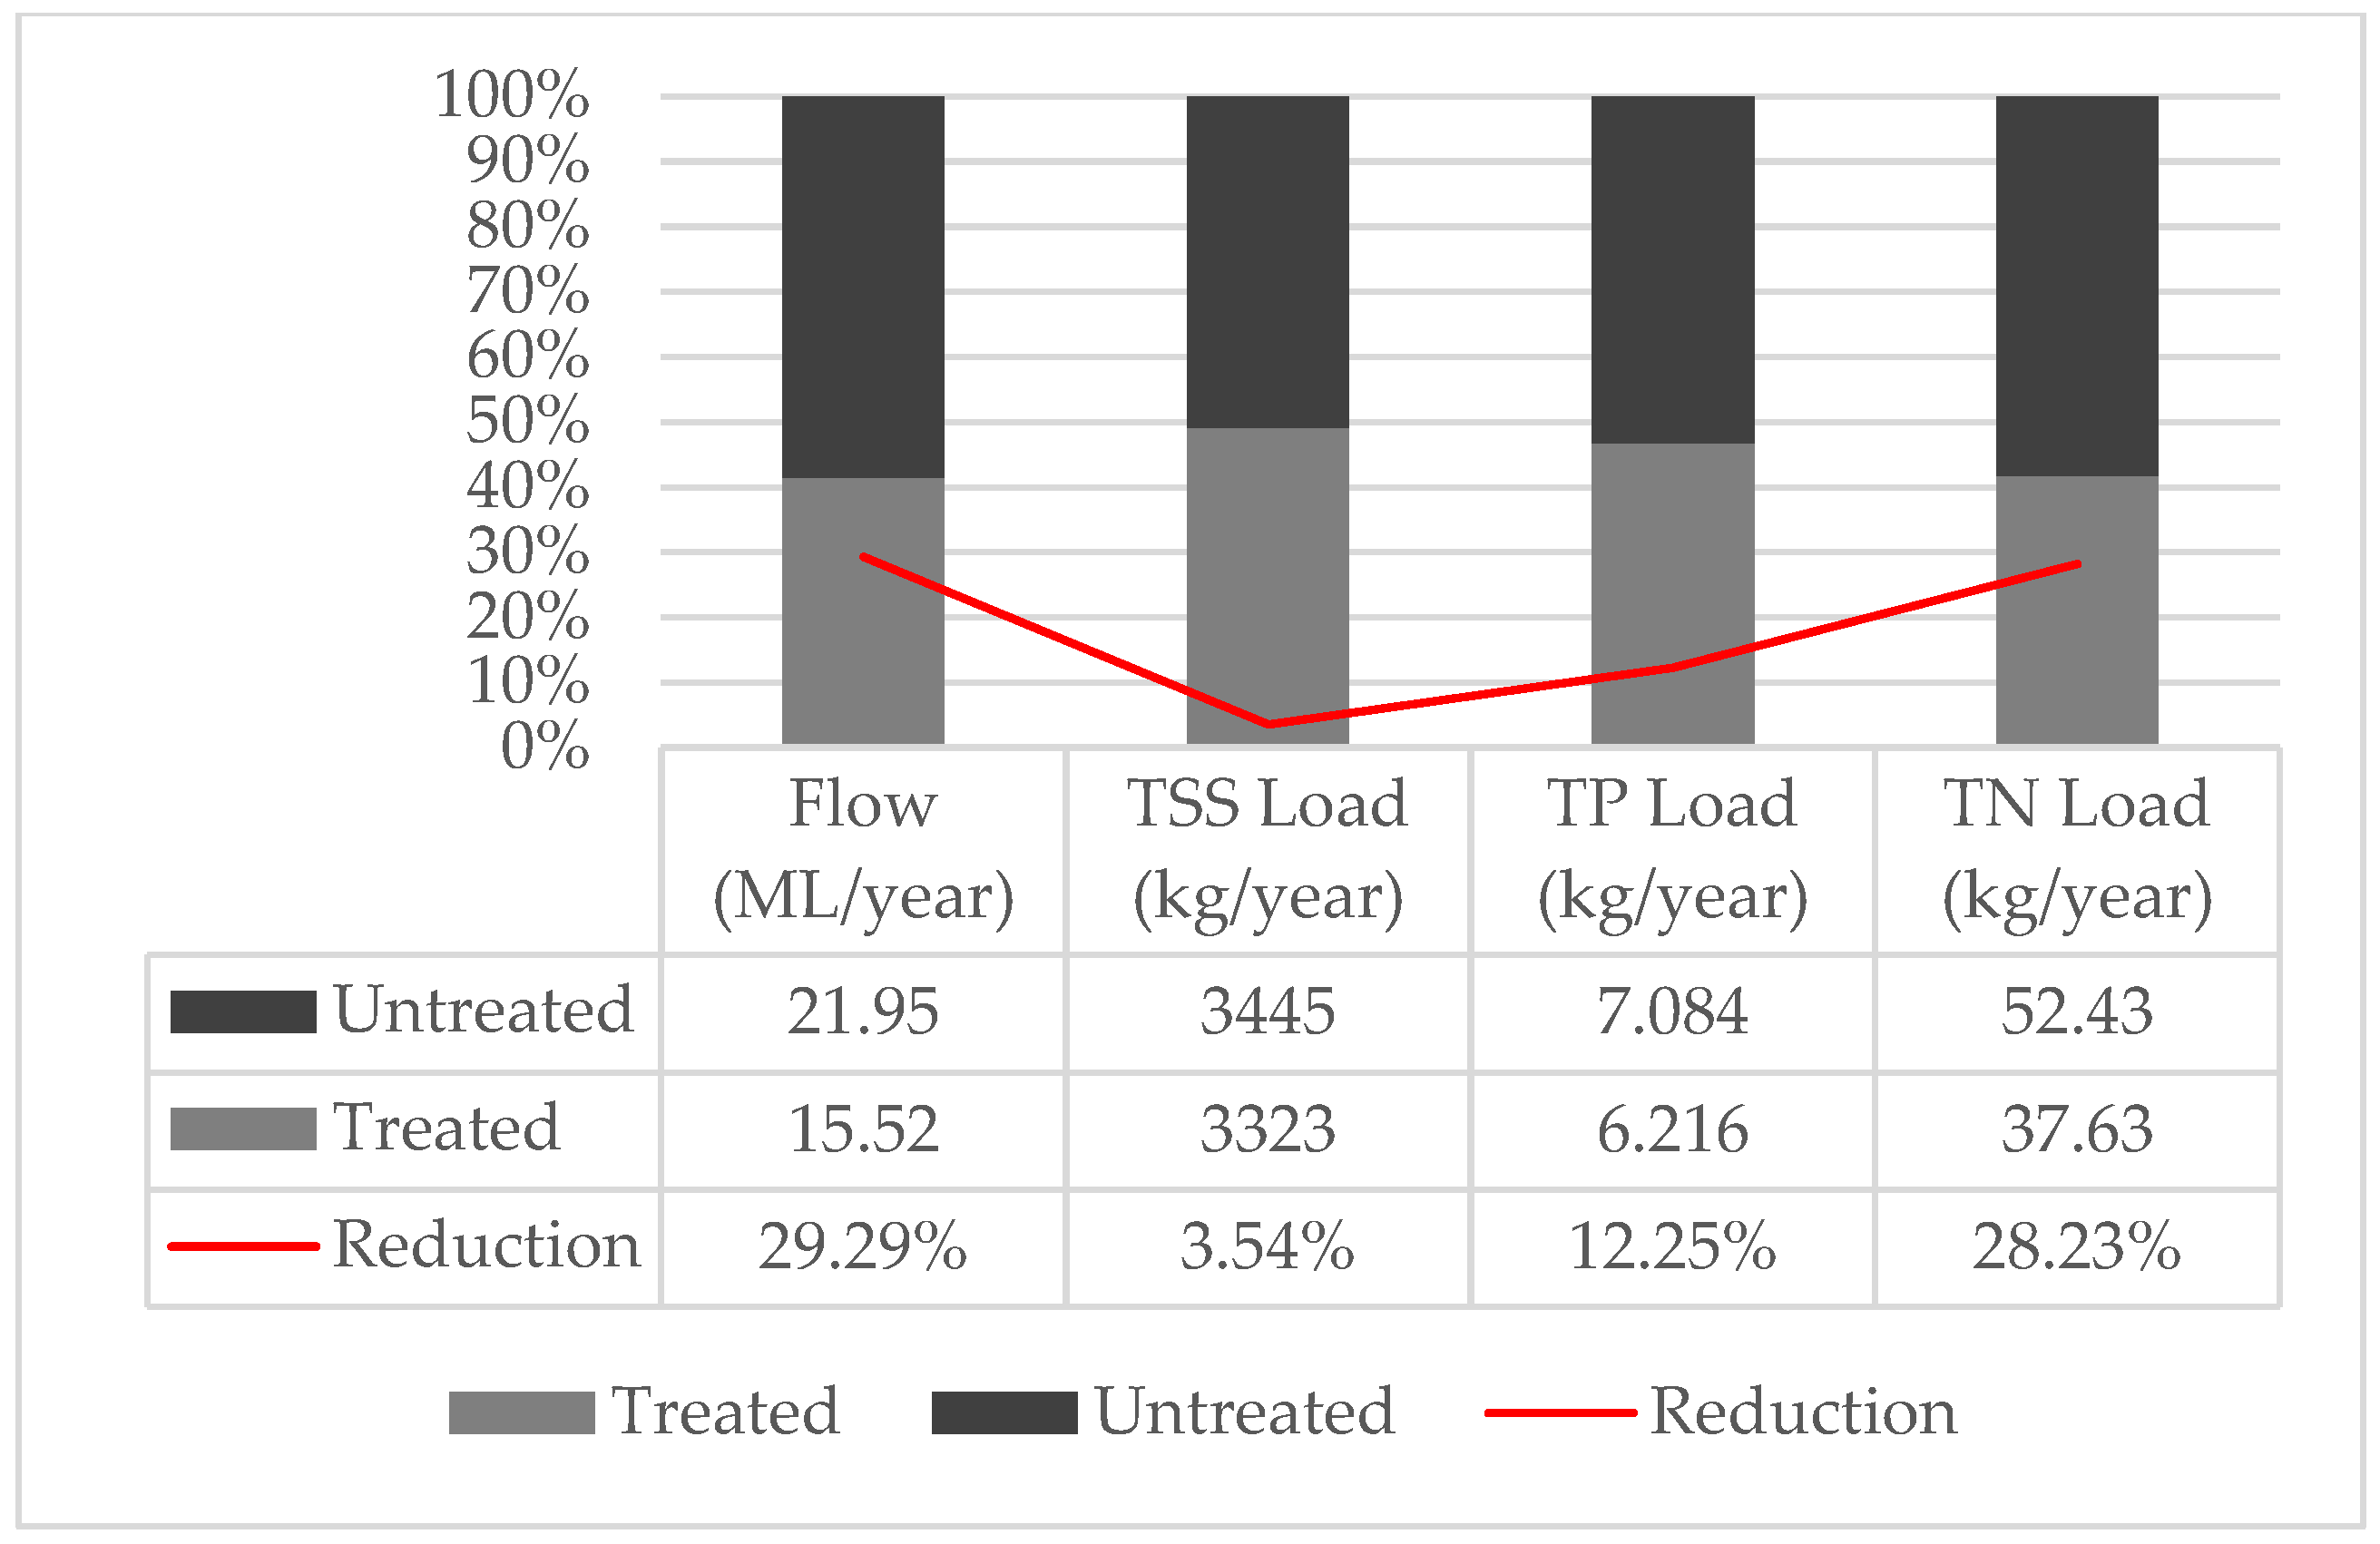
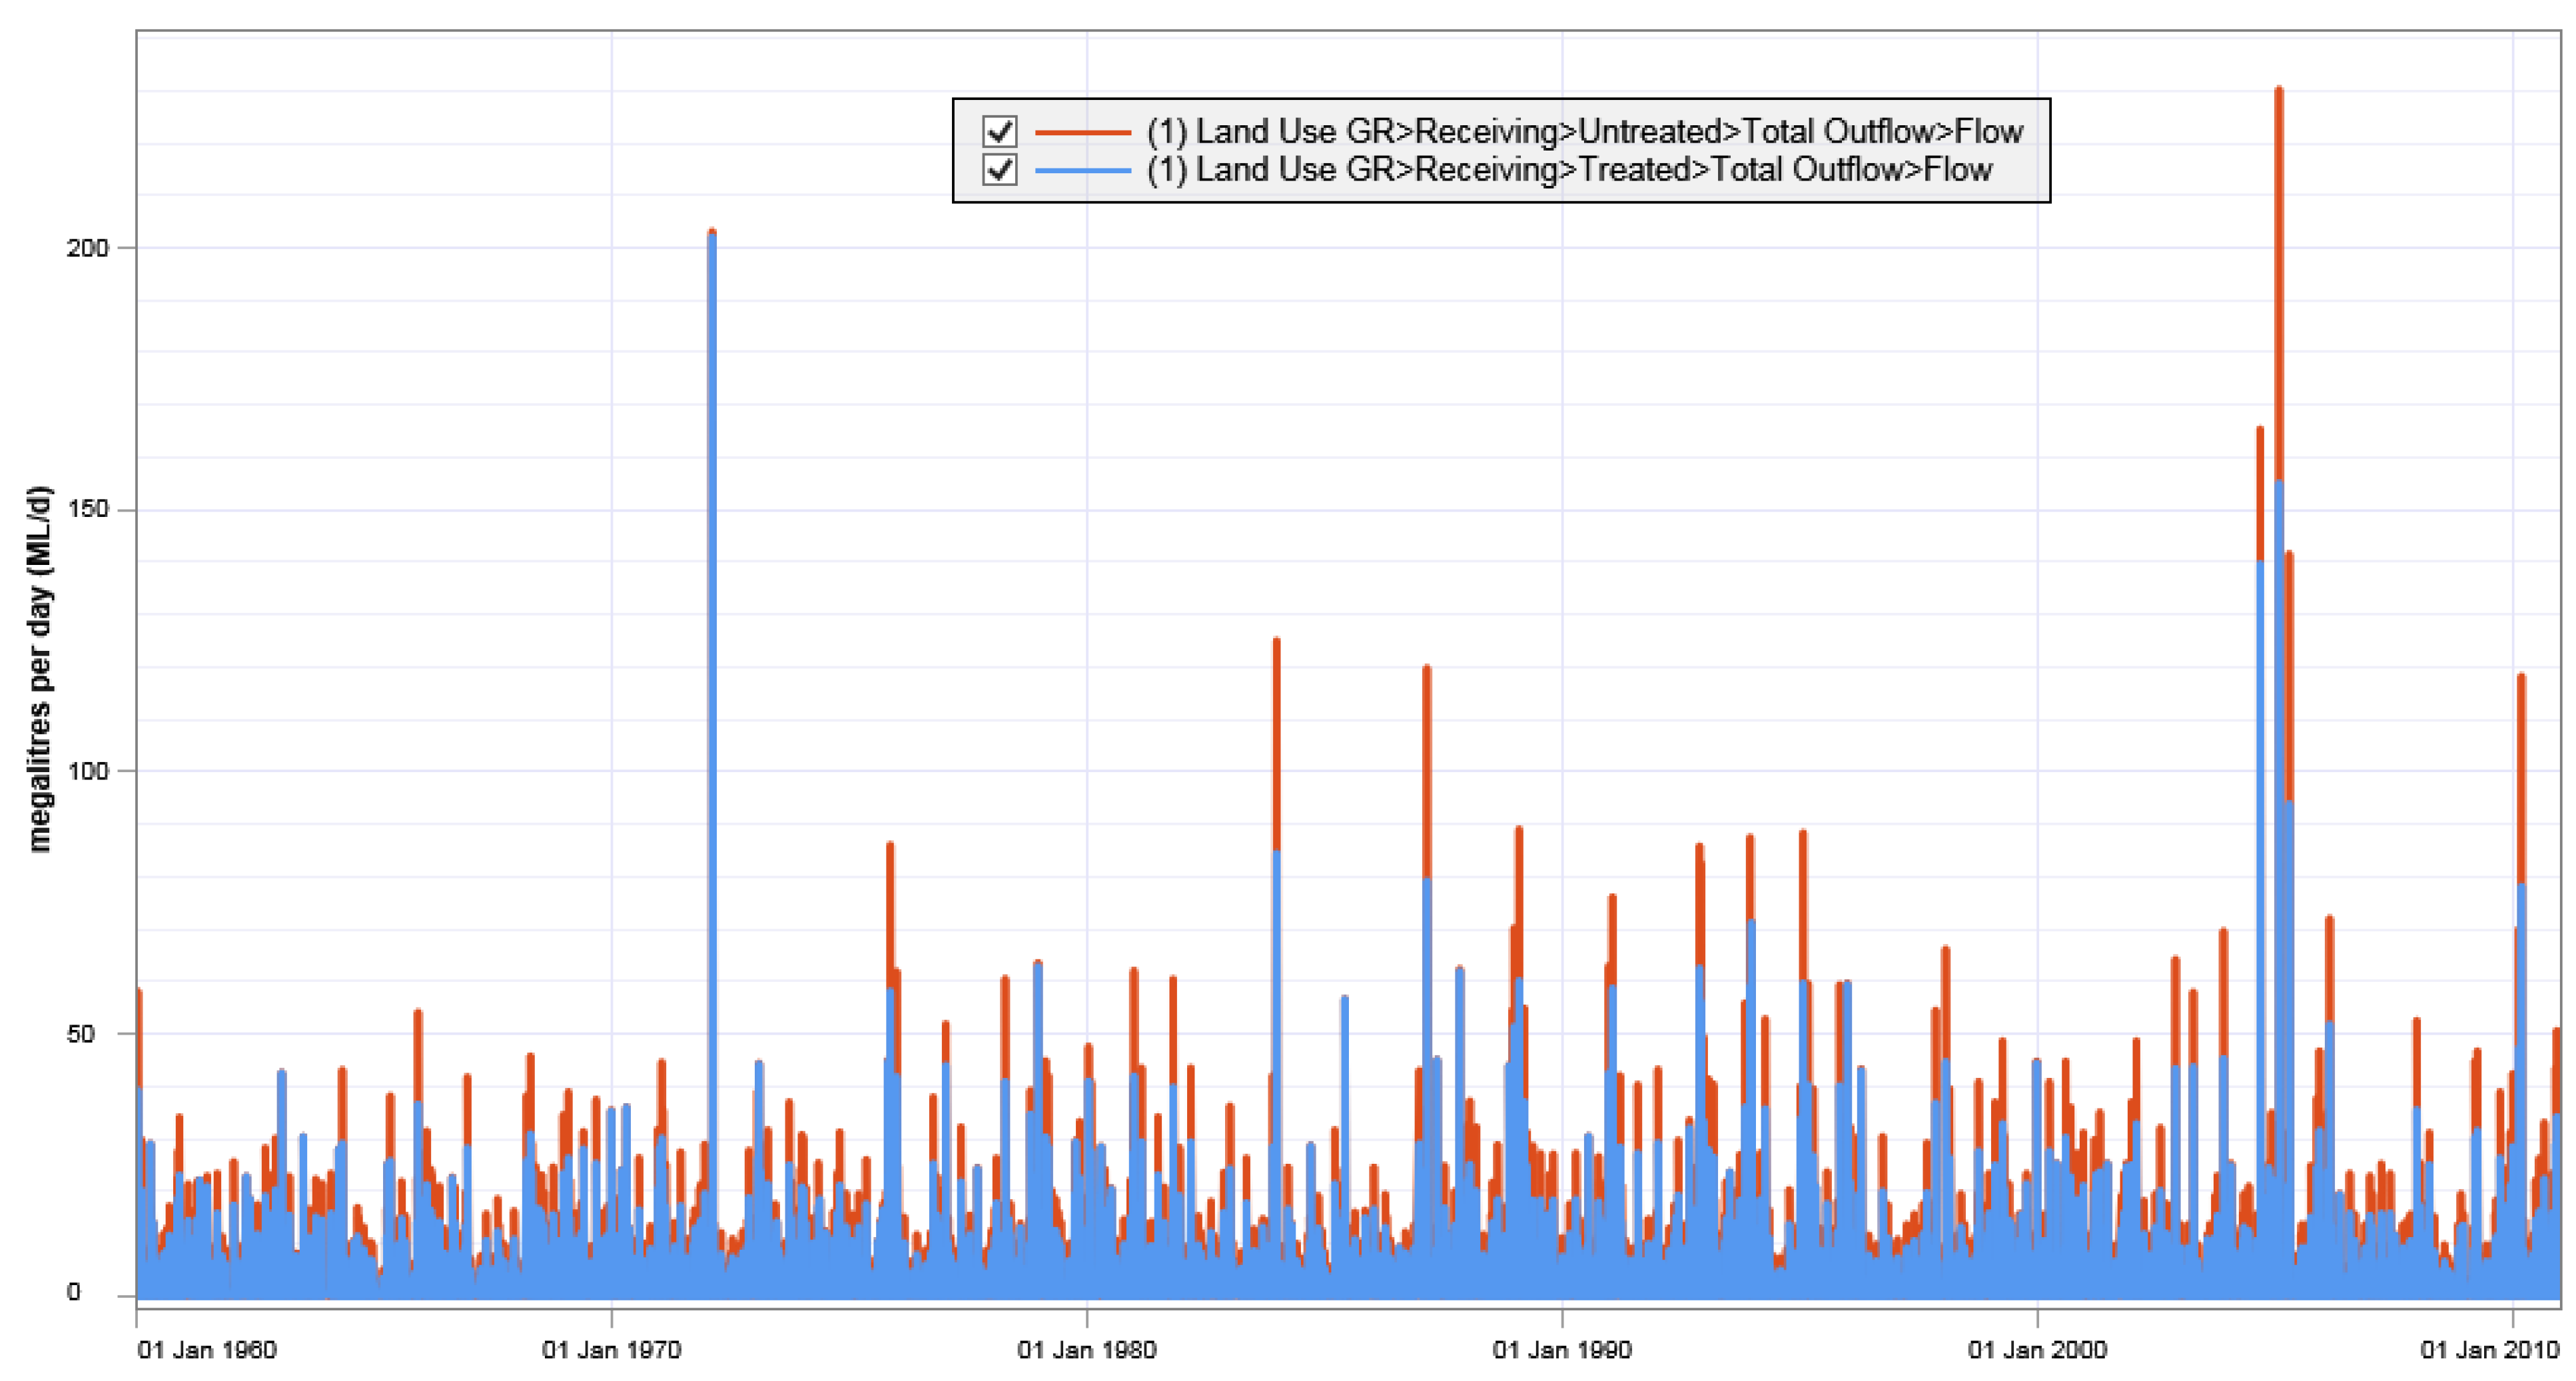
Figure 6 illustrates the MUSIC layout of green roof modeling based on the land use node. Due to the lack of a particular treatment node, two separate diagrams in the same model were created for the performance comparison. One including a source node representing the green roof has a receiving node called “Treated”. The other, describing different surface types at the VU campus catchment without green roof treatment, is finished with a receiving node called “Untreated”. The results from these two receiving nodes, “Treated” and “Untreated”, are presented in Figure 7. As expected, the “Treated” node completely outperformed the “Untreated” one. The presence of green roofs brings significant benefits, especially the reductions in flow volume and TN load of 29.29% and 28.23%, respectively.
3.2. GR Bioretention Node
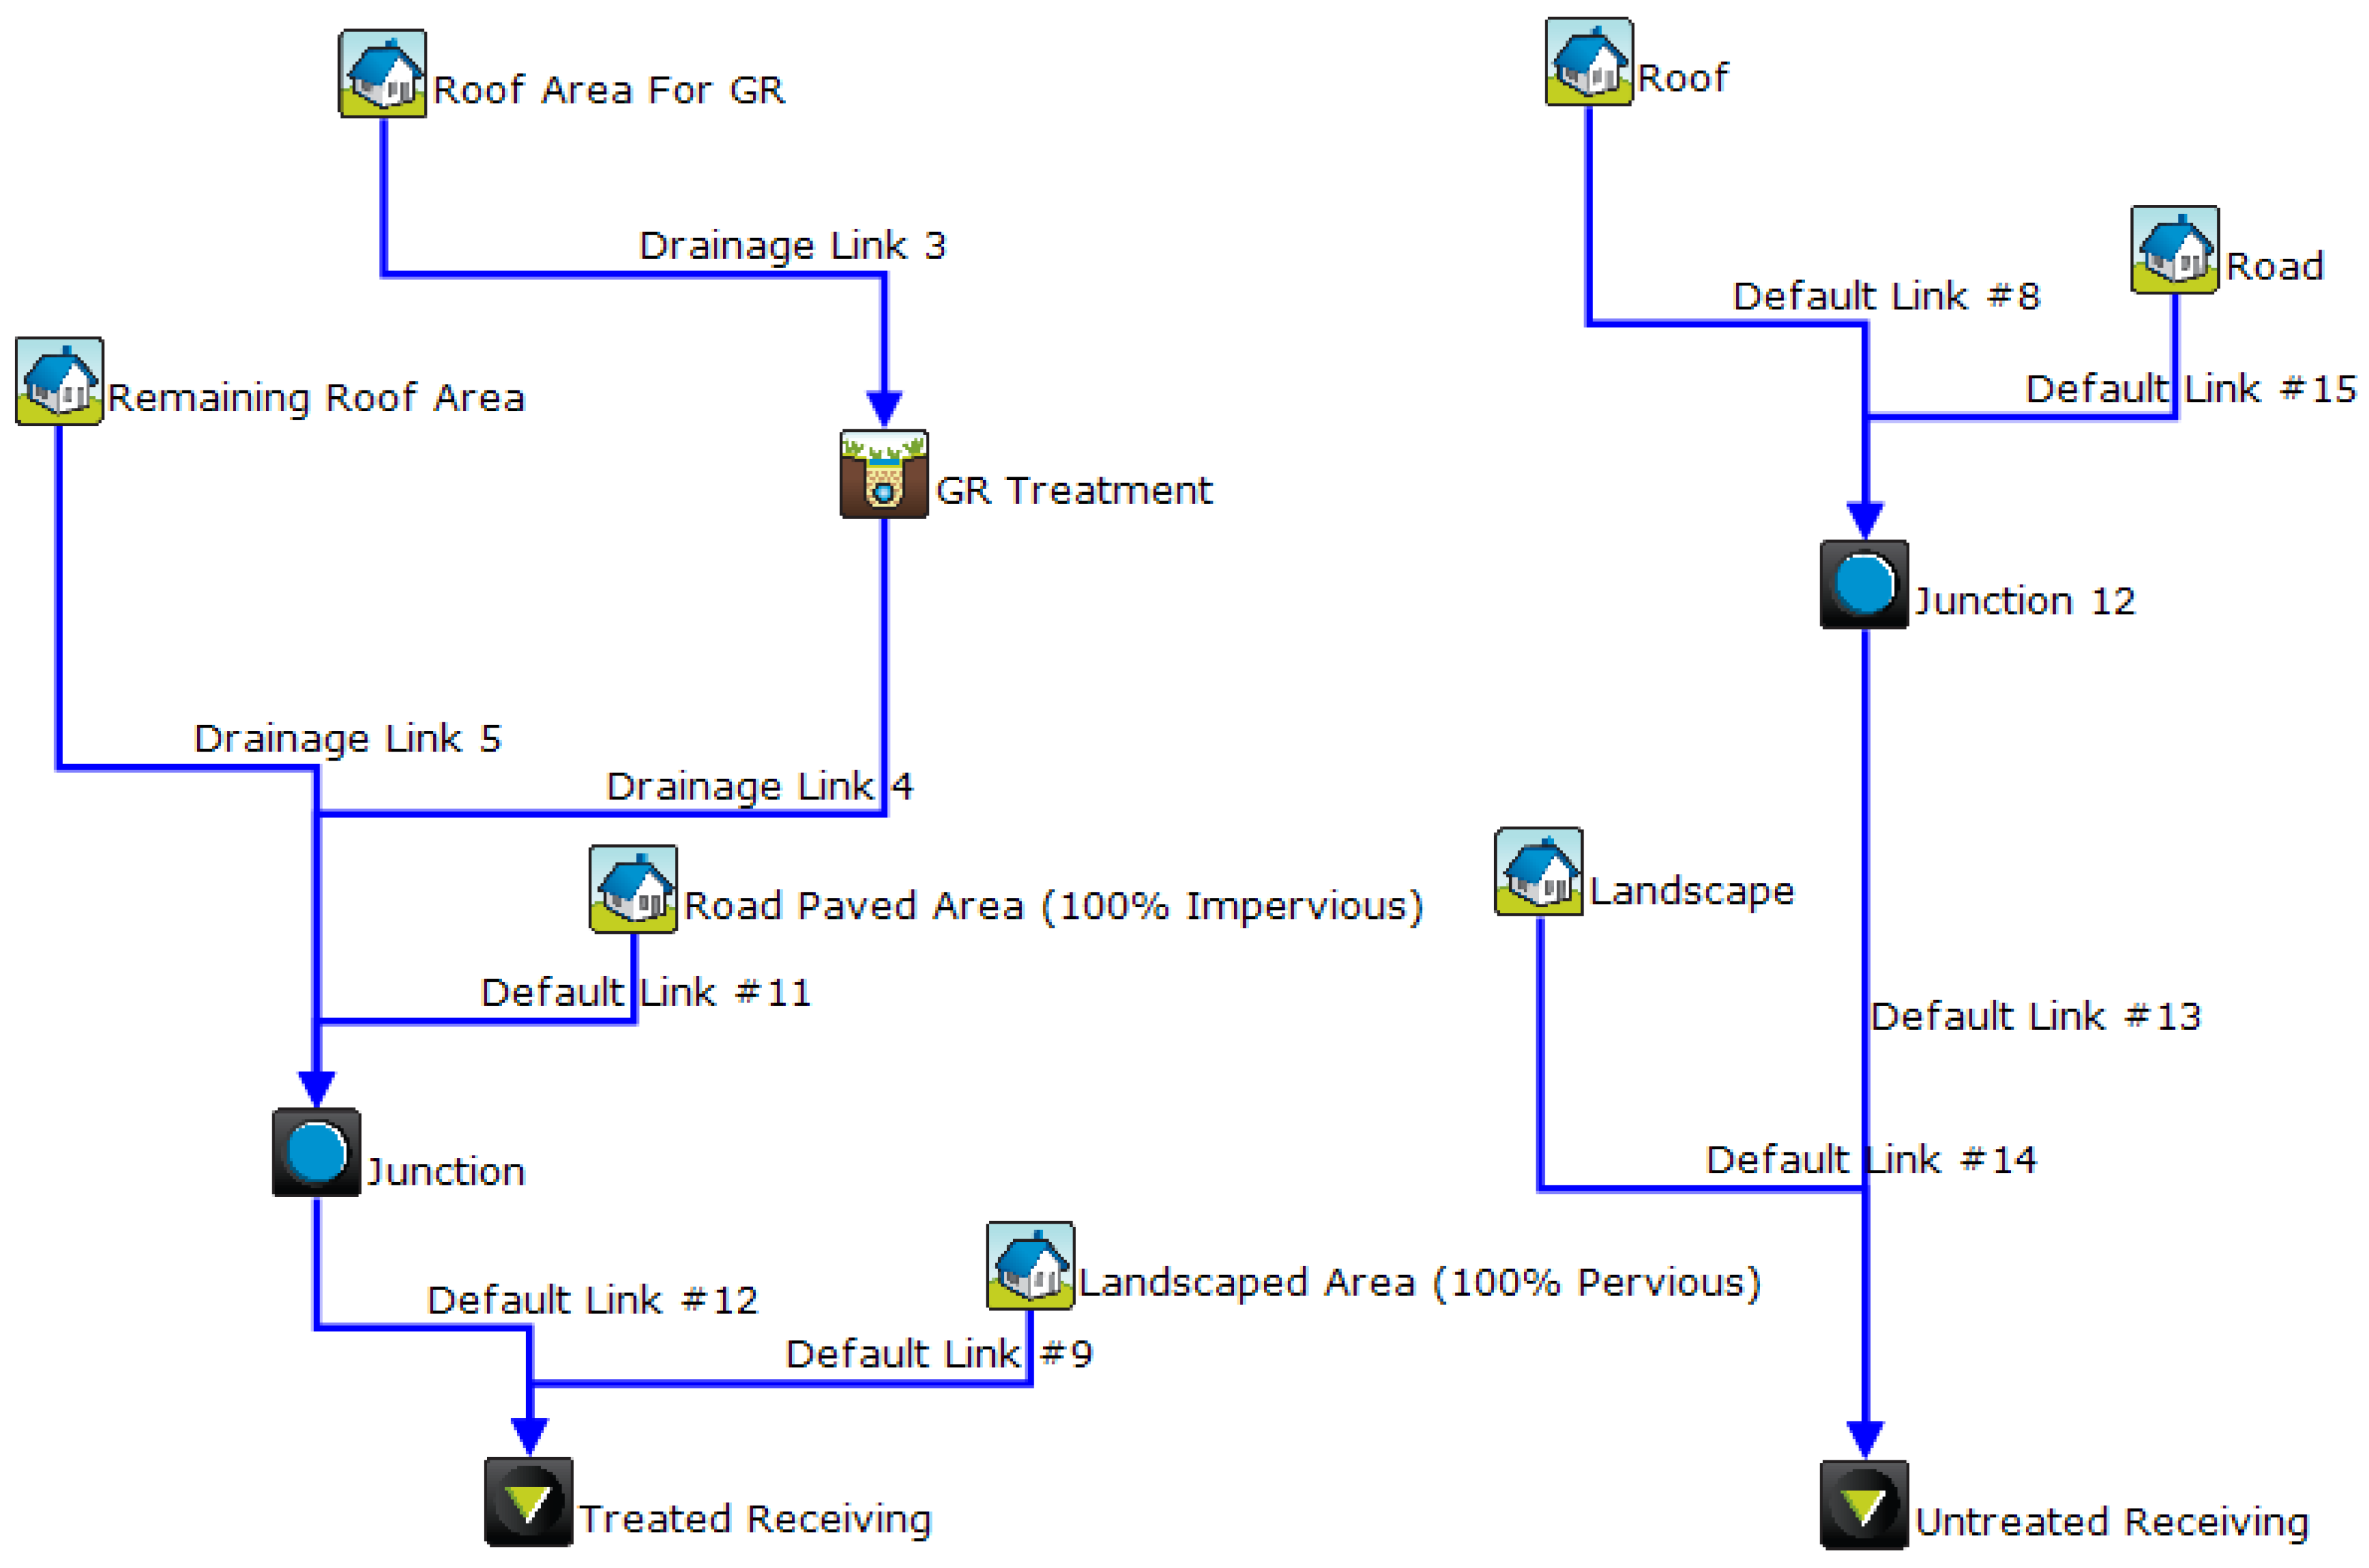
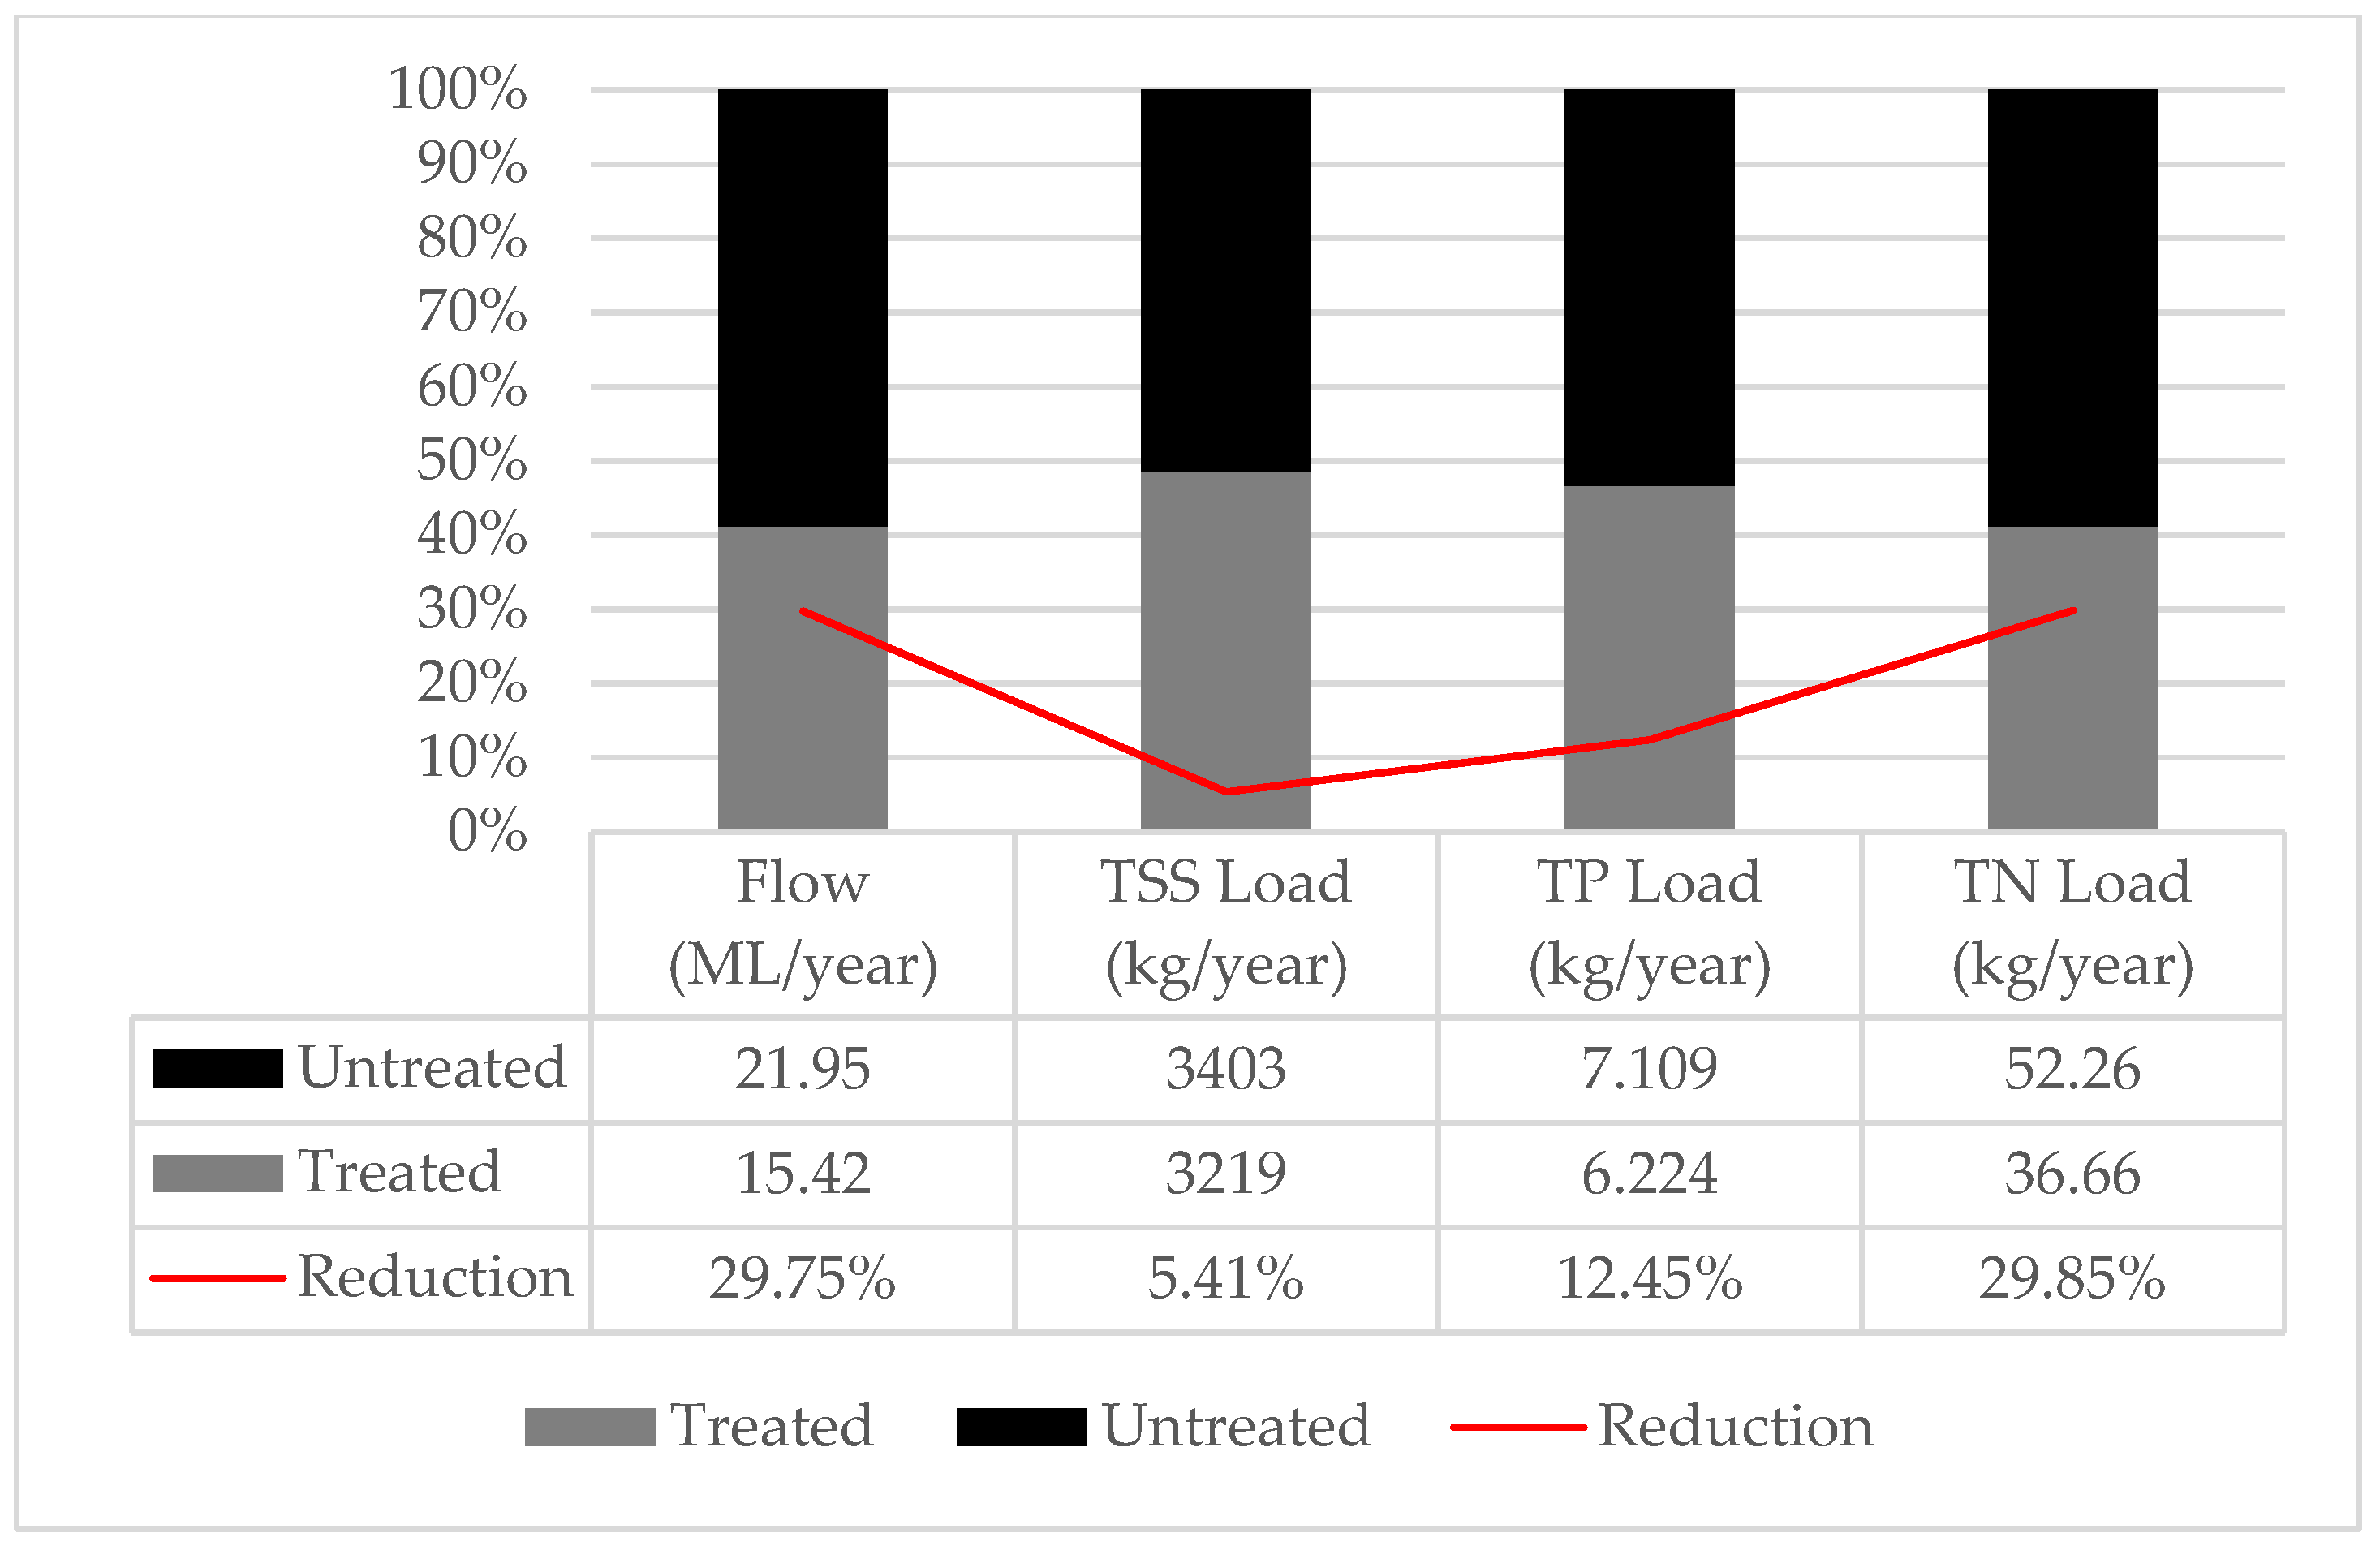
Figure 8 is the illustration of the MUSIC schematic diagram used to investigate the hydrological performance of GR through a bioretention node. Compared to the land-use-based approach, the bioretention-based one requires only one diagram since MUSIC understands bioretention as a treatment device and then directly produces outputs regarding the impacts of the treatment on the modeled catchment. However, another diagram without green roof treatment is still created for the purpose of comparing time-series outflows. Figure 9 summarizes the simulation results using the bioretention-based method. According to this, the application of GRs continues to lead to positive changes in both runoff quantity and quality. The flow volume (ML/year) and TN load (kg/year) again show the greatest reductions compared to others.
4. Discussion
4.1. Model Results
As presented earlier, the hydrological behavior of GRs was simulated using the land use and bioretention nodes in MUSICX. Figure 7 and Figure 9 show that there are negligible differences in outcome between these two approaches. This implies that they are likely to be used interchangeably to investigate the effects of large-scale implementation of GRs in MUSICX. The small impacts of GRs on the mitigation of TSS is worth mentioning. This could be because of the sediments primarily sourced from ground and road surfaces, whereas green roofs cover a small portion of the VU catchment. Additionally, the reductions in TSS, TP, and TN did not meet the stormwater quality management objectives as set out in the Environment Protection Authority (EPA) Victoria Guidelines (TSS: 80%, TP: 45%, and TN: 45%) [51]. The poor performance of VU’s large-scale GRs in terms of stormwater quality could be due to the insignificant area of GRs with only around 23% of the total catchment area of the VU’s campus. The large area of ground and hard surfaces greatly contributes to the sources of TSS, TP, and TN.
The above indicates that there is a need for green roofs to be combined with other green infrastructure responses to fully deliver on stormwater management objectives at the campus scale. Complementary green infrastructure assets such as swales, bioretention, and gross pollutant traps as well as sediment ponds and wetlands (where space allows) are recommended to be considered in order to meet the EPA targets. For example, a variety of stormwater treatment devices was proposed to be applied in a 3.9 ha residential area in Canberra, Australia [27]. The optimal scenario of bioretention, infiltration systems, swales, wetlands, and water tanks reduced loads of TSS, TP, and TN by 80%, 76%, and 65%, respectively. Noh, Mohd Sidek, Haron, Puad and Selamat [25] tested the performance of a treatment train of wetlands, bioretention, on-site detention, sediment basin, and gross pollutant traps in the Cameron Highlands District, Malaysia. The simulation results from MUSIC showed considerable reductions of 65–83%, 52–78%, and 40–66% for TSS, TP, and TN, respectively.
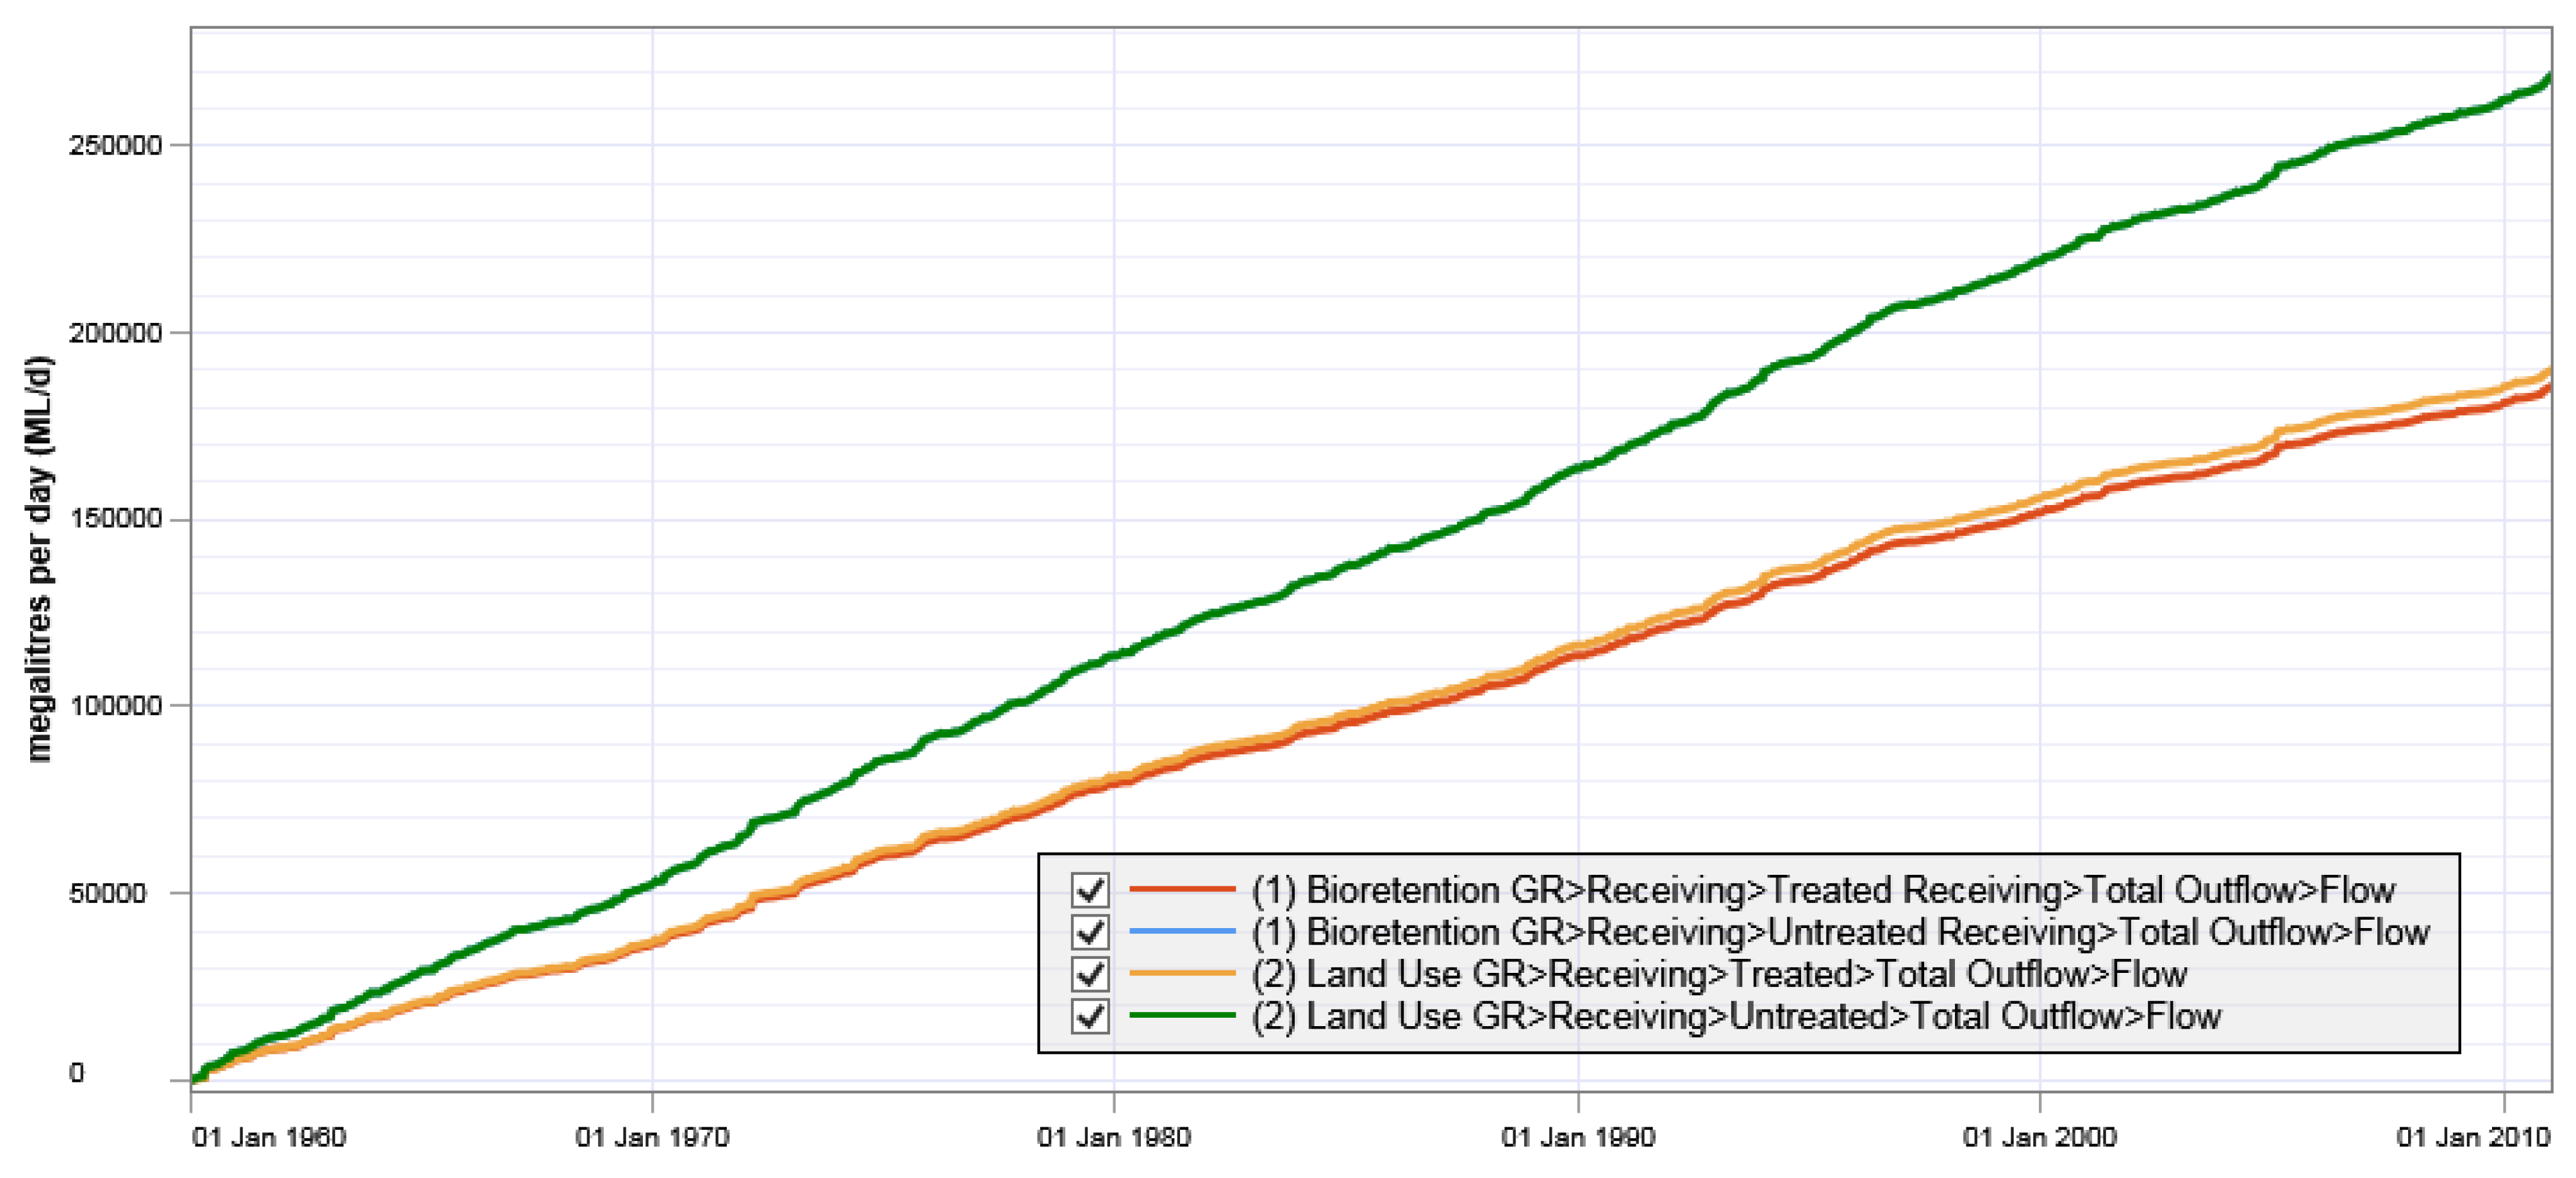
In addition to the requirements for improvements in stormwater quality, the EPA guidelines also recommend reductions in stormwater volumes [51]. These reductions vary by climate region and a reduction in stormwater volume of 29% through harvesting/evapotranspiration is recommended for VU’s Footscray Park Campus. It can be observed from Figure 7 and Figure 9 that the reduction in flow volumes using both the land use and bioretention nodes meet the EPA guideline requirements. Figure 10 illustrates a significant change in runoff volume before and after the application of GR on all existing buildings at the VU campus. The annual stormwater reduction is around 30% in both studied approaches in this paper. This is comparatively similar to other published results. For example, Versini, et al. [52] reported an averaged runoff reduction of 25.2% using a coupled conceptual and SWMM model. Roehr and Kong [53] reported 29% and 28% of runoff reduction per year with large-scale EGRs using low-water-use plants with an annual precipitation of 1200 mm and 1219 mm, respectively. A water-balance model was applied in this study. Runoff reduction from the application of EGRs throughout a Chinese city in Liu, et al. [54] fluctuated from 27% to 42% in different rainfall events, which was simulated with SWMM. However, the study of Barnhart, et al. [55] published a lower runoff reduction of only 10% to 15% and 20% to 25% yearly for EGR and IGR scenarios, respectively. Similar to runoff quality, runoff quantity (i.e., stormwater volume) could be further reduced by combining GRs with other WSUD strategies such as rainwater tanks and bioretention systems. Additionally, the results from [20] and [19] using MUSIC to model GRs are not comparable to this current study, since they were conducted at a building scale. Figure 11 further describes the difference between them in terms of cumulative flow volume. The difference in runoff quantity from the untreated scenarios can hardly be seen, whereas the runoff volume treated with the GR-bioretention node is slightly higher than that of the GR-land use node.
In some cases where modelers seek to obtain accurate results for runoff quantity, the land-use-based method is significantly preferable due to several hydraulic substrate characteristics that can be modified. Moreover, the land use node settings allow users to adjust the flow movements in the drainage layer as closely as possible to a typical GR system. When modelers focus on the improvement of runoff quality, the bioretention-based method should be applied. The bioretention node considerably differs from the land use node and it is a treatment device provided by MUSIC. Hence, it is capable of treating rainwater with its vegetated substrate. Accordingly, this node’s settings comprise nutritional characteristics such as TN and orthophosphate content and selections of either effective or ineffective nutrient-removal plants. There is a noticeable difference in the reductions in TSS and TN loads between the two adopted methods. It is also noteworthy that this node has inputs of SHC and PET scaling factor for specific plants, which play a major role in estimating runoff quantity. Nevertheless, model calibration against the monitoring data remains necessary to ensure the model’s accuracy and validity, which is discussed further in the following section. The above-suggested approaches should only be adopted when experimental data are not available.
4.2. Model Calibration
As stated previously, the calibration process is crucial in any model development. Regarding stormwater modeling, it requires calibration based on the flow data from the WSUD devices and climate parameters in the area of interest. Additionally, physical characteristics are required prior to the model calibration. The measurements of those parameters through soil tests have been reported to be expensive and time-consuming [56]. Moreover, a model is likely to perform effectively only within the timeframe in which it is completely adjusted to match the monitoring data through the model calibration process. Given that GR hydraulic properties are highly variable parameters over time, the developed models must deal with the ambiguous performance outside of the simulation period. The downward trend in SHC values is a good example of the significant changes in the substrate characteristics during its lifetime. Todorov, Driscoll and Todorova [50] reported SHC values of 17,000, 1080, and 684 mm/h in 2009, 2010, and 2012, respectively. The SHC of the substrate used in De-Ville, et al. [57] was reduced from 10,740 to 2658 mm/h in five years. Nevertheless, flow monitoring data and soil testing are importantly required, but arfe missing in the present study. They are goals of future work to strengthen the connection between the VU GR designs and the modeling settings, thereby enhance the modeling accuracy.
The parameter values used in model settings are even more complex. SHC and other parameters are well-calibrated to reproduce the observed data accurately. Therefore, they are different from the values either measured in the laboratory or provided by the supplier. The calibrated SHC in Versini, Ramier, Berthier and De Gouvello [52] is 104.7 mm/h, which is far less than the 1158 mm/h reported by the green roof supplier. Other papers using HYDRUS and SWMM modeling also reported similar calibrated values fluctuating only from 100 to 200 mm/h for SHC [54,56,58]. Since there are no published calibrated SHC for MUSIC modeling, 700 mm/h of SHC in this study was derived from other scholars’ values measured in the laboratory only. Elliott and Trowsdale [16] stated that no obvious advantages exist of one model over another, and the accuracy of both conceptual and physical hydrological models must be assured by proper calibrations. Future studies on GR modeling with MUSIC are suggested to measure hydraulic characteristics combined with the inflow/ outflow data from actual experiments to enhance the model validity.
HYDRUS and SWMM are the two physics-based modeling software that are most widely applied by researchers. Some noteworthy studies were carried out in [15,52,54,56,58,59]. By contrast, their applications to the large-scale simulation of GI devices remain limited, corresponding to a minimal number of papers studying green roofs at the catchment scale [3]. Versini, Ramier, Berthier and De Gouvello [52] pointed out that most efforts have been performed to reproduce the observed data of experimental GRs and investigate the catchment-scale hydrological effects of GRs through a simple extrapolation method. The complexity of physics-based models could explain this modeling gap. For example, computational constraints confront the application of SWMM in long-term continuous simulation at the catchment scale [18,56]. To be successfully implemented, SWMM is required to correctly calibrate approximately 12 parameters [15,60]. HYDRUS is not even suited for large-scale urban modeling due to the high computational requirements of fine temporal and spatial scales [17,23]. On the other hand, the nature of MUSIC is a conceptual-based model; hence, it has advantages over physics-based ones. A long continuous simulation period due to low computational costs and proper input values calibration could offset its simplicity. In general, none of the models totally prevails over others. A model is likely to perform efficiently in specific situations with appropriate modeling objectives.
4.3. Inclusion of Irrigation into Green Roof MUSIC Modeling
Irrigation is required to maintain the establishment and survival of GR vegetation. Therefore, it adds a considerable water volume to GR systems, resulting in more runoff and affecting GRs’ hydrological performance. The irrigation demand is thus reasonably involved in modeling. However, MUSIC does not have a specific function to simulate irrigation. Liebman, Wark and Mackay [20] successfully included the irrigation demand by modifying the rainfall template in MUSIC and using an imported node. Regardless of the substantial impact of irrigation on green roof hydrological performance, it is impossible to include irrigation in large-scale modeling in this study due to limitations of the currently used MUSICX version. Future studies are suggested to add irrigation to the rainfall template applied to a model containing GRs only. The imported node containing outputs of the GR-only model will be consecutively inputted into the main model for the whole catchment with the unmodified rainfall template.
With the release of newer versions of MUSICX, the following steps are suggested to be applied for an approximate estimation of the irrigation demand. The calculation of irrigation requires crop evapotranspiration (ETC). The ETC equation is:
where ET0 (mm d−1) is the reference evapotranspiration and Kc is the crop coefficient for specific crops.
PET and ET0 differ in terms of their developments, concepts, and equations, and they are used for different purposes [61]. To date, researchers are still struggling with using these two confusing terms. Referring to their concepts and development history, PET is utilized in the fields of hydrology and meteorology, while ET0 is commonly used for irrigation and agriculture [61]. The ET0 equation according to FAO-56 Method is [62]:
where T is the mean air temperature (°C), u2 is the wind speed (m s−1) at a height of 2 m above the ground, Rn is the net radiation flux (MJ m−2 d−1), G is the sensible heat flux into the soil (MJ m−2 d−1), Δ is the slope of the saturated vapor pressure curve, γ is the psychrometric constant (kPa °C−1), es is the mean saturation vapor pressure (kPa), and ea is the actual vapor pressure (kPa).
The calculation of ET0 is substantially complicated and requires the availability of various climate datasets. When data required to calculate ET0 are incomplete, PET, designed to be appropriate for MUSIC algorithms, is recommended for irrigation estimation.
The equation for the irrigation demand on a given day is:
where Ei is the irrigation system’s efficiency, R is the rainfall depth on a given day, and Er is the rainfall effectiveness. The values suggested by Connellan [63] for Ei, Er, and Kc are 0.75 (for sprinkle system), 0.5, and 0.4 (for drought-tolerant plants), respectively.
In practice, the irrigation interval should be calculated to determine when irrigation is required based on the plant available water (PAW) and the percentage allowable depletion (PAD). An Excel spreadsheet calculates the irrigation interval based on the PAW and PAD [63].
PAW is calculated to be 18.75 mm using a root zone depth of 150 mm and an available water holding capacity of 125 mm/h for Light Clay [29]. Connellan [63] also suggests using a PAD of 50%, which allows the irrigation to take place when the soil moisture is below 9.375 mm. This approach reflects the actual irrigation practice in which plants are not irrigated daily.
This method was successfully tested with a data period of 10 years. Many Excel functions were used to deal with the large number of calculation steps. Irrigation days and irrigation depths were explicitly determined. They were consecutively combined with the MUSIC 6 min rainfall data to reflect the precise amount of water going through the GR. Nevertheless, the inclusion of irrigation in a more extended data period is difficult given the limitations of Excel and other software may be needed to do this regularly. More particularly, this case requires advanced skills to load and edit the complete data in a large csv file. It would be preferable if an add-on program, plug-in, or feedback loop were implemented in MUSIC to support the representation of irrigation.
5. Conclusions
GRs have been extensively used worldwide in the recent past as compared to other varieties of GI as a potential strategy to address several social and environmental issues. GRs have been significantly studied during the last decade and the results show both its advantages as well as disadvantages.
Due to the existing research gap related to assessing GR performance at a large scale (i.e., scales exceeding the single-building scale), this paper attempts to investigate the hydrological effect of the implementation of GRs at the Footscray Park Campus of Victoria University in Melbourne, Australia. The simulation was carried out using eWater MUSICX, which is a modeling tool that is widely used in Australia. MUSICX possesses the advantages of a conceptual model with built-in Australian climate data and has a huge potential to effectively simulate the hydrological response of GRs at large scales.
Green roofs are still not very popular in Australia and there has been very little modeling of these green infrastructures to understand their benefits in terms of improvement in stormwater quality in the Australian context. This research presents the outcomes of continuous simulation modeling assessment, demonstrating that an existing model (namely MUSICX) can be adapted and used for this application. Thus, this paper aims to assess the performance of GRs using the MUSICX software and provides a simple but effective framework to inform investors and policy makers about the benefits of GRs, which is a prerequisite for widespread implementation of GRs. Additionally, this study attempted to evaluate the impacts of large-scale GRs on runoff quantity and quality on the campus. The simulation results showed a positive performance of GRs, especially with regard to the reduction in stormwater runoff volume. On the other hand, the combined use of GRs and other stormwater treatment devices is required to meet runoff quality objectives according to local stormwater guidelines.
The following is a summary of the key observations and recommendations obtained from this study:
- (a)
- The modeling results show that GR is effective in reducing runoff volume, TSS load, TP load, and TN load. While the largest reductions of roughly 30% are in runoff volume and TN load, the smallest reduction is in TSS load in both studied approaches;
- (b)
- Land use node and bioretention node approaches can be used interchangeably since the difference in MUSIC modeling outputs was found not to be substantial.
- (c)
- The land use node-based method is recommended to be applied when modelers focus on studying runoff quantity due to several simulation settings of the GR substrate’s hydraulic characteristics. On the other hand, the bioretention node-based method is preferable in runoff-quality-related research because of the modifications of plant types and nutritional characteristics of the GR substrate.
- (d)
- In this paper, the importance of model calibration is highlighted. Though no soil testing and flow monitoring data were obtained to calibrate the MUSIC-GR model, they are still part of future work to strengthen the connection between the VU GR design and modeling settings, thereby enhancing the modeling accuracy. On the other hand, concerns about the low accuracy of a model even with properly-calibrated parameters have also been discussed.
- (e)
- The application of GR for the entire VU campus area did not meet runoff quality objectives as set out in the EPA Victoria guidelines. Therefore, it is recommended that a treatment train including GR and other WSUD strategies be implemented to meet several stormwater management objectives.
- (f)
- Irrigation for the GR vegetation contributes to a substantial amount of GR runoff. This paper provides an explicit recommendation to include irrigation into MUSIC to model GRs more accurately.
Author Contributions
Conceptualization, C.N.N. and N.M.; methodology C.N.N., D.B. and N.M.; software, C.N.N., D.B. and N.M.; validation, C.N.N. and N.M.; formal analysis, C.N.N. and N.M.; investigation, C.N.N., D.B. and N.M.; resources, C.N.N. and N.M.; data curation, C.N.N.; writing—original draft preparation, C.N.N.; writing—review and editing, C.N.N., M.A.U.R.T., D.B. and N.M.; visualization, C.N.N.; supervision, N.M.; project administration, N.M.; funding acquisition, N.M. All authors have read and agreed to the published version of the manuscript.
Funding
This research received no external funding.
Data Availability Statement
Not applicable.
Conflicts of Interest
The authors declare no conflict of interest.
References
- Shafique, M.; Kim, R.; Rafiq, M. Green roof benefits, opportunities and challenges—A review. Renew. Sustain. Energy Rev. 2018, 90, 757–773. [Google Scholar] [CrossRef]
- Vijayaraghavan, K. Green roofs: A critical review on the role of components, benefits, limitations and trends. Renew. Sustain. Energy Rev. 2016, 57, 740–752. [Google Scholar] [CrossRef]
- Nguyen, C.N.; Muttil, N.; Tariq, M.A.U.R.; Ng, A.W. Quantifying the Benefits and Ecosystem Services Provided by Green Roofs—A Review. Water 2021, 14, 68. [Google Scholar] [CrossRef]
- Saadatian, O.; Sopian, K.; Salleh, E.; Lim, C.; Riffat, S.; Saadatian, E.; Toudeshki, A.; Sulaiman, M. A review of energy aspects of green roofs. Renew. Sustain. Energy Rev. 2013, 23, 155–168. [Google Scholar] [CrossRef]
- Akther, M.; He, J.; Chu, A.; Huang, J.; Van Duin, B. A review of green roof applications for managing urban stormwater in different climatic zones. Sustainability 2018, 10, 2864. [Google Scholar] [CrossRef] [Green Version]
- Van Mechelen, C.; Dutoit, T.; Hermy, M. Adapting green roof irrigation practices for a sustainable future: A review. Sustain. Cities Soc. 2015, 19, 74–90. [Google Scholar] [CrossRef]
- Hui, S.C.; Chan, S.-C. Integration of green roof and solar photovoltaic systems. In Proceedings of the Joint symposium 2011: Integrated Building Design in the New Era of Sustainability, Kowloon Shangri-la Hotel, Tsim Sha Tsui East, Kowloon, Hong Kong, 22 November 2011; pp. 1–12. [Google Scholar]
- Chemisana, D.; Lamnatou, C. Photovoltaic-green roofs: An experimental evaluation of system performance. Appl. Energy 2014, 119, 246–256. [Google Scholar] [CrossRef]
- Shafique, M.; Lee, D.; Kim, R. A field study to evaluate runoff quantity from blue roof and green blue roof in an urban area. Int. J. Control Autom. 2016, 9, 59–68. [Google Scholar] [CrossRef]
- Feitosa, R.C.; Wilkinson, S.J. Attenuating heat stress through green roof and green wall retrofit. Build. Environ. 2018, 140, 11–22. [Google Scholar] [CrossRef]
- Feitosa, R.C.; Wilkinson, S.J. Small-scale experiments of seasonal heat stress attenuation through a combination of green roof and green walls. J. Clean. Prod. 2020, 250, 119443. [Google Scholar] [CrossRef]
- Wilkinson, S.; Feitosa, R.C.; Kaga, I.T.; De Franceschi, I.H. Evaluating the thermal performance of retrofitted lightweight green roofs and walls in Sydney and Rio de Janeiro. Procedia Eng. 2017, 180, 231–240. [Google Scholar] [CrossRef]
- Xing, Q.; Hao, X.; Lin, Y.; Tan, H.; Yang, K. Experimental investigation on the thermal performance of a vertical greening system with green roof in wet and cold climates during winter. Energy Build. 2019, 183, 105–117. [Google Scholar] [CrossRef]
- Brunetti, G.; Šimůnek, J.; Piro, P. A comprehensive analysis of the variably saturated hydraulic behavior of a green roof in a mediterranean climate. Vadose Zone J. 2016, 15, vzj2016.04.0032. [Google Scholar] [CrossRef] [Green Version]
- Cipolla, S.S.; Maglionico, M.; Stojkov, I. A long-term hydrological modelling of an extensive green roof by means of SWMM. Ecol. Eng. 2016, 95, 876–887. [Google Scholar] [CrossRef]
- Elliott, A.; Trowsdale, S.A. A review of models for low impact urban stormwater drainage. Environ. Model. Softw. 2007, 22, 394–405. [Google Scholar] [CrossRef]
- Locatelli, L.; Mark, O.; Mikkelsen, P.S.; Arnbjerg-Nielsen, K.; Jensen, M.B.; Binning, P.J. Modelling of green roof hydrological performance for urban drainage applications. J. Hydrol. 2014, 519, 3237–3248. [Google Scholar] [CrossRef]
- Jayasooriya, V.; Ng, A. Tools for modeling of stormwater management and economics of green infrastructure practices: A review. Water Air Soil Pollut. 2014, 225, 2055. [Google Scholar] [CrossRef] [Green Version]
- Hannah, M.; Wicks, M.; O’Sullivan, A.; de Vries, T. Designing and Implementing Green Roofs for WSUD in Australasia. In Proceedings of the 8th International Water Senitive Urban Design Conference, Gold Coast, QLD, Australia, 25–29 November 2013. [Google Scholar]
- Liebman, M.; Wark, L.; Mackay, C. Modifying the Green Roof for Downunder; 2012. Available online: https://www.clearwatervic.com.au/user-data/resource-files/Liebman,-Mark-et-al---Non-Refereed-Paper.pdf (accessed on 24 November 2022).
- Zhang, K.; Bach, P.M.; Mathios, J.; Dotto, C.B.; Deletic, A. Quantifying the benefits of stormwater harvesting for pollution mitigation. Water Res. 2020, 171, 115395. [Google Scholar] [CrossRef]
- Williams, N.S.; Rayner, J.P.; Raynor, K.J. Green roofs for a wide brown land: Opportunities and barriers for rooftop greening in Australia. Urban For. Urban Green. 2010, 9, 245–251. [Google Scholar] [CrossRef]
- Soulis, K.X.; Valiantzas, J.D.; Ntoulas, N.; Kargas, G.; Nektarios, P.A. Simulation of green roof runoff under different substrate depths and vegetation covers by coupling a simple conceptual and a physically based hydrological model. J. Environ. Manag. 2017, 200, 434–445. [Google Scholar] [CrossRef]
- Ghofrani, Z.; Sposito, V.; Faggian, R. Maximising the value of natural capital in a changing climate through the integration of blue-green infrastructure. J. Sustain. Dev. Energy Water Environ. Syst. 2020, 8, 213–234. [Google Scholar] [CrossRef]
- Noh, N.; Sidek, L.; Haron, S.; Puad, A.; Selamat, Z. Pollutant loading analysis of suspended solid, nitrogen and phosphorus at bertam catchment, cameron highlands using MUSIC. Int. J. Eng. Technol. 2018, 7, 743–748. [Google Scholar] [CrossRef] [Green Version]
- Schubert, J.E.; Burns, M.J.; Fletcher, T.D.; Sanders, B.F. A framework for the case-specific assessment of Green Infrastructure in mitigating urban flood hazards. Adv. Water Resour. 2017, 108, 55–68. [Google Scholar] [CrossRef]
- Montaseri, M.; Afshar, M.H.; Bozorg-Haddad, O. Development of simulation-optimization model (MUSIC-GA) for urban stormwater management. Water Resour. Manag. 2015, 29, 4649–4665. [Google Scholar] [CrossRef]
- Melbourne Water. MUSIC Guidelines; Input Parameters and Modelling Approaches for MUSIC Users in Melbourne Water’s Service Area. State Goverment of Victoria, Melbourne, Australia, 2018. Available online: https://www.melbournewater.com.au/building-and-works/developer-guides-and-resources/guidelines-drawings-and-checklists/guidelines (accessed on 24 November 2022).
- Macleod, A. MUSIC calibration based on soils conditions. In Proceedings of the Stormwater Industry Association (SIA) NSW and Qld Joint Annual Conference, Gold Coast, QLD, Australia, 8–11 July 2018; 2008. [Google Scholar]
- Dotto, C.B.S.; Deletic, A.; McCarthy, D.; Fletcher, T. Calibration and sensitivity analysis of urban drainage models: MUSIC rainfall/runoff module and a simple stormwater quality model. Australas. J. Water Resour. 2011, 15, 85–94. [Google Scholar] [CrossRef]
- Chu, Y.; Yang, L.; Wang, X.; Wang, X.; Zhou, Y. Research on distribution characteristics, influencing factors, and maintenance effects of heavy metal accumulation in bioretention systems: Critical review. J. Sustain. Water Built Environ. 2021, 7, 03120001. [Google Scholar] [CrossRef]
- Vijayaraghavan, K.; Biswal, B.K.; Adam, M.G.; Soh, S.H.; Tsen-Tieng, D.L.; Davis, A.P.; Chew, S.H.; Tan, P.Y.; Babovic, V.; Balasubramanian, R. Bioretention systems for stormwater management: Recent advances and future prospects. J. Environ. Manag. 2021, 292, 112766. [Google Scholar] [CrossRef]
- Qin, Y.; Chen, M.; Li, X.; Qiu, J. Factors affecting the hydrological response of substrate material for green roofs and bioretention. In Proceedings of the IOP Conference Series: Earth and Environmental Science, Yinchuan, China, 19–21 September 2021; p. 012009. [Google Scholar]
- Goor, J.; Cantelon, J.; Smart, C.C.; Robinson, C.E. Seasonal performance of field bioretention systems in retaining phosphorus in a cold climate: Influence of prolonged road salt application. Sci. Total Environ. 2021, 778, 146069. [Google Scholar] [CrossRef]
- Payne, E.; Hatt, B.; Deletic, A.; Dobbie, M.; McCarthy, D.; Chandrasena, G. Adoption Guidelines for Stormwater Biofiltration systems—Summary Report; Cooperative Research Centre for Water Sensitive Cities: Clayton, VIC, Australia, 2015. [Google Scholar]
- Mainwright, C.W.; Weber, T. NSW MUSIC Modelling Guidelines; NSW Government, Greater Sysney Local Land Services: Wingham, NSW, Australia, 2015. [Google Scholar]
- Harper, G.E.; Limmer, M.A.; Showalter, W.E.; Burken, J.G. Nine-month evaluation of runoff quality and quantity from an experiential green roof in Missouri, USA. Ecol. Eng. 2015, 78, 127–133. [Google Scholar] [CrossRef]
- Kotsiris, G.; Nektarios, P.A.; Ntoulas, N.; Kargas, G. An adaptive approach to intensive green roofs in the Mediterranean climatic region. Urban For. Urban Green. 2013, 12, 380–392. [Google Scholar] [CrossRef]
- Nektarios, P.A.; Amountzias, I.; Kokkinou, I.; Ntoulas, N. Green roof substrate type and depth affect the growth of the native species Dianthus fruticosus under reduced irrigation regimens. HortScience 2011, 46, 1208–1216. [Google Scholar] [CrossRef] [Green Version]
- Palermo, S.A.; Turco, M.; Principato, F.; Piro, P. Hydrological effectiveness of an extensive green roof in Mediterranean climate. Water 2019, 11, 1378. [Google Scholar] [CrossRef] [Green Version]
- Zhang, Z.; Szota, C.; Fletcher, T.D.; Williams, N.S.; Farrell, C. Green roof storage capacity can be more important than evapotranspiration for retention performance. J. Environ. Manag. 2019, 232, 404–412. [Google Scholar] [CrossRef]
- Vijayaraghavan, K.; Raja, F.D. Pilot-scale evaluation of green roofs with Sargassum biomass as an additive to improve runoff quality. Ecol. Eng. 2015, 75, 70–78. [Google Scholar] [CrossRef]
- Johannessen, B.G.; Muthanna, T.M.; Braskerud, B.C. Detention and retention behavior of four extensive green roofs in three nordic climate zones. Water 2018, 10, 671. [Google Scholar] [CrossRef] [Green Version]
- Hakimdavar, R.; Culligan, P.J.; Finazzi, M.; Barontini, S.; Ranzi, R. Scale dynamics of extensive green roofs: Quantifying the effect of drainage area and rainfall characteristics on observed and modeled green roof hydrologic performance. Ecol. Eng. 2014, 73, 494–508. [Google Scholar] [CrossRef]
- Arellano-Leyva, E.A.; López-Portillo, M.; Muñoz-Villers, L.E.; Prado-Pano, B.L. Rainfall retention and runoff generation processes in tropical mature green roof ecosystems. Hydrol. Process. 2021, 35, e14382. [Google Scholar] [CrossRef]
- Sims, A.W.; Robinson, C.E.; Smart, C.C.; O’Carroll, D.M. Mechanisms controlling green roof peak flow rate attenuation. J. Hydrol. 2019, 577, 123972. [Google Scholar] [CrossRef]
- Voyde, E.; Fassman, E.; Simcock, R. Hydrology of an extensive living roof under sub-tropical climate conditions in Auckland, New Zealand. J. Hydrol. 2010, 394, 384–395. [Google Scholar] [CrossRef]
- Hamouz, V.; Lohne, J.; Wood, J.R.; Muthanna, T.M. Hydrological performance of LECA-based roofs in cold climates. Water 2018, 10, 263. [Google Scholar] [CrossRef]
- De-Ville, S.; Menon, M.; Stovin, V. Temporal variations in the potential hydrological performance of extensive green roof systems. J. Hydrol. 2018, 558, 564–578. [Google Scholar] [CrossRef] [Green Version]
- Todorov, D.; Driscoll, C.T.; Todorova, S. Long-term and seasonal hydrologic performance of an extensive green roof. Hydrol. Process. 2018, 32, 2471–2482. [Google Scholar] [CrossRef]
- Urban Stormwater Management Guidelines by Environmental Protection Authority (EPA) Victoria. 2021. Available online: https://www.epa.vic.gov.au/about-epa/publications/1739-1 (accessed on 24 October 2022).
- Versini, P.-A.; Ramier, D.; Berthier, E.; De Gouvello, B. Assessment of the hydrological impacts of green roof: From building scale to basin scale. J. Hydrol. 2015, 524, 562–575. [Google Scholar] [CrossRef] [Green Version]
- Roehr, D.; Kong, Y. Runoff reduction effects of green roofs in Vancouver, BC, Kelowna, BC, and Shanghai, PR China. Can. Water Resour. J. 2010, 35, 53–68. [Google Scholar] [CrossRef] [Green Version]
- Liu, L.; Sun, L.; Niu, J.; Riley, W.J. Modeling green roof potential to mitigate urban flooding in a Chinese city. Water 2020, 12, 2082. [Google Scholar] [CrossRef]
- Barnhart, B.; Pettus, P.; Halama, J.; McKane, R.; Mayer, P.; Djang, K.; Brookes, A.; Moskal, L.M. Modeling the hydrologic effects of watershed-scale green roof implementation in the Pacific Northwest, United States. J. Environ. Manag. 2021, 277, 111418. [Google Scholar] [CrossRef]
- Baek, S.; Ligaray, M.; Pachepsky, Y.; Chun, J.A.; Yoon, K.-S.; Park, Y.; Cho, K.H. Assessment of a green roof practice using the coupled SWMM and HYDRUS models. J. Environ. Manag. 2020, 261, 109920. [Google Scholar] [CrossRef]
- De-Ville, S.; Menon, M.; Jia, X.; Reed, G.; Stovin, V. The impact of green roof ageing on substrate characteristics and hydrological performance. J. Hydrol. 2017, 547, 332–344. [Google Scholar] [CrossRef]
- Carson, T.; Keeley, M.; Marasco, D.E.; McGillis, W.; Culligan, P. Assessing methods for predicting green roof rainfall capture: A comparison between full-scale observations and four hydrologic models. Urban Water J. 2017, 14, 589–603. [Google Scholar] [CrossRef]
- Sun, T.; Bou-Zeid, E.; Wang, Z.-H.; Zerba, E.; Ni, G.-H. Hydrometeorological determinants of green roof performance via a vertically-resolved model for heat and water transport. Build. Environ. 2013, 60, 211–224. [Google Scholar] [CrossRef]
- Haghighatafshar, S.; Yamanee-Nolin, M.; Larson, M. A physically based model for mesoscale SuDS–an alternative to large-scale urban drainage simulations. J. Environ. Manag. 2019, 240, 527–536. [Google Scholar] [CrossRef]
- Xiang, K.; Li, Y.; Horton, R.; Feng, H. Similarity and difference of potential evapotranspiration and reference crop evapotranspiration—A review. Agric. Water Manag. 2020, 232, 106043. [Google Scholar] [CrossRef]
- Zotarelli, L.; Dukes, M.D.; Romero, C.C.; Migliaccio, K.W.; Kelly, T.R. Step by Step Calculation of the Penman-Monteith Evapotranspiration (FAO-56 Method) 1. Ph.D. Thesis, University of Florida, Gainesville, FL, USA, 2015. [Google Scholar]
- Connellan, G. Water Use Efficiency for Irrigated Turf and Landscape; CSIRO Publishing: Collingwood, VIC, Australia, 2013; p. 433. [Google Scholar]
Figure 1.
Details of green roof plots on Building M at Victoria University’s Footscray Park Campus: (a) Green roof design, (b) Actual constructed green roof.
Figure 1.
Details of green roof plots on Building M at Victoria University’s Footscray Park Campus: (a) Green roof design, (b) Actual constructed green roof.

Figure 2.
Details of flat roof areas, landscape areas, and stormwater drainage system at VU’s Footscray Park Campus.
Figure 2.
Details of flat roof areas, landscape areas, and stormwater drainage system at VU’s Footscray Park Campus.

Figure 3.
A framework for evaluating the performance of large-scale green roofs in terms of runoff quantity and quality.
Figure 3.
A framework for evaluating the performance of large-scale green roofs in terms of runoff quantity and quality.

Figure 4.
A cross-section of VU’s green roof selected for modeling in this study.

Figure 5.
The 6 min rainfall data during the study period from 1 January 1960 to 31 December 2010.

Figure 6.
MUSIC schematic of green roof modeling using the land use node.

Figure 7.
The green roof treatment effectiveness using the land use node approach.

Figure 8.
MUSIC schematic of green roof modeling using the bioretention node.

Figure 9.
Green roof treatment effectiveness based on the bioretention node approach.

Figure 10.
Comparison of outflow volume between treated and untreated scenarios using the land use node.
Figure 10.
Comparison of outflow volume between treated and untreated scenarios using the land use node.

Figure 11.
Cumulative runoff volume from the land use node and bioretention node approaches.

Table 2.
Catchment characteristics of VU’s Footscray Park Campus.
| Catchment Characteristic | Area (m2) |
|---|---|
| Total Roof Area | 22,018 |
| Total Flat Roof Area | 15,873 |
| Potential GR Area | 13,159.5 |
| Roof Area Without GR | 8858.5 |
| Pervious Area (Landscape) | 8526 |
| Impervious Area (Road, Paved Pathway, etc.) | 26456 |
| Effective Impervious Area | 18,519.2 |
| Pervious Area + Ineffective Impervious Area | 16,462.8 |
| Total VU Catchment Area | 57,000 |
Table 3.
Soil characteristics for the green roof in MUSIC’s land use node.
| Parameter | Value | Reference |
|---|---|---|
| Soil Moisture Storage Capacity (mm) | 29.46 | [29] |
| Field Capacity (mm) | 26.71 | [29] |
| “a” coefficient (mm/day) | 200 | [29] |
| “b” coefficient | 3 | [29] |
| Daily Recharge Rate (%) | 90 | [29] |
| Daily Baseflow Rate (%) | 5 | [29] |
Table 5.
Saturated hydraulic conductivity values for different substrate types as reported in the literature.
Table 5.
Saturated hydraulic conductivity values for different substrate types as reported in the literature.
| Study | Saturated Hydraulic Conductivity—SHC (mm/h) | Substrate Composition |
|---|---|---|
| Sims, et al. [46] | 604.8 | Expanded shale (coarse and fine) 50%, compost (bark and peat moss) 25%, and sand, limestone, and expanded clay |
| Voyde, et al. [47] | 1224 | Pumice 4–10 mm (20%), pumice 1–7 mm (20%), Expanded clay (40%), and composted bark fines (20%) |
| Hakimdavar, Culligan, Finazzi, Barontini and Ranzi [44] | 756 | Expanded-shale-based |
| Hamouz, et al. [48] | 1432 | LECA-based |
| De-Ville, et al. [49] | 2100 | LECA (80%), loam (10%), and compost (10%) |
| Arellano-Leyva, López-Portillo, Muñoz-Villers and Prado-Pano [45] | 351.8 ± 275.9/571.1 ± 290.9 | Gravel, volcanic rock mixed with clay, coconut fiber, compost, and soil with sandy loam texture |
| Todorov, et al. [50] | 17,000, 1080, 684 (2009, 2010, 2012) | NA |
| Palermo, Turco, Principato and Piro [40] | 0, 1667, and 1250 (min, max, value) | A mineral soil with 74% gravel, 22% sand, 4% silt, and clay |
Table 6.
Soil characteristics for the green roof in MUSIC’s bioretention node.
| Parameter | Value | Reference |
|---|---|---|
| Saturated Hydraulic Conductivity (SHC) (mm/h) | 700 | [28,35,36] |
| TN Content (mg/kg) | 200 | [35,36] |
| Orthophosphate Content (mg/kg) | 30 | [35,36] |
| Is base lined? | Yes | NA |
| Exfiltration Rate (mm/h) | 0 | NA |
| Underdrain Present | Yes | NA |
| Extended Detention Depth (m) | 0.05 | NA |
| Unlined Filter Media Perimeter (m) | 0.01 | [36] |
| Vegetated with Ineffective Nutrient Removal Plants | Yes | NA |
| PET scaling factor | 1.5 | NA |
Disclaimer/Publisher’s Note: The statements, opinions and data contained in all publications are solely those of the individual author(s) and contributor(s) and not of MDPI and/or the editor(s). MDPI and/or the editor(s) disclaim responsibility for any injury to people or property resulting from any ideas, methods, instructions or products referred to in the content. |
© 2023 by the authors. Licensee MDPI, Basel, Switzerland. This article is an open access article distributed under the terms and conditions of the Creative Commons Attribution (CC BY) license (https://creativecommons.org/licenses/by/4.0/).
Share and Cite
MDPI and ACS Style
Nguyen, C.N.; Tariq, M.A.U.R.; Browne, D.; Muttil, N. Performance Evaluation of Large-Scale Green Roofs Based on Qualitative and Quantitative Runoff Modeling Using MUSICX. Water 2023, 15, 549. https://doi.org/10.3390/w15030549
AMA Style
Nguyen CN, Tariq MAUR, Browne D, Muttil N. Performance Evaluation of Large-Scale Green Roofs Based on Qualitative and Quantitative Runoff Modeling Using MUSICX. Water. 2023; 15(3):549. https://doi.org/10.3390/w15030549
Chicago/Turabian StyleNguyen, Cuong Ngoc, Muhammad Atiq Ur Rehman Tariq, Dale Browne, and Nitin Muttil. 2023. "Performance Evaluation of Large-Scale Green Roofs Based on Qualitative and Quantitative Runoff Modeling Using MUSICX" Water 15, no. 3: 549. https://doi.org/10.3390/w15030549
Note that from the first issue of 2016, this journal uses article numbers instead of page numbers. See further details here.