1. Introduction
Urbanisation has a significant impact on the natural hydrologic cycle in urban cities due to impervious surfaces [
1]. These effects include reduced evapotranspiration, infiltration, groundwater recharge, and increased surface runoff [
1,
2]. When runoff volume exceeds the carrying capacity of the drainage system, urban areas experience flooding of varied severity depending on the intensity of rainfall. Further, stormwater runoff delivered to the receiving waters via drainage pipes has negative consequences for in-stream biota and water quality. With increased threats to public safety and damage to infrastructure and the environment, there is a greater need to manage stormwater at the source of generation to prevent shifting the problem downstream.
Many stormwater management practices have been developed to address these issues, including permeable pavements, swales, rain gardens, green roofs, and rainwater tanks—collectively called water sensitive urban design (WSUD) in Australia. These practices integrate sustainable water management and urban planning to protect water quality, restore water balance, and reduce hydromodification (peak flows and runoff volumes) [
3]. Among these systems, permeable pavements are designed to enhance stormwater infiltration without consuming any land area [
1] and are appropriate for a range of industrial, commercial, and residential applications based on the material and different design configurations [
4]. The multiple benefits provided by PP include enhanced stormwater infiltration, baseflow recharge, and flood reduction while maintaining regular use of the land area. There are three major types of permeable pavements, called porous concrete, porous asphalt, and permeable interlocking concrete paving [
5].
Approximately 25% of impervious surfaces in urban catchments comprise of impervious pavement, making them a major producer of runoff [
6,
7]. Retrofitting these areas by permeable pavements is one potential solution to reduce the risk of flooding by increasing the time of concentration (the time at which peak flow is reached) and decreasing the hydraulic efficiency of the catchment (disconnecting impervious surfaces) [
7]. Permeable pavements have been shown to reduce peak flows for frequent storms of lower intensity by allowing on-site storage of water for reuse or to provide baseflows [
8,
9,
10,
11]. These pavements can be laid in locations usually occupied by roads, parking lots, and walkways [
12]. Permeable pavements generally consist of pavers, which have small, structured voids in the surface to allow for the infiltration of runoff. There are four main components or layers of permeable pavement systems: pavers, bedding layer, base material layer, and subgrade or underlying soil [
4]. It is common to include a geotextile membrane layer between the bedding and base material to discourage the mixing and migrating of sand from the bedding layer into the base filter media [
13]. The systems can be constructed with an underdrain, whereby water is collected via a drainage pipe or without an underdrain, in which case all water infiltrates into the underlying soil [
13]. Common applications of permeable pavement systems include residential driveways, car parks, pedestrian walkways, bicycle trails, slope stabilisation and erosion control and land irrigation [
14].
While PP systems have been widely investigated from a water quality perspective, there is limited understanding of their performance to reduce critical storm events at the watershed scale. With larger flooding events projected to occur more frequently as a result of urbanisation and climate change, PP systems have the potential to mitigate floss by reducing peak flows and runoff volumes. This research aims to address this knowledge gap by investigating the performance of permeable pavements under a range of storm events and land-use scenarios. The scenarios considered in this research comprise rainfall events ranging in duration from 10 min to 24 h and average recurrence interval (ARI) (5, 20, and 100 year ARI). Land-use changes that can vary the impervious area within the catchment have also been modelled. Further, we also simulated the effects of significant clogging to the permeable pavement system over time. The performance of permeable pavements under these predictive hydrological scenarios is envisioned to assist councils and stormwater managers in selecting the appropriate stormwater management measures. The research employs eWater’s model for stormwater improvement conceptualisation (MUSIC) to investigate the capability of permeable pavements to reduce peak flows and runoff volumes for mitigating floods downstream.
2. Methodology
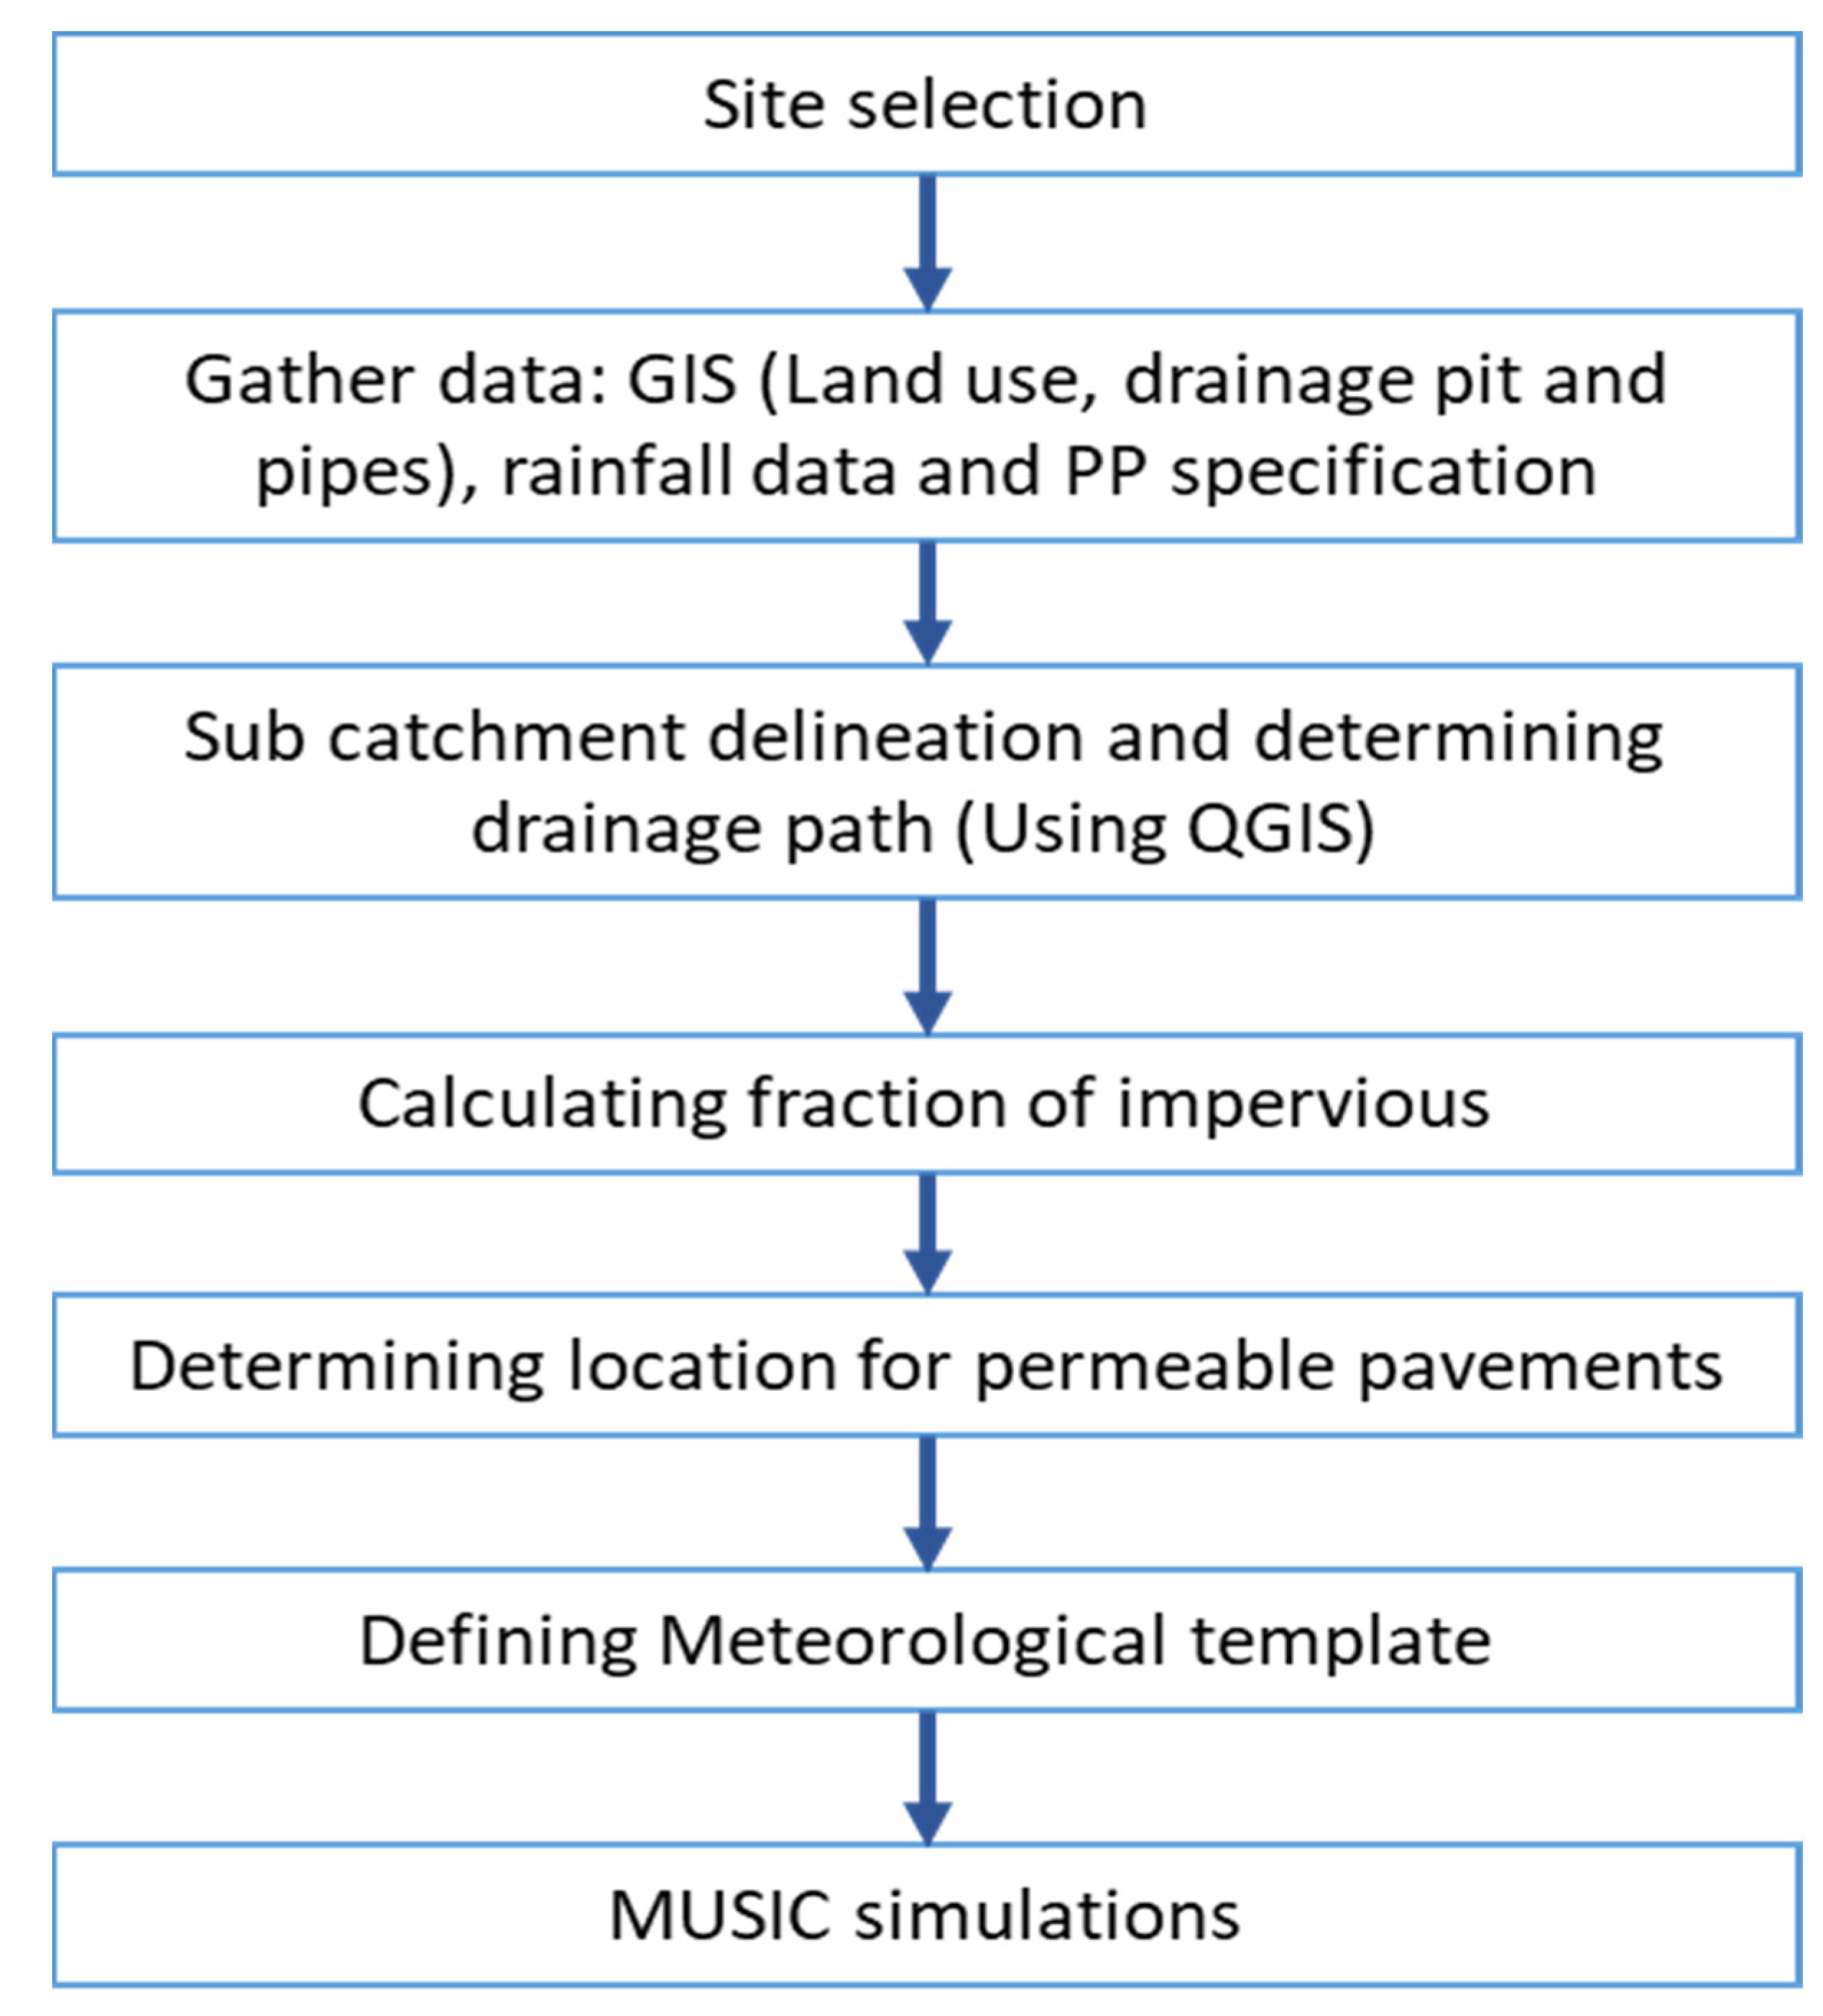
Figure 1 presents the stepwise methodology adopted for this study.
2.1. Study Site
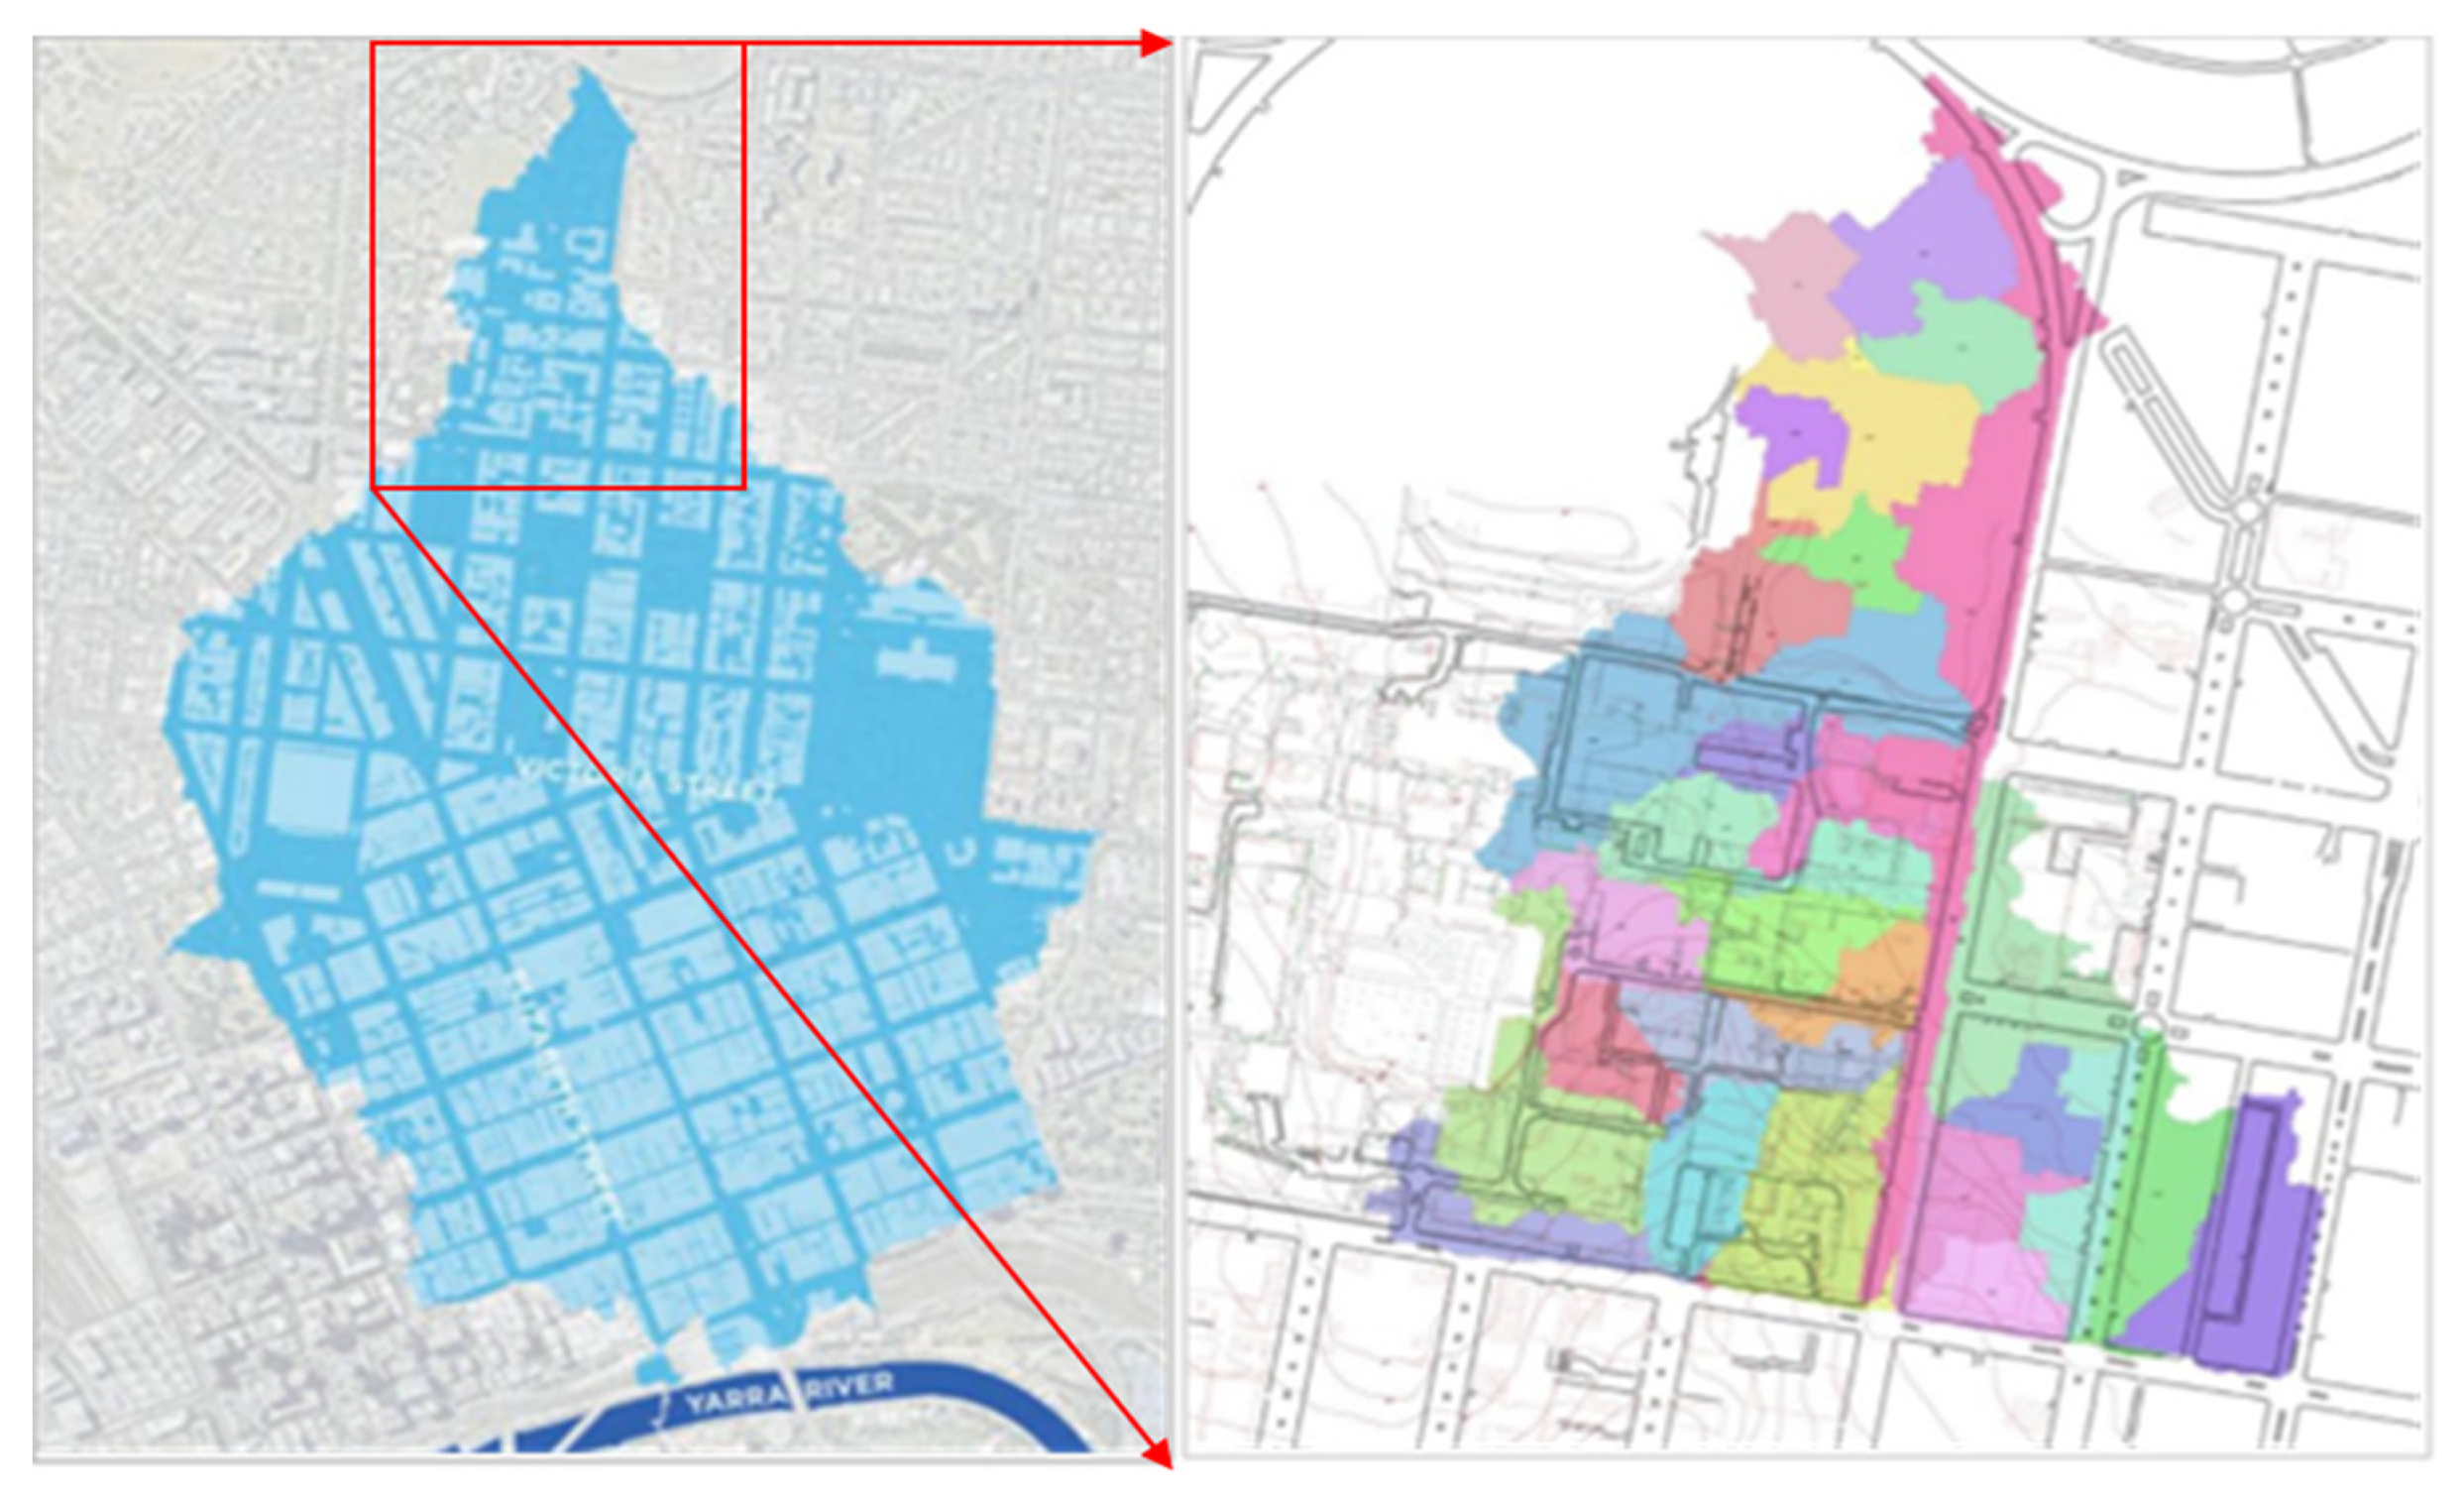
This study was carried out within one of the most urbanised catchments in Melbourne, Australia: the Elizabeth Street Catchment. Elizabeth Street was built upon a historically natural creek and is the lowest point in the Melbourne CBD. The Elizabeth Street Catchment shown in
Figure 2 is managed by the City of Melbourne and begins at College Crescent in Carlton where the University of Melbourne is located and ends where Elizabeth Street drains out to the Yarra River. The catchment has been classified as an Extreme Flood Risk by Melbourne Water [
15]. Since 1884, the Elizabeth Street underground drain has been responsible for collecting stormwater from the Carlton and CBD surroundings and transferring it into the Yarra River, and has experienced frequent flash flooding events (services). Recently, the City of Melbourne has developed the Elizabeth Street Catchment Integrated Water Cycle Management Plan 2015. Targets included in the plan include upgrading the existing drainage infrastructure to be able to handle a 1:20 ARI event, i.e., a stormwater event that is predicted to occur once in 20 years [
15]. As the University of Melbourne’s Parkville campus is located at the upstream location of this catchment (
Figure 2), reducing surface runoff from the campus through the installation of permeable pavements presents an excellent opportunity to reduce the potential flooding downstream, and therefore has been chosen as the study location. The scale of the campus can be classified as a watershed as it is approximately 21.2 hectares. Further, the site presents many suitable locations with mild slopes for the implementation of permeable pavements, as well as multiple carparks, pedestrian pathways, and low traffic areas.
2.2. Model Input Data: Site Characteristics (GIS and Soil Characteristics) and Rainfall Data
Inputs required to develop the MUSIC model were obtained from various sources. GIS data was obtained from Kunapo et al. 2018, [
16]. The GIS data assisted with delineating the land use into impervious (roads, footpaths, and residential land) and pervious surfaces (open space). We developed a synthetic rainfall series with known ARIs. Permeable pavements were modelled as per guidelines specified by Melbourne Water Corporation. Hydrocon was identified as a leading manufacturer in Australia that supplies porous concrete products for a range of uses in driveways, carparks, walkways, courtyards, and tree-surrounds in residential and commercial environments [
17]. Hence, specifications of their permeable pavements were directly used in our model simulations.
2.3. Determining the Drainage Path
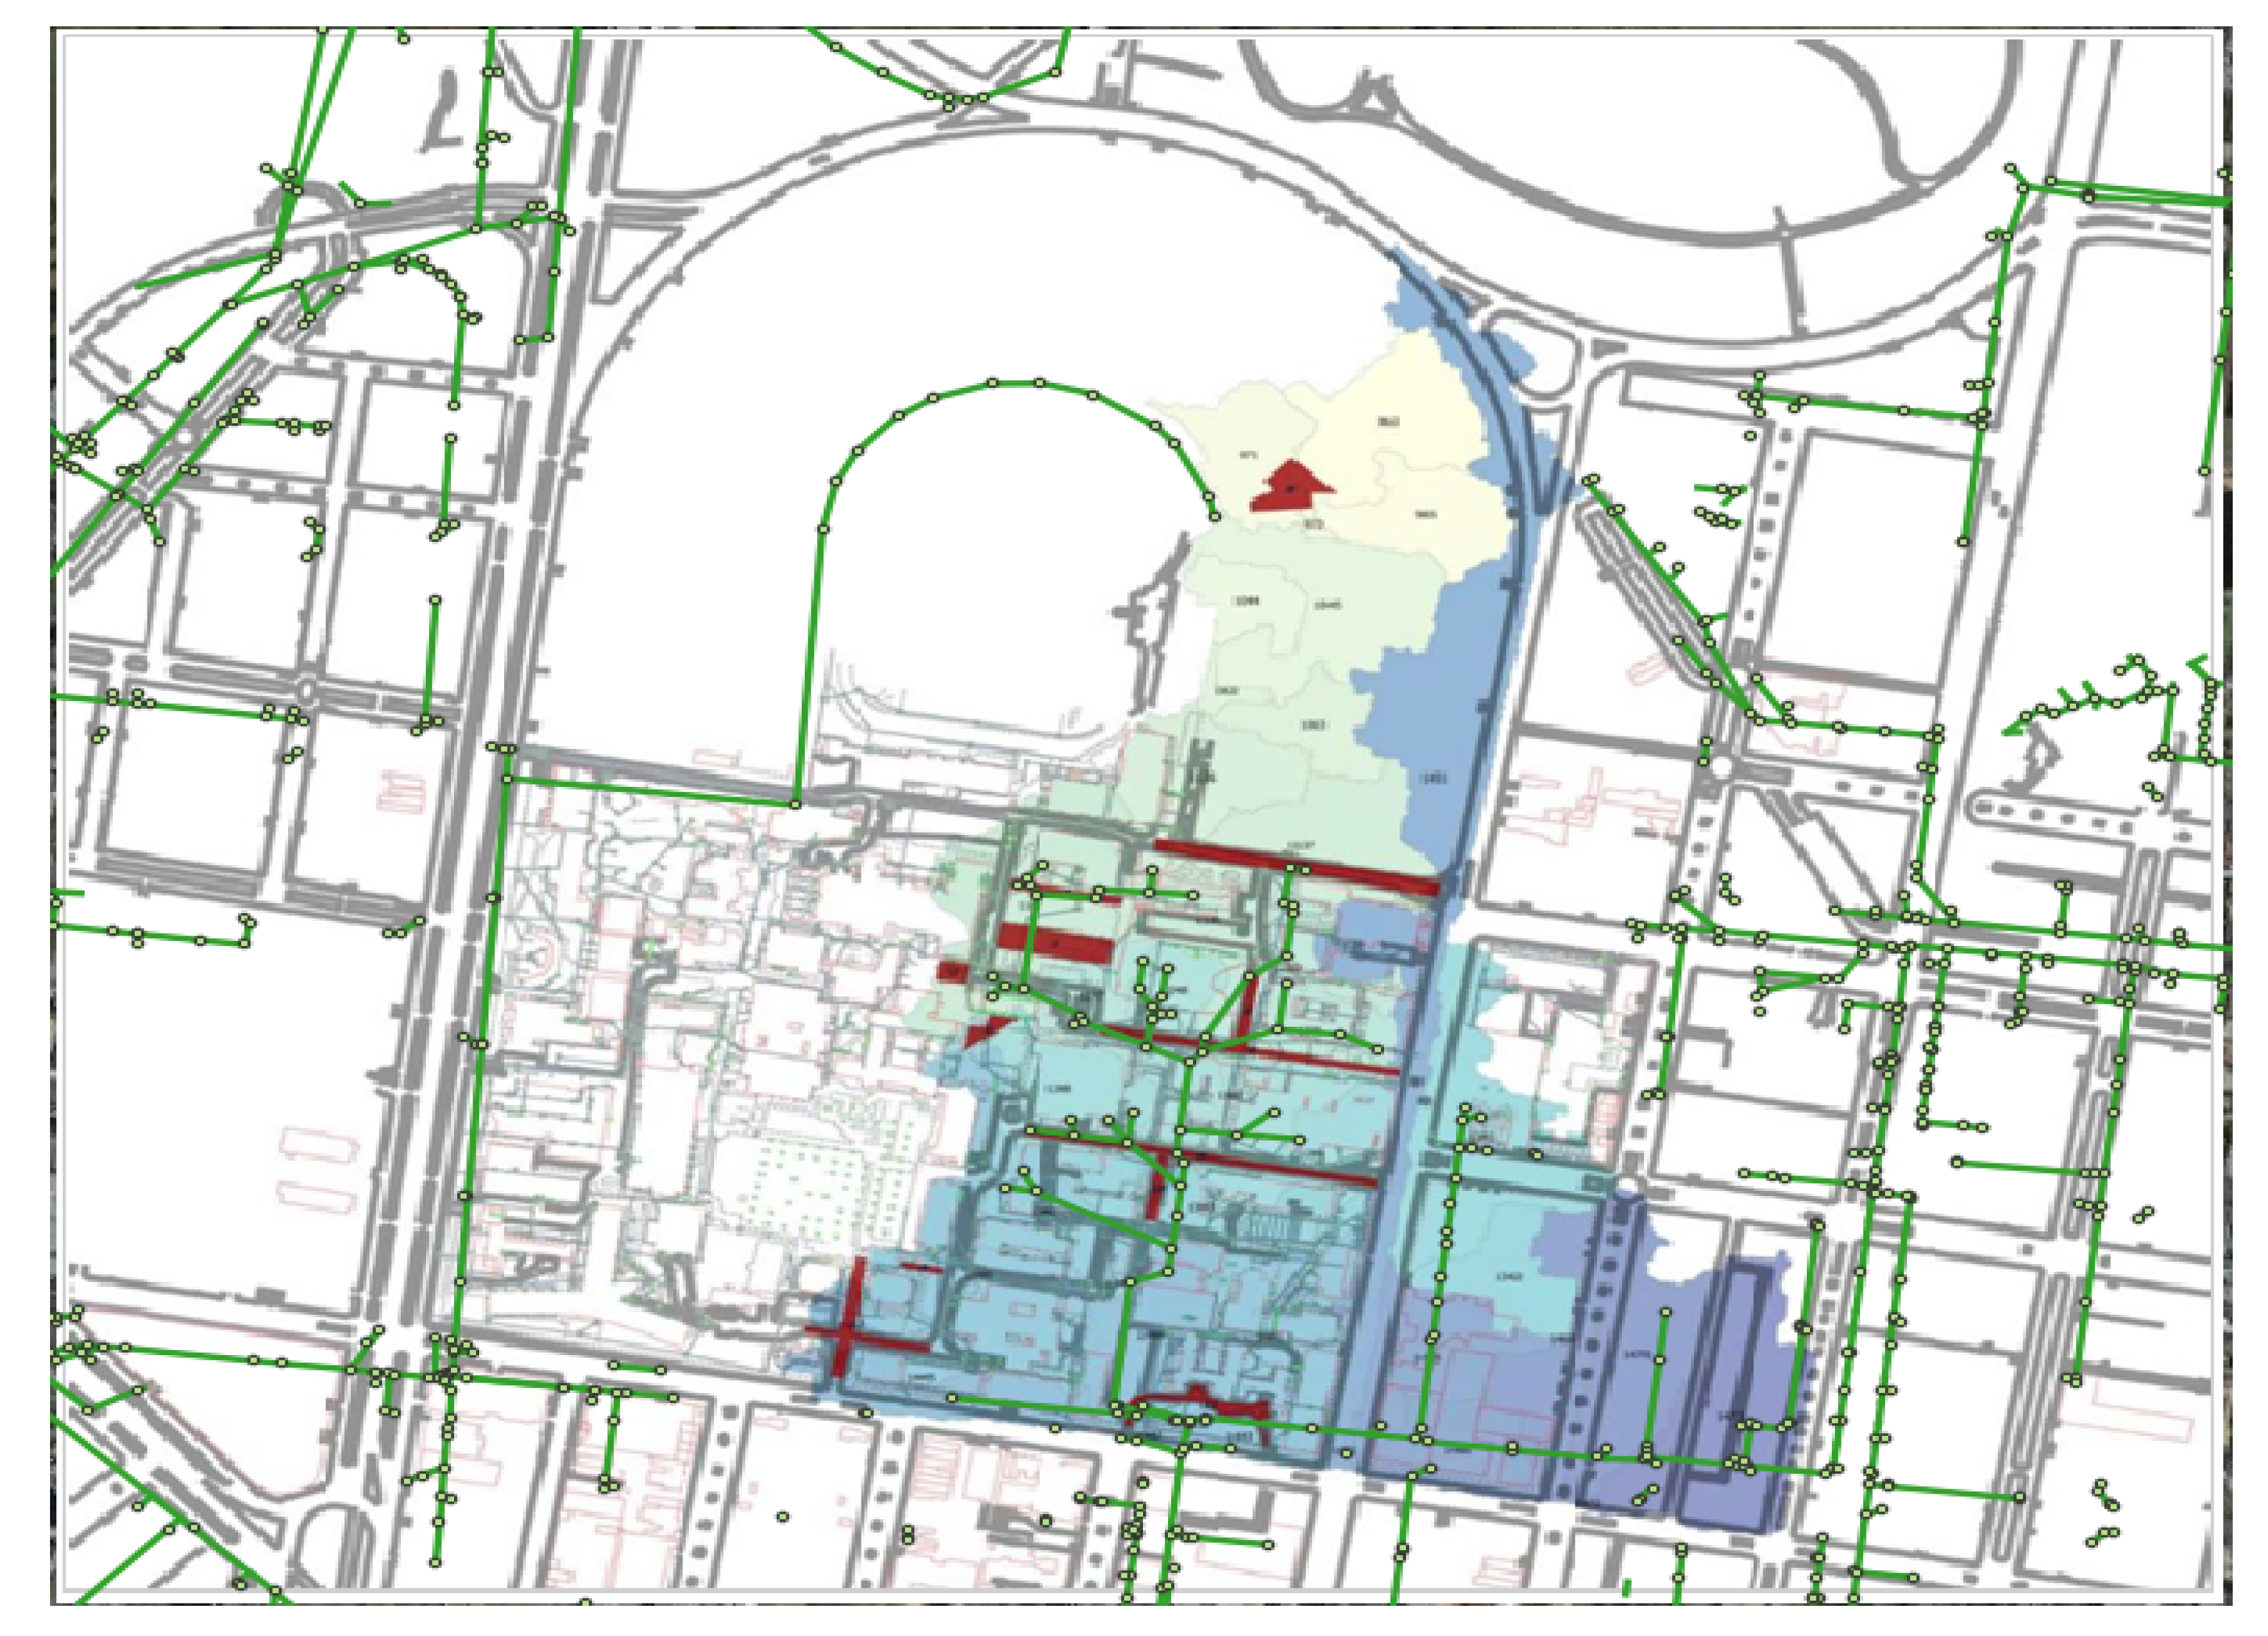
The GIS data yielded 39 sub catchments at the Parkville site. These sub catchments drain to the major pipe network located at Grattan St., which is represented as the receiving node in the MUSIC model. QGIS was employed to highlight individual sub catchments and to overlay elevation levels, as well as the pipe network. Starting at the top of the catchment, storms drains, pits, and pipes were located to identify the entry and exit points for stormwater. Contour lines were then followed from the highest point at 46.9 m Australian height datum (AHD) down to 34 m AHD to determine the natural course of surface runoff flowing into entry points of the drainage system within their respective sub catchments. Concentric circles of contour lines indicated a hill while closely spaced and widely spaced lines indicated steep and gentle slopes, respectively. The pipe overlay provided the direction of flow once surface water entered the drainage system. This allowed the drainage path to be visualised and conceptually modelled within MUSIC.
2.4. Calculating Fraction of Imperviousness
QGIS was used to calculate sub catchment areas, pervious (tree canopy and nature strips) and impervious (roof, roads, and footpath) areas, in addition to aerial photographs. The fraction of the impervious area of each sub catchment was determined by dividing total impervious areas by the area of the sub catchment.
2.5. Determining Locations for Permeable Pavements
In total, 14 sites were identified as practical and feasible locations for the implementation of permeable pavement based on slopes, traffic in the area, and distance from buildings (
Figure 3). These sites exhibit mild slopes (less than 4%) and low traffic areas which is important for sustaining the performance of the system over long periods to keep maintenance costs low. An appropriate buffer distance of 10 feet down-gradient and 100 feet up-gradient from significant buildings is recommended, as the extensive infiltration of water into underlying soils can lead to subsidence for surrounding structures. In this study, this risk was mitigated by having underdrains beneath the system to allow flow into the stormwater network. QGIS was used to determine the extent of pavement surfaces and determine their respective areas. These areas were then used as inputs for the filter area within the model.
2.6. Meteorological Template
We constructed a time-series of rainfall using rain events with known ARIs (design rainfalls derived from the Bureau of Meteorology;
http://www.bom.gov.au/water/designRainfalls/revised-ifd/, accessed on 15 March 2016) along with ~1 year of rainfall recorded at a pluviograph. This synthetic rainfall time-series featured repeating sequences of the observed rainfall and the different design rainfalls considered. The observed rainfall was included to ensure that model storages were at similar levels before each design rain event was simulated. The resulting rainfall input file was ~100 years of 6-min data. This presented operational challenges for our computational system and the entire rainfall series could not be run as a single simulation. Instead, we extracted 10 years of rainfall data for each of the 5, 20, and 100 ARI storm events ranging from 10 min to 24-h. This does not affect the validity of our results, as the rainfall events that we are interested in are the 5 year ARI (against which current stormwater infrastructure is designed), 20 year ARI (against which infrastructure is to be upgraded), and 100 year ARI events (to model the 1 in 100-year flood disaster).
We note that due to data and time constraints, the synthetic rainfall time-series used is representative of another location named Mt. Evelyn (some ~43 km away from our study site at 37.7830° S and 145.3850° E). This had minimal influence on our study outcomes, as differences in design rainfalls between these locations are small. For example, the design rainfall intensity for a 10-min 5-year ARI storm at our study site is 69.2 mm/h and for Mt. Evelyn it is 67.3 mm/h. This point is further illustrated in
Table 1, which illustrates relatively small percentage differences in design rainfall intensities between the sites.
2.7. MUSIC Software and Simulations
The research uses eWater’s model for stormwater improvement conceptualisation (MUSIC) to investigate the capability of permeable pavements to reduce peak flows and runoff volumes for mitigating floods downstream. MUSIC is capable of operating at a range of temporal and spatial scales with results viewed using a range of graphical and tabular formats.
For each of the 5, 20, and 100-year ARI storm events, a base case (no implementation of permeable pavements) and an alternative case (with permeable pavements implemented) was modelled to compare the effects of the permeable pavements in reducing peak flows and volumes. The performance of permeable pavements was also modelled under significantly clogged conditions and with the increased imperviousness of the catchment by 10%.
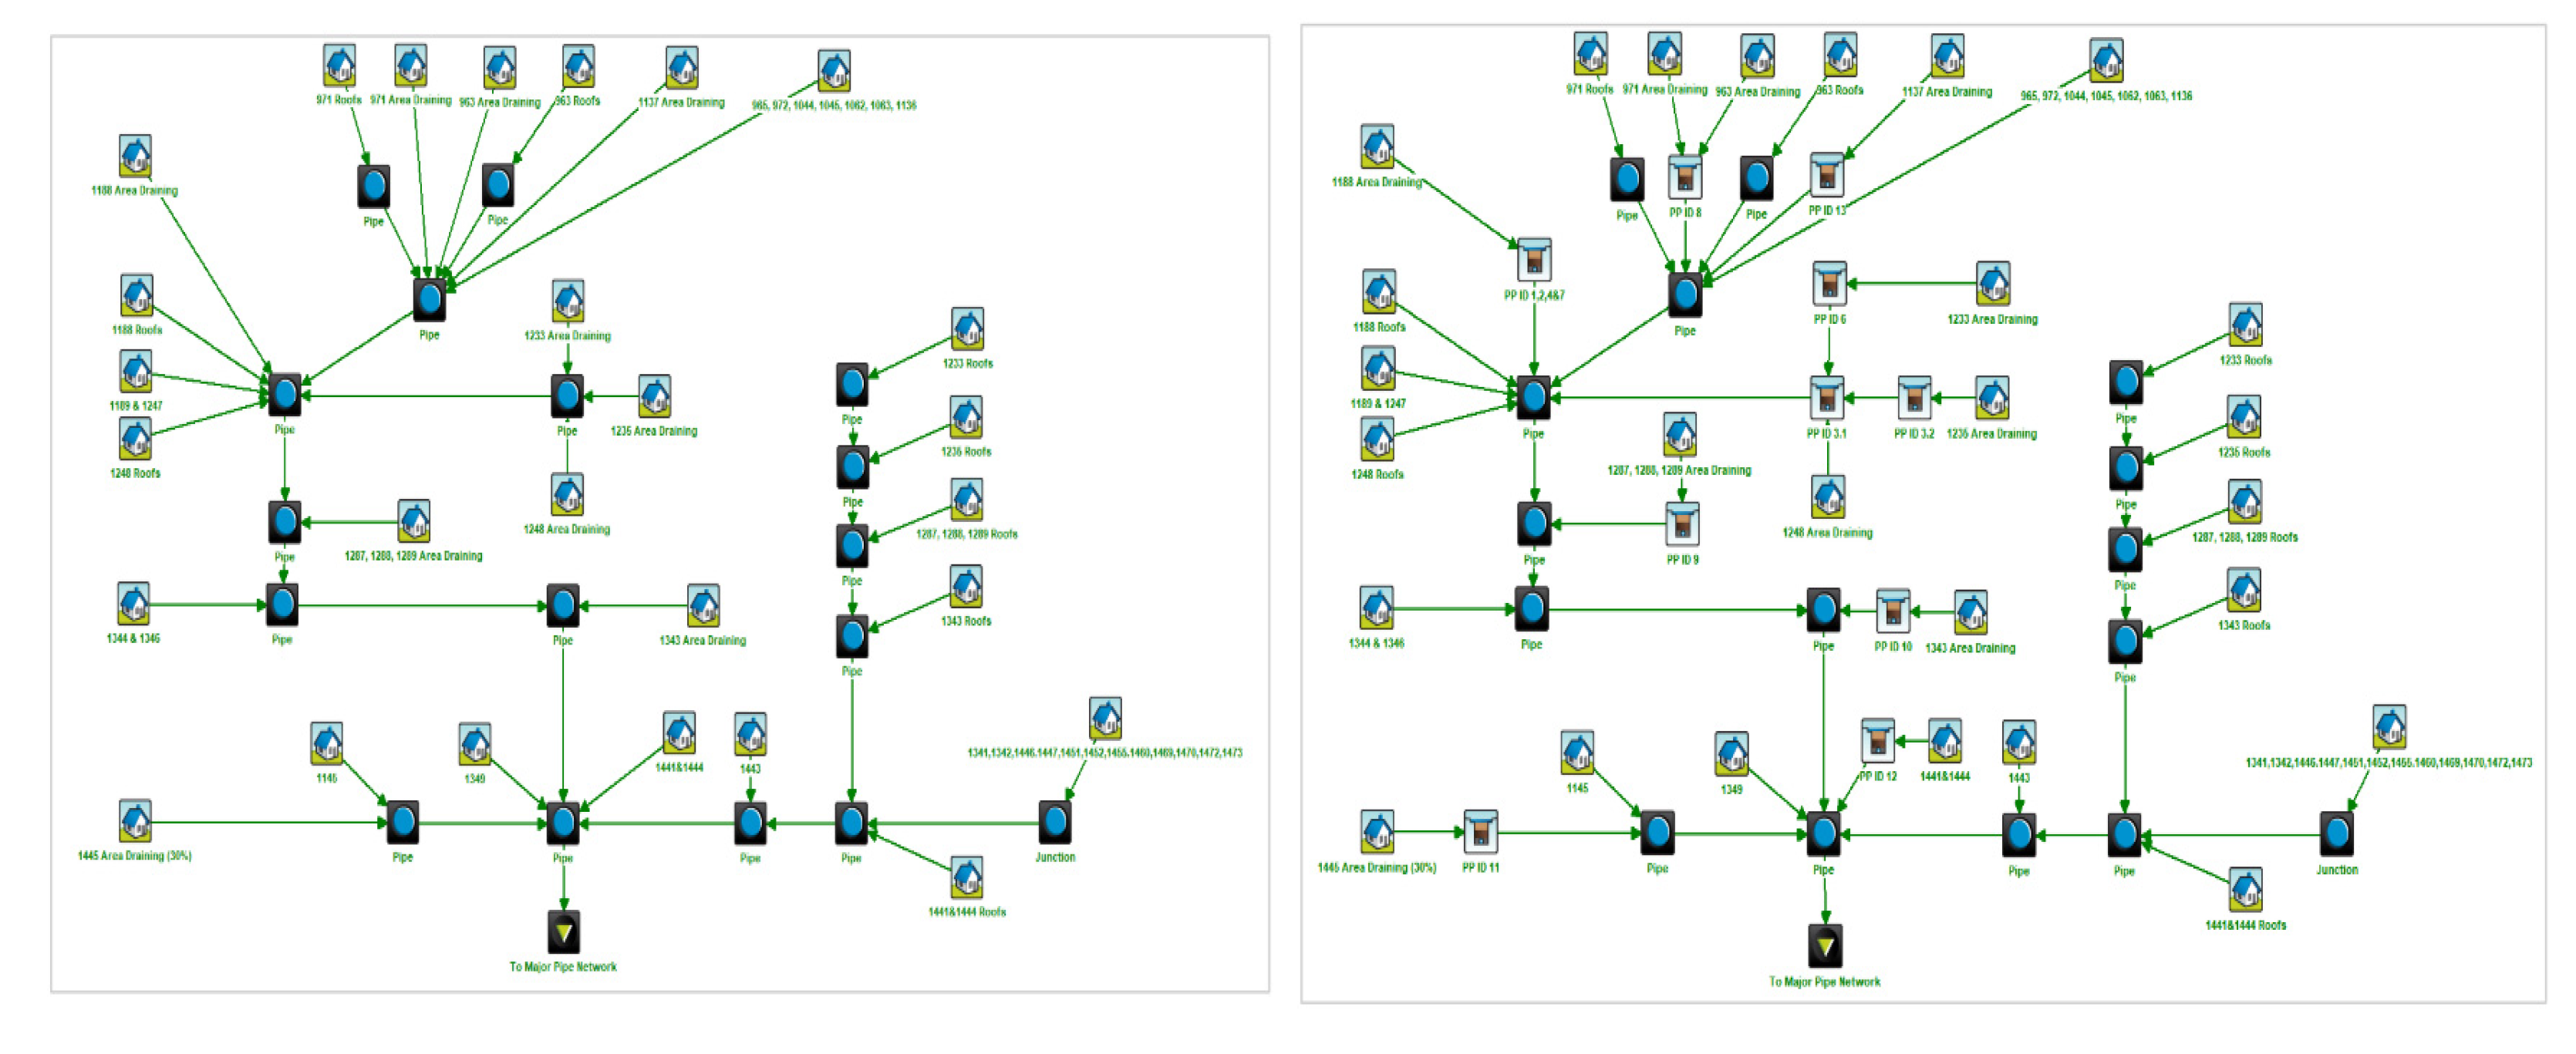
Figure 4 shows the hydrological models for the base and alternative case respectively.
Inputs to the MUSIC model comprised urban nodes to represent the areas of roads, footpaths, and other impervious surfaces draining into pavements indicated as “area draining” within the model. The media infiltration node represents the permeable pavements and junction nodes indicate the locations of pits, pipes and areas of confluence. These nodes were connected by primary linkages to indicate the path of drainage as either surface flow and/or pipe flow. Sub catchments were lumped if they were found to drain into common permeable pavements or common pipe entry points. Rainfall on roofs was modelled to enter directly into the stormwater network, as it was considered to otherwise overload the permeable pavements. There are, however, technologies available to capture the rainfall that falls on roofs (rainwater tanks, rooftop gardens). These systems were not considered in the model, and permeable pavements served as the standalone system for controlling runoff. The validity of this assumption will be discussed in proceeding sections.
We used manufacturer specifications to model permeable pavements (i.e., filter depth, filter median particle size, and depth below underdrain). The actual paver layer was assumed to be free draining (no water detention or ponding on pavement surfaces) meaning that the amount of water that can infiltrate is controlled by underlying layers. It was assumed that underdrains would be built beneath the pavements to prevent the subsidence of significant structures; the substrate layer formed the “determining” layer. This layer comprises coarse aggregates of sand and gravel. The corresponding exfiltration rate for this layer (the rate at which water can expel) was assumed to be 3600 mm/h, as suggested by MUSIC for this type of soil (coarse aggregates of sand and gravel).
Routing was applied to primary linkages (arrowed lines) to represent the time it takes for the furthest point of each sub catchment (urban node) to be contributing runoff to its outlet (either storm pipe or permeable pavements). This is termed as the “time of concentration” and is an important aspect of hydrological modelling, as it yields the minimum duration (time) for peak flows to occur (discharge in m3/s). A simplified method was used to estimate the time of concentration by assuming that each sub catchment is square in shape with the longest flow path being the hypotenuse of an equilateral triangle. This method is suitable for providing estimates for the planning phase, where later detailed design may be investigated to verify and/or modify the initial estimates.
3. Results
Before characterizing the impact of permeable pavements on flood discharge and peak flow reductions, we estimated critical flooding flow rates in the Elizabeth Street Catchment. The majority of Melbourne’s drainage infrastructure is over 60 years old with most areas only able to accommodate 5 year ARI events (Australia 2015). Therefore, for our analysis, we have taken the critical flooding flow rate as the peak flow of the 5 year ARI for the base case scenario (without permeable pavements) which is 2.1 m3/s. If the flow rate is below 2.1 m3/s, the catchment will be safe from flooding and if it exceeds this volume, the catchment will experience flooding.
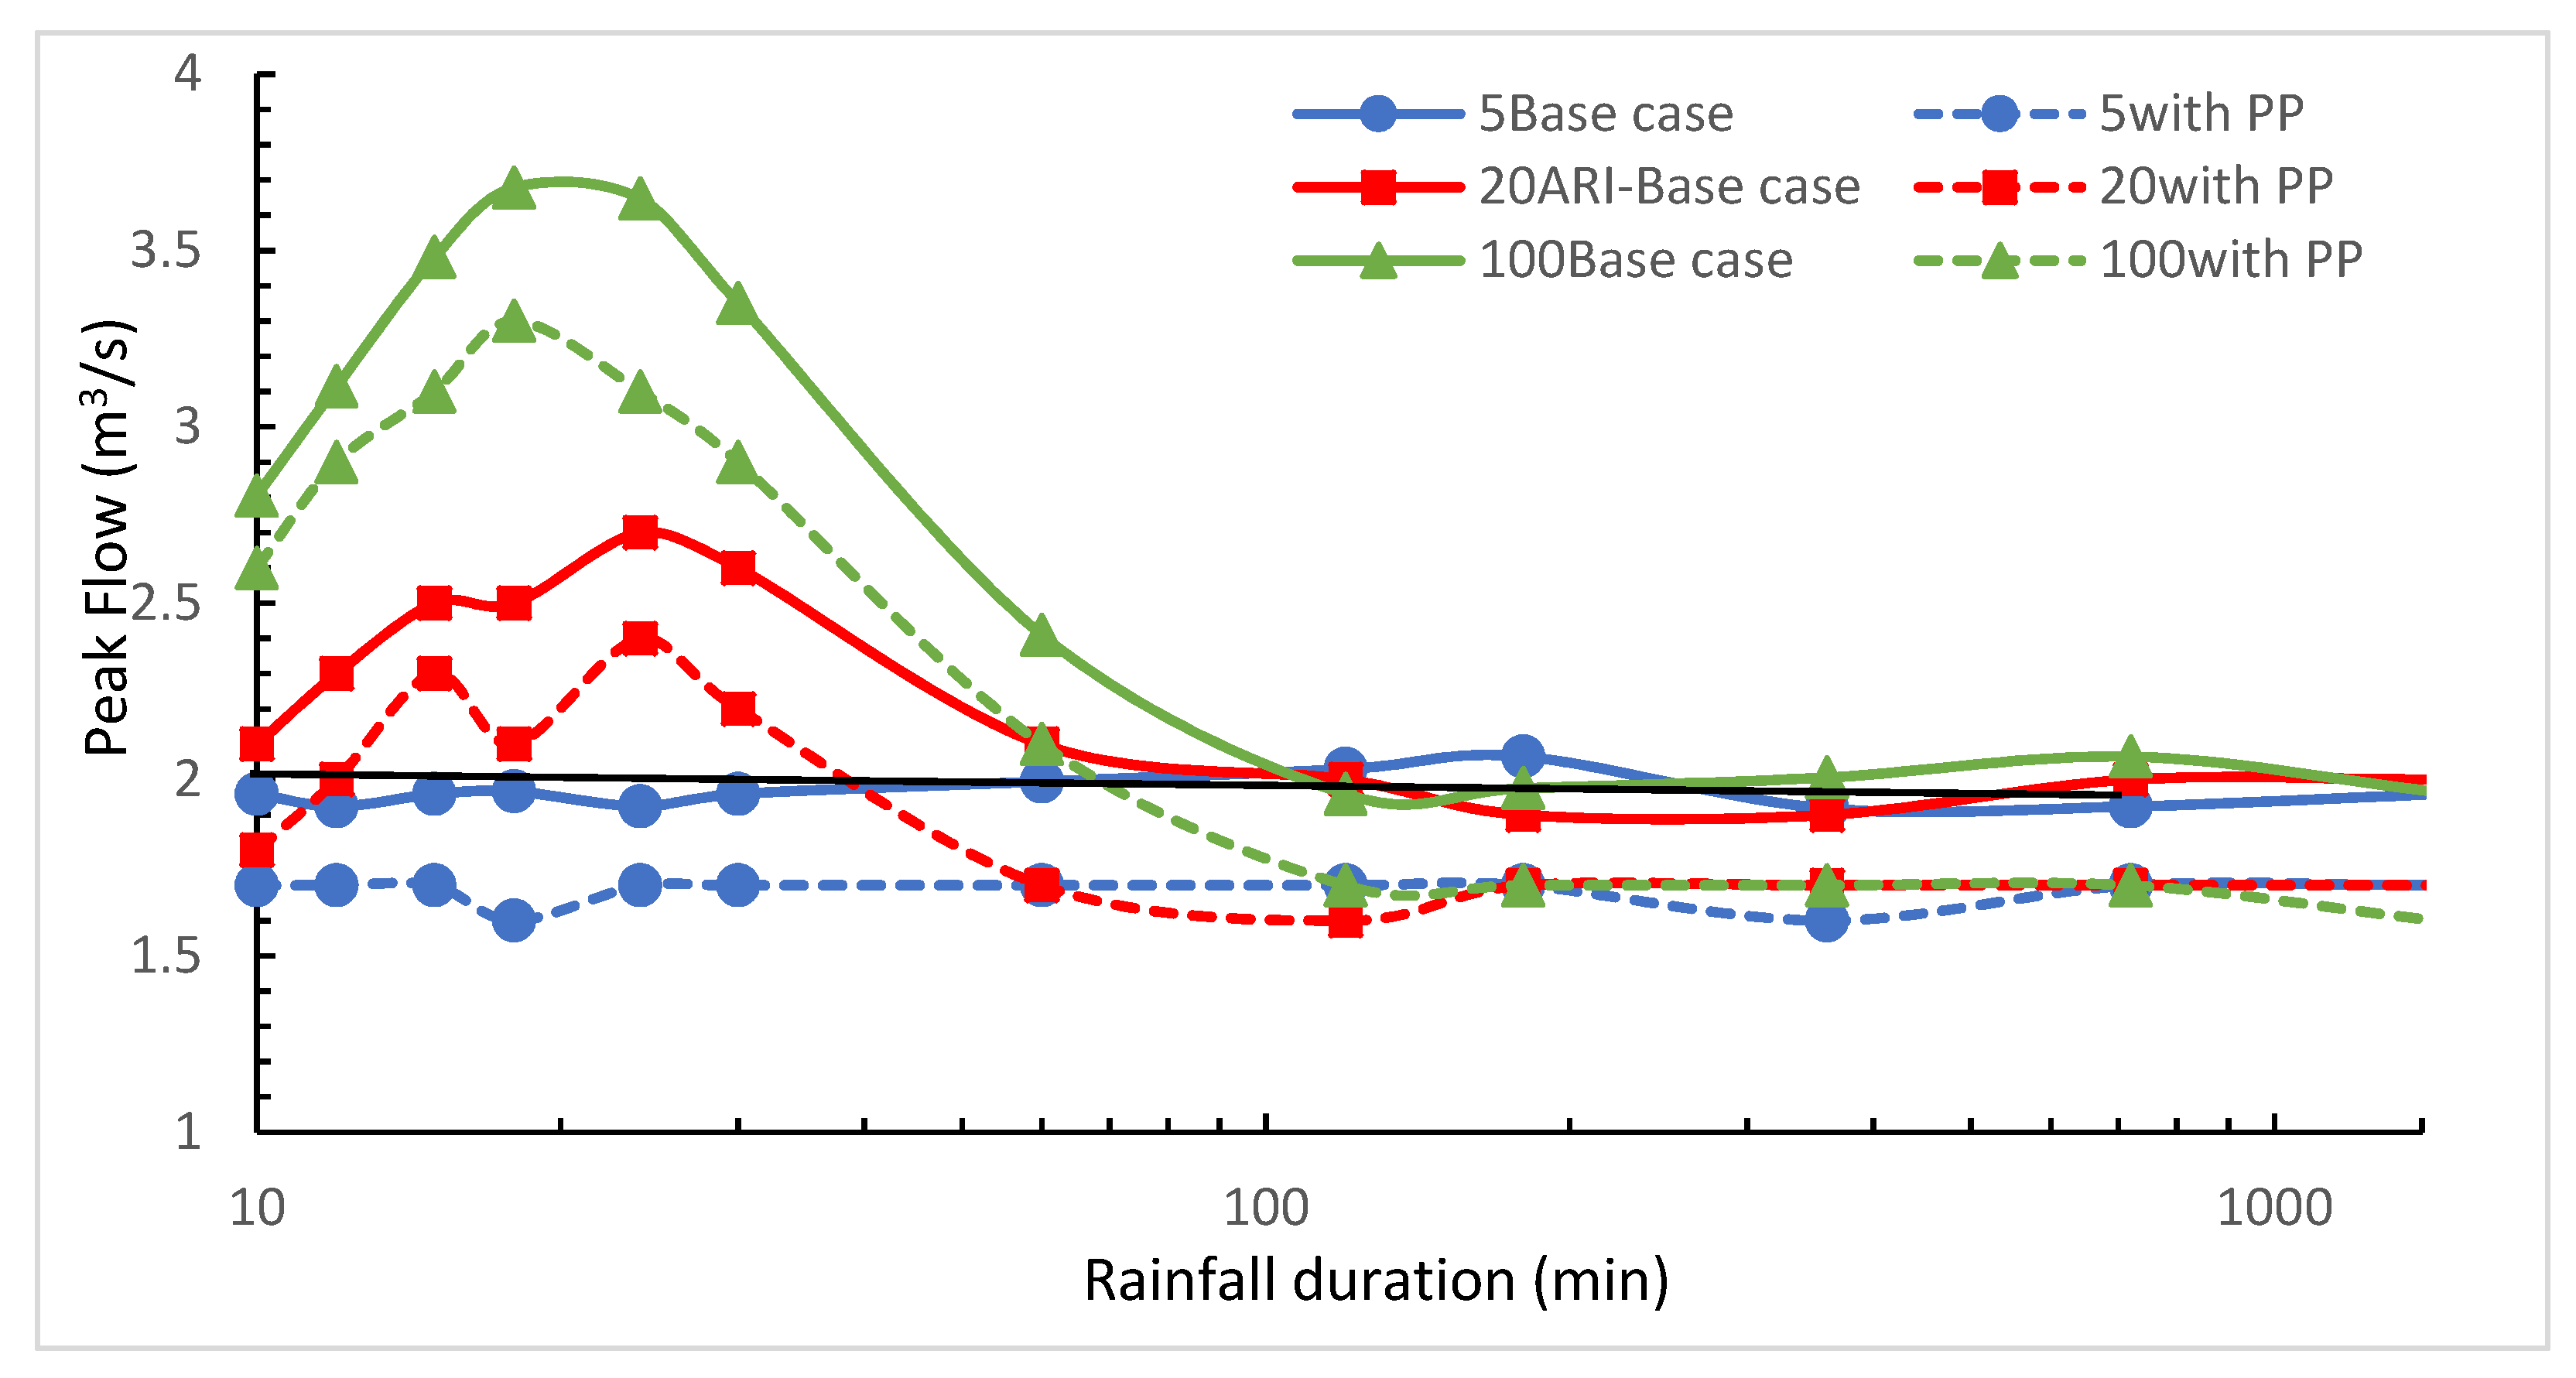
3.1. Impact of Rainfall Duration on Flood Discharge and Peak Flows
The flooding of the drainage system for both scenarios (base case and with permeable pavements, PP installed) was investigated under different storm events (5-, 20-, and 100-year ARI) and different rainfall durations (
Figure 5) at the outfall of the Elizabeth St. Catchment.
Table 2 represents peak flows and the corresponding rainfall duration for each ARI event. The simulation results show that for low intensity storm events, flood discharges are high when rainfall duration is large. However, for high rainfall intensity events, high flood discharges are observed even for low rainfall durations.
Overall, permeable pavements reduced flood discharges for all rainfall scenarios (
Figure 5: continuous lines, base case flood discharges; and dashed lines, after implementing permeable pavements). Flow peaks of the 5 year ARI were consistent for each duration of storm events averaging around 2 m
3/s. The highest peak flow recorded for the base case was 2.07 m
3/s for a 3-h duration storm event. With the implementation of permeable pavements, the amount of stormwater that enters the major pipe network from the University of Melbourne was attenuated to 1.7 m
3/s (16% flow reduction). Flow peaks in 20 year ARI are more varied, ranging from 2.1 m
3/s for the 10-min event to 2.7 m
3/s for the 24-min event. Permeable pavements have reduced the discharge by 12% and attenuate the highest peak flow from the base case to 2.4 m
3/s. The 100 year ARI flood event produces much more varied flow peaks than previous cases, with the highest flow observed (3.68 m
3/s) for the 18-min duration. Permeable pavements attenuate the highest peak flow to 3.3 m
3/s with a reduction of 10%.
We evaluated the impact of rainfall duration on flood discharge reduction. According to our simulation results, permeable pavements are effective at reducing peak discharges and runoff volumes for shorter but more frequent storm events of up to 18-min. After 18 min, its performance reduces to 9% (
Table 3), suggesting that the pavers have become saturated as a result of the intense burst of rainfall (around 30 mm/h). The performance of permeable pavements for the 5 year ARI storm improves once the rainfall intensity subsides and the system has had time to drain. This is evidenced by the increase in flow reduction at 180- and 360-min durations. It is observed that this tread continues as the duration Increases. For the 20-year ARI storm, permeable pavements are most effective for storms of a 120-min duration with moderate rainfall intensities (around 15 mm/h). For the 1 in 100-year flood, pavements become overloaded for short and highly intense rainfall but can reduce flows by up to 17% at the 24-h mark where intensities are much lower (around 3 mm/h).
For the same rainfall intensity, as the rainfall duration increased, the percentage of flood discharge reduction increased for the 100 year ARI, but no clear trend in flood discharge reduction is observed for the 5 year ARI and 20 year ARI scenarios (
Table 3). However, previous studies report increases in the reduction rates of flood discharges when the rainfall duration is longer for any ARI event [
10,
18].
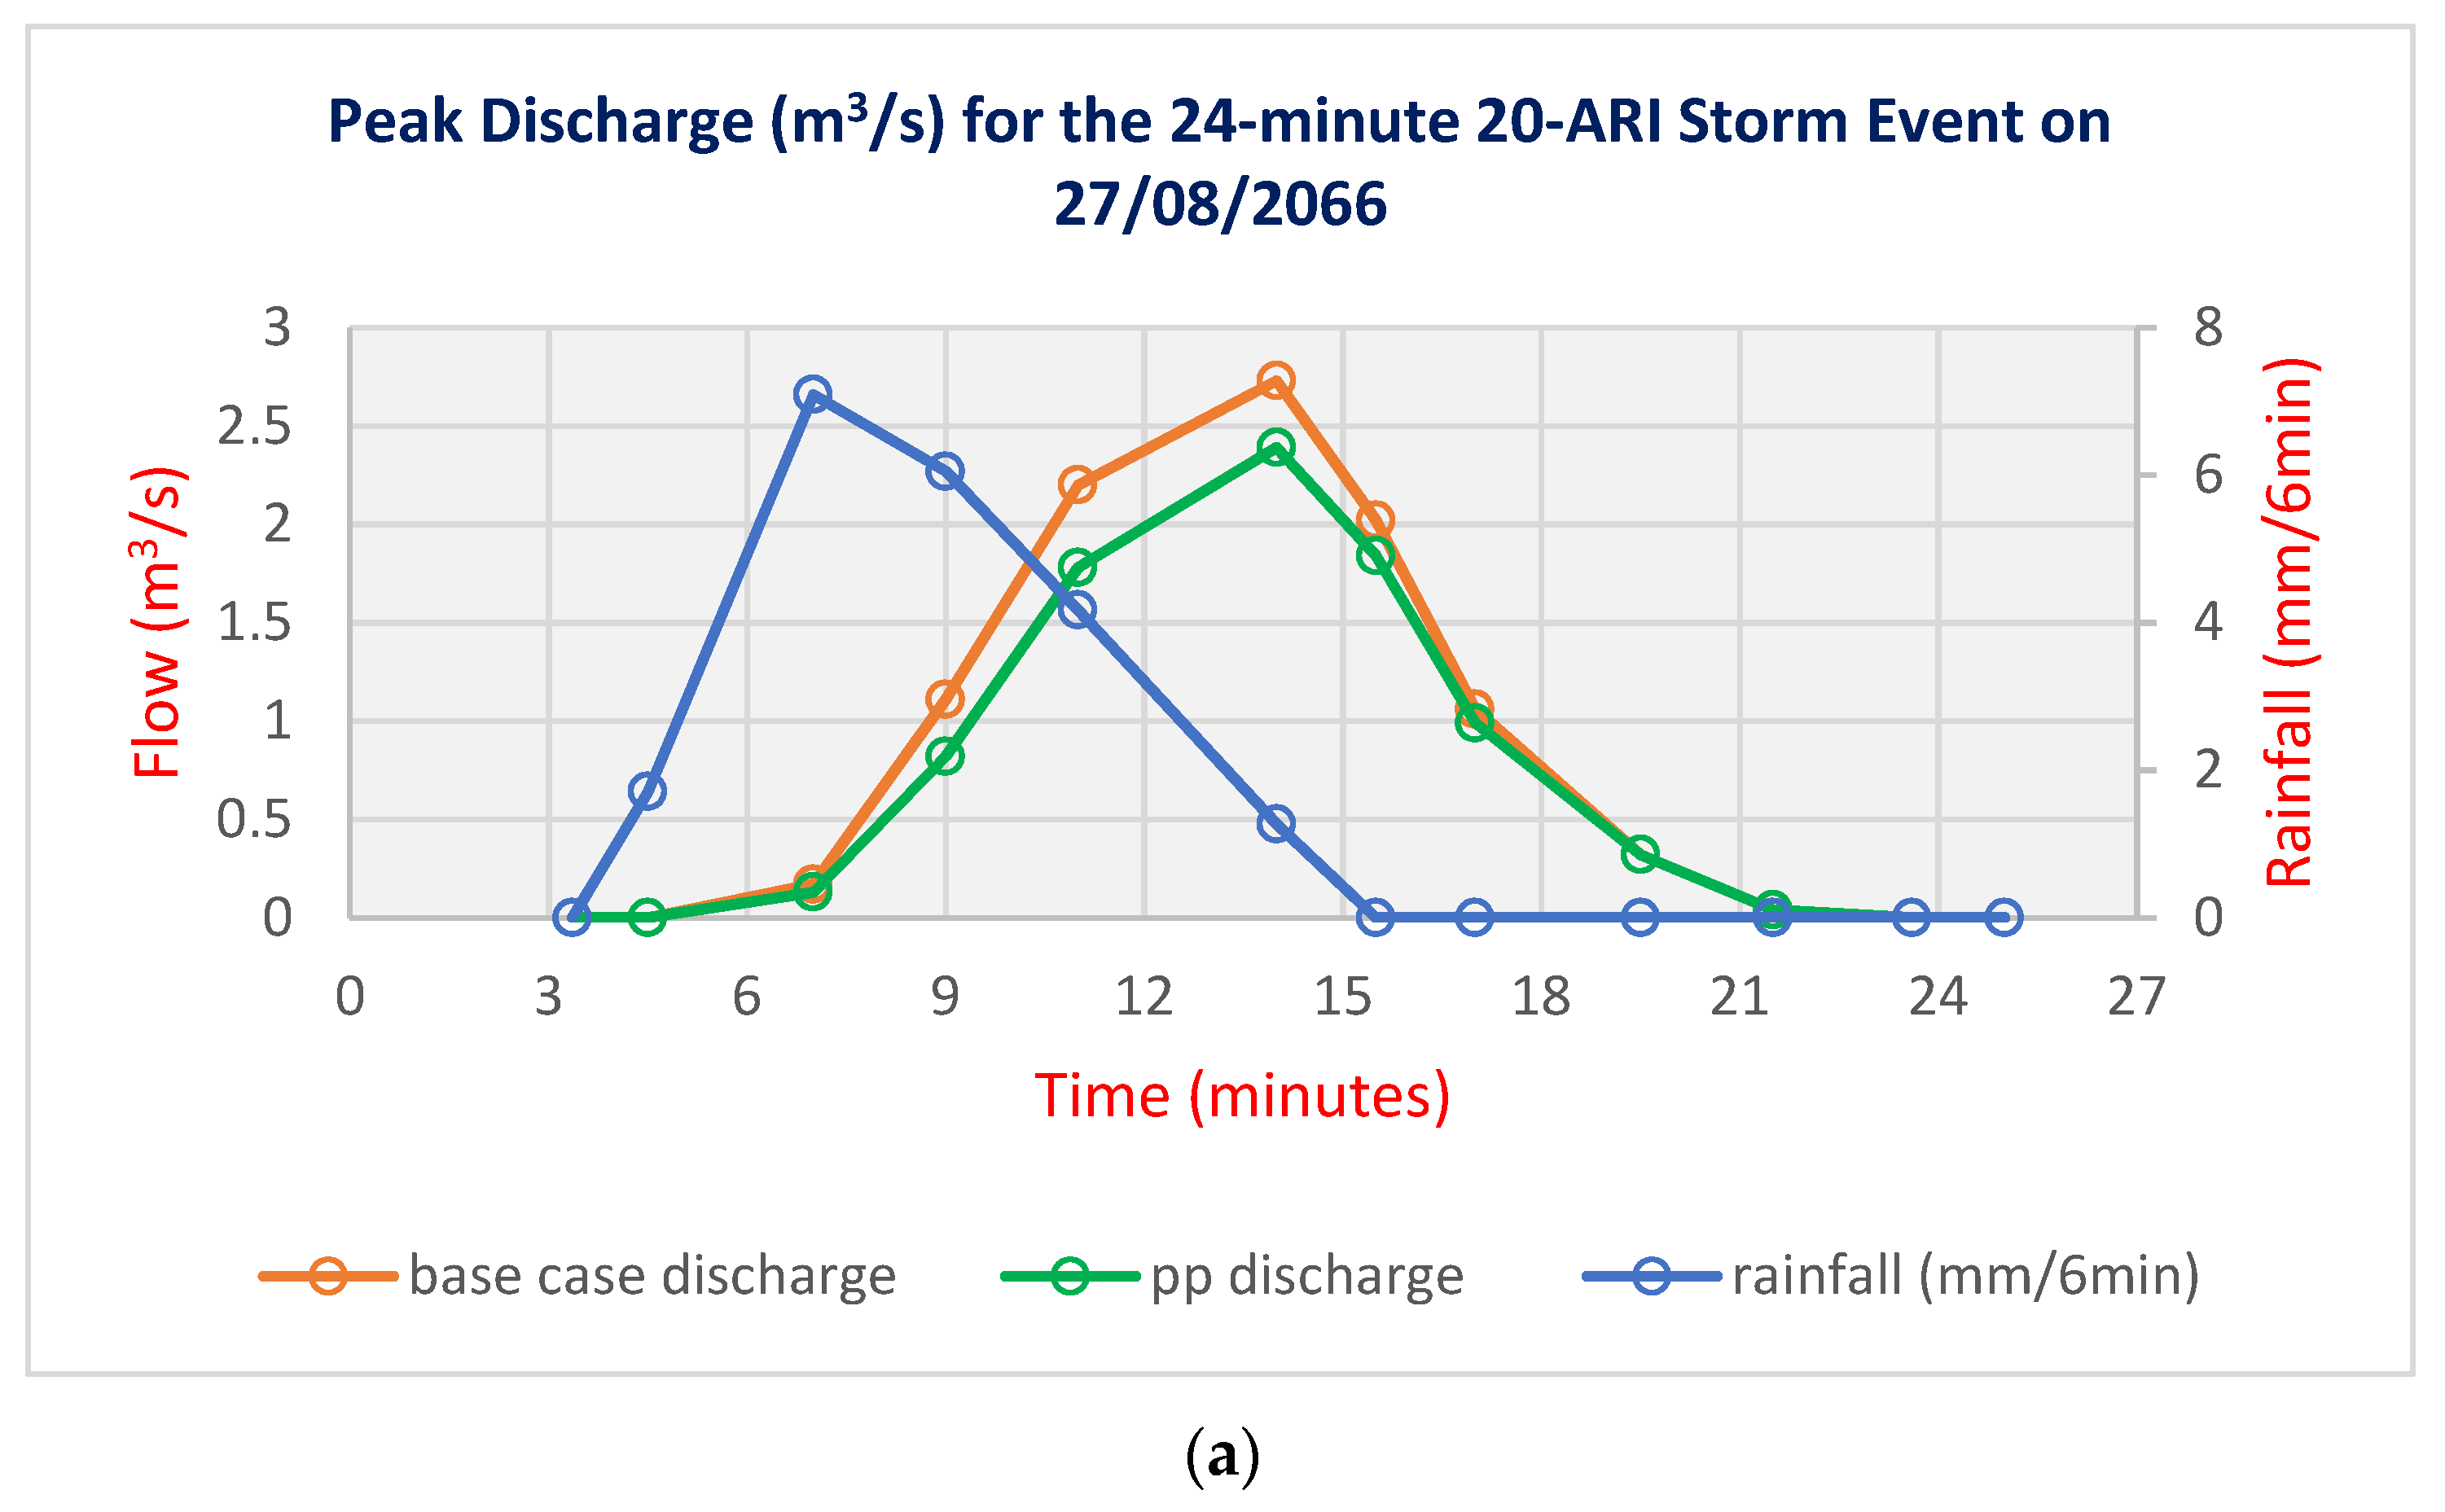
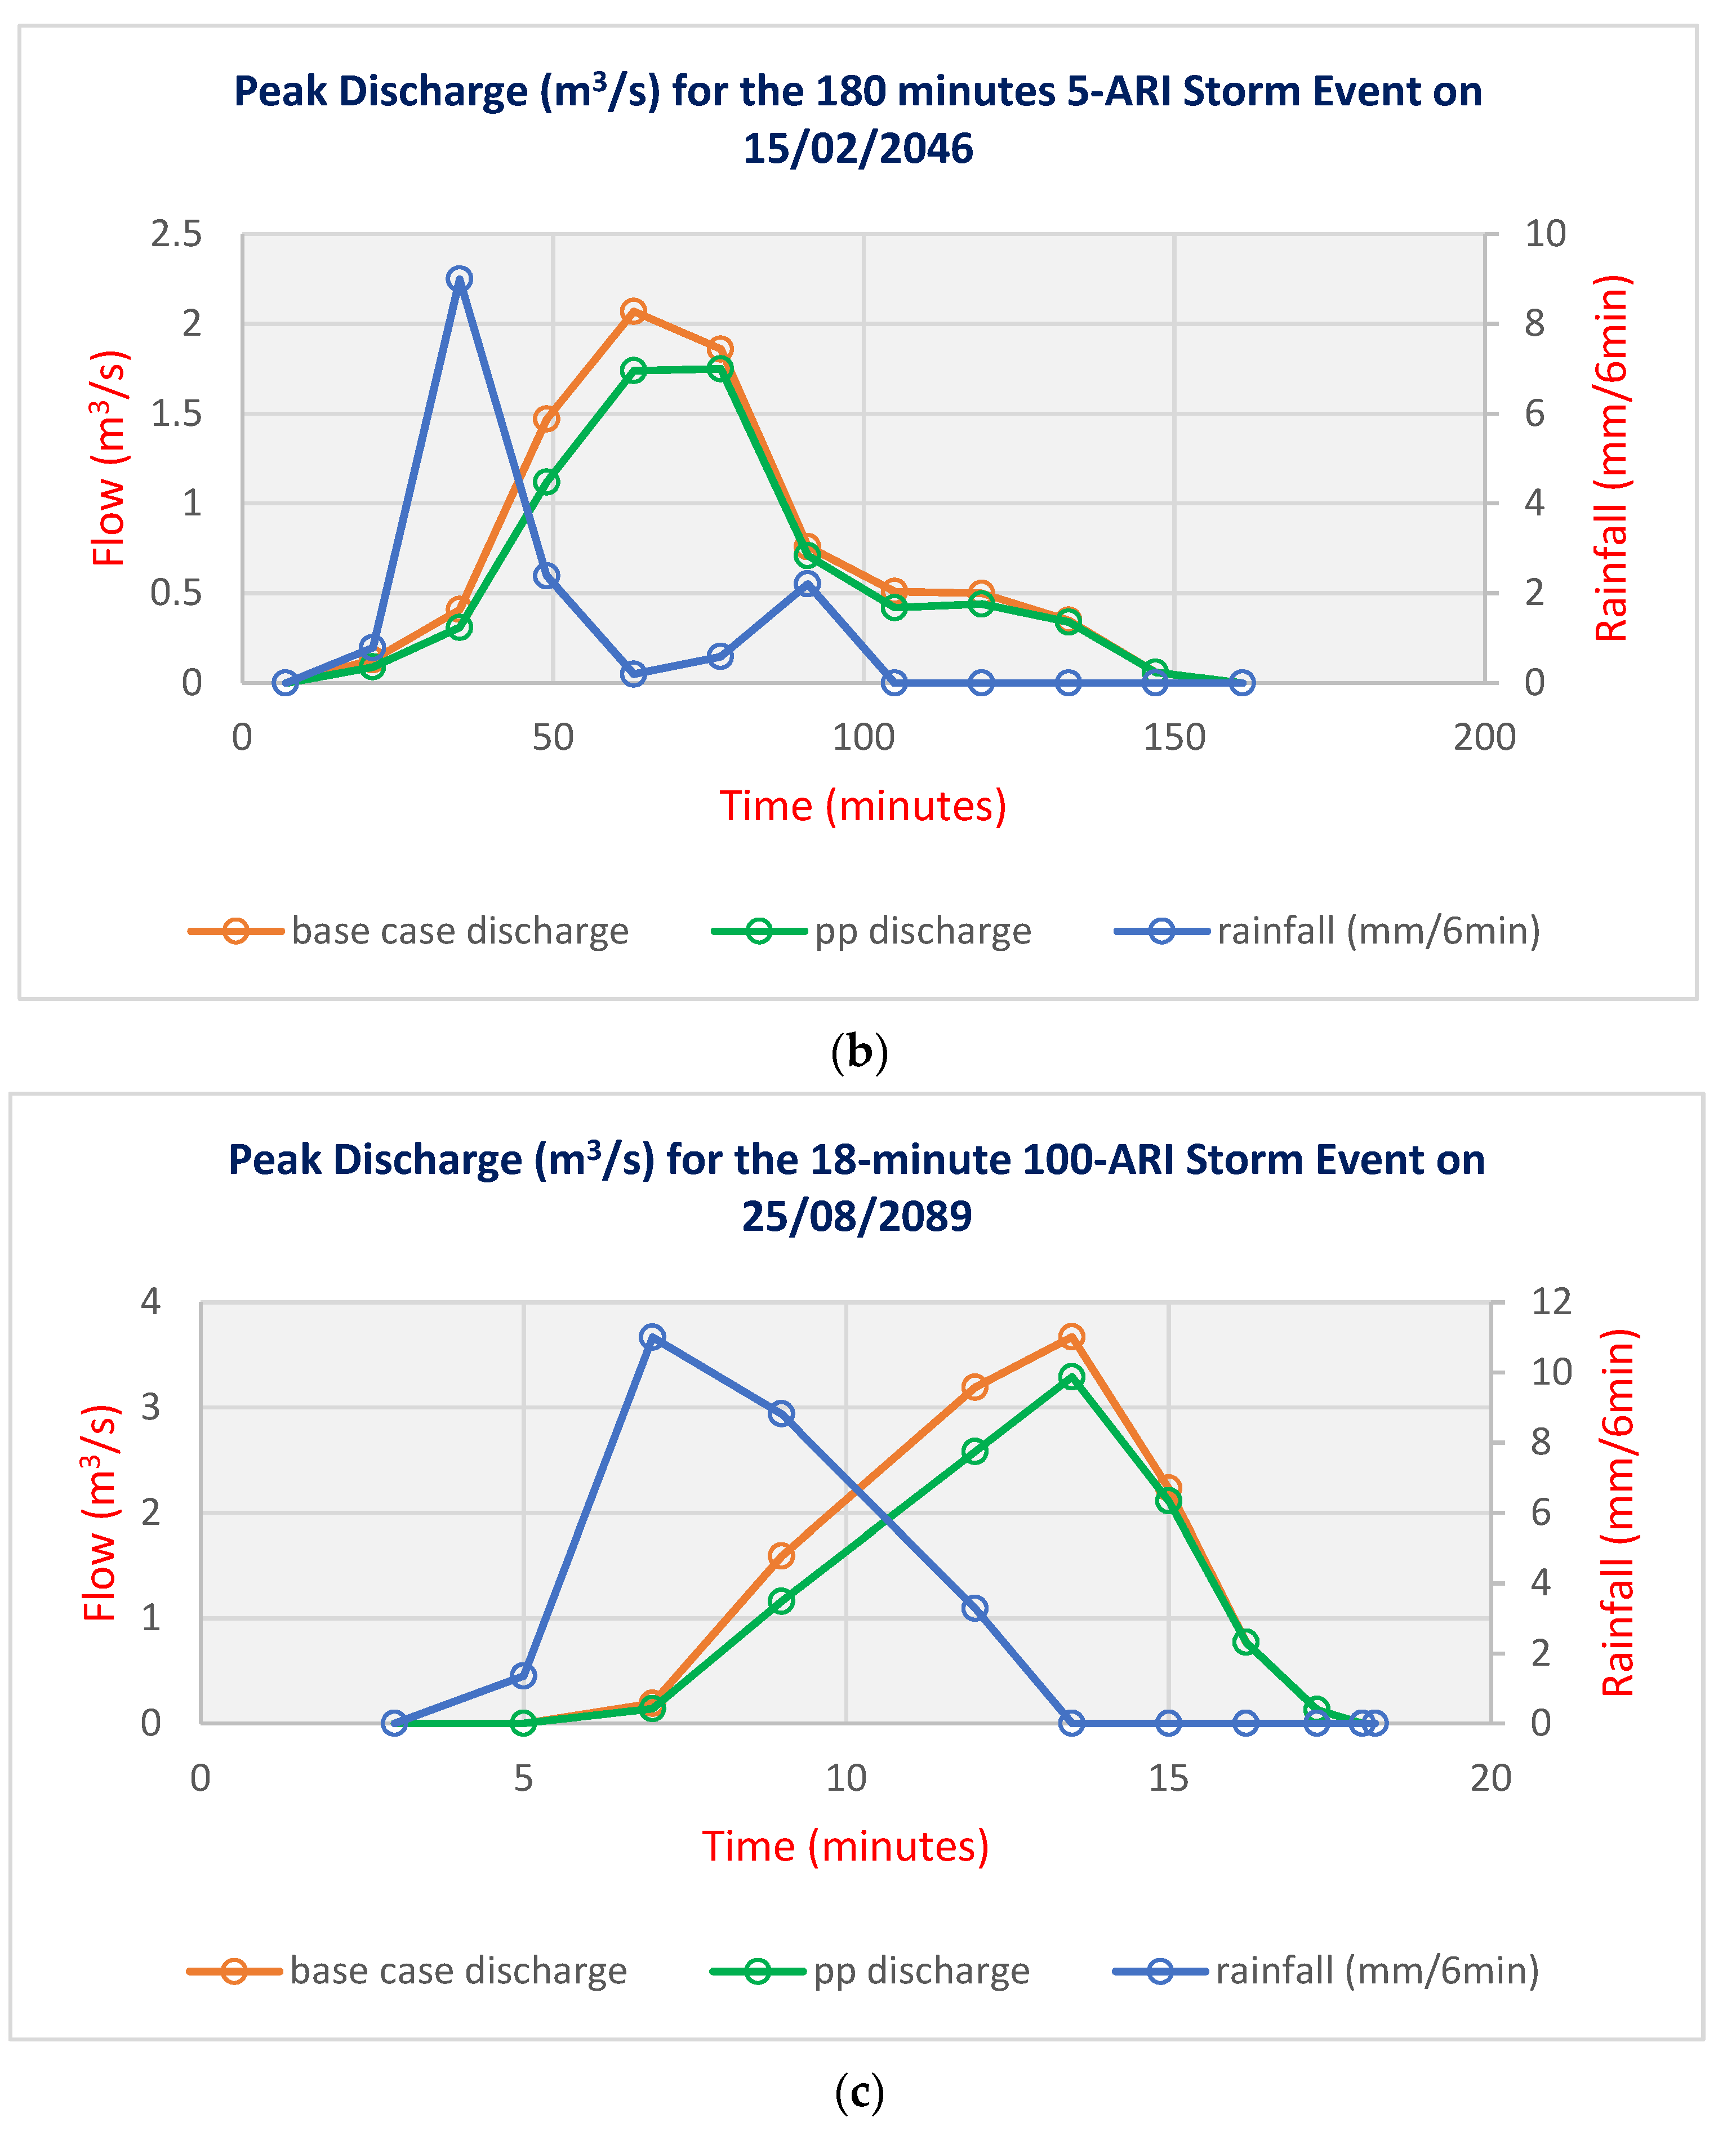
3.2. Impact of Permeable Pavements on Delaying the Timing of Flooding
The effect of permeable pavements on delaying the timing of peak flows for different storm events are shown in
Figure 6. The storm duration that produces the greatest peak flows was selected as the critical duration for each ARI. For the 5 year ARI storm event, permeable pavements delay the timing of peak flow runoff after the peak rainfall has occurred by 3 min relative to the base case (
Figure 6a). For the 20 year ARI storm event, permeable pavements have delayed the build-up to peak flow runoff by 6 min relative to the base case (
Figure 6b). For the 100 ARI storm event, permeable pavements delay the time to the 3.3 m
3/s peak by 6 min relative to the base case (
Figure 6c).
These results show that the permeable pavement can infiltrate surface runoff and delay peak flow and amount. However, clogging and the duration of the rainfall events will determine the infiltration capacity of permeable pavements [
18].
Overall, our results show that the implementation of permeable pavements reduces flood discharge for all storm events, regardless of the duration and intensity. However, flooding cannot be completely eliminated by implementing permeable pavements in a small fraction of the catchment. However, permeable pavement can reduce flood duration. Permeable pavements are less effective in flood mitigation during shorter and heavier storms. As a case study, this research identified the efficiency level of permeable pavement for the study area, which may not be applicable in other watersheds with different characteristics. Therefore, more work is required for region specific implementation of permeable pavements for flood control.
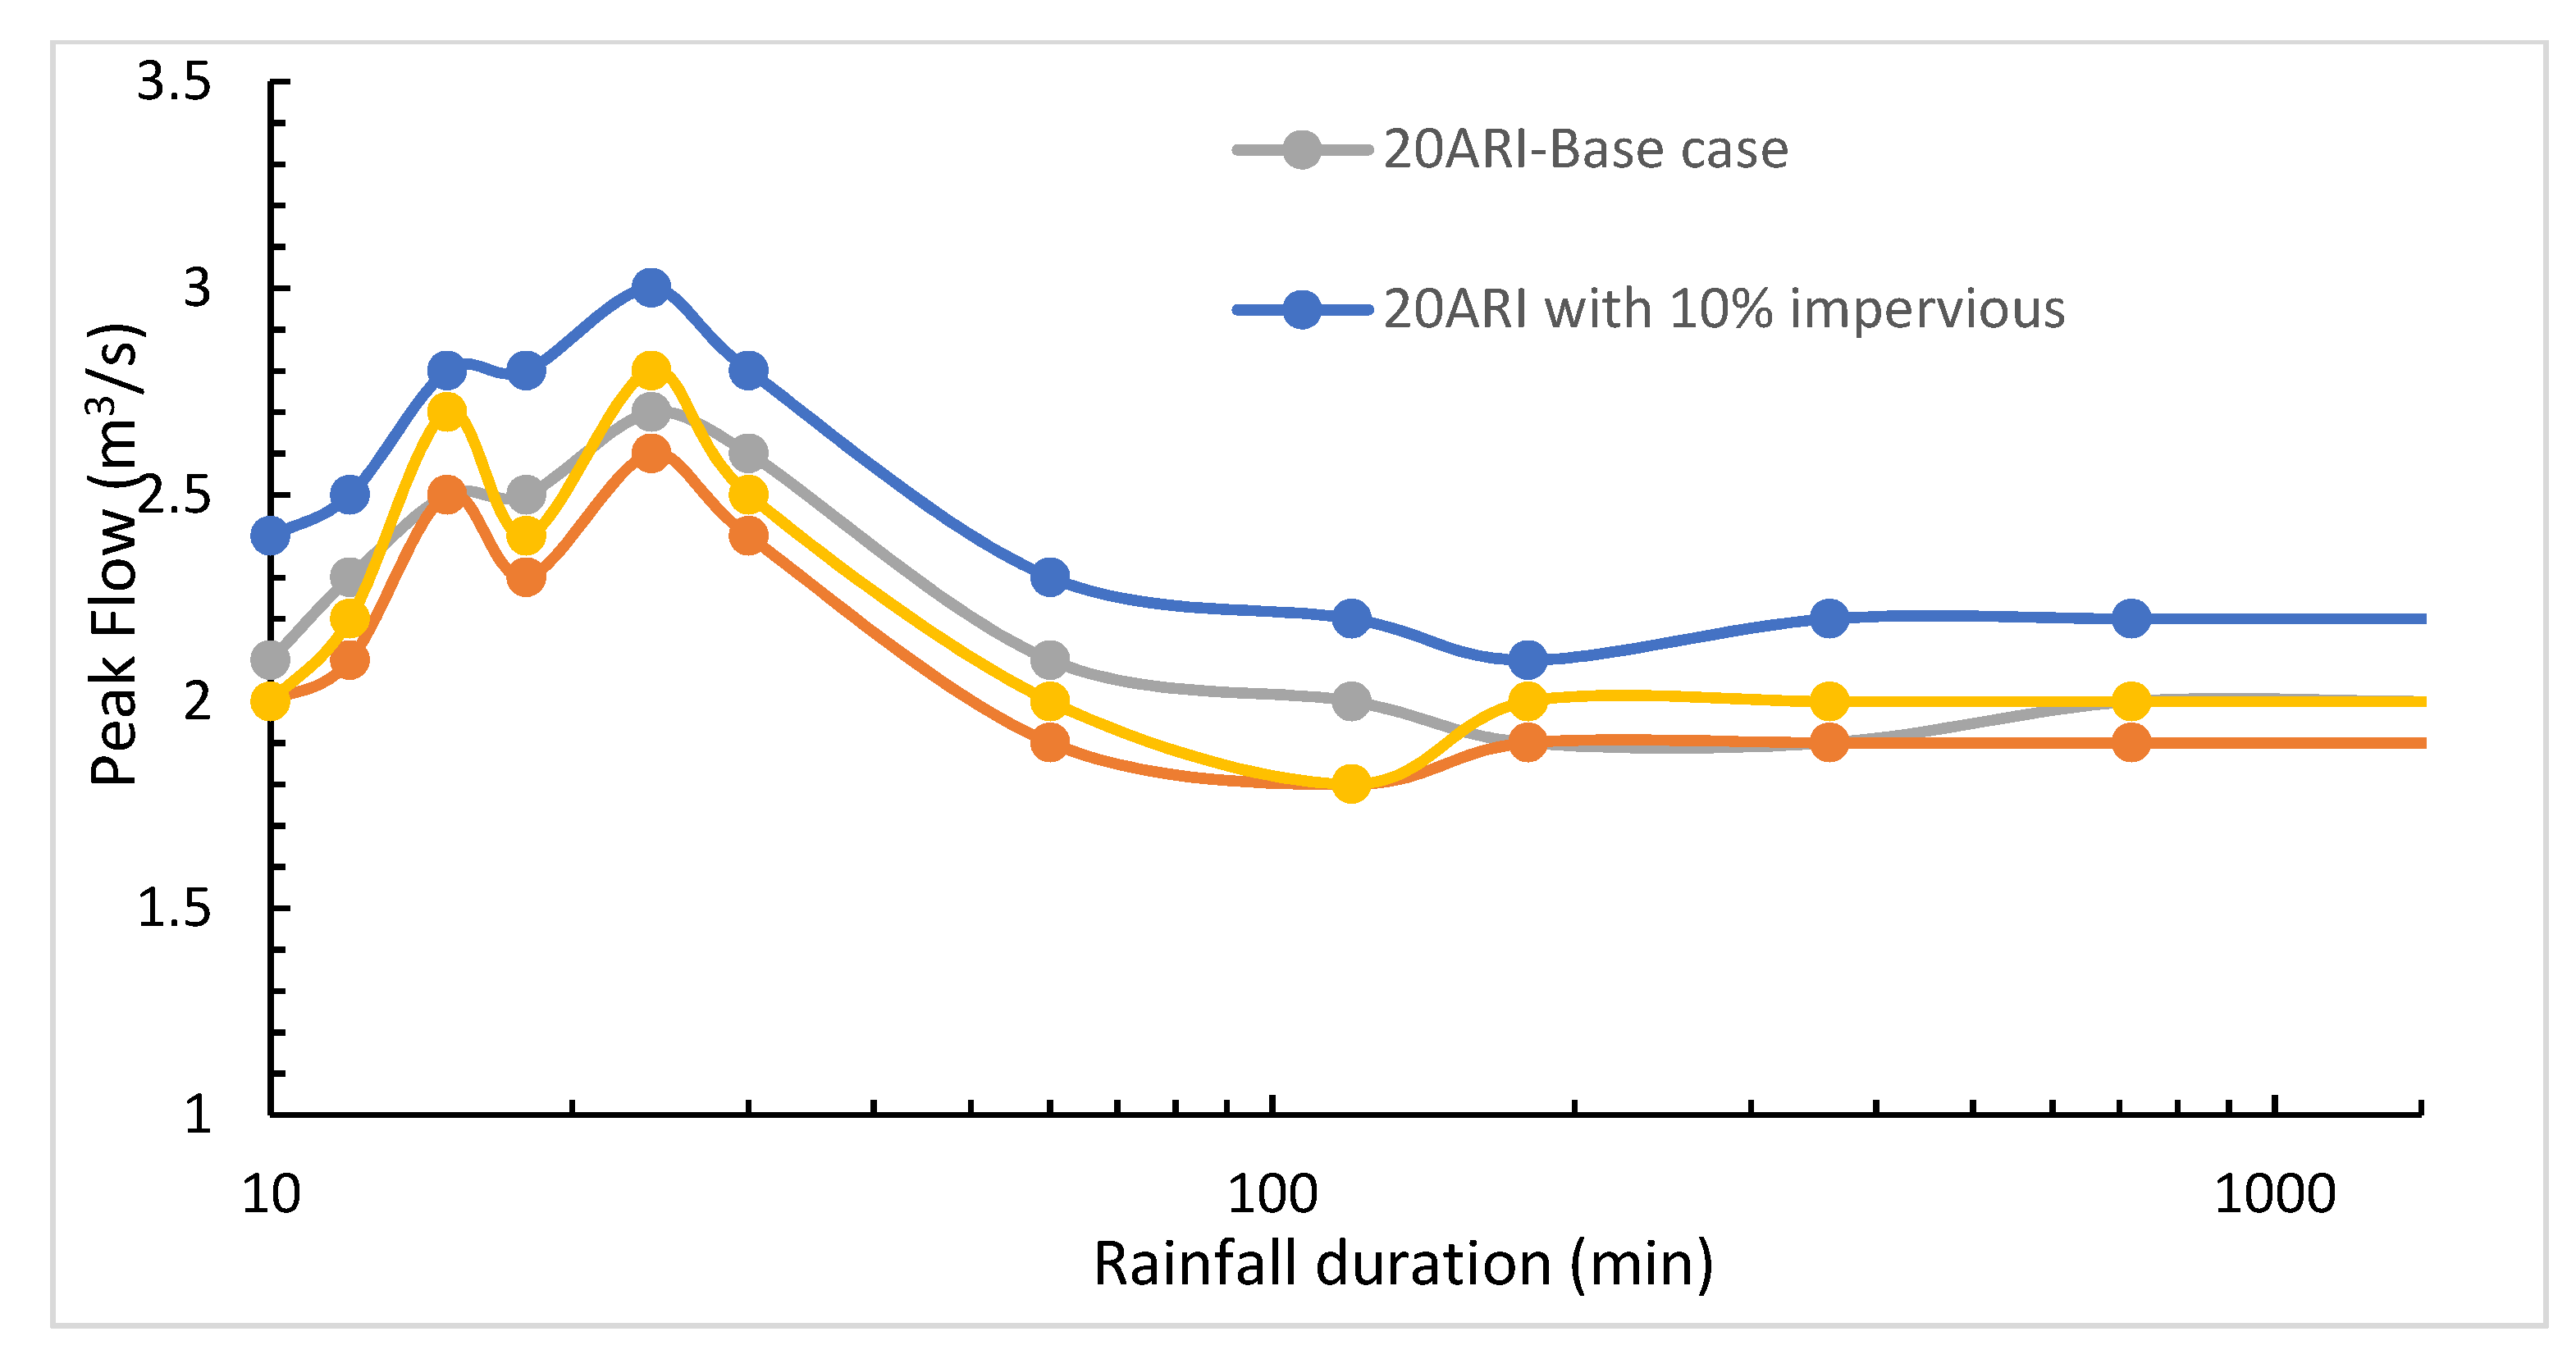
3.3. Land Use Change Scenario
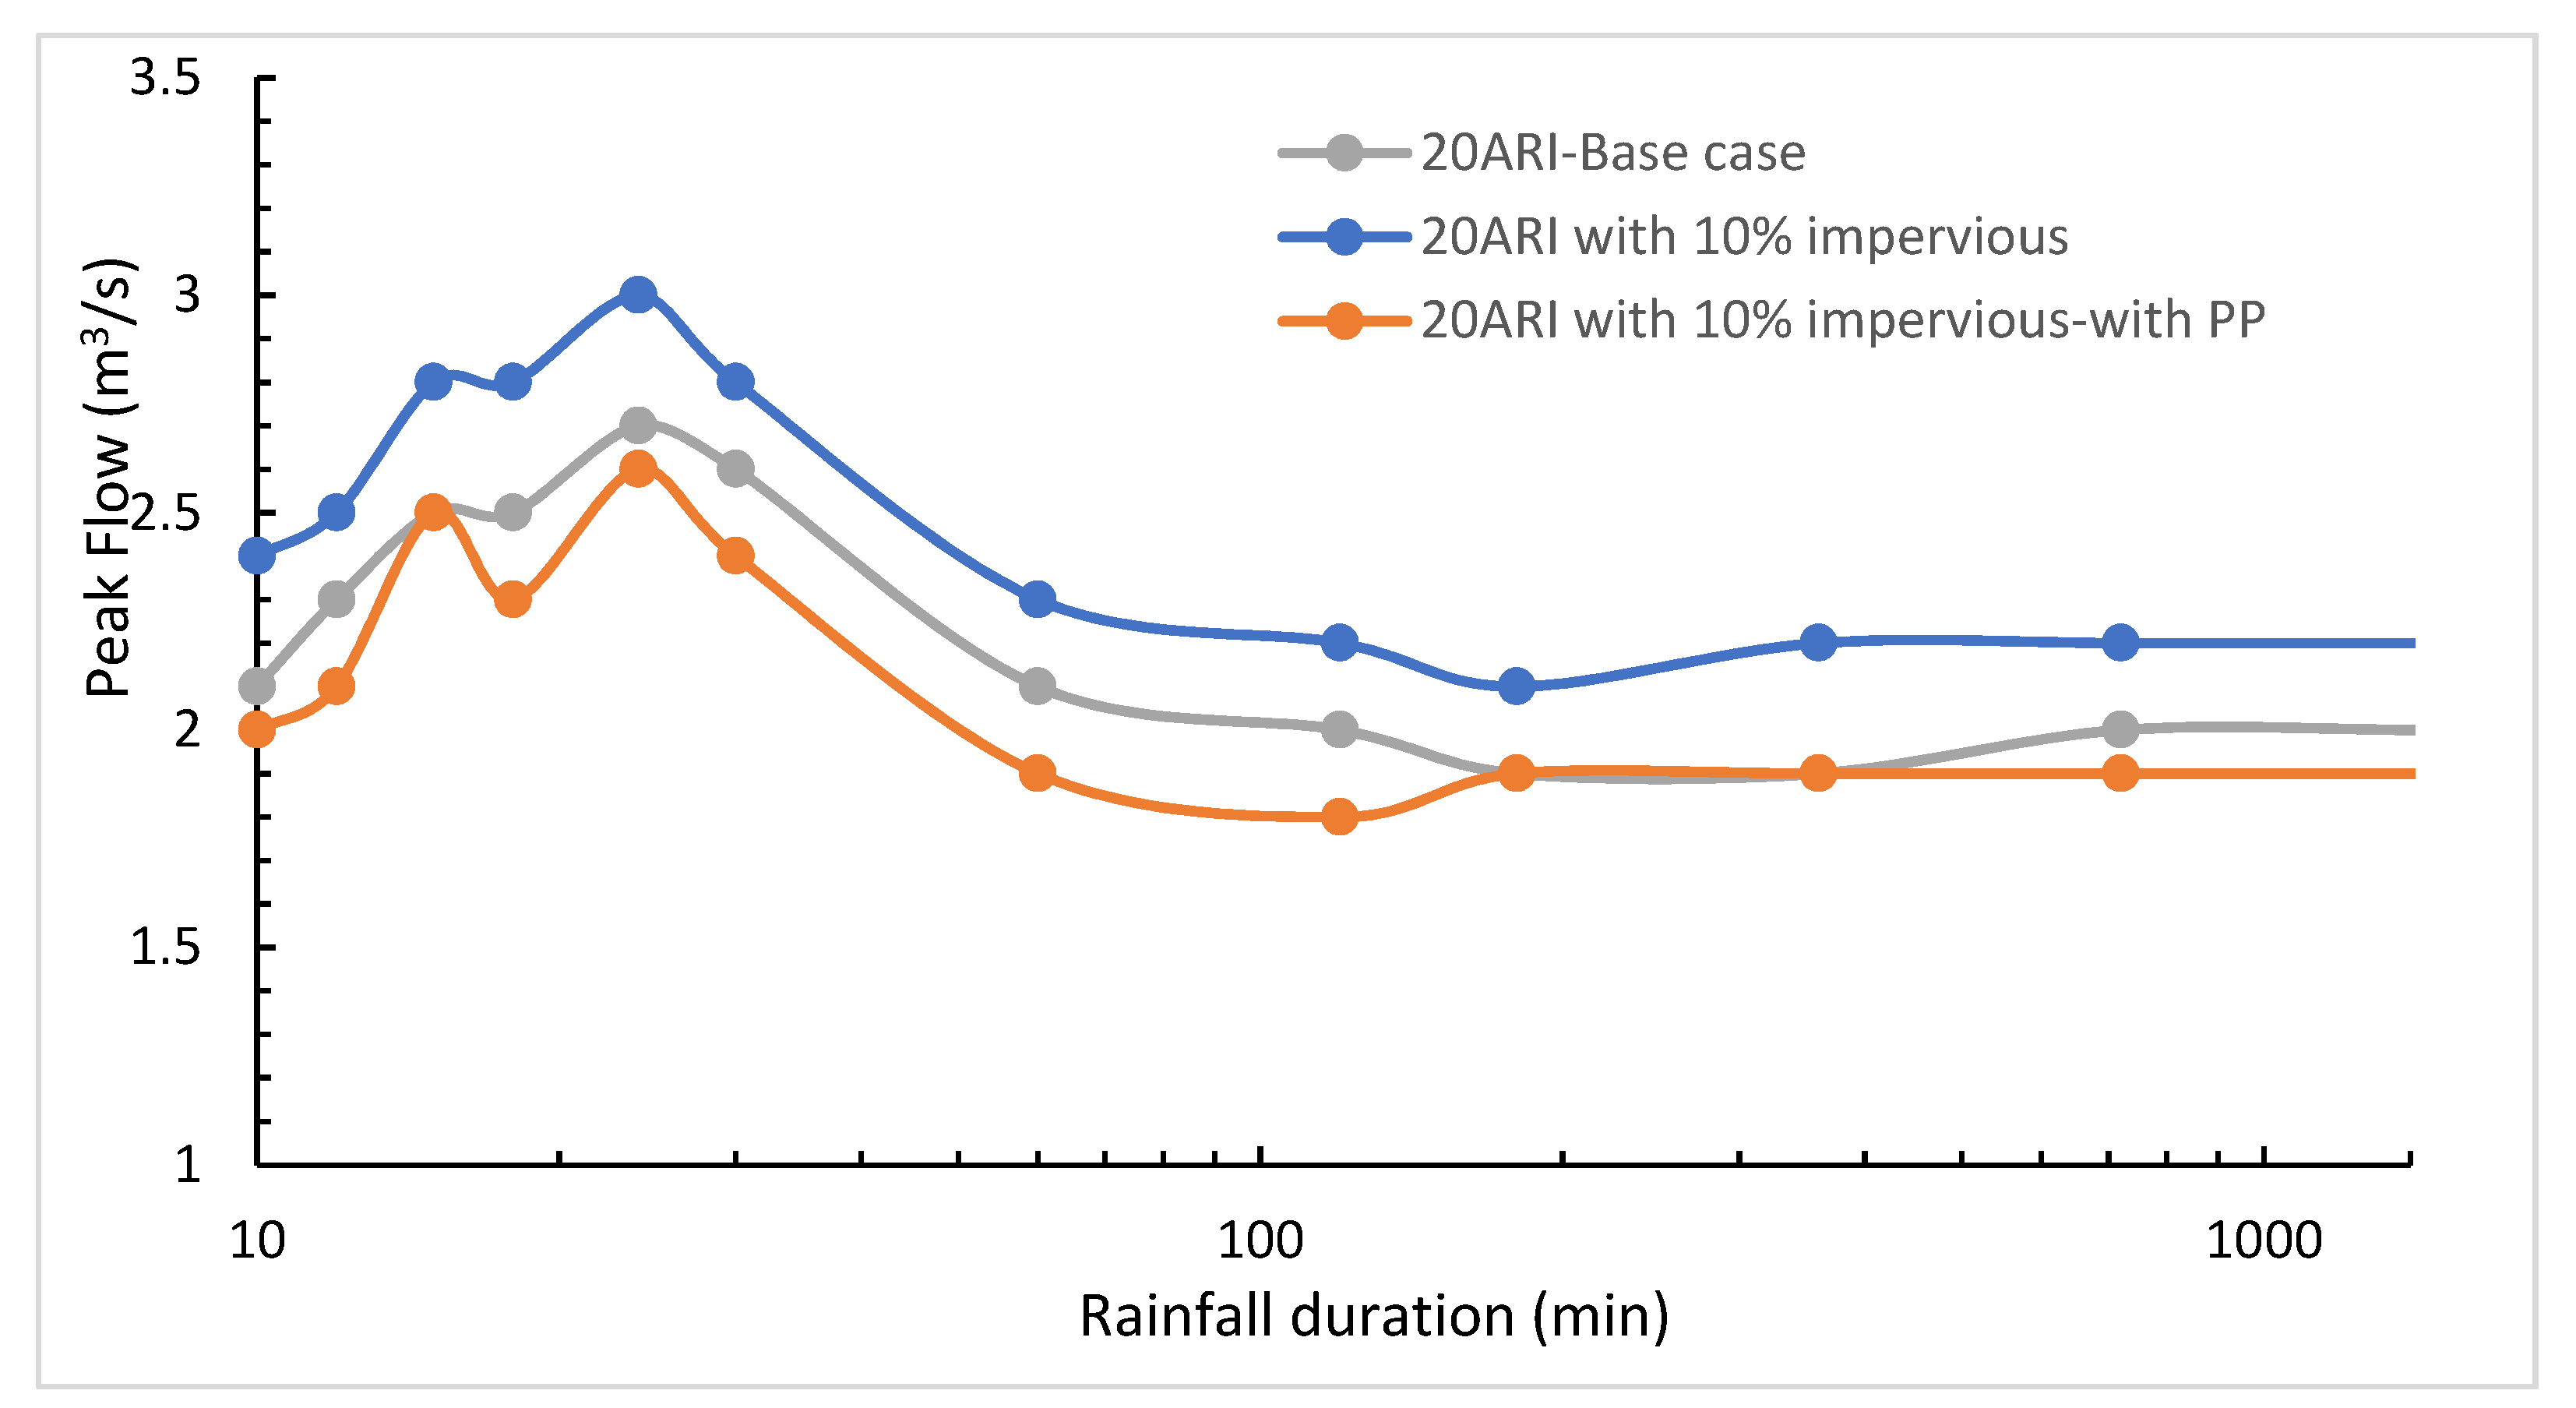
3.3.1. Increasing the Percentage Impervious by 10% for 20 ARI Storm Event
The effect of increased imperviousness on the performance of permeable pavements was investigated by comparing peak flows for 20 year ARI storm events. The percentage imperviousness for each sub catchment was increased by 10% to model increasing urbanisation at the University of Melbourne. Increasing the impervious cover increases the peak flow by 0.3–0.5 m
3/s for all durations of storm events (
Figure 7) when compared to the base case (no PP). However, with the permeable pavements case, stormwater runoff (flood discharge) reduces compared to the base case, demonstrating the role of PPs in flood mitigation. The percentage reductions in flow are similar despite the increase in imperviousness. This shows that permeable pavements remain effective under the modelled land-use change. Additionally, it is noted that the percentage reduction in flood discharge is greater for small duration rainfall events than for larger rainfall durations (100 min and above).
Land use changes that were modelled by increasing the percentage imperviousness of the catchment by 10% show that permeable pavements retain their capability to reduce runoff for the 20 year ARI storm. This suggests that permeable pavements can still provide benefits for stormwater management despite the changes in land use by reducing the volume of stormwater that is produced and by reducing the size or need for other water retention facilities.
3.3.2. Clogging
Clogging is one of the main issues with permeable pavements in an urban setting. Therefore, we analysed peak flows when permeable pavements are partially clogged. This analysis was built on from the previous scenario (20 year ARI, 10% increase in imperviousness). The exfiltration rate of permeable pavements was reduced from 3600 mm/h full operation to 360 mm/h semi-clogged. Within this scenario, the performance of permeable pavements was reduced very marginally, and results were similar to the fully operational state (
Figure 8). Noticeable reductions in performance occurred only when the exfiltration rate was reduced to 36 mm/h, which is significantly clogged.
Figure 7 shows that permeable pavement performance can be affected by up to 6%. This equates to a surplus of 4475 megalitres of stormwater that is discharged to the major pipe network per year based on the surface runoff calculated if no PPs were installed.
Marginal performance reductions were noted when the system was modelled to be significantly clogged. Allowances should therefore be made in the design for a 90% reduction in infiltration capacity over the 20-year design life, after which the aggregate layer may require replacement.
Previous literature reports the continuous decline of infiltration rates through permeable pavements due to clogging a few years after installation [
19]. This is due to the deposition of particulate matter on pavement surfaces. Our study proved that clogging could reduce the performance of permeable pavements by 3–6% when pavements are semi-clogged. The trapping of sediments within permeable pavements during infiltration is an important process that contributes to its water quality treatment performance [
20]. However, this process also creates clogging within permeable pavements, that reduces the infiltration rates. This issue could be tackled to some extent through maintenance and regular cleaning. Many previous studies have shown that the infiltration rates of permeable pavements can be improved with proper maintenance [
18,
21,
22].
From a commercial point of view, the lifetime cost of floods to the Australian economy are estimated to be upwards of
$20 billion [
23,
24]. This creates a strong case for implementing measures to mitigate the risk of floods to protect both public safety and infrastructure. As mentioned earlier, the majority of Melbourne’s drainage infrastructure is over 60 years old with most areas only able to accommodate 5-year ARI events [
22]. The City of Melbourne’s target of upgrading stormwater infrastructure to be able to handle 20-year ARI storm events will require roughly a 10% increase in the drainage system costs. As such, retrofits of permeable pavements offer an economically viable solution for decision makers to implement, along with other suitable WSUD.
4. Discussion
The performance of PP was investigated under storm durations ranging from 10 min to 24 h and average recurrence intervals of 5, 20, and 100 years. The storm duration that produces the greatest peak flows was selected as the critical duration for each ARI. Results show that PP can achieve reductions to the highest peaks found in the 180-min 5 year ARI, 24-min 20 year ARI, and 18-min 100 year ARI storm by 16%, 12% and 10%, respectively.
The results indicate that PP is effective at reducing peak discharges and runoff volumes for shorter but more frequent storm events of up to 18-min. The performance of PP for the 5 year ARI storm is improved once the rainfall intensity has subsided and the system has had time to drain. For the 20 year ARI storm, PP is most effective for storms of a 120-min duration with moderate rainfall intensities (around 15 mm/h). For the 1 in 100-year flood, pavements become overloaded for short and highly intense rainfall but are capable of reducing flows by up to 17% at the 24-h mark where intensities are much lower (around 3 mm/h).
Land use changes that were modelled by increasing the percentage pervious of the catchment by 10% shows PP retaining its capability to reduce runoff for the 20 year ARI storm. This suggests that PP can still provide benefits to stormwater management despite the changes in land use by reducing the volume of stormwater produced and by reducing the size or need for other water retention facilities.
Marginal performance reductions were noted when the system was modelled to be significantly clogged. Allowances should therefore be made in the design for a sequential reduction in the infiltration capacity over the 20-year design life, after which the aggregate layer may require replacement.
Limitations and Future Work
It should be noted that our models have not been calibrated to the observed rainfall and discharge data in the Elizabeth Street Catchment. The synthetic rainfall series used in our model was for another study at Mt. Evelyn where the rainfall intensities are lower compared to our study site. This means that our model has underestimated the amount of discharge that is produced at the University of Melbourne. For the 5 year ARI, the margin of inaccuracy is negligible; however, for storm events of 20 and 100-years, this margin increases to 10 and 20% respectively.
Further, water treatment systems should not be modelled in isolation from each other. Our study has solely focused on the impact of permeable pavements on reducing peak flows to the exclusion of other water retention devices such as rainwater tanks and rain gardens. The omission of these other technologies from our model has the implication of over-estimating the flow produced. For the purposes of our highly conceptual study, the runoff routing procedure to determine the time of concentrations was based on a simplified method that should be subject to detailed design. As such, the model results provide useful insights but should be used with caution.
5. Conclusions
This study investigates how permeable pavement implementation impacts urban flooding in a highly urbanised catchment in Melbourne, Australia. The effectiveness of permeable pavement implementation was analysed with various rainfall scenarios (with average recurrence intervals and storm durations) and various land use scenarios (increased imperviousness and clogging). Main findings of our study are summarized below.
The performance of the permeable pavement was substantially affected by the intensity and duration of the rainfall event. Our research has shown that permeable pavements are effective at reducing flows for:
- (1)
smaller, shorter, and highly intense rainfall events;
- (2)
larger, longer, but lower intensity storm events
Land use changes were incorporated into our model to simulate a 10% increase in impervious area. For the 20 year ARI storm that was investigated for this scenario, PP has been shown to sustain its performance and reduce flow discharge by up to 17%. Results from the clogging scenario pointed to a reduction in PP capabilities by up to 6% when the exfiltration rate was decreased from 3600 mm/h fully operational to 360 mm/h semi clogged. With appropriate maintenance measures in place, the life of PP can extend to 20 years, which positions the technology as a viable solution for urban stormwater management.
Author Contributions
Conceptualization: I.C., M.H.N., T.D.F. and M.A.; methodology: I.C., M.H.N., T.D.F., M.A. and M.J.B.; software, I.C., M.H.N., T.D.F. and M.J.B.; validation, I.C., M.H.N., T.D.F. and M.A.; formal analysis, I.C., M.H.N., M.A., M.J.B. and P.F.; investigation, I.C. and M.H.N.; resources, T.D.F., M.A. and M.J.B.; writing—original draft preparation, I.C., M.H.N., P.F. and M.A.; writing—review and editing, M.A., P.F. and M.J.B.; supervision, M.A., T.D.F. and M.J.B. All authors have read and agreed to the published version of the manuscript.
Funding
This research received no external funding.
Data Availability Statement
The data will be available on request.
Acknowledgments
The authors would like to thank the Editor and two anonymous reviewers for taking time to provide their helpful feedback and suggestions.
Conflicts of Interest
The authors declare no conflict of interest.
References
- Vaillancourt, C.; Duchesne, S.; Pelletier, G. Hydrologic Performance of Permeable Pavement as an Adaptive Measure in Urban Areas: Case Studies near Montreal, Canada. J. Hydrol. Eng. 2019, 24, 05019020. [Google Scholar] [CrossRef] [Green Version]
- Aryal, S.K.; Ashbolt, S.; McIntosh, B.S.; Petrone, K.P.; Maheepala, S.; Chowdhury, R.K.; Gardener, T.; Gardiner, R. Assessing and Mitigating the Hydrological Impacts of Urbanisation in Semi-Urban Catchments Using the Storm Water Management Model. Water Resour. Manag. 2016, 30, 5437–5454. [Google Scholar] [CrossRef]
- Donofrio, J.; Kuhn, Y.; McWalter, K.; Winsor, M. Research Article: Water-Sensitive Urban Design: An Emerging Model in Sustainable Design and Comprehensive Water-Cycle Management. Environ. Pract. 2009, 11, 179–189. [Google Scholar] [CrossRef]
- Scholz, M.; Grabowiecki, P. Review of permeable pavement systems. Build. Environ. 2007, 42, 3830–3836. [Google Scholar] [CrossRef]
- Yang, Q.; Beecham, S.; Liu, J.; Pezzaniti, D. The influence of rainfall intensity and duration on sediment pathways and sub-sequent clogging in permeable pavements. J. Environ. Manag. 2019, 246, 730–736. [Google Scholar] [CrossRef] [PubMed]
- Shackel, B. The design, construction and evaluation of permeable pavements in Australia. In Proceedings of the 24th ARRB Conference, Melbourne, Australia, 12–15 October 2010. [Google Scholar]
- Fassman, E.A.; Blackbourn, S. Urban Runoff Mitigation by a Permeable Pavement System over Impermeable Soils. J. Hydrol. Eng. 2010, 15, 475–485. [Google Scholar] [CrossRef]
- Damodaram, C.; Zechman, E.M. Simulation-Optimization Approach to Design Low Impact Development for Managing Peak Flow Alterations in Urbanizing Watersheds. J. Water Resour. Plan. Manag. 2013, 139, 290–298. [Google Scholar] [CrossRef]
- Booth, D.B.; Leavitt, J. Field Evaluation of Permeable Pavement Systems for Improved Stormwater Management. J. Am. Plan. Assoc. 1999, 65, 314–325. [Google Scholar] [CrossRef]
- Qin, H.-P.; Li, Z.-X.; Fu, G. The effects of low impact development on urban flooding under different rainfall characteristics. J. Environ. Manag. 2013, 129, 577–585. [Google Scholar] [CrossRef] [PubMed] [Green Version]
- Kuruppu, U.; Rahman, A.; Rahman, M.A. Permeable pavement as a stormwater best management practice: A review and discussion. Environ. Earth Sci. 2019, 78, 327. [Google Scholar] [CrossRef]
- Braswell, A.S.; Winston, R.J.; Hunt, W.F. Hydrologic and water quality performance of permeable pavement with internal water storage over a clay soil in Durham, North Carolina. J. Environ. Manag. 2018, 224, 277–287. [Google Scholar] [CrossRef] [PubMed]
- Sansalone, J.; Kuang, X.; Ying, G.; Ranieri, V. Filtration and clogging of permeable pavement loaded by urban drainage. Water Res. 2012, 46, 6763–6774. [Google Scholar] [CrossRef] [PubMed]
- Raeesi, R.; Xue, Y.; Disfani, M.M.; Arora, M. Hydrological and water quality performance of Waste Tire Permeable Pavements: Field monitoring and numerical analysis. J. Environ. Manag. 2022, 323, 116199. [Google Scholar] [CrossRef] [PubMed]
- Water Corporation. Elizabeth Street Catchment Integrated Water Cycle Management Plan; Water Corporation: Melbourne, Australia, 2019. [Google Scholar]
- Kunapo, J.; Fletcher, T.D.; Ladson, A.R.; Cunningham, L.; Burns, M.J. A spatially explicit framework for climate adaptation. Urban Water J. 2018, 15, 159–166. [Google Scholar] [CrossRef]
- HydroCon. HydroSTON Permeable Paving; HydroCon: Waterloo, Australia, 2016. [Google Scholar]
- Hu, M.; Zhang, X.; Li, Y.; Yang, H.; Tanaka, K. Flood mitigation performance of low impact development technologies under different storms for retrofitting an urbanized area. J. Clean. Prod. 2019, 222, 373–380. [Google Scholar] [CrossRef]
- Kumar, K.; Kozak, J.; Hundal, L.; Cox, A.; Zhang, H.; Granato, T. In-situ infiltration performance of different permeable pavements in a employee used parking lot—A four-year study. J. Environ. Manag. 2016, 167, 8–14. [Google Scholar] [CrossRef] [PubMed]
- Bean, E.Z.; Hunt, W.F.; Bidelspach, D.A. Evaluation of Four Permeable Pavement Sites in Eastern North Carolina for Runoff Reduction and Water Quality Impacts. J. Irrig. Drain. Eng. 2007, 133, 583–592. [Google Scholar] [CrossRef]
- Bean, E.Z.; Hunt, W.F.; Bidelspach, D.A. Field Survey of Permeable Pavement Surface Infiltration Rates. J. Irrig. Drain. Eng. 2007, 133, 249–255. [Google Scholar] [CrossRef]
- Kamali, M.; Delkash, M.; Tajrishy, M. Evaluation of permeable pavement responses to urban surface runoff. J. Environ. Manag. 2017, 187, 43–53. [Google Scholar] [CrossRef] [PubMed]
- Parliament of Australia. Stormwater Management in Australia; Parliament of Australia: Canberra, Australia, 2015. [Google Scholar]
- Australian Business Roundtable for Disaster Resilience and Safer Communities. The Economic Cost of the Social Impact of Natural Disasters; Australian Business Roundtable for Disaster Resilience and Safer Communities: Sydney, Australia, 2016. [Google Scholar]
| Disclaimer/Publisher’s Note: The statements, opinions and data contained in all publications are solely those of the individual author(s) and contributor(s) and not of MDPI and/or the editor(s). MDPI and/or the editor(s) disclaim responsibility for any injury to people or property resulting from any ideas, methods, instructions or products referred to in the content. |
© 2023 by the authors. Licensee MDPI, Basel, Switzerland. This article is an open access article distributed under the terms and conditions of the Creative Commons Attribution (CC BY) license (https://creativecommons.org/licenses/by/4.0/).


