
Evolution of Water–Sediment Situation and Attribution Analysis in the Upper Yangtze River, China
by
 , ,
, ,
Hongxiang Wang
,
Yinchu Ma
,
Fengtian Hong
,
Huan Yang
,
Lintong Huang
,
Xuyang Jiao
and
Wenxian Guo
* College of Water Resources, North China University of Water Resources and Electric Power, Zhengzhou 450045, China
*
Author to whom correspondence should be addressed.
Water 2023, 15(3), 574; https://doi.org/10.3390/w15030574
Submission received: 25 October 2022
/
Revised: 25 January 2023
/
Accepted: 29 January 2023
/
Published: 1 February 2023
(This article belongs to the Section Ecohydrology)
Abstract
:River water and sand conditions are important factors affecting river morphology, biogeochemical processes and ecosystems. However, climate change and long-term human activities have changed the water–sediment conditions of rivers. This study combines the ecohydrological indicator range of the variation approach (IHA-RVA) and the genetic planning approach in order to dissect the water–sediment situation and its ecological response relationship in the upper Yangtze River. The synergistic effects of climate change and human activities on sediment–runoff were quantified based on the Budyko hypothesis and the sediment attribution decomposition method. The results showed that the interannual trend in sand transport decreased significantly compared to the runoff at each station in the upper Yangtze River, and that it began to change abruptly in 1985 and 1993, respectively (mean values of 56.8% and 70%, respectively); there were also different degrees of decreases in fish species diversity attributed to the combined effects of reduced rainfall and reservoir construction. The factors driving changes in watershed runoff were dominated by human activities (approximately 60%), while changes in sand transport were mainly driven by the sand production capacity in the watershed, both of which contributed more than 95%. The research process and results contribute to an in-depth understanding of the characteristics and driving mechanisms of river water and sand evolution under changing environments, and provide a scientific basis for watershed water resource management and ecological restoration.
1. Introduction
As an important hydrological factor of the river system, the runoff and sediment of the river play a key role in the physical, chemical, geological, geomorphological, and ecological evolution process in the basin [1]. In the hydrological cycle, climate change and human activities are important drivers of hydrological and water resource changes in the basin, where climate mainly influences regional water resource distribution through temperature, evapotranspiration, and the spatial and temporal distribution of precipitation. Human activities mainly affect the changing pattern of natural water and sand in rivers through the construction and operation of water conservancy projects, soil and water conservation work, and land use [2]. Quantifying the relative impacts of climate change and human activities on water sediment can help identify the hydrological response of various drivers, which is important for watershed water resource management and the sustainable development of ecosystems.
A complete assessment of changes in the hydrological situation of a river should analyze one or more elements under a specific activity, especially the changes in flow patterns between two time periods and the optimal operation of hydraulic facilities [3,4]. The hydrological situation of rivers can be further reduced to the spatial and temporal variability in runoff and sediment [5]. Runoff is an important process element for the growth and development of plants and animals in water ecosystems, while sediment alteration involves the habitat configuration of aquatic plants and animals, and waterfront organisms [6]. Sediment transport is accompanied by runoff flows, giving the river organisms the nutrients they need [7]. Therefore, the influence of the change in runoff–sediment synergy on the organisms in the river under the changing environment cannot be ignored. However, there are few studies on quantifying the runoff–sediment synergy and its ecological response process in large-scale watersheds [8,9].
In the past decades, most studies have tended to analyze the effects of human activities and climate change on changes in watershed runoff [10,11]. Based on the properties of runoff changes, water balance theory and mathematical and statistical methods have become the main methods of studying them [12]. The Budyko hydrothermal coupled equilibrium theory is an important attribution analysis method that has been improved and refined in a series of ways, and several empirical relationships have been extended based on the Budyko hydrothermal coupling hypothesis; this is widely used in the equilibrium distribution of watershed energy, multi-year average water volume calculation and the prediction of the interannual variation in both [13,14,15]. Fu combined the water balance principle with the hydrothermal method principle to refine the boundary conditions of the Budyko hypothesis and make it more compatible with the applied research field [16,17,18]. Yang used the Choudhury–Yang equation based on the Budyko hypothesis to quantitatively assess the drivers of runoff variability in 64 catchments, and the method has since been widely used in wet and non-wet areas, and to verify the generalizability of the Budyko hypothesis in Chinese river systems [19,20]. Li used the double cumulative curve method to quantitatively attribute water and sand changes in the Jinsha River basin in the upper reaches of the Yangtze River, concluding that the construction of cascade reservoir groups is the main factor affecting sand transport, accompanied by the influence of factors such as mining and deforestation [21]. Wang used the sediment attribution decomposition method to analyze the changes in sand transport in the Yellow River basin and found that the decrease in sand transport was mainly due to the decrease in water production, which was mainly influenced by engineering and vegetation measures [22]. It has been shown that damming has a sediment load reduction effect by reducing the continuity of water and sand transport in river systems, and is widespread worldwide [23,24]; meanwhile, land use (deforestation, etc) increases the production of surface sediment [25]. There are also many factors affecting sediment, and the mainstream currently considers rainfall, flow production, and sediment production as the important drivers of sediment transport [26]. However, current research on the quantitative assessment of the attribution of changes in sand transport is lacking, especially on how to allow the attribution of changes in the water–sand flux to various human activities, such as reservoir construction and land use change [27,28]. In the Chinese region, most studies related to sedimentation have focused on the Yellow River basin, where soil erosion is severe. Although the upper Yangtze River does not contain as much sand as the Yellow River, the influence of sediment has been further expanded at long time scales due to the increasing number of large reservoirs and other hydraulic facilities in recent decades. Next, most of the studies on water and sand in the Yangtze River basin also focus on the basin conditions at a local scale (e.g., Jialing River basin, etc.), and the differences in the methods used and the time interval between the selected hydro-meteorological data series may also produce some differences in the study results [29].
As a typical large river basin, the upper Yangtze River has experienced significant changes in sand production under the influence of a multi-year changing environment [30,31], and an in-depth analysis of the driving mechanisms of sand production changes is important for studying the evolution of river morphology, reservoir optimization and water resource development and utilization; it also helps to understand the basic principles of natural flow in real-world river systems [32]. In this study, we adopted a comprehensive analysis approach to analyze the variability in hydrological elements in the upper Yangtze River at different spatial and temporal scales, and the variability characteristics of water and sand by dividing long-time hydrological series and establishing IHA hydrological indicators based on an updated database. On this basis, we proposed a comprehensive evaluation system based on the water–sand relationship curve method, the Budyko hypothesis, and the sediment attribution decomposition method, in order to quantify the effects of climate change and multiple human activities on the changes in the water–sand relationship in the watershed. The results of the study are important for clarifying the characteristics of water and sand distribution, change patterns, driving mechanisms, and the ecosystem response characteristics in the upper reaches of the Yangtze River, and can provide a theoretical basis for the next research on water and sand regulation in reservoir groups.
2. Study Area and Data
2.1. Study Area
The Yangtze River is the world’s third longest river (approximately 6300 km). It has the fifth highest river flow and fourth highest sediment volume. The basin covers 1.9 × 10⁶ square kilometers, or nearly 20% of China’s land area. It originates on the Qinghai–Tibet Plateau from the southwest side of Gradandong Snow Mountain, the main summit of the Tanggula Mountains. It stretches from central China to the East China Sea and has a population of over 480 million people [33].
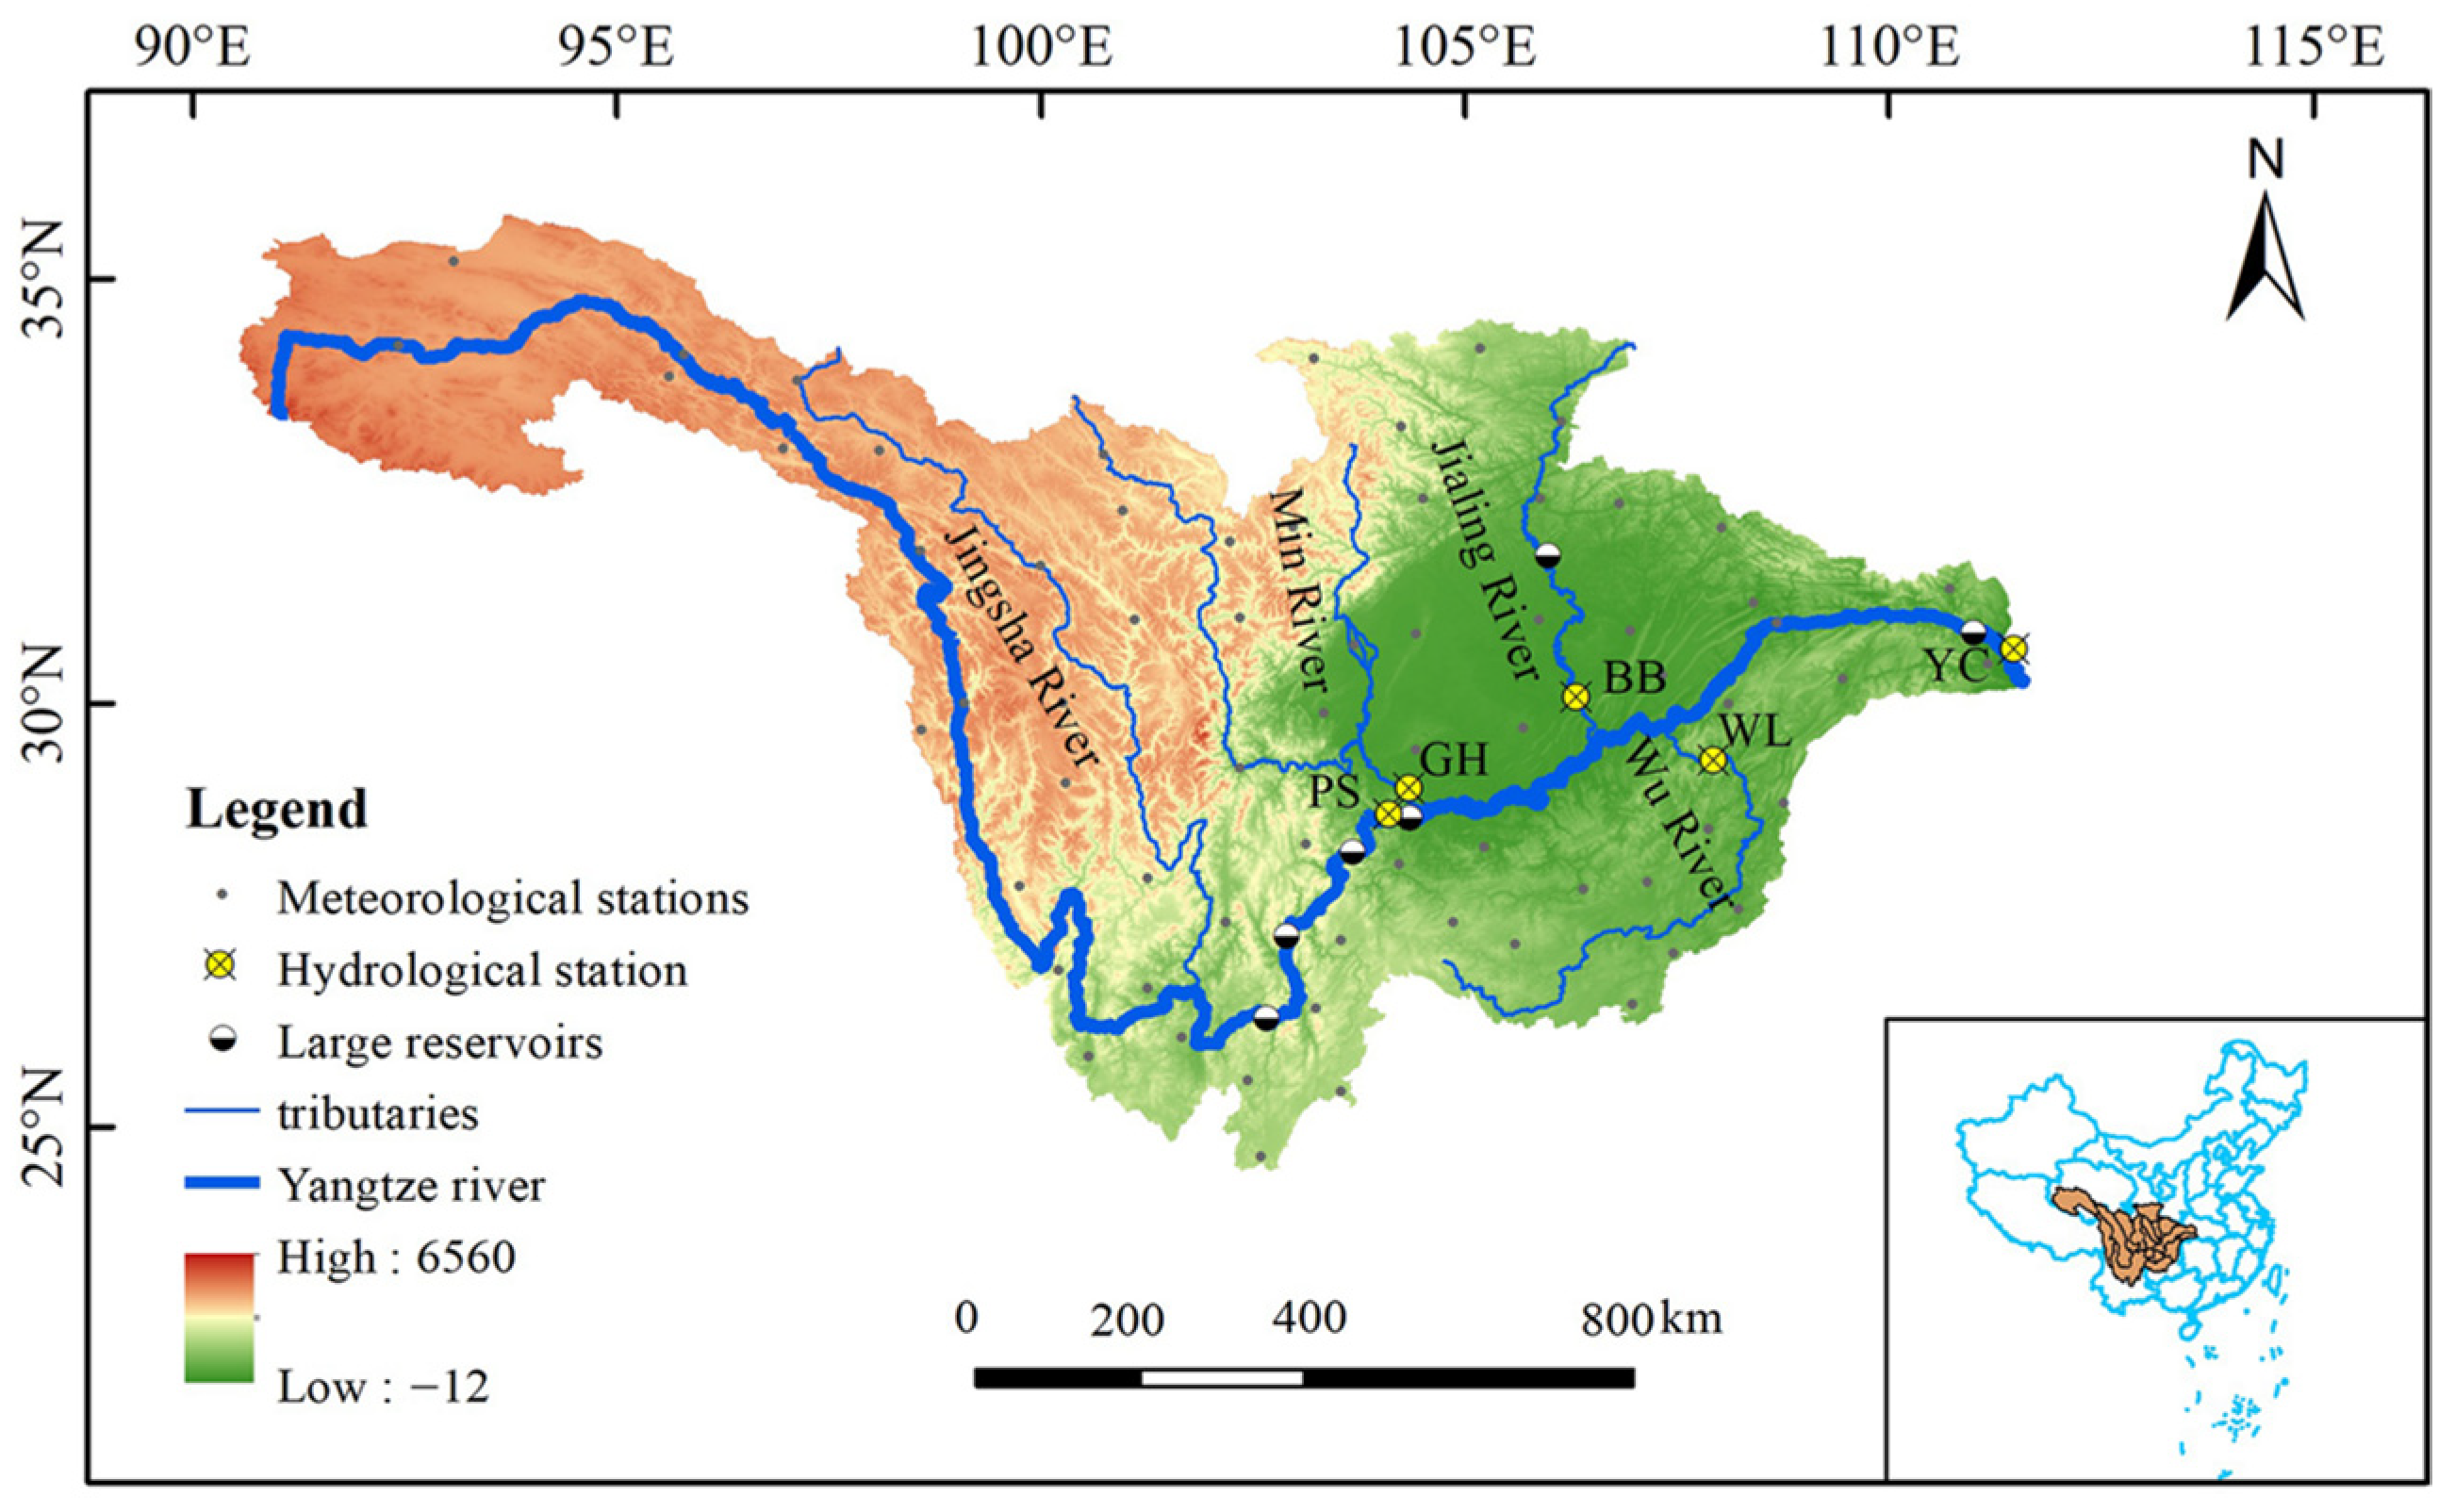
The river basin, from its source to Yichang, is located in the upper reaches of the Yangtze River. It is located in the southwestern region of China. It is located between 97° E~111° E and 21° N~34° N. It is high in the west and low in the east (Figure 1). It flows through eight provinces and cities in China, including Tibet, Qinghai, Gansu, Sichuan, Chongqing, Guizhou, Yunnan and Hubei. The length of the trunk stream is approximately 4500 km, with a basin area of nearly 1.08 × 10⁶ km2, accounting for approximately 56% of the entire Yangtze River basin. The upper parts of the Yangtze River have mostly hilly topography, with an average riverbed slope of 1.1%, making them the primary source region of water and sediment in the Yangtze River basin. The upper Yangtze undergoes great temporal fluctuation in precipitation, with the majority of river flow (approximately 75%) and sediment load (approximately 85%) released during the rainy season (May to October), near the basin’s exit (approximately 1200 km downstream of Yichang).
2.2. Data
In this study, the upper reaches of the Yangtze River were divided into trunk streams and four branches, according to the following hydrological control stations: Yichang station (YC)—trunk stream, Pingshan station (PS)—Jinsha River, Beibei station (BB)—Jialing River, Gaochang station (GC)—Minjiang River, and Wulong station (WL)—Wujiang River. Based on the theory of river ecohydrology, the statistical analysis of historical data and field monitoring data, the daily flow data of the above five hydrological stations from 1956 to 2020 were selected from the “Hydrological Yearbook of the Yangtze River Basin”, and the daily sediment transport data from 1965 to 2020 were selected from the “China River Sediment Bulletin”. The meteorological data were selected from 52 meteorological stations, including Suining, Leshan, Batang, Lijiang, Shapingba, Yuqing, and Wufeng, for daily precipitation, average temperature, and sunshine hours, etc. The data were obtained from the China Meteorological Data Network. The land use data were received from the Geographic State Monitoring Cloud Platform and were based on Landsat 30 m remote sensing images.
3. Methods
3.1. TFPW–MK Trend Mutation Test
The Mann–Kendall (M–K) trend test method [34] is usually used to analyze the trends in hydrological series. Its advantage is that it does not depend on outliers and does not need to satisfy specific probability distribution. To enhance it, our study applied the Trend-Free Pre-Whitening (TFPW) Test [35]. The TFPW–MK method’s particular calculation stages are as follows:
where j < i; β is the linear trend of the series to be measured; Yt denotes a sequence with no trend term; r1 is the Yt correlation coefficient; denotes the sequence with the autocorrelation term removed; Tt is the compensation term; and is a new sequence with no autocorrelation.
When n ≥ 10, S approximately obeys the positive terrestrial distribution, and its average E(S) and variance var (S) are as follows:
where n is the number of data points, ti is the number of connections for the ith value, and m is the number of connection groups.
The standardized test statistic ZMK is as follows:
Here, bilateral tests are used at the α significant level if ; the series disproves the initial hypothesis of no trend. Sequences have a tendency to increase or decrease; conversely, sequences have no tendency to increase or decrease.
The Mann–Kendall mutation test was used to calculate the inverse series UB (UB= −UF) at the same time as the original time series statistic UF. The method of judgment is to observe whether the intersection of the two curves UF and UB appears at a given confidence level α. If there is an intersection, it is considered that a mutation occurs here, and can be judged as an increase or decrease in mutation by observing UF. For detailed calculation steps, see [36]. In this paper, the mean difference t-test [37] is used to further verify the mutation year, and the mutation index is calculated first:
where , are the average and standard deviation of the water temperature series before the mutation; , are the average and standard deviation of the water temperature series after the mutation year, respectively.
The statistic T is calculated as follows:
where M1 and M2 are the sample lengths before and after mutation, respectively; the following is the calculation of SP:
The T-statistic follows the T-distribution with M1 + M2 − 2 as the degree of freedom. If T < Tα (significant level α is taken as 0.05 in this paper), it means that the series before and after the mutation year are significantly different at the given significance level and satisfy the mutability test.
3.2. IHA-RVA Method
In this study, the Range of Variation Approach (RVA), built on Indicators of Hydrologic Alteration (IHA), was used to evaluate the hydrologic situation of the river in a changing environment and analyze the change process using five groups of ecohydrology indicators [38]. The 32 hydrological indicators in the IHA parameters were divided into five groups (Table 1), based on their influence in different ecosystems, in order to comprehensively evaluate the degree of change in the hydrological state of the river [39]. The following equation was used to calculate the degree of disruption of several hydrological indicators:
where Di is the degree of hydrological change in the first indicator; r is the proportion of indicators falling within the RVA target threshold before the change; and NT is the total number of years since the change in the hydrological indicator occurred. The number of years falling within the RVA target threshold and the expected number of years after the hydrological index change are denoted by N0i and Ne, respectively.
In order to objectively describe the change degree of each hydrological index, the value of Di is divided into three stages: less than 33% is unchanged or low change; 33–67% are moderate changes; and more than 67% are height changes [40]. The calculation formula for the overall hydrological change degree Do is as follows:
where n is the number of indicators, Do is the same as Di.
The calculation formula of deviation is as follows:
In the formula, P is the offset of the IHA index; Ppre is the average value of each IHA index in the period before influence; and Ppost is the average value of each IHA indicator in the post-impact period.
3.3. Ecological Diversity Assessment
In addition, we employed the river biodiversity Shannon Index (SI) to represent the ecological response process in the upper reaches of the Yangtze River, as a result of a change in the hydrological regime [41].
The calculation formula is as follows:
where Dmin indicates the Julian date of the minimum daily flow of water in the year; W3 and W5 represent March and May average flows, respectively; Min3 and Min7 are the annual minimum average 3-day and 7-day discharges; Max3 is the annual maximum annual 3-day discharge; and Rrate is the overflow rate.
3.4. Cumulative Curve Method
The cumulative curve method was used to accumulate water and sediment, and the change in the cumulative curve was used to describe the change in the water and sediment situation. When obvious turning occurs at a certain point, this indicates the characteristics of water and sediment change. When the slope of the cumulative curve is biased towards the coordinate axis, it indicates that the runoff (sediment discharge) increases or decreases. See specific references [42,43,44].
3.5. Water–Sediment Rating Curve Method
The water–sediment Rating Curve was used to reflect the sediment production characteristics of the watershed and the sediment transport characteristics of the river, and is defined as a power exponential relationship between the flow rate (Q) and the transport rate of suspended sediment (S). The form of expression is as follows:
where a is the coefficient and b is the index. The a indicates the characteristics of flow and sediment production in the watershed, which are influenced by external factors such as human activities, and are related to reservoirs, agricultural production, soil and water conservation projects, and reforestation projects. b indicates the characteristics of sediment transport in the river itself, which are influenced by internal factors, such as water velocity, flow rate, and sediment grade ratio, and are related to riverbed morphology and the river profile. The values of a and b indicate the variation in sediment transport under the influence of sediment supply and water flow [45].
3.6. Estimation of Potential Evapotranspiration
The potential evapotranspiration in this study was calculated using the FAO Pen-man–Monteith formula, which has been extensively used by domestic and foreign scholars:
where ET0 is the potential evapotranspiration (mm/d); is the slope of the saturation water pressure curve (KPa/°C); is the net surface radiation (MJ/m2d); G is the soil heat flux (MJ/m2d); is the dry and wet table constant (KPa/°C); T is the average daily air temperature (°C); is the wind velocity at 2 m from the ground (m/s); is the saturation water pressure (KPa); and is the actual water pressure (KPa). The meteorological data presented above were obtained from the China Meteorological Data Network, and the specific calculation process is depicted in [46].
3.7. Elasticity Factor Method Based on Budyko Assumption
Runoff changes in a watershed should take into account both climate and human activities [47]. The calculation formula is as follows:
where is the difference in flow change; and are the runoff changes due to climate change, representing the effects of rainfall and evapotranspiration, respectively; is the runoff changes due to human activities; and represent the contribution of climate change (rainfall and evapotranspiration) to runoff change; and represents the contribution of human activities to runoff change.
Using the elasticity factor method [48], the equation based on Budyko hypothesis is calculated based on the long-time water balance equation () of the basin and the dryness index (). The equations for calculating , and are as follows:
where Q, E0, P are the multi-year average runoff, potential evapotranspiration and precipitation respectively; and are the changes in potential evaporation and precipitation before and after the disturbance, respectively; and and are the elasticity indices of runoff to precipitation and potential evapotranspiration, respectively.
3.8. Sediment Attribution Decomposition Method
The Sediment attribution decomposition method [50] is a method used to diagnose the drivers of sediment transport variability. The method introduces the concept of sediment characteristic factor, and the sediment transport S can be regarded as a combination of three variables, namely the average precipitation (P), runoff (R) and sediment content (s) in the basin, with the following expressions:
because of
Therefore, the rate of change in the proportion corresponding to the sediment transport S is then expressed as follows:
For P, r, and s, this paper uses least squares to obtain the rates of change in the three variables over different time periods, and then normalizes them by the mean value of each variable before mutation. The relative importance of each element is then determined by dividing its commensurate rate of change over the same period by S’s proportional rate of change. The theoretical commensurate rate of evolution calculated by adding r(P), r(r), and r(s) is very close to S’s actual proportional rate of change.
4. Results and Analysis
4.1. Analysis of the Time-Varying Characteristics of Water and Sediment
4.1.1. Water and Sediment Trend Analysis
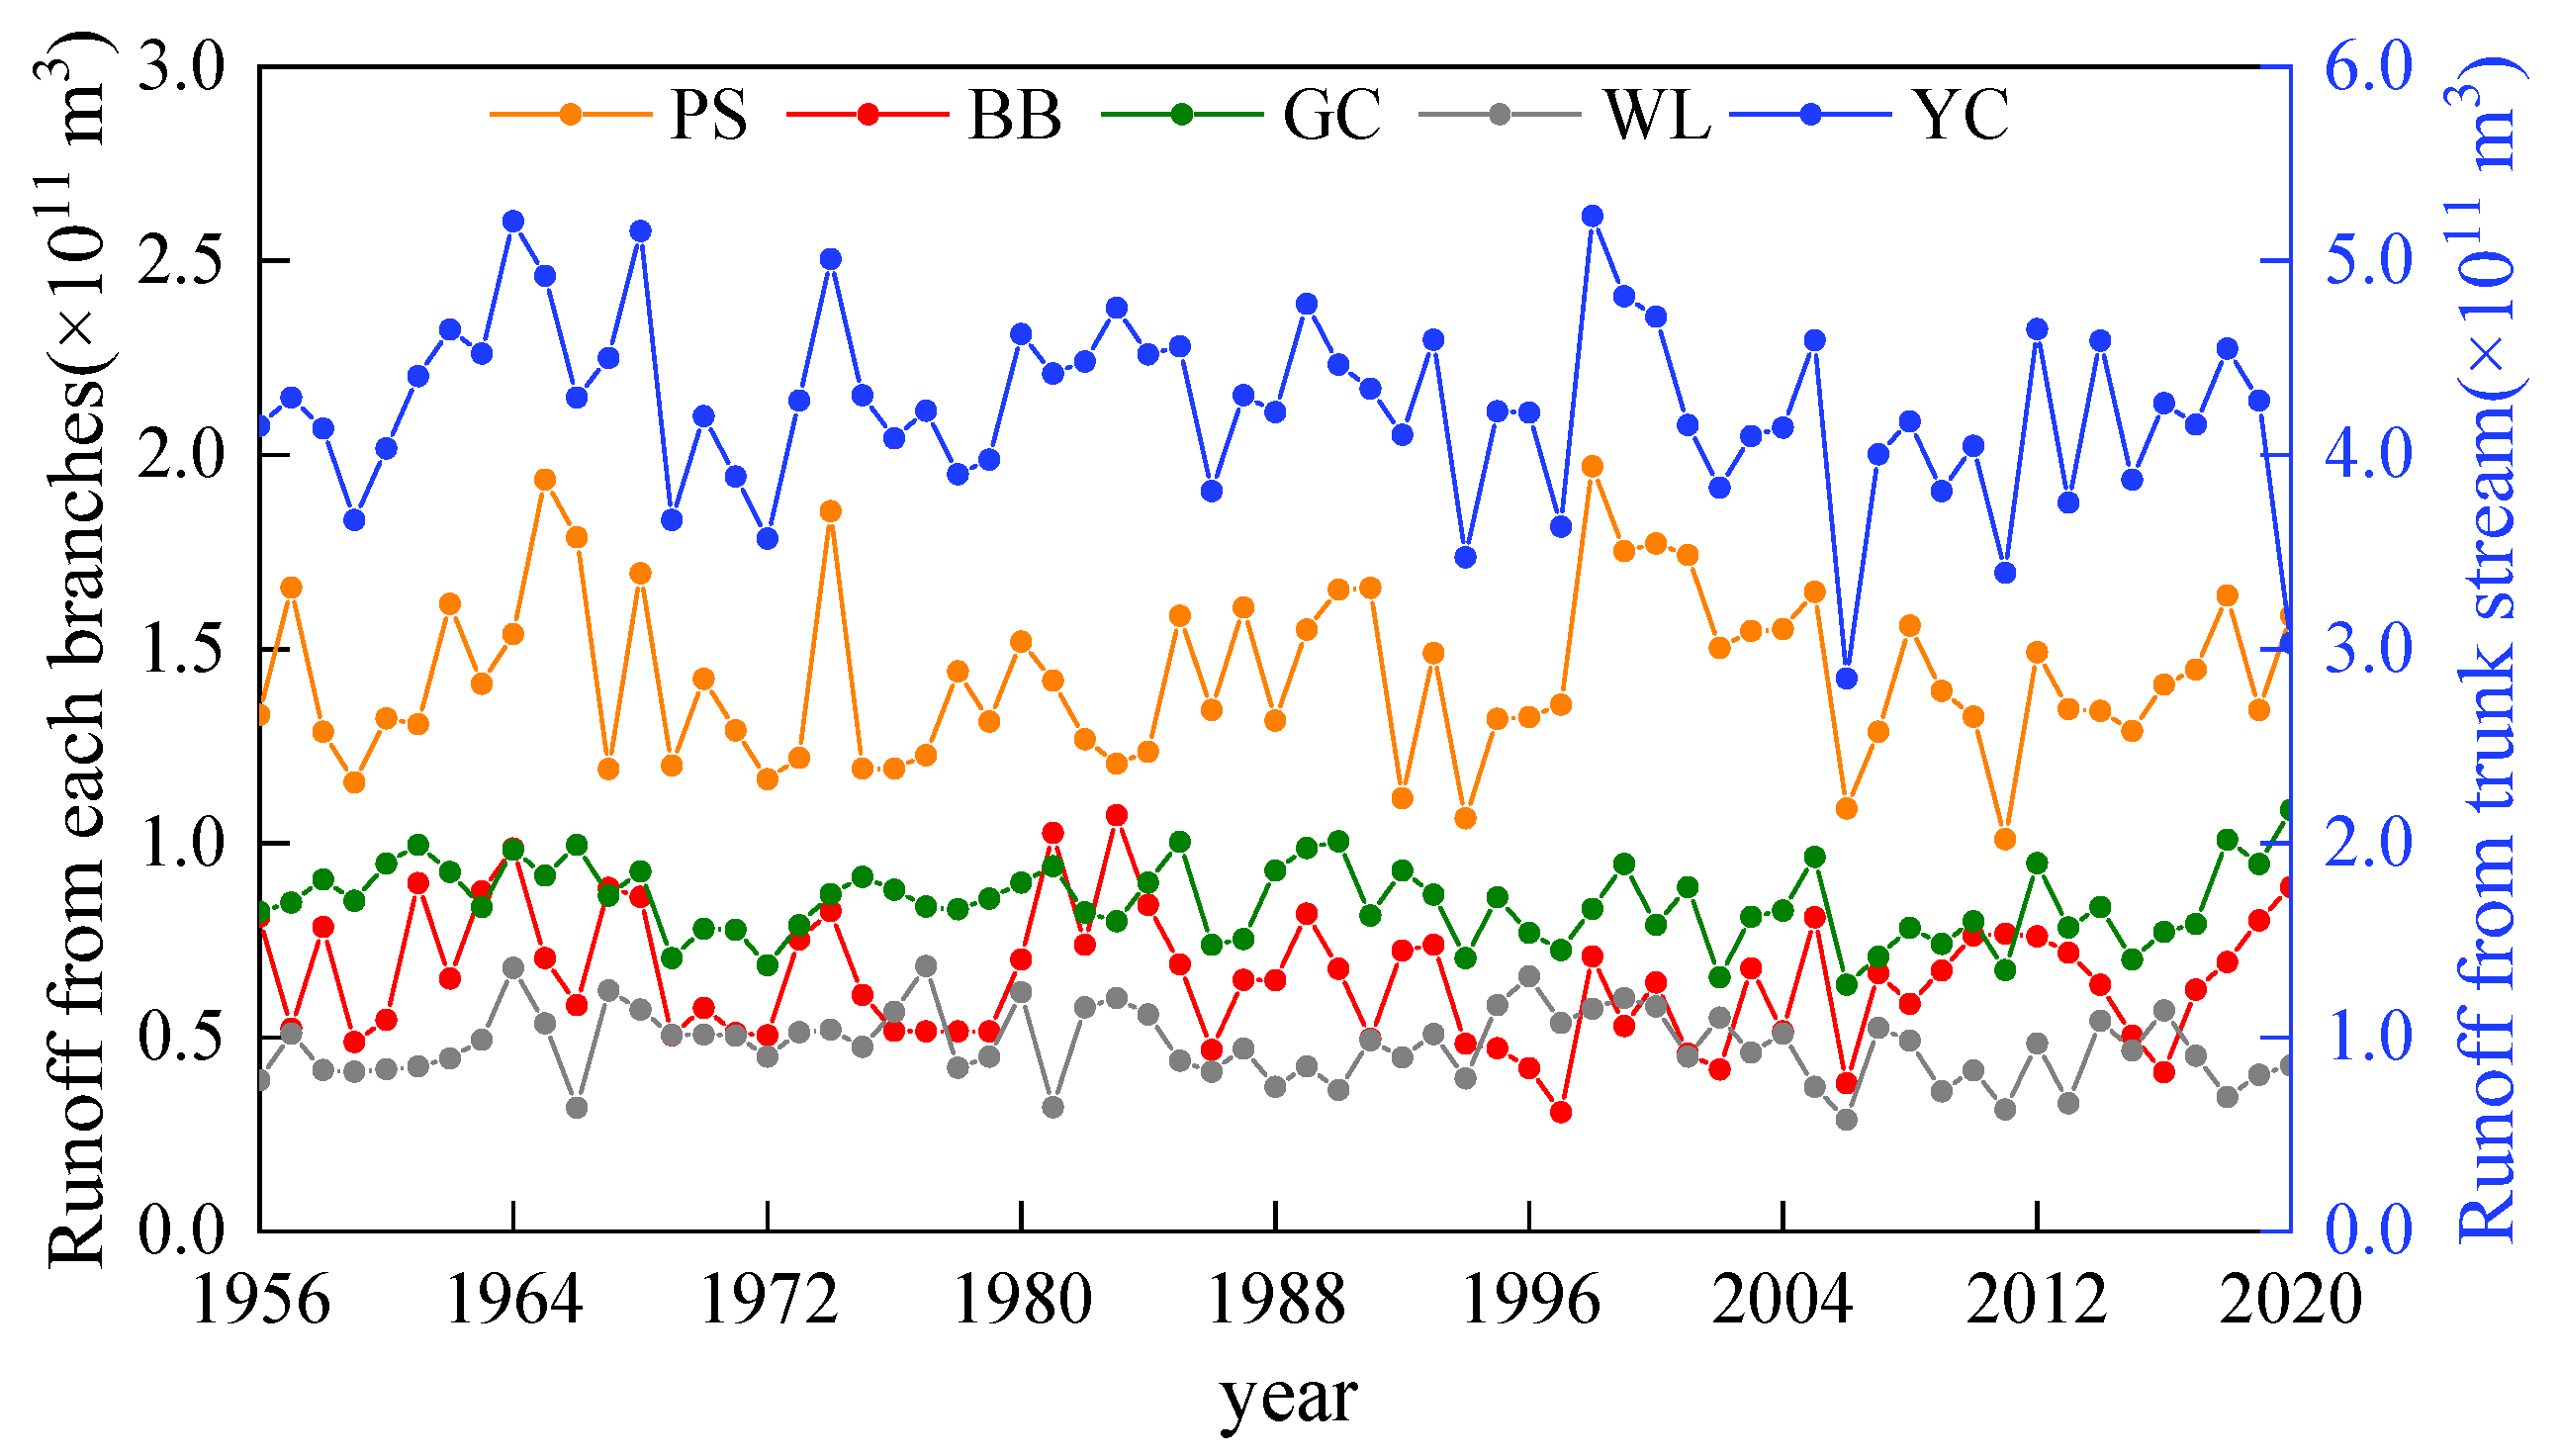
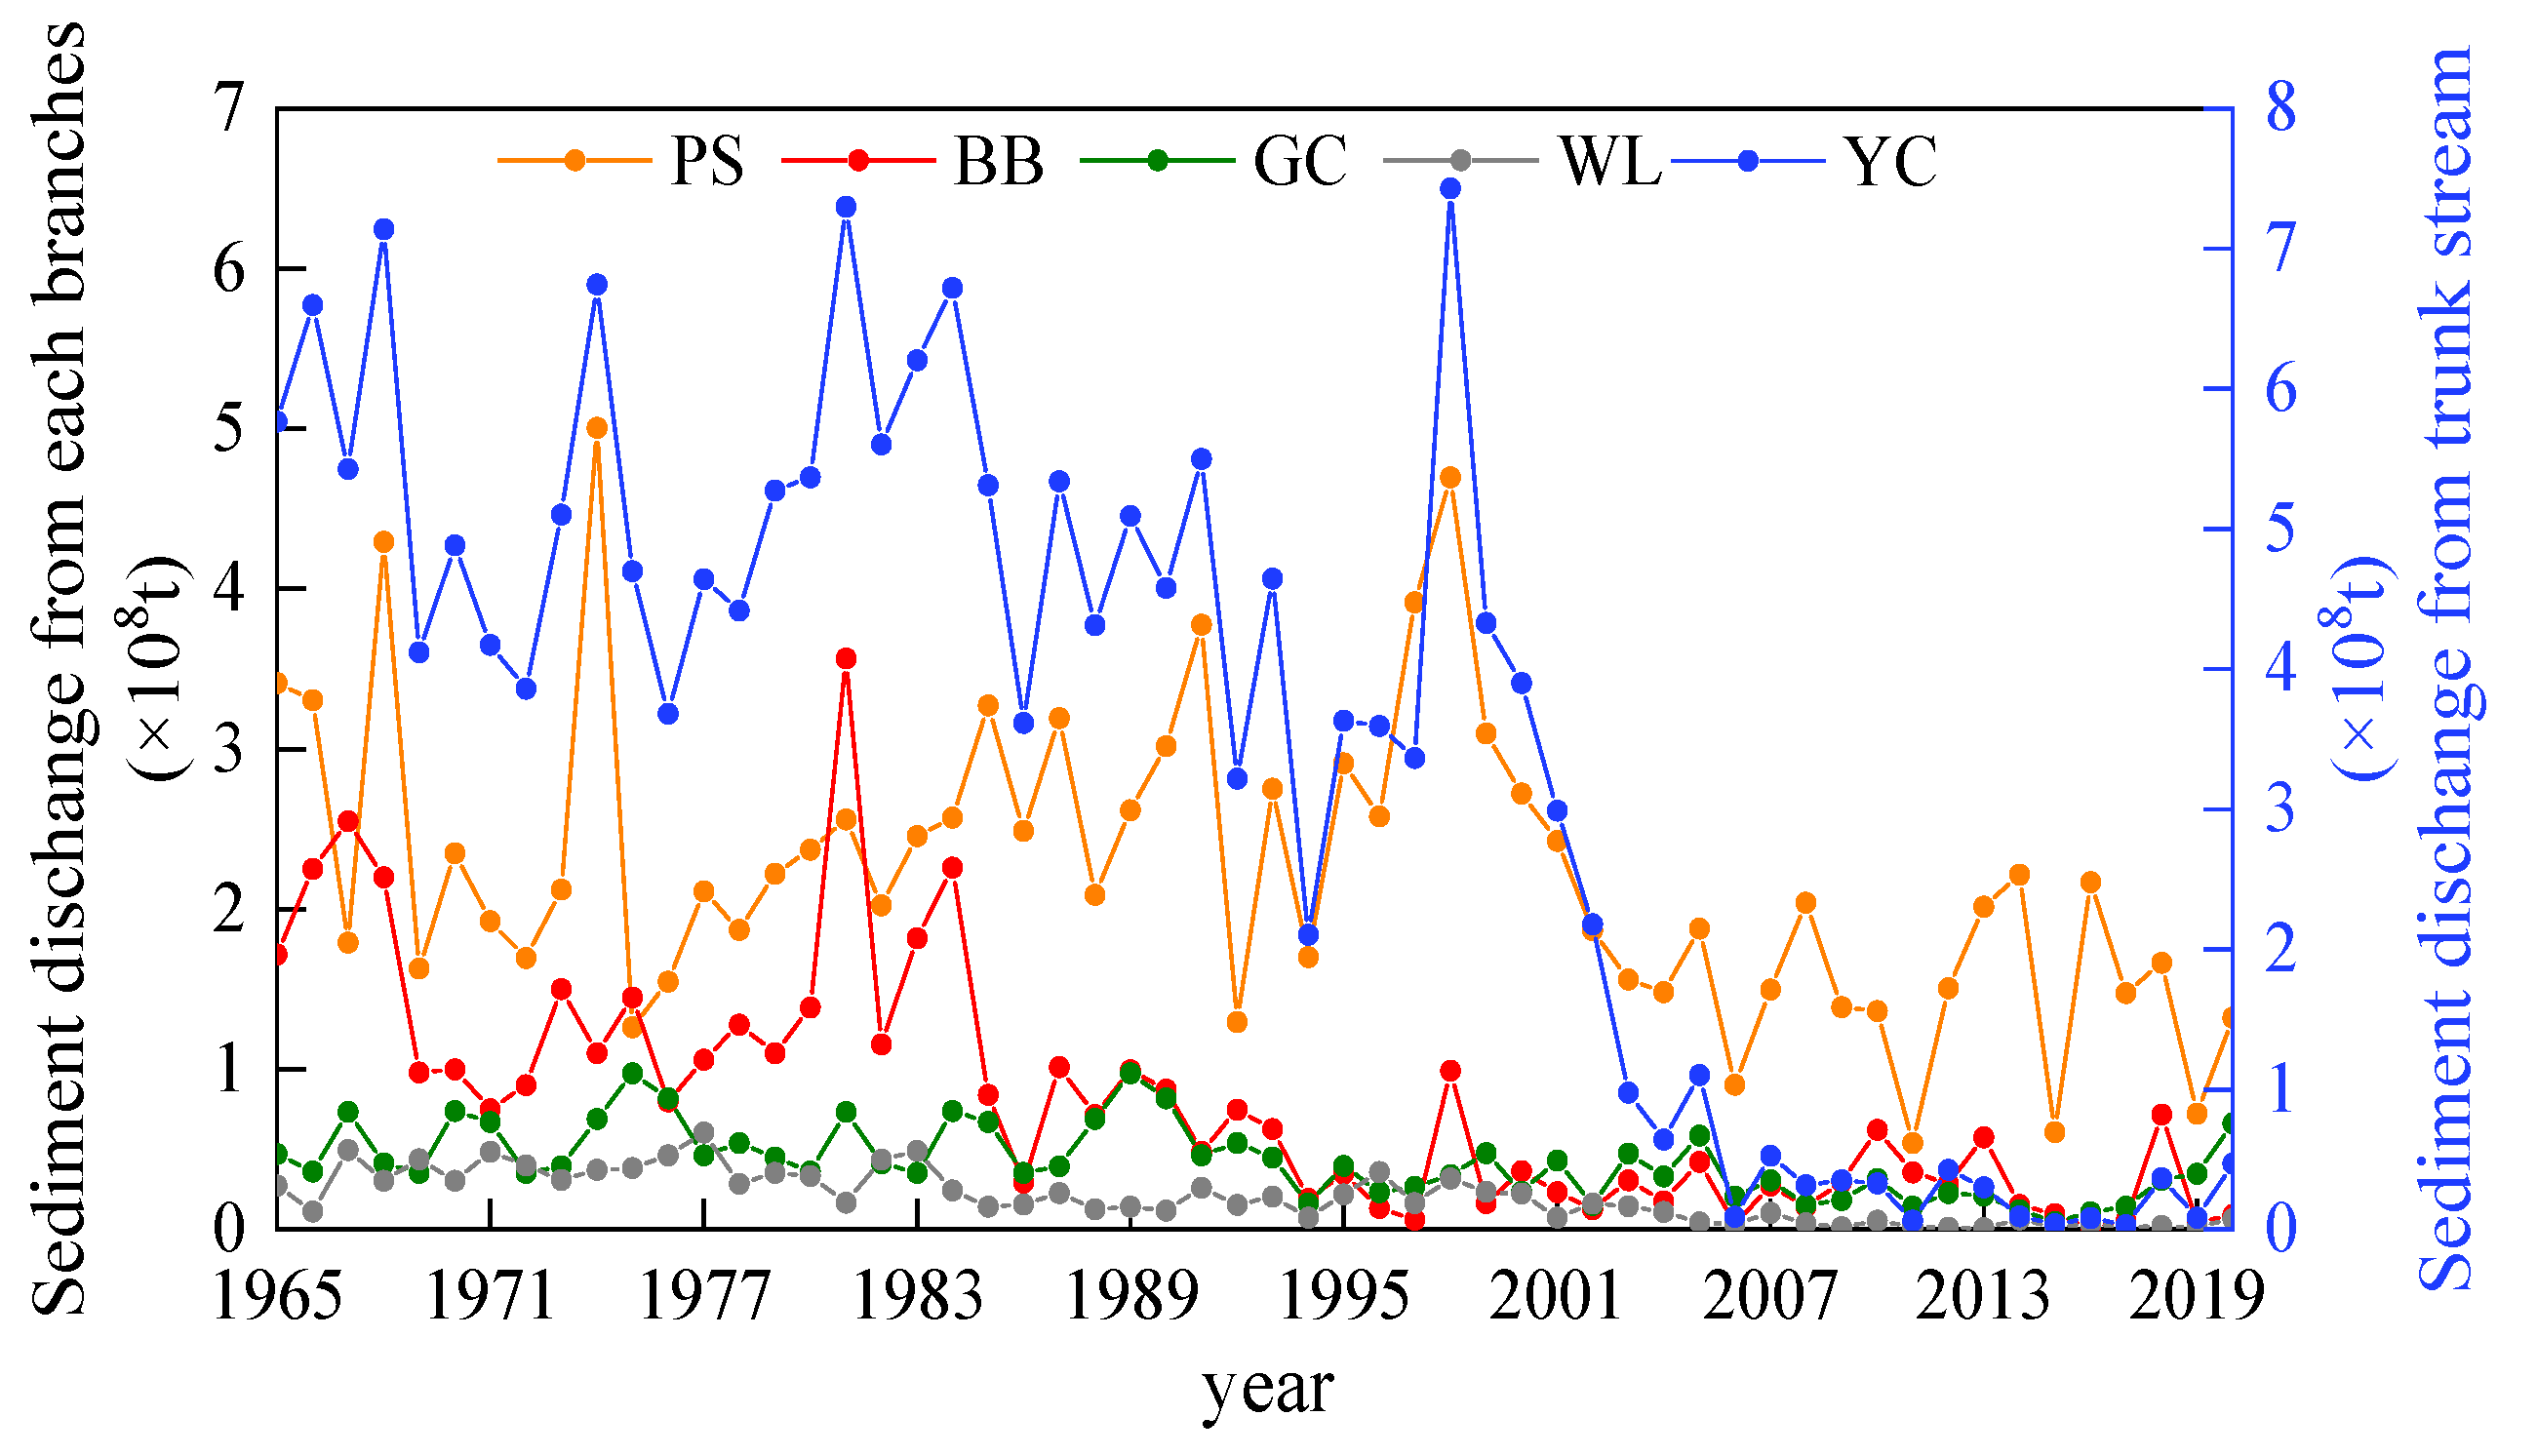
Schematic diagrams of runoff and sediment transport in the trunk stream and each branch are drawn, respectively (Figure 2 and Figure 3). From the information in the figures, it can be seen that there is no significant change in the annual average runoff volume in the upper reaches of the Yangtze River, while there is a significant decrease in the amount of sediment transport. In order to quantitatively assess the trend situation in runoff and sediment change in the trunk and branches of the upper Yangtze River, the TFPW–MK method was used to quantitatively assess the trendiness. The results of the trend test for runoff and sediment transport in the trunk stream and each branch of the upper Yangtze River are shown in Table 2. Based on the information in the table, we can see the following: that the statistical value of runoff at the Pingshan station is 0.83, indicating that the runoff of Jinsha River is increasing, while the statistics of the remaining hydrological stations are −1.62, −0.97, −1.43, and −1.74, indicating that the Jialing, Min, Wu, and trunk streams of the upper Yangtze River are showing a decreasing trend; all of this indicates that there is no significant trend in the runoff of the upper reaches of the Yangtze River, which is lower than the critical value of 1.96 at the significance level . The statistics for the annual sediment transport at each hydrological station are all less than 0, and the absolute value of the statistic exceeds the critical value of 2.58 at the significance level , which passes the 99% significance test; this indicates a significant decrease in the amount of incoming sediment. Therefore, from the long time series, there is no significant change trend in the runoff of the upper stem and branches of the Yangtze River, while the sediment transport at each hydrological station shows a significant decreasing trend.
4.1.2. Analysis of Water–Sediment Mutability
The TFPW–MK mutation test was used to examine the runoff and sediment of the trunk and branch streams of the upper Yangtze River, and the results are shown in the table. According to the information in the figure, the runoff UF and UB of each hydrological station in the upper reaches of the Yangtze River intersected several times in the 1980s, 1990s and around 2003, and all of them were within 0.1 significant level; the sediment UF and UB of each hydrological station intersected only once: the UF and UB of the Pingshan station in 2006, the Gaochang station in 2002, the Beibei station in 1993, the Wulong station in 2003, and the Yichang station in 2002.
Since there are more mutation points in the TFPW–MK mutation test for each hydrological station, the mean difference T method was used for further testing to ensure scientificity, and the test results were collated to be more significant, and the collated results are shown in Table 3. According to the information in the table, there is no significant abrupt change in the runoff of the tributaries of the upper Yangtze River, except for the Yichang station; compared with the runoff, there is an abrupt change in the sediment transport of both the trunk stream and branches of the upper Yangtze River; the runoff and sediment in the Yichang station of the trunk river show a significant abrupt change in 2002, which indicates that the Three Gorges reservoir has a significant influence on the runoff and sediment of the river.
4.2. Characteristics of the Water–Sediment Situation and Ecological Response
4.2.1. Analysis of the Degree of Change in the Water and Sediment Situation in the Upper Yangtze River
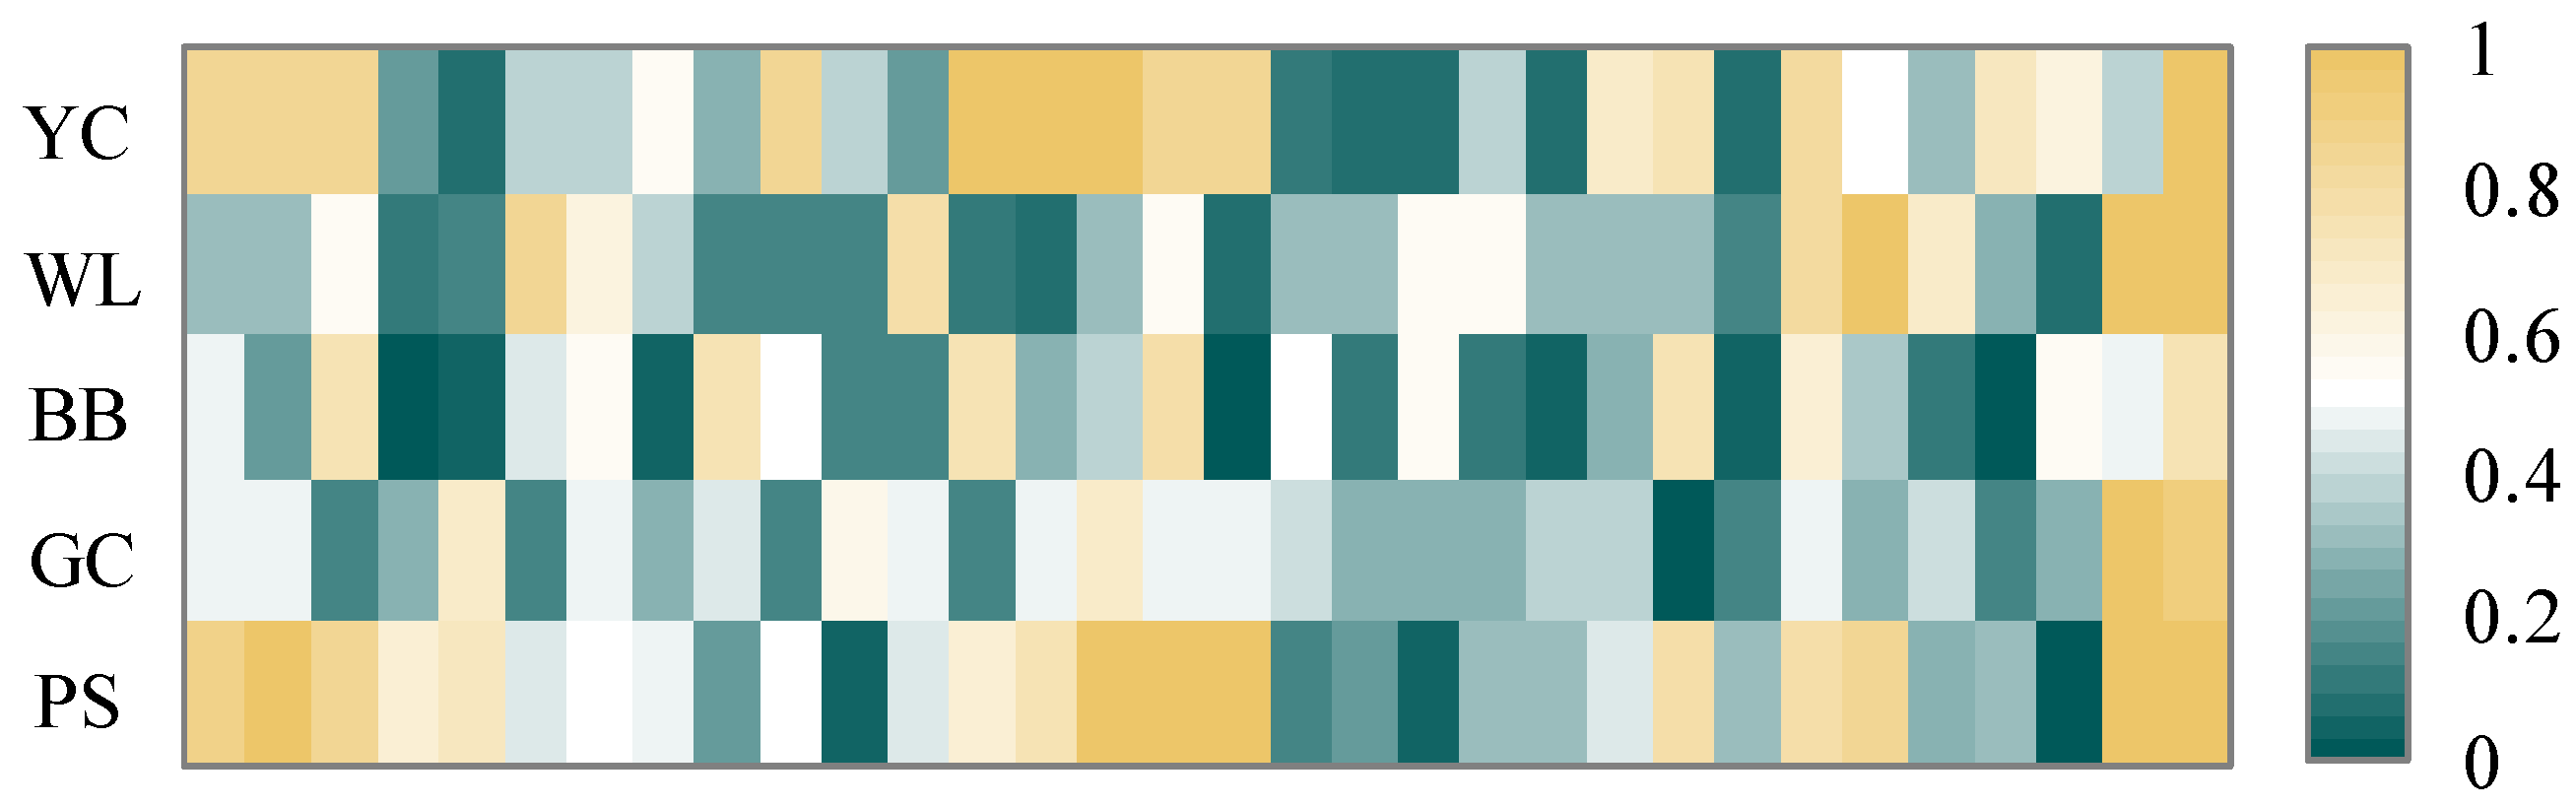
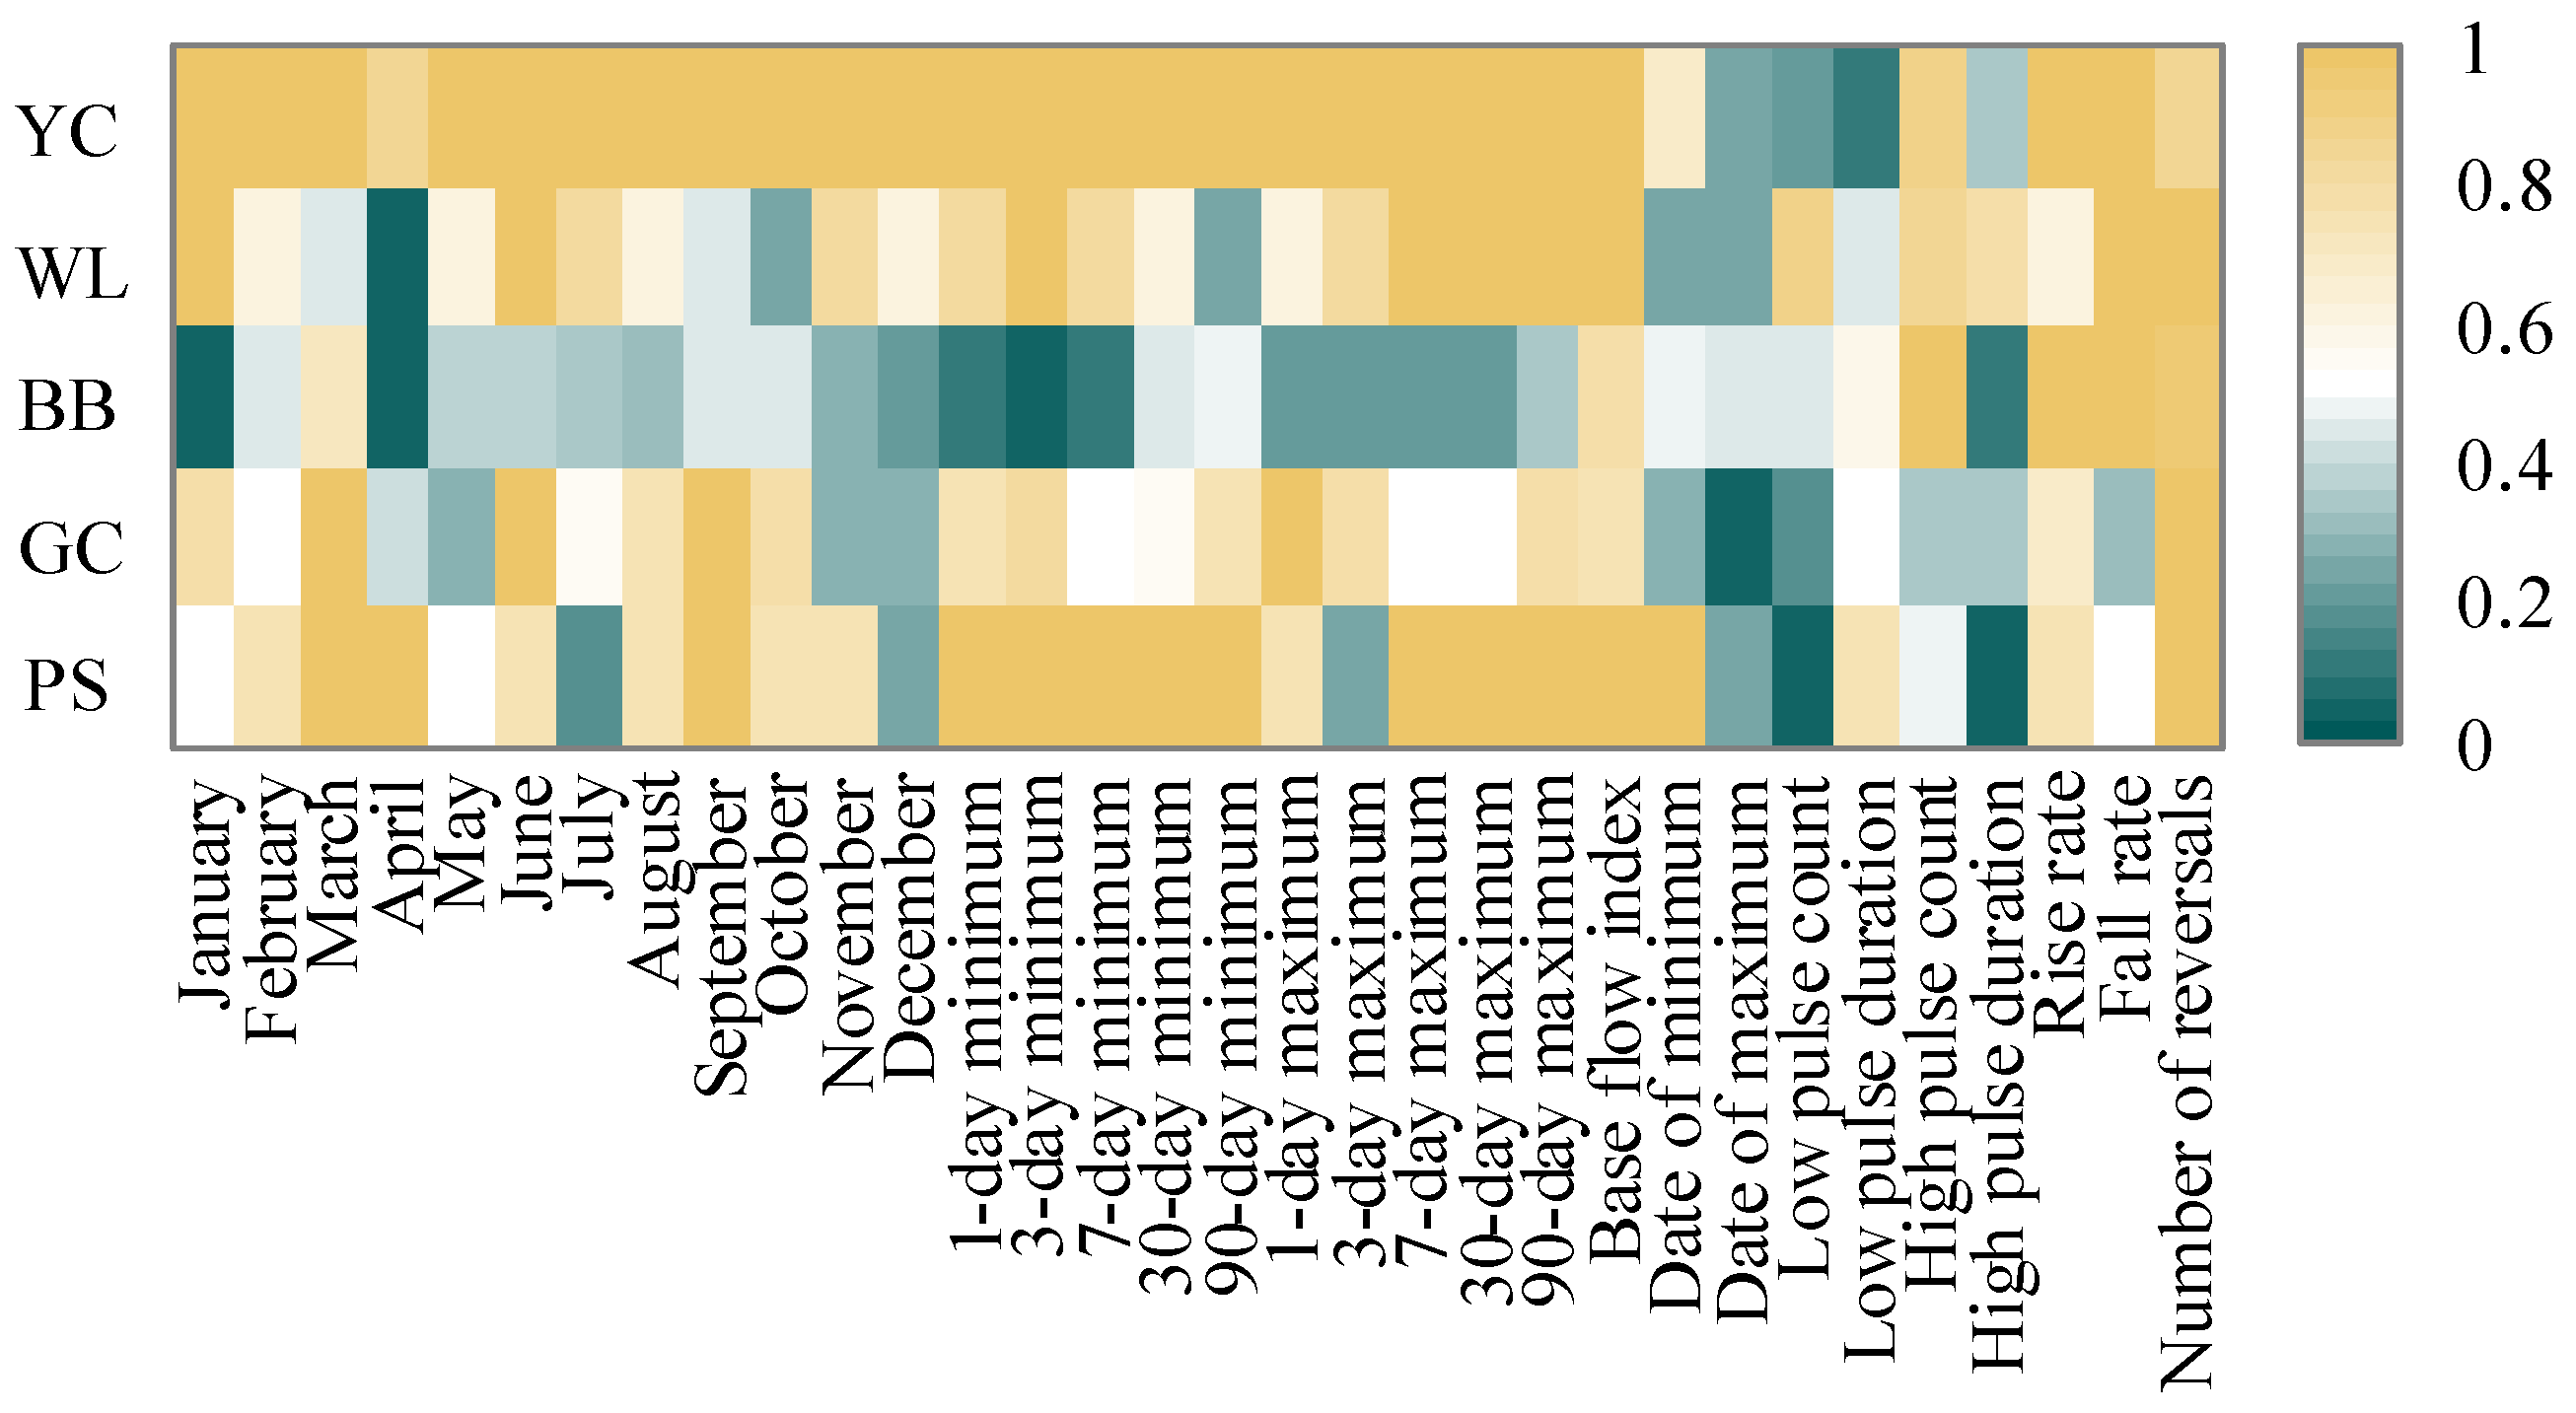
Based on the 32 IHA hydrological indicators, obtained from the statistics of runoff and sediment data at each hydrological station, the degree of change was calculated according to formulas 11–13, and then the change values of hydrological indicators at each station were analyzed (Figure 4). The proportion of highly altered sediment in the five hydrological stations in the upper Yangtze River is much higher than that in the runoff, and the integration of the indicators of each station shows that the number of times the sediment reaches 100% alteration is 54, while the runoff is only 15. At the Pingshan station, the overall hydrological alteration to the runoff was 68% and the sediment was 77%; at the Gaochang station, the overall hydrological alteration to the runoff was 48% and the sediment was 59%; at the Beibei station, the overall alteration to the runoff was 48% and the sediment was 57%; at the Wulong station, the overall hydrological alteration to the runoff was 57% and the sediment was 73; and at the Yichang station, the overall alteration to runoff was 63% and the sediment was 84%.
4.2.2. Biodiversity Analysis of the Upper Yangtze River
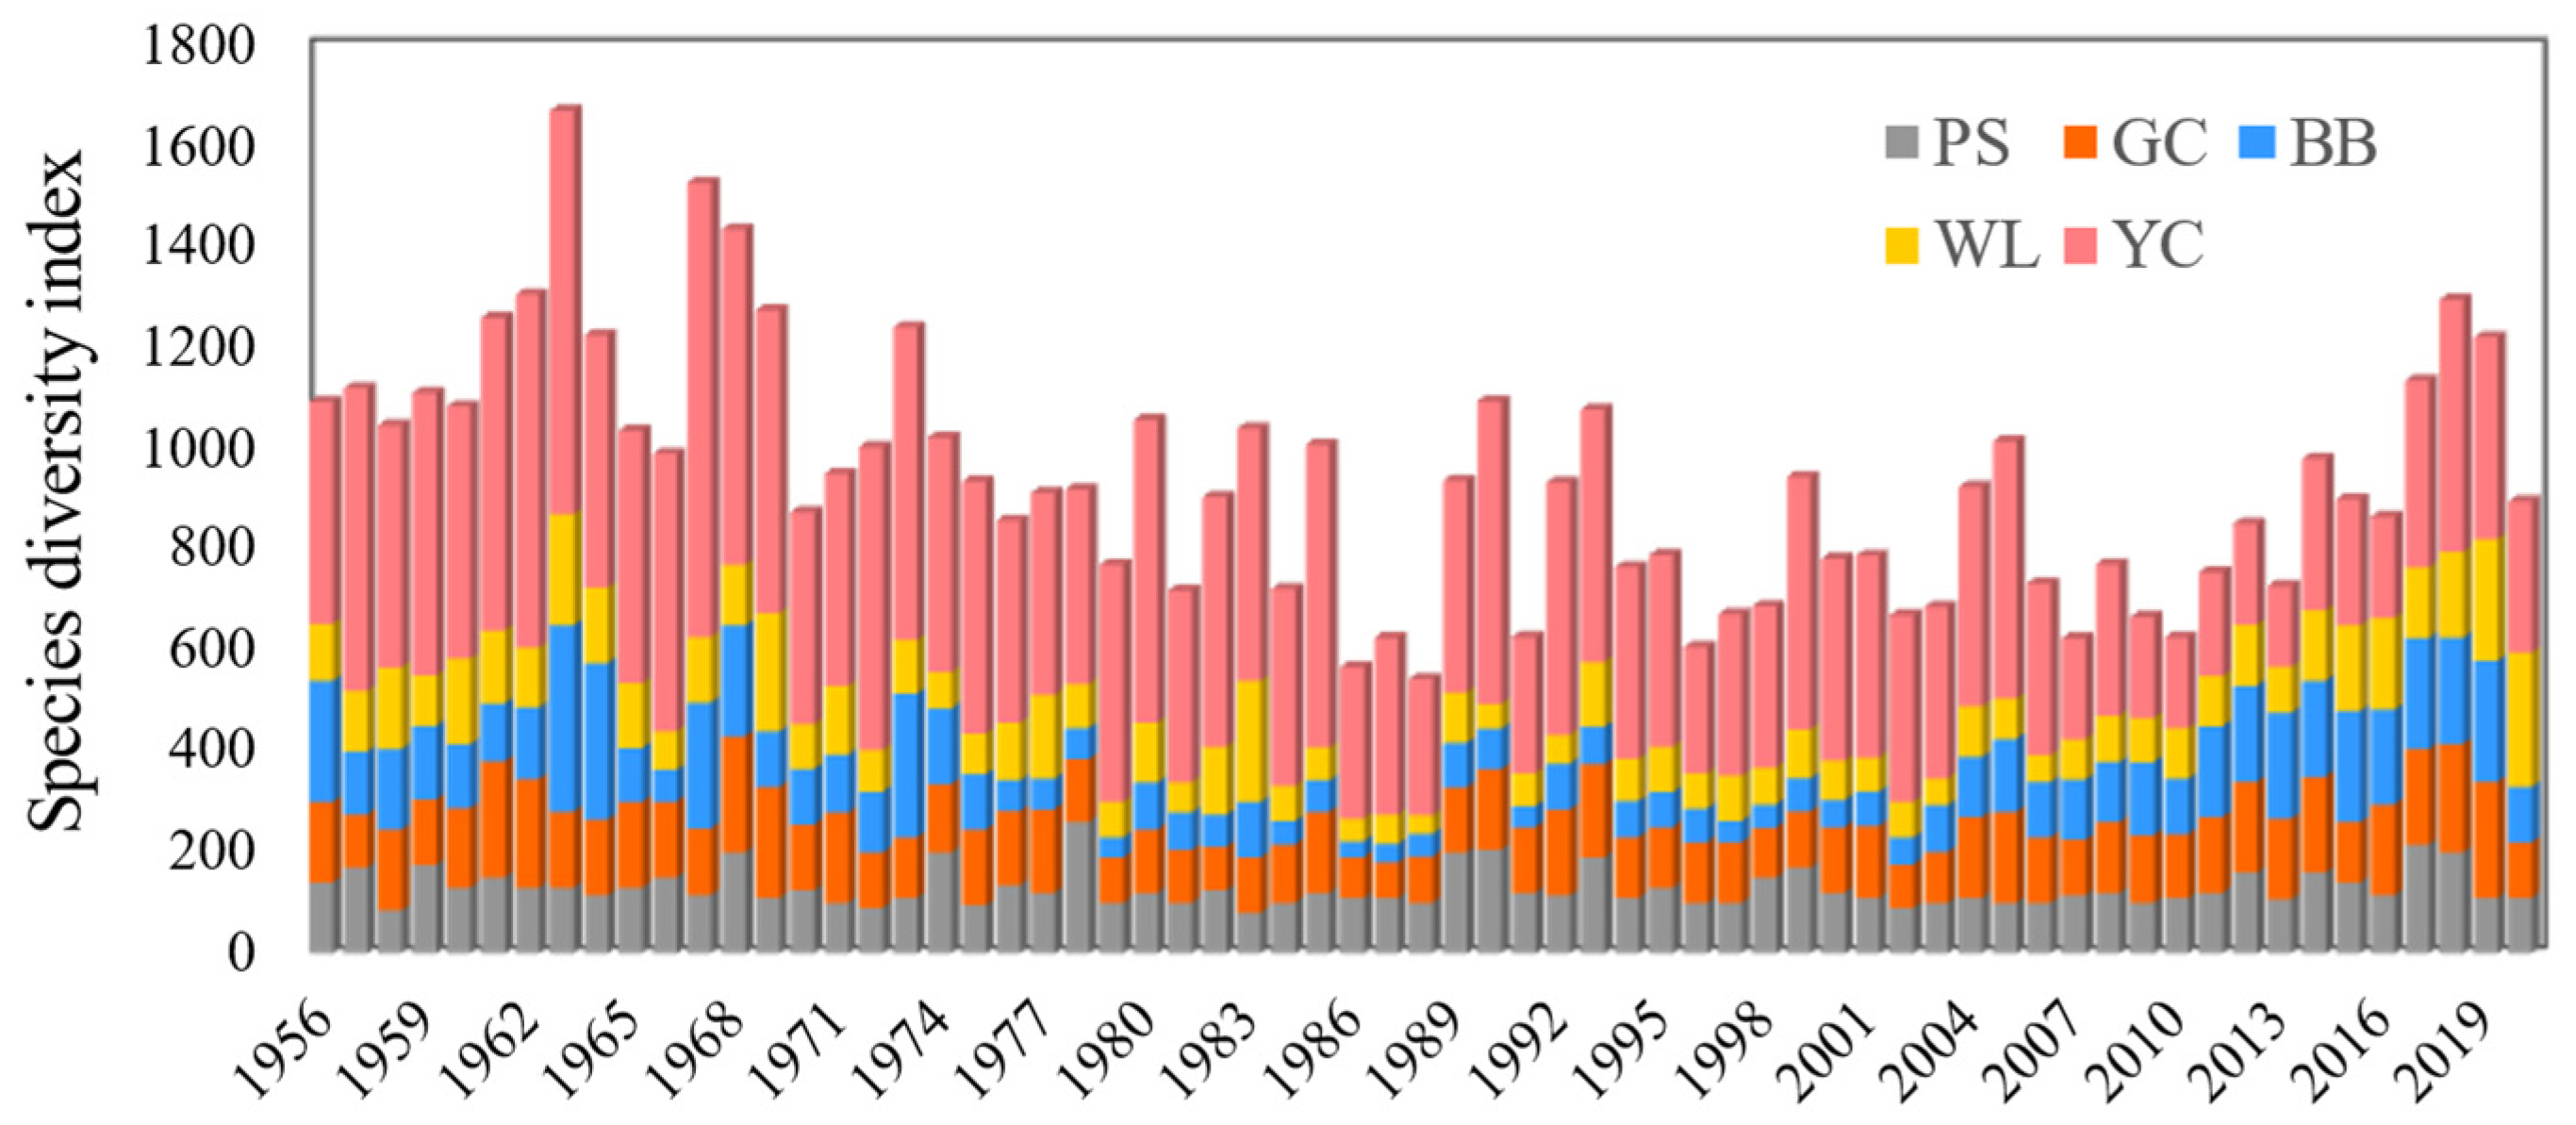
Based on the results of the IHA index of river flow at each hydrological station in the upper reaches of the Yangtze River, the biodiversity of each river in the upper reaches of the Yangtze River was calculated by using the formula for calculating biodiversity; this was derived from the analysis of genetic programming method, and the results are shown in Figure 5. From the information in the figure, it can be seen that there is no obvious decreasing and increasing trend in biodiversity in the upper reaches of the Yangtze River in each era, and its fluctuation range is not large during the study period; in the time range, the SI value of each hydrological station shows a decreasing trend before 1990, a relatively stable trend between 1990 and 2010, and a small increasing trend after 2010.
In order to reveal the overall situation of biodiversity changes in each river in the upper Yangtze River under changing hydrological conditions, the TFPW–MK trend test was used to examine the SI values of each hydrological station, and the results are shown in Table 4. According to the information in the table, the SI values calculated at each hydrological station in the upper reaches of the Yangtze River show an overall decreasing trend, among which the test value at the Yichang station exceeds the 95% significance level; this indicates that the biodiversity of both the trunk stream and the branches of the upper reaches of the Yangtze River is decreasing. Based on the SI values of each hydrological station, we can see that the change in the water and sediment conditions will lead to a decrease in river biodiversity in the upper reaches of the Yangtze River, which will pose a serious threat to the river ecosystem; therefore it is urgent to conduct an attribution analysis of water and sediment changes in the upper reaches of the Yangtze River, in order to provide a reference for the restoration of the upper Yangtze River water ecosystem.
4.3. Water and Sediment Change Attribution Analysis
4.3.1. Water–Sediment Correlation Analysis
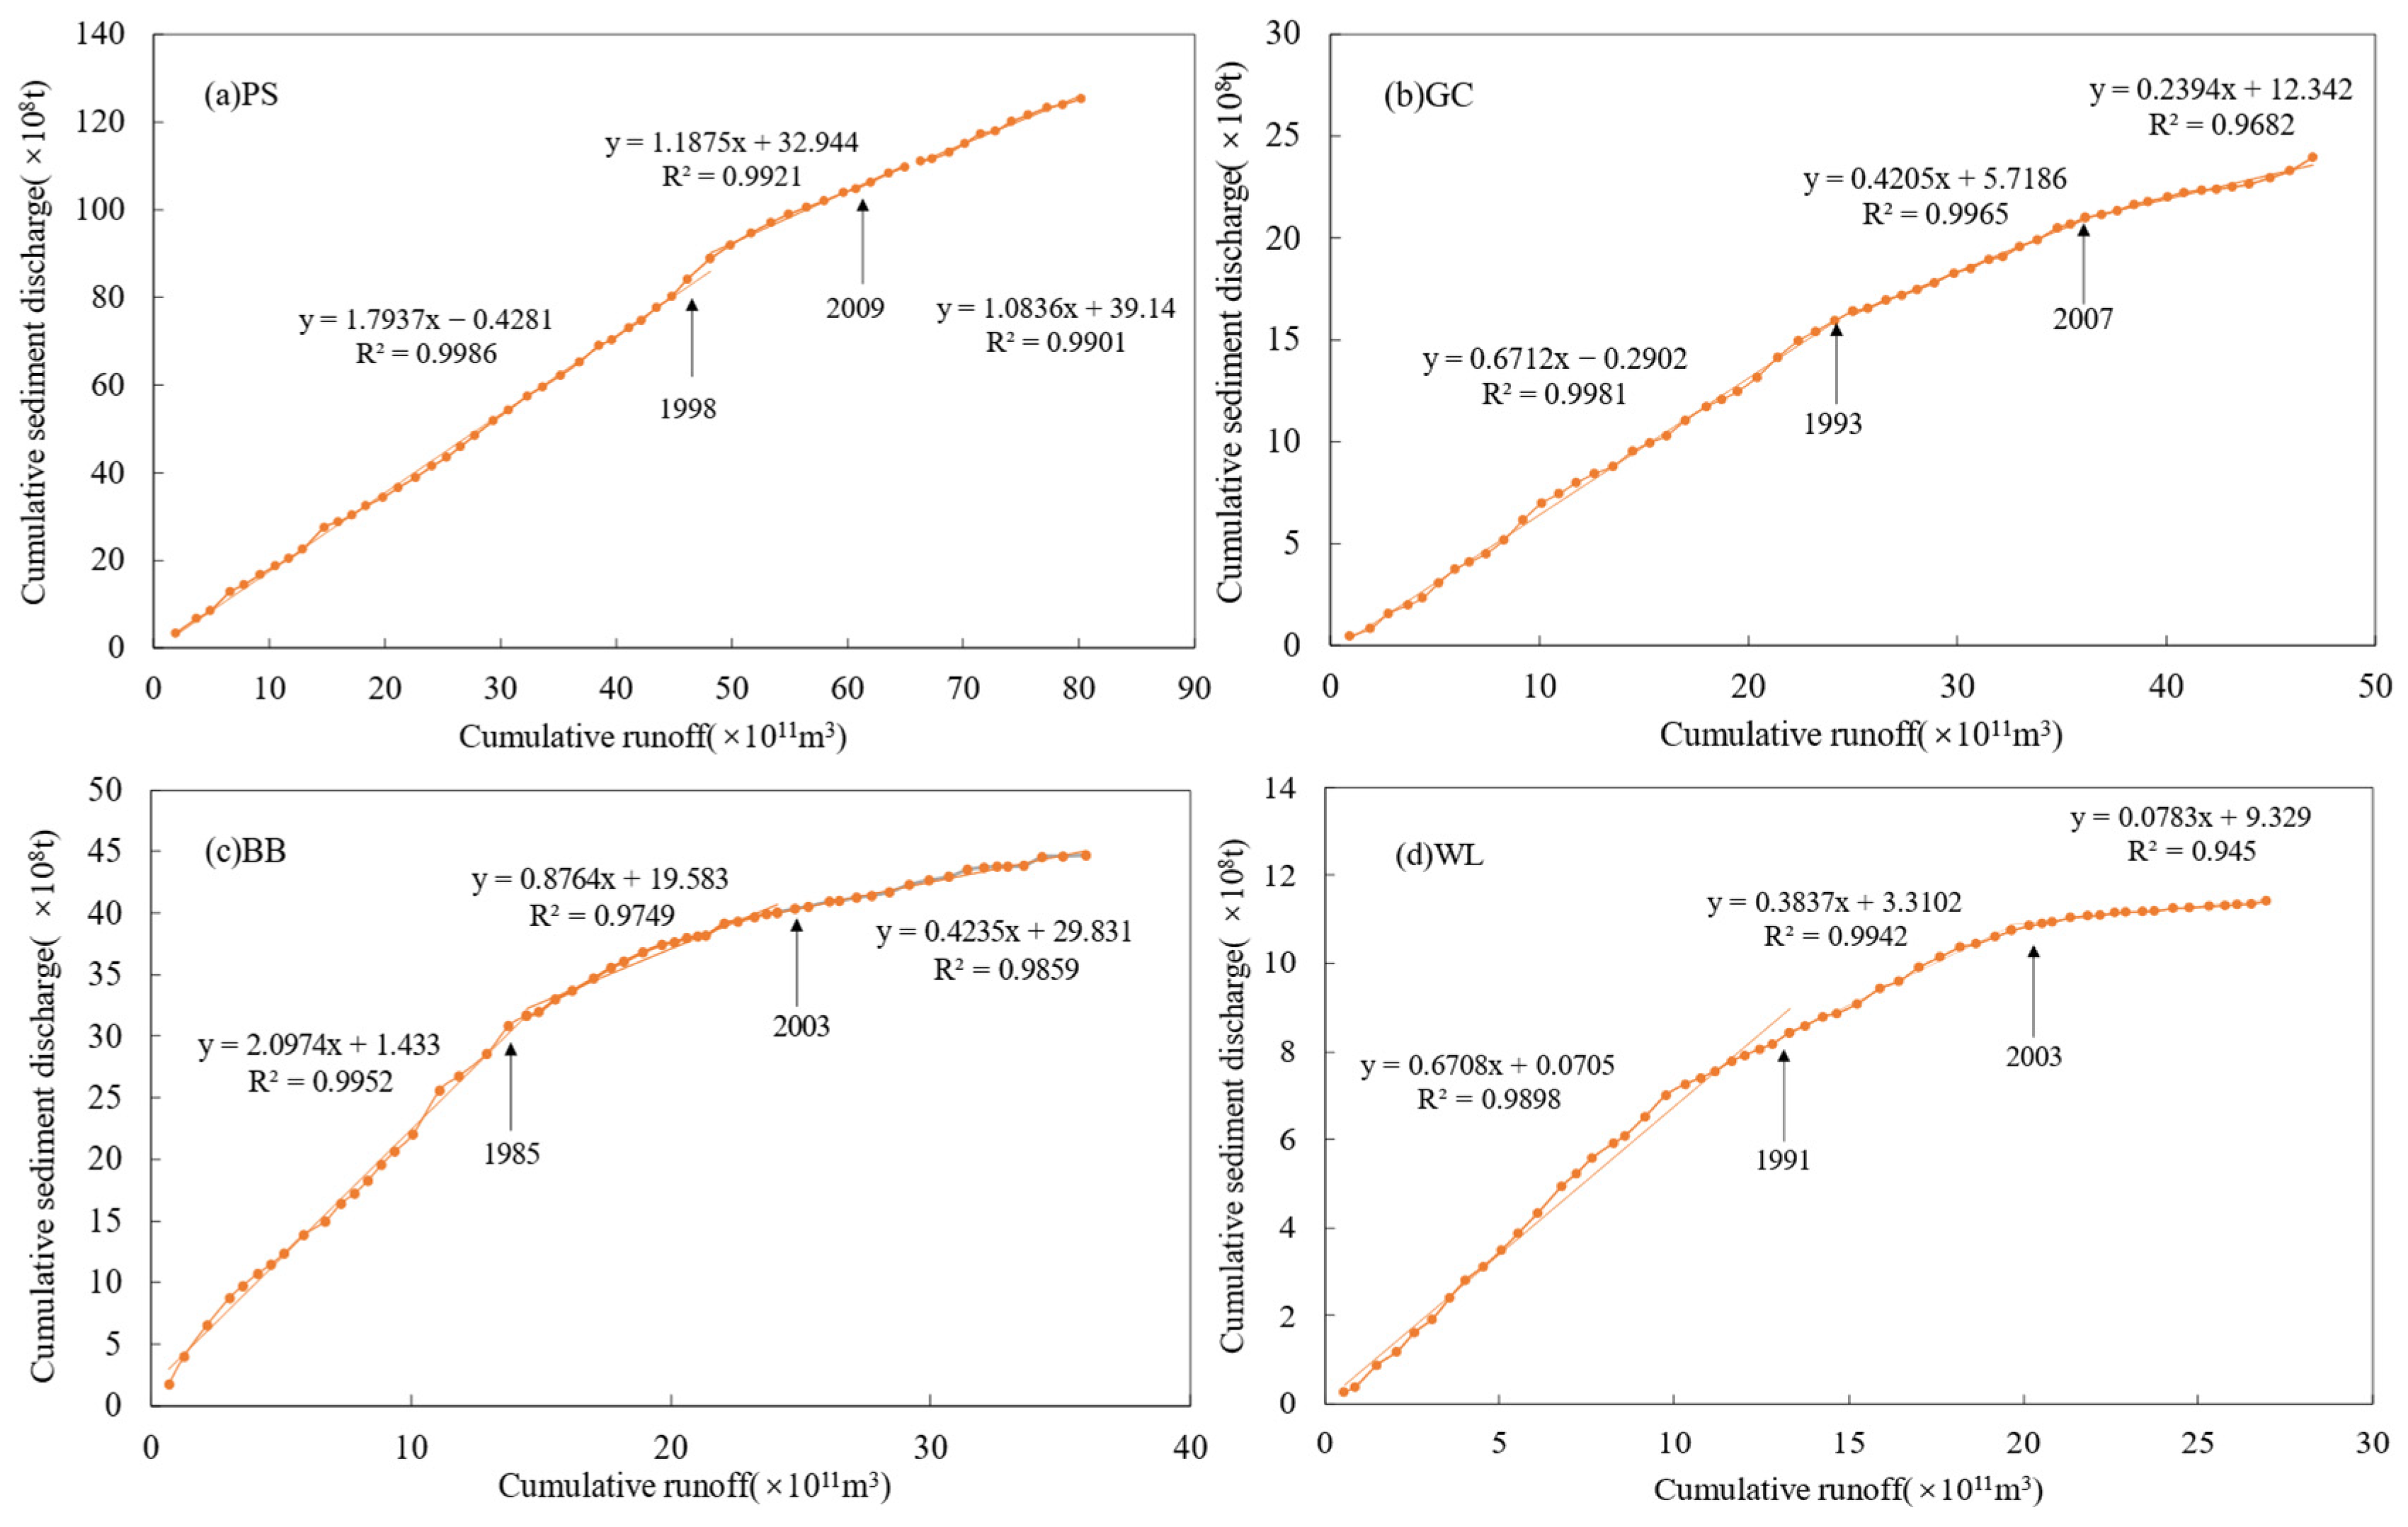
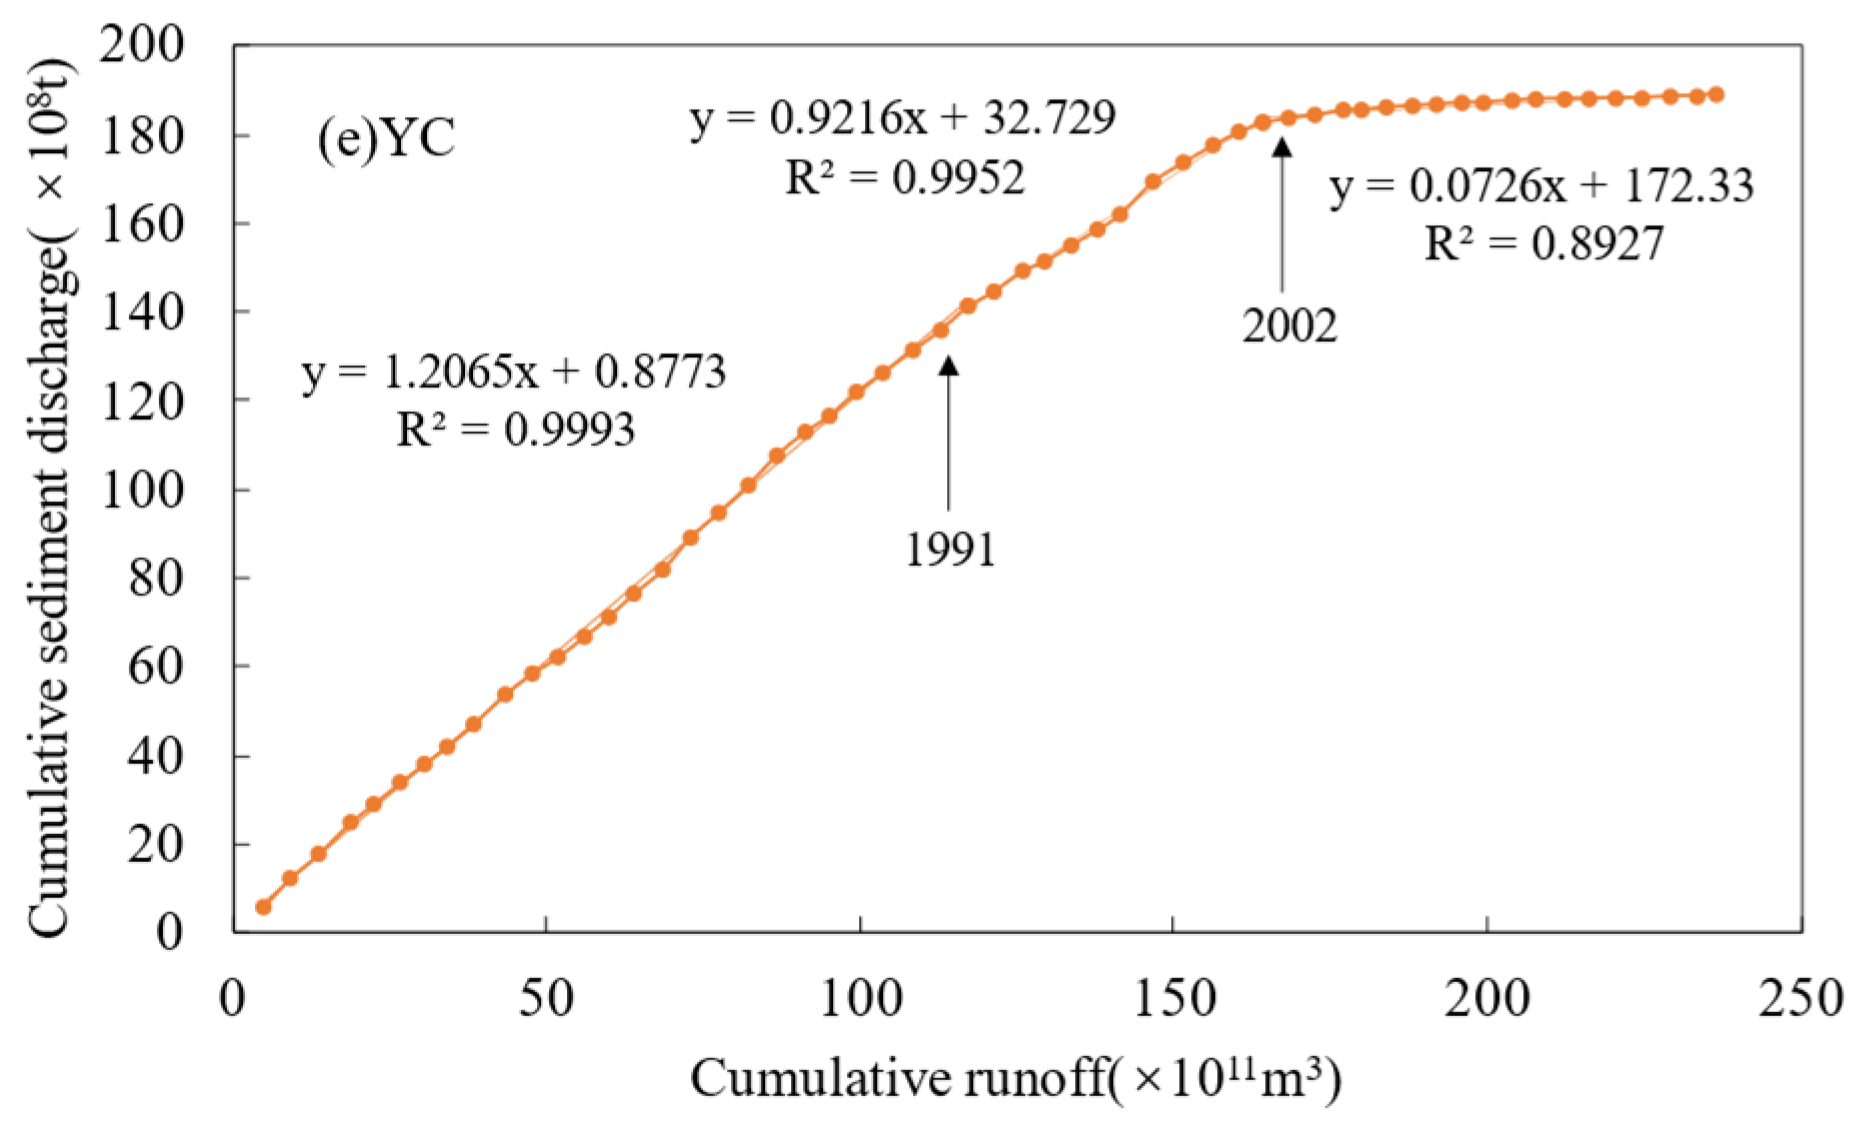
Under the natural condition, the double accumulation curve of river runoff and sediment transport is a straight line; however, under the changing environment, the water–sediment relationship will change, thus causing the double accumulation curve to be deflected. The runoff–sediment transport double accumulation curves of each hydrological station in the upper reaches of the Yangtze River are plotted separately (Figure 6), and according to the information in the figure, we can see the following: that the water and sand accumulation curves in the upper reaches of the Yangtze River are well fitted, with an R2 around 0.9, indicating that the water and sand accumulation curves are well fitted; that the water–sediment curves of each hydrological station are deflected twice to different degrees, the first time occurring in the 1980s and 1990s, while the second time occurring around 2000; and that the water–sediment accumulation curves of each hydrological station are deflected toward the horizontal coordinate (runoff axis) in both deflections, indicating that a significant reduction in sediment transport occurs in the upper Yangtze River after each deflection, thus causing a change in the water–sediment relationship.
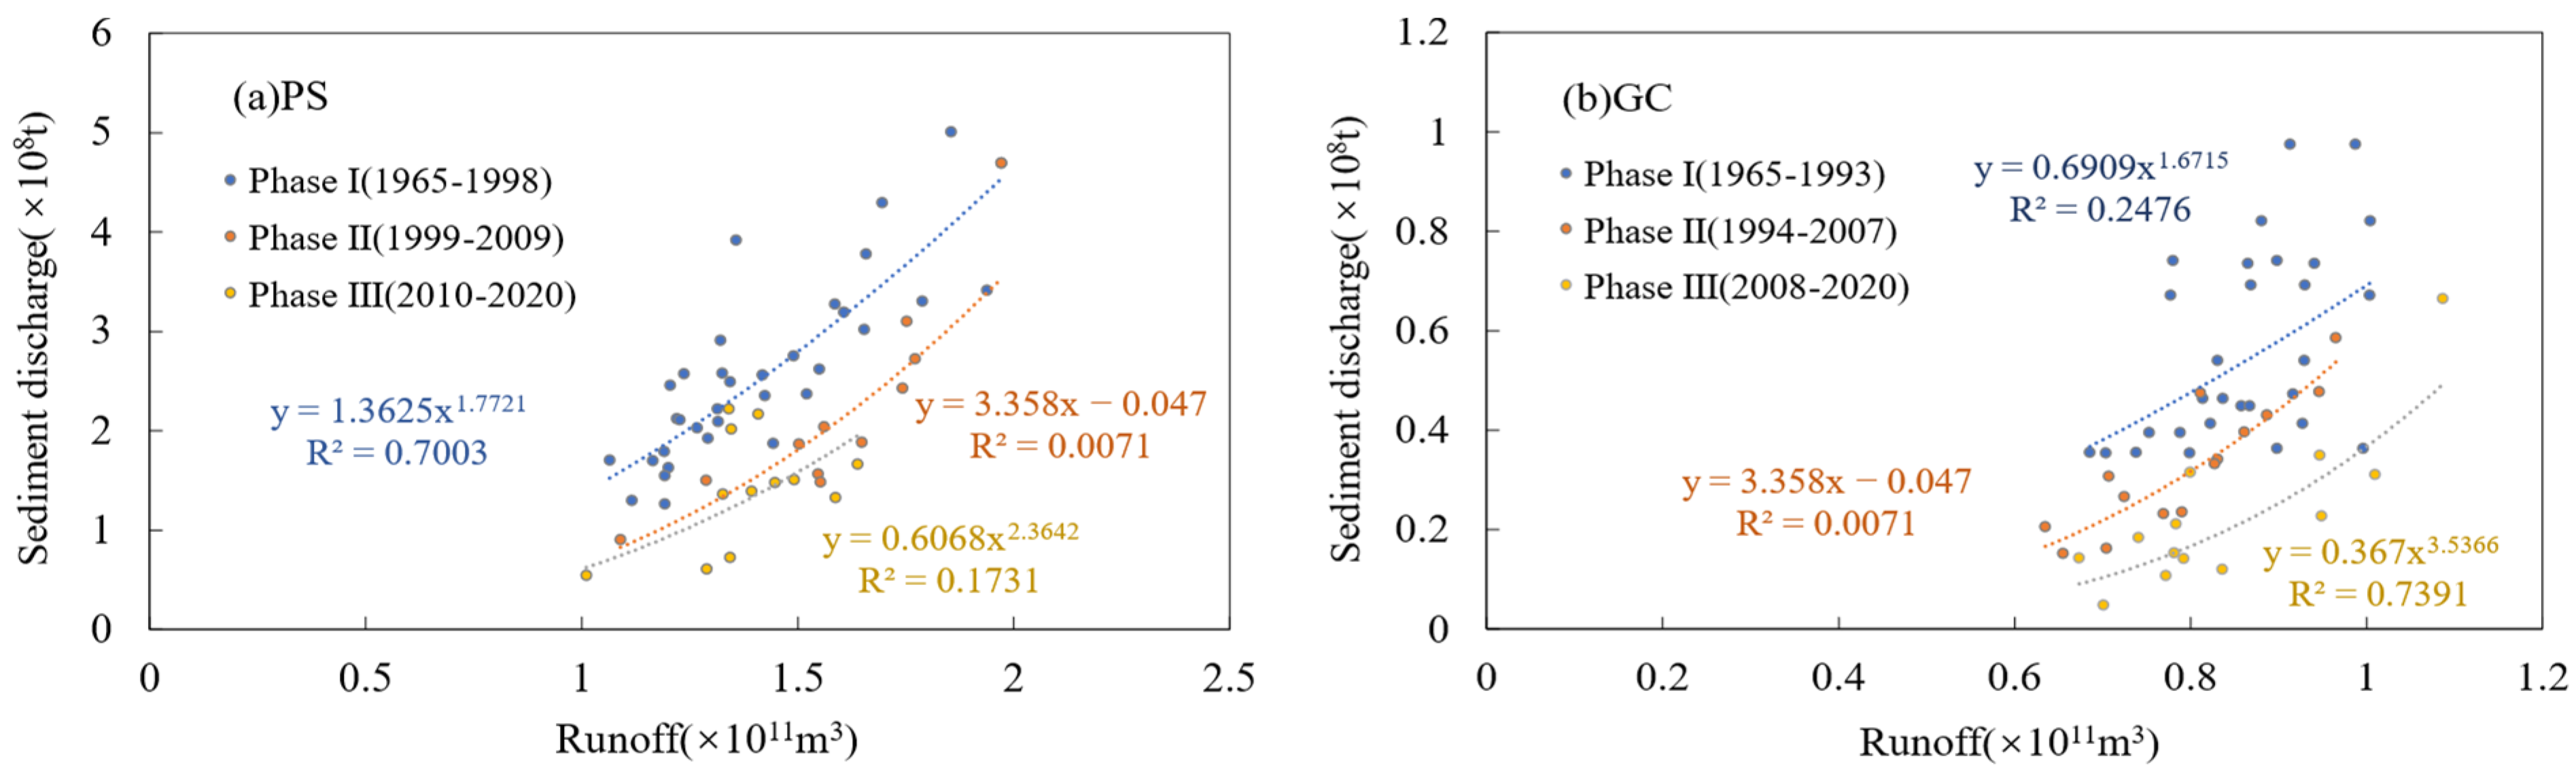
In order to reveal the change in the water–sediment relationship in the upper reaches of the Yangtze River after two deflections, the water–sediment time series of each hydrological station were divided according to the deflection time, and the water–sediment relationship curve was drawn (Figure 7). According to the information in the figure, it can be seen that at different stages, the a-value of the Pingshan station shows a trend of first increasing and then decreasing, and the b-value shows a trend of first decreasing and then increasing; this indicates that the first deflection was mainly influenced by large water conservancy projects, such as Ertan to transfer storage, and thus has a greater impact on the water–sediment relationship. Meanwhile, later, with the continued construction of the Jinping, Xiluodu and other graded reservoirs, the sediment transport capacity of the river was indirectly changed; the high field station shows a decreasing trend in a-values and an increasing trend in b-values at different stages, which indicates that the sediment transport capacity and characteristics of the Min River itself are decreasing; this is related to the inter-annual regulation of river runoff by large reservoirs such as Zipingpu and Cascade Gorge. The Beibei station shows a decreasing trend in a-values and an increasing trend in b-values at different stages, indicating that the Jialing River, as in the case of the Min River, is affected by the construction of the Baozhusi and Tingzikou reservoirs, and that the river itself has a reduced capacity to carry sediment transport. The Wulong station shows a decreasing trend in a-values and an increasing trend in b-values at different stages, indicating that the influence of external anthropogenic disturbances on sediment production in the Wu River is gradually increasing, including the operation of Wujiangdu and Pigoutan reservoirs and the implementation of soil and water conservation work in the Yangtze River basin. The Yichang station shows a decreasing trend in a-values and an increasing trend in b-values at different stages, indicating that the operation of the Three Gorges and the reservoirs in the upstream basins affects the water and sediment at the Yichang station, further reducing the relevance of river water and sediment.
4.3.2. Spatial and Temporal Distribution Patterns of Meteorological Elements
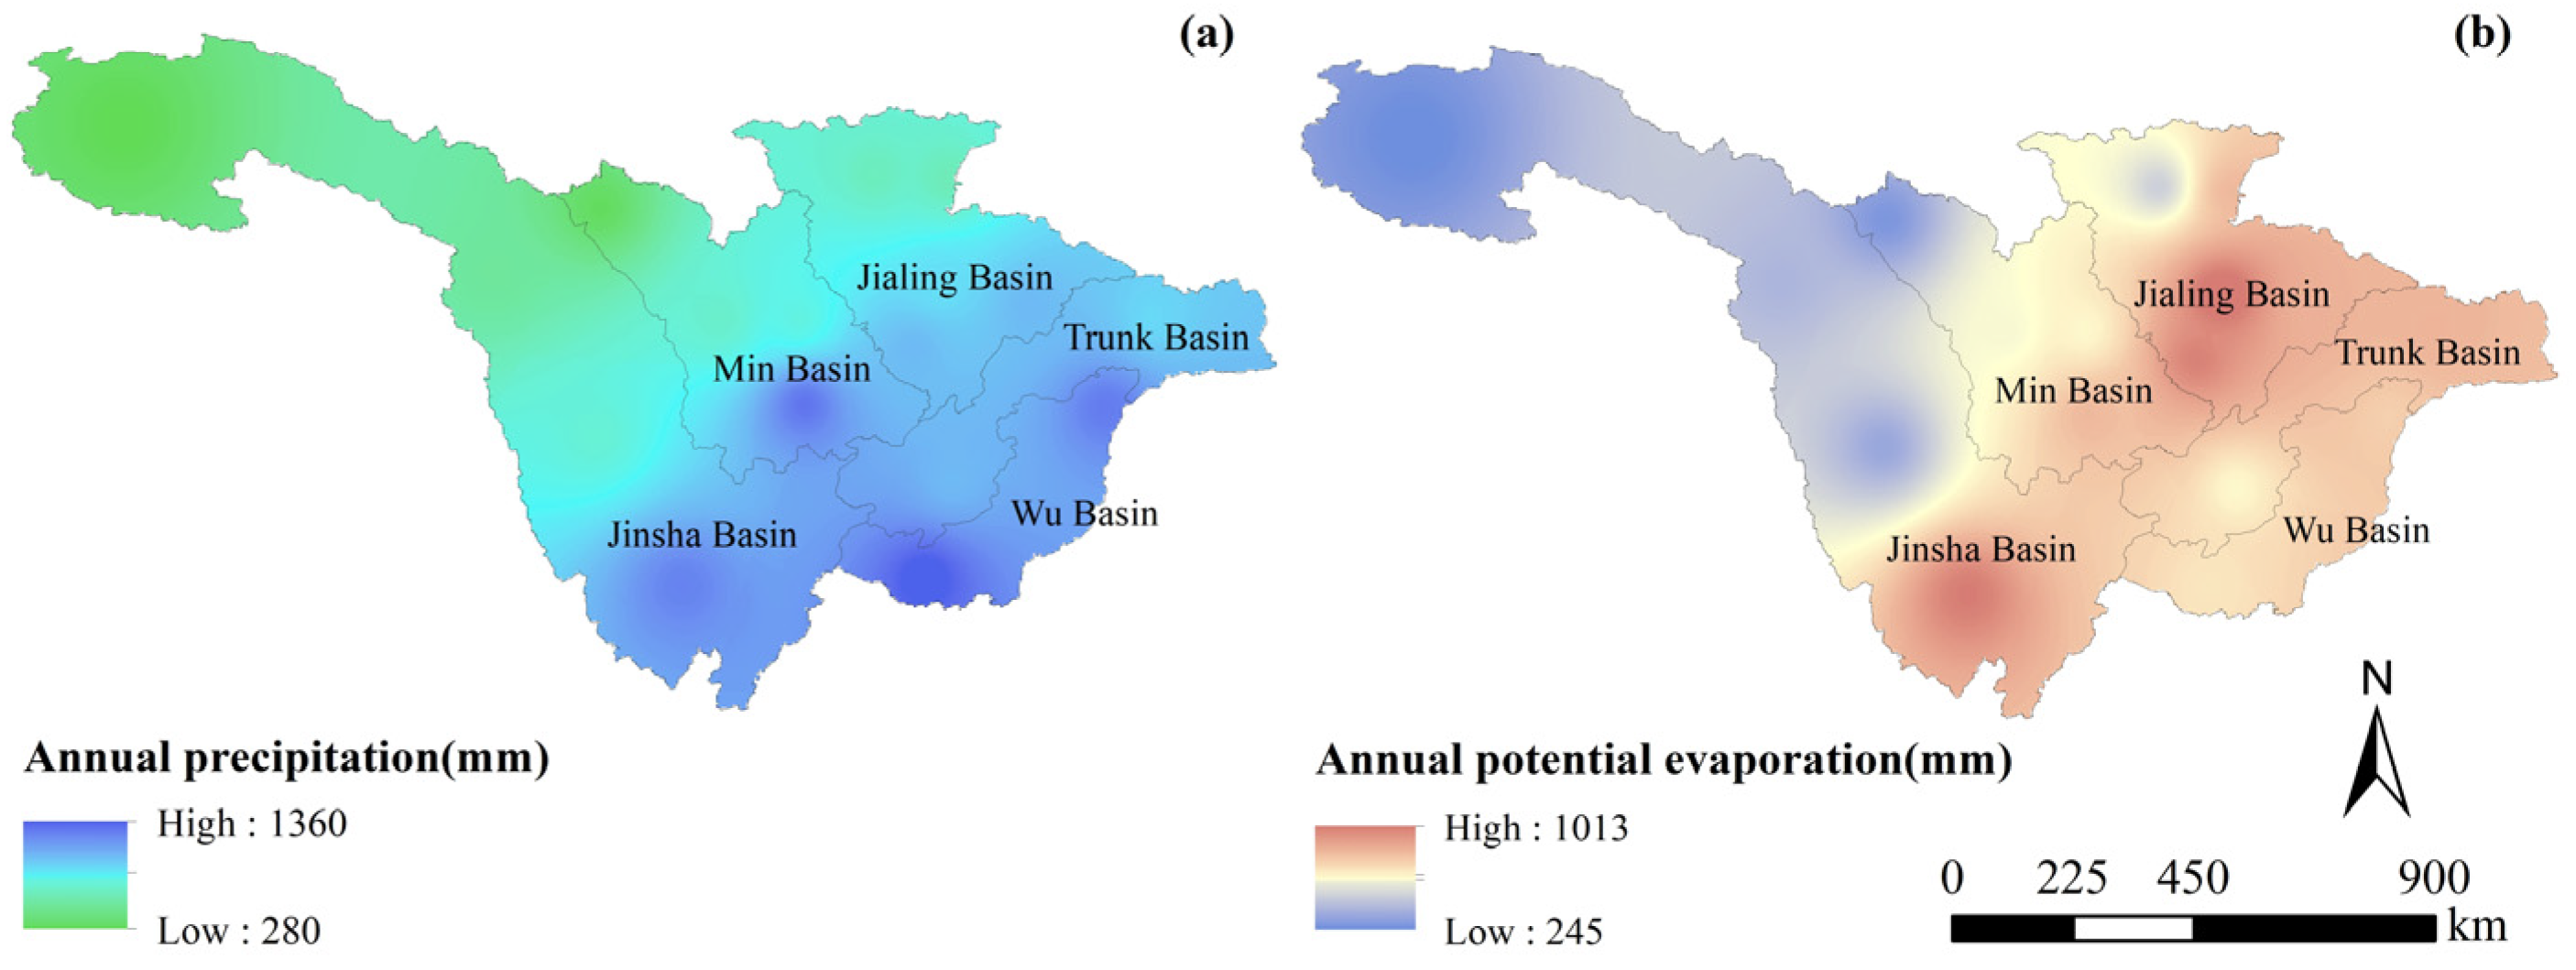
Based on the daily average temperature, sunshine hours, barometric pressure, wind speed, relative humidity and other meteorological data of each meteorological station from 1956 to 2020, the potential evapotranspiration was calculated according to the Penman–Monteith formula, recommended by the Food and Agriculture Organization of the World (FAO). At the same time, the multi-year average precipitation and potential evapotranspiration of each meteorological station were spatially interpolated in ArcGis software (Developed by ESRI, Inc. of RedLands, California, USA, the version used in this study is 10.1) according to the inverse distance weight method (IDW), in order to obtain the spatial distribution of the multi-year average precipitation and potential evapotranspiration in the upper reaches of Yangtze River from 1956 to 2020 (Figure 8). According to the information in the figure, the distribution of precipitation and potential evaporation in the upper reaches of the Yangtze River basin are in the range of 200–1400 mm, which is consistent with the results calculated by Guo et al. [51]. The potential evapotranspiration and precipitation are basically the same in space, with less evaporation in the northern part of Jinsha River and Min River and the northwestern part of Jialing River; meanwhile, the potential evapotranspiration is higher in the southern part of Jinsha River and the central part of Jialing River.
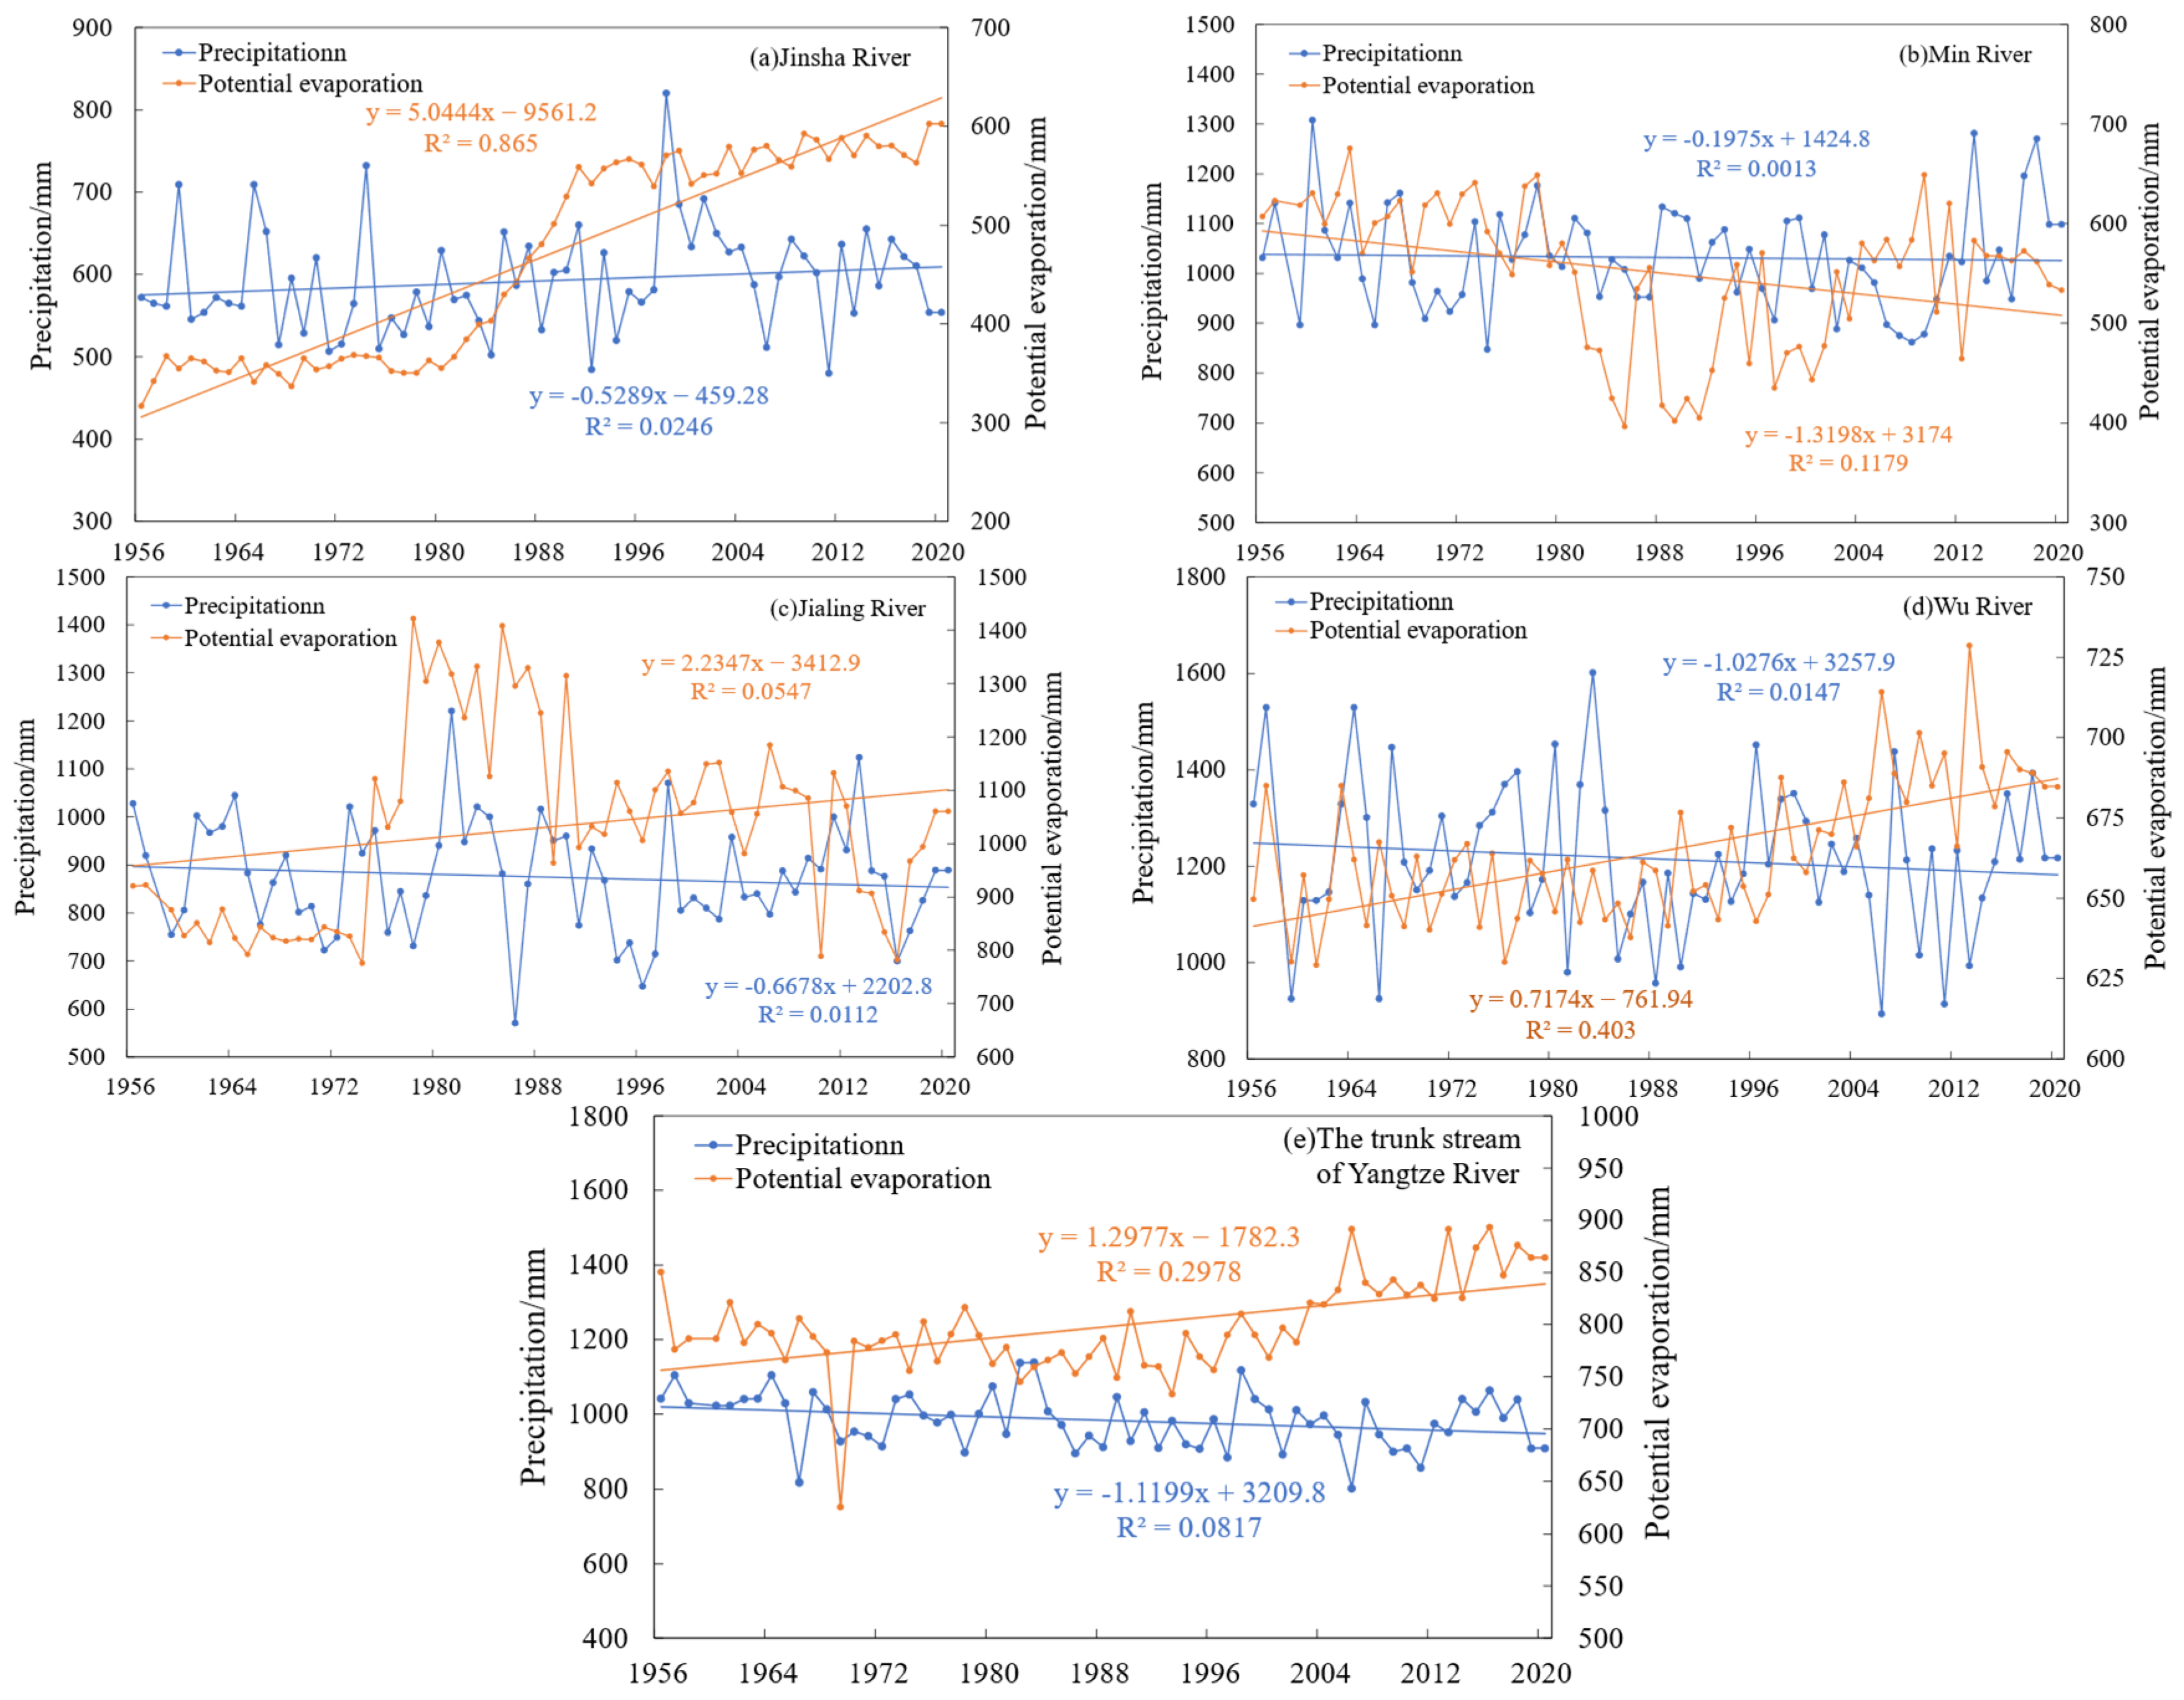
Figure 9 shows the distribution of the multi-year average precipitation and potential evapotranspiration in the upper reaches of the Yangtze River, and, according to the information in the figure, the following can be obtained: the overall precipitation in the upper reaches of the Yangtze River is decreasing, but it is not obvious, and the deviation is not more than 100 mm; the potential evapotranspiration in the upper reaches of the Yangtze River, except for the Min River, is decreasing, while all the other basins maintain an increasing trend, among which the rising trend is more obvious in the Jinsha River basin. Overall, precipitation in the upper Yangtze River decreases while the potential evaporation increases, and the degree of drought in the basin increases.
4.3.3. Attribution Analysis Based on Elasticity Coefficient Method
The elasticity coefficient method, based on the Budyko theory, is used to calculate each hydrological station in the upper reaches of the Yangtze River, and the results are shown in Table 5. According to the table, the absolute values of the precipitation elasticity coefficients () of both the trunk and branch streams of the upper Yangtze River are greater than the potential evapotranspiration elasticity coefficients (), indicating that the changes in the runoff of the upper Yangtze River are more sensitive to precipitation. The contribution rate shows that the contribution rate of human activities is greater than the contribution rate of precipitation and the potential evapotranspiration at all hydrological stations in different stages, except for the Gaochang station in the Ta-Tb stage and the Yichang station in the Ta-Tb stage; however, the difference in the contribution rate of precipitation is not significant, while the contribution rate of potential evapotranspiration has the least effect on runoff, with values ranging from −4.3 to −16.77. Overall, the decrease in runoff from the upper Yangtze River is most affected by human activities, followed by the decrease in precipitation on it; meanwhile, the overall increase in the potential evaporation from the upper Yangtze River has an insignificant effect on the change in runoff.
4.3.4. Study Based on Sediment Attribution Decomposition Method
Based on the principle of the sediment attribution decomposition method, the influencing factors of sediment transport were analyzed for each hydrological station in the upper Yangtze River, including precipitation capacity (P), flow production capacity (r), and sediment production capacity (s). The changes in their components and their contributions to sediment transport are calculated in Table 6, where Ta-Tc represents the time series from 1965 to 2020, Ta-Tb represents the time series from the base period to the first stage of variability for each hydrological station, and Tb-Tc represents the time series from the first stage to the second stage of variability for each hydrological station. A comprehensive analysis shows that the rate of change in the proportion of sediment transport in the upper reaches of the Yangtze River exceeds 1.06, except for the Ta-Tb stage at the Pingshan station, in which the rate of change in sediment transport at the Beibei station exceeds 4.08 at different stages; this indicates that the trend in sediment change in the Jialing River in the upper reaches of the Yangtze River is more obvious. The rate of change in the sand production capacity (s) at all the hydrological stations is greater than that of the precipitation capacity (P) and flow production capacity (r); additionally, its rate of change value is greater than 1.05, except for the Ta-Tb stage at the Ping Shan station. The contribution of sediment production capacity (s) in the basin exceeds 64% at all the hydrological stations in the upper Yangtze River at different stages, followed by the basin flow production capacity, whose contribution is in the range of −10% to 14.22%, except for the Pingshan station in the Ta-Tb stage; meanwhile, the contribution of precipitation (P) has the least impact, except for the Pingshan station in the Ta-Tb stage and the Gaochang station in the Tb-Tc stage, whose contribution rates are all about the absolute value of approximately 1.5. In general, the change in sediment transport in the upper trunk stream and branches of the Yangtze River is mainly controlled by the sediment production capacity in the basin, followed by the flow production capacity in the basin; the change in precipitation has the least effect on the change in sediment transport.
5. Discussion
5.1. Analysis of Factors Influencing Water and Sediment Changes
This study builds on the hydrological situation of the basin and water–sand correlations, and integrates the influence of each element on water–sand in the upper Yangtze River. The elasticity coefficient method and sediment attribution decomposition method are used to combine multiple factors (the elasticity coefficient method includes rainfall, potential evapotranspiration, and underlying surface change, and the sediment attribution decomposition method includes precipitation, runoff, and sand content) to quantify the contribution of influencing factors to the water–sediment change. The use of Budyko’s hypothesis and the sediment attribution decomposition method consistently showed that a range of human activities contribute much more to runoff–sediment reduction than climate change, and the impact is gradually increasing; this is consistent with the results of previous studies [52]. Previous studies have also emphasized the importance of soil and water conservation efforts, land use, and water conservancy construction in watershed hydrologic systems [53,54,55,56]. For climatic factors, we found that the contribution of P reduction to the change in runoff volume of the main stem and major tributaries of the upper Yangtze River is greater than that of E; meanwhile, the contribution to the change in sand transport is generally smaller than that of r and s, similar to the findings of Bao and Zhang et al. [57,58]. In addition, human activities, such as reservoir construction, vegetation restoration and land use, also have a non-negligible influence on r and s changes in sediment characteristics [59], and the analysis of the effects of multiple human activities on water–sand changes has become a key research topic at present [60].
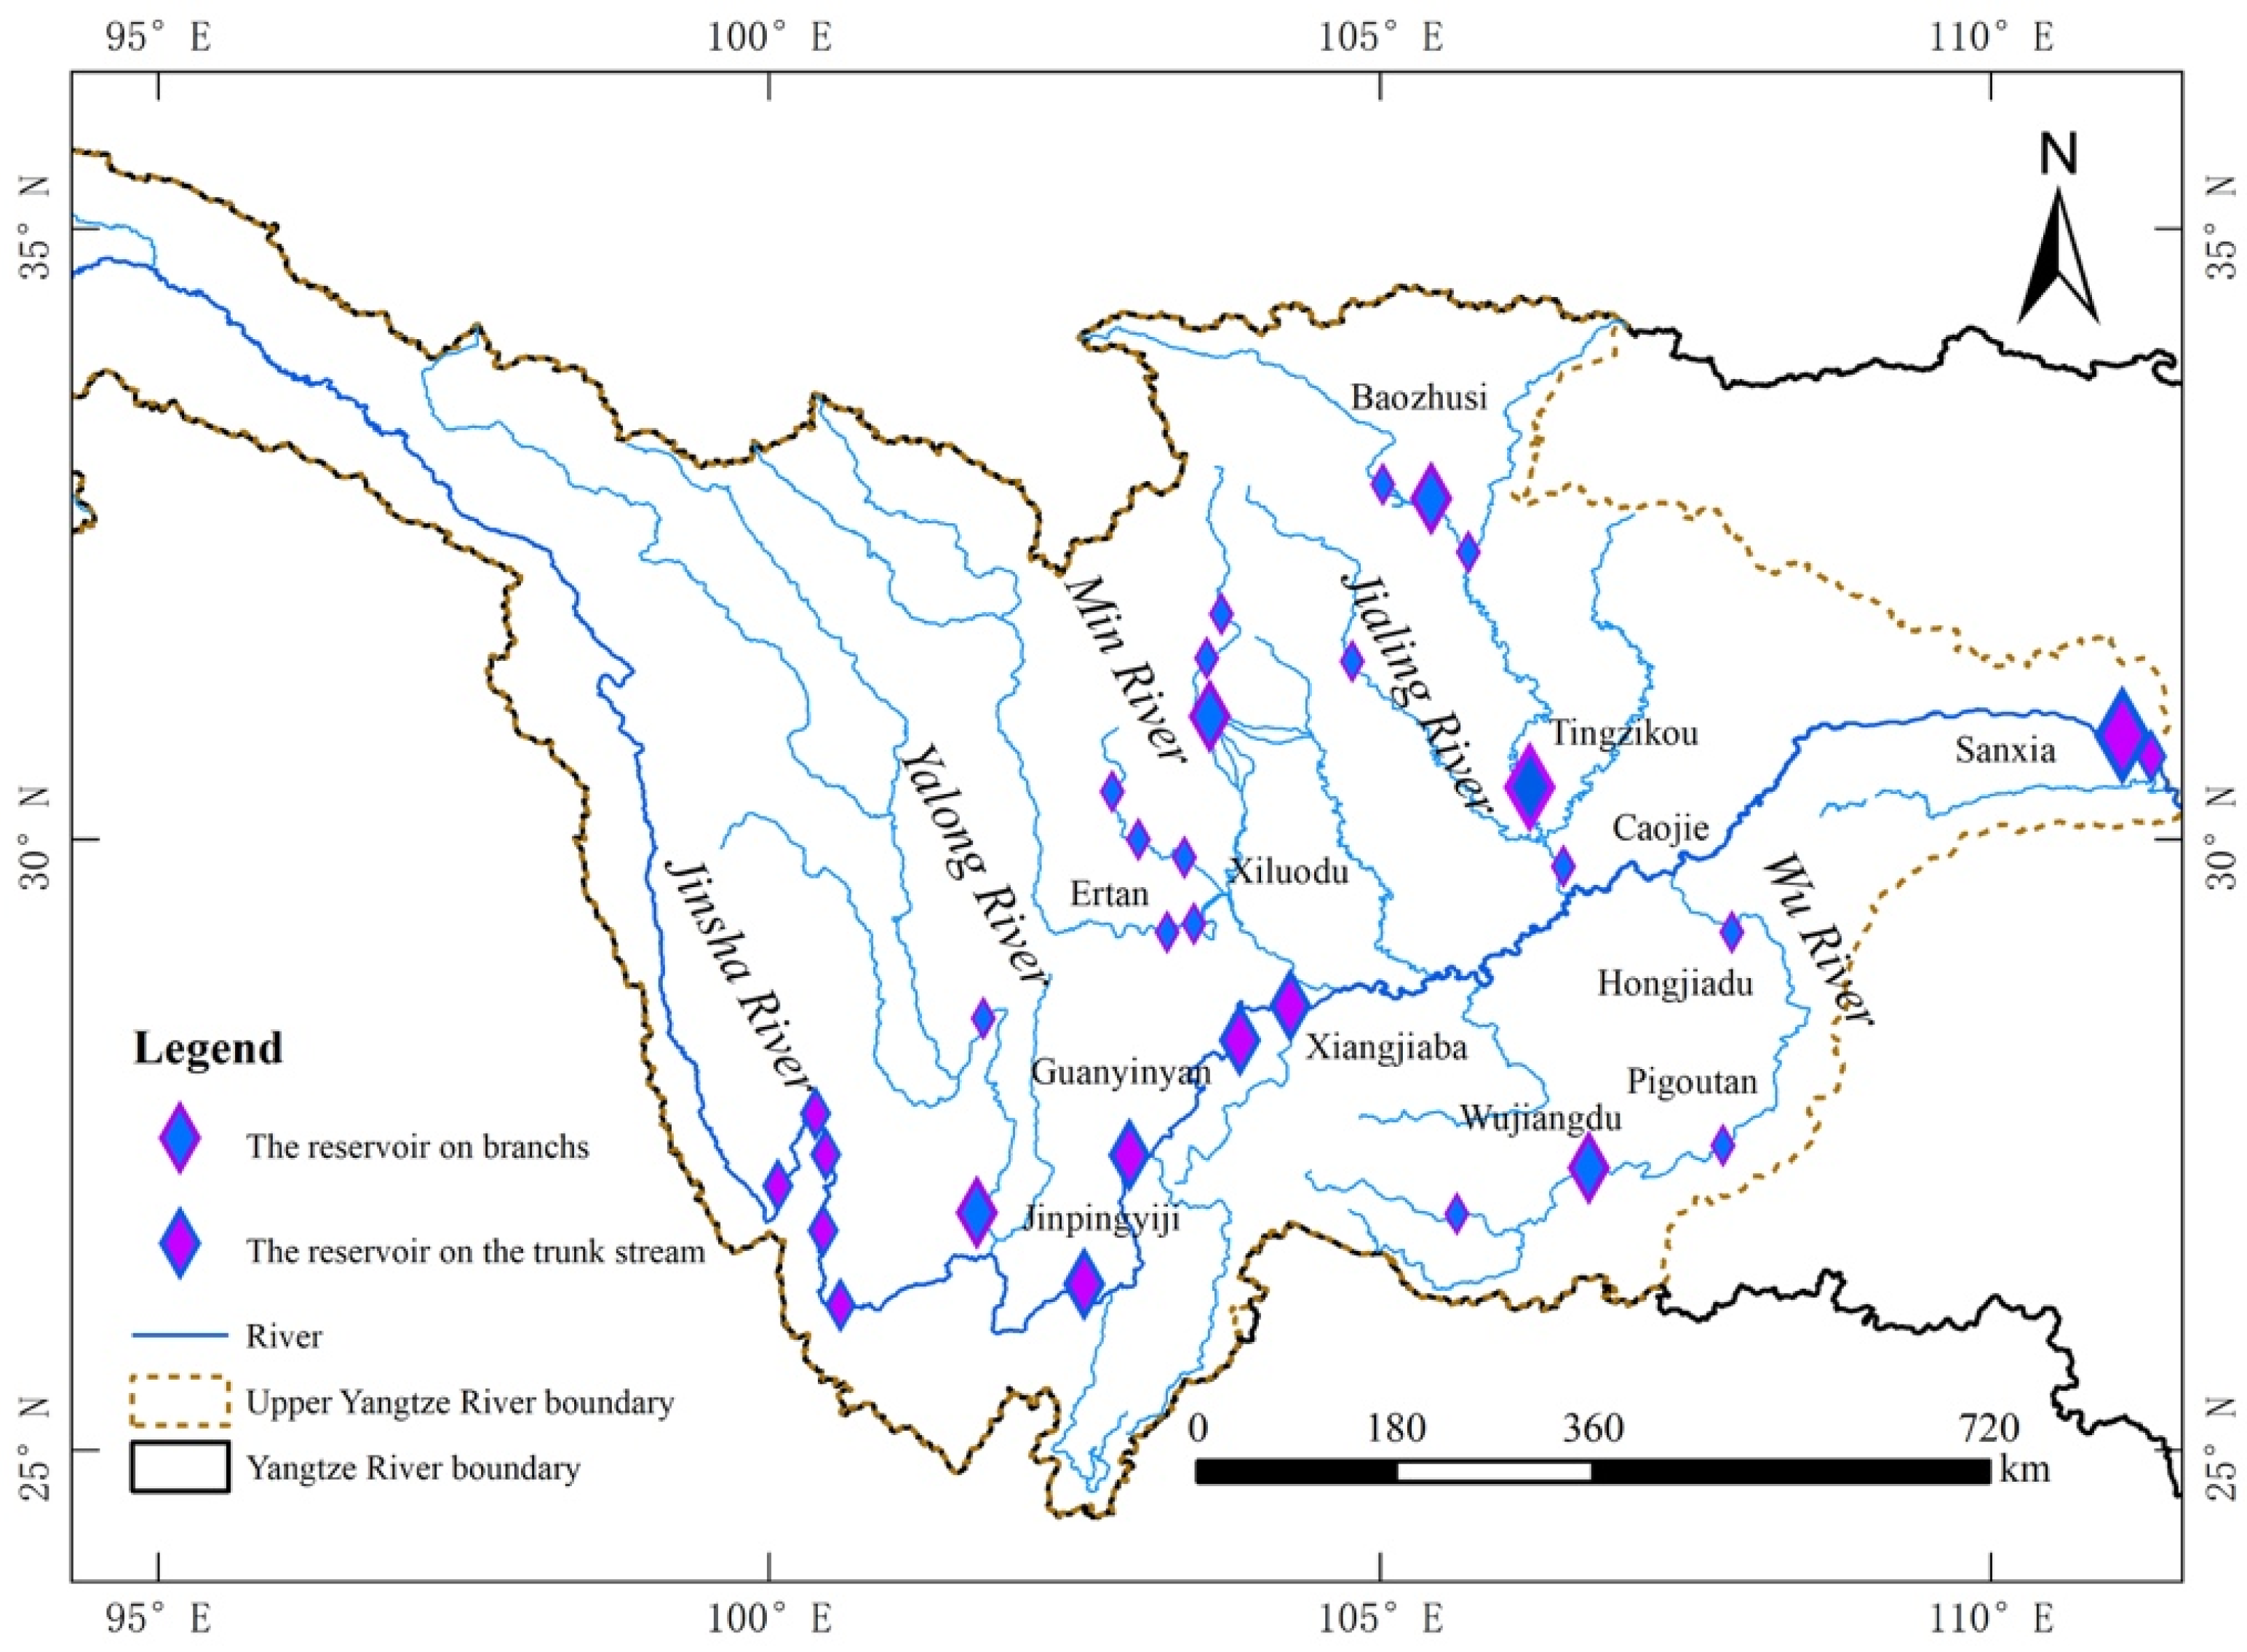
The upper Yangtze River basin is rich in hydropower resources, and the scale of hydropower development and utilization in the trunk stream and branches is huge; this has an important position in China’s national economic development [61]. Because of its mountainous terrain and tremendous topographic variations, the upper Yangtze is well suited for hydroelectric power generation. Specifically, as of the late 1980s, there were 11,931 dams in the upper Yangtze, accounting for 80% of the dams in the entire basin at the time, with a total reservoir capacity of 20.5 billion cubic meters [62]. As of 2016, the number of hydropower dams across the Yangtze River has increased to approximately 52,000, and its total reservoir capacity has increased to approximately 360 billion m3, making it one of the most heavily dammed large rivers in the world. The cumulative flood control capacity (FCC) and the reservoir capacity between the minimum and maximum flood control levels is >77 billion m3. Most dams are located in the upper reaches of the Yangtze River. As of 2017, there are 14,624 dams in the upper reaches of the Yangtze River with storage capacities of >10,000 m3. Large, medium and small reservoirs accounted for 0.7%, 3.4%, and 95.9% respectively. Although the number of large reservoirs is much smaller than that of small and medium reservoirs, they have a very large capacity, accounting for 86.6% of the total reservoir capacity. The current construction of major reservoirs in the upper Yangtze River is shown in Figure 10.
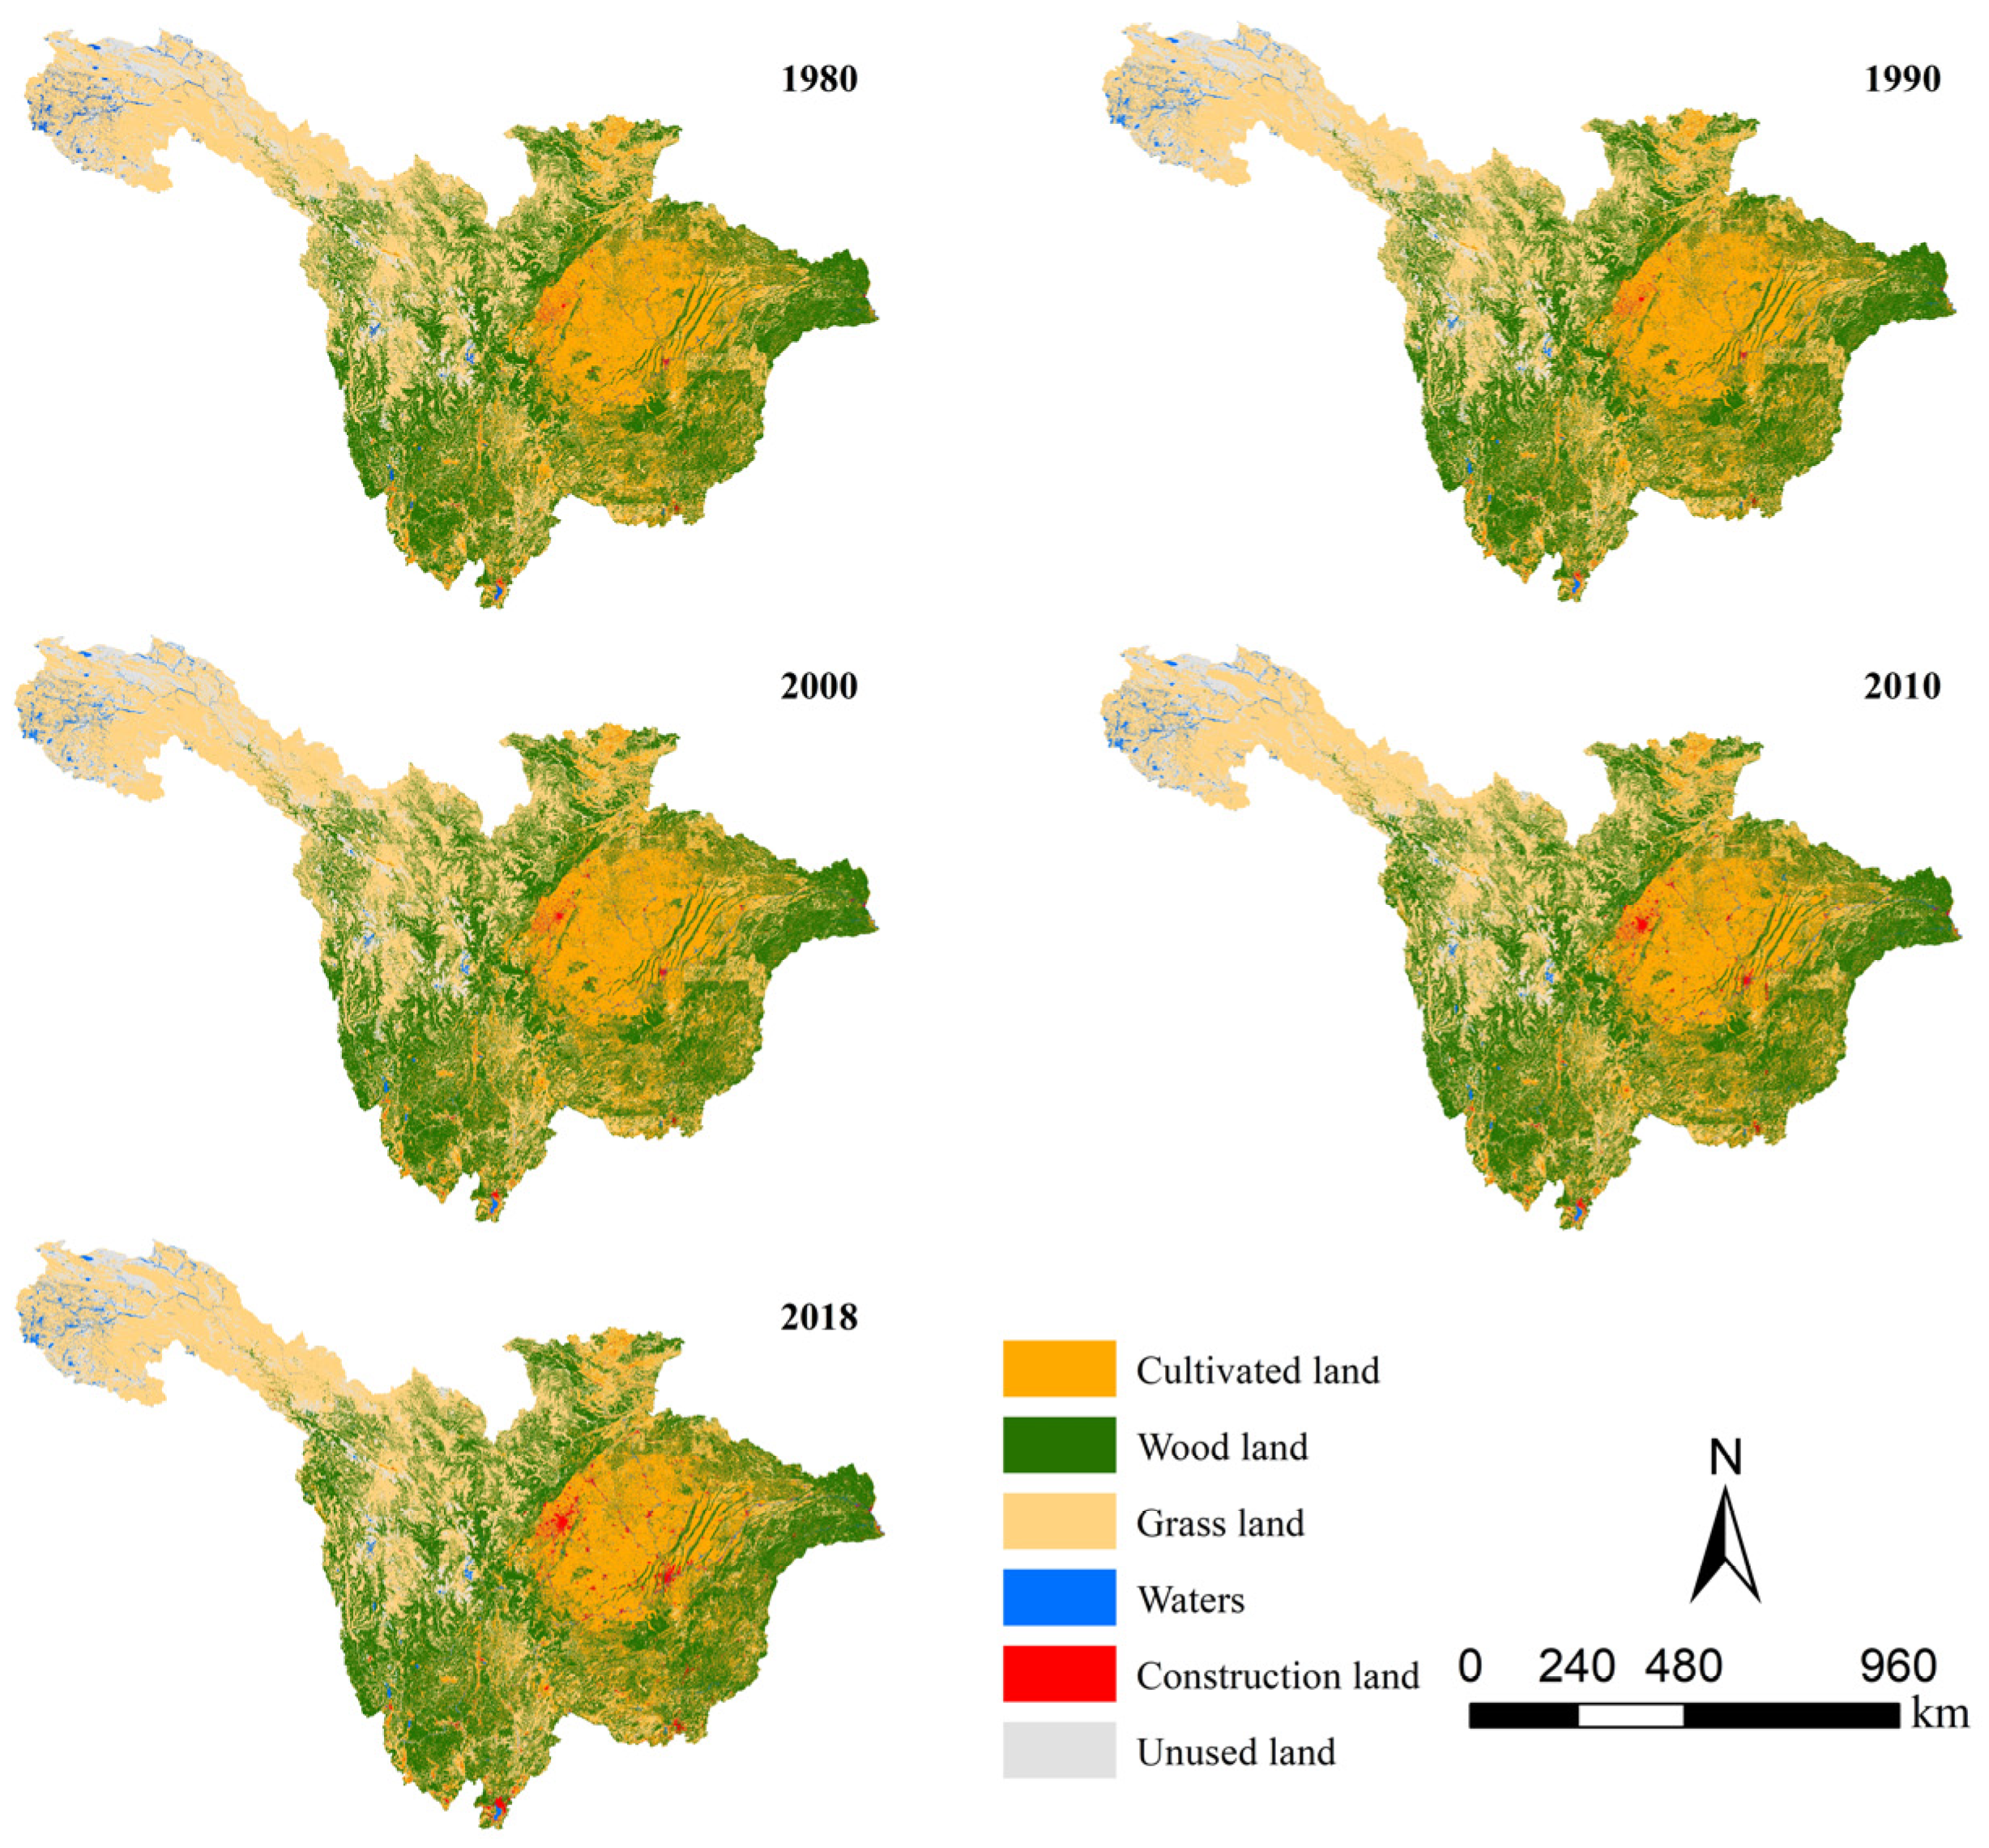
During 1980–2018, a series of vegetation restoration projects, and soil and water conservation programs were carried out, which contributed to a significant improvement in the protection and restoration of soil vegetation [63]. These studies showed that the proportion of forest land (34.91–35.93%), grassland (35.36–35.56%), and arable land area (21.52–22.14%) in the upper reaches of the Yangtze River is large, as seen in Figure 11. Compared to 1980, the area of water, woodland, and construction land in 2020 all show an increasing trend, each with an increase of 0.82%, 2.1%, and 208.3%, respectively; meanwhile, the area of unused land, cultivated land and grassland all show a decreasing trend, each with a decrease of 18%, 3% and 0.44%, respectively. There has been some reduction in grassland and cultivated land, indicating that human activities have had some impact on habitats in the watershed. According to Figure 12, the transfer of water area has been the most complex in the last 40 years, followed by the transfer of grassland area; the most direct manifestation of the complex land use change on the upper Yangtze River is in soil erosion. Since the 1950s, the rapid increase in population and the expansion of human activities in the Yangtze River basin have led to an increase in the impermeable layer of the basin’s subsurface, affecting the runoff–sediment–precipitation–evaporation cycle; this has changed the spatial and temporal distribution of the water resources [64]. In response, the state has taken active measures to implement ecological restoration actions, such as soil and water conservation, in the Yangtze River basin [65].
In addition, due to the extremely complex formation environment of natural rivers, real rivers usually have irregular channel cross-sections and form intricate river network systems under the hydraulic action of a large number of rivers, crossings, and hydraulic facilities. In order to gain a deeper understanding of the macro and micro characteristics of rivers, it is often necessary to build a river network model based on the complex networks theory and to carry out applied analytical studies on the target watersheds to achieve the purpose of predicting and controlling the dynamic changes in river networks [66]. For a more scientific understanding of the driving mechanisms of river sediment changes, the role of turbulence and secondary flows in different sections of the river (rectangular or trapezoidal) should also be considered on this basis, and inhomogeneous velocity distributions in the river can also greatly affect the transport of river sediment [67]. Therefore, to describe complex river characteristics, various numerical and mathematical models (e.g., Shiono–Knight model, Multi-Zonal model) have been introduced to simulate turbulence and secondary flow variations in the river channel and thus calculate its flow distribution [68]. Subsequently, Pu optimized the Shiono–Knight model for simulating the sidewall effect of secondary flow, which can be used to predict the effect of the sidewall on secondary flow velocity, resulting in another improvement in its computational accuracy. Such model predictions play a key role in determining the stability of turbulence-induced riverbank scour [69]. Meanwhile, natural rivers are often accompanied by nudged and rough riverbeds, and both bed shape and roughness can greatly alter the time-averaged spatial velocity and turbulence characteristics of the river, and how to optimize the water-worked bed that simulates natural riverbeds (how to create an appropriate bedform, how to fill the bed, etc.); therefore, establishing a link with, and quantifying the effects of river water and sand changes are key future research directions [70,71,72].
5.2. Environmental Impact of Water and Sediment Changes
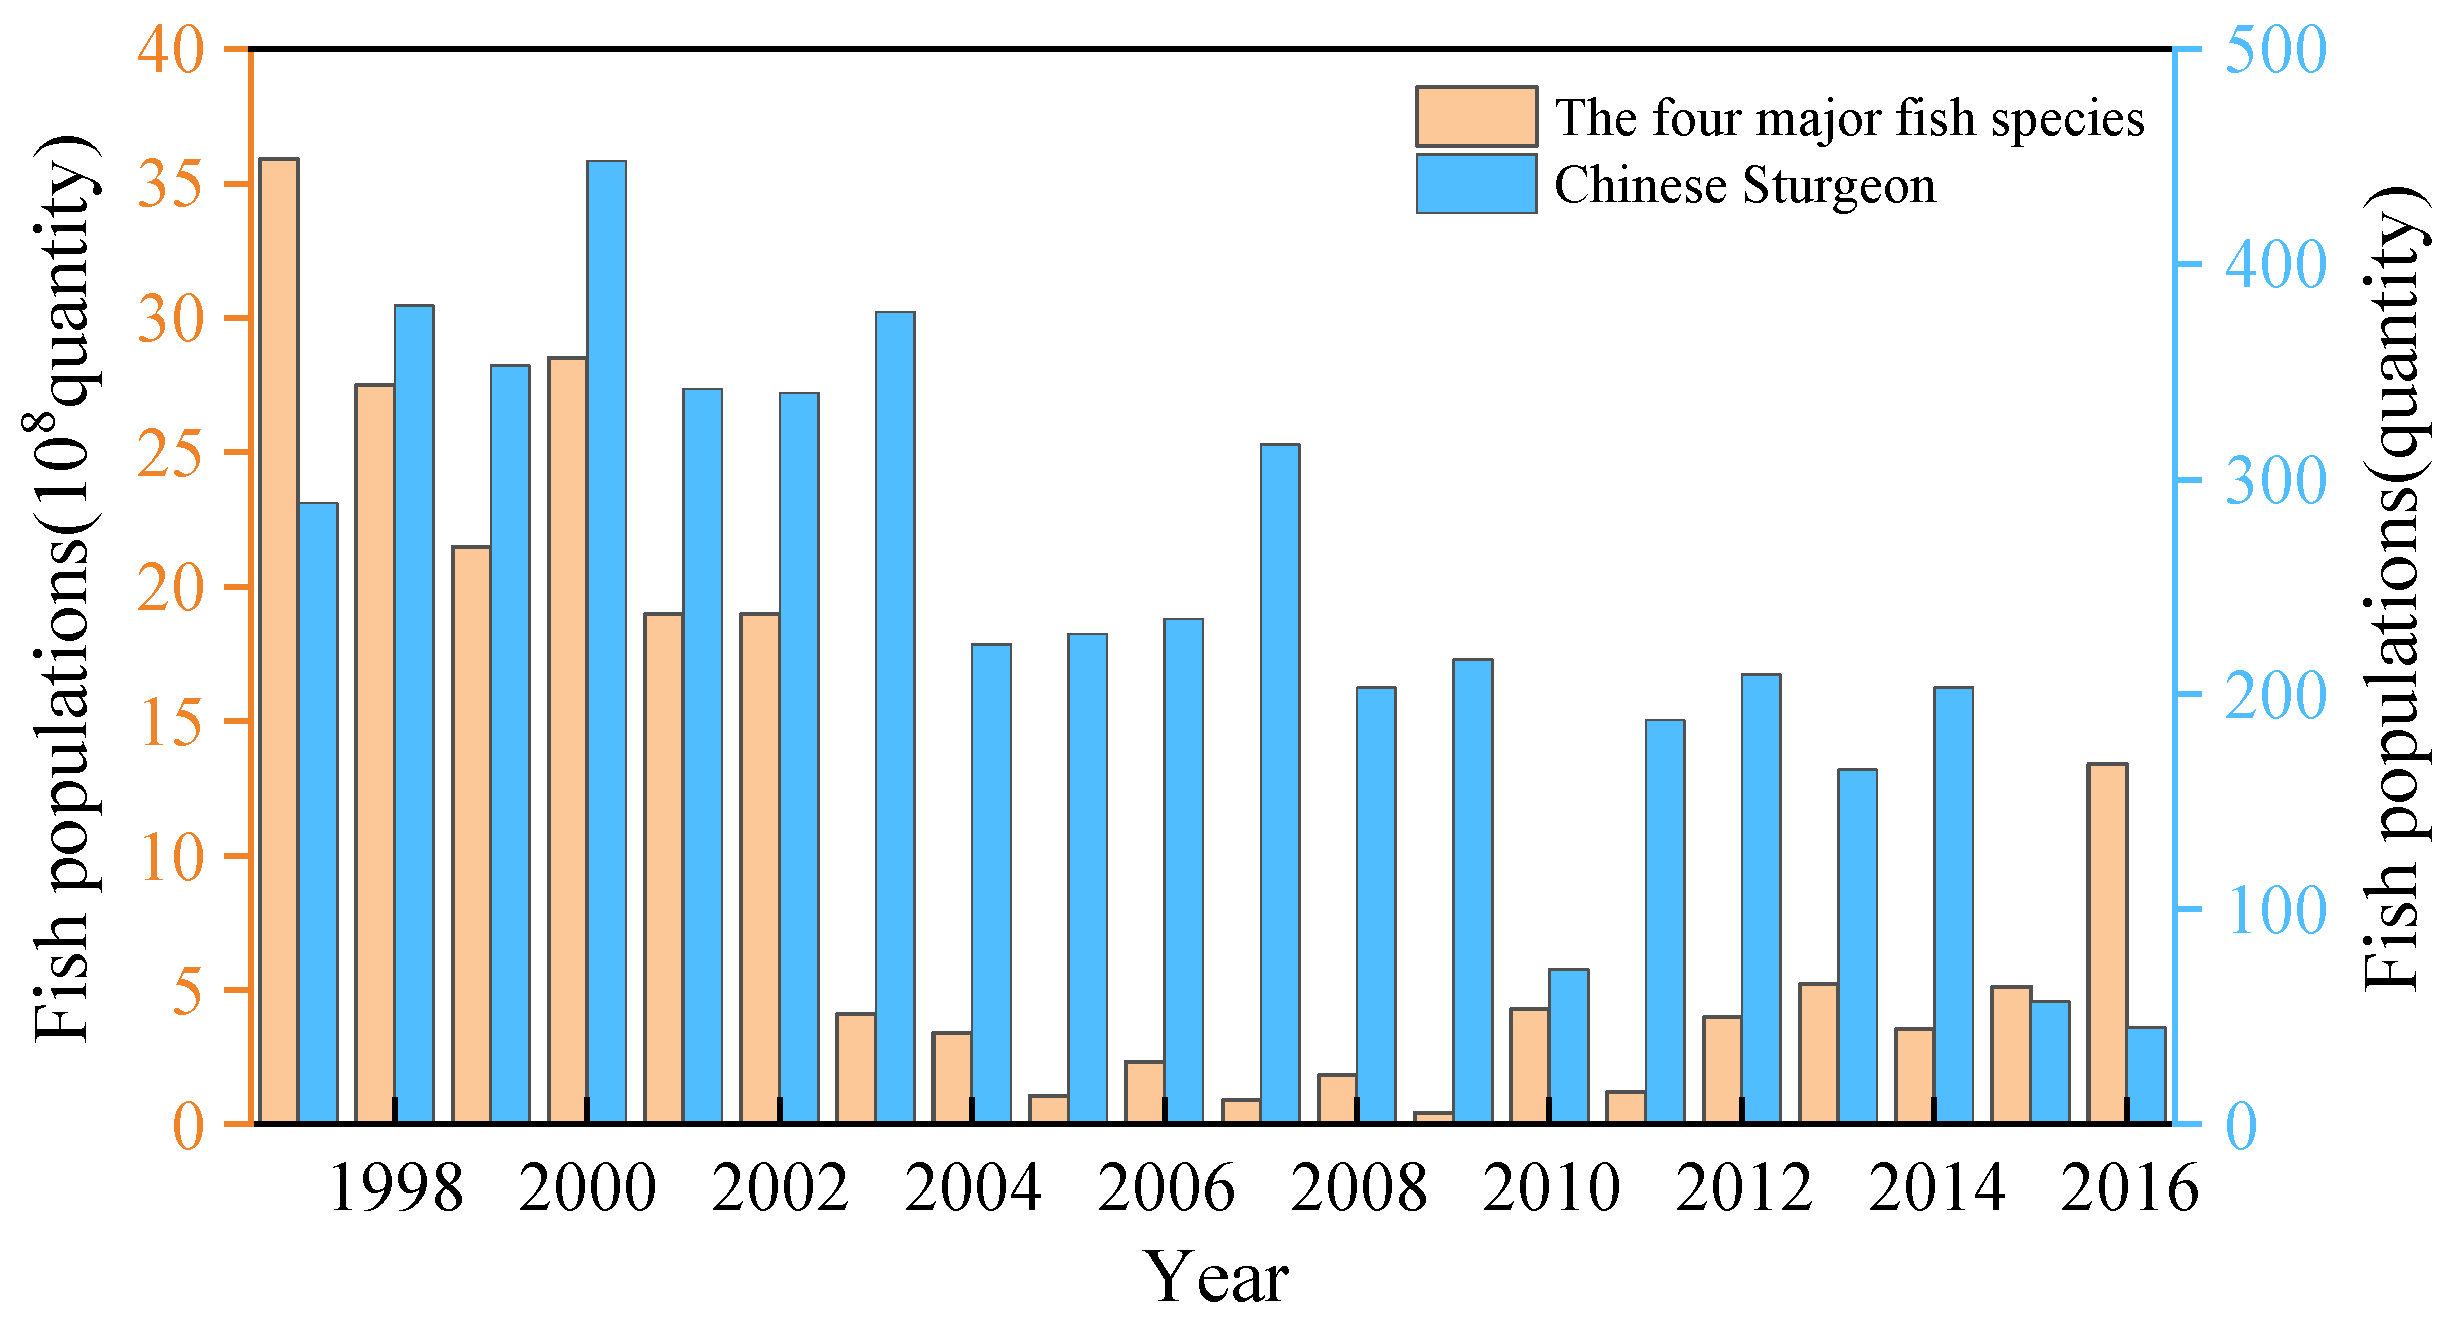
Reduced river runoff and sediment transport have a significant impact on changes in hydrology and geomorphology, which have a serious impact on the stability of river ecosystems. After the Three Gorges Dam impoundment, a large amount of sediment was trapped in the reservoir area, and the sediment volume at the Yichang station downstream of the Three Gorges Reservoir decreased sharply as a result. With a significant reduction in water and sediment flux, the sediment volume in the Yangtze River’s middle and lower reaches shifted from the original sedimentation state to the erosion state along the river banks; the result of river bank erosion and scouring is river bank collapse. According to the CWRC survey (2003–2017), more than 920 phases of varying degrees of collapse occurred in the Yangtze River’s middle and lower reaches, with a total collapsed length of more than 693 km. Furthermore, the reduction in water and sediment in the river alters the water ecology, having a greater effect on the freshwater environment. Garric et al. [42] demonstrated that river flow velocity, sediment content, and dissolved oxygen concentration all play a role in fish lethality. According to the Yangtze River Three Gorges Project’s Ecological and Environmental Monitoring Bulletin (1997–2016), the population of the four major fish and Chinese sturgeon in the Yangtze River’s middle reaches has been decreasing year by year, and their oviposition size has become smaller and fewer. The reproductive rate of four major fish and Chinese sturgeon decreased significantly, particularly after the impoundment of the Three Gorges Reservoir in 2003 (Figure 13), with the estimated number of Chinese sturgeon breeding population before the first spawning being less than 250, and less than 100 after 2014. This series of ecological imbalances needs to be further explored for the linkages, in order to further address the current situation through the water and sediment regulation of the Yangtze River.
6. Conclusions
In this study, a comprehensive assessment method was used to analyze the spatial and temporal characteristics of runoff–sediment, hydrological situation changes and the quantification of influencing factors in the upper Yangtze River based on the TFPW–MK trend test method, the IHA-RVA method, the water–sediment relationship curve method, the Budyko hypothesis and the sediment attribution decomposition method. The results show that the runoff volume in the upper reaches of the Yangtze River displays a decreasing trend, except for the rising trend at the Ping Shan station, and the trend of all the tributaries and main streams is not significant. Compared with the runoff, the sand transport in all the tributaries and main streams of the upper Yangtze River shows a decreasing trend, which is significant. There is no significant abrupt change in the runoff volume of the upper Yangtze River, except for the Yichang station in 2002, and the abrupt changes are concentrated in the 1980s, 1990s and 2000s. All the stations in the upper reaches of the Yangtze River have significant abrupt changes in sand transport, and the abrupt changes are concentrated in the 1990s and 2000s. Next, the overall variability in runoff at the Yichang station is 63%, while the overall variability in sand transport reaches 84% and exceeds that of the rest of the hydrological stations; this indicates that the variability in the water and sand fluxes in the upper Yangtze River is greater, and that the variability in sand transport is more serious. The decrease in precipitation in the basin and the enhancement of human activities (reservoir construction, land use, etc.) are the main reasons for the change in runoff, and the contribution rate is all around 60%; the change in sand transport is less influenced by climate change, and the contribution rate of rainfall is only around −2%, which is mainly controlled by the sand production capacity in the basin, with an average contribution rate of 96.5%.
River biodiversity as a whole is decreasing due to the variability in water and sand conditions in the upper Yangtze River, and the numbers of some nationally protected fish and even economic fish are significantly reduced. The results of this study provide a fundamental understanding of the potential drivers of water–sand variability in the basin, which provides a reference for water resource management and sustainability in the basin. However, further research and attention is needed to fully refine the regulation of water resources in the form of climate change and human activities.
Author Contributions
H.W. and Y.M.: Data curation, writing—original draft, methodology, funding acquisition. L.H., X.J., H.Y. and F.H.: conceptualization, supervision. W.G.: conceptualization, supervision, project administration, funding acquisition. All authors have read and agreed to the published version of the manuscript.
Funding
This study was supported by Basic Research Project of Key Scientific Research Projects of Colleges and Universities of Henan Province (23ZX012); The National Natural Science Foundation of China (Grant No. 51779094); The 2016 Henan University Science and Technology Innovation Talent Support Plan (16HASTIT024); The Water Conservancy Science and Technology Project of Guizhou Province(KT202008).
Institutional Review Board Statement
Not applicable.
Informed Consent Statement
Not applicable.
Data Availability Statement
Not applicable.
Conflicts of Interest
The authors declare that they have no competing interests.
References
- Ge, J.; Peng, W.; Huang, W.; Qu, X.; Singh, S.K. Quantitative Assessment of Flow Regime Alteration Using a Revised Range of Variability Methods. Water 2018, 10, 597. [Google Scholar] [CrossRef]
- Hu, Y.; Feng, J.; Wang, M.; He, X. Influences of climate and land surface change on runoff and sediment in Jialing River Basin. Sci. Soil Water Conserv. 2016, 14, 75–83. [Google Scholar] [CrossRef]
- Richter, B.D.; Baumgartner, J.V.; Powell, J.; Braun, D.P. A Method for Assessing Hydrologic Alteration within Ecosystems. Conserv. Biol. 1996, 10, 1163–1174. [Google Scholar] [CrossRef]
- Galat, D.L.; Lipkin, R. Restoring ecological integrity of great rivers: Historical hydrographs aid in defining reference conditions for the Missouri River. In Hydrobiologia; Jungwirth, M., Muhar, S., Schmutz, S., Eds.; Springer: Dordrecht, The Netherlands, 2000; Volume 422, pp. 29–48. ISBN 978-94-010-5814-8. [Google Scholar]
- Cheng, N.N.; He, H.M.; Yang, S.Y.; Lu, Y.J.; Jing, Z.W. Impacts of topography on sediment discharge in Loess Plateau, China. Quat. Int. 2017, 440, 119–129. [Google Scholar] [CrossRef]
- Zhou, Y.; Li, D.; Lu, J.; Yao, S.; Yan, X.; Jin, Z.; Liu, L.; Lu, X.X. Distinguishing the multiple controls on the decreased sediment flux in the Jialing River basin of the Yangtze River, Southwestern China. Catena 2020, 193, 104593. [Google Scholar] [CrossRef]
- Wang, S.; Fu, B.J.; Piao, S.L.; Lü, Y.H.; Ciais, P.; Feng, X.M.; Wang, Y.F. Reduced sediment transport in the Yellow River due to anthropogenic changes. Nat. Geosci. 2016, 9, 38–41. [Google Scholar] [CrossRef]
- Zhang, Y.; Song, C. Impacts of Afforestation, Deforestation, and Reforestation on Forest Cover in China from 1949 to 2003. Soc. Am. For. 2006, 10, 341–356. [Google Scholar] [CrossRef]
- Xu, Z.; Bennett, M.T.; Tao, R.; Xu, J. China’s Sloping Land Conversion Program Four Years on: Current Situation and Pending Issues. Int. For. Rev. 2004, 6, 317–326. [Google Scholar] [CrossRef]
- Zhai, R.; Tao, F. Contributions of climate change and human activities to runoff change in seven typical catchments across China. Sci. Total Environ. 2017, 605–606, 219–229. [Google Scholar] [CrossRef]
- Milliman, J.D.; Farnsworth, K.L.; Jones, P.D.; Xu, K.H.; Smith, L.C. Climatic and anthropogenic factors affecting river discharge to the global ocean, 1951–2000. Glob. Planet. Chang. 2008, 62, 187–194. [Google Scholar] [CrossRef]
- Zhao, Y.; Zou, X.; Liu, Q.; Yao, Y.; Li, Y.; Wu, X.; Wang, C.; Yu, W.; Wang, T. Assessing natural and anthropogenic influences on water discharge and sediment load in the Yangtze River, China. Sci. Total Environ. 2017, 607, 920–932. [Google Scholar] [CrossRef]
- Sivapalan, M.; Zhang, L.; Vertessy, R.; Blöschl, G. Downward approach to hydrological prediction. Hydrol. Process. 2003, 17, 2099. [Google Scholar] [CrossRef]
- Sankarasubramanian, A.; Vogel, R.M. Annual hydroclimatology of the United States. Water Resour. Res. 2002, 38, 19-1–19-12. [Google Scholar] [CrossRef]
- Htwe, A.T.; Thant, A.A. Comparison of Radiation-based Method and the Standard Penman- Monteith Estimates of Reference Evapotranspiration in Myanmar. Int. J. Sci. Eng. Technol. Res. 2014, 3, 857–864. [Google Scholar]
- He, Y.; Song, J.; Hu, Y.; Tu, X.; Zhao, Y. Impacts of different weather conditions and landuse change on runoff variations in the Beiluo River Watershed, China. Sustain. Cities Soc. 2019, 50, 101674. [Google Scholar] [CrossRef]
- Yang, D.; Sun, F.; Liu, Z.; Cong, Z.; Lei, Z. Interpreting the complementary relationship in non-humid environments based on the Budyko and Penman hypotheses. Geophys. Res. Lett. 2006, 33, 18. [Google Scholar] [CrossRef]
- Liu, B.; Xu, M.; Henderson, M.; Gong, W. A spatial analysis of pan evaporation trends in China, 1955–2000. J. Geophys. Res. Atmos. 2004, 109, D15102. [Google Scholar] [CrossRef]
- Lv, X.; Zuo, Z.; Ni, Y.; Sun, J.; Wang, H. The effects of climate and catchment characteristic change on streamflow in a typical tributary of the Yellow River. Sci. Rep. 2019, 9, 14535. [Google Scholar] [CrossRef]
- Yang, L.; Zhao, G.; Tian, P.; Mu, X.; Tian, X.; Feng, J.; Bai, Y. Runoff changes in the major river basins of China and their responses to potential driving forces. J. Hydrol. 2022, 607, 127536. [Google Scholar] [CrossRef]
- Li, D.; Lu, X.X.; Yang, X.; Chen, L.; Lin, L. Sediment load responses to climate variation and cascade reservoirs in the Yangtze River: A case study of the Jinsha River. Geomorphology 2018, 322, 41–52. [Google Scholar] [CrossRef]
- Wang, S.; Fu, B.; Liang, W.; Liu, Y.; Wang, Y. Driving forces of changes in the water and sediment relationship in the Yellow River. Sci. Total Environ. 2017, 576, 453–461. [Google Scholar] [CrossRef] [PubMed]
- Wang, H.; Yang, Z.; Wang, Y.; Saito, Y.; Liu, J.P. Reconstruction of sediment flux from the Changjiang (Yangtze River) to the sea since the 1860s. J. Hydrol. 2008, 349, 318–332. [Google Scholar] [CrossRef]
- Nilsson, C.; Reidy, C.A.; Dynesius, M.; Revenga, C. Fragmentation and Flow Regulation of the World’s Large River Systems. Science 2005, 308, 405–408. [Google Scholar] [CrossRef] [PubMed]
- Lu, X.X.; Ran, L.S.; Liu, S.; Jiang, T.; Zhang, S.R.; Wang, J.J. Sediment loads response to climate change: A preliminary study of eight large Chinese rivers. Int. J. Sediment Res. 2013, 28, 1–14. [Google Scholar] [CrossRef]
- Zhu, Y.-M.; Lu, X.X.; Zhou, Y. Sediment flux sensitivity to climate change: A case study in the Longchuanjiang catchment of the upper Yangtze River, China. Glob. Planet. Chang. 2008, 60, 429–442. [Google Scholar] [CrossRef]
- Sun, P.; Wu, Y.; Wei, X.; Sivakumar, B.; Qiu, L.; Mu, X.; Chen, J.; Gao, J. Quantifying the contributions of climate variation, land use change, and engineering measures for dramatic reduction in streamflow and sediment in a typical loess watershed, China. Ecol. Eng. 2020, 142, 105611. [Google Scholar] [CrossRef]
- Best, J. Anthropogenic stresses on the world’s big rivers. Nat. Geosci. 2019, 12, 7–21. [Google Scholar] [CrossRef]
- Wu, J.; Miao, C.; Zhang, X.; Yang, T.; Duan, Q. Detecting the quantitative hydrological response to changes in climate and human activities. Sci. Total Environ. 2017, 586, 328–337. [Google Scholar] [CrossRef]
- Fan, H.; He, H.; Xu, L.; Zhang, M.; Jiang, J. Simulation and attribution analysis based on the long-short-term-memory network for de- tecting the dominant cause of runoff variation in the Lake Poyang Basin. J. Lake Sci. 2021, 33, 866–878. [Google Scholar] [CrossRef]
- Antico, A.; Schlotthauer, G.; Torres, M.E. Analysis of hydroclimatic variability and trends using a novel empirical mode decomposition: Application to the Paraná River Basin. J. Geophys. Res. Atmos. 2014, 119, 1218–1233. [Google Scholar] [CrossRef]
- Huai, W.; Gao, M.; Zeng, Y.; Li, D. Two-Dimensional Analytical Solution for Compound Channel Flows with Vegetated Floodplains. Appl. Math. Mech. 2009, 30, 1121–1130. [Google Scholar] [CrossRef]
- Xu, C.-Y.; Gong, L.; Jiang, T.; Chen, D.; Singh, V.P. Analysis of spatial distribution and temporal trend of reference evapotranspiration and pan evaporation in Changjiang (Yangtze River) catchment. J. Hydrol. 2006, 327, 81–93. [Google Scholar] [CrossRef]
- Burn, D.H.; Elnur, M.A.H. Detection of hydrologic trends and variability. J. Hydrol. 2002, 255, 107–122. [Google Scholar] [CrossRef]
- Zhang, D.; Cong, Z.; Ni, G. Comparison of three Mann-Kendall methods based on the China’s meteorological data. Adv. Water Sci. 2013, 24, 490–496. [Google Scholar] [CrossRef]
- Kahya, E.; Kalaycı, S. Trend analysis of streamflow in Turkey. J. Hydrol. 2004, 289, 128–144. [Google Scholar] [CrossRef]
- Huntington, T.G. Evidence for intensification of the global water cycle: Review and synthesis. J. Hydrol. 2006, 319, 83–95. [Google Scholar] [CrossRef]
- Guo, W.; Jiao, X.; Zhou, H.; Zhu, Y.; Wang, H. Hydrologic regime alteration and influence factors in the Jialing River of the Yangtze River, China. Sci. Rep. 2022, 12, 11166. [Google Scholar] [CrossRef]
- Zhang, J.; Zhang, X.; Xiao, H. Study of the dynamic evaluation model of overall hydrological alternation degree based on the RVA and set pair analysis-Markov chain methods. Water Supply 2019, 19, 1515–1524. [Google Scholar] [CrossRef]
- Guo, W.; Zhou, H.; Jiao, X.; Huang, L.; Wang, H. Analysis of Alterations of the Hydrological Situation and Causes of River Runoff in the Min River, China. Water 2022, 14, 1093. [Google Scholar] [CrossRef]
- Yang, Y.-C.E.; Cai, X.; Herricks, E.E. Identification of hydrologic indicators related to fish diversity and abundance: A data mining approach for fish community analysis. Water Resour. Res. 2008, 44, 4. [Google Scholar] [CrossRef]
- Gao, P.; Li, P.; Zhao, B.; Xu, R.; Zhao, G.; Sun, W.; Mu, X. Use of double mass curves in hydrologic benefit evaluations. Hydrol. Process. 2017, 31, 4639–4646. [Google Scholar] [CrossRef]
- Cluis, D.A. Visual techniques for the detection of water quality trends: Double-mass curves and cusum functions. Environ. Monit. Assess. 1983, 3, 173–184. [Google Scholar] [CrossRef] [PubMed]
- Walling, D.E. Human impact on land–ocean sediment transfer by the world’s rivers. Geomorphology 2006, 79, 192–216. [Google Scholar] [CrossRef]
- Hu, B.; Wang, H.; Yang, Z.; Sun, X. Temporal and Spatial Variations of Sediment Rating Curves in the Changjiang (Yangtze River) Basin and Their Implications. Quat. Int. 2011, 230, 34–43. [Google Scholar] [CrossRef]
- Sun, Y.; Wang, X. Changes in Runoff and Driving Force Analysis in the Key Section of the Yellow River Diversion Project. J. Hydroecol. 2020, 41, 19–26. [Google Scholar] [CrossRef]
- Liu, J.; Zhang, Q.; Singh, V.P.; Shi, P. Contribution of multiple climatic variables and human activities to streamflow changes across China. J. Hydrol. 2017, 545, 145–162. [Google Scholar] [CrossRef]
- Xu, X.; Yang, D.; Yang, H.; Lei, H. Attribution analysis based on the Budyko hypothesis for detecting the dominant cause of runoff decline in Haihe basin. J. Hydrol. 2014, 510, 530–540. [Google Scholar] [CrossRef]
- Zhang, L.; Dawes, W.R.; Walker, G.R. Response of mean annual evapotranspiration to vegetation changes at catchment scale. Water Resour. Res. 2001, 37, 701–708. [Google Scholar] [CrossRef]
- Samaras, A.G.; Koutitas, C.G. Modeling the impact of climate change on sediment transport and morphology in coupled watershed-coast systems: A case study using an integrated approach. Int. J. Sediment Res. 2014, 29, 304–315. [Google Scholar] [CrossRef]
- Guo, L.; Su, N.; Townend, I.; Wang, Z.B.; Zhu, C.; Wang, X.; Zhang, Y.; He, Q. From the headwater to the delta: A synthesis of the basin-scale sediment load regime in the Changjiang River. Earth-Sci. Rev. 2019, 197, 102900. [Google Scholar] [CrossRef]
- Mu, X.; Zhang, X.; Shao, H.; Gao, P.; Wang, F.; Jiao, J.; Zhu, J. Dynamic Changes of Sediment Discharge and the Influencing Factors in the Yellow River, China, for the Recent 90 Years. Clean Soil Air Water 2012, 40, 303–309. [Google Scholar] [CrossRef]
- Yu, Y.; Wang, H.; Shi, X.; Ran, X.; Cui, T.; Qiao, S.; Liu, Y. New discharge regime of the Huanghe (Yellow River): Causes and implications. Cont. Shelf Res. 2013, 69, 62–72. [Google Scholar] [CrossRef]
- Miao, C.-Y.; Ni, J.-R. Variation of Natural Streamflow since 1470 in the Middle Yellow River, China. Int. J. Environ. Res. Public Health 2009, 6, 2849–2864. [Google Scholar] [CrossRef]
- Gao, P.; Deng, J.; Chai, X.; Mu, X.; Zhao, G.; Shao, H.; Sun, W. Dynamic sediment discharge in the Hekou–Longmen region of Yellow River and soil and water conservation implications. Sci. Total Environ. 2017, 578, 56–66. [Google Scholar] [CrossRef]
- Wang, H.; Yang, Z.; Saito, Y.; Liu, J.P.; Sun, X. Interannual and seasonal variation of the Huanghe (Yellow River) water discharge over the past 50 years: Connections to impacts from ENSO events and dams. Glob. Planet. Chang. 2006, 50, 212–225. [Google Scholar] [CrossRef]
- Zhang, C.; Zhang, B.; Li, W.; Liu, M. Response of streamflow to climate change and human activity in Xitiaoxi river basin in China. Hydrol. Process. 2014, 28, 43–50. [Google Scholar] [CrossRef]
- Bao, Z.; Zhang, J.; Wang, G.; Fu, G.; He, R.; Yan, X.; Jin, J.; Liu, Y.; Zhang, A. Attribution for decreasing streamflow of the Haihe River basin, northern China: Climate variability or human activities? J. Hydrol. 2012, 460, 117–129. [Google Scholar] [CrossRef]
- Zhang, C.; Liu, G.; Xue, S.; Wang, G. Changes in rhizospheric microbial community structure and function during the natural recovery of abandoned cropland on the Loess Plateau, China. Ecol. Eng. 2015, 75, 161–171. [Google Scholar] [CrossRef]
- Zhao, G.; Mu, X.; Wen, Z.; Wang, F.; Gao, P. Soil Erosion, Conservation, and Eco-Environment Changes in the Loess Plateau of China. Land Degrad. Dev. 2013, 24, 499–510. [Google Scholar] [CrossRef]
- Cai, H.; Piccolroaz, S.; Huang, J.; Liu, Z.; Liu, F.; Toffolon, M. Quantifying the impact of the Three Gorges Dam on the thermal dynamics of the Yangtze River. Environ. Res. Lett. 2018, 13, 054016. [Google Scholar] [CrossRef]
- Lu, X.; Higgitt, D.L. Recent Changes of Sediment Yield in the Upper Yangtze, China. Environ. Manag. 1998, 22, 697–709. [Google Scholar] [CrossRef] [PubMed]
- Yang, S.L.; Milliman, J.D.; Xu, K.H.; Deng, B.; Zhang, X.Y.; Luo, X.X. Downstream sedimentary and geomorphic impacts of the Three Gorges Dam on the Yangtze River. Earth-Sci. Rev. 2014, 138, 469–486. [Google Scholar] [CrossRef]
- Haleem, K.; Khan, A.U.; Ahmad, S.; Khan, M.; Khan, F.A.; Khan, W.; Khan, J. Hydrological impacts of climate and land-use change on flow regime variations in upper Indus basin. J. Water Clim. Chang. 2022, 13, 758–770. [Google Scholar] [CrossRef]
- Hayashi, S.; Murakami, S.; Xu, K.-Q.; Watanabe, M. Simulation of the reduction of runoff and sediment load resulting from the Gain for Green Program in the Jialingjiang catchment, upper region of the Yangtze River, China. J. Environ. Manag. 2015, 149, 126–137. [Google Scholar] [CrossRef]
- Wu, X.W.; Li, L.; Qu, Y.G. Modelling and Analysis of River Networks Based on Complex Networks Theory. Adv. Mater. Res. 2013, 756–759, 2728–2733. [Google Scholar] [CrossRef]
- Shiono, K.; Knight, D.W. Turbulent open-channel flows with variable depth across the channel. J. Fluid Mech. 1991, 222, 617–646. [Google Scholar] [CrossRef]
- Pu, J.H. Turbulent rectangular compound open channel flow study using multi-zonal approach. Environ. Fluid Mech. 2019, 19, 785–800. [Google Scholar] [CrossRef]
- Pu, J.H.; Pandey, M.; Hanmaiahgari, P.R. Analytical modelling of sidewall turbulence effect on streamwise velocity profile using 2D approach: A comparison of rectangular and trapezoidal open channel flows. J. Hydro-Environ. Res. 2020, 32, 17–25. [Google Scholar] [CrossRef]
- Pu, J.H.; Wei, J.; Huang, Y. Velocity Distribution and 3D Turbulence Characteristic Analysis for Flow over Water-Worked Rough Bed. Water 2017, 9, 668. [Google Scholar] [CrossRef]
- Cooper, J.R.; Tait, S.J. Examining the physical components of boundary shear stress for water-worked gravel deposits. Earth Surf. Process. Landforms 2010, 35, 1240–1246. [Google Scholar] [CrossRef]
- Pu, J.H. Velocity Profile and Turbulence Structure Measurement Corrections for Sediment Transport-Induced Water-Worked Bed. Fluids 2021, 6, 86. [Google Scholar] [CrossRef]
Figure 1.
Map of the upper Yangtze River basin area.

Figure 2.
Average annual runoff in the upper reaches of the Yangtze River.

Figure 3.
Average annual sediment discharge in the upper reaches of the Yangtze River.

Figure 4.
The change degree of each hydrological index at stations in the upper Yangtze River (above is runoff below is sediment).
Figure 4.
The change degree of each hydrological index at stations in the upper Yangtze River (above is runoff below is sediment).


Figure 5.
Fragrance diversity index in the upper reaches of the Yangtze River.

Figure 6.
Runoff–sediment load double accumulation curve in the upper reaches of the Yangtze River.


Figure 7.
Relationship between annual runoff and sediment load in the upper reaches of the Yangtze River.
Figure 7.
Relationship between annual runoff and sediment load in the upper reaches of the Yangtze River.


Figure 8.
(a) Spatial distribution of multi-year average precipitation in the upper reaches of the Yangtze River from 1956 to 2020. (b) Spatial distribution of multi-year average potential evaporation in the upper reaches of the Yangtze River from 1956 to 2020.
Figure 8.
(a) Spatial distribution of multi-year average precipitation in the upper reaches of the Yangtze River from 1956 to 2020. (b) Spatial distribution of multi-year average potential evaporation in the upper reaches of the Yangtze River from 1956 to 2020.

Figure 9.
Evolution of multi-year average potential evapotranspiration and precipitation in the upper Yangtze River from 1956 to 2020.
Figure 9.
Evolution of multi-year average potential evapotranspiration and precipitation in the upper Yangtze River from 1956 to 2020.

Figure 10.
Schematic diagrams of reservoir construction in the upper reaches of the Yangtze River.

Figure 11.
Structure of land use types in the upper Yangtze River from 1980 to 2018.

Figure 12.
Transfer matrix of land use types in the upper Yangtze River from 1980 to 2018.

Figure 13.
Breeding of major fishes in the Yangtze River.


Table 1.
Indexes of IHA.
| IHA Parameter Group | Parametric Index |
|---|---|
| Monthly median (No. 1–12) | Median monthly flow (sediment load) |
| Annual extreme value size (No. 13~23) | Annual 1, 3, 7, 30, 90 d minimum and maximum flow (sediment load), base flow index |
| The occurrence time of annual extreme value status (No. 24~25) | Date of maximum and minimum 1 day of the year (Rome Day) |
| High, low Frequency and duration (No. 26~29) | High and low pulses per year and average pulse duration |
| Change rate and frequency (No. 30–32) | Annual median of increase (rate of increase), decrease (rate of decrease) and number of reversals |
Table 2.
TFPW–MK trend test of runoff and sediment transport at major hydrological stations in the upper reaches of the Yangtze River.
Table 2.
TFPW–MK trend test of runoff and sediment transport at major hydrological stations in the upper reaches of the Yangtze River.
| Hydrological Stations | PS | GC | BB | WL | YC | |
|---|---|---|---|---|---|---|
| Runoff | 0.83 | −1.62 | −0.97 | −1.43 | −1.74 | |
| Test discrimination | ||||||
| Trendiness | Non-significant increase | Non-significant reduction | Non-significant reduction | Non-significant reduction | Non-significant reduction | |
| Sediment | −2.88 | −4.64 | −6.53 | −6.76 | −6.85 | |
| Test discrimination | ||||||
| Trendiness | Significant reduction | Significant reduction | Significant reduction | Significant reduction | Significant reduction | |
Table 3.
The t-test of mean of runoff and sediment.
| Hydrological Stations | Category | Year | Base Year | Mutation Index | Statistical Quantities |
|---|---|---|---|---|---|
| PS | Runoff | 1998 | 42 | 0.10 | 0.36 |
| Sediment delivery volume | 2009 | 44 | 0.79 | 3.67 *** | |
| GC | Runoff | 1993 | 37 | 0.24 | 0.59 |
| Sediment delivery volume | 2007 | 42 | 0.76 | 2.57 ** | |
| BB | Runoff | 1985 | 29 | 0.26 | 0.83 |
| Sediment delivery volume | 1993 | 28 | 0.91 | 4.65 *** | |
| WC | Runoff | 2008 | 52 | 0.13 | 0.31 |
| Sediment delivery volume | 2003 | 38 | 1.16 | 2.71 *** | |
| YC | Runoff | 2002 | 46 | 0.42 | 2.68 ** |
| Sediment delivery volume | 2002 | 37 | 2.58 | 14.41 *** |
Note: **, *** indicates the year of mutation that passed the significance test with 95% and 99% confidence levels, respectively.
Table 4.
TFPW–MK trend test of SI values in the upper reaches of the Yangtze River.
| Hydrological Stations | PS | GC | BB | WL | YC | |
|---|---|---|---|---|---|---|
| SI | −1.09 | −0.10 | −0.09 | −0.52 | −5.78 | |
| Test discrimination | ||||||
| Trendiness | No significant decline | No significant decline | No significant decline | No significant decline | Significant decline | |
Table 5.
Contribution rate of each influencing factor to runoff.
| Hydrological Stations | Stage | ||||||||
|---|---|---|---|---|---|---|---|---|---|
| PS | Ta-Tb | 1.683 | −0.683 | −33.888 | 8.187 | −35.801 | 55.10 | −13.31 | 58.21 |
| Tb-Tc | −31.382 | 10.139 | −39.206 | 51.92 | −16.77 | 64.85 | |||
| GC | Ta-Tb | 1.294 | −0.294 | −32.144 | 6.457 | −31.646 | 56.07 | −11.26 | 55.20 |
| Tb-Tc | −30.906 | 6.189 | −36.451 | 50.53 | −10.12 | 59.59 | |||
| BB | Ta-Tb | 2.181 | −1.181 | −40.964 | 9.186 | −51.019 | 49.48 | −11.09 | 61.62 |
| Tb-Tc | −41.127 | 10.558 | −56.566 | 47.20 | −12.12 | 64.92 | |||
| WL | Ta-Tb | 1.315 | −0.315 | −24.164 | 4.903 | −36.867 | 43.05 | −8.74 | 65.68 |
| Tb-Tc | −23.768 | 5.099 | −99.553 | 20.10 | −4.31 | 84.21 | |||
| YC | Ta-Tb | 1.731 | −0.731 | −29.926 | 7.613 | −24.694 | 63.66 | −16.20 | 52.53 |
| Tb-Tc | −30.960 | 7.889 | −42.582 | 47.16 | −12.02 | 64.86 |
Table 6.
Contribution of sediment characteristic factors to changes in sediment load.
| Hydrological Stations | Stage | Rate of Change in Proportion (%/a) | Contribution Rate (%) | |||||
|---|---|---|---|---|---|---|---|---|
| S | P | r | s | P | r | s | ||
| PS | Ta-Tc | −1.06 | 0.09 | −0.1 | −1.05 | −8.49 | 9.43 | 99.06 |
| Ta-Tb | 0.39 | 0.3 | −0.16 | 0.25 | 76.92 | −41.03 | 64.10 | |
| Tb-Tc | −4.48 | −0.53 | −0.16 | −3.79 | 11.83 | 3.57 | 84.60 | |
| GC | Ta-Tc | −1.76 | 0.05 | −0.11 | −1.7 | −2.85 | 6.25 | 96.60 |
| Ta-Tb | −1.27 | −0.09 | −0.13 | −1.05 | 7.10 | 10.24 | 82.66 | |
| Tb-Tc | −1.19 | 0.39 | 0.07 | −1.65 | −32.77 | −5.88 | 138.65 | |
| BB | Ta-Tc | −4.08 | 0.07 | −0.09 | −4.06 | −1.72 | 2.21 | 99.51 |
| Ta-Tb | −4.14 | −0.14 | −0.59 | −3.42 | 3.37 | 14.22 | 82.41 | |
| Tb-Tc | −4.15 | 0.18 | 0.27 | −4.59 | −4.35 | −6.52 | 110.87 | |
| WL | Ta-Tc | −3.73 | 0.05 | −0.25 | −3.53 | −1.34 | 6.70 | 94.64 |
| Ta-Tb | −2.27 | −0.04 | 0.12 | −2.35 | 1.76 | −5.29 | 103.52 | |
| Tb-Tc | −8.25 | 0.05 | −0.82 | −7.48 | −0.61 | 9.94 | 90.67 | |
| YC | Ta-Tc | −3.61 | 0.05 | −0.13 | −3.53 | −1.39 | 3.60 | 97.79 |
| Ta-Tb | −1.1 | −0.09 | 0.11 | −1.12 | 8.18 | −10 | 101.82 | |
| Tb-Tc | −13.22 | 0.14 | −0.02 | −13.34 | −1.06 | 0.15 | 100.91 | |
Disclaimer/Publisher’s Note: The statements, opinions and data contained in all publications are solely those of the individual author(s) and contributor(s) and not of MDPI and/or the editor(s). MDPI and/or the editor(s) disclaim responsibility for any injury to people or property resulting from any ideas, methods, instructions or products referred to in the content. |
© 2023 by the authors. Licensee MDPI, Basel, Switzerland. This article is an open access article distributed under the terms and conditions of the Creative Commons Attribution (CC BY) license (https://creativecommons.org/licenses/by/4.0/).
Share and Cite
MDPI and ACS Style
Wang, H.; Ma, Y.; Hong, F.; Yang, H.; Huang, L.; Jiao, X.; Guo, W. Evolution of Water–Sediment Situation and Attribution Analysis in the Upper Yangtze River, China. Water 2023, 15, 574. https://doi.org/10.3390/w15030574
AMA Style
Wang H, Ma Y, Hong F, Yang H, Huang L, Jiao X, Guo W. Evolution of Water–Sediment Situation and Attribution Analysis in the Upper Yangtze River, China. Water. 2023; 15(3):574. https://doi.org/10.3390/w15030574
Chicago/Turabian StyleWang, Hongxiang, Yinchu Ma, Fengtian Hong, Huan Yang, Lintong Huang, Xuyang Jiao, and Wenxian Guo. 2023. "Evolution of Water–Sediment Situation and Attribution Analysis in the Upper Yangtze River, China" Water 15, no. 3: 574. https://doi.org/10.3390/w15030574
Note that from the first issue of 2016, this journal uses article numbers instead of page numbers. See further details here.