
Transformer Based Water Level Prediction in Poyang Lake, China


1
School of Environmental Engineering, Nanjing Institute of Technology, Nanjing 211167, China
2
Key Laboratory of Watershed Geographic Sciences, Nanjing Institute of Geography and Limnology, Chinese Academy of Sciences, Nanjing 210008, China
3
College of Computer Science and Technology, Nanjing University of Aeronautics and Astronautics, Nanjing 211106, China
4
Department of Environmental Engineering, Jeonbuk National University, Jeonju 561-756, Republic of Korea
*
Author to whom correspondence should be addressed.
Water 2023, 15(3), 576; https://doi.org/10.3390/w15030576
Submission received: 27 November 2022
/
Revised: 9 January 2023
/
Accepted: 28 January 2023
/
Published: 1 February 2023
(This article belongs to the Section Hydrology)
Abstract
:Water level is an important indicator of lake hydrology characteristics, and its fluctuation significantly affects lake ecosystems. In recent years, deep learning models have shown their superiority in the long-time range prediction of hydrology processes, while the application of deep learning models with the attention mechanism for lake water level prediction is very rare. In this paper, taking Poyang Lake as a case study, the transformer neural network model is applied to examine the model performance in lake water level prediction, to explore the effects of the Yangtze River on lake water level fluctuations, and to analyze the influence of hyper-parameters (window size and model layers) and lead time on the model accuracy. The result indicated that the transformer model performs well in simulating the lake water level variations and can reflect the temporal water level variation characteristics in Poyang Lake. In the testing stage, the RMSE values were recorded in the range of 0.26–0.70 m, and the NSE values are higher than 0.94. Moreover, the Yangtze River inflow has a great influence on the lake water level fluctuation of Poyang Lake, especially in flood and receding periods. The contribution rate of the Yangtze River in RMSE and NSE is higher than 80% and 270%, respectively. Additionally, hyper-parameters, such as window size and model layers, significantly influence the transformer model simulation accuracy. In this study, a window size of 90 d and a model layer of 6 are the most suitable hyper-parameters for water level prediction in Poyang Lake. Additionally, lead time may affect the model accuracy in lake water level prediction. With the lead time varied from one to seven days, the model accuracy was high and RMSE values were in the range of 0.46–0.73 m, while the RMSE value increased to 1.37 m and 1.82 m with the lead time of 15 and 30 days, respectively. The transformer neural network model constructed in this paper was the first to be applied to lake water forecasting and showed high efficiency in Poyang Lake. However, few studies have tried to use transformer model coupling with the attention mechanism for forecasting hydrological processes. It is suggested that the model can be used for long sequence time-series forecasting in hydrological processes in other lakes to test its performance, providing further scientific evidence for the control of lake floods and management of lake resources.
1. Introduction
Lakes are important surface waters and play a key role in regulating water supply, supporting ecosystem biodiversity, and promoting economic development [1]. Water level is an important indicator of lake hydrology characteristics and its fluctuation significantly affects lake ecosystems [2,3,4]. Moreover, in recent decades, with the impact of climate change and anthropogenic activities, large water level fluctuations show high non-linearity and complexity, making it hard to forecast daily water level fluctuation. Consequently, the search for an effective lake water level simulation method has become an important and urgent task for the current research. Poyang Lake is the first largest freshwater lake in China, and it is one of the most typical fluvial lakes in the middle and lower reaches of the Yangtze River. It plays an very important role in freshwater resource supply and flood control [5]. As a typical seasonal throughput lake, Poyang Lake mainly receives seasonal inflows from the “five rivers” and water from the Yangtze River, and the annual water level varies drastically [6]. In recent decades, with the increased impact of climate change and human activities, the hydrological interactions between Poyang Lake and the inflowing rivers have been changed [7]. The lake water regimen has undergone drastic changes and is frequently plagued by flooding and water depletion problems [8,9,10,11,12], which brings great challenges to the production water supply, residents’ lives, and the heath of ecosystem in the lake area [5,13,14]. Therefore, to find an effective modeling method for the Poyang Lake water level is of great importance.
The water-level of lakes is influenced by many factors, including hydrological variables as well as meteorological and geological conditions, and forecasting water level fluctuation in lake systems remains a tough task due to its non-linearity and complexity. In the past several decades, many types of models have been developed and applied to forecast water levels in lake systems. The related works are summarized in this study and are mainly from the Journal of Hydrology, Journal of Hydrologic Engineering, Journal of Resource management, and Journal of Lake Sciences in the period of 2000–2022. One typical type is the hydrodynamic model. This kind of model can simulate the process accurately, while it requires perfect basic information, and complicated calculations, and is time consuming, and it is still a challenge to achieve the efficient prediction of the water level [15,16,17]. In recent decades, with the development of artificial intelligence, data-driven adaptive models were developed and have been widely applied on lake water level simulations. Based on the machine learning method, the data-driven adaptive models run without a priori assumptions, can better simulate and predict the complex nonlinear relationships, and have been applied in forecasting of lake water levels [18,19,20,21,22,23,24,25]. The machine learning models related to forecasting lake water levels are summarized in the study of Zhu [26]. In recent years, one type of machine learning methods based on artificial neural networks, named deep learning methods, have been developed rapidly and gradually applied on water level prediction. Generally, deep learning networks can be divided into several folds according to the architectures and functions, such as feed-forward neural networks (FNNs), convolutional neural networks (CNNs), recurrent neural networks (RNNs), and graph neural network (GNNs), as well as some special constructed structures such as ResNet [27], long short-term memory model (LSTM) [28], and transformer [29]. Among these deep learning models, the LSTM is one typical type and has been recently applied on lake water level forecasting, achieving a number of good results. For example, Liang [30] developed the LSTM model to predict the water level variations in the Dongting Lake, and reported that the LSTM model performed better than the support vector machine (SVM) method. In the Vrana Lake, Hrnjica and Bonacci [31] applied the feed forward neural network (FFNN) models and the LSTM model for forecasting the lake water level, finding that the LSTM and FFNN models performed better than exponential smoothing, nonlinear regression, and autoregressive integrated methods. Zhu [26] applied FFNN and LSTM on water level simulations in 69 lakes in Poland, finding that these two models performed similarly in most of the lakes. The LSTM models have also been applied in Poyang Lake for water level prediction, and the results show that LSTM can better predict the spatial and temporal water level variation characteristics compared with the traditional hydrological models [32]. Another deep learning method, named transformer model, proposed by Google in the field of machine translation, is now a crucial backbone framework for many artificial intelligence models [29]. Compared with the recurrent neural networks such as LSTM, the transformer model breaks the recurrent dependency among the hidden variables during the sequence modeling procedure by proposing a new mechanism-self-attention modeling, which can be trained more efficiently in a parallel computing manner. Additionally, the proposed self-attention module can capture the interaction features of two arbitrary positions in the time series process, which is more flexible than LSTM model. More importantly, compared with LSTM, the transformer model has longer memory and can receive attention in simulating long time series problems. The deep learning model coupling with the attention mechanism has been applied in several tasks, such as machine translation [29], long sequence time-series forecasting [33], and image classification tasks [34]. However, the application of deep learning model coupling with the attention mechanism to the study of hydrology is very rare. Based on the transformer model, Yin [35] developed a novel rainfall-runoff model and found the model has a more flexible architecture and outperformed two LSTM-based models for runoff predictions. To our knowledge, no study has employed the transformer model for lake water level forecasting.
Previous study indicated that the deep learning model may show superiority than that of traditional machine learning models [26]. Meanwhile, the superiority of the transformer model with self-attention mechanism applied to lake water level simulation compared with the other deep learning models such as LSTM remains inconclusive. Besides, the effects of hyper-parameters, such as model layers and window sizes, on the lake water level simulation accuracy are not clear for the transformer model. Moreover, the analysis on lake water level forecasting with different lead time (e.g., one day, two days, three days, four days, five days, six days, seven days, 15 days, and a month) are relatively limited, though these scales of lake water level forecasting are very important for flood prediction and water resources management. Additionally, previous studies showed the Yangtze River plays an important role in water level fluctuation in Poyang Lake, while the effects of the Yangtze River in different lake water level stages were seldom discussed [36].
In this regard, this paper selects Poyang Lake as the research object, adopts the transformer neural network method to establish the prediction model of daily scale of water level of Poyang Lake, and explores its potential to predict the water level change process of Poyang Lake. We compare the simulation results of transformer model with other deep learning networks such as LSTM, and distinguish the influences of inflows from the “five river” and Yangtze River discharges on the lake water variations. We present an analysis the effects of hyper-parameters and forecasting lead time on model accuracy. The contribution points of this study are as follows: (1) This is the first study to apply deep learning model coupling with the self-attention mechanism on lake water level prediction. (2) We examine the influence of hyper-parameters and forecasting lead time on the model accuracy, and the effects of different window size, model layers, as well as different lead time are analyzed in this study. (3) We quantitatively distinguished the influence of the Yangtze River on lake water level fluctuations in different water level stages. (4) The analysis of RMSE, R2 and NSE values showed high model accuracy of the transformer model in lake water level prediction, and the model may be applied in other lakes in the future. The study may benefit the application of deep learning models to lake water level prediction and other hydrological time series modelling and provide support for water resources management in Poyang Lake and other lakes.
The rest of this paper is organized as follows. Section 2 describes the Poyang Lake and the research data used for lake water level simulation, the transformer model and LSTM model architectures used in this study, the training and testing process, and model performance evaluation. Section 3 introduces the modeling results and the discussion. Section 4 presents the primary conclusions.
2. Materials and Methods
2.1. Study Area
Poyang Lake is located at 115°47′–116°45′ E and 28°22′–29°45′ N in the northern part of Poyang Lake basin and in the south bank of the middle and lower reaches of Yangtze River (Figure 1). It is the largest freshwater lake in China and has an internationally important wetland system. Affected by subtropical monsoon climate, it has an average annual precipitation of 1666 mm and a mean annual temperature of 17.6 °C [37]. The inflows of Poyang Lake are primarily from five major rivers, named Ganjiang, Fuhe, Xinjiang, Raohe, and Xiushui Rivers (Figure 1). Additionally, the inflows are also from the Yangtze River and seasonal precipitations. The seasonal precipitation results in considerable interannual water level variations, which are from 8 to 18 m. Consistently, the lake surface area size fluctuates highly from less than 1000 km2 during the dry season to around 3000 km2 in the wet season [38]. The lake bottom elevation increases from north to south, and there are five hydrological gauging stations: Hukou, Xingzi, Duchang, Tangyin, and Kangshan stations.
2.2. Research Data
The daily average values of meteorological data of national meteorological stations from 1960 to 2013 in Poyang Lake catchment are selected as the model input meteorological data, including temperature, precipitation, solar radiation, relative humidity, and wind speed (Table 1). Daily discharge observations of Ganjiang River, Fuhe River, Xinjiang River, Raohe River, and Xiushui River are selected as model input data for the period of 1960–2013. The water level observations at Hukou station were selected as model input data to reflect the effects of the Yangtze River on Poyang Lake water levels. Daily water level observations of four gauging stations of Xingzi, Duchang, Tangyin, and Kangshan were selected to represent different responses of the lake and are simulated and analyzed for the period of 1960–2013 (Table 1).
2.3. Transformer-Based Water Level Prediction
2.3.1. Modelling
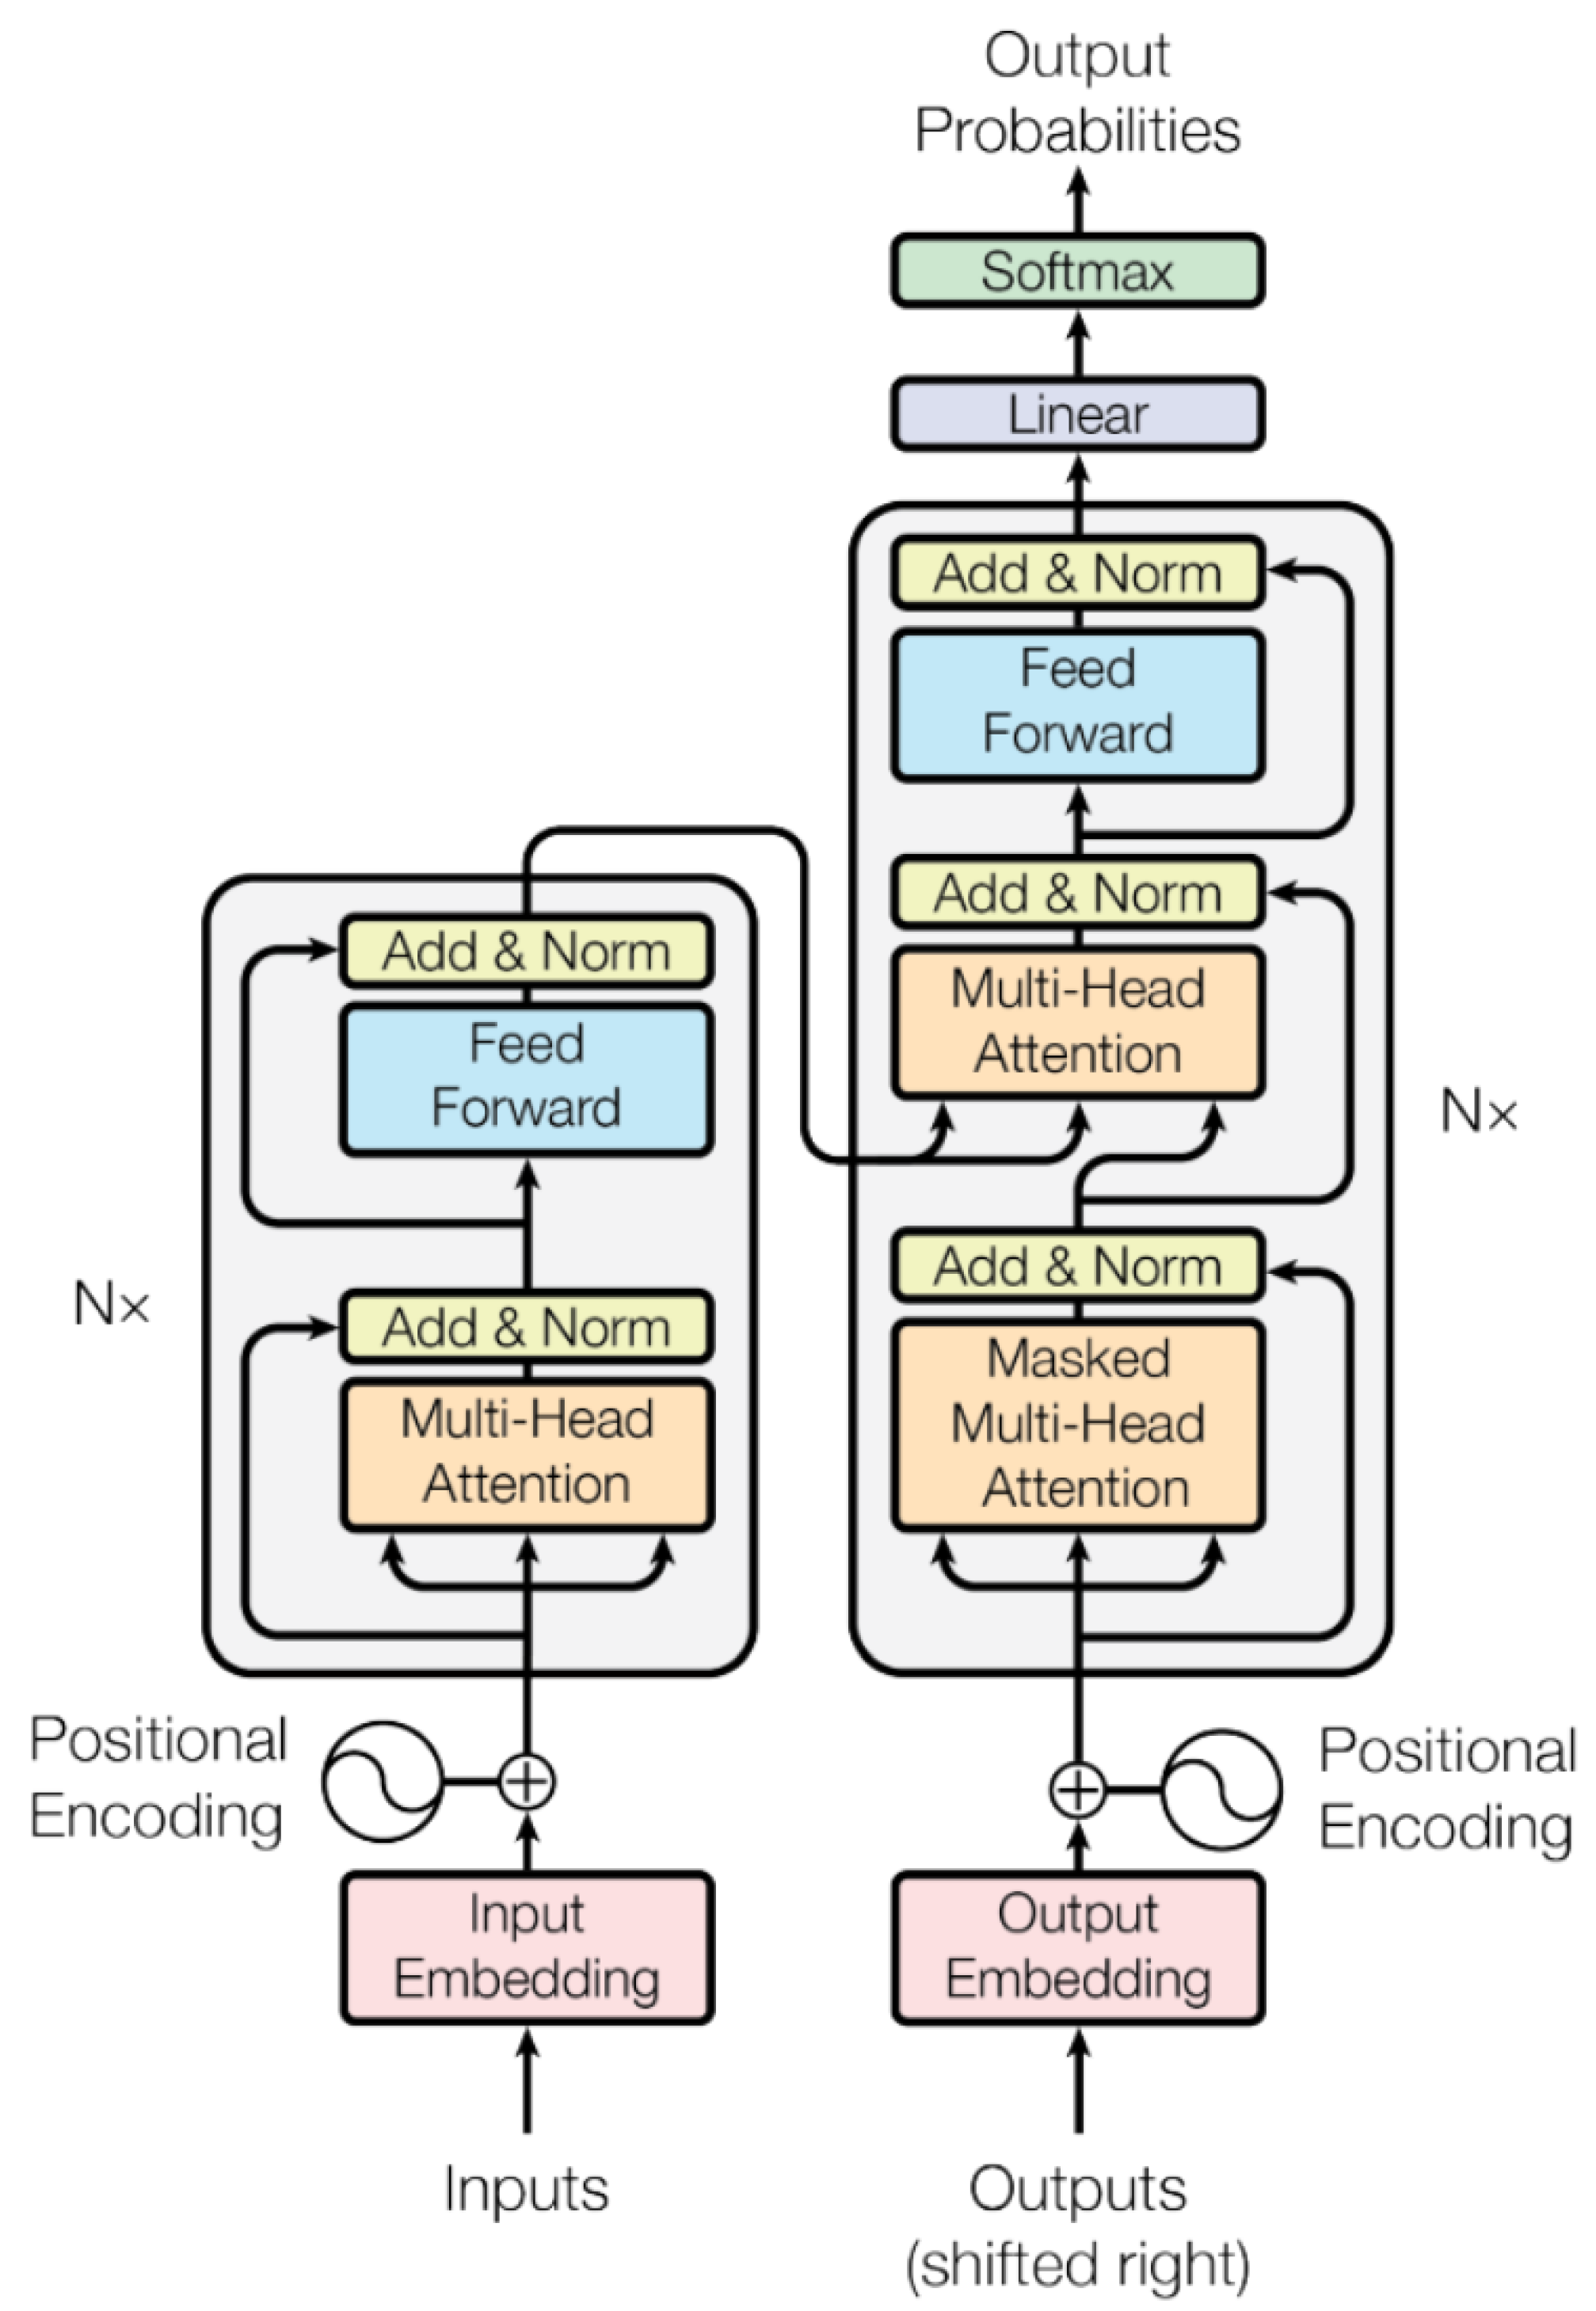
The transformer model is a sequence modeling framework that breaks the recurrent dependency among the hidden variables using the self-attention mechanism to capture the interaction features between variables in the input sequence and obtain the output representations after several stacked transformer layers [29]. The transformer model contains two components: encoder and decoder. The encoder consists of six layers stacked on top of each other, and the internal structure of each layer is shown on the left side of Figure 2. Each transformer layer contains two connected sub-layers, a multi-head self-attention layer and a fully connected feedforward layer. Each sub-layer is connected by residual connections and layer normalization operation. In this paper, we only used the encoder part for sequential data learning.
The multi-head self-attention mechanism is the basic component of the transformer architecture (Figure 2). Self-attention conducts feature representation learning by computing the current state with all the input sequence members, absorbing the relevant information from the bi-directional context by the attention mechanism. More specifically, the self-attention layer differentially key-value searches the input sequence for each time state and adds results to the output sequence. Self-attention is calculated using three matrices Q, K, and V, which represent the query matrix, the key matrix, and the value matrix, respectively. These three matrices are linearly transformed by the input variable X, and the attention calculation can be performed according to the expressions below:
Based on the self-attention mechanism, transformer proposes a multi-head attention mechanism, which splits the input into multiple parts, performs multiple self-attention calculations separately, and after obtaining multiple outputs performs a simple splicing operation on all outputs to obtain the final output:
The multi-headed attention mechanism can capture more fine-grained and multi-aspect features from the input data.
More importantly, to allow the model to take advantage of the order of the time series data, the transformer model adds the position information to the input embeddings for encoder and decoder, respectively. The position information has the same dimension 512 as the input embeddings, so the two can be added directly. The position embedding is represented as follows:
where pos is the position and i is the dimension. Since the position embedding information comes from the sin and cos operation, it can thus capture the relative position information of the input data.
2.3.2. Training and Testing
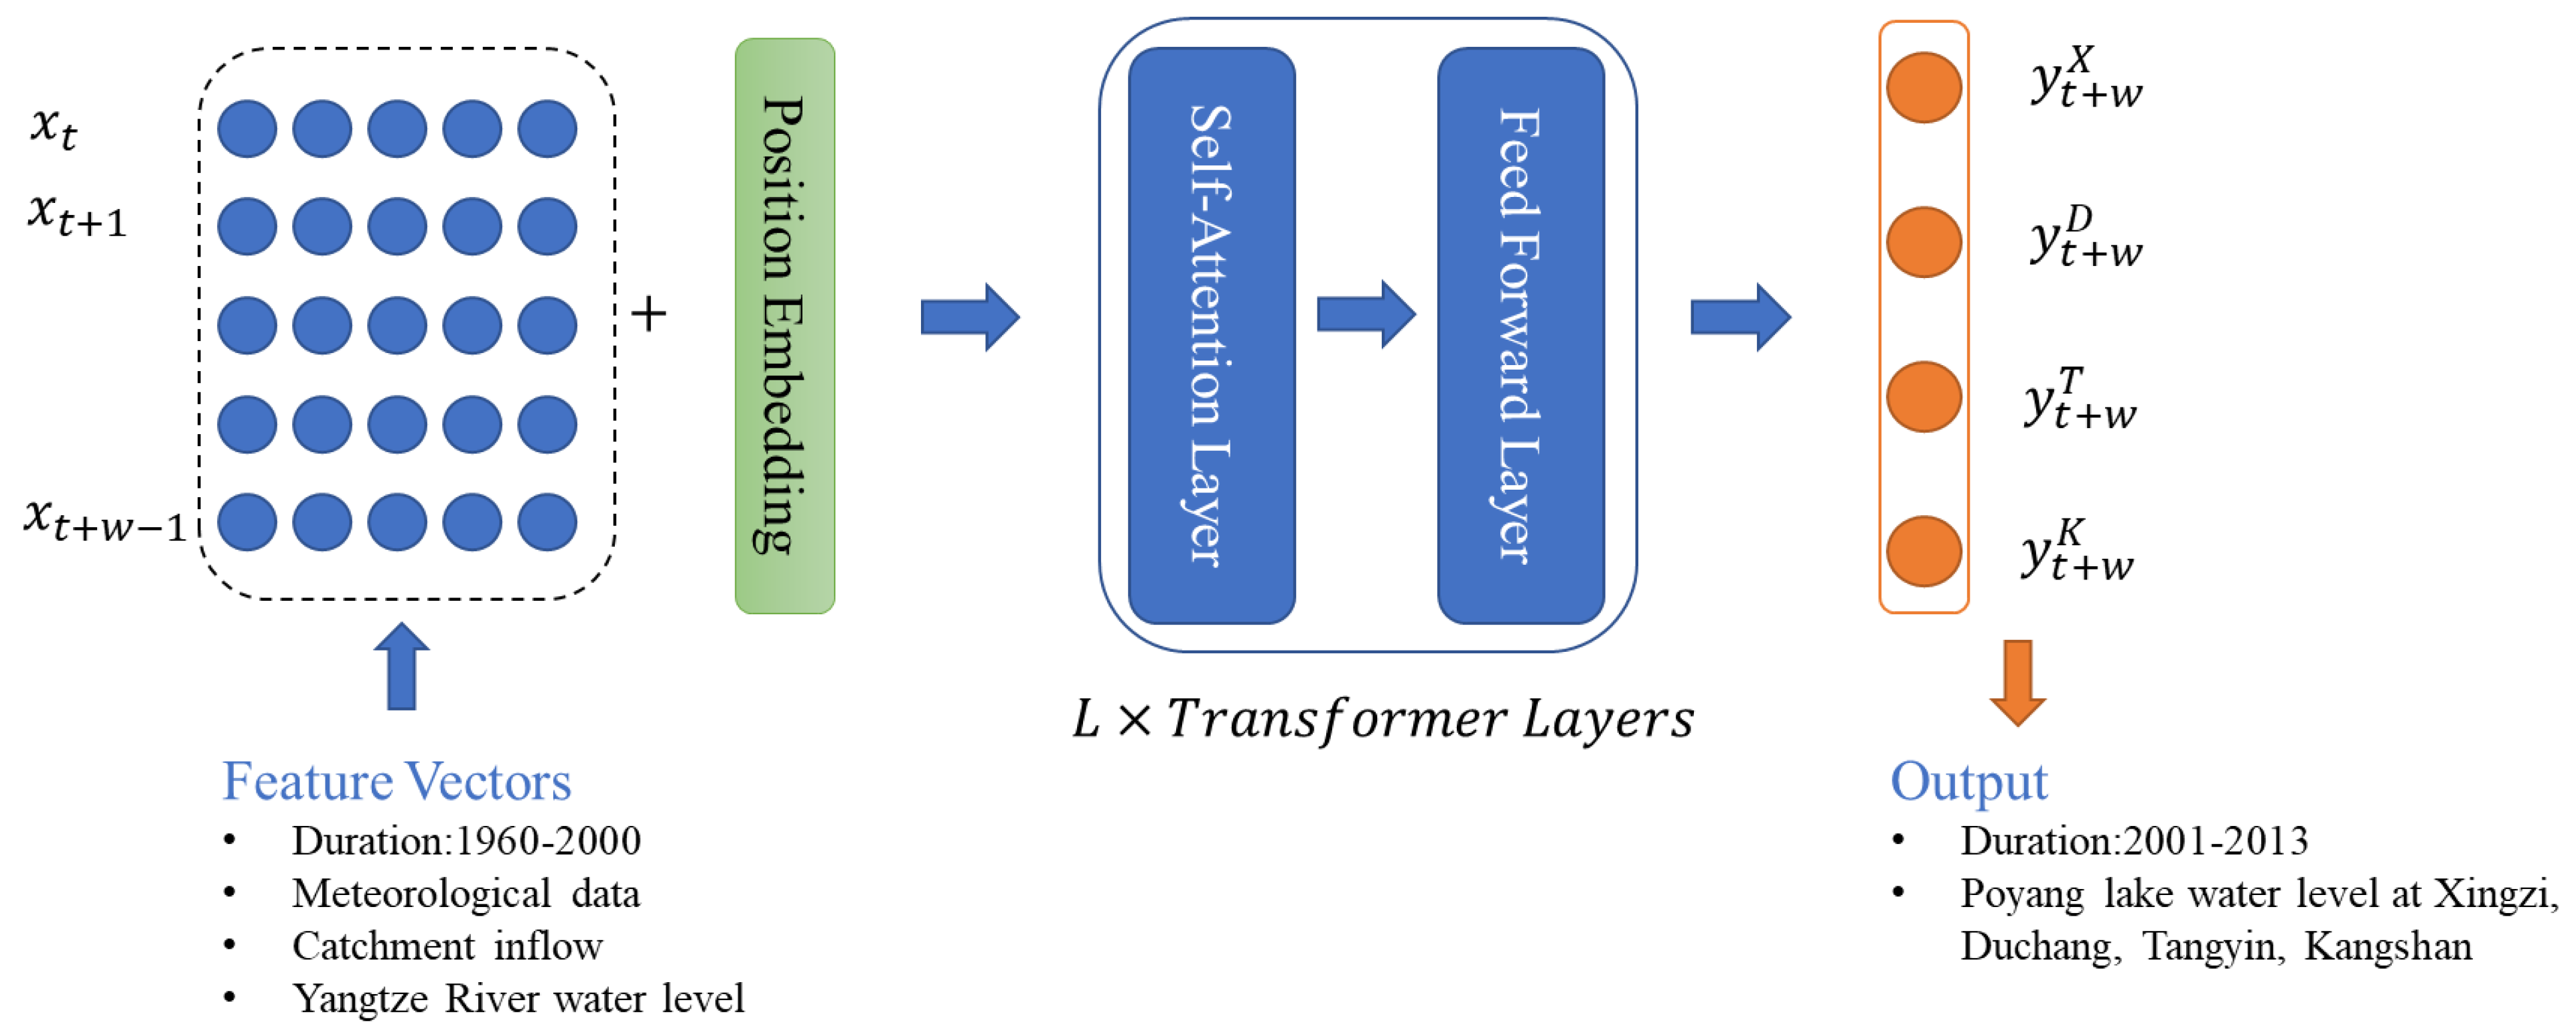
The meteorological elements affect the runoff process and lake water level variation. Therefore, the meteorological elements (precipitation, temperature, relative humidity, solar radiation, and wind speed) act as the input data to train the water level model of the Poyang Lake basin (Figure 3). The lake water level is mainly affected by the catchment discharge and Yangtze River. Consequently, the daily discharge observations of the five rivers (Ganjiang River, Fuhe River, Xinjiang River, Raohe River, and Xiushui River) were selected as input variables. The water level at Hukou station was chosen as model input data to reflect the influences of the Yangtze River in Poyang Lake water levels. The model output data are water levels from the gauging stations of Xingzi station, Duchang station, Tangyin station, and Kangshan station (Figure 3). The model training period is 1960–2000, and the testing period is 2001–2013. The input data for the transformer model were normalized using the function:
In the function,i is the observation value, max and min are the maximum and minimum of the data set, respectively.
Two model scenarios were set in the model to distinguish the influences of catchment “five rivers”and theYangtze River discharges. The model training period is 1960–2000, and the testing period is 2001–2013.
Scenario 1 (S1): Select meteorological elements and catchment river discharges as the input variables to simulate the water levels in four gauging stations at Xingzi station, Duchang station, Tangyin station, and Kangshan station. The effects of the Yangtze River discharge on lake water levels are neglected.
Scenario 2 (S2): Based on scenario 1, the water level observations at Hukou station were incorporated into the input variables, to explore the influence of the Yangtze River on lake water level variations.
The transformer model is essentially a time series prediction model. It inherently requires the previous time series as input variables , where is the daily input feature at day t and is the window size. In our problem settings, the input variables can be the normalized features of meteorological elements, as well as the water level observations at Hukou station according to the scenarios of S1 or S2. The target of the model is the prediction of the next time step water levels of four gauging stations (Xingzi, Duchang, Tangyin, and Kangshan):
Precisely, we first input the sequence data X to the transformer, and then add the positional embeddings to the input features to obtain the first layer input representations :
where the superscript indicates the layer index and the subscript t is the time state. is the positional embeddings obtained by Equations (4) and (5). After obtaining the input representations H0, we then input them into several transformer layers to conduct feature representation learning according to the following formulas:
where SLF-ATT is the self-attention mechanism, LN is layer normalization operation, and FFN denotes the full-connected feed-forward layer. Then, we can obtain the final output representation vectors after L transformer layer calculation, where w is the input sequence length (window size) and d is the vector dimension.
For the water level prediction, we can add one more layer to project the representation vector into the real numbers:
where and .
During the training stage, since water level prediction is a regression problem, we can use RMSE as the loss function:
In the validation and testing stages, the length of the previous time series (window size) is critical to the final simulation of the model. Therefore, in this study, the effect of window sizes on the simulation is analyzed and the optimal window size for the simulation is found. Considering the computational efficiency and simulation time, nine groups of window sizes are set, namely 1, 5, 10, 15, 25, 30, 60, 90, and 180 days. The window size with the best simulation performance is used as the final window size. Moreover, we also conduct some other hyper-parameter tuning, such as the number of layers L, etc.
In order to examine the model performance of long-time range prediction of lake water level, a set of different lead times are designed to predict the lake water level in the future, i.e., 1 day, 2 days, 3 days, 4 days, 5 days, 6 days, 7 days, 15 days, and 30 days.
2.4. LSTM-Based Water Level Prediction
Since the long-short-term-memory model (LSTM) is also a typical method utilized to conduct the time series modeling problem, in this work, we design experiments to conduct the comparisons with LSTM. LSTM is a special recurrent neural network structure designed to address the shortcomings of traditional recurrent neural networks in learning long-term dependency problems. LSTM was first introduced by Hochreiter and Schmidhuber [39], and was recently extended and improved by Graves and Schmidhuber [40]. The LSTM has a deep structure in the temporal dimension, and through designed gates and memory units, the LSTM can decide when to forget state information and how long to keep it. LSTM has been very successful and widely used in many tasks [41,42,43].
Similarly to the transformer model, a LSTM-based model is built to simulate the lake water level variations of Poyang Lake. The input variables and the optimization objective are the same as the transformer-based method.
2.5. Implementation Details
Our transformer-based model is implemented using the PyTorch deep learning framework, which consists of L layers with masked self-attention, and we set L = 6 after experimental comparisons and analysis. The hidden size, number of heads, and feed-forward size are 512, 8, 1024 respectively. We employ Adam as optimizer and the initial learning rate is 1 × 10⁻⁵. The batch size is 32 and we train the model up to 150 epochs. We evaluate the model every one epoch and select the model that performs best on the validation set for producing the final results. All the training and testing operations are conducted on a GeForce RTX 3090 GPU card with 24 G memory.
2.6. Performance Evaluation
The model simulation performance is quantitatively evaluated by the main indexes, such as the coefficient of determination (R2), Nash–Sutcliffe efficiency coefficient (NSE). and the root mean square error (RMSE). The value of R2 is from 0 to 1, and the larger the value, the better the model simulation effect. NSE is a parameter that determines the relative importance of the residual variance compared to the observed variance. It takes a value from negative infinity to 1. The closer to 1, the better the simulation effect and the higher the credibility of the model; close to 0, the simulation result is close to the mean values of the observations, the root mean square error (RMSE), but the process simulation error is large. An RMSE value of 0 indicates that the observed value is in perfect agreement with the predicted value.
The functions for R2, RMSE, and NSE are listed as follows:
In Equations (15)–(17), is the observed value, predicted value, mean of observed value, and mean of predicted value, respectively, and n is the data length.
3. Results and Discussion
3.1. Model Performance at Lake Water Level Simulation
The model simulation performance is shown in Table 2. Scenario 1 (S1) has an R2 of 0.84–0.91 at four hydrological stations in training stage and an R2 of 0.76–0.84 in testing stage. The RMSE is 1.12 m, 1.02 m, 0.96 m, and 0.94 m in training stage and 1.60 m, 1.63 m, 1.66 m, and 1.28 m in testing stage in Xingzi, Duchang, Tanyin, and Kangshan stations, respectively. The NSE of S1 is 0.83–0.91 and 0.69–0.79 in training stage and testing stages, respectively. Scenario 2 (S2) produced a much better simulation at all four stations. R2 values increased from 0.76–0.91 for S1 to 0.97–1.0 for S2, which showed the highest fit between observations and simulations. The RMSE values of S2 are 0.16 m, 0.15 m, 0.14 m, and 0.14 m for four stations in the training stage respectively, and this is much lower than that of S1 (0.94–1.12 m) at the same stage. Similarly, in the testing stage, the RMSE values decreased from 1.28–1.66 m in S1 to 0.26–0.70 m in S2. NSE values of S2 are higher than 0.94 in both training and testing stages at all four stations, and are higher than that of S1. Moriasi [44] showed that NSE values around 0.75 mean the model simulation is effective. Therefore, the simulation accuracy of S2 is high and can reflect the temporal water level variation characteristics in Poyang Lake. The better performance of S2 indicated that the discharge of the Yangtze River has non-negligible effects on the Poyang Lake water level variations. Li [37] found similar results using the back-propagation neural network, and Yu 2022 [45] also found that the Yangtze River plays the most important role in lake water level variations, followed by five rivers inflowing, and lake rainfall effects were the weakest.
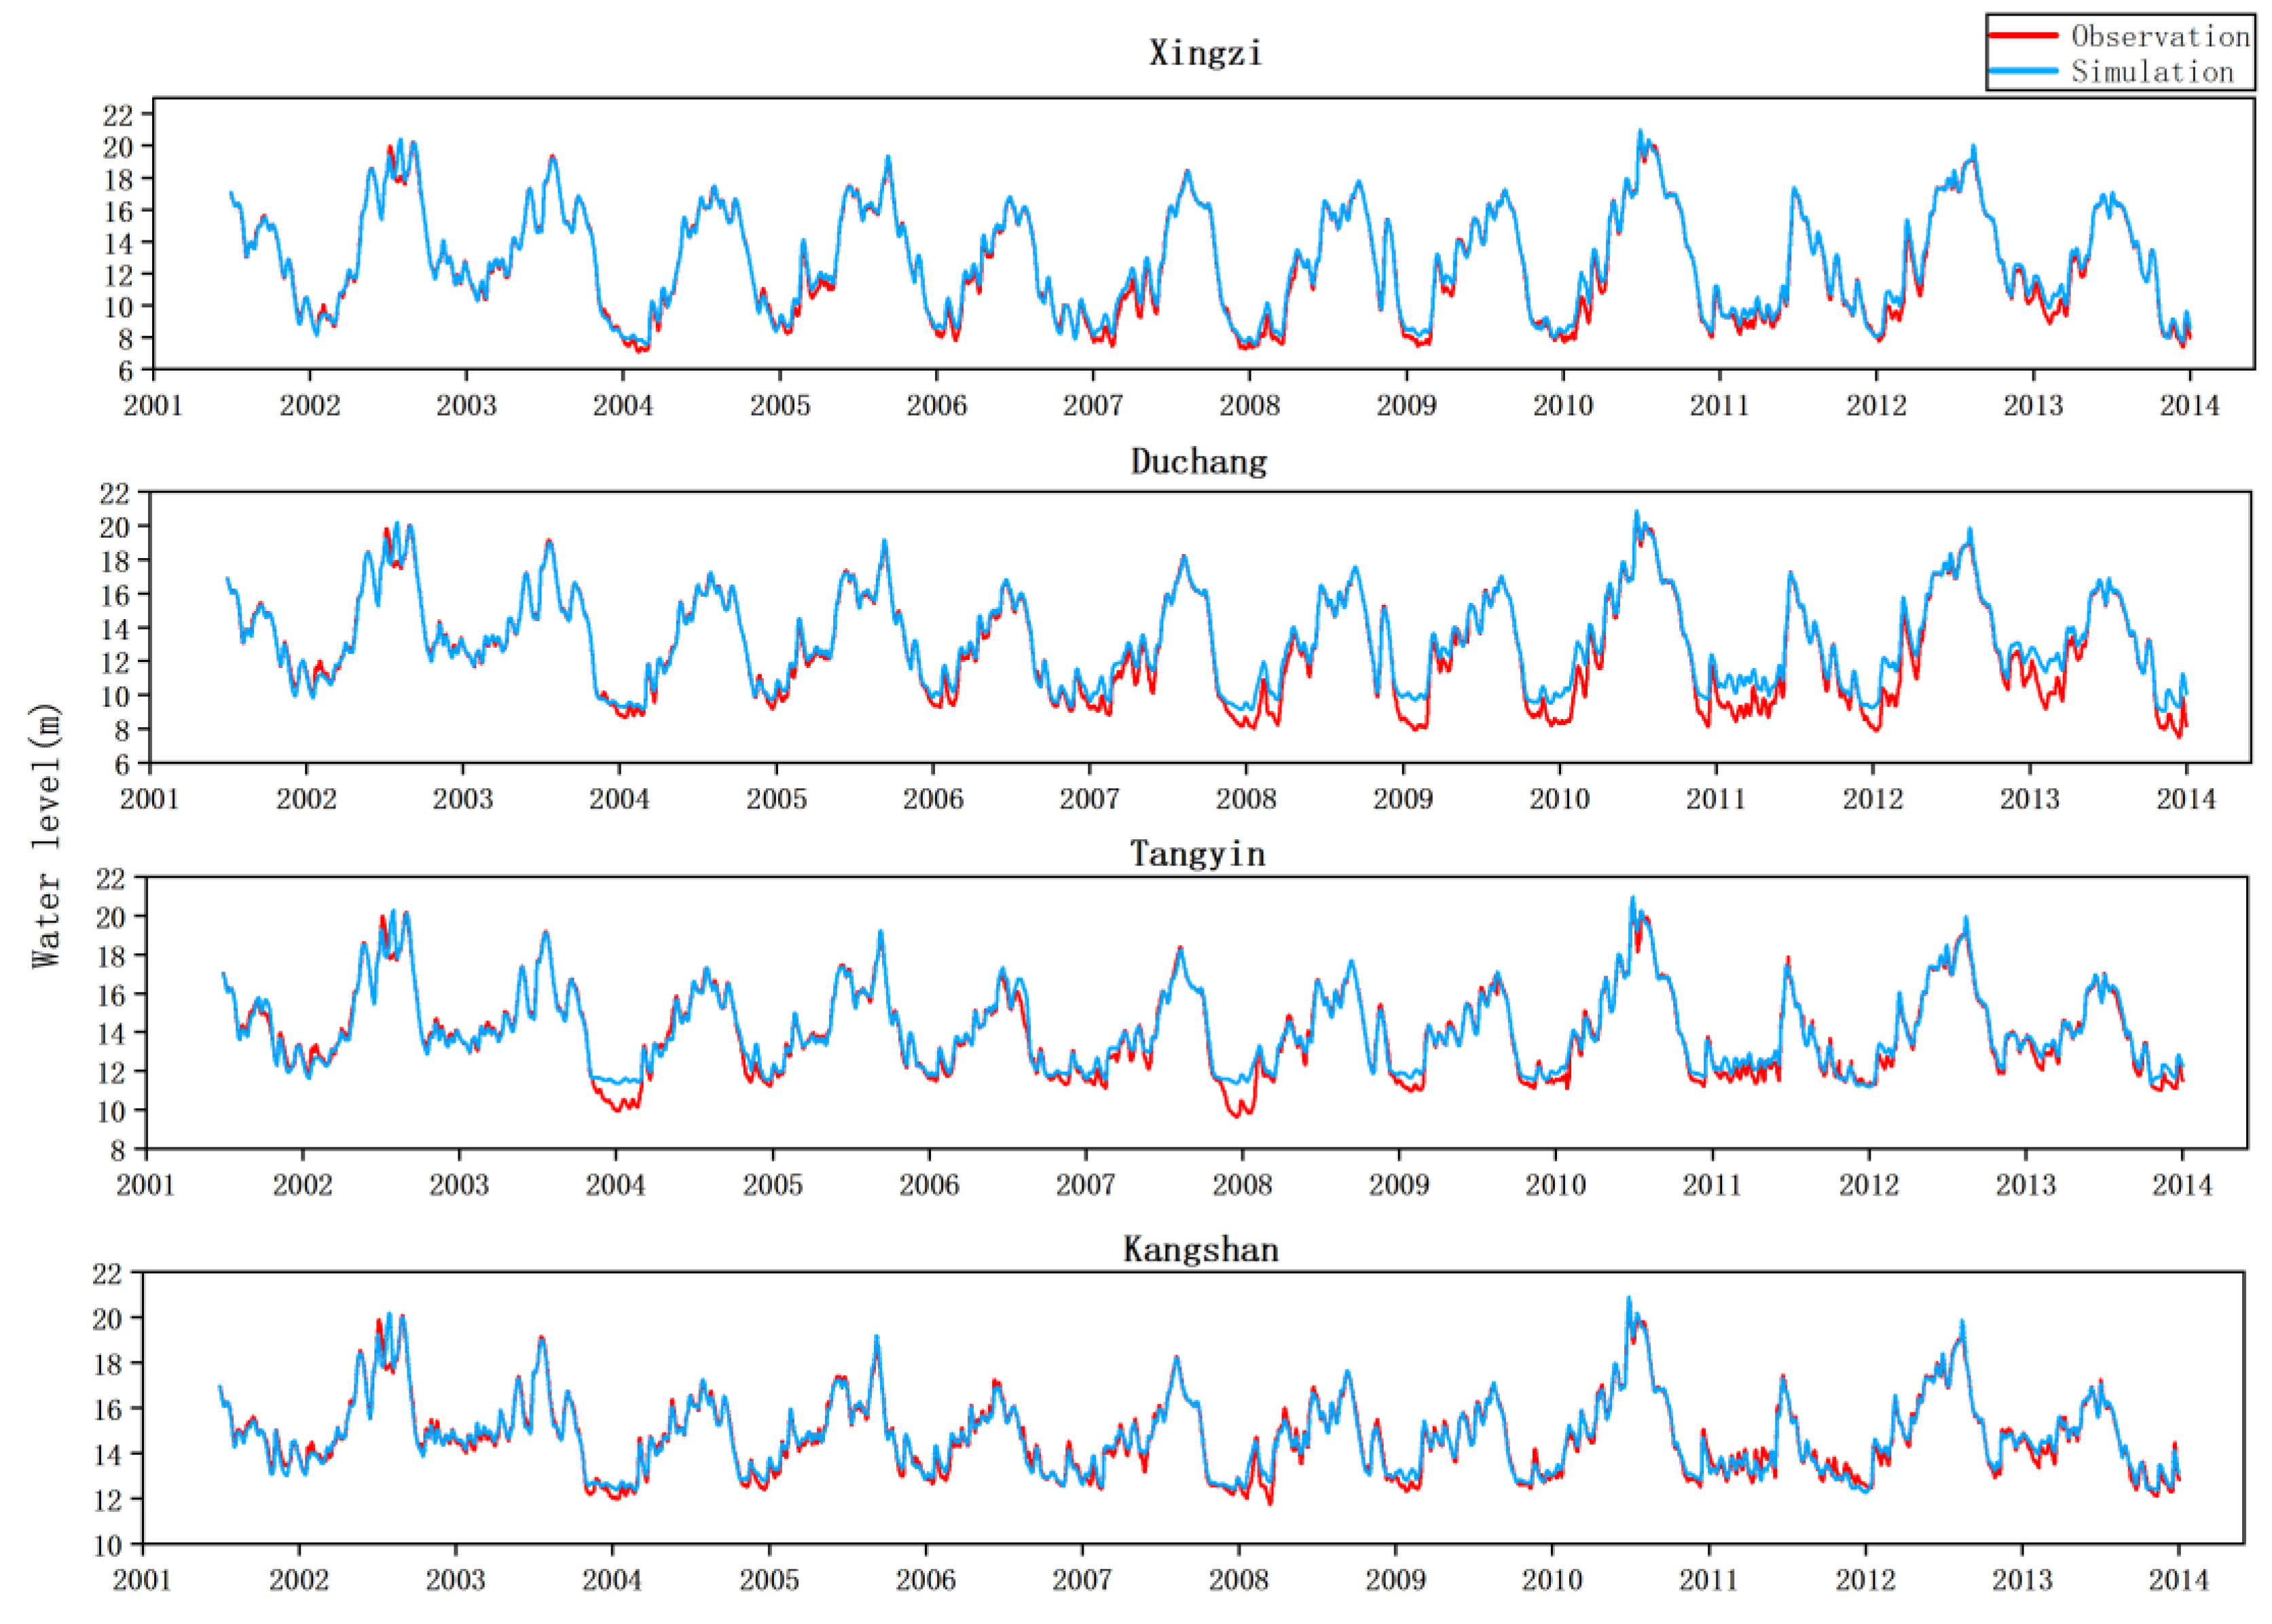
In order to reflect the model performance in the simulation of the water level variation process more intuitively, the simulated values in S2 in testing stage (2021–2013) are compared with the observed values, and the results are shown in Figure 4. It can be seen that the transformer model can simulate the temporal variations of water level well and can learn the interrelationship between the meteorological elements, the five rivers discharge, and the water level variations of Yangtze River, and can capture the water level change process and the extreme value well. Therefore, it can be considered that the constructed model with S2 can simulate the water level variation process of Poyang Lake basin well.
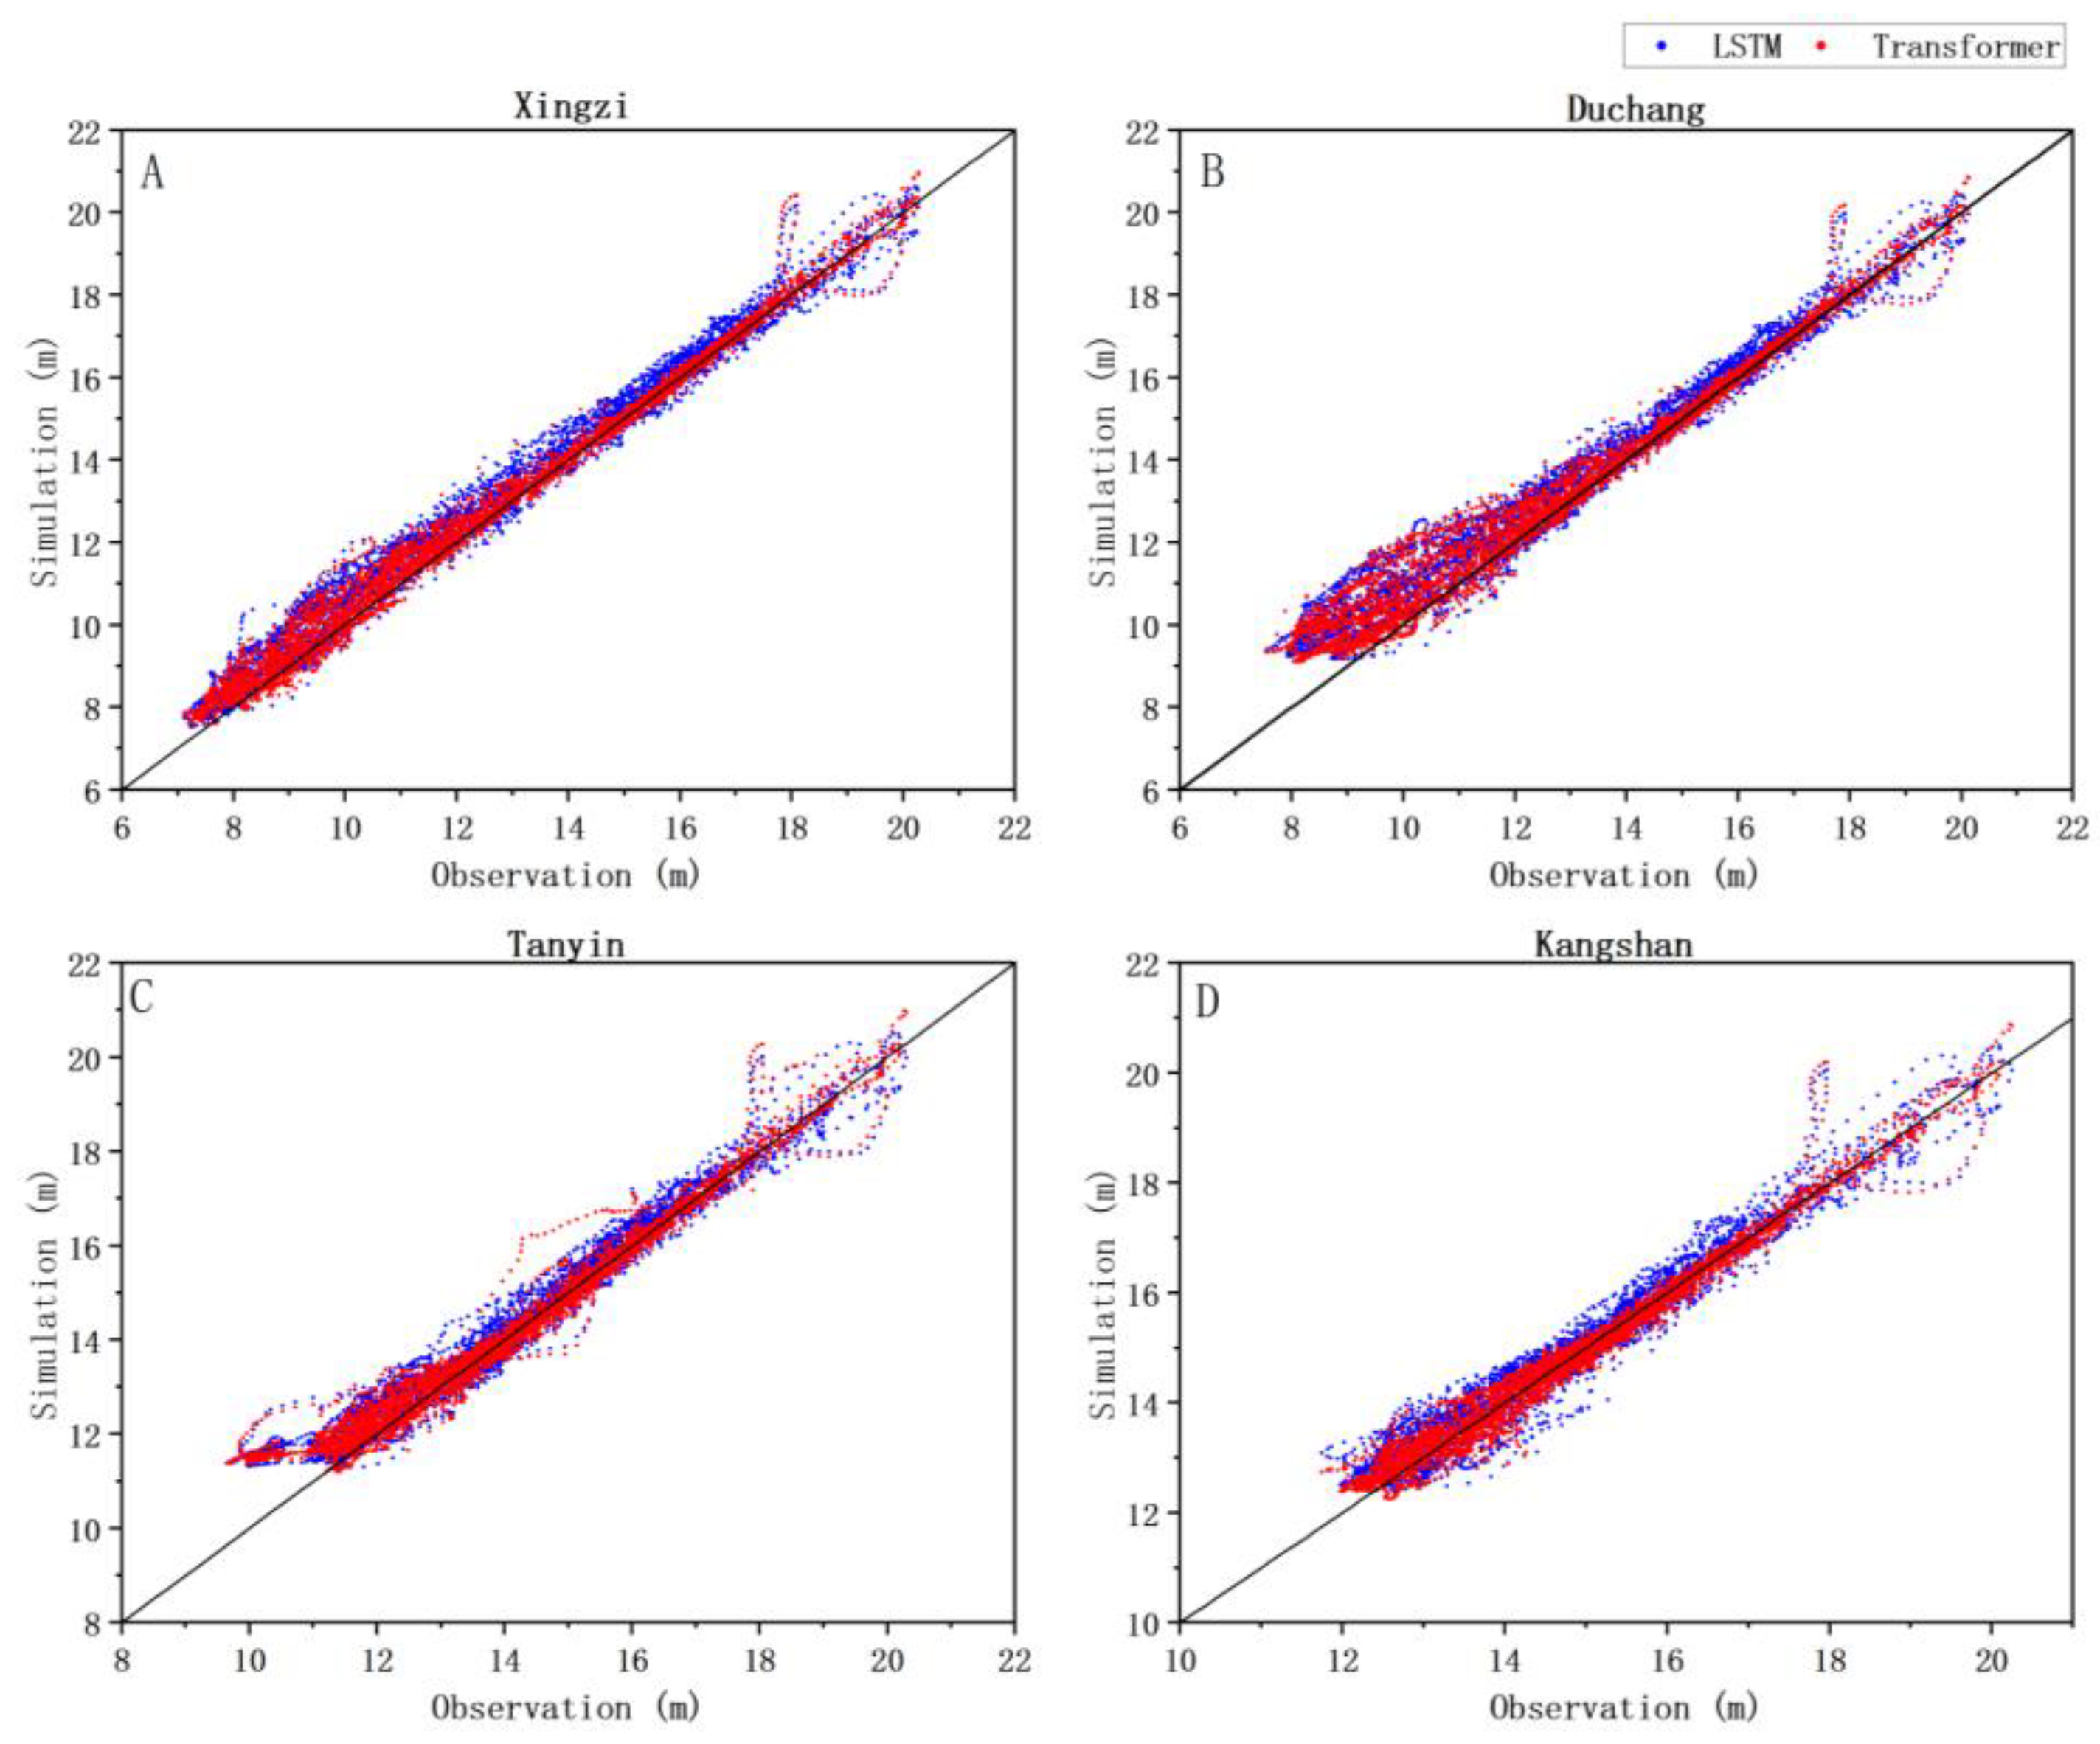
A number of previous studies applied deep learning models for lake water level prediction (Table 3). LSTM is one typical type and has been recently applied on lake water level forecasting. To compare the simulation performance between transformer and LSTM, the LSTM cell was trained recurrently during the training phase (1960–2000) and testing phase (2001–2013), corresponding to that of transformer with S2. A comparison of model performance between the transformer and LSTM models for water level simulations was performed (Table 4). During the training stage, RMSE of the transformer model was lower than 0.16 m, demonstrating the better performance than the LSTM model (higher than 0.76 m). Moreover, the NSE values were lower for the LSTM model than the transformer model. Similarly, during the testing stage, LSTM model had higher RMSE and lower NSE values. Figure 5 presents the match degree of simulation and observation values with these two models in four stations. It can be seen that the blue and red scatters are generally distributed uniformly on both sides of the best fit line, showing that both the LSTM and transformer models have high simulation performance. However, scatters with transformer model are much more concentrated on the best fit line than those with LSTM. The results indicated that the transformer was superior to the LSTM model in lake water level simulations in all four stations in this study and it is necessary to apply the transformer model to water level prediction in other lakes.
3.2. The Contribution of the Yangtze River on Simulation Performance in Different Stages
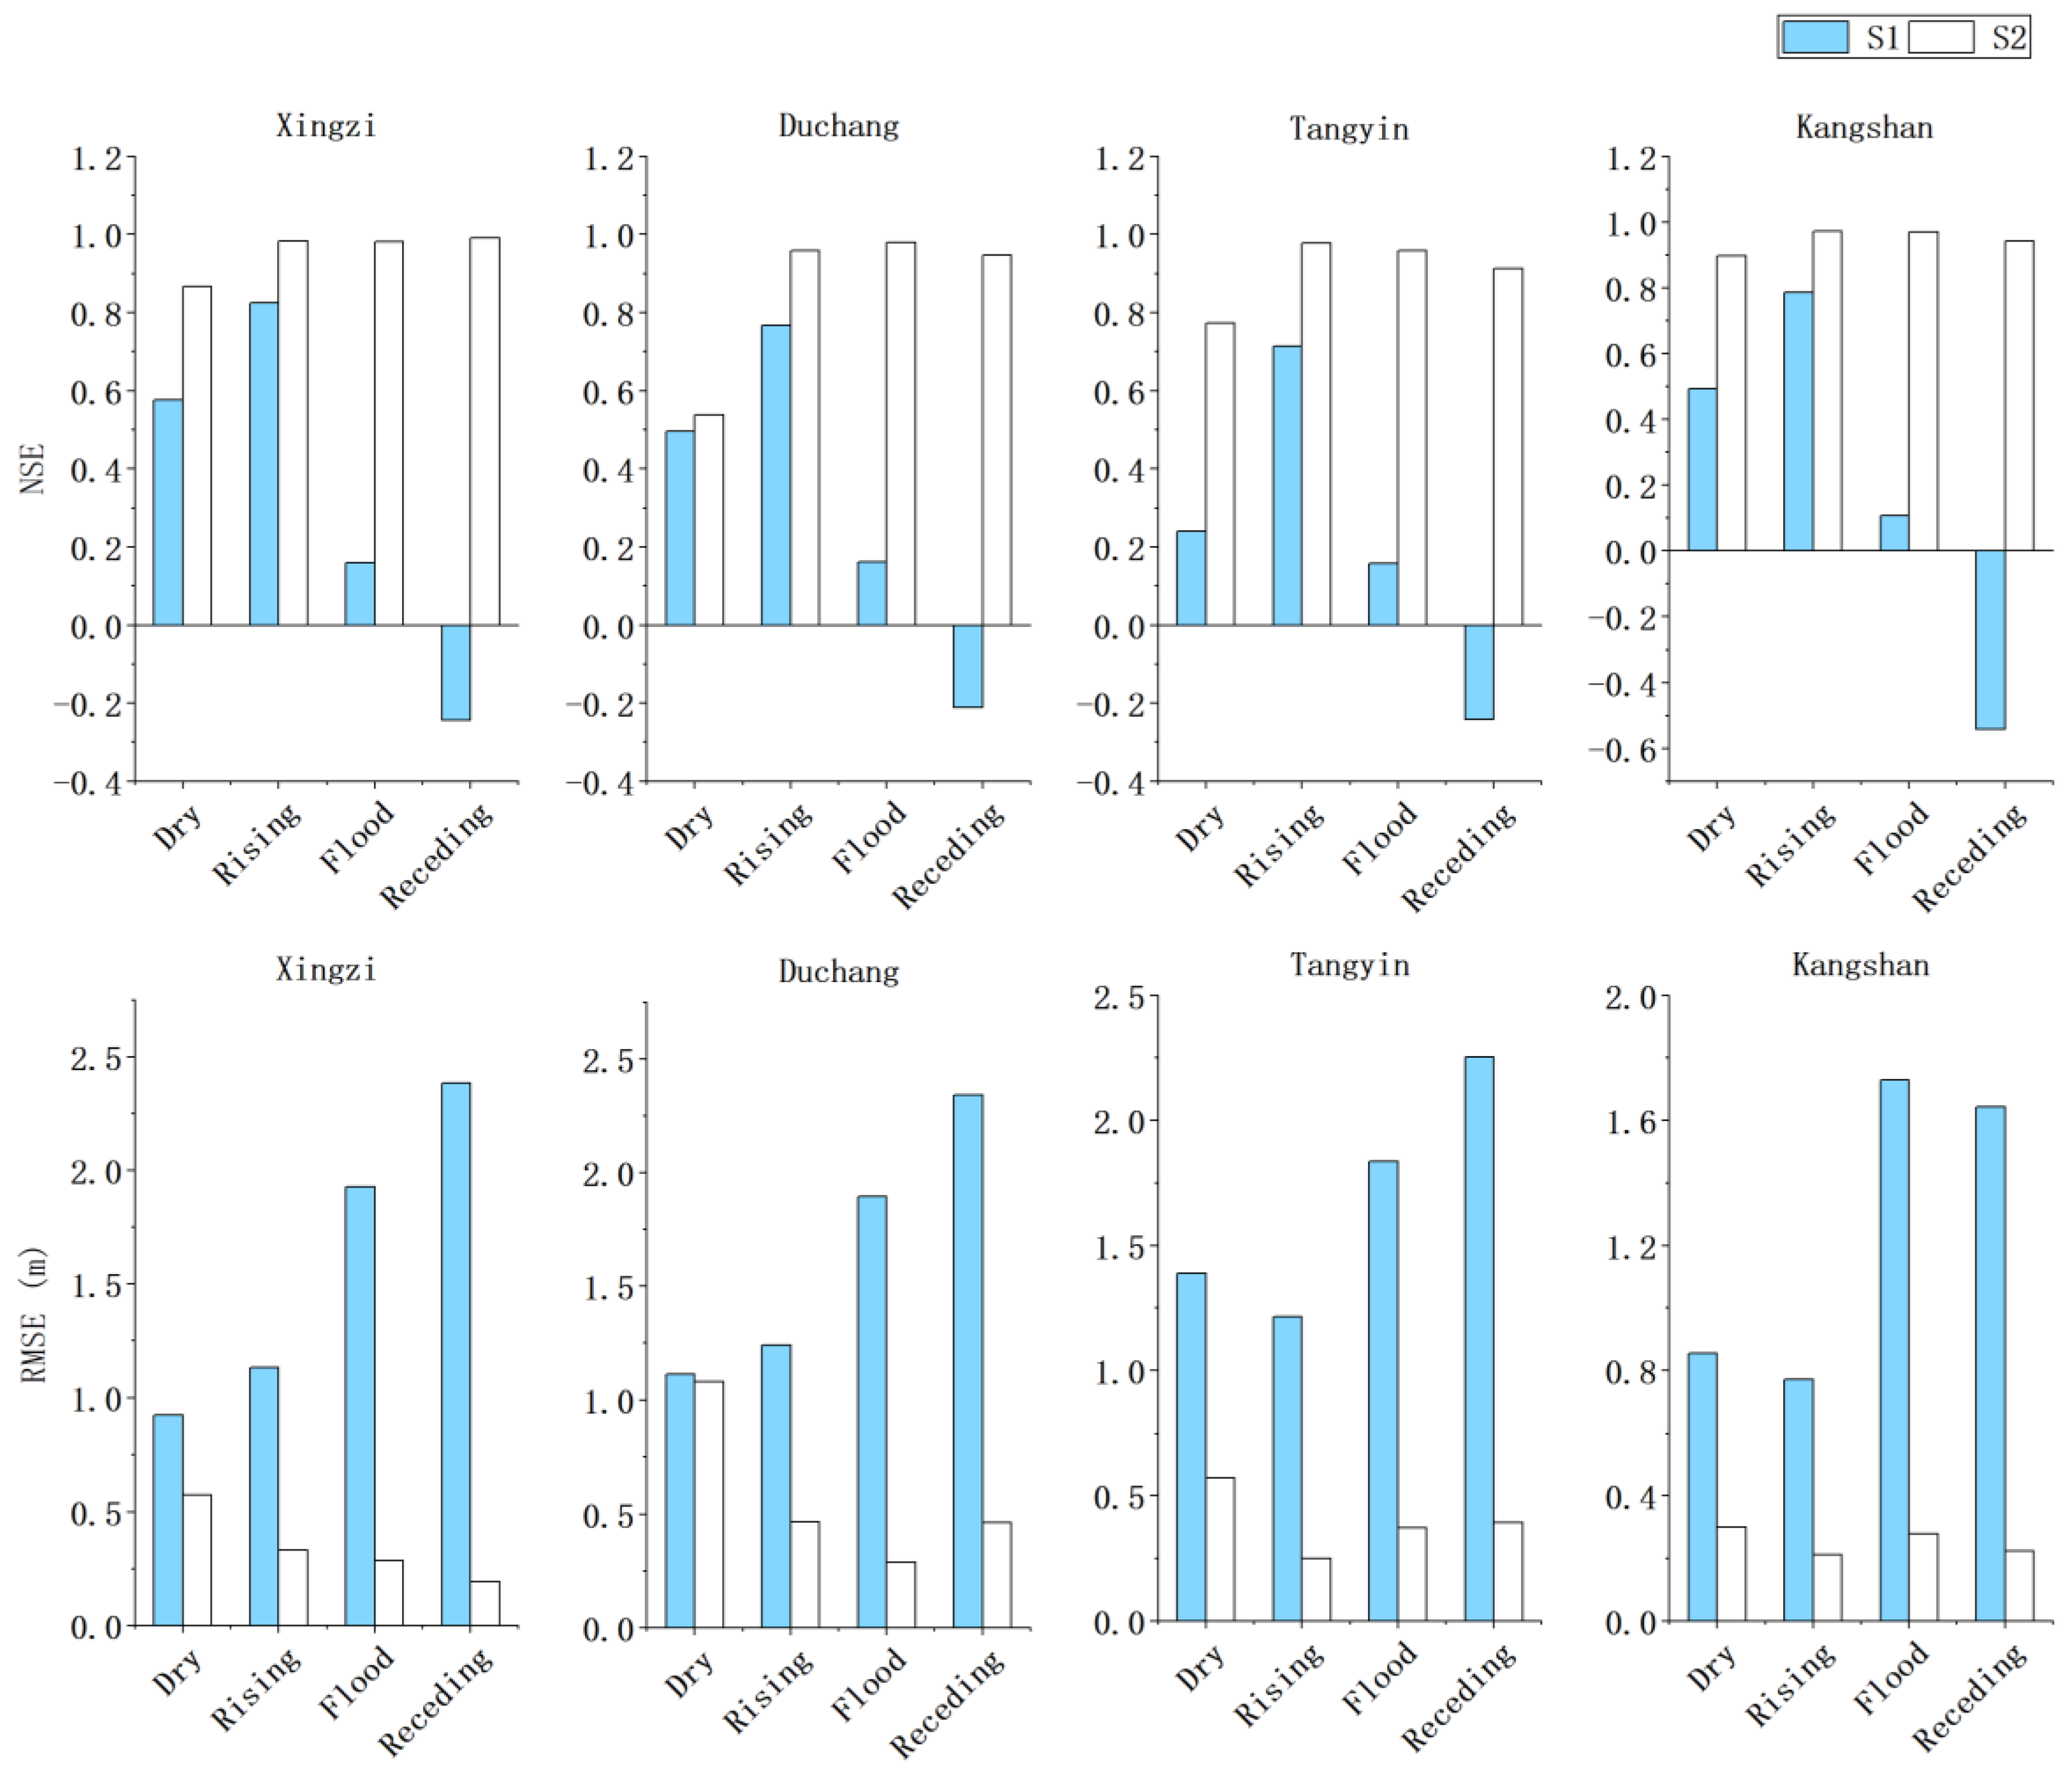
To evaluate the simulation results for water level change in different water periods, we divided the water level periods into four stages: dry period (from December to March), rising period (from April to June), flood period (from July to September), and receding period (from October to November). Moreover, we analyze the simulation performance of S1 and S2 (effects of Yangtze River) using RMSE and NSE values in each period (Figure 6) and compute the contribution rate of S2 compared with S1 in the simulation performance increase (Table 5). Compared with S1, S2 has a significant decrease and increase in RMSE and NSE over all four periods, respectively (Figure 6), which indicated the remarkable influence of the Yangtze River on the lake water level variations, and this results has also been reported by Li [37]. The RMSE contribution rates of S2 were higher in flood and receding periods than in dry and rising periods at all four hydrological stations. For example, the contribution rate varies from 79.7% to 85.2% and from 80.2% to 92.0%, in flood period and receding period, respectively (Table 5). While in dry period and rising period, the contribution rates were in the range of 2.8–65.0% and 62.4–79.3%, respectively. Similarly, NSE contribution rates of S2 were much higher in flood period (506.6–803.1%) and receding period (274.1–550.6%) than in dry period (8.6–223.5%) and rising period (19.1–36.9%). Similar results were found by Yu 2022 [45], who showed that during the wet season, the Yangtze River greatly elevated the lake water level, while the effects decrease during the dry period. During the main flood period of Yangtze River, the high water level of the Yangtze River supports the lake water level to increase [47]. During the receding period, the Yangtze River imposes strong blocking and pulling efforts on the lake outflows and significantly influences water level variations of Poyang Lake [36,48]. Moreover, according to the study of Huang [49], the Three Gorges Dam (TGD) on the Yangtze River also has a remarkable effects on the water level variations of Poyang Lake. From July to August, i.e., the main flood season in the Yangtze River, the TGD weakened the flood peak of Poyang Lake, lowering the water level of Poyang Lake. September to November is mainly the receding period of the Yangtze River, and it is also the impoundment period of the TGD. The TGD significantly decreased the water level of Poyang Lake during this period, especially in October [49]. Consequently, the flooding and receding of the Yangtze River water level, as well as the effects of the TGD, may have remarkable effects on the water level variations of Poyang Lake. The effects from Yangtze River and the TGD should be considered as one of the most important factors in the water level forecasting of Poyang Lake in the future.
3.3. Effects of Window Size, Model Layers, and Lead Time on Model Performance
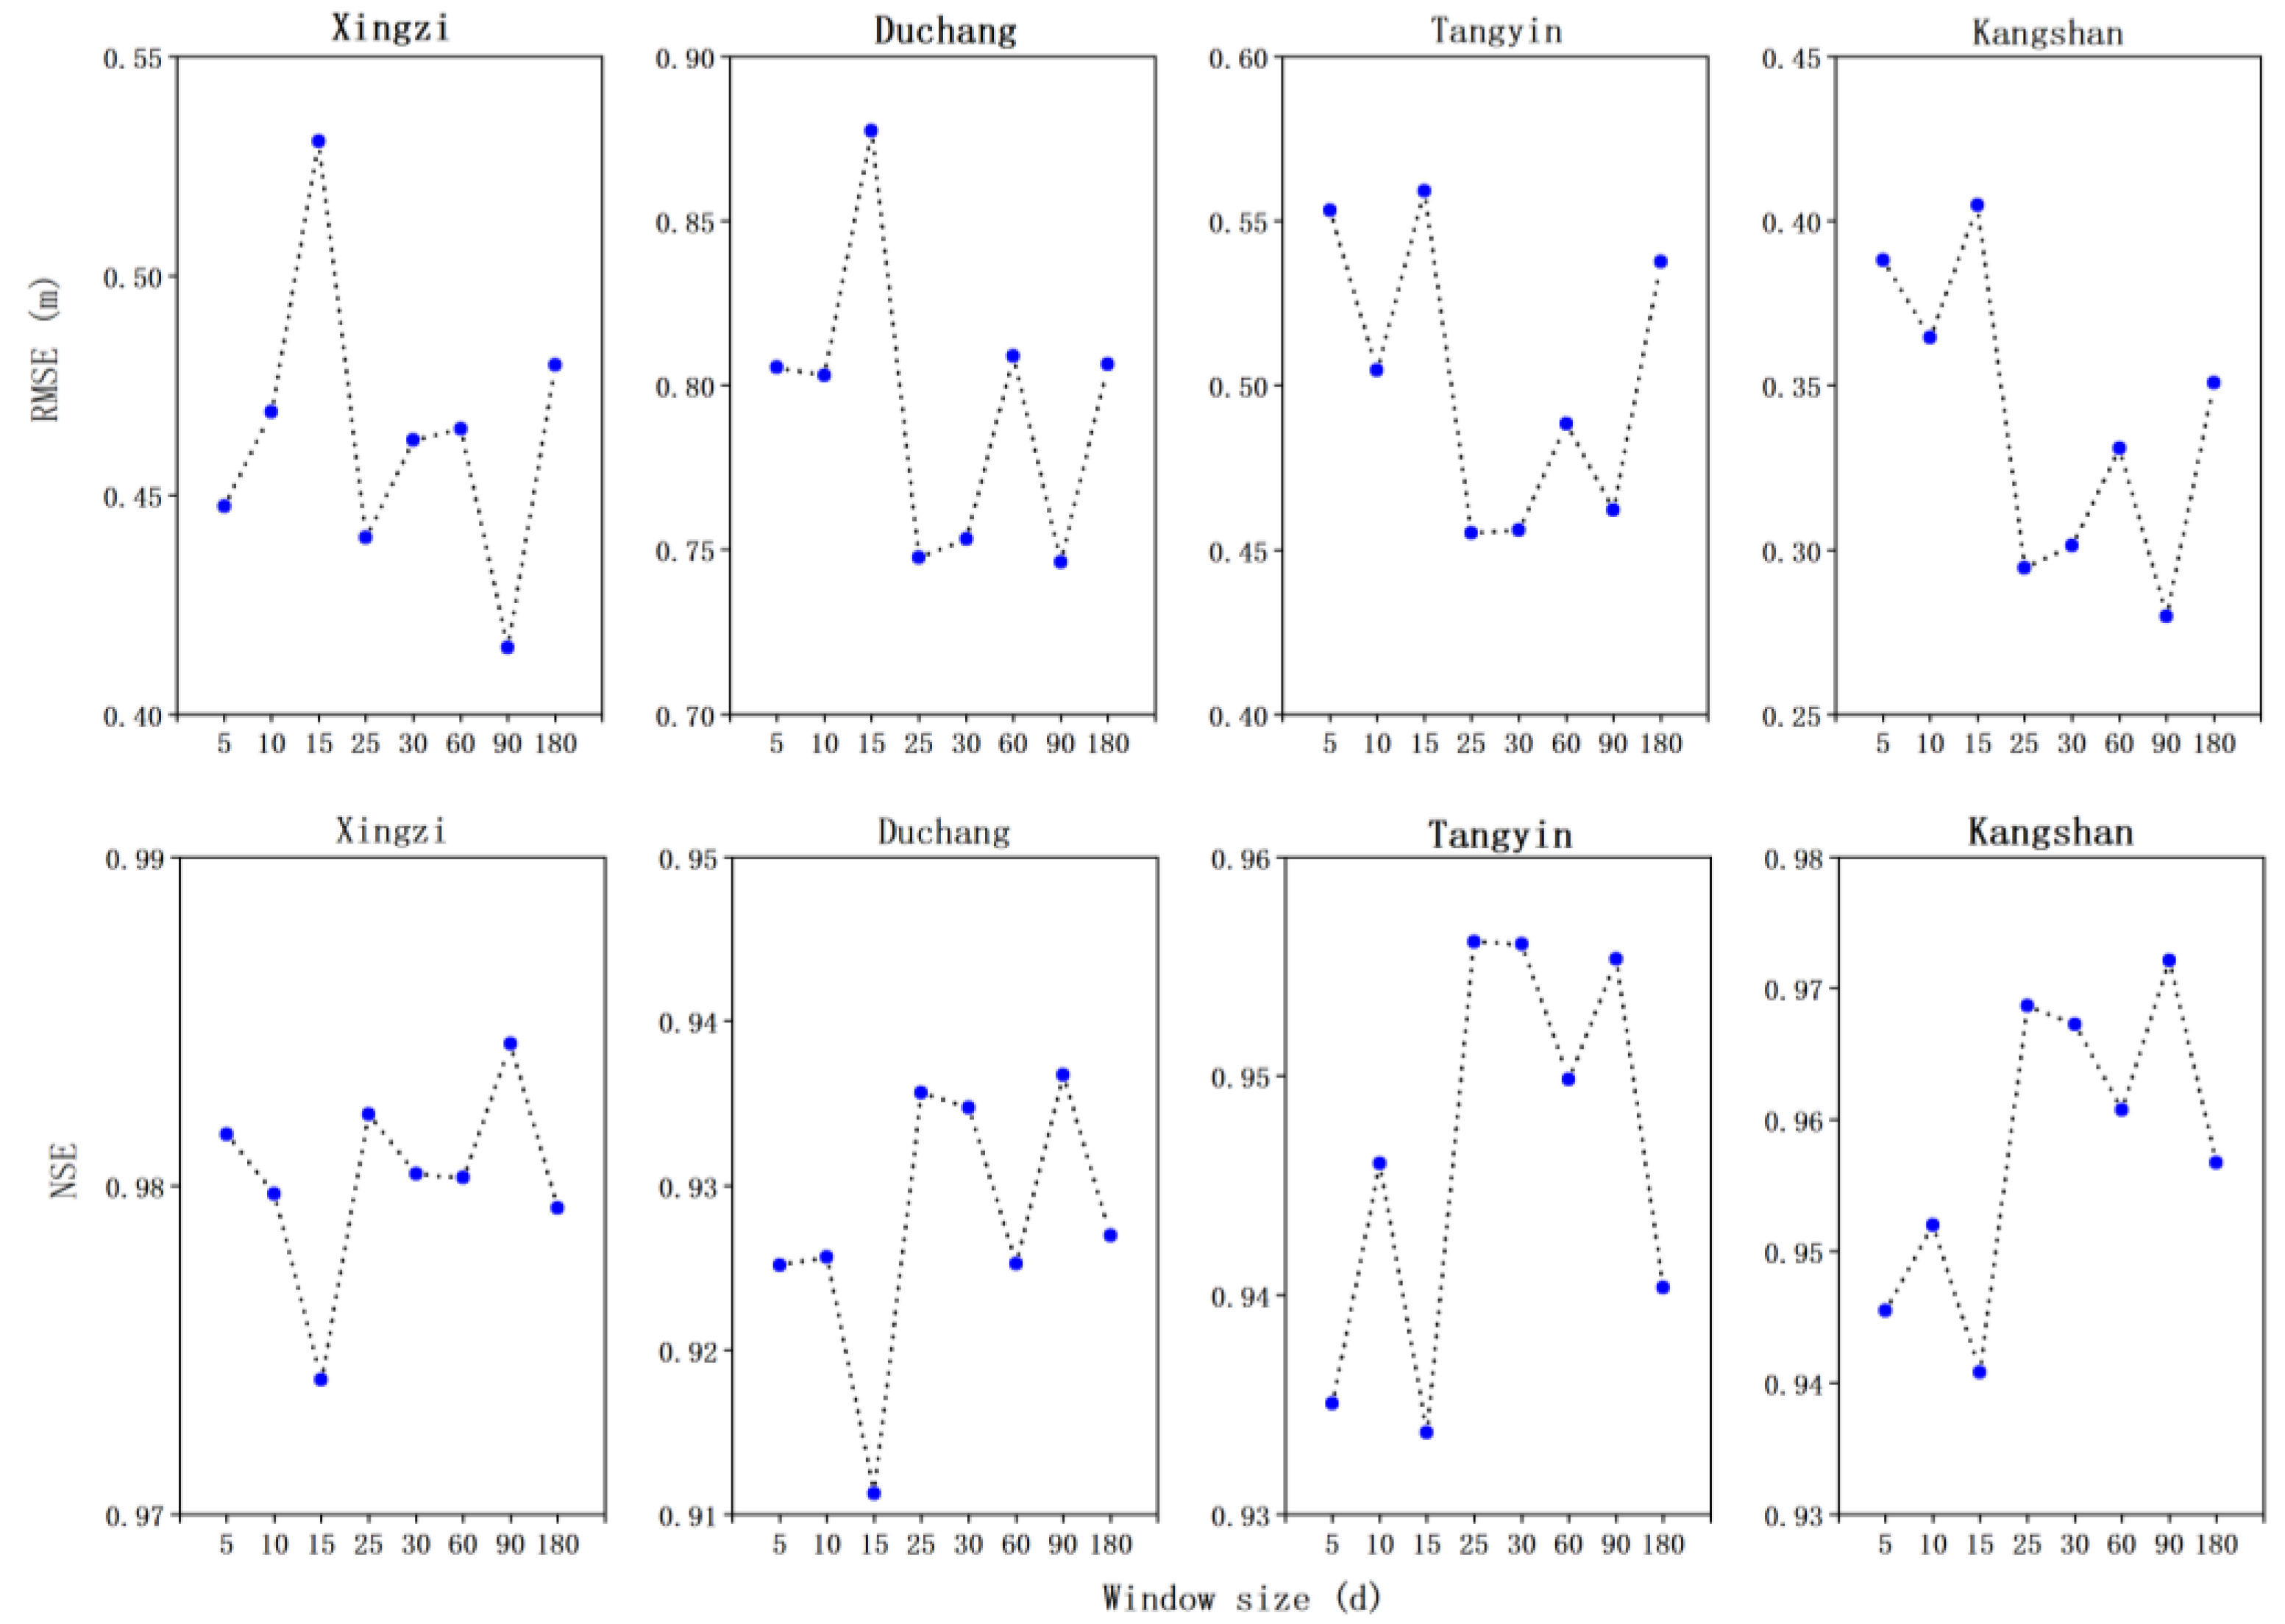
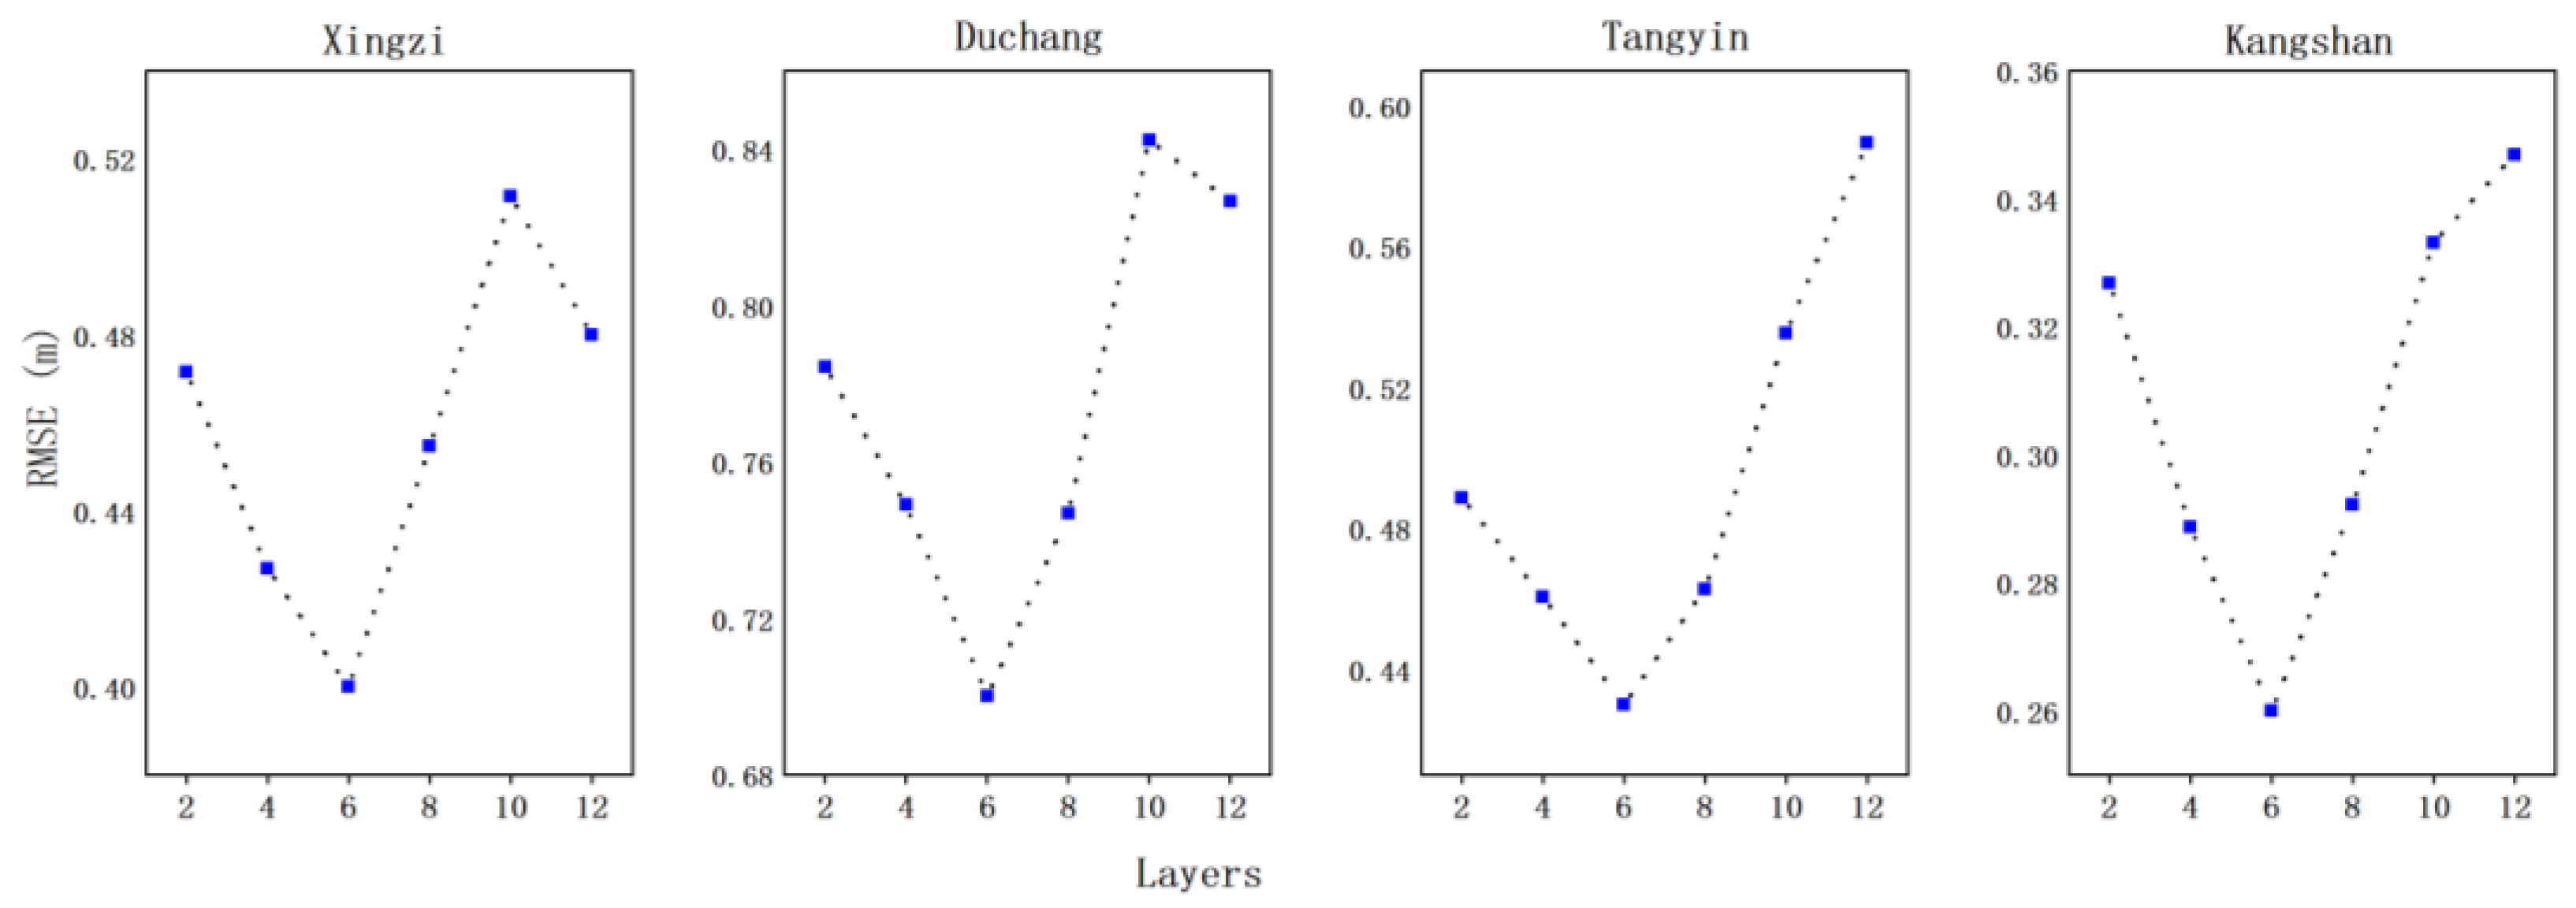
To explore the influences of window size in the model prediction results, nine independent transformer models were trained with nine sets of window sizes under the model layer of 6 (the best layer for simulation results). The model performances are measured by RMSE and NSE. It can be found that both RMSE and NSE show fluctuating variations with the window size increased from 5 d to 180 d (Figure 7). As the prediction window size varies from 5 d to 15 d, RMSE reached its highest value at 15 d. RMSE decreased rapidly when the window size increased to 20 d. As the window size continues to increase, RMSE reaches the minimum value at 90 d. When the prediction window size increases to 180 d, the RMSE appears to increase significantly. This may mean that the model overfitting occurs. Corresponding to the RMSE variations, NSE showed an opposite fluctuation characteristic. With the window size varied from 5 d to 15 d, the NSE decreases rapidly, which indicated a decrease of simulation accuracy. As the window size exceeded 15 d, NSE increased rapidly. The NSE reaches the maximum value with a window size of 90 d at all three stations except for at Tangyin station. Moreover, the highest NSE values indicate a good model simulation effect with this window size. When the window exceeds 90 d, the NSE decreases rapidly, indicating that the increase of the window size is no longer beneficial to promote the improvement of the simulation accuracy. To explore the influence of model layers on prediction results, transformer models were trained with six sets of model layers. This indicated that, with the layers increased from 2 to 12, the RMSE values decrease at first and then increase gradually (Figure 8). With the layer of 6, the model got the best simulation results with the lowest RMSE values of 0.40 m, 0.70 m, 0.43 m, and 0.46 m in Xingzi, Duchang, Tangyin, and Kangshan stations, respectively. This result indicated that large window size and model layers may lead to model overfitting, and a suitable window size and model layer should be chosen to increase computation efficiency and model accuracy.
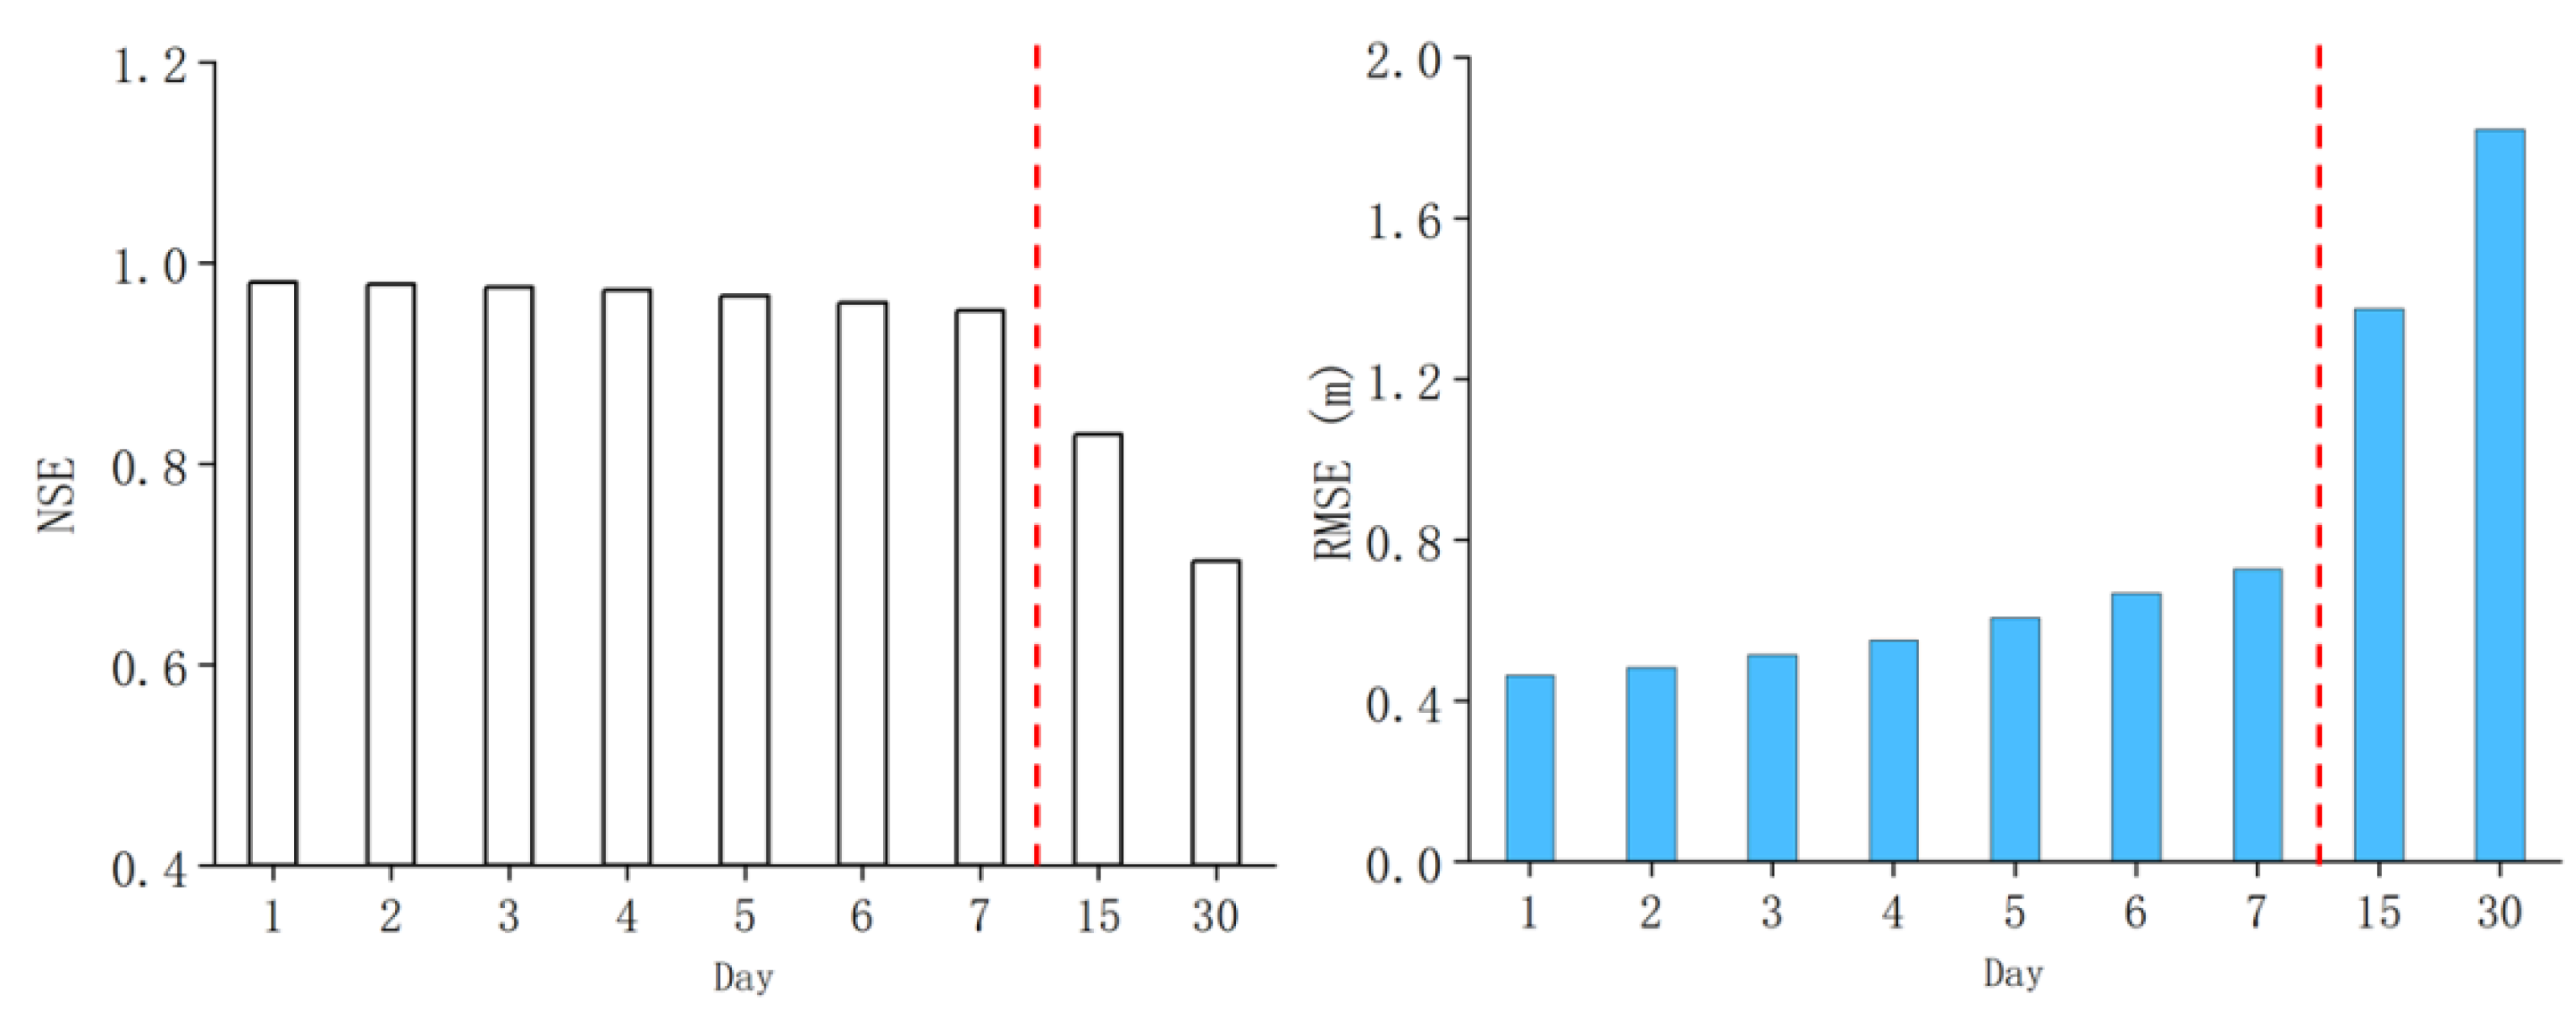
Model performance with different forecasting lead times in lake water level simulation is analyzed in this study. This is very important for lake water resource management and flood prediction. At Xingzi Station, this study explored the model performance with different lead times, such one, two, three, four, five, six, seven, and 15 days and a month. With the lead time varied from one to seven days, the RMSE and NSE values were recorded in the range of 0.46–0.73 m and 0.95–0.98, respectively, and the RMSE and NSE variances with lead time variations were little, demonstrating high model accuracy in lake water level prediction (Figure 9). However, with the lead time of 15 and 30 days, the RMSE value increased to 1.37 m and 1.82 m, respectively, showing relatively lower simulation accuracy in lake water level prediction. This result illustrated that a lead time range of 1–7 days is suitable in lake water prediction for lake water resource management and flood prediction.
4. Conclusions
In this study, the transformer model is applied on the simulation of daily water level from Poyang Lake and the results showed that:
(1) The transformer model performs well in simulating the lake water level variations and can reflect the temporal water level variation characteristics in Poyang Lake. In the testing stage, the RMSE values were recorded in the range of 0.26–0.70 m, and the NSE values are higher than 0.94. Moreover, the transformer was superior to the LSTM model in lake water level simulations in all four stations in this study and it is necessary to apply the transformer model on water level prediction in other lakes.
(2) The Yangtze River inflow has a great influence on the lake water level fluctuation of Poyang Lake, especially in flood and receding periods. The contribution rate of the Yangtze River in RMSE and NSE is higher than 80% and 270%, respectively. In the future, the effects from Yangtze River and the TGD should be considered as one of the most important factors in the water level forecasting of Poyang Lake.
(3) Window size and model layers significantly influence the transformer model simulation accuracy. In this study, a window size of 90 d and a model layer of 6 are the most suitable hyper-parameters for water level prediction in Poyang Lake and large window size and model layers may lead to model overfitting. Additionally, the transformer model showed high model accuracy in lake water level prediction with the lead time varied from one to seven days, while the RMSE value increased to 1.37 m and 1.82 m, with the lead time of 15 and 30 days. A lead time range of 1–7 days is suitable in lake water prediction for lake water resource management and flood prediction.
The transformer model in this study showed high efficiency in water level forecasting in Poyang Lake. This model may be used to investigate other hydrological processes. For example, Yin [21] built a rainfall-runoff model based on the transformer model to predict runoff variations. However, few studies have tried to use the transformer model coupling with the attention mechanism for hydrological process forecasting. Thus, the application and superiority of this model in water level forecasting and other hydrologic process simulation in other lakes is far from known. Zhu [26] stated that the deep learning model present superiority over traditional machine learning models in lake water level prediction when there is a large training dataset and a small temporal scale (e.g., daily timescale). However, the “breakeven point” of the transformer model begins to overtake the traditional machine learning models if the length of the training data is not clear. It is suggested that the model can be used for long sequence time-series forecasting in hydrological processes, e.g., in lake water temperature modelling. Meanwhile, the application of the model in lake water simulation in other lakes is suggested to test its performance.
Author Contributions
Conceptualization, J.X.; Methodology, J.X., H.F. and P.L.; Software, P.L.; data curation, L.X. and H.F.; writing-original draft preparation, J.X. and P.L.; supervision, L.X. and H.F.; writing-review and editing, M.L. and T.J.; funding acquisition, J.X., H.F. and L.X. All authors have read and agreed to the published version of the manuscript.
Funding
The work described in this paper was supported by the grant from the Scientific Research Fund of Nanjing Institute of Technology (YKJ201846), the National Natural Science Foundation of China (41971137, U2240224, 42001109), the Natural Science Foundation of Jiangsu Province (BK20201102), and the Science and Technology Project of Jiangxi Province (20203CCD46006, 20213AAG01012, 20212BBG71002, 20222BCD46002).
Data Availability Statement
The data are supported by Poyang Lake Wetland Observation and research Station, Chinese Academy of Sciences ([email protected]). The source code and model can be obtained from: https://github.com/lipiji/water_level_prediction (accessed on 26 November 2022).
Conflicts of Interest
The authors declare no conflict of interest.
References
- Zhang, Q.; Ye, X.C.; Werner, A.D.; Li, Y.L.; Yao, J.; Li, X.H.; Xu, C.Y. An investigation of enhanced recessions in Poyang Lake: Comparison of Yangtze River and local catchment impacts. J. Hydrol. 2014, 517, 425–434. [Google Scholar] [CrossRef]
- Cusell, C.; Lamers, L.P.; van Wirdum, G.; Kooijman, A. Impacts of water level fluctuation on mesotrophic rich fens: Acidification vs. eutrophication. J. Appl. Ecol. 2013, 50, 998–1009. [Google Scholar] [CrossRef]
- Wang, P.; Zhang, Q.; Xu, Y.S.; Yu, F.H. Effects of water level fluctuation on the growth of submerged macrophyte communities. Flora 2016, 223, 83–89. [Google Scholar] [CrossRef]
- Khanal, R.; Uk, S.; Kodikara, D.; Siev, S.; Yoshimura, C. Impact of water level fluctuation on sediment and phosphorous dynamics in Tonle Sap Lake, Cambodia. Water Air Soil Pollut. 2021, 232, 139. [Google Scholar] [CrossRef]
- Li, B.; Yang, G.; Wan, R.; Lai, X.; Wagner, P.D. Impacts of hydrological alteration on ecosystem services changes of a large river-connected lake (Poyang Lake), China. J. Environ. Manag. 2022, 310, 114750. [Google Scholar] [CrossRef]
- Ye, X.; Li, Y.; Li, X.; Zhang, Q. Factors influencing water level changes in China’s largest freshwater lake, Poyang Lake, in the past 50 years. Water Int. 2014, 39, 983–999. [Google Scholar] [CrossRef]
- Li, M.; Li, Y. On the hydrodynamic behavior of the Changed River–Lake relationship in a large floodplain system, Poyang Lake (China). Water 2020, 12, 626. [Google Scholar] [CrossRef]
- Shankman, D.; Keim, B.D.; Song, J. Flood frequency in China’s Poyang Lake region: Trends and teleconnections. Int. J. Climatol. J. R. Meteorol. Soc. 2006, 26, 1255–1266. [Google Scholar] [CrossRef]
- Zhang, Z.; Chen, X.; Xu, C.Y.; Hong, Y.; Hardy, J.; Sun, Z. Examining the influence of river–lake interaction on the drought and water resources in the Poyang Lake basin. J. Hydrol. 2015, 522, 510–521. [Google Scholar] [CrossRef]
- Li, Y.; Zhang, Q.; Werner, A.D.; Yao, J.; Ye, X. The influence of river-to-lake backflow on the hydrodynamics of a large floodplain lake system (Poyang Lake, China). Hydrol. Process. 2017, 31, 117–132. [Google Scholar] [CrossRef]
- Wang, W.; Wang, Y.; Hou, J.; Ouyang, S. Flooding influences waterbird abundance at Poyang Lake, China. Waterbirds 2019, 42, 30–38. [Google Scholar]
- Zhou, H.; Zhou, W.; Liu, Y.; Yuan, Y.; Huang, J.; Liu, Y. Meteorological drought migration in the Poyang Lake Basin, China: Switching among different climate modes. J. Hydrometeorol. 2020, 21, 415–431. [Google Scholar] [CrossRef]
- Liu, Y.; Song, P.; Peng, J.; Fu, Q.; Dou, C. Recent increased frequency of drought events in Poyang Lake Basin, China: Climate change or anthropogenic effects. Hydro-Climatol. Var. Chang. IAHS Publ. 2011, 344, 99–104. [Google Scholar]
- Jianping, B.; Pengxin, D.; Xiang, Z.; Sunyun, L.; Marani, M.; Yi, X. Flood coincidence analysis of Poyang Lake and Yangtze River: Risk and influencing factors. Stoch. Environ. Res. Risk Assess. 2018, 32, 879–891. [Google Scholar] [CrossRef]
- Lai, X.; Jiang, J.; Liang, Q.; Huang, Q. Large-scale hydrodynamic modeling of the middle Yangtze River Basin with complex river–lake interactions. J. Hydrol. 2013, 492, 228–243. [Google Scholar] [CrossRef]
- Nourani, V.; Baghanam, A.H.; Adamowski, J.; Kisi, O. Applications of hybrid wavelet–artificial intelligence models in hydrology: A review. J. Hydrol. 2014, 514, 358–377. [Google Scholar] [CrossRef]
- Li, Y.; Zhang, Q.; Yao, J.; Werner, A.D.; Li, X. Hydrodynamic and hydrological modeling of the Poyang Lake catchment system in China. J. Hydrol. Eng. 2014, 19, 607–616. [Google Scholar] [CrossRef]
- Altunkaynak, A.; Şen, Z. Fuzzy logic model of lake water level fluctuations in Lake Van, Turkey. Theor. Appl. Climatol. 2007, 90, 227–233. [Google Scholar] [CrossRef]
- Buyukyildiz, M.; Tezel, G.; Yilmaz, V. Estimation of the change in lake water level by artificial intelligence methods. Water Resour. Manag. 2014, 28, 4747–4763. [Google Scholar] [CrossRef]
- Çimen, M.; Kisi, O. Comparison of two different data-driven techniques in modeling lake level fluctuations in Turkey. J. Hydrol. 2009, 378, 253–262. [Google Scholar] [CrossRef]
- Das, M.; Ghosh, S.K.; Chowdary, V.M.; Saikrishnaveni, A.; Sharma, R.K. A probabilistic nonlinear model for forecasting daily water level in reservoir. Water Resour. Manag. 2016, 30, 3107–3122. [Google Scholar] [CrossRef]
- Kakahaji, H.; Banadaki, H.D.; Kakahaji, A.; Kakahaji, A. Prediction of Urmia Lake water-level fluctuations by using analytical, linear statistic and intelligent methods. Water Resour. Manag. 2013, 27, 4469–4492. [Google Scholar] [CrossRef]
- Khan, M.S.; Coulibaly, P. Application of support vector machine in lake water level prediction. J. Hydrol. Eng. 2006, 11, 199–205. [Google Scholar] [CrossRef]
- Zaji, A.H.; Bonakdari, H. Robustness lake water level prediction using the search heuristic-based artificial intelligence methods. ISH J. Hydraul. Eng. 2019, 25, 316–324. [Google Scholar] [CrossRef]
- Güldal, V.; Tongal, H. Comparison of recurrent neural network, adaptive neuro-fuzzy inference system and stochastic models in Eğirdir Lake level forecasting. Water Resour. Manag. 2010, 24, 105–128. [Google Scholar] [CrossRef]
- Zhu, S.; Lu, H.; Ptak, M.; Dai, J.; Ji, Q. Lake water-level fluctuation forecasting using machine learning models: A systematic review. Environ. Sci. Pollut. Res. 2020, 27, 44807–44819. [Google Scholar] [CrossRef]
- Targ, S.; Almeida, D.; Lyman, K. Resnet in resnet: Generalizing residual architectures. arXiv 2016, arXiv:1603.08029. [Google Scholar]
- Yu, Y.; Si, X.; Hu, C.; Zhang, J. A review of recurrent neural networks: LSTM cells and network architectures. Neural Comput. 2019, 31, 1235–1270. [Google Scholar] [CrossRef]
- Vaswani, A.; Shazeer, N.; Parmar, N.; Uszkoreit, J.; Jones, L.; Gomez, A.N.; Kaiser, Ł.; Polosukhin, I. Attention is all you need. Adv. Neural Inf. Process. Syst. 2017, 30, 5998–6008. [Google Scholar]
- Liang, C.; Li, H.; Lei, M.; Du, Q. Dongting lake water level forecast and its relationship with the three gorges dam based on a long short-term memory network. Water 2018, 10, 1389. [Google Scholar] [CrossRef]
- Hrnjica, B.; Bonacci, O. Lake level prediction using feed forward and recurrent neural networks. Water Resour. Manag. 2019, 33, 2471–2484. [Google Scholar] [CrossRef]
- Guo, Y.; Lai, X.-J. Water level prediction of Lake Poyang based on long short term memory neural network. J. Lake Sci. 2020, 32, 865–876. [Google Scholar]
- Dai, Z.; Yang, Z.; Yang, Y.; Carbonell, J.; Le, Q.V.; Salakhutdinov, R. Transformer-xl: Attentive language models beyond a fixed-length context. arXiv 2019, arXiv:1901.02860. [Google Scholar]
- Dosovitskiy, A.; Beyer, L.; Kolesnikov, A.; Weissenborn, D.; Zhai, X.; Unterthiner, T.; Dehghani, M.; Minderer, M.; Heigold, G.; Gelly, S.; et al. An image is worth 16 × 16 words: Transformers for image recognition at scale. arXiv 2020, arXiv:2010.11929. [Google Scholar]
- Yin, H.; Guo, Z.; Zhang, X.; Chen, J.; Zhang, Y. RR-Former: Rainfall-runoff modeling based on Transformer. J. Hydrol. 2022, 609, 127781. [Google Scholar] [CrossRef]
- Dai, X.; Wan, R.; Yang, G. Non-stationary water-level fluctuation in China’s Poyang Lake and its interactions with Yangtze River. J. Geogr. Sci. 2015, 25, 274–288. [Google Scholar] [CrossRef]
- Li, Y.L.; Zhang, Q.; Werner, A.D.; Yao, J. Investigating a complex lake-catchment-river system using artificial neural networks: Poyang Lake (China). Hydrol. Res. 2015, 46, 912–928. [Google Scholar] [CrossRef] [Green Version]
- Hui, F.; Xu, B.; Huang, H.; Yu, Q.; Gong, P. Modelling spatial-temporal change of Poyang Lake using multitemporal Landsat imagery. Int. J. Remote Sens. 2008, 29, 5767–5784. [Google Scholar] [CrossRef]
- Hochreiter, S.; Schmidhuber, J. Long short-term memory. Neural Comput. 1997, 9, 1735–1780. [Google Scholar] [CrossRef]
- Graves, A.; Schmidhuber, J. Framewise phoneme classification with bidirectional LSTM and other neural network architectures. Neural Netw. 2005, 18, 602–610. [Google Scholar] [CrossRef]
- Kratzert, F.; Klotz, D.; Brenner, C.; Schulz, K.; Herrnegger, M. Rainfall–runoff modelling using long short-term memory (LSTM) networks. Hydrol. Earth Syst. Sci. 2018, 22, 6005–6022. [Google Scholar] [CrossRef]
- Qi, Y.; Li, Q.; Karimian, H.; Liu, D. A hybrid model for spatiotemporal forecasting of PM2.5 based on graph convolutional neural network and long short-term memory. Sci. Total Environ. 2019, 664, 1–10. [Google Scholar] [CrossRef]
- Qin, J.; Liang, J.; Chen, T.; Lei, X.; Kang, A. Simulating and Predicting of Hydrological Time Series Based on TensorFlow Deep Learning. Pol. J. Environ. Stud. 2019, 28, 795–802. [Google Scholar] [CrossRef] [PubMed]
- Moriasi, D.N.; Arnold, J.G.; Van Liew, M.W.; Bingner, R.L.; Harmel, R.D.; Veith, T.L. Model evaluation guidelines for systematic quantification of accuracy in watershed simulations. Trans. ASABE 2007, 50, 885–900. [Google Scholar] [CrossRef]
- Yu, M.; Liu, X.; Wood, P.; Wei, L.; Wang, G.; Zhang, J.; Li, Q. Simulation of Poyang Lake water levels and outflow under historical extreme hydrological scenarios. J. Flood Risk Manag. 2022, 15, e12806. [Google Scholar] [CrossRef]
- Zhu, S.; Hrnjica, B.; Ptak, M.; Choiński, A.; Sivakumar, B. Forecasting of water level in multiple temperate lakes using machine learning models. J. Hydrol. 2020, 585, 124819. [Google Scholar] [CrossRef]
- Ye, X.; Zhang, Q.; Bai, L.; Hu, Q. A modeling study of catchment discharge to Poyang Lake under future climate in China. Quat. Int. 2011, 244, 221–229. [Google Scholar] [CrossRef]
- Shankman, D.; Keim, B.D.; Nakayama, T.; Li, R.; Wu, D.; Remington, W.C. Hydroclimate analysis of severe floods in China’s Poyang Lake region. Earth Interact. 2012, 16, 1–16. [Google Scholar] [CrossRef]
- Huang, S.; Xia, J.; Zeng, S.; Wang, Y.; She, D. Effect of Three Gorges Dam on Poyang Lake water level at daily scale based on machine learning. J. Geogr. Sci. 2021, 31, 1598–1614. [Google Scholar] [CrossRef]
Figure 1.
Poyang Lake area (A) and rivers, hydrological stations and gauging stations in Poyang Lake (B).
Figure 1.
Poyang Lake area (A) and rivers, hydrological stations and gauging stations in Poyang Lake (B).

Figure 2.
The Transformer Model architecture [29].
Figure 2.
The Transformer Model architecture [29].

Figure 3.
Data flow chart.

Figure 4.
Comparison of simulated and observed water levels in four stations in Poyang Lake.

Figure 5.
Simulation and observation of Poyang lake water levels with LSTM and Transformer models.

Figure 6.
NSE and RMSE values in four periods under S1 and S2.

Figure 7.
Simulation accuracy (RMSE and NSE) under different window sizes of Transformer model.

Figure 8.
Simulation accuracy (RMSE) under different model layers of Transformer model.

Figure 9.
Effects of lead time on model accuracy in Xingzi Station. The red vertical line split the results into two groups to indicate the reason why the difference gap suddenly increased from day 7 to day 15: the left group are the prediction results for the coming 1 day to 7 days correspondingly; the right group are the prediction results for day 15 and day 30 respectively.


Table 1.
Input data and output data.
| Data Description | Gauging Station | Duration | Application |
|---|---|---|---|
| Meteorological data | 14 national meteorological stations | 1960–2013 | Input |
| Catchment inflow | Waizhou (Ganjiang River) | 1960–2013 | Input |
| Lijiadu (Fuhe River) | 1960–2013 | Input | |
| Meigang (Xinjiang River) | 1960–2013 | Input | |
| Dufengkeng (Raohe River) Hushan (Raohe River) | 1960–2013 1960–2013 | Input Input | |
| Wanjiabu (Xiushui River) | 1960–2013 | Input | |
| Yangtze River water level | Hukou | 1960–2013 | Input |
| Poyang lake water level | Xingzi | 1960–2013 | Output |
| Duchang | 1960–2013 | Output | |
| Tangyin | 1960–2013 | Output | |
| Kangshan | 1960–2013 | Output |
Table 2.
Performance evaluation using the Transformer model for water level prediction.
| Stage | Index | Xingzi | Duchang | Tangyin | Kangshan |
|---|---|---|---|---|---|
| Scenario 1 | |||||
| Training | R2 | 0.91 | 0.91 | 0.89 | 0.84 |
| RMSE | 1.12 | 1.02 | 0.96 | 0.94 | |
| NSE | 0.91 | 0.91 | 0.89 | 0.83 | |
| Testing | R2 | 0.84 | 0.84 | 0.81 | 0.76 |
| RMSE | 1.60 | 1.63 | 1.66 | 1.28 | |
| NSE | 0.79 | 0.76 | 0.69 | 0.66 | |
| Scenario 2 | |||||
| Training | R2 | 1.00 | 1.00 | 1.00 | 1.00 |
| RMSE | 0.16 | 0.15 | 0.14 | 0.14 | |
| NSE | 1.00 | 1.00 | 1.00 | 1.00 | |
| Testing | R2 | 0.99 | 0.97 | 0.97 | 0.98 |
| RMSE | 0.40 | 0.70 | 0.43 | 0.26 | |
| NSE | 0.99 | 0.94 | 0.96 | 0.98 |
Table 3.
Studies applying deep learning models for water level prediction in lakes.
| Study Area | Temporal Scale | Model Input | Training Period | Testing Period | Performance Evaluation Criteria | Reference | |
|---|---|---|---|---|---|---|---|
| LSTM | Poyang Lake | Daily | River flows | 1956–1980 | 1981–2000 | R2, RMSE, NSE | Guo and Lai 2020 [32] |
| LSTM, SVM | Dongting Lake | Daily | Water level, water inflow, rainfall | 2003–2012 | 2011–2013 | R2, RMSE | Liang 2018 [30] |
| FFNN, LSTM | Vrana Lake | Monthly | Water level | 1978–2016 | 12 months | R, RMSE | Hrnjica and Bonacci 2019 [31] |
| FFNN, DL | 69 lakes in Poland | Monthly | Water level | 1984–2014 (2/3rd) | 1984–2014 (1/3rd) | R, RMSE | Zhu 2020 [46] |
| Transformer | Poyang Lake | Daily and monthly | Water level, meteorological factors | 1960–2000 | 2001–2013 | R2, RMSE, NSE | This study |
Table 4.
Comparison of model performances between Transformer and LSTM in four stations.
| Station | Model | Training Stage | Testing Stage | ||||
|---|---|---|---|---|---|---|---|
| R2 | RMSE/m | NSE | R2 | RMSE/m | NSE | ||
| Xingzi | LSTM | 0.98 | 0.81 | 0.94 | 0.98 | 0.55 | 0.97 |
| Transformer | 1.00 | 0.16 | 1.00 | 0.99 | 0.40 | 0.99 | |
| Duchang | LSTM | 0.92 | 0.91 | 0.85 | 0.97 | 0.79 | 0.93 |
| Transformer | 1.00 | 0.15 | 1.00 | 0.97 | 0.70 | 0.94 | |
| Tangyin | LSTM | 0.99 | 0.76 | 0.95 | 0.96 | 0.48 | 0.95 |
| Transformer | 1.00 | 0.14 | 1.00 | 0.97 | 0.43 | 0.96 | |
| LSTM | 0.97 | 0.77 | 0.89 | 0.96 | 0.37 | 0.95 | |
| Kangshang | Transformer | 1.00 | 0.14 | 1.00 | 0.98 | 0.26 | 0.98 |
Table 5.
Contribution of the Yangtze River on RMSE and NSE.
| Period | RMSE Contribution Rate (%) | NSE Contribution Rate (%) | ||||||
|---|---|---|---|---|---|---|---|---|
| Xingzi | Duchang | Tangyin | Kangshan | Xingzi | Duchang | Tangyin | Kangshan | |
| Dry period | 38.0 | 2.8 | 58.8 | 65.0 | 50.1 | 8.6 | 223.5 | 81.4 |
| Rising period | 70.8 | 62.4 | 79.3 | 72.5 | 19.1 | 24.8 | 36.9 | 23.7 |
| Flood period | 85.2 | 84.8 | 79.7 | 83.9 | 514.6 | 506.6 | 507.8 | 803.1 |
| Receding period | 92.0 | 80.3 | 82.6 | 86.4 | 505.5 | 550.6 | 477.0 | 274.1 |
Note: RMSE contribution rate = (RMSE of S2 − RMSE of S1)/(RMSE of S1) ∗ 100%, the NSE contribution rate = (RMSE of S2 − RMSE of S1)/(RMSE of S1) ∗ 100%.
Disclaimer/Publisher’s Note: The statements, opinions and data contained in all publications are solely those of the individual author(s) and contributor(s) and not of MDPI and/or the editor(s). MDPI and/or the editor(s) disclaim responsibility for any injury to people or property resulting from any ideas, methods, instructions or products referred to in the content. |
© 2023 by the authors. Licensee MDPI, Basel, Switzerland. This article is an open access article distributed under the terms and conditions of the Creative Commons Attribution (CC BY) license (https://creativecommons.org/licenses/by/4.0/).
Share and Cite
MDPI and ACS Style
Xu, J.; Fan, H.; Luo, M.; Li, P.; Jeong, T.; Xu, L. Transformer Based Water Level Prediction in Poyang Lake, China. Water 2023, 15, 576. https://doi.org/10.3390/w15030576
AMA Style
Xu J, Fan H, Luo M, Li P, Jeong T, Xu L. Transformer Based Water Level Prediction in Poyang Lake, China. Water. 2023; 15(3):576. https://doi.org/10.3390/w15030576
Chicago/Turabian StyleXu, Jiaxing, Hongxiang Fan, Minghan Luo, Piji Li, Taeseop Jeong, and Ligang Xu. 2023. "Transformer Based Water Level Prediction in Poyang Lake, China" Water 15, no. 3: 576. https://doi.org/10.3390/w15030576
Note that from the first issue of 2016, this journal uses article numbers instead of page numbers. See further details here.