
A Unique Approach to Hydrological Behavior along the Bednja River (Croatia) Watercourse


1
Department of Civil Engineering, University North, Jurja Križanića 31b, 42000 Varazdin, Croatia
2
Faculty of Geotechnical Engineering, University of Zagreb, Hallerova aleja 7, 42000 Varazdin, Croatia
3
Faculty of Civil Engineering, Architecture, and Geodesy, University of Split, Matice Hrvatske 15, 21000 Split, Croatia
4
Department of Civil and Mechanical Engineering (DICEM), University of Cassino and Southern Lazio, Via Di Biasio, 43, Cassino, 03043 Frosinone, Italy
*
Authors to whom correspondence should be addressed.
Water 2023, 15(3), 589; https://doi.org/10.3390/w15030589
Submission received: 29 December 2022
/
Revised: 27 January 2023
/
Accepted: 30 January 2023
/
Published: 2 February 2023
(This article belongs to the Special Issue Interference Hydrology-Interference of Human Activities on Hydrological System)
Abstract
:Forecasting upstream flow amount based on downstream flow values is a new way of managing flood risk. This kind of prediction of the flow, size, and intensity of rivers in the alluvial aquifers is, in most cases, a challenging task due to climate change, as well as anthropogenic impacts on river flows. The presented methodology allows for organizing and preparing measures for flood protection, the operational work of hydropower plants, and many other usages. The methodology consists of correlation, cross-correlation, and a rescaled adjusted partial sums (RAPS) method. Although all methods are known, they have not been used in a methodology like the one presented. Research is conducted on a real case study of the river Bednja, on five consecutive hydrological measurement stations in the northwestern part of Croatia, for an available time series of the average daily flows from 2007–2018. High correlations were observed between the five stations along the Bednja River, with values of the correlation coefficient between 0.85 and 0.97 for the average daily flows, and between 0.88 and 0.99 for the RAPS values. The presented analysis gives information about similarities and connections between all five hydrological stations, which is significant and can be used to predict flow intensity.
1. Introduction and Background
It is needless to say that climate changes drastically affect the distribution of water resources on Earth. As an essential part of the hydrological balance, river flow is also exposed to climate changes and anthropogenic impacts, especially in water management, i.e., regulation works and the excessive exploitation of drinking water. This makes it difficult to predict the size and time of individual flows, especially the peaks. The general fact is that flood hazards will increase over half the globe [1], as well as in the analyzed area of Eastern Europe [2].
Many tools, models, and methodologies exist for such predictions/forecasting. Many of them are not “user-friendly” and require at least basic knowledge about the input datasets. Additionally, some of the user data are not often available. In general, such models can be broadly classified as conceptually based and empirical models, i.e., the “black-box” approach [3]. In conceptually based models, the flood propagation process is usually described by the Saint Venant equations, comprising partial differential equations of continuity and momentum. In addition to the Saint Venant equations-based models, there are also routing techniques, usually referred as zero-order models, which were used in the past to track floodwave propagation in a river and also for a quick assessment of flood damage [4]. Finally, empirical models are based on evidence of relationships manifested in historical input and output records without analyzing the internal structure of the physical process.
A time series is a series of data points, which is a prerequisite to give a conclusion based on analyzing the historical dataset and its patterns, understanding and matching the current situation with patterns derived from the previous stage, and understanding the factors influencing specific variable(s) in different periods [5]. Time series analysis allows for the preparation of numerous time-based studies and results, i.e., forecasting, segmentation, classification, descriptive analysis, and intervention analysis [6]. Such research could determine trends, seasonality, cyclicity, or irregularities in series data.
Regarding hydrology, the river Bednja was a subject of research, but only in a small number of publications. The first analysis of the hydrological properties of the river Bednja was presented in [7], in a review form of the river basin data and figures. The last known reference is [8], which deals with the length calculation of rivers in Croatia, where the river Bednja is also included. There was a lot of study documentation [9], elaborated reports [10], regulation projects [11], and similar documentation, including student theses [12,13]. These were prepared with an accent on flood protection. In addition, this documentation deals with the design and building of small hydropower plants [14].
Although these results, graphical data, and table data are beneficial in understanding the characteristics of the river Bednja, further research improvements were made in a small number of literature studies. In [15], the correlation between the precipitation from the Bednja river basin and the flow rates measured from stations located along the river is investigated, which results in a comparison of the values of the flow and the existing values to forecast the flows in the future. Despite the high values of the validation (calibration) parameters used for testing, which imply a high correlation between the modeled and observed values, there were discrepancies regarding the maximum observed values. In other words, the modeled values differed from the observed ones by a range of a minimum of 5 m3/s to 10 m3/s [15]. These facts indicate difficulties in modeling flow from rivers flowing through the alluvial river basin, regarding the observed values.
The analysis provided by [16] was based on applying the rescaled adjusted partial sums (RAPS) method to the example of three rivers in Croatia, including the river Bednja. The paper aimed to demonstrate the application of the RAPS method for determining the possible irregularities and periodicities which may occur in the original time series and cannot be observed by simple trend analysis. This research aims to define and understand the relations between the flows of the river Bednja, as measured/calculated on the hydrological gauging stations, and determine the possible alterations that impact the hydrological regime. These are essential for predicting the river’s reaction to the basin’s natural and anthropogenic activities. Concerning similar research, such relationships can be used for establishing river management and designing restoration and regulation operations [5]. Such a method provides a great starting point for better understanding the river flow size and intensity at measurement stations, which is the primary goal of the research.
2. Study Area and Dataset
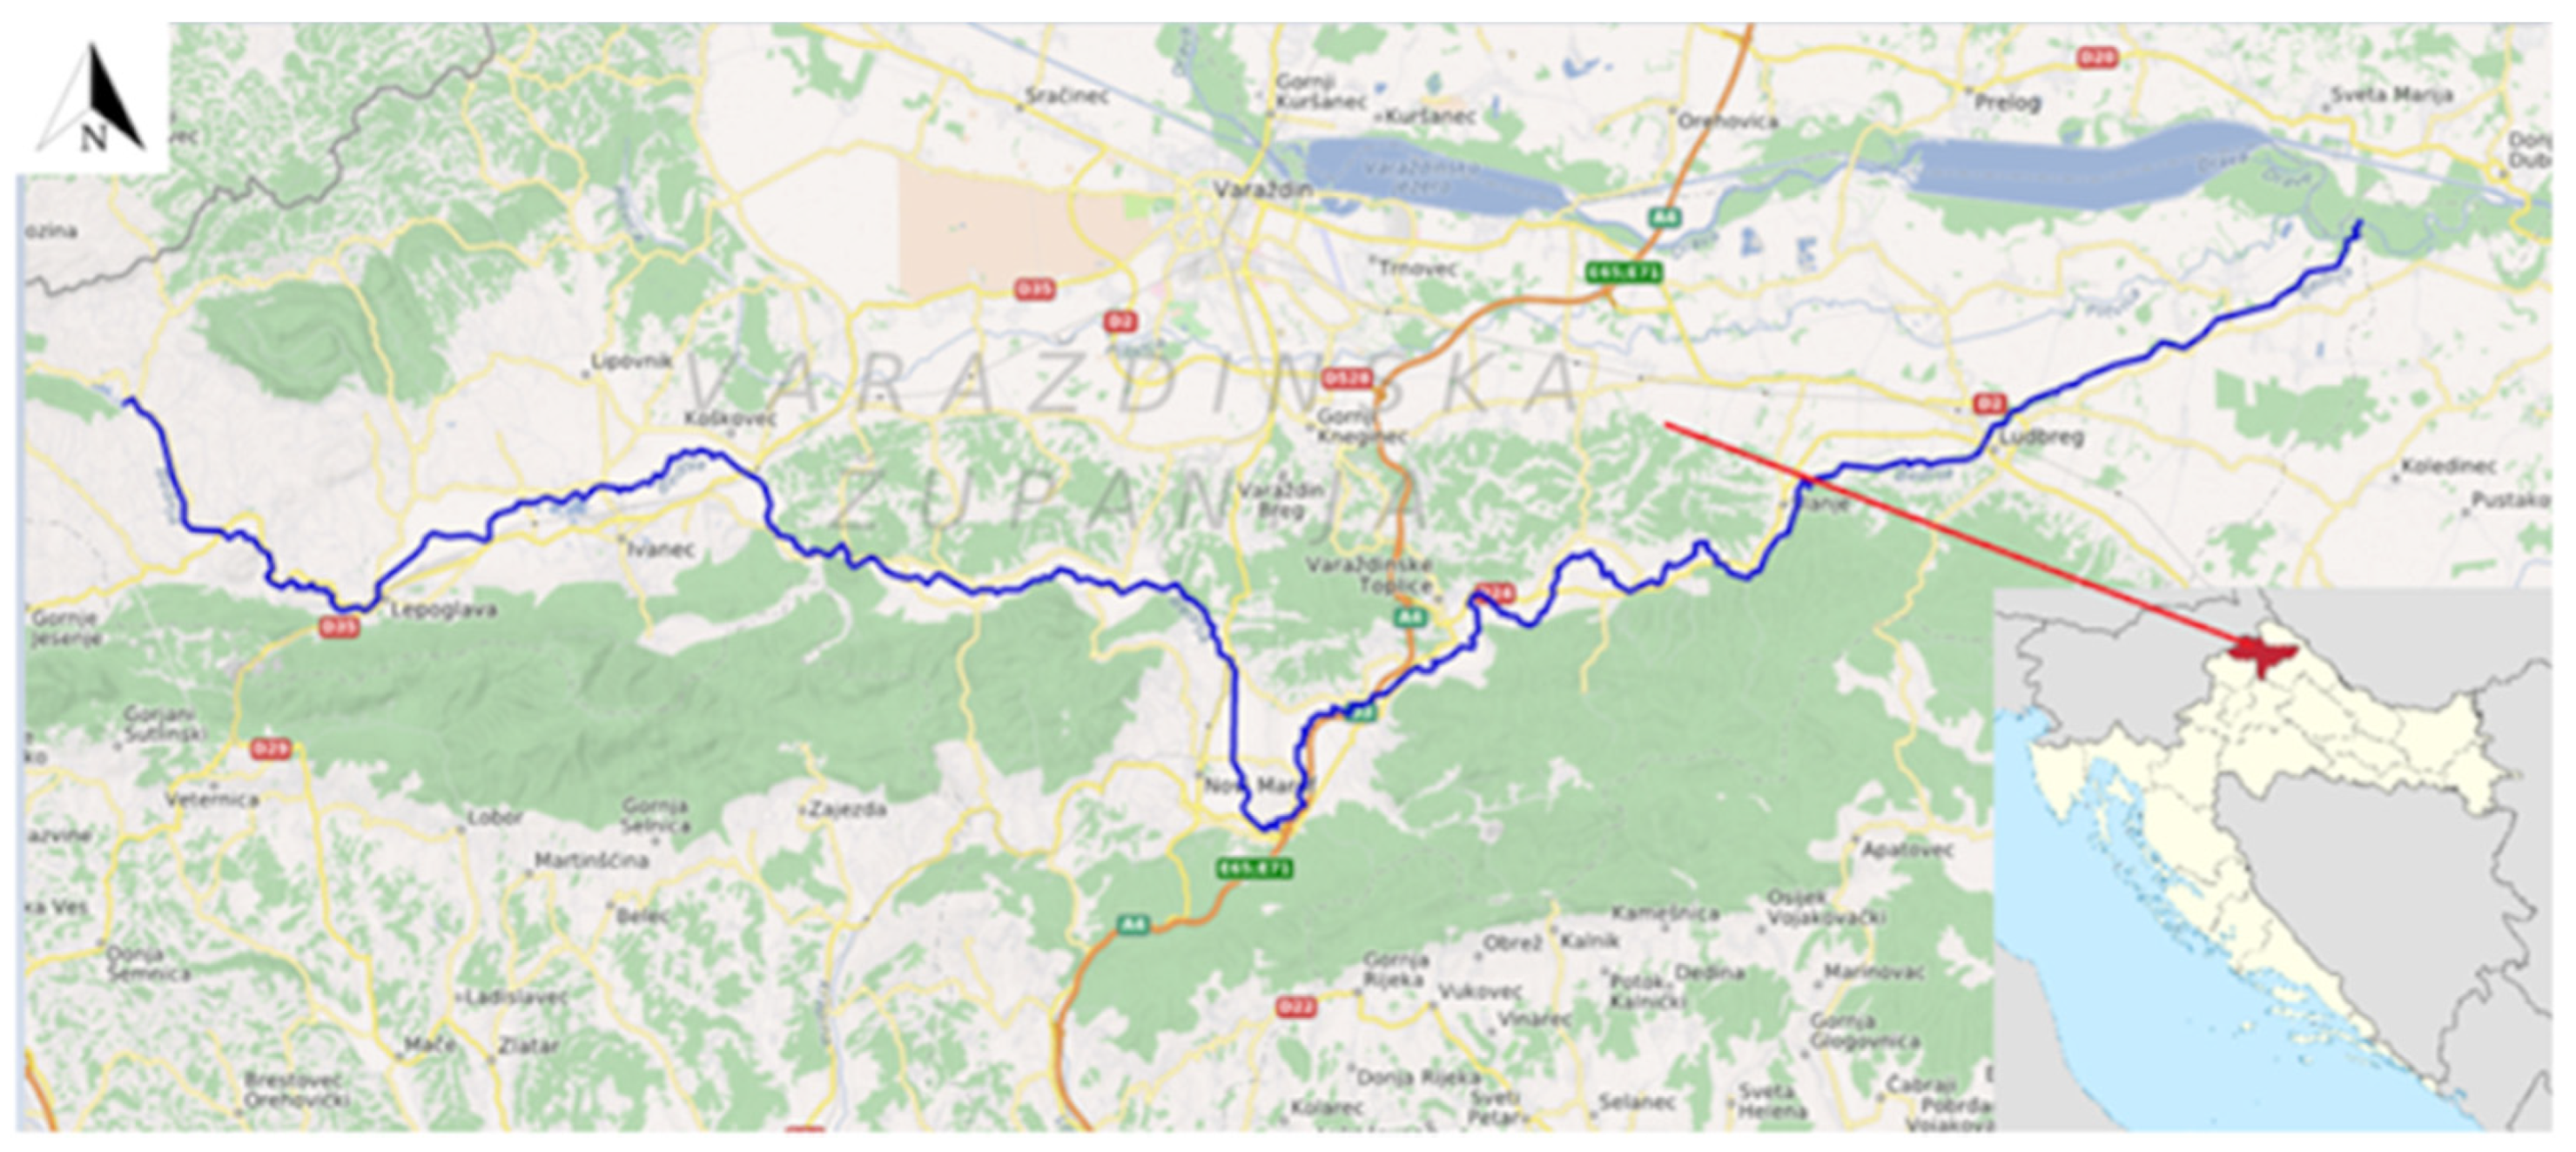
River Bednja is the right tributary of the Drava River, which springs from littler streams at the height of 300 m and creates a constant flow at the foot of Macelj, near Brezova Gora in the northwest part of Croatia (Figure 1). It should be emphasized that Bednja is the longest river in Croatia with a source and estuary in the same country.
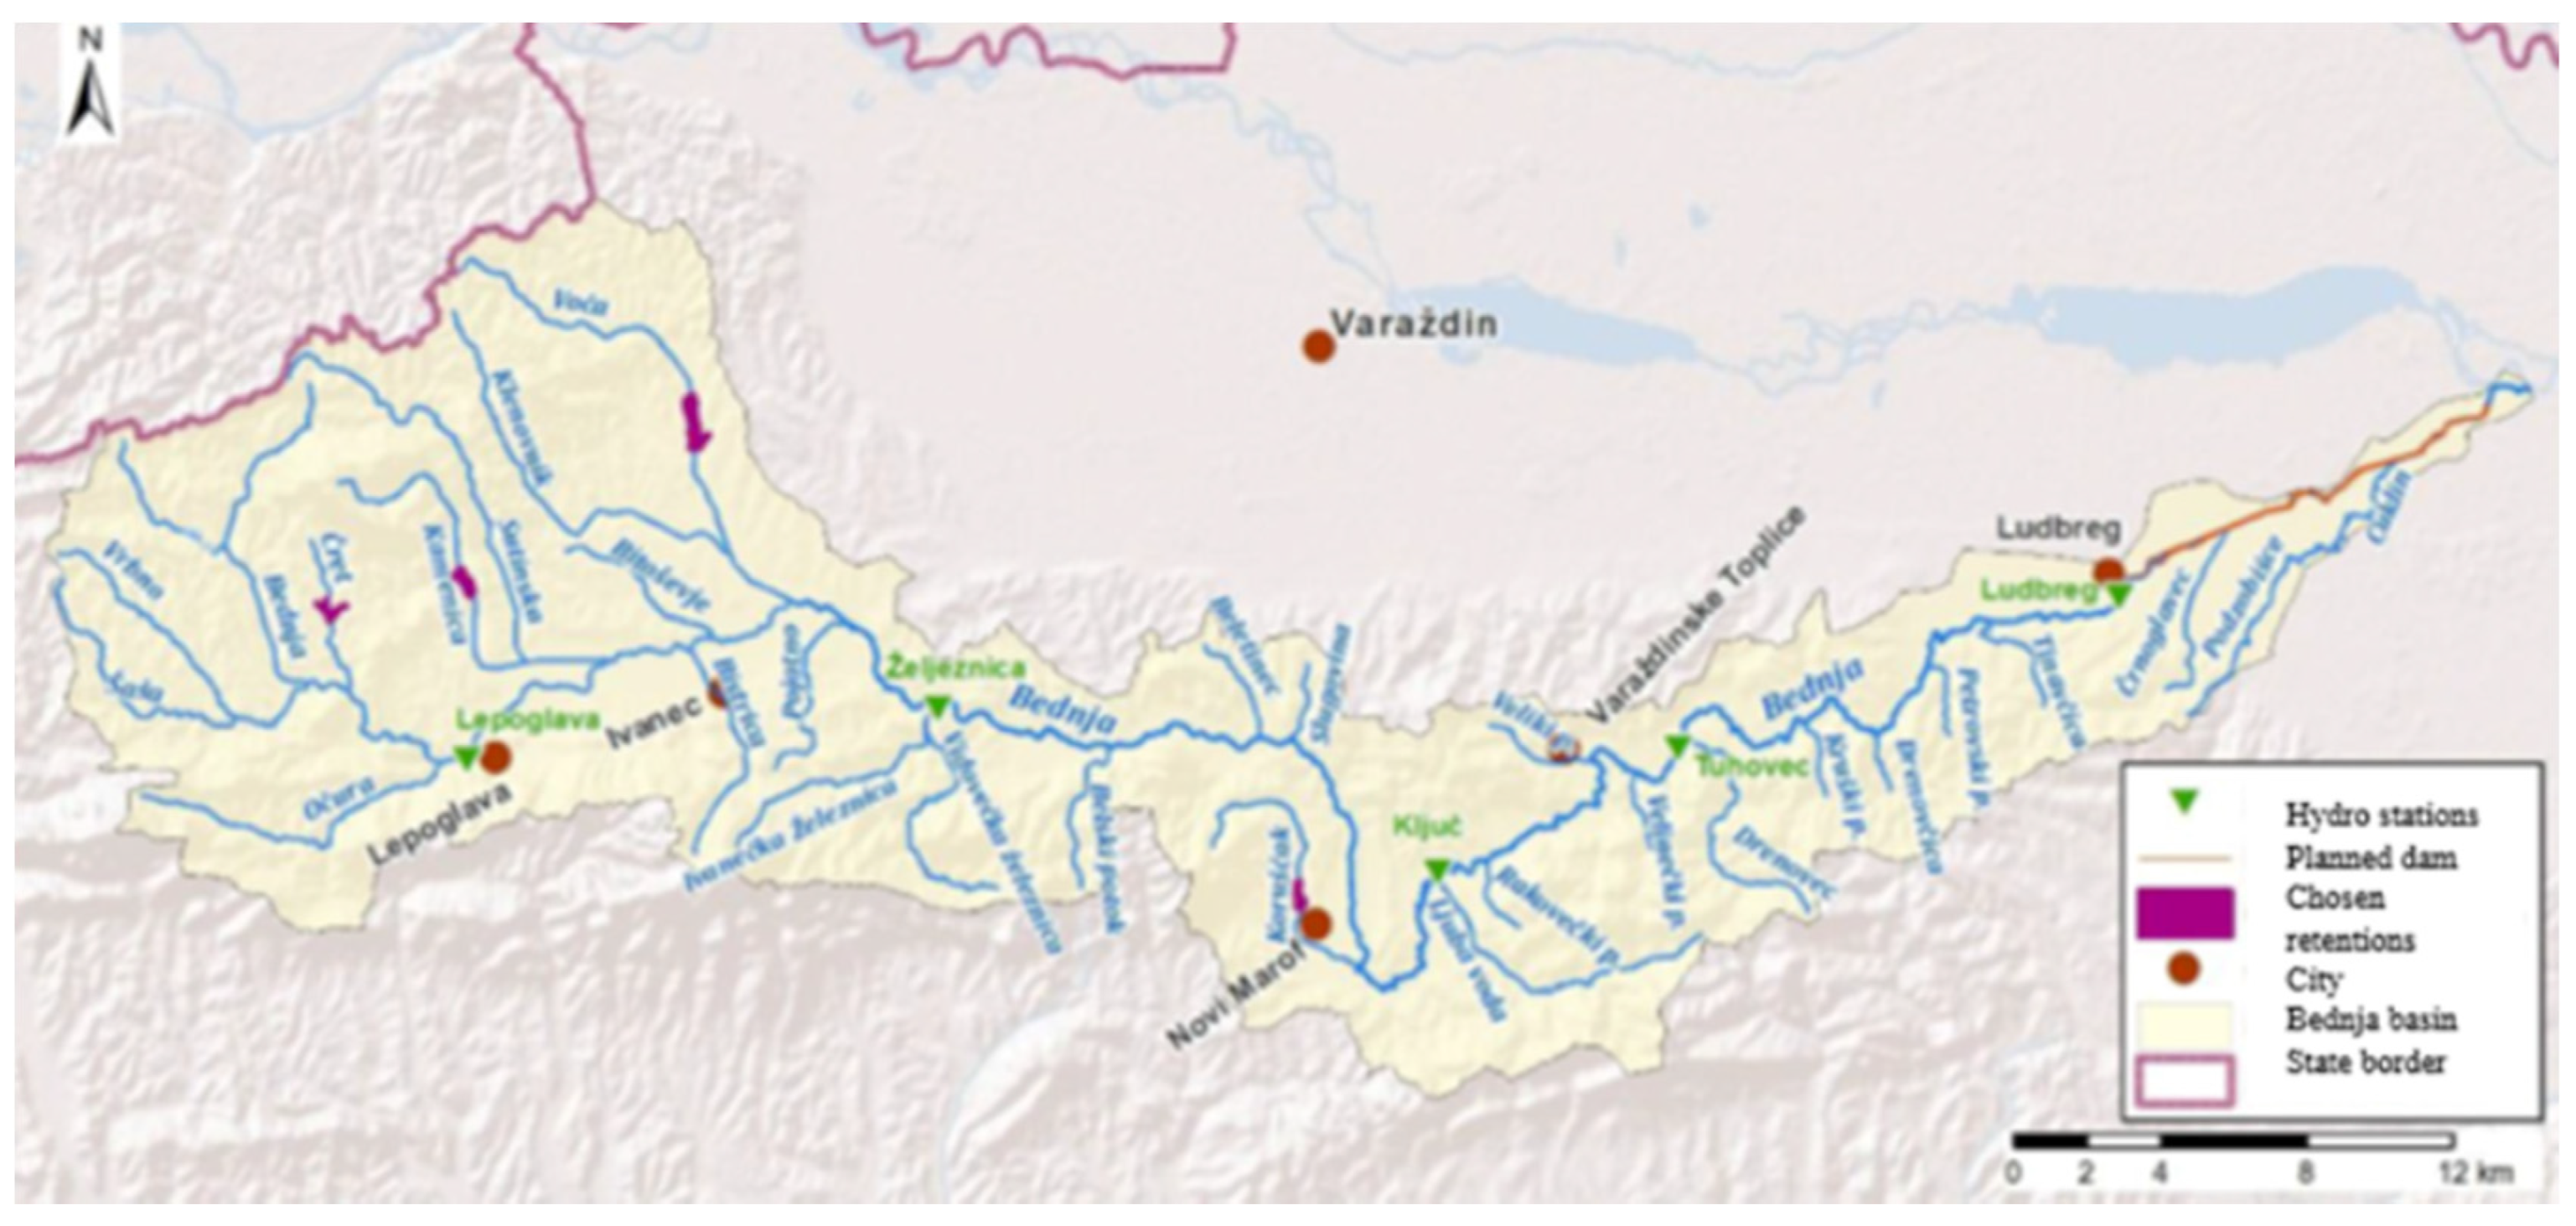
Bednja flows into the Drava River near Mali Bukovec (at a height of 136 m), and is 133 km long, while the area of its basin is 596 km2 [18]. In the Bednja basin, three relief units stand out: alluvial plain, tertiary mountains, and Paleozoic mountains. This river is selected for its torrential flow, proximity, and accessibility compared with other rivers provided in available publications [8]. Its flow and depth were measured constantly through five hydrologic measurement stations, Lepoglava, Željeznica, Ključ, Tuhovec, and Ludbreg, Figure 2.
The data on elevation, geographic coordinates, area, and maximum and minimum flow for all five stations are given in Table 1 and Table 2 [20]. The characteristics of River Bednja are its buoyant (variable) flow, its increased flow during more considerable precipitation periods, and its possibility of a drastic reduction in flow during summers [21].
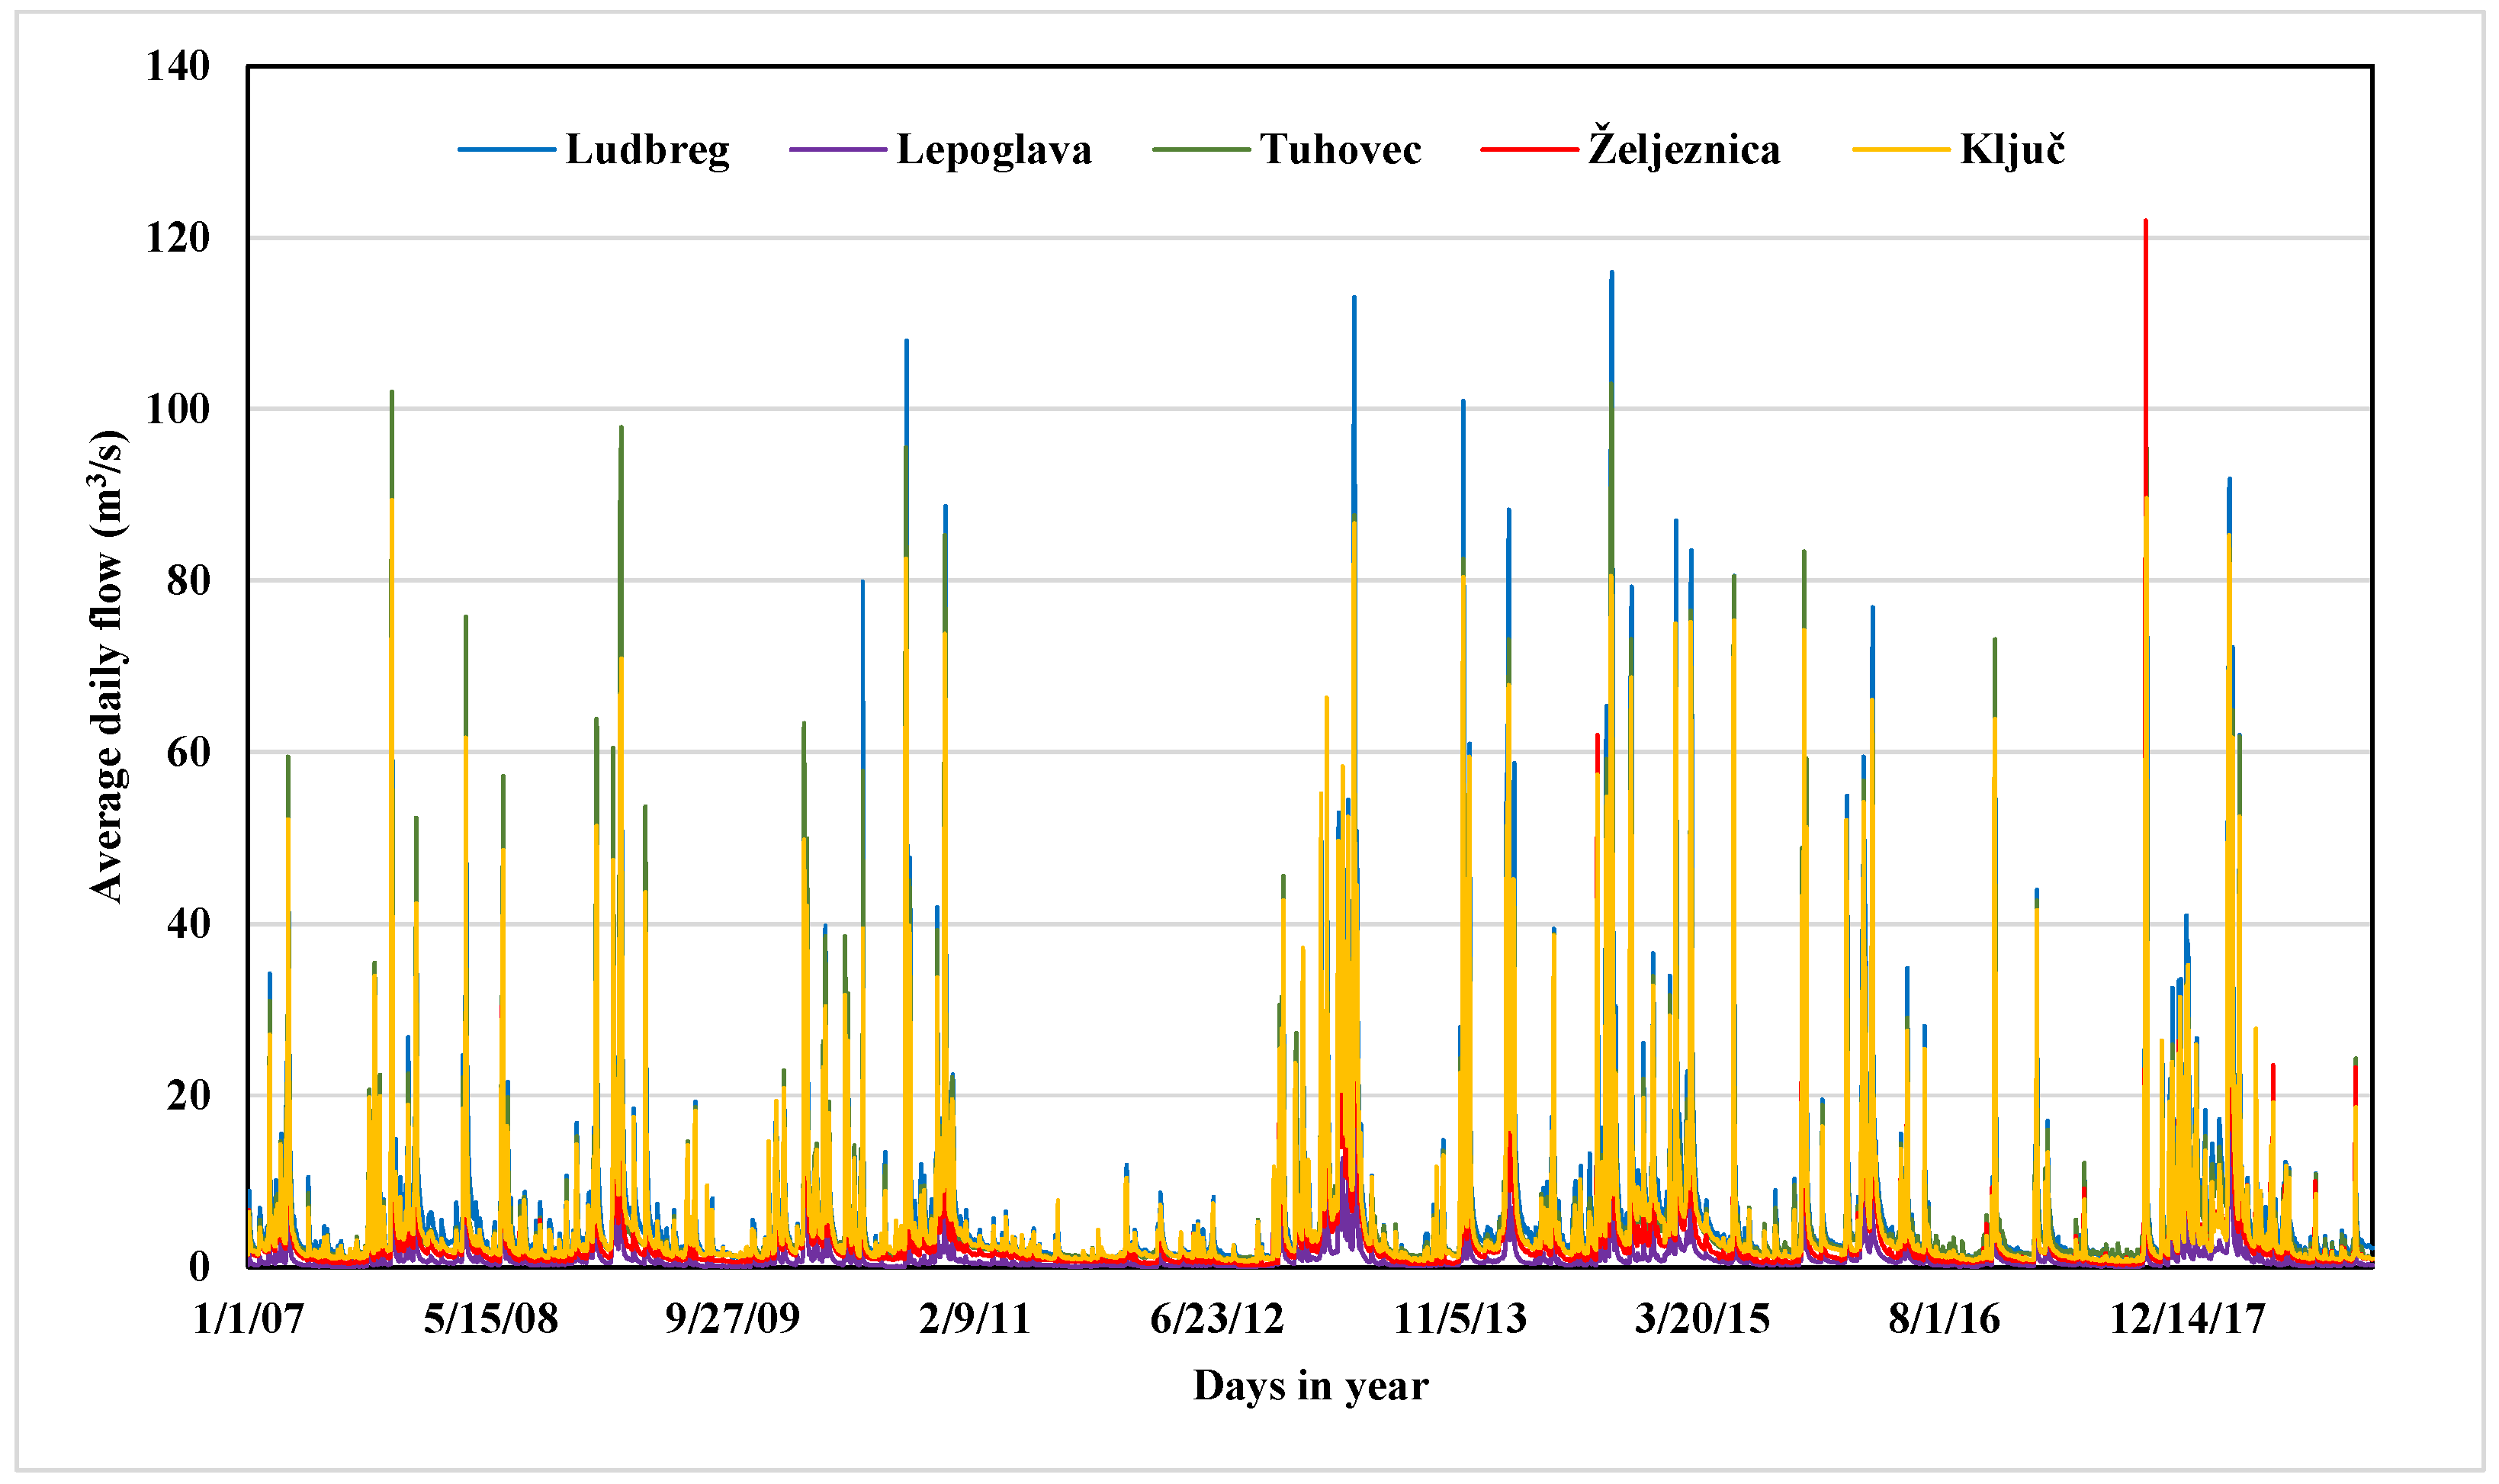
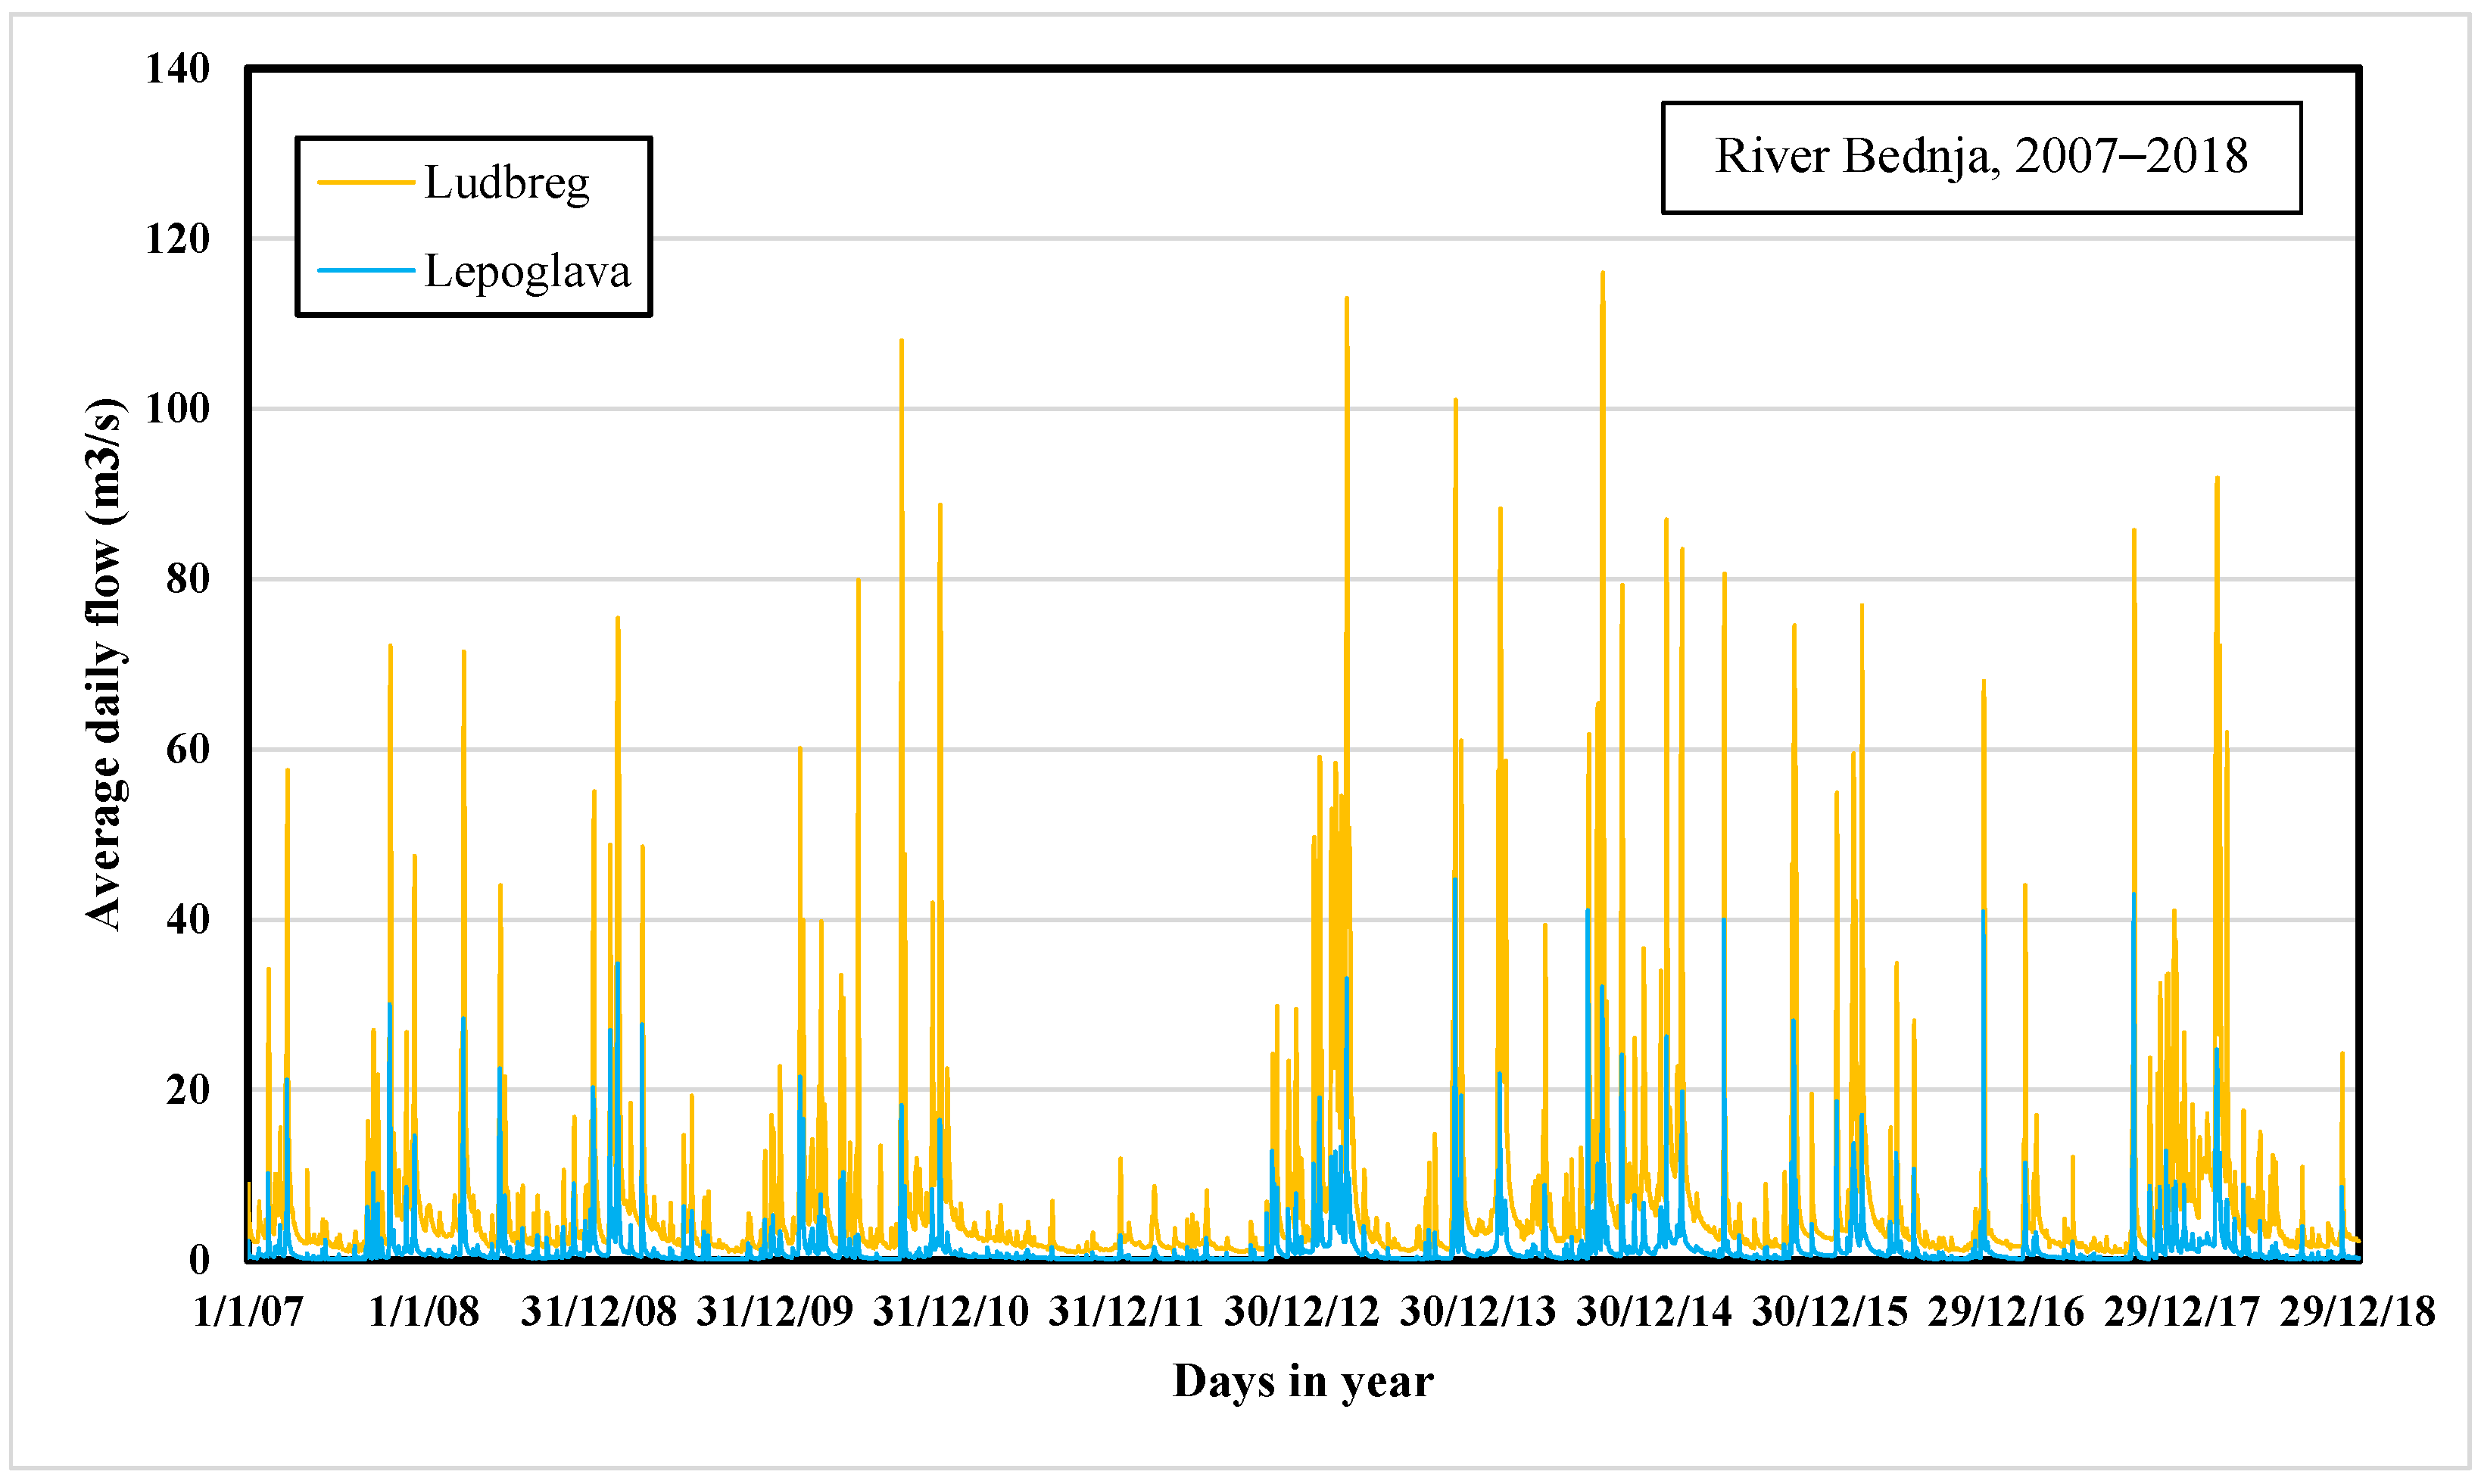
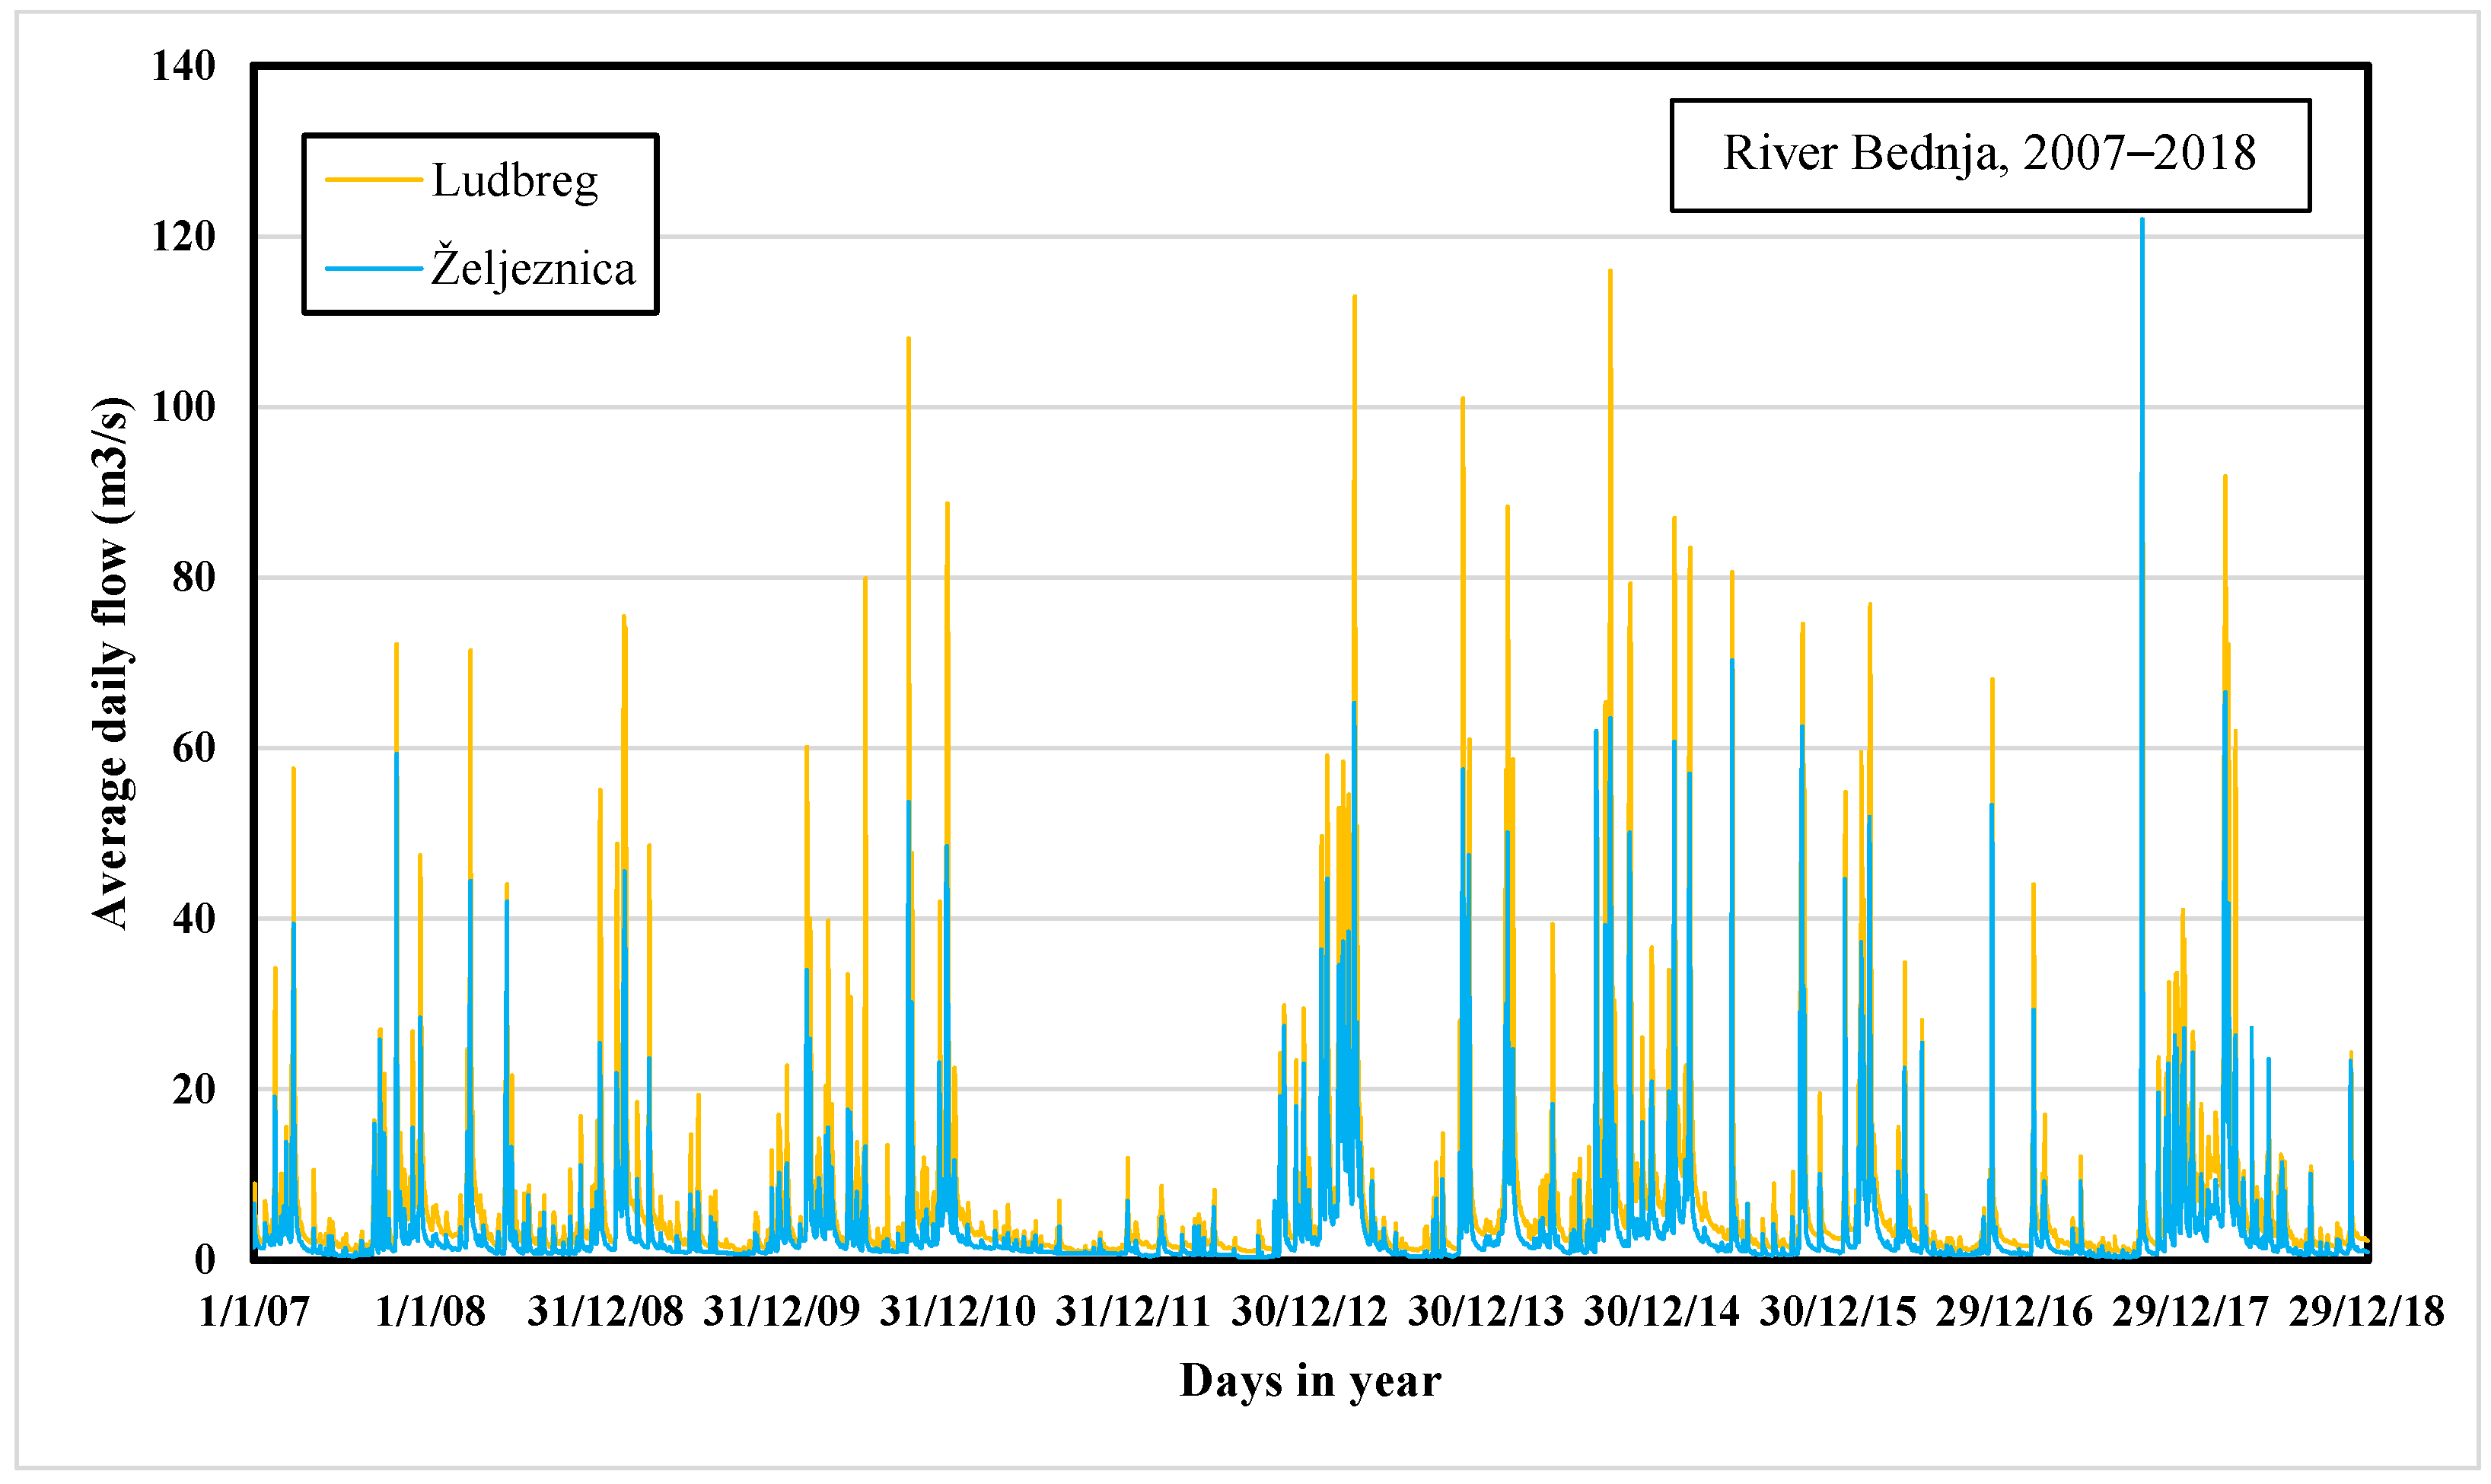
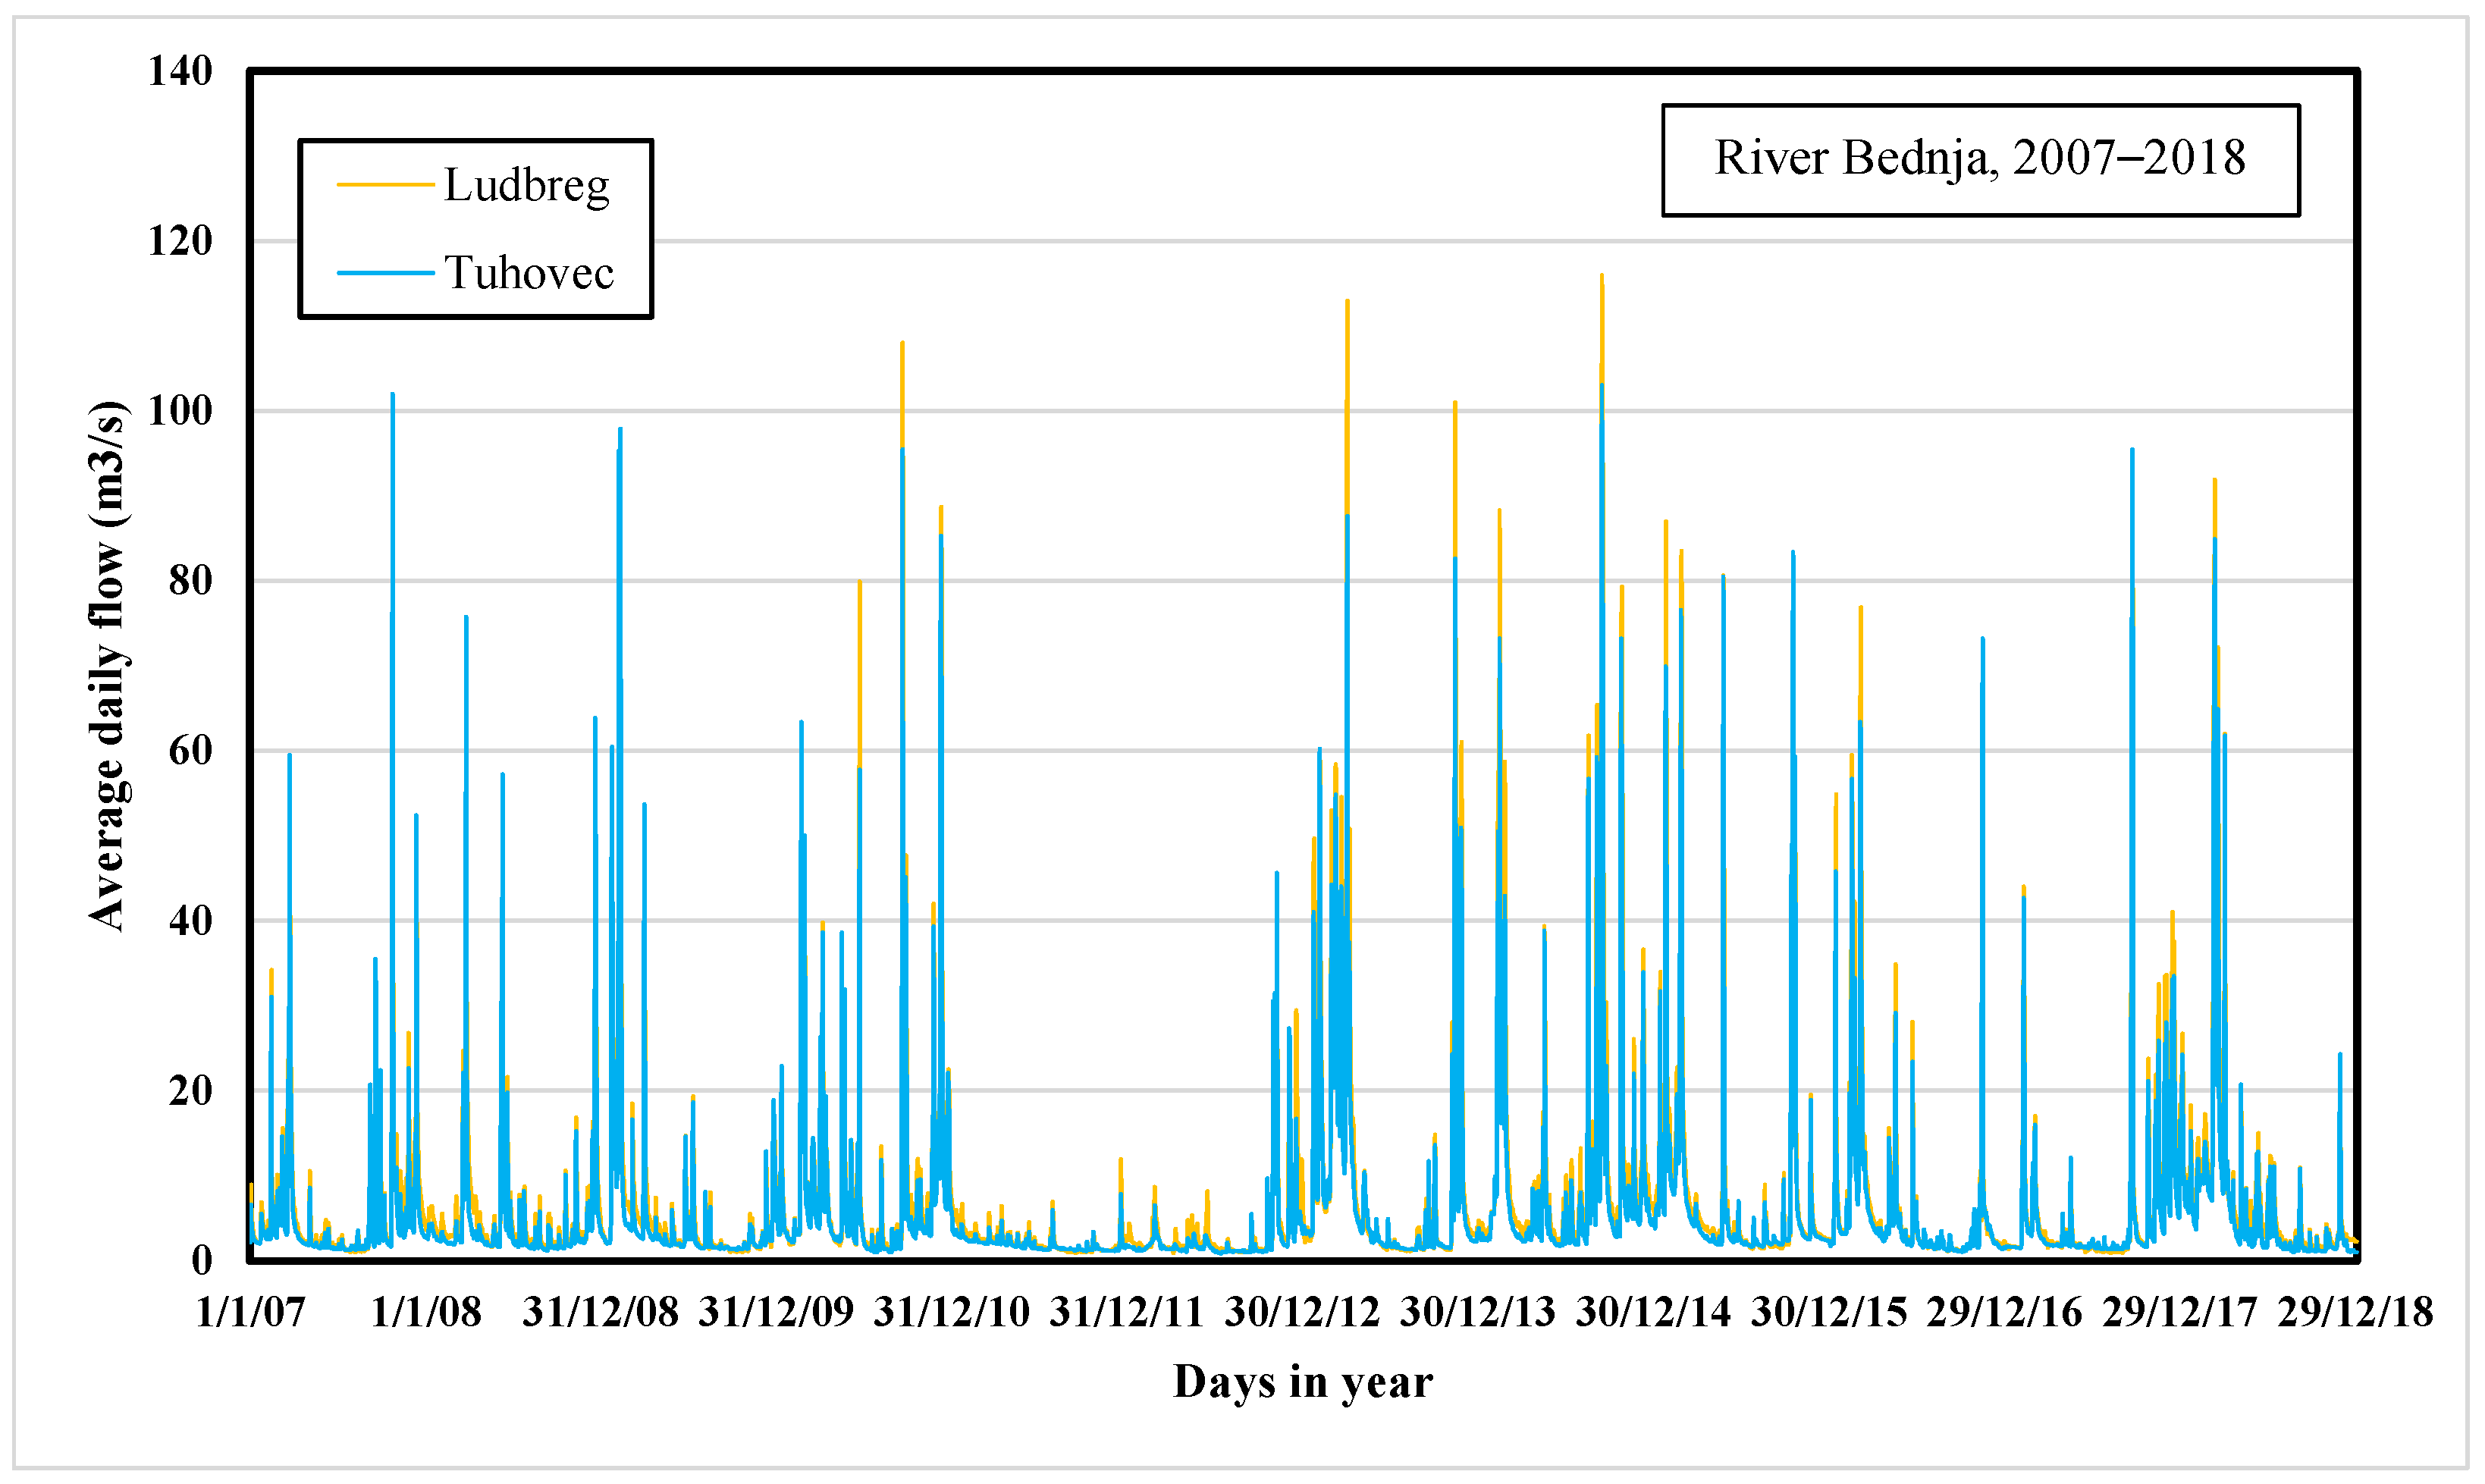
Input data for time series analysis consist of data from these five measurement stations on river flow from January 2007 to December 2018. Figure 3 shows the average daily flow of River Bednja at each measurement station. Analyzed periods, i.e., durations, were selected because continuous data were only available from this period, without the days with the unmeasured, i.e., uncalculated values. In addition, statistics related to the streamflow rate for the five measurement stations in the monitoring period are also reported in Table 3. Proceeding from upstream to downstream, we observe an increase in the minimum, mean, and maximum streamflow rates, with the lower values for the station in Lepoglava and the higher for the Ludbreg one. An exception was observed for the maximum flow recorded in Željeznica and equal to 122 m3/s. However, this peak is not reflected in the downstream stations, indicating possible flooding along the river. Furthermore, the skewness ranges from 0.80 to 0.95, indicating a positive asymmetry between the mean and median, becoming increasingly marked from upstream to downstream.
There is a similarity for all measuring stations regarding the drought period between 2011 and 2012. Furthermore, the common feature of all analyzed time series is that flows are smaller during the summer than in spring, autumn, and winter. The precipitation and melting of the snow explain as such.
Figure 3 shows that the biggest river flow oscillations occur at the Lepoglava and Ludbreg stations, which is a starting point for further and more extensive flow analysis.
3. Methodology
The proposed methodology will consist of three steps.
The first step is a definition of the correlation between average daily flows for all analyzed stations. This will be provided so that the most downstream measuring station in Ludbreg will be analyzed concerning all other downstream stations. The measuring station in Ludbreg has the most significant values of the average daily flows, so this is the reason to determine Ludbreg a “dependent” measuring station. The correlation coefficient is expected to be the smallest regarding the upstream station Lepoglava, while the correlation with the closest measuring station in Tuhovec will be the biggest compared with all other stations.
The second step is a RAPS analysis of the particular time series of the average daily flow, for each of the five analyzed measuring stations. This part of the research intends to determine any possible interruptions in the original time series of the flow. Additionally, obtained results, as well as conclusions, will give additional information about the characteristics of the river Bednja. Some discordances should be determined in the first step of the methodology.
The third step of the methodology is a RAPS analysis of the average daily flow values between all the measuring stations. This will be provided to see if the subseries obtained in the RAPS analysis from the second step have mutual correlations between the measuring stations.
The methodology conducted in this research consists of observing river flow data at five consecutive measurement stations to create the best possible input data set for the RAPS analysis.
RAPS will be made on collected and cleaned data sets of river flow to prepare a visualization concerning time. This will provide a diagram of the calculated values, so the stationarity of the flow series can be observed. This will lead to a better understanding of the series nature and give the possibility to extract insight into the river flow prediction.
RAPS is a widely used method for analyzing river flow [22] and other research areas [23,24]. RAPS gives a visual determination of subseries from input data series using frequent statistical parameters. It provides insight into the occurrence of the trends, data grouping, fluctuations, and similar appearances during the time, using average value and standard deviations of the input data from the observed time series:
where Yt is the value of the analyzed member (parameter) of the considered time series, Y is the average value of the regarded time series, Sy is the standard deviation of the supposed time series, n is the number of members of the considered time series, and k = 1, 2, …, n, where n is a counter during summation.
The data provided with the RAPS method will be used in correlation analysis to observe the association between data from five different measurement stations. In correlated data, the change in the magnitude of 1 variable is associated with a difference in the importance of another variable, either in the exact (positive correlation) or the opposite (negative correlation) direction [25]. In this research, the Pearson correlation coefficient is used on RAPS values. The Pearson coefficient ranges from −1 to +1, where 0 indicates no linear association, and the relationship becomes stronger as the coefficient value approaches an absolute value of 1.
4. Results and Discussion
4.1. Correlation Analysis
The first step of the research/presented methodology is to analyze the correlations between all the measuring stations. In this step, as mentioned earlier, all correlations will be obtained concerning the measuring station in Ludbreg, the most downstream measuring station. A comparison with the average daily flows will also be presented within the correlation to see and explain connections.
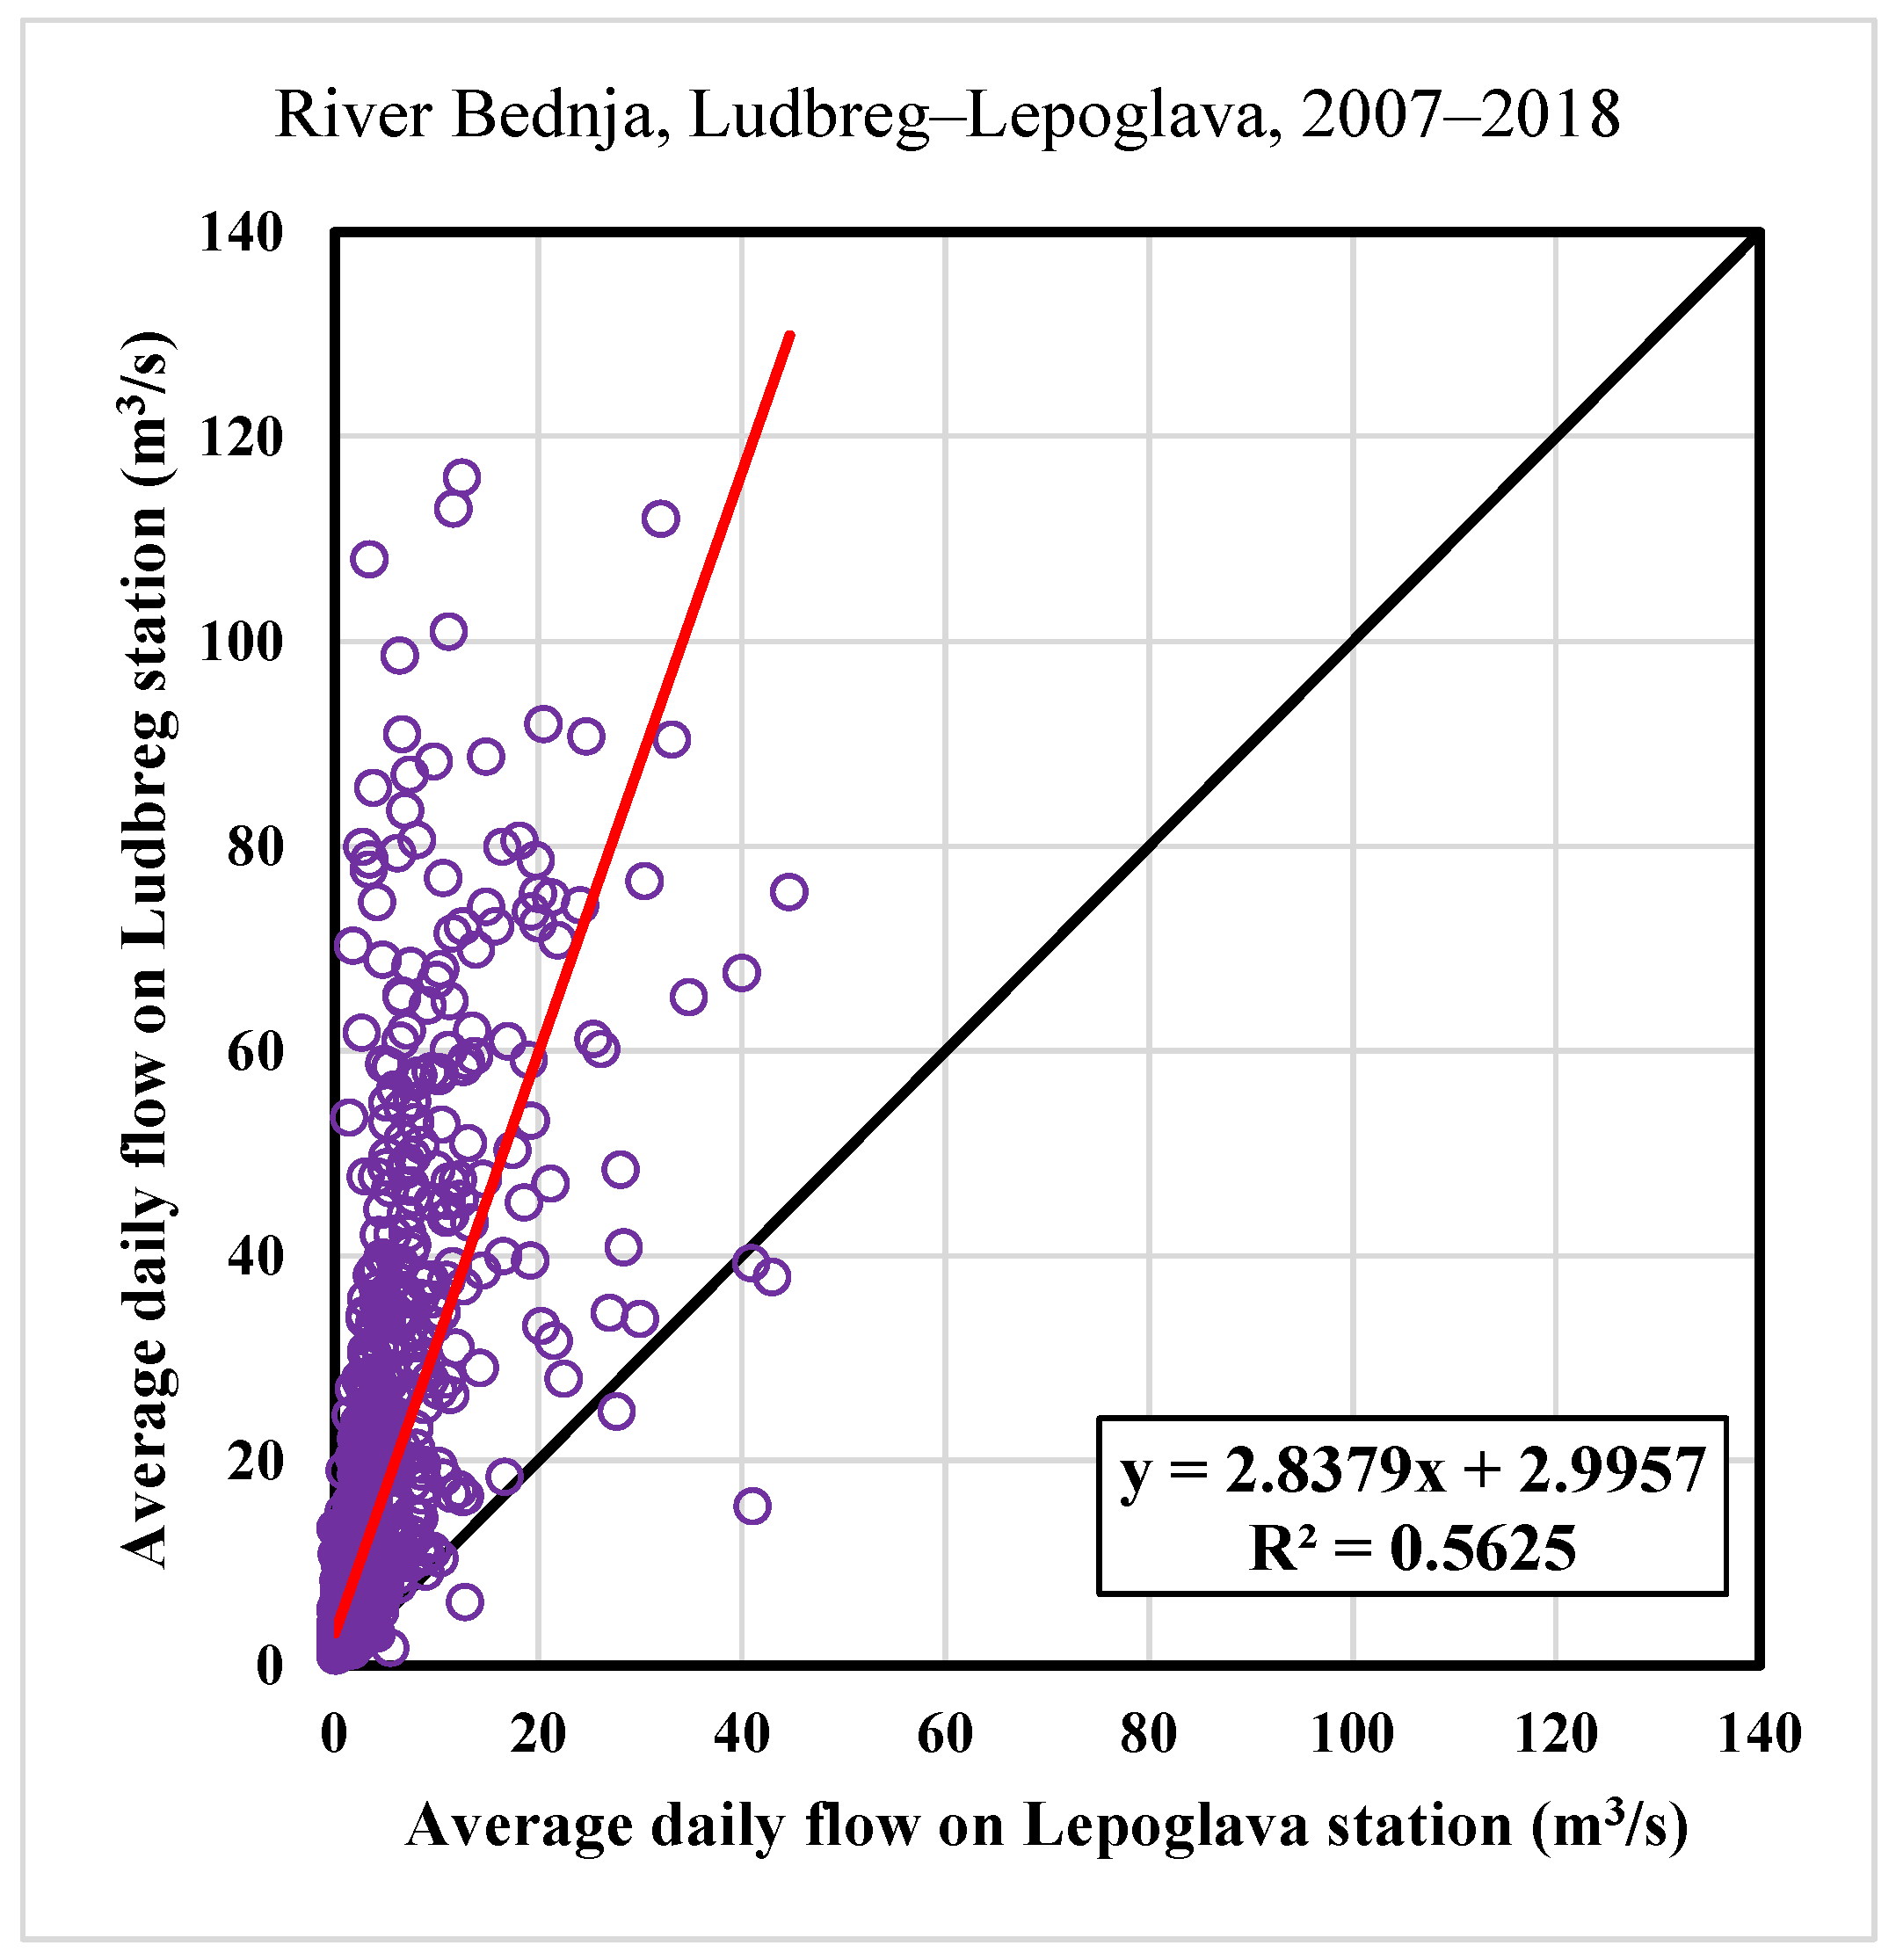
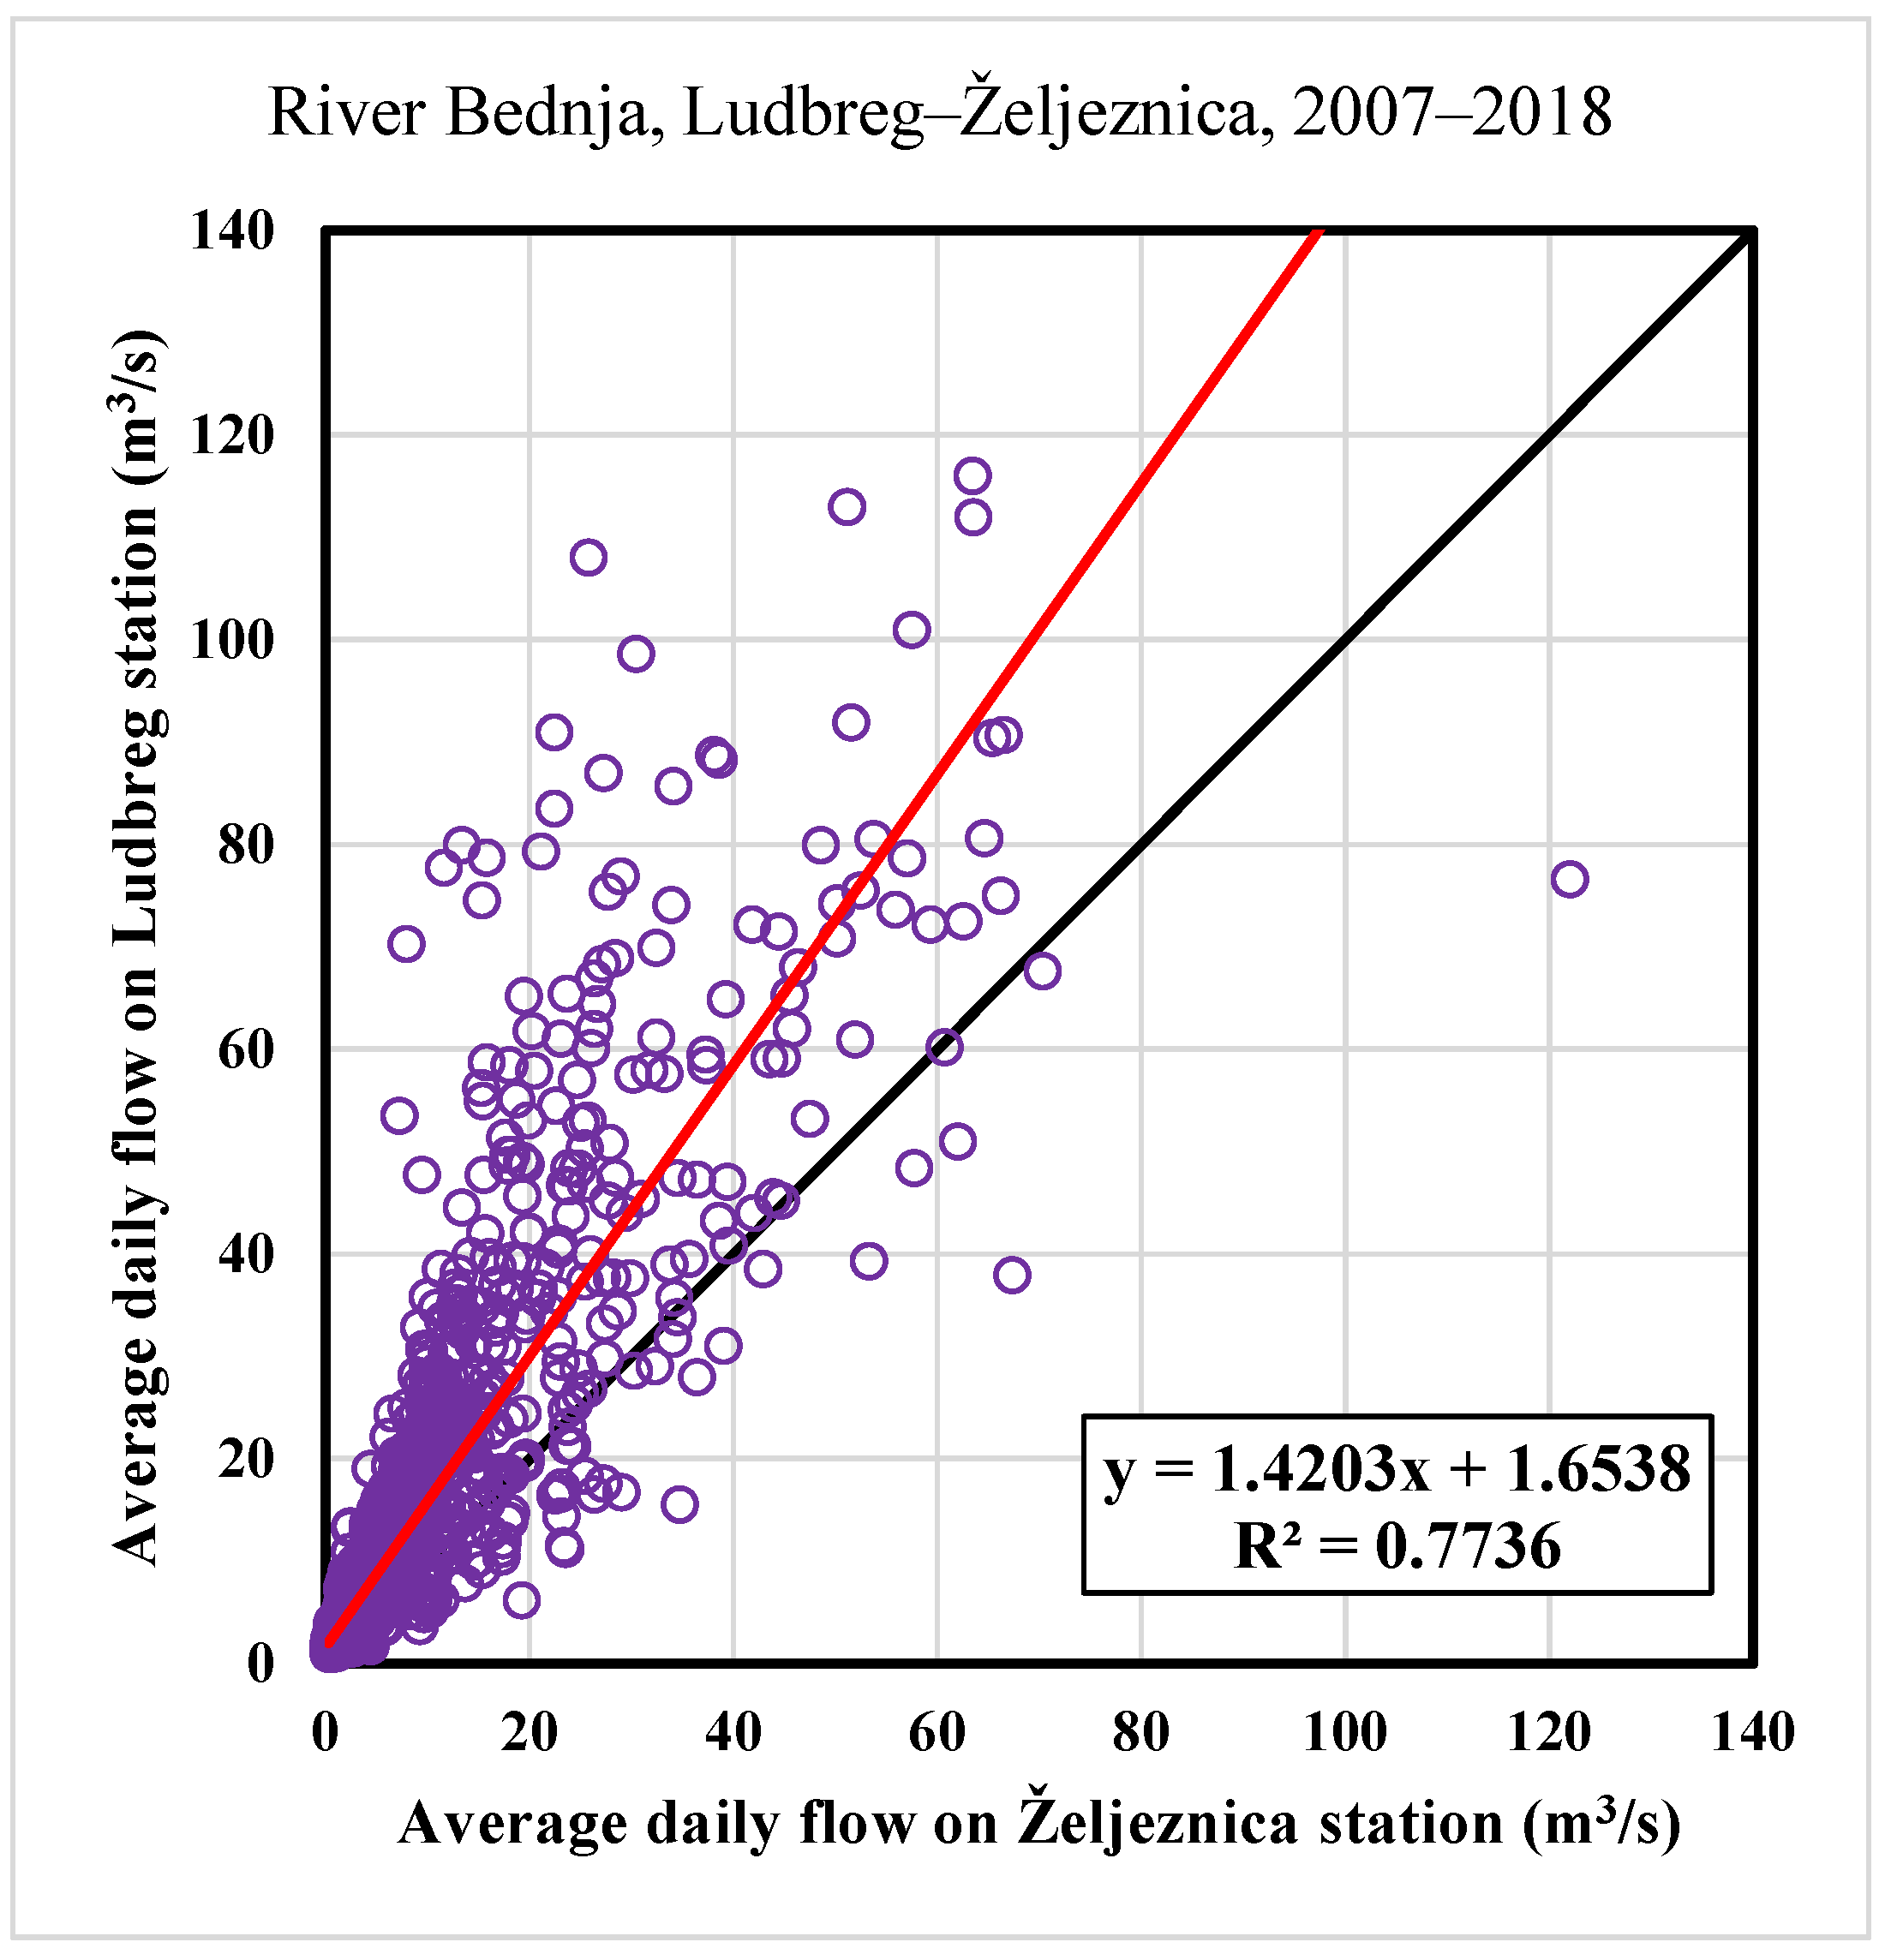
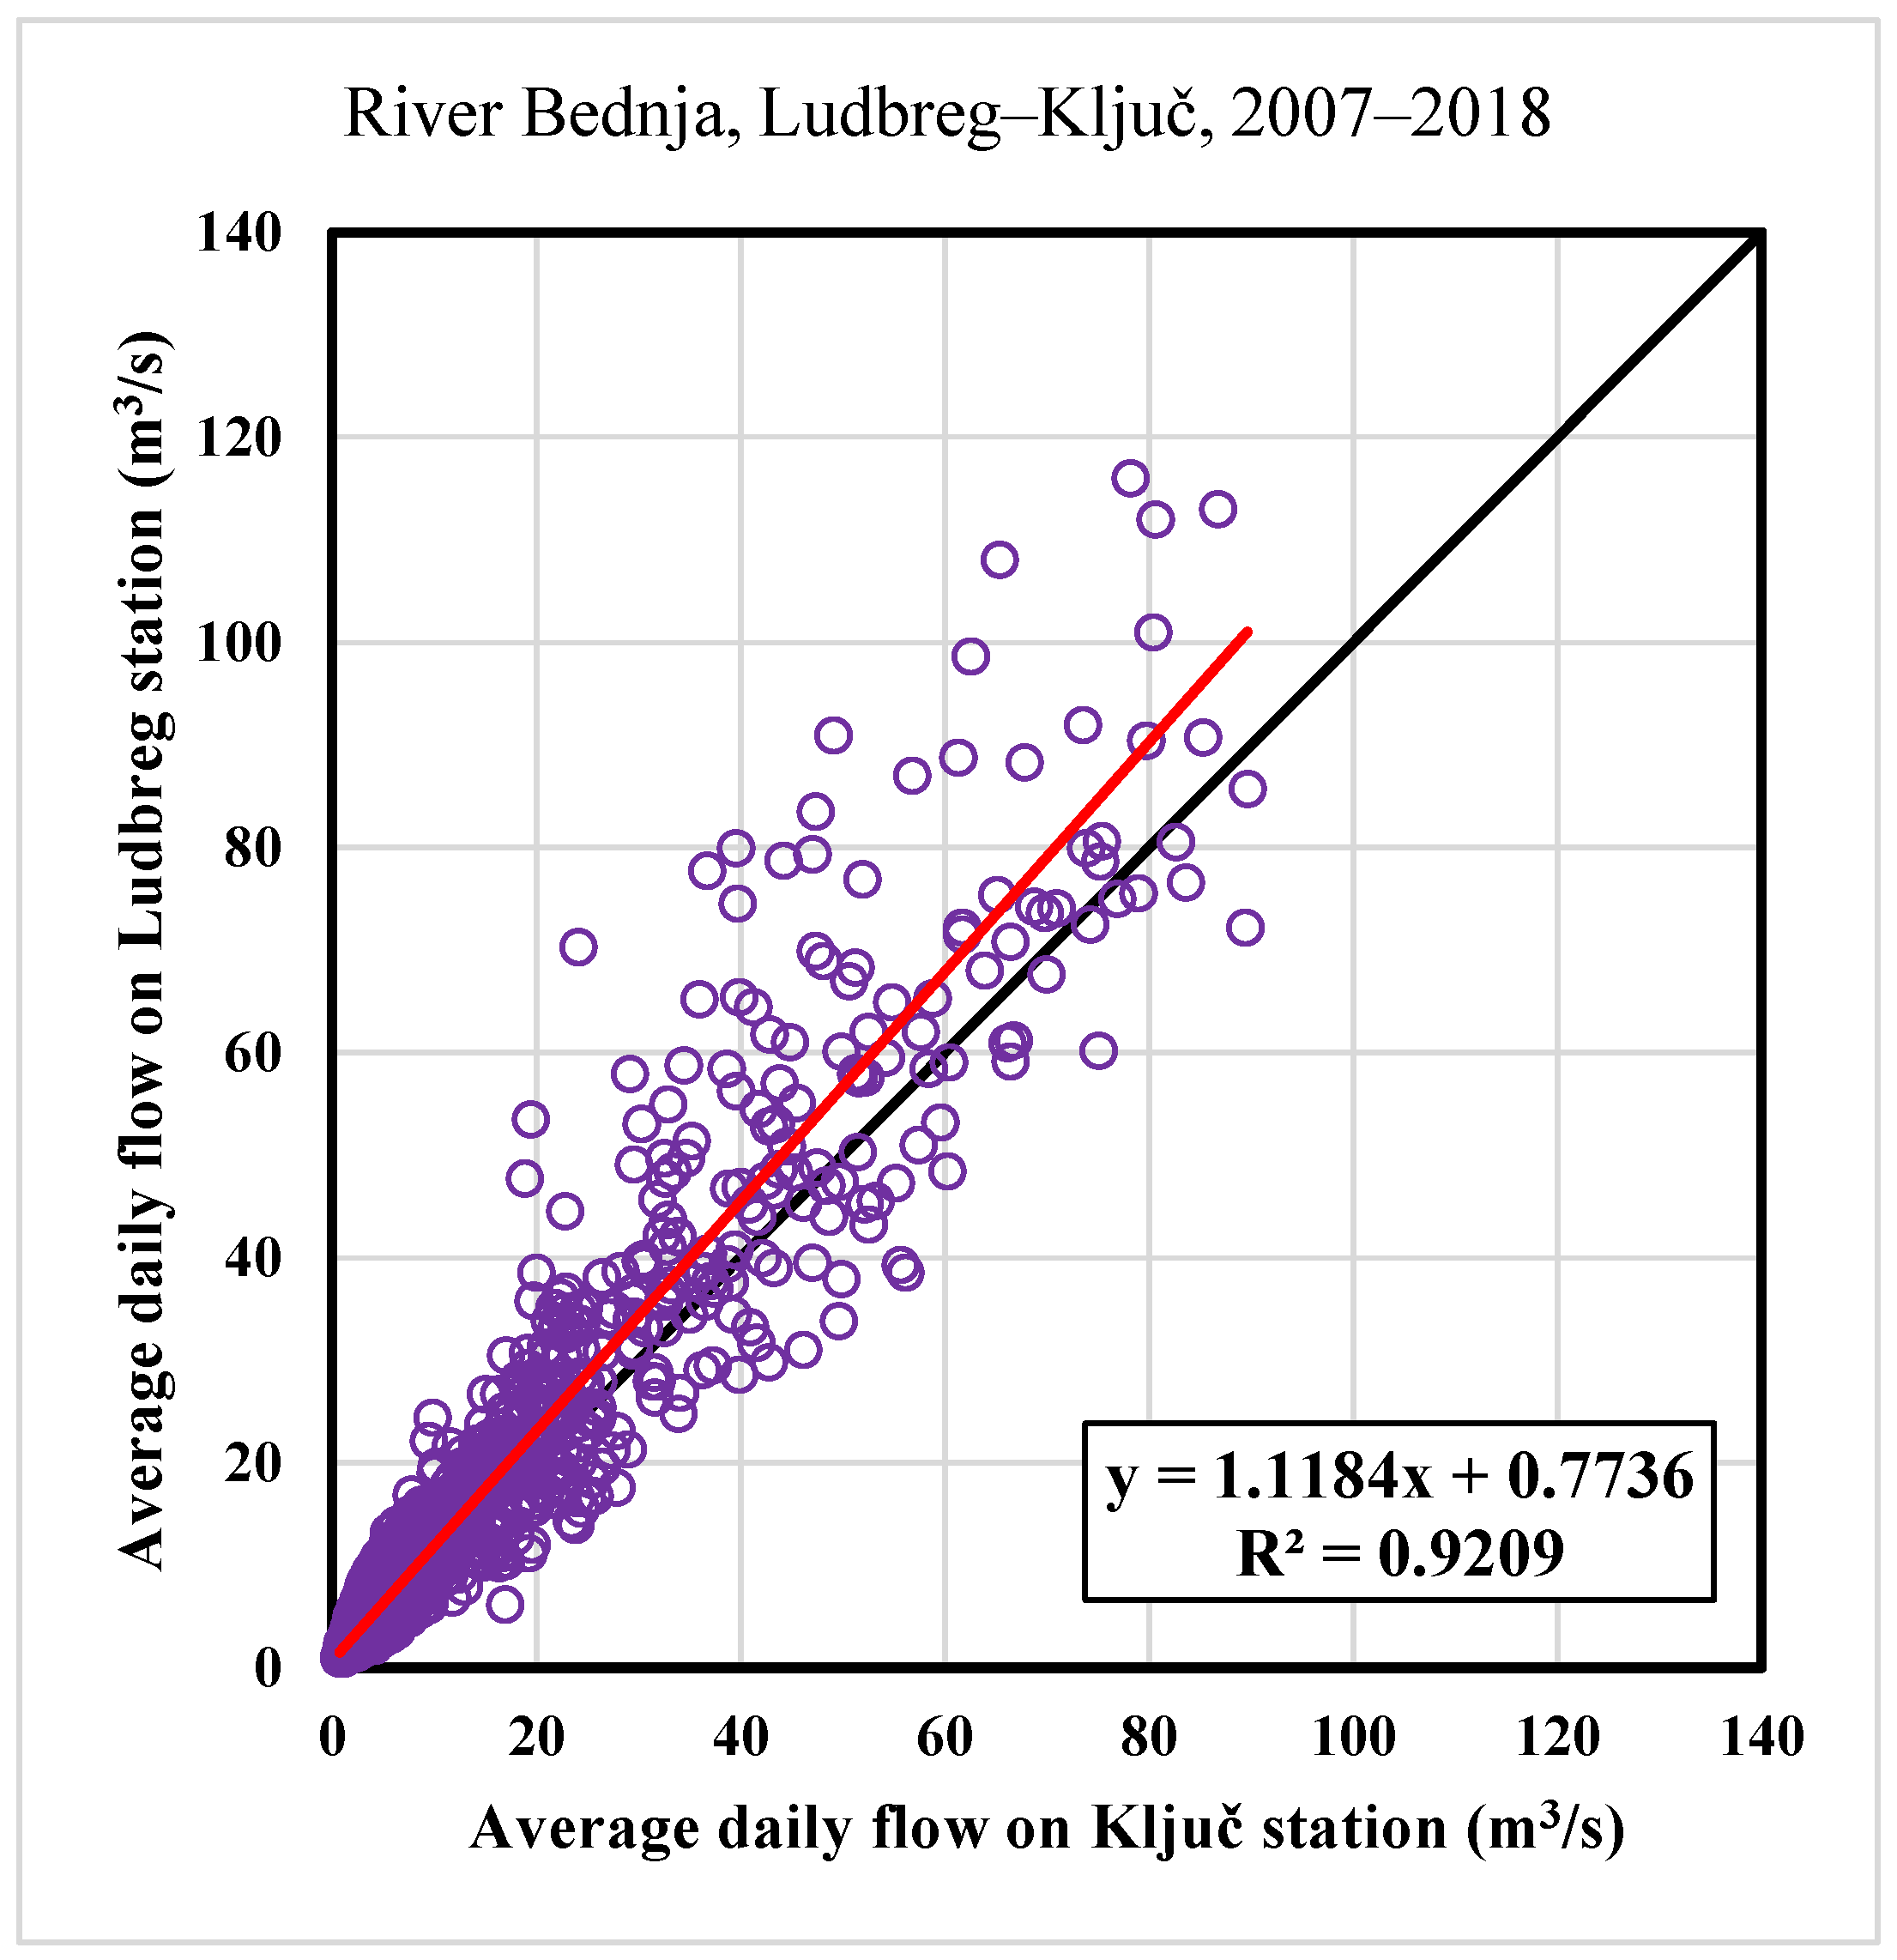
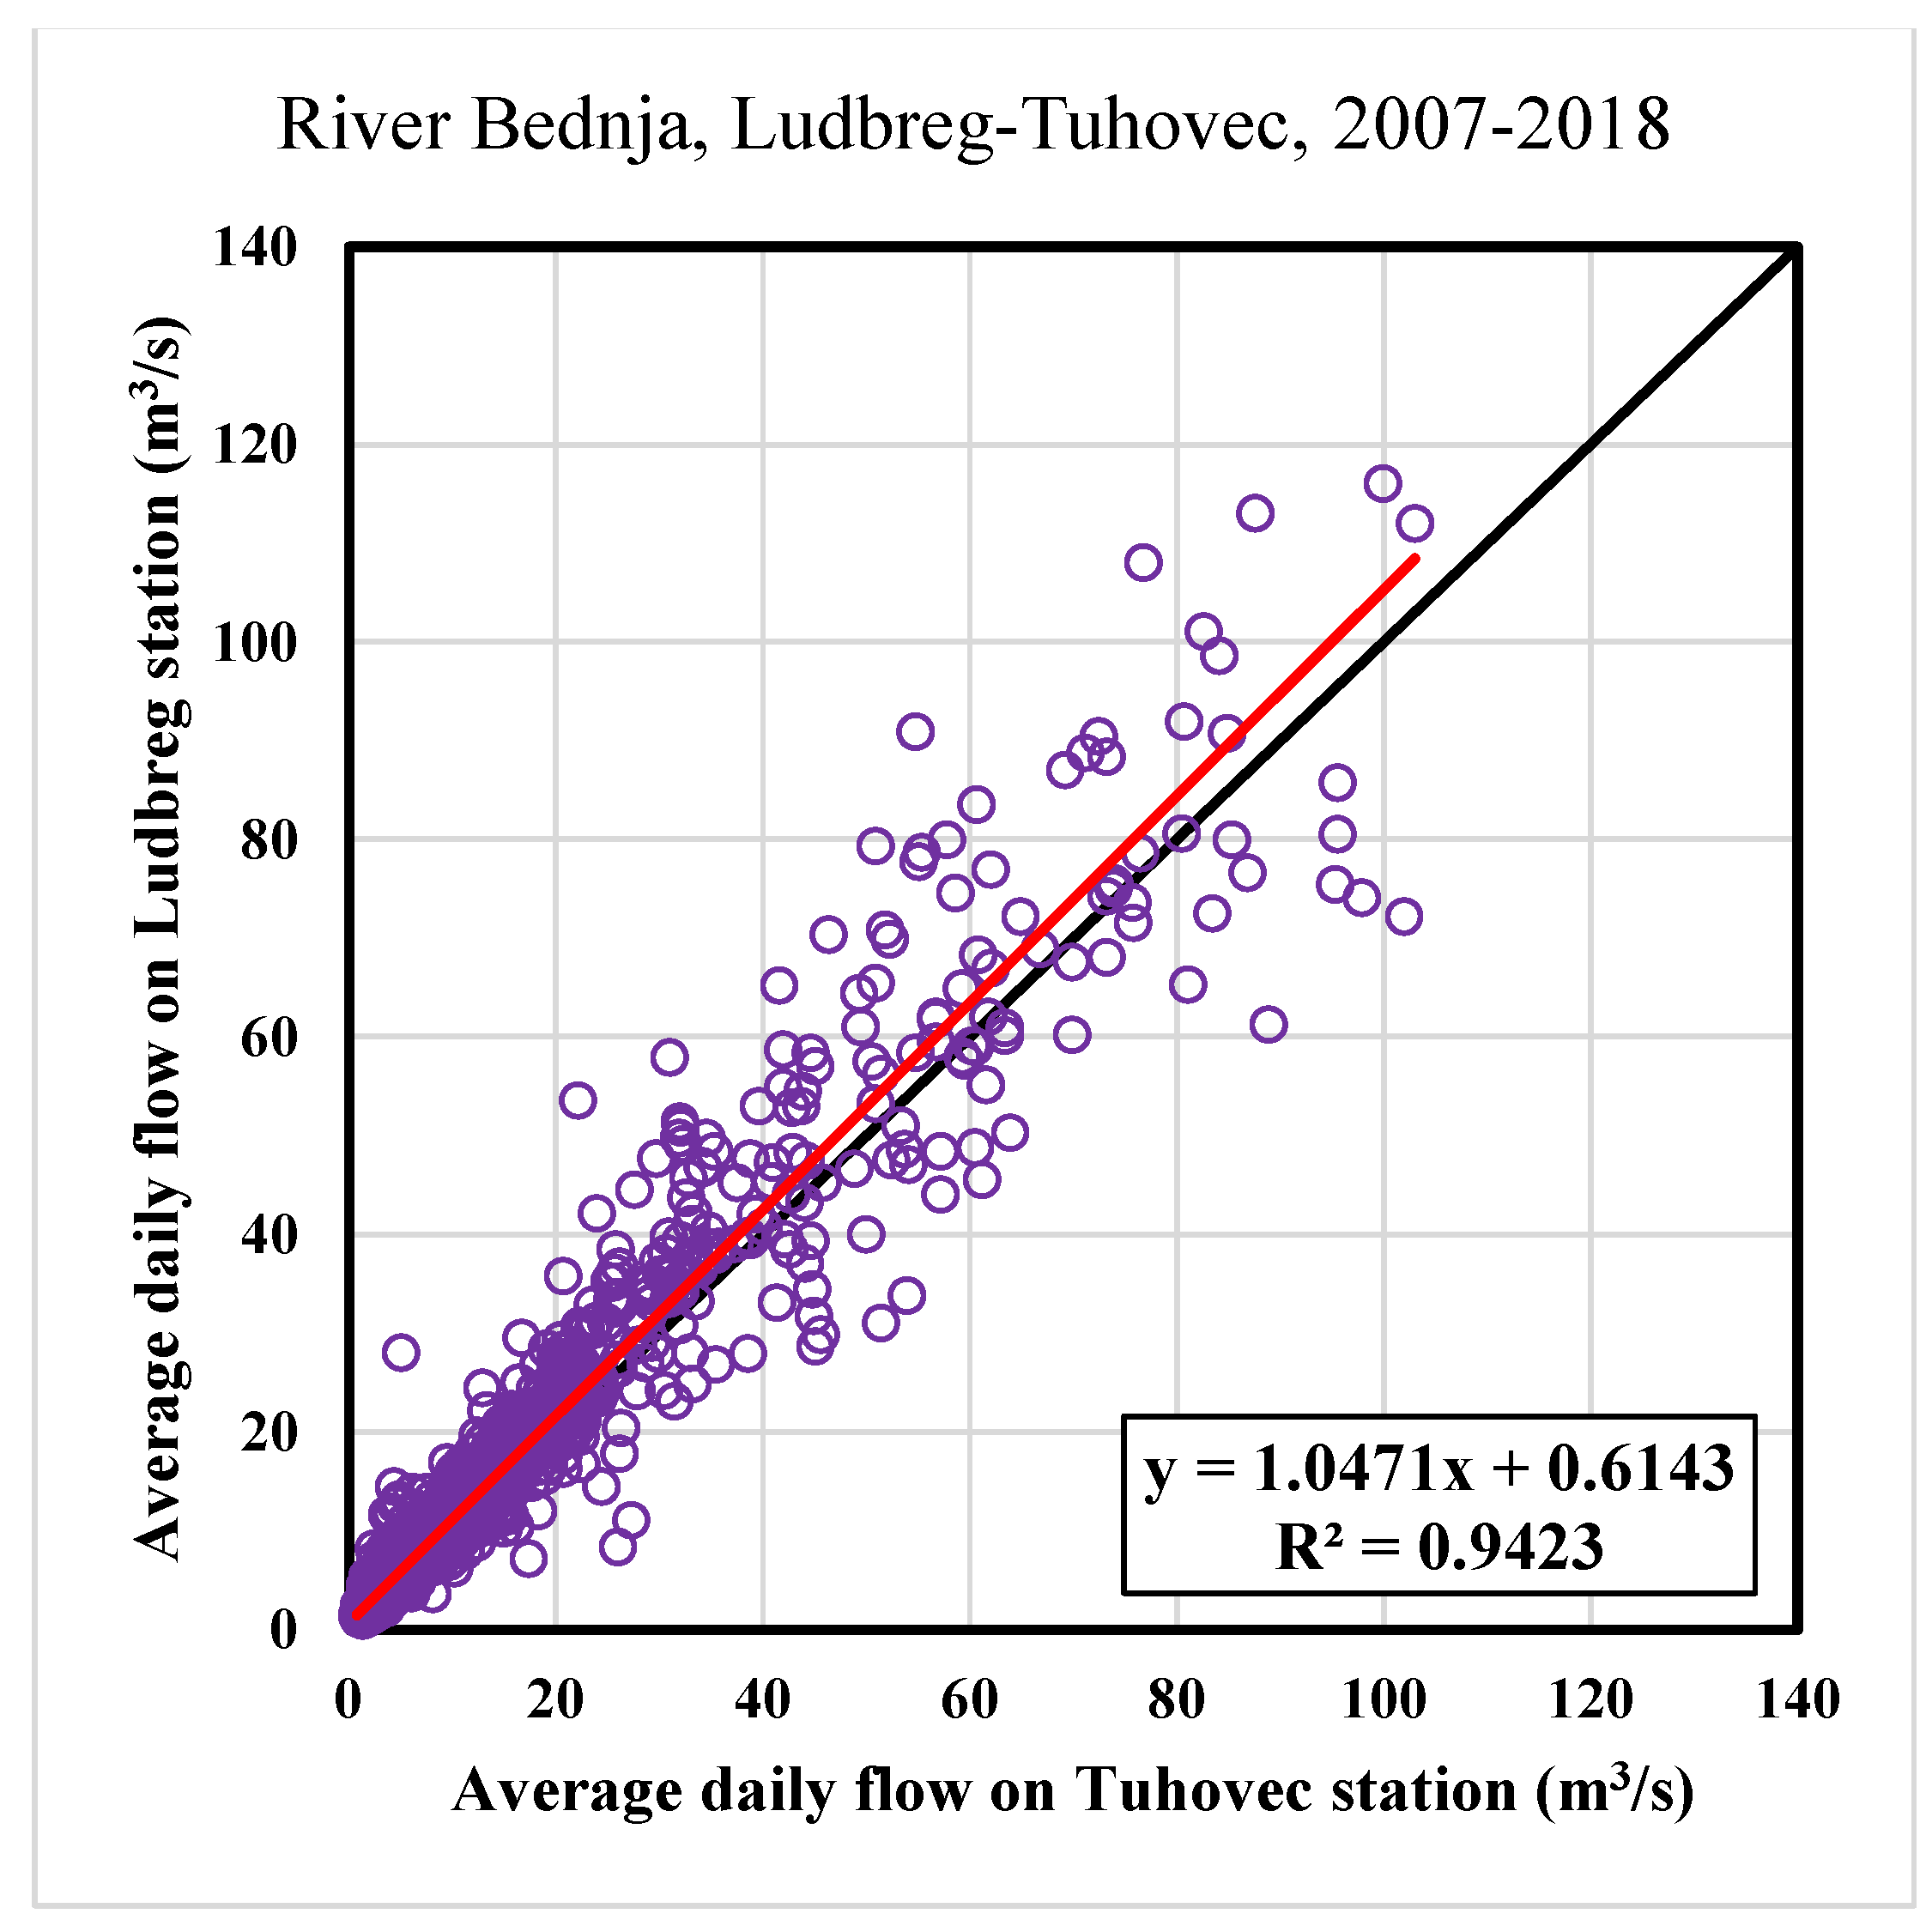
In particular, Figures 4, 6, 8 and 10 provide a comparison between the time series of the average daily flows. In contrast, Figures 5, 7, 9 and 11 provide the correlation between the average daily flows of the different stations, with the regression line in red and the 1:1 line in black. The comparison of the average daily flows for the measuring stations in Ludbreg and Lepoglava (Figure 4) showed a lower correlation, since Ludbreg is the most downstream station and Lepoglava is the most upstream station, with an R2 value equal to 0.5625 (see Figure 5). Moving downstream, the comparison between the measuring stations in Ludbreg and Željeznica (Figure 6) highlighted a higher correlation, with R2 = 0.7736 (Figure 7), which should be related to a significant increase in flow rates passing from the station of Lepoglava to the Željeznica one. Getting closer to the downstream area of the Bednja River, a considerable correlation increase was observed between the stations in Ključ and Ludbreg, with R2 = 0.9209 (Figure 8 and Figure 9). However, a higher correlation was computed between Tuhovec and Ludbreg, with R2 = 0.9423 (Figure 10 and Figure 11).
Overall, the closer a single measuring station is to Ludbreg, the smaller the flow differences and the more significant the correlation. At the upstream station in Lepoglava, the flows are the smallest, while the flows at the downstream station in Ludbreg are the biggest. The impact of the tributaries explains as such in Figure 2.
An overall perspective of the correlation between streamflow for the different monitoring stations was provided based on the cross-correlation function XCF. After calculating the cross-correlation between the other time series, the correlation peak was detected in intensity and lag time. The peak can be expressed as:
where s is the size of the time series, equal to the monitoring period, and τ is the lag time [26].
Table 4 provides the cross-correlation peaks matrix, computed for the five measurement stations. As can be seen, a peak reduction can be observed as the distance between the stations increases. In particular, the lower correlation was computed between Lepoglava and Ludbreg, the top-most and bottom-most stations, respectively. Higher correlations were observed between nearby stations, with values of 0.93 between Lepoglava and Željeznica, 0.95 between Željeznica and Ključ, 0.98 between Ključ and Tuhovec, and 0.97 between Tuhovec and Ludbreg.
Table 5 provides the cross-correlation lag times matrix for the five measurement stations. In particular, lag times were between −1 day and 1 day. This indicates that the effects of an increase (or reduction) in streamflow measured at Lepoglava can be observed after one day at the measurement stations of Tuhovec and Ludbreg and in less than one day at the stations of Željeznica and Ključ. Moreover, nearby stations show lag times of 0, indicating how flood or low events measured at a given station are reflected at the neighboring station in less than 24 h.
4.2. RAPS Analysis
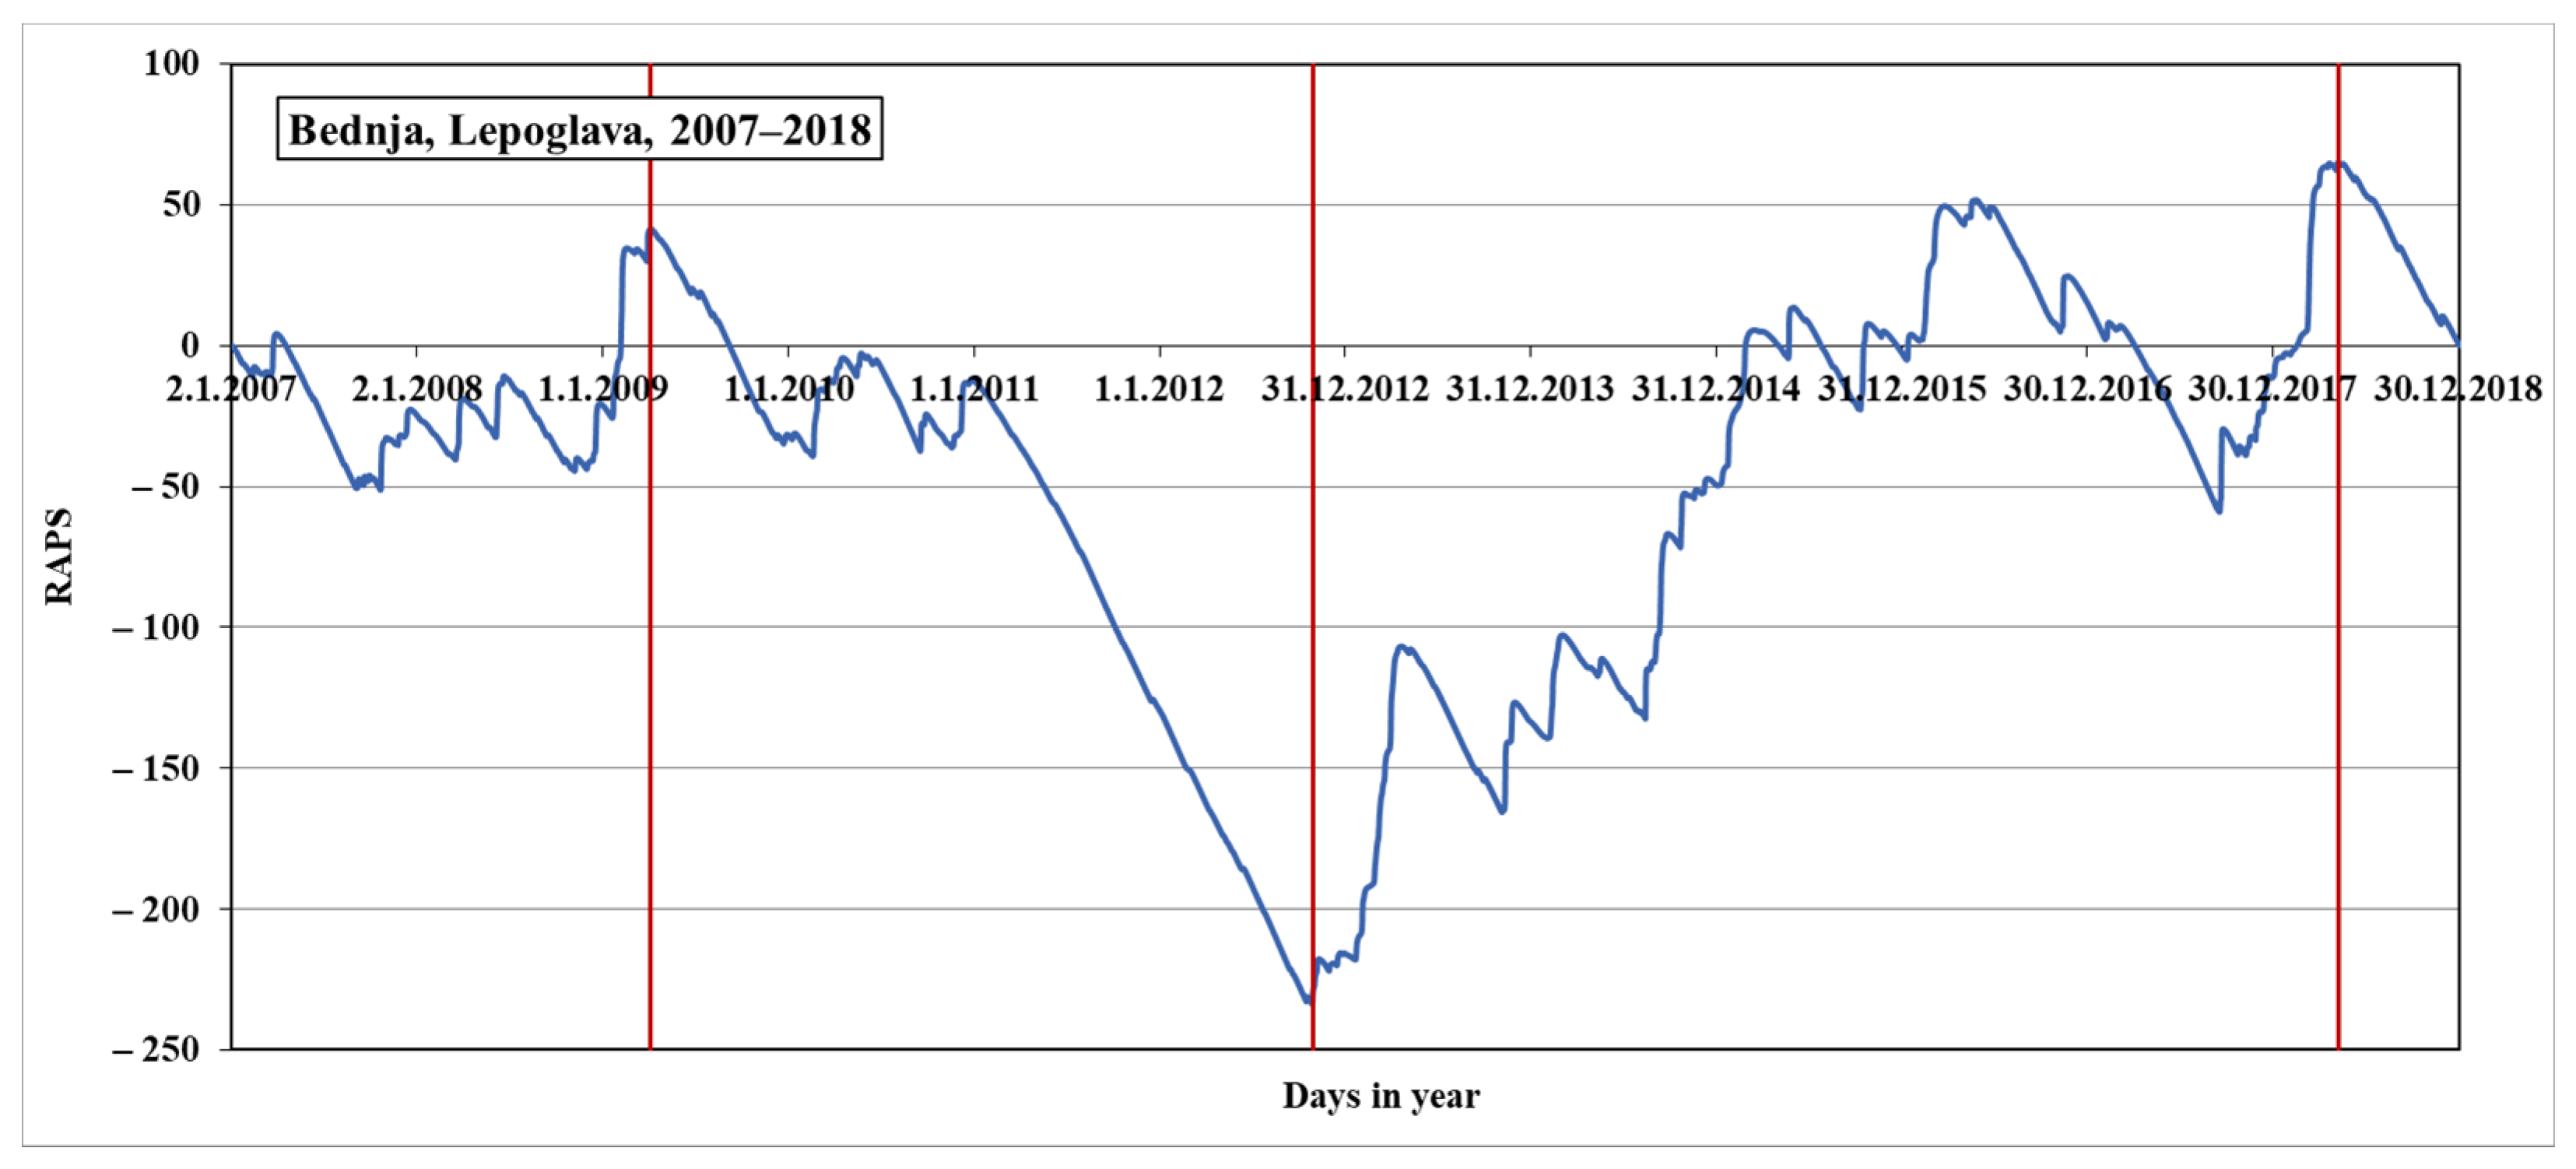
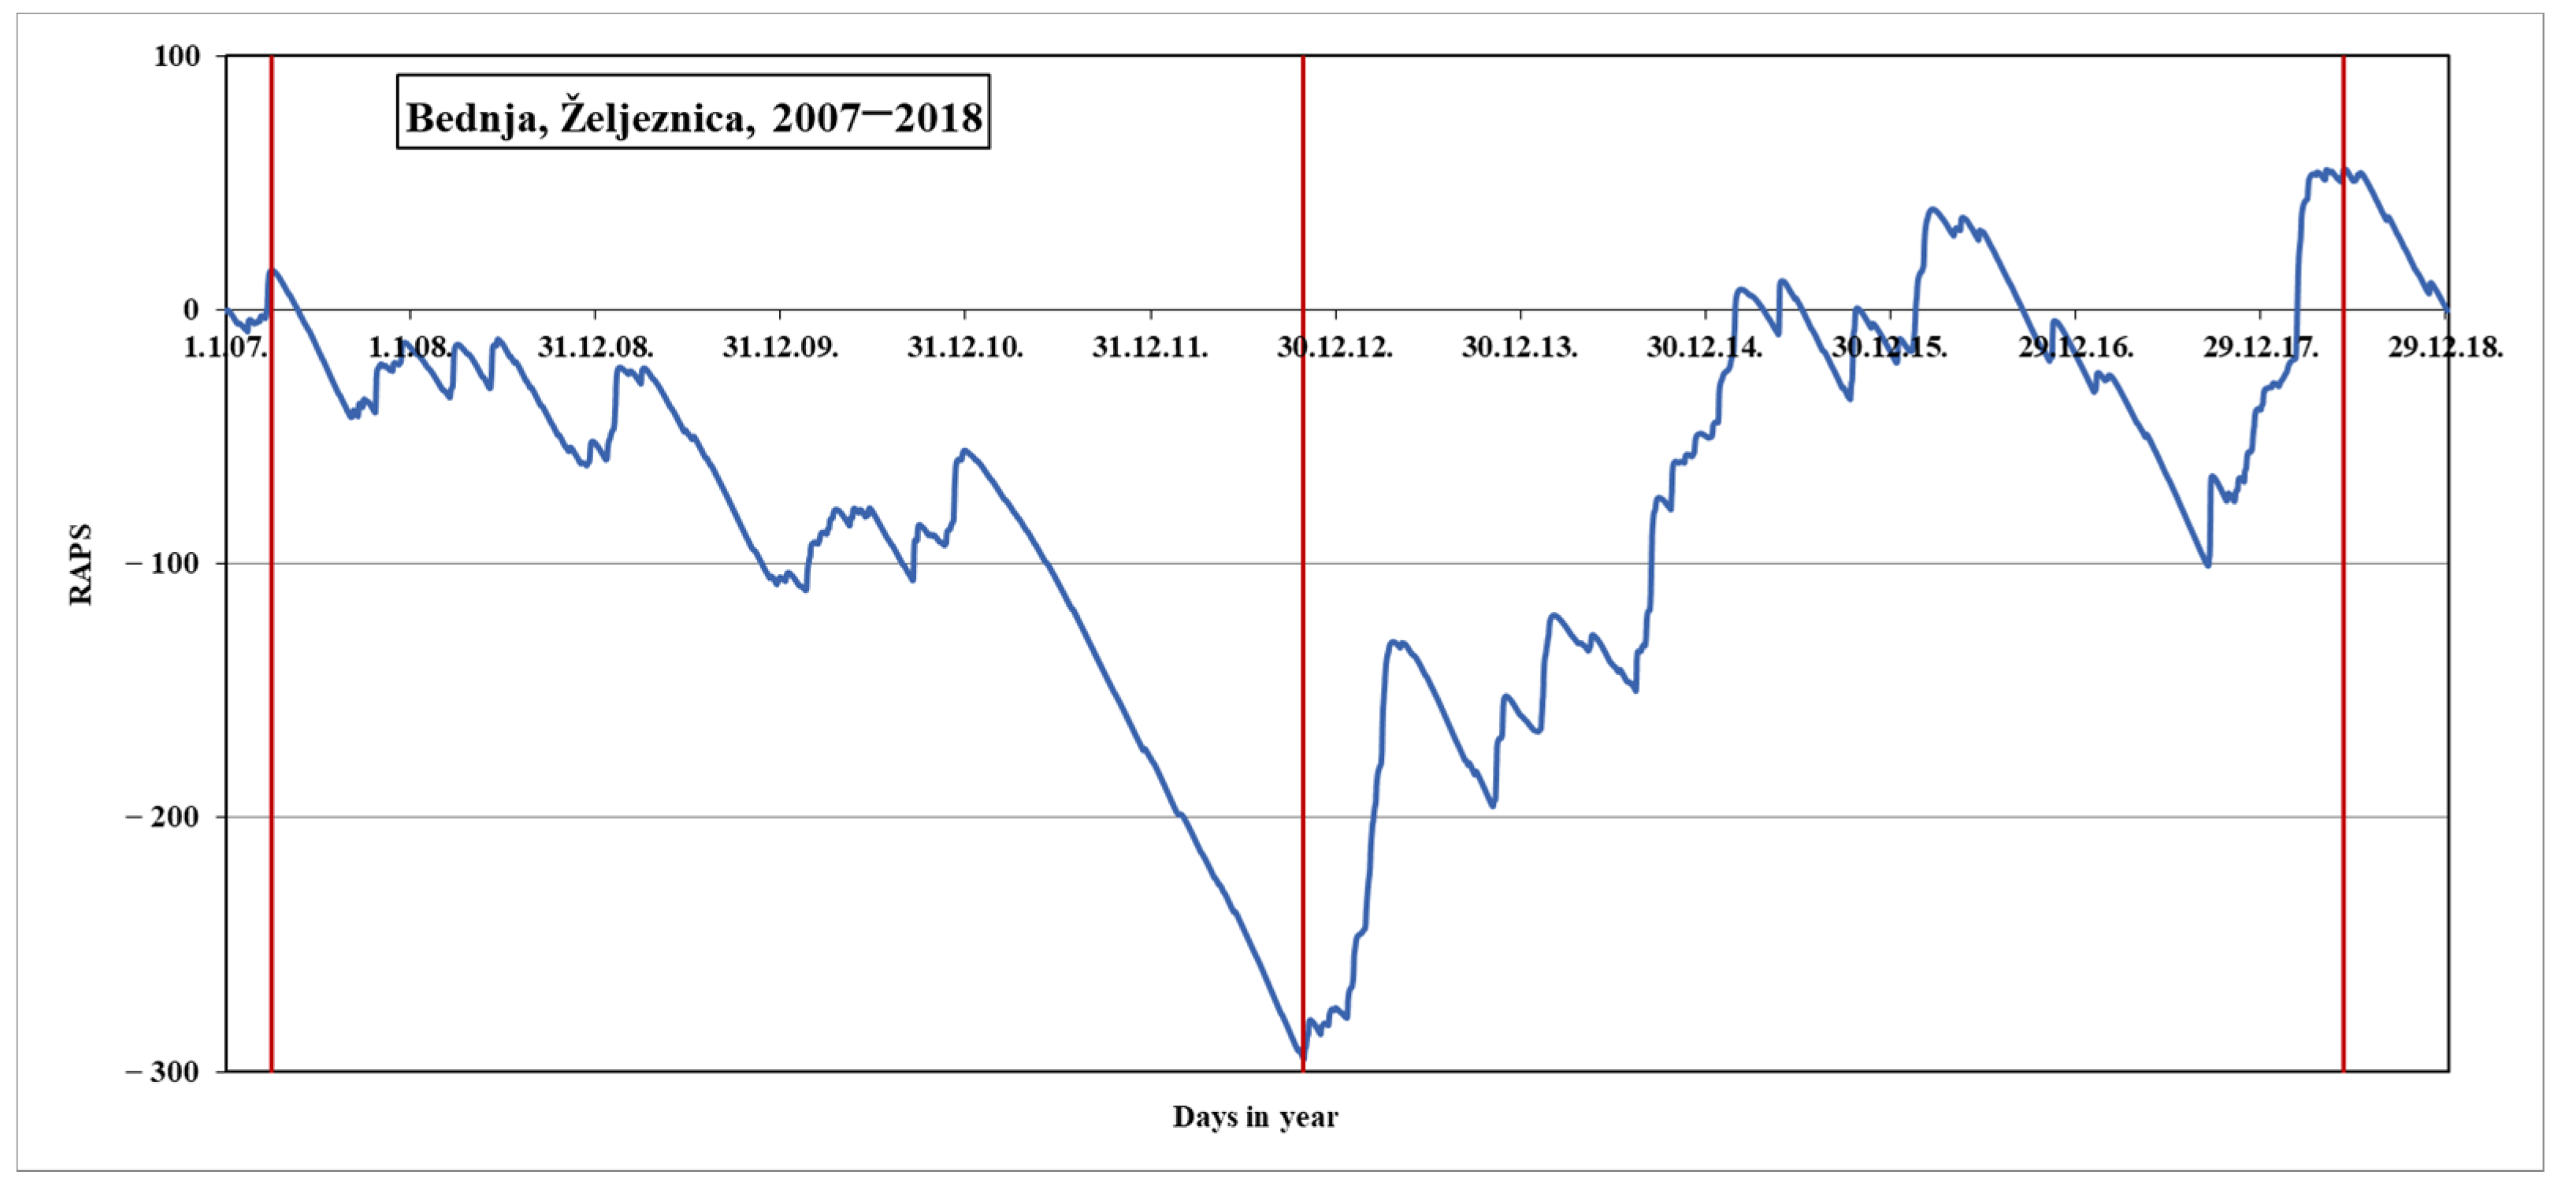
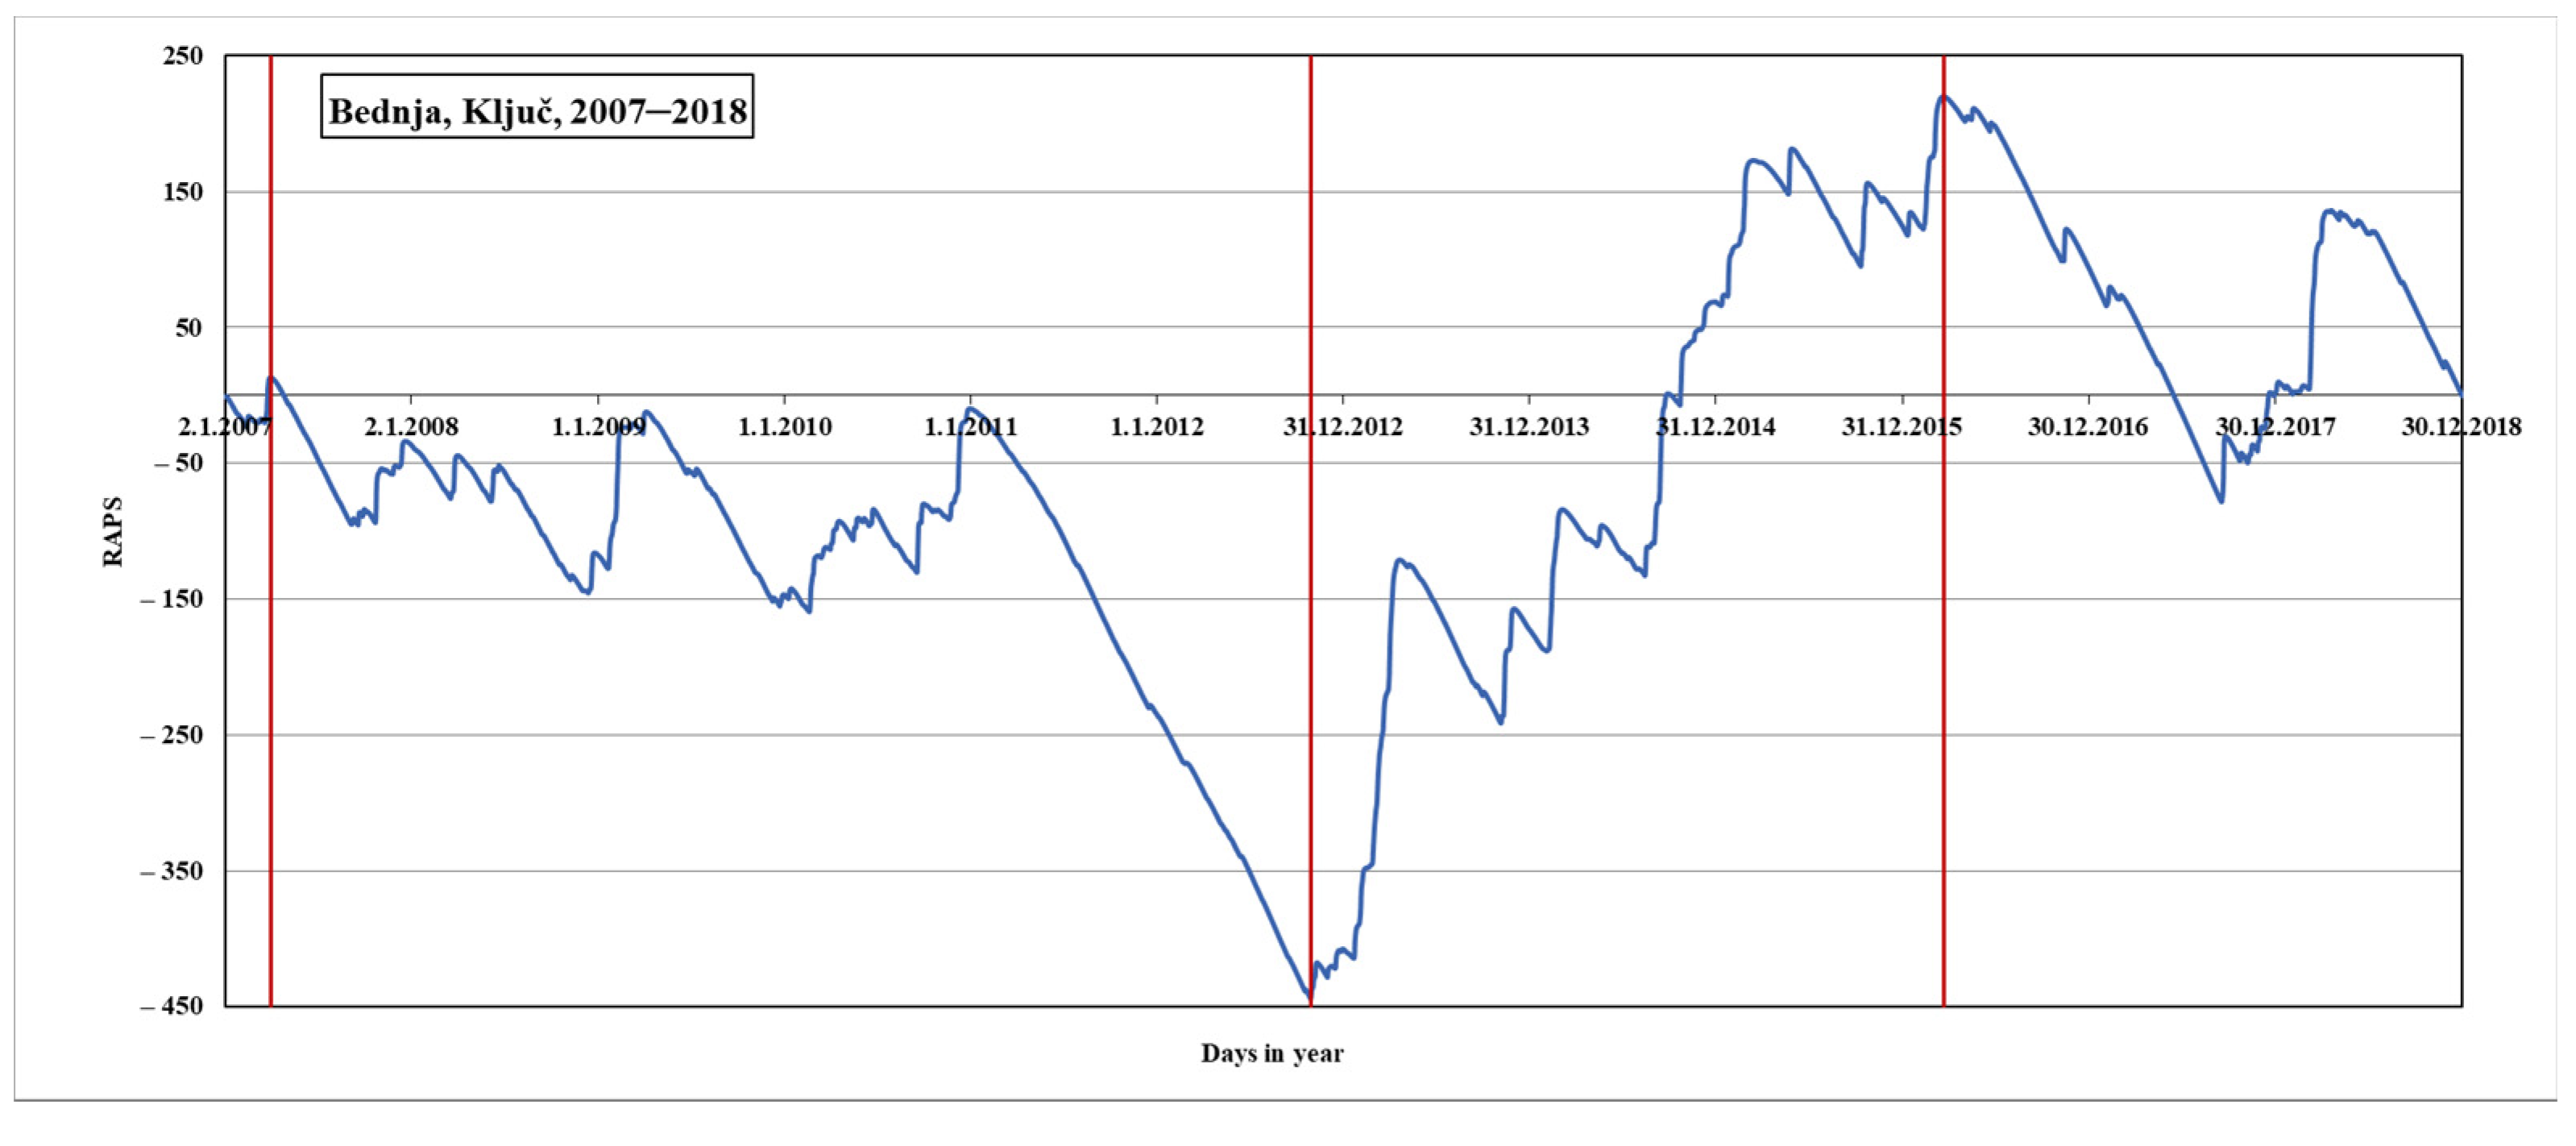
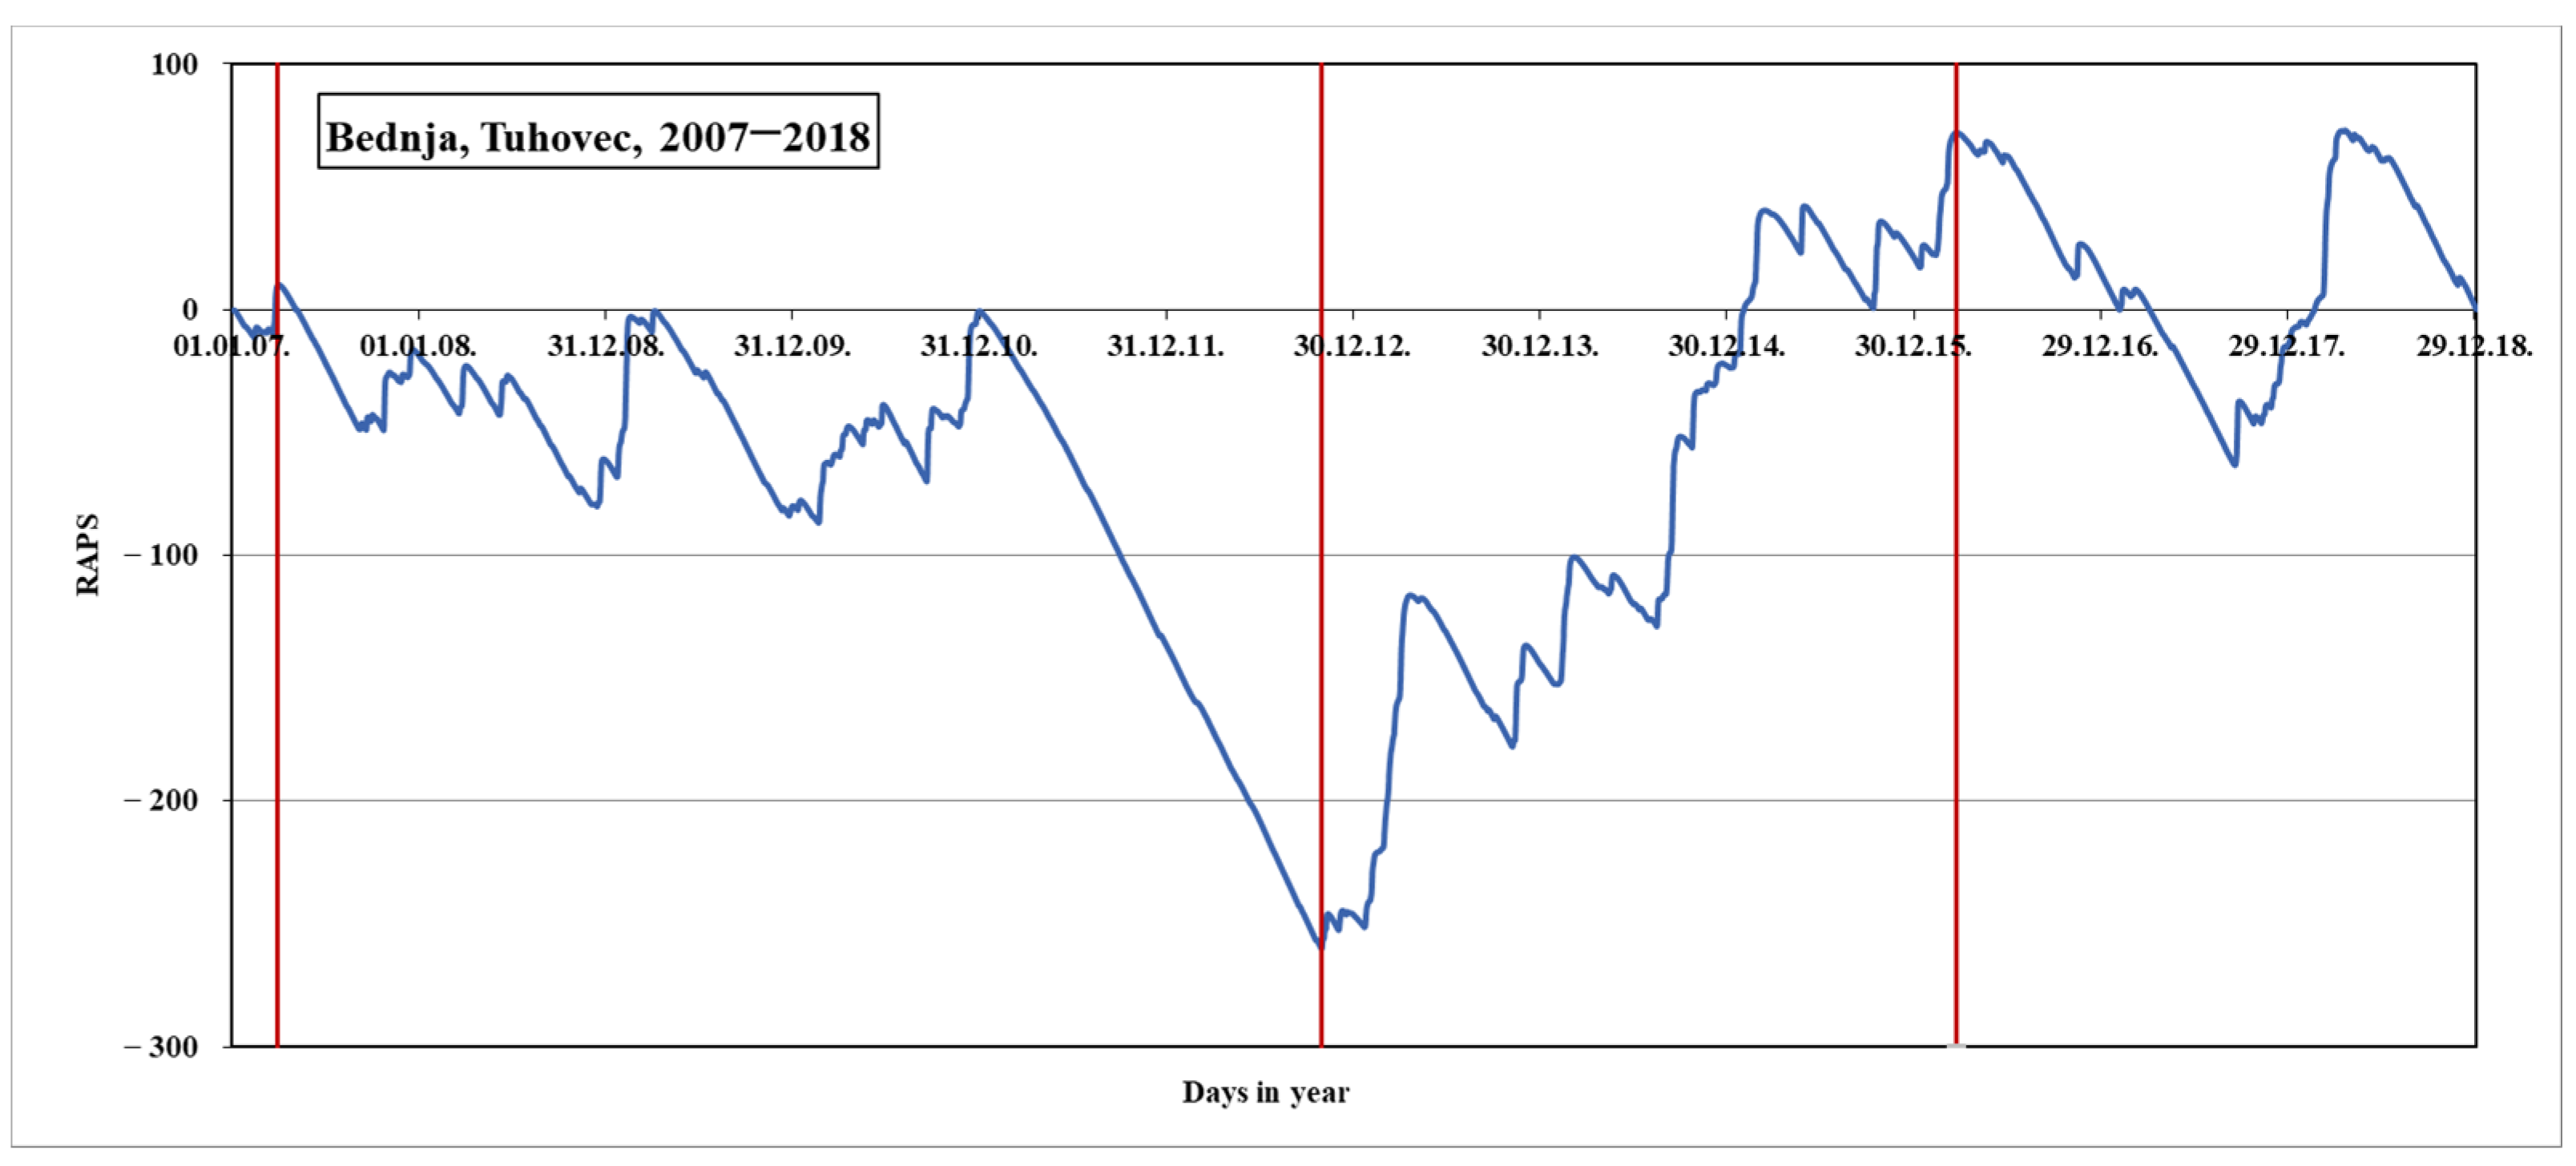
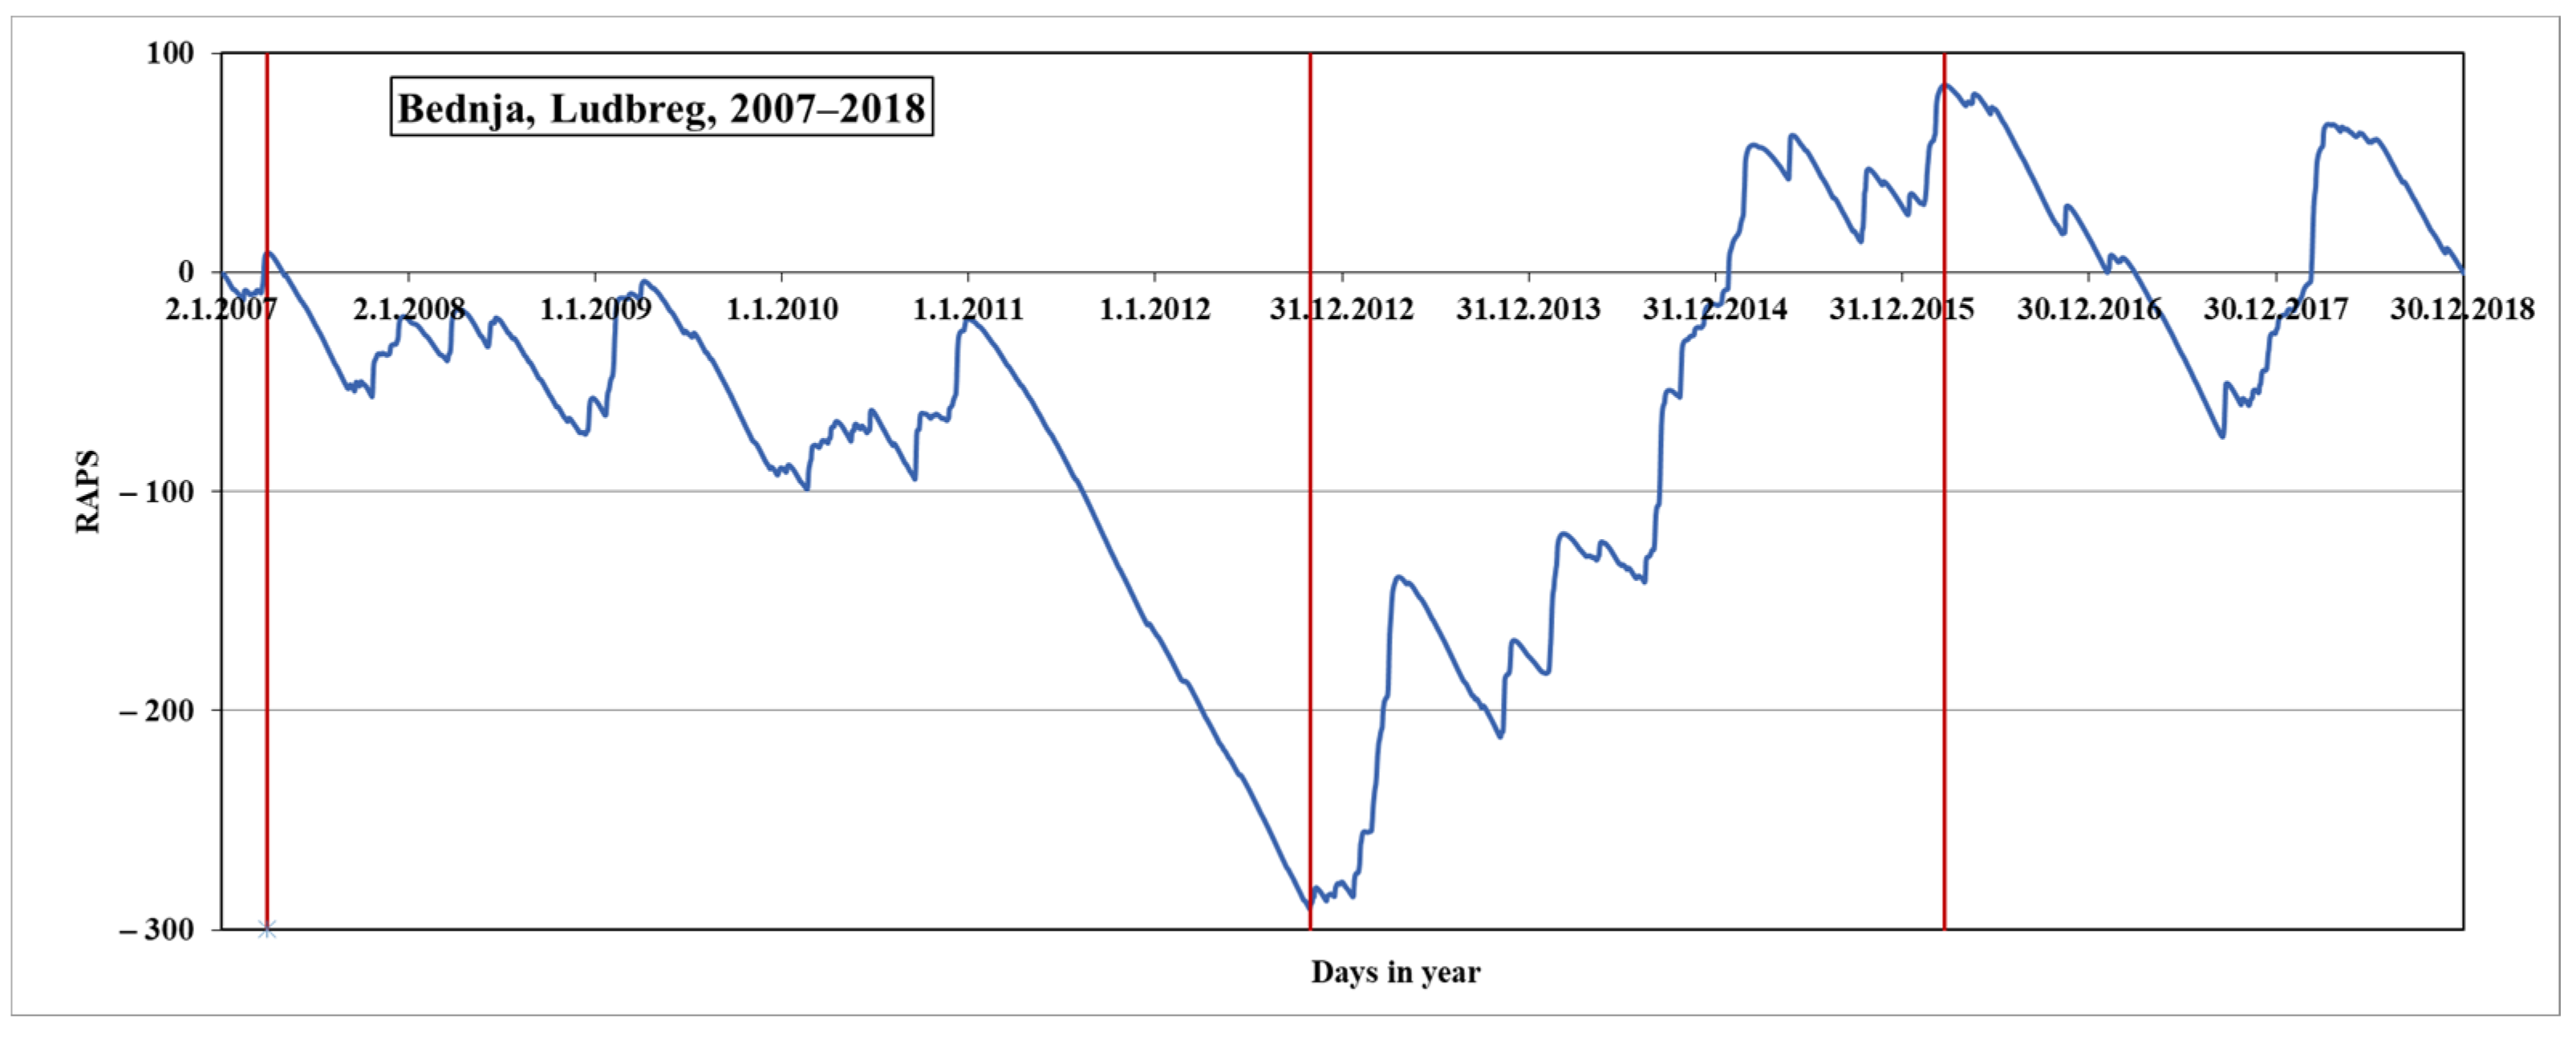
RAPS analysis was made on all five data sets for each measurement station, and diagrams are given in Figure 12, Figure 13, Figure 14, Figure 15 and Figure 16. Analyzing the charts, the displayed RAPS values show that Željeznica, Ključ, Tuhovec, and Ludbreg have the end of the first subperiod at the beginning of 2007, when the second subperiod of low flows begins. For the Lepoglava station, the second subperiod of low flows starts later, in the first months of 2009, and last shorter. For all five stations, the third subperiod of so-called high flows begins in December 2012, but the duration is different. For Lepoglava and Željeznica, that period lasts until the middle of 2018, while for Ključ, Tuhovec, and Ludbreg, the subperiod lasts shorter and ends at the beginning of 2016.
The measuring stations in Ključ, Tuhovec, and Ludbreg have overlapping shapes. Given their proximity to each other, this is expected, as well as with regards to the amount of the flow. In Figure 2, it can be noticed that there are many tributaries during the entire watershed of the river Bednja. Downstream after the source, flow amounts are small, so the inflow from the tributaries significantly impacts the variability, i.e., the torrential news of the flows. With increasing downstream distance from the source, the impact of the tributaries becomes smaller, as seen in the RAPS diagram. In other words, the obtained subseries from the two upstream measuring stations, Lepoglava and Željeznica, are not overlapping, compared with those from Ključ, Tuhovec, and Ludbreg, where flows are becoming bigger and bigger.
4.3. Correlation of the RAPS Values
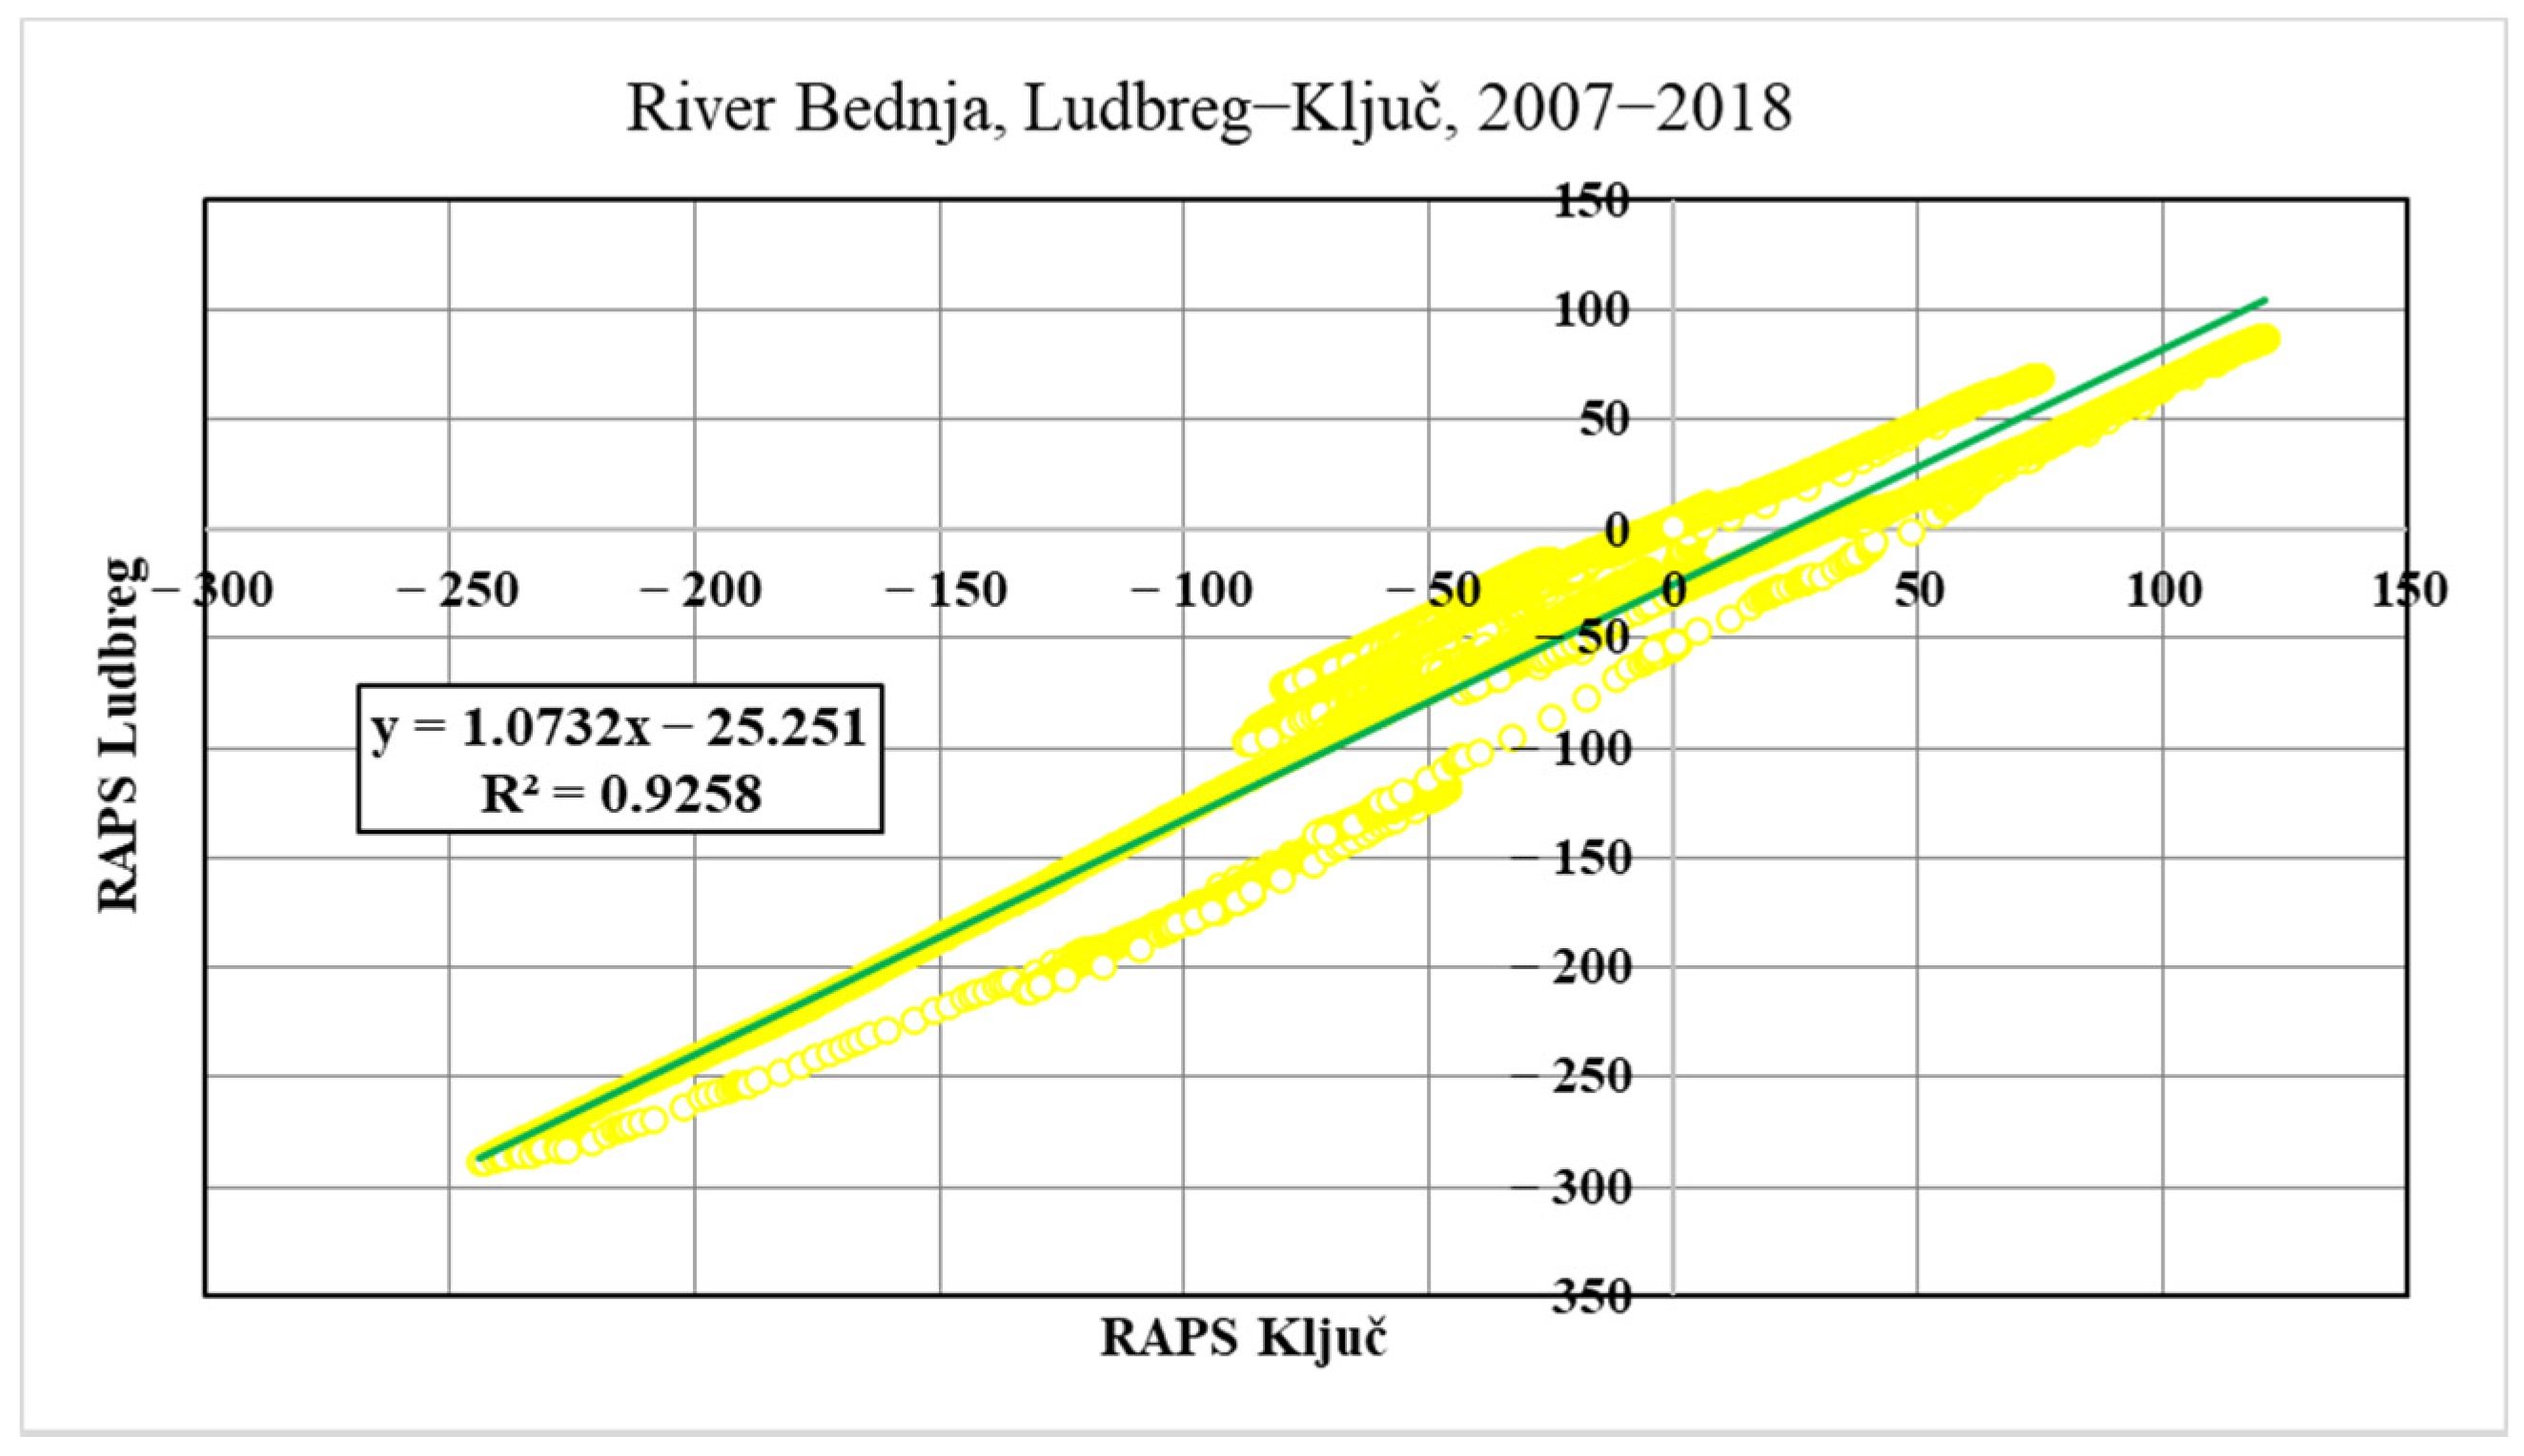
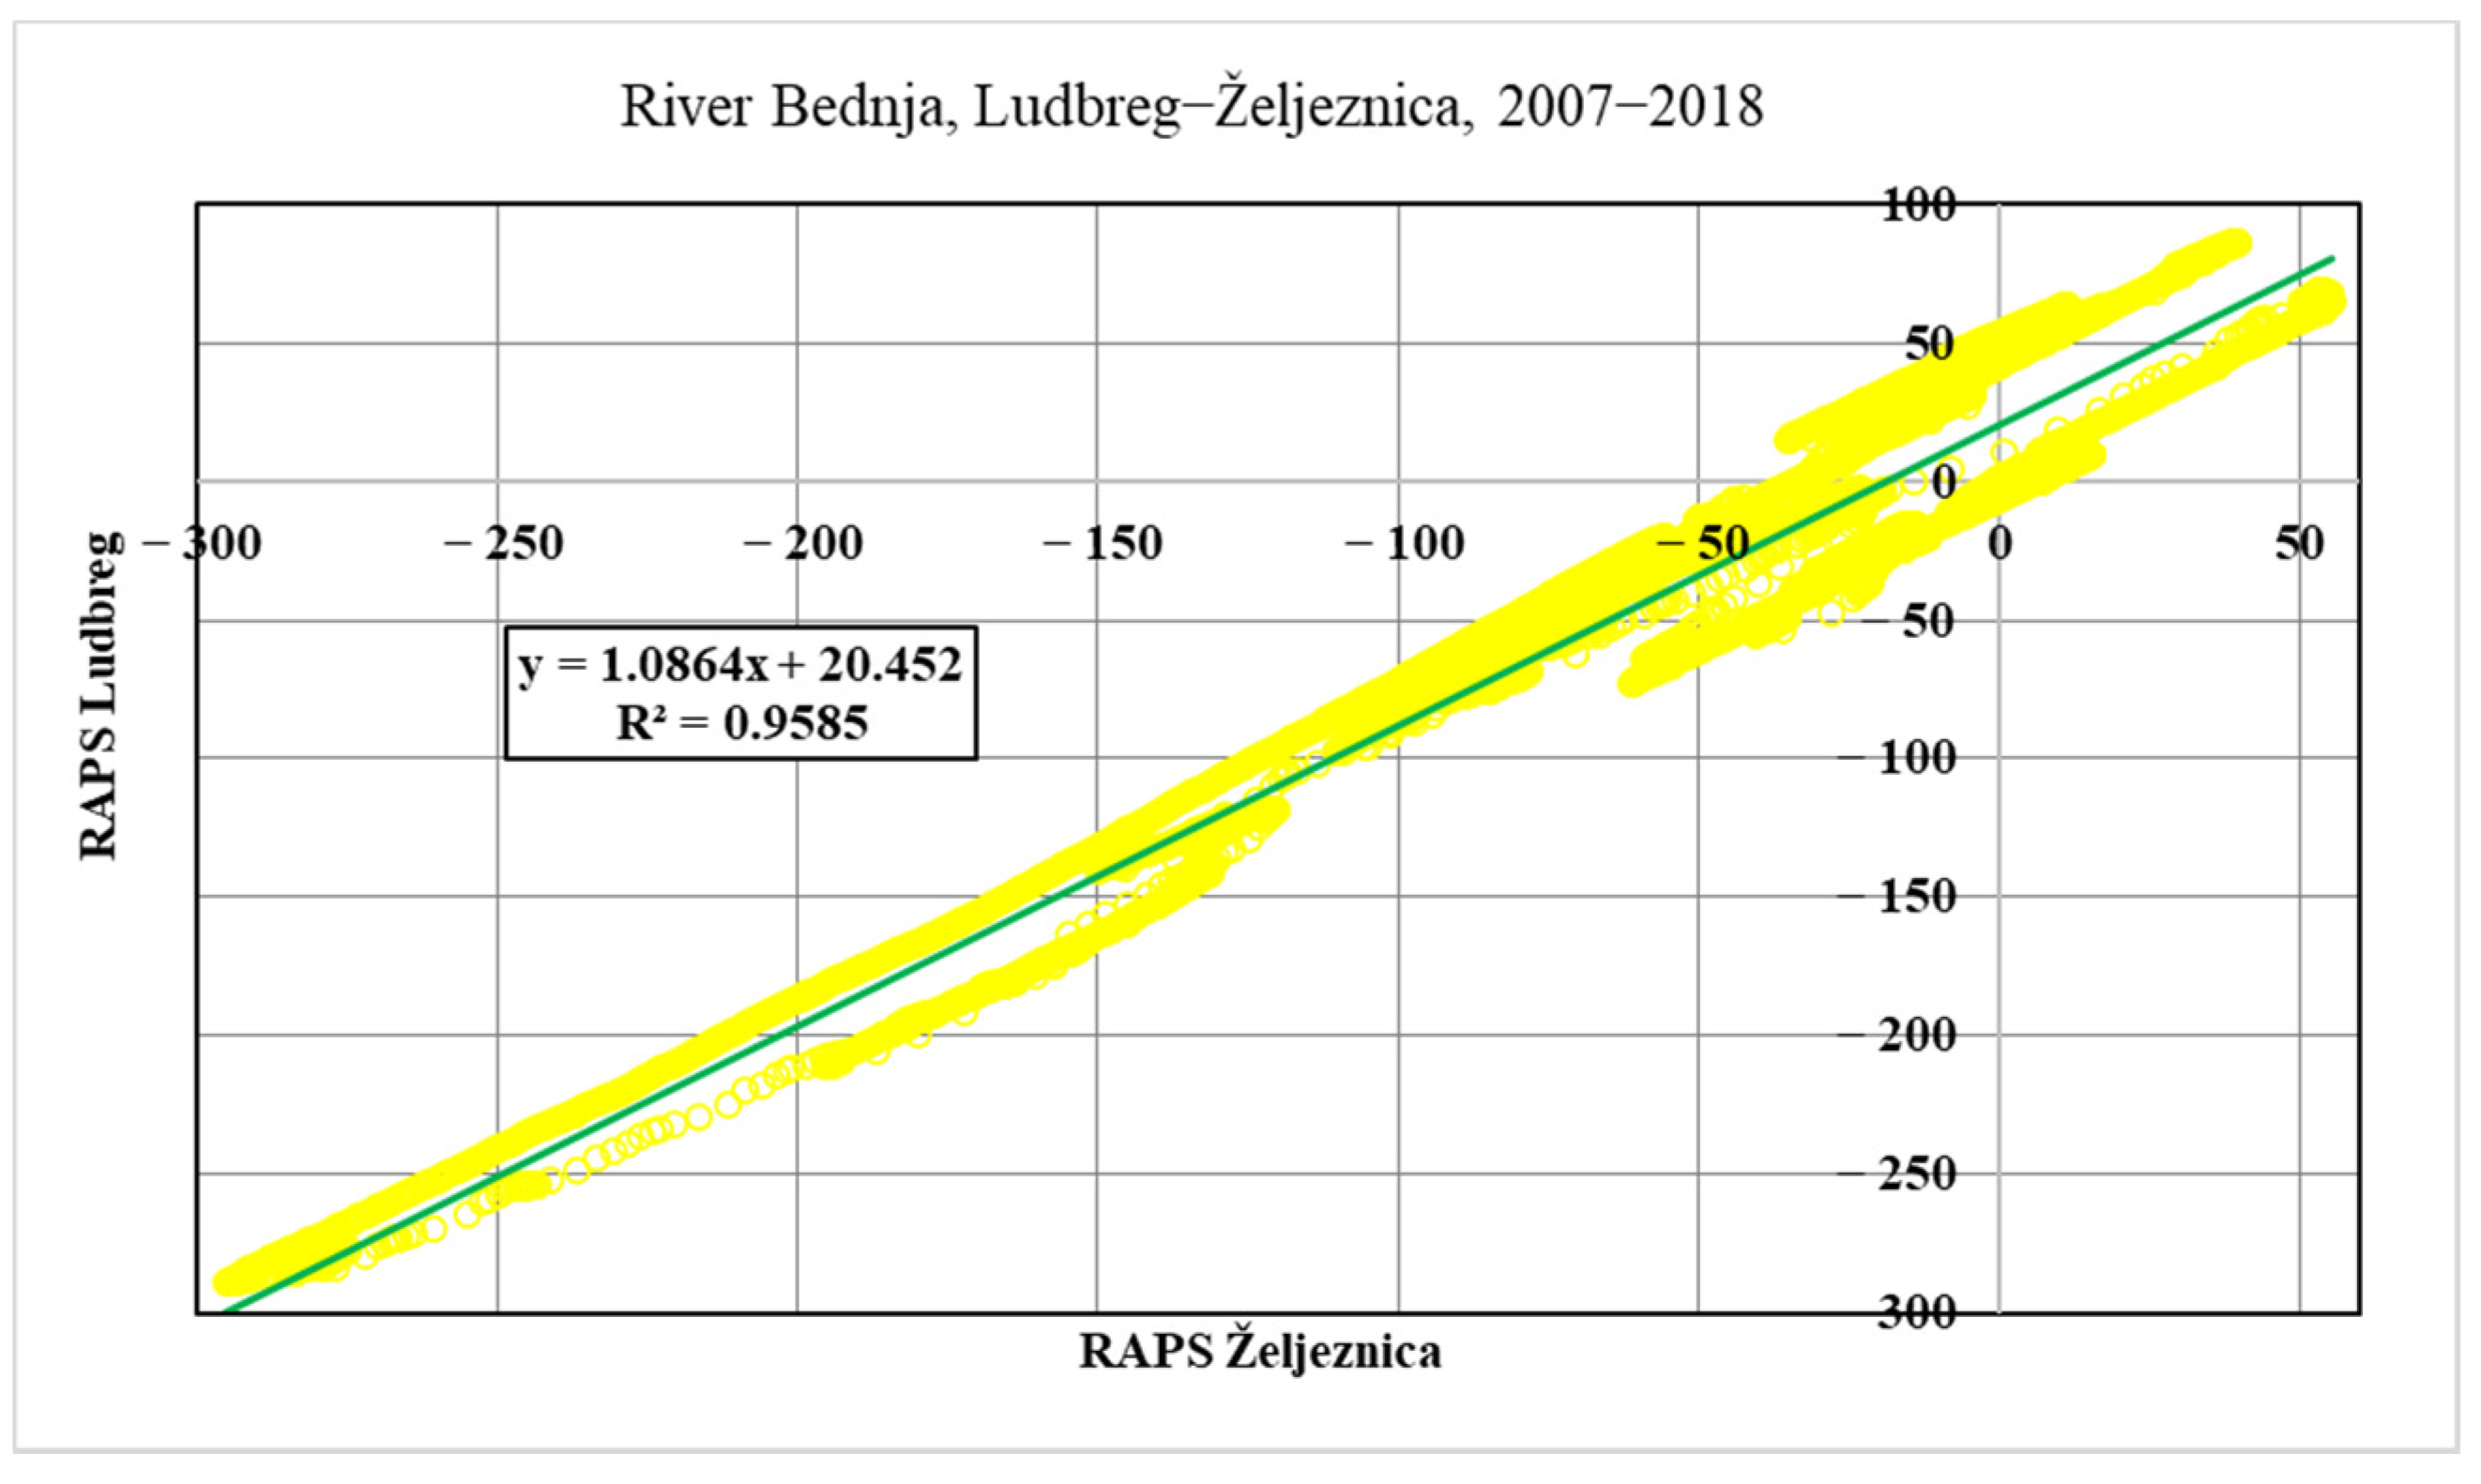
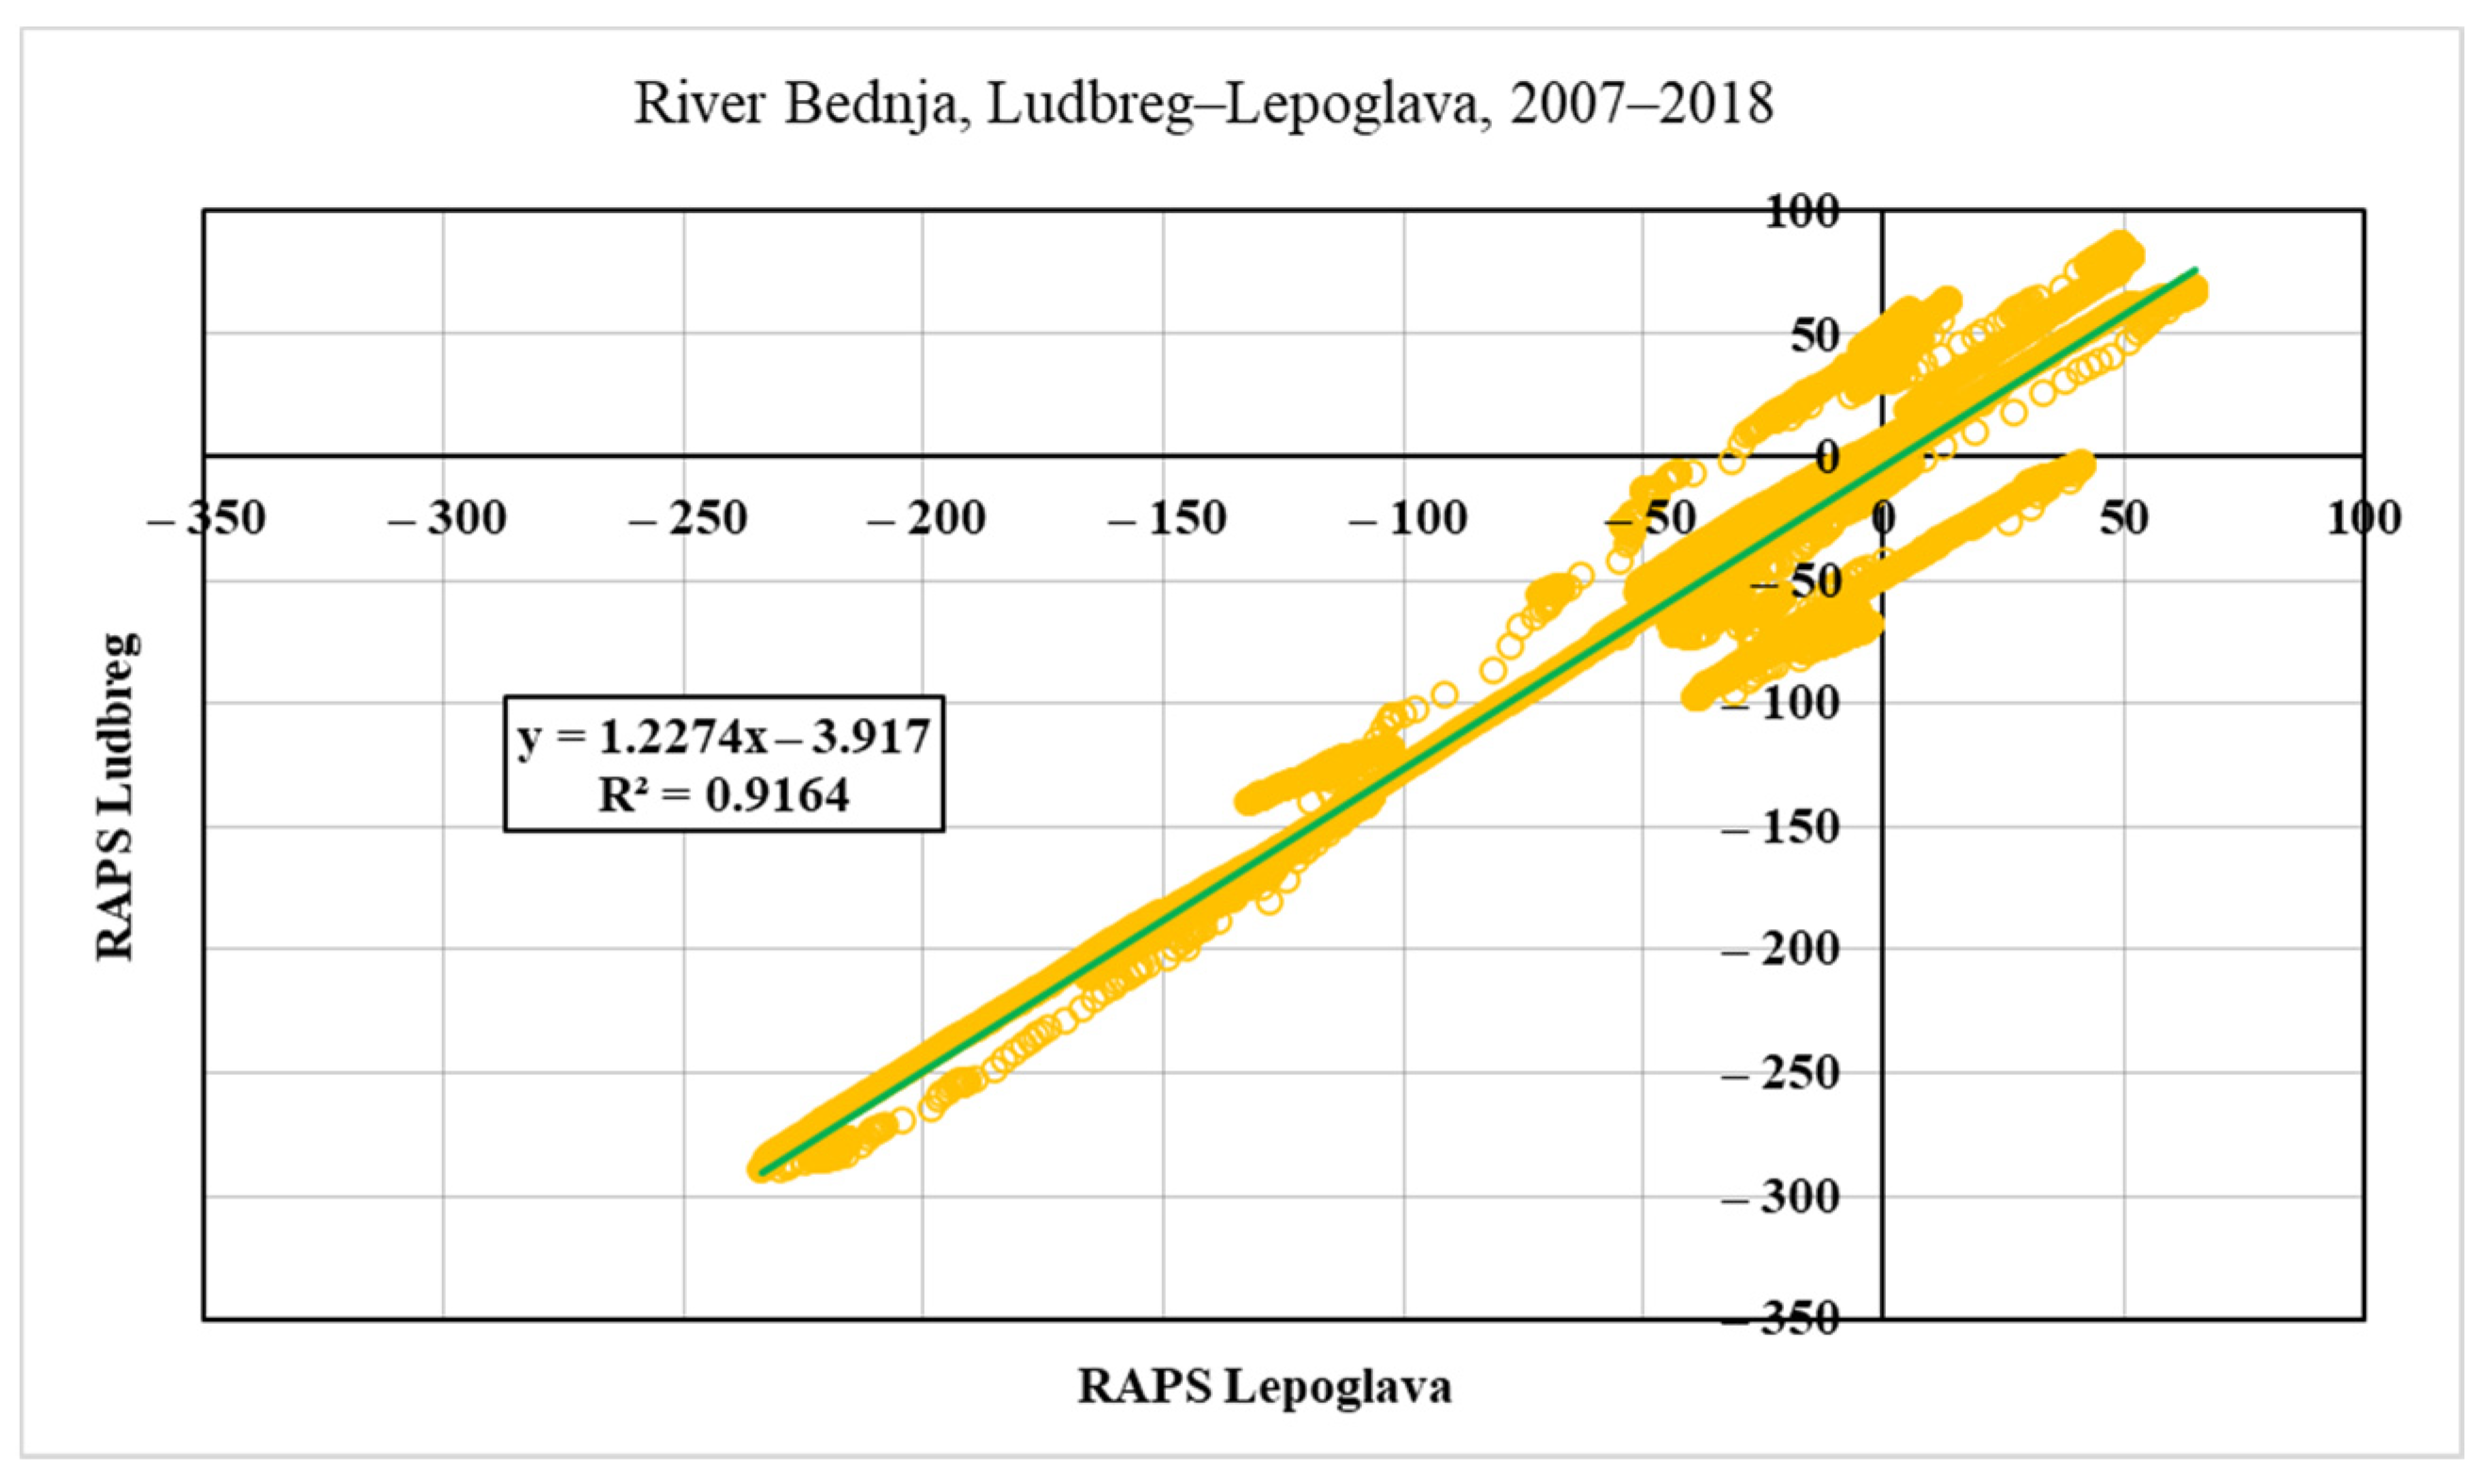
Previously conducted analysis was a further motivation to conduct the correlation analysis on the given RAPS values. Because the Ludbreg station is the most downflow measurement station on river Bednja, the connection between the measured flows at this station will be compared to the data from the other four measurement stations. RAPS correlation analysis is shown in Figure 17, Figure 18, Figure 19 and Figure 20.
As was expected, RAPS values at all five measurement stations give a strong correlation, which shows that they are connected and that the forecasting of flow values for the most downflow stations can be made using the flow values from the most upper flow stations on that river, besides the fact that Bednja has torrential flow.
The RAPS correlation between Ludbreg and Tuhovec is bigger than all the other RAPS correlations because Tuhovec is the closest measuring station. This part of the research aimed to determine if there were any fluctuations in the average daily flows between the measuring stations.
An additional argument for the justification of the methodology, as well as for the connection between the flow to the most downstream measuring station (Ludbreg) and to the most upstream measuring station (Lepoglava), is the fact that the RAPS correlation value R2 is very high (0.9164). Furthermore, the values of the cross-correlation peaks and lag times matrix (Table 4 and Table 5) for the measurement stations support this.
Table 6 provides the RAPS cross-correlation peaks matrix, computed for the five measurement stations. The highest correlation peak was observed between the nearby stations in Tuhovec and Ludbreg. However, a marked decreasing trend with increasing distance between the stations has yet to be observed, as seen in Table 4 with the average daily flows. In particular, the station in Ključ, located approximately halfway along the investigated stretch of Bednja River, showed lower correlation peaks, with a lower value of 0.88 with respect to the Lepoglava station and a second low peak of 0.92 for the nearby station of Željeznica. The slope of the Bednja basin can describe this occurring before the Ključ station, which is more significant than that after the station, and the flows at these two parts of the river are different. Before the Ključ station, the floods occur on streams that flow from the slopes of the Ivanščica, Ravna Gora, and Kalnik mountains, and after the Ključ station, floods occur after a large amount of rain and/or melting of snow. In addition, the river flow is from west to east, and it turns more strongly near the Presečno settlement, just before the Ključ station, where it changes course in a north–south direction, and after bypassing the eastern part of the Varaždin Toplica mountain, it continues to flow in an east–west direction.
Table 7 provides the RAPS cross-correlation lag times matrix for the five measurement stations. In particular, lag times were equal to 0 between all the stations, except the station of Ključ, for which lag times of up to 3 days (with the downstream station of Ludbreg) were observed.
5. Conclusions
River flow behavior prediction is the subject of much research, given the frequent floods caused by climate changes and the anthropogenic use of rivers. New approaches to preparing the data for forecasting methodologies are needed to better understand the connection between the values of river flows through the whole river, from its spring till the end. RAPS methodology gives the visual division of low and high flow periods in time series, using average values and standard deviations. The results of an application of the RAPS method on data sets from five consecutive measurement stations on River Bednja provide information about the similarities in the duration of subperiods at most of the stations. Still, some irregularities also raise the need for additional analysis. Correlation analysis shows the connection between all five stations according to the last (downstream) station on the river Bednja flow, Ludbreg. The given values of the correlation coefficient, especially the RAPS correlation coefficients, show a significant connection between all stations. As such, it is essential for predicting flow intensity regarding flood protection, assessing hydro-technical facilities, and monitoring the flow.
Author Contributions
Conceptualization, B.Đ., L.P. and O.B.; methodology, B.Đ.; software, F.D.N.; validation, B.Đ., L.P. and O.B.; investigation, L.P.; resources, B.Đ.; data curation, B.Đ.; writing—original draft preparation, L.P.; writing—review and editing, B.Đ. and O.B.; visualization, L.P. and F.D.N.; supervision, O.B. All authors have read and agreed to the published version of the manuscript.
Funding
This research received no external funding. Research was provided under the project ‘’Determining the potential of watercourses for the production of electric energy from micro and mini hydropower plants UNIN-TEH-22-1-3, from the University North, Croatia.
Data Availability Statement
All data available upon the reasonable request from the corresponding authors.
Conflicts of Interest
The authors declare no conflict of interest.
References
- Janizadeh, S.; Chandra Pal, S.; Saha, A.; Chowdhuri, I.; Ahmadi, K.; Mirzaei, S.; Mosavi, A.H.; Tiefenbacher, J.P. Mapping the Spatial and Temporal Variability of Flood Hazard Affected by Climate and Land-Use Changes in the Future. J. Environ. Manag. 2021, 298, 113551. [Google Scholar] [CrossRef] [PubMed]
- Hattermann, F.F.; Wortmann, M.; Liersch, S.; Toumi, R.; Sparks, N.; Genillard, C.; Schröter, K.; Steinhausen, M.; Gyalai-Korpos, M.; Máté, K.; et al. Simulation of Flood Hazard and Risk in the Danube Basin with the Future Danube Model. Clim. Serv. 2018, 12, 14–26. [Google Scholar] [CrossRef]
- Chau, K.W.; Wu, C.L.; Li, Y.S. Comparison of Several Flood Forecasting Models in Yangtze River. J. Hydrol. Eng. 2005, 10, 485–491. [Google Scholar] [CrossRef]
- Manselli, L.; Molinari, D.; Pogliani, A.; Zambrini, F.; Menduni, G. Improvements and Operational Application of a Zero-Order Quick Assessment Model for Flood Damage: A Case Study in Italy. Water 2022, 14, 373. [Google Scholar] [CrossRef]
- Peixeiro, M. The Complete Guide to Time Series Analysis and Forecasting. 2019. Available online: https://towardsdatascience.com/the-complete-guide-to-time-series-analysis-and-forecasting-70d476bfe775 (accessed on 21 October 2022).
- Zhu, S.; Bonacci, O.; Oskoruš, D. Assessing Sediment Regime Alteration of the Lower Drava River. Electron. J. Fac. Civ. Eng. Osijek—E-GFOS. 2019, 19, 1–12. [Google Scholar] [CrossRef]
- Počakal, M. Hidrografske veličine porječja Bednje. Hrvat. Geogr. Glas. 1982, 44, 85–102. [Google Scholar]
- Čanjevac, I.; Orešić, D. Contemporary Changes of Mean Annual and Seasonal River Discharges in Croatia. Hrvat. Geogr. Glasnik. 2015, 77/1, 7–27. [Google Scholar] [CrossRef]
- Croatian Waters. Ciak, Elaborat Zaštite Okoliša Za Postupak Ocjene O Potrebi Procjene Utjecaja Na Okoliš Za Zahvat Retencija BelšćAki OpćIna Donja voća I OpćIna Klenovnik Varaždinska ŽUpanija. 2020. Available online: http://arhiva2.varazdinska-zupanija.hr/repository/public/upravna-tijela/poljoprivreda/zastita-okolisa/ocjena-o-potrebi-procjene-utjecaja-na-okolis/2020/01_elaborat_EZO_Belscaki_03.06.2020.pdf (accessed on 17 June 2022).
- VitaPROJEKT, d.o.o. Elaborat Zaštite Okoliša ZA Ocjenu O Potrebi Procjene Utjecaja NA Okoliš ZA Zahvat: Sunčana Elektrana Bednja Zapad, Grad Ivanec, Varaždinska ŽUpanija. 2021. Available online: https://mingor.gov.hr/UserDocsImages//UPRAVA-ZA-PROCJENU-UTJECAJA-NA-OKOLIS-ODRZIVO-GOSPODARENJE-OTPADOM/Opuo//09_02_2021_Elaborat_SE_Bednja_zapad.pdf (accessed on 17 June 2022).
- Action Plan for Bednja (CRO) (D.T3.5.8). EU Projekt Zaštite od Poplava na Slivu Bednje. Studija Utjecaja na Okoliša. Elektroprojekt d.d. Zagreb. 2018. Available online: http://arhiva2.varazdinska-zupanija.hr/repository/public/upravna-tijela/poljoprivreda/zastita-okolisa/procjena-utjecaja-okolis/2018/konacna-verzija-Studije-utjecaja-na-okolis-za%20Bednju.pdf (accessed on 21 June 2022).
- Graberec, M. Regulacijski Zahvati na Rijeci Bednji na Primjeru Nekoliko Lokacija od Ludbrega do Malog Bukovca. Undergraduate Thesis, University North, Koprivnica, Northern Croatia, 2020. Available online: https://urn.nsk.hr/urn:nbn:hr:122:938097 (accessed on 20 June 2022).
- Bigor, P. Potencijal Rijeke Bednje za Korištenje Hidrokinetičkih Turbina. Master’s Thesis, University North, Koprivnica, Northern Croatia, 2021. Available online: https://urn.nsk.hr/urn:nbn:hr:122:343637 (accessed on 20 June 2022).
- Ekonerg. Studija o Utjecaju na Okoliš MHE Zelena na Rijeci Bednji. 2016. Available online: https://mingor.gov.hr/UserDocsImages/ARHIVA%20DOKUMENATA/ARHIVA%20---%20PUO/2016/studija_o_utjecaju_na_okolis_121.pdf (accessed on 20 June 2022).
- Leskovar, K.; Mrakužić, P.; Meaški, H. Evaluation of remotely sensed precipitation product in a hydrological model of the Bednja watershed. Građevinar 2021, 73, 335–348. [Google Scholar] [CrossRef]
- Kos, Ž.; Đurin, B.; Dogančić, D.; Kranjčić, N. Hydro-Energy Suitability of Rivers Regarding Their Hydrological and Hydrogeological Characteristics. Water 2021, 13, 1777. [Google Scholar] [CrossRef]
- GoogleMaps. Available online: https://www.google.com/maps/place/Bednja(river) (accessed on 26 October 2022).
- Petrić, H. Some Settlements in the River Bednja River Basin During the Middle Ages and at the Beginning of the Early New Age. Kaj Časopis Za Književnost Umjet. Kult. 2010, 43, 3. Available online: https://hrcak.srce.hr/69983 (accessed on 20 June 2022).
- Croatian Waters. Studija Utjecaja na Okoliš za eu Projekt Zaštite od Poplava na Slivu Bednje. 2019. Available online: http://arhiva2.varazdinska-zupanija.hr/repository/public/upravna-tijela/poljoprivreda/zastita-okolisa/procjena-utjecaja-okolis/2019/75_Netehnicki_sazetak_2019.pdf (accessed on 26 October 2022).
- Croatian Meteorological and Hydrological Service (CMHS), Hydro Stations Data. Available online: https://hidro.dhz.hr/ (accessed on 22 June 2022).
- Đurin, B.; Kranjčić, N.; Muhar, A.M. Smart Hydro-Energy Hybrid System Potential in Croatia—Bednja River Case Study. Electron. J. Fac. Civ. Eng. Osijek—E-GFOS 2020, 11, 39–50. [Google Scholar] [CrossRef]
- Bonacci, O.; Andrić, I. Sinking karst rivers hydrology—Case of the Lika and Gacka (Croatia). Acta Carsologica 2008, 37, 185–196. [Google Scholar] [CrossRef] [Green Version]
- Garbrecht, J.; Fernandez, G.P. Visualization of Trends and Fluctuations in Climatic Records. J. Am. Water Resour. Assoc. 1994, 30, 297–306. [Google Scholar] [CrossRef]
- Basarin, B.; Lukic, T.; Pavic, D.; Wilby, R. Trends and multi-annual variability of water temperatures in the river Danube, Serbia. Hydrol. Process. 2016, 30, 3315–3329. [Google Scholar]
- Schober, P.; Boer, C.; Schwarte, L. Correlation Coefficients: Appropriate Use and Interpretation. Anesth. Analgesia. 2018, 126, 1763–1768. [Google Scholar] [CrossRef] [PubMed]
- Di Nunno, F.; Granata, F.; Gargano, R.; de Marinis, G. Prediction of spring flows using nonlinear autoregressive exogenous (NARX) neural network models. Environ. Monit. Assess. 2021, 193, 350. [Google Scholar] [CrossRef] [PubMed]
Figure 1.
River Bednja in Croatia [17].
Figure 1.
River Bednja in Croatia [17].

Figure 2.
Water catchment with the tributaries of the river Bednja [19].
Figure 2.
Water catchment with the tributaries of the river Bednja [19].

Figure 3.
Comparison of the average daily flow of River Bednja on all five measurement stations.

Figure 4.
Comparison of the average daily flows for the measuring stations Ludbreg and Lepoglava.

Figure 5.
Comparison of the correlation between the measuring stations Ludbreg and Lepoglava.

Figure 6.
Comparison of the average daily flows for the measuring stations Ludbreg and Željeznica.

Figure 7.
Comparison of the correlation between the measuring stations Ludbreg and Željeznica.

Figure 8.
Comparison of the average daily flows for the measuring stations Ludbreg and Ključ.

Figure 9.
Comparison of the correlation between the measuring stations Ludbreg and Ključ.

Figure 10.
Comparison of the average daily flows for the measuring stations Ludbreg and Tuhovec.

Figure 11.
Comparison of the correlation between the measuring stations Ludbreg and Tuhovec.

Figure 12.
RAPS value on flow data from Lepoglava measurement station.

Figure 13.
RAPS value on flow data from Željeznica measurement station.

Figure 14.
RAPS value on flow data from Ključ measurement station.

Figure 15.
RAPS value on flow data from Tuhovec measurement station.

Figure 16.
RAPS value on flow data from Ludbreg measurement station.

Figure 17.
Correlation of RAPS values on Ludbreg and Tuhovec measurement stations.

Figure 18.
Correlation of RAPS values on Ludbreg and Ključ measurement stations.

Figure 19.
Correlation of RAPS values on Ludbreg and Željeznica measurement stations.

Figure 20.
Correlation of RAPS values on Ludbreg and Lepoglava measurement stations.


Table 1.
Elevation, geographic coordinates, and area of the measurement stations on Bednja River [20].
Table 1.
Elevation, geographic coordinates, and area of the measurement stations on Bednja River [20].
| Measurement Station | Elevation [m a.s.l.] | Geographic Coordinates | Area [km2] | |
|---|---|---|---|---|
| width φ [° ‘ “ ] | length λ [° ‘ “ ] | |||
| Lepoglava | 219,310 | 46°20′66.21″ | 16°03′33.5″ | 89,800 |
| Željeznica | 196,828 | 46°21′99.2″ | 16°20′02.4″ | 307,950 |
| Ključ | 173,090 | 46°17′96.5″ | 16°37′79″ | 415,670 |
| Tuhovec | 162,850 | 46°21′04.8″ | 16°46′30.5″ | 469,540 |
| Ludbreg | 147,350 | 46°24′77.6″ | 16°61′96.06″ | 546,980 |
Table 2.
Flow values at measurement stations on Bednja River [20].
Table 2.
Flow values at measurement stations on Bednja River [20].
| Measurement Station | Date and Minimum Flow [m3/s] | Date and Maximum Flow [m3/s] |
|---|---|---|
| Lepoglava | 30 January 1987 (0.004) | 4 December 1997 (99.54) |
| Željeznica | 3 February 1998 (0.134) | 20 September 2017 (132.1) |
| Ključ | 27 May 1993 (0.267) | 5 December 1997 (104.5) |
| Tuhovec | 31 August 1992 (0.312) | 6 November 1998 (159.3) |
| Ludbreg | 7 September 1947 (0.003) | 15 July 1972 (179.3) |
Table 3.
Streamflow rate statistics were computed for the measurement stations.
| Lepoglava | Željeznica | Ključ | Tuhovec | Ludbreg | |
|---|---|---|---|---|---|
| Mean (m3/s) | 1.32 | 3.58 | 5.33 | 5.84 | 6.73 |
| Median (m3/s) | 0.52 | 1.48 | 2.32 | 2.54 | 3.15 |
| Max (m3/s) | 44.70 | 122.00 | 89.60 | 103.00 | 116.00 |
| Min (m3/s) | 0.05 | 0.27 | 0.67 | 0.82 | 0.91 |
| Std Deviation (m3/s) | 2.99 | 7.01 | 9.71 | 10.49 | 11.32 |
| CV | 2.27 | 1.96 | 1.82 | 1.80 | 1.68 |
| 1st Quartile (m3/s) | 0.24 | 0.82 | 1.40 | 1.67 | 1.89 |
| 3rd Quartile (m3/s) | 1.12 | 3.02 | 4.40 | 5.03 | 6.36 |
| Skewness | 0.80 | 0.90 | 0.93 | 0.94 | 0.95 |
Table 4.
Cross-correlation peaks matrix for the measurement stations. The red to green color bar indicates values between 0.85 and 1.
Table 4.
Cross-correlation peaks matrix for the measurement stations. The red to green color bar indicates values between 0.85 and 1.
| Lepoglava | Željeznica | Ključ | Tuhovec | Ludbreg | |
|---|---|---|---|---|---|
| Lepoglava | 1.00 | 0.93 | 0.87 | 0.86 | 0.85 |
| Željeznica | 0.93 | 1.00 | 0.95 | 0.92 | 0.91 |
| Ključ | 0.87 | 0.95 | 1.00 | 0.98 | 0.96 |
| Tuhovec | 0.86 | 0.92 | 0.98 | 1.00 | 0.97 |
| Ludbreg | 0.85 | 0.91 | 0.96 | 0.97 | 1.00 |
Table 5.
Cross-correlation lag times matrix for the measurement stations. The red to blue color bar indicates values between −1 and 1.
Table 5.
Cross-correlation lag times matrix for the measurement stations. The red to blue color bar indicates values between −1 and 1.
| Lepoglava | Željeznica | Ključ | Tuhovec | Ludbreg | |
|---|---|---|---|---|---|
| Lepoglava | 0 | 0 | 0 | 1 | 1 |
| Željeznica | 0 | 0 | 0 | 0 | 1 |
| Ključ | 0 | 0 | 0 | 0 | 0 |
| Tuhovec | −1 | 0 | 0 | 0 | 0 |
| Ludbreg | −1 | −1 | 0 | 0 | 0 |
Table 6.
Cross-correlation peaks matrix for the measurement stations. The red to green color bar indicates values between 0.88 and 1.
Table 6.
Cross-correlation peaks matrix for the measurement stations. The red to green color bar indicates values between 0.88 and 1.
| Lepoglava | Željeznica | Ključ | Tuhovec | Ludbreg | |
|---|---|---|---|---|---|
| Lepoglava | 1.00 | 0.95 | 0.88 | 0.97 | 0.96 |
| Željeznica | 0.95 | 1.00 | 0.92 | 0.98 | 0.98 |
| Ključ | 0.88 | 0.92 | 1.00 | 0.96 | 0.96 |
| Tuhovec | 0.97 | 0.98 | 0.96 | 1.00 | 0.99 |
| Ludbreg | 0.96 | 0.98 | 0.96 | 0.99 | 1.00 |
Table 7.
Cross-correlation lag times matrix for the measurement stations. The red to blue color bar indicates values between −3 and 2.
Table 7.
Cross-correlation lag times matrix for the measurement stations. The red to blue color bar indicates values between −3 and 2.
| Lepoglava | Željeznica | Ključ | Tuhovec | Ludbreg | |
|---|---|---|---|---|---|
| Lepoglava | 0 | 0 | −2 | 0 | 0 |
| Željeznica | 0 | 0 | −1 | 0 | 0 |
| Ključ | 2 | 1 | 0 | 2 | 3 |
| Tuhovec | 0 | 0 | −2 | 0 | 0 |
| Ludbreg | 0 | 0 | −3 | 0 | 0 |
Disclaimer/Publisher’s Note: The statements, opinions and data contained in all publications are solely those of the individual author(s) and contributor(s) and not of MDPI and/or the editor(s). MDPI and/or the editor(s) disclaim responsibility for any injury to people or property resulting from any ideas, methods, instructions or products referred to in the content. |
© 2023 by the authors. Licensee MDPI, Basel, Switzerland. This article is an open access article distributed under the terms and conditions of the Creative Commons Attribution (CC BY) license (https://creativecommons.org/licenses/by/4.0/).
Share and Cite
MDPI and ACS Style
Đurin, B.; Plantak, L.; Bonacci, O.; Di Nunno, F. A Unique Approach to Hydrological Behavior along the Bednja River (Croatia) Watercourse. Water 2023, 15, 589. https://doi.org/10.3390/w15030589
AMA Style
Đurin B, Plantak L, Bonacci O, Di Nunno F. A Unique Approach to Hydrological Behavior along the Bednja River (Croatia) Watercourse. Water. 2023; 15(3):589. https://doi.org/10.3390/w15030589
Chicago/Turabian StyleĐurin, Bojan, Lucija Plantak, Ognjen Bonacci, and Fabio Di Nunno. 2023. "A Unique Approach to Hydrological Behavior along the Bednja River (Croatia) Watercourse" Water 15, no. 3: 589. https://doi.org/10.3390/w15030589
Note that from the first issue of 2016, this journal uses article numbers instead of page numbers. See further details here.