
Rainfall Forecast and Drought Analysis for Recent and Forthcoming Years in India


1
SRM Institute of Science and Technology, Department of Computing Technologies, Kattankulathur, Chengalpattu 603203, India
2
Skolkovo Institute of Science and Technology, Center for AgroTechnologies, Moscow 121205, Russia
*
Author to whom correspondence should be addressed.
Water 2023, 15(3), 592; https://doi.org/10.3390/w15030592
Submission received: 5 December 2022
/
Revised: 19 January 2023
/
Accepted: 28 January 2023
/
Published: 2 February 2023
(This article belongs to the Special Issue Effects of Drought on Agriculture Water Resources and Crop Productivity)
Abstract
:Agriculture is the primary profession in India which relies on several climatic factors such as rainfall, temperature, humidity, etc., for the successful growth of crops. Weather and drought forecasting may help to take preventive measures in an unusual situation due to crop failure. Most of the existing work attempts to forecast the weather or analyse the reason for the occurrence of drought and its effects in the past. This paper adopts the machine learning model called the long short-term memory (LSTM) neural network to forecast the long-term rainfall and standardised precipitation index for drought estimation. The predicted annual rainfall from LSTM is taken as an input to forecast the drought conditions of India for the upcoming years, which is a unique approach and objective, and based on this work appropriate decisions can be made for future actions. The past 117 years of rainfall and drought conditions are compared with the recent 50 years by analysing the data in several ways in order to predict the future scenario. The forecasted results are compared with actual observations to demonstrate the effectiveness of the LSTM model to produce adequate results. The error and network loss of the model is 0.059 and 0.0036, which is minimal, and the forecasted rainfall level is almost equal to actual level specifically accuracy is 99.46% for the previous year, 2021. It was found that there is a rainfall decline of 0.04% every year. Apart from the prediction for the country, a clear picture of the region regarding drought forecasts is presented in this work. The real-time drought level is mild and moderate for most of the regions in the country which matches with the drought level determined using forecasted rainfall.
1. Introduction
Water is a basic necessity for human life and any living being on Earth. Rainfall is the primary source of freshwater; it is one of the significant criteria that define climate and monsoons and also acts as the phenomenon that drives atmospheric circulation [1]. Rainfall influences people in several ways, such as livelihood, economy, etc., although agriculture is the career most dependent on rainfall. More than 70% of the rural population in India relies on agriculture for their livelihood [2]. Farmers in India sow seasonal crops expecting adequate monsoon rainfall every year. However, significant variability is exhibited in recent rainfall patterns [3]. The extreme impacts of rainfall are flood and drought with the untimely occurrence of either leading to crop damage.
Drought is a natural disaster caused by below-average precipitation in a particular region. This results in persistent shortages in the water supply—ground, surface, or atmospheric water, leading to a hydrological imbalance in that area. Droughts can last for days, months, or years. Such drought conditions or scarce water supply also considerably impact the country’s socio-economic development [4]. Drought is identified based on the incident rainfall, soil moisture, and runoff. Several drought indices, typically based on a combination of precipitation, temperature, and soil moisture have been derived in recent decades to assess the effects of agricultural droughts and define different drought parameters, which include intensity, duration, severity, and spatial extent [5]. Examples include the standardised precipitation index (SPI) [6], standard precipitation evapotranspiration index (SPEI) [6], Palmer drought severity index (PDSI) [6], standardised soil moisture index (SSI) [7], standardised runoff index (SRI) [8], stream flow drought index (SDI) [8], etc. The range of positive or negative values of the drought indices represents the region’s severity level of wetness or dryness. Among the four commonly classified types of droughts—meteorological, socio-economic, hydrological, and agricultural, agricultural drought is particularly important. Other than the direct and immediate impact on the people and environment due to crop failure and the loss of pastures, it also affects the entire food production and processing industry for a long time [9]. The moisture content in the soil is considered the major indicator of agricultural drought. When the water content in the soil does not meet the plant’s demands, agricultural drought arises and directly affects agricultural crop productivity.
India is one of the biggest producers of agricultural products in the world. As the population grows, there is a need for increased farm productivity to feed them. Productivity also needs to be increased so that farmers can get more pay from the same piece of land with less labour. When there is excess rainfall, the government can make arrangements to store the water in surface storage, such as ponds, lakes, and reservoirs, which can be used later for irrigation in agriculture. On the other hand, when there is a rainfall deficit, it leads to crop failures. Forecasting the rainfall becomes mandatory to be aware of either impact, through which appropriate planning and actions can be taken. Hence data analytics aids in predicting future outcomes, such as rainfall and drought/flood dynamics. Furthermore, the various aspects of rainfall and drought analysis can be performed using descriptive and predictive analytics to uncover insights.
Precision agriculture provides a way to increase productivity. Precision farming, as the name implies, refers to the application of precise quantities of water, fertilisers, etc., at the proper time to the crop as necessary in each location to raise the yield. Precision agriculture assists in decision making for crop management using analysis tools, especially irrigation management [10]. Rainfall prediction and drought analysis play a major role in decision making relevant to crop recommendation and irrigation. The estimations must be accurate and precise in agriculture since errors may lead to heavy material and capital losses and significant environmental impacts due to water over-extraction or contamination. Some existing works perform rainfall forecast alone and few works perform drought forecast directly without predicting its relevant parameters. Statistical methods, such as ARIMA and regression models, are used to perform drought forecasts for different timescales in the early days, especially with SPI. However, the limitations of these models are: (i) there exists a linear relationship between the predictand and predictor, and (ii) they are applicable for fewer parameters [11]. However, machine learning models are adopted nowadays due to their ability to handle highly nonlinear patterns [12].
Machine learning models, especially artificial neural networks (ANN) that can learn from and forecast time series data, are well suited for rainfall forecasting. ANNs have gained more attention for rainfall prediction in recent years and some approaches/applications are listed here. Multi-layer perceptron (MLP) along with backpropagation and random optimisation was used to predict local rainfall in Japan, and it was reported that the ANN approach outperformed radial basis function networks (RBFN) [13]. Rainfall was forecasted for several meteorological subdivisions of India from 2015 to 2030 using MLP. The results of the study convey that there would be a decline in rainfall in the upcoming years. The authors also suggested that employing deep learning models like long short-term memory (LSTM) may further improve the prediction accuracy [14].
A nonlinear autoregressive model with exogenous variables (NARX) network predicted six months of rainfall with good accuracy compared to the 12 months ahead, whereas the performance of linear models was unsatisfactory [15]. A short-term rainfall forecast was carried out for 609 sub-basins in Iran using Gaussian process classification (GPC) and ANN with backpropagation [16]. This work applied the SPI to determine that the south-east regions of Iran are drought prone areas. Hence, the authors of that work recommend long-term drought analysis to estimate groundwater level as an enhancement. One month of rainfall was forecast for Nigeria by developing an adaptive neuro-fuzzy inference system (ANFIS) for August 2016 to identify river discharge [17]. The outcomes indicated that the model performed well for the monthly forecast. Still, there was a significant difference in the yearly forecast. Reservoir computing was used to forecast hourly rainfall for the southern Taiwan region that adopts the echo state network (ESN) and deep echo state network (DeepESN) [18]. The DeepESN model gives better results than existing methods but needs high volume data for prediction. Dynamical methods for seasonal forecast, such as the general circulation model (GCM) and multi-model ensemble forecast, show a marginal improvement whereas predictions beyond the tropics are not satisfiable and prediction skill reduces as the forecast period increases [11].
A common drawback found In the previous works is that the prediction models do not support long-term forecasts but are performed on a minute or hourly basis. Predictions must be carried out in advance for appropriate decision making and to take necessary precautions, especially for agricultural applications. Thus, traditional rainfall forecast techniques are not precise due to their short-term predictions. Deep learning approaches, such as recurrent neural networks (RNN), can efficiently handle time series data for forecasting [19]. Long short-term memory (LSTM) is a type of RNN that can perform long-term forecasts due to the presence of special gate units [20]. Thus, our work adopts LSTM to forecast the annual rainfall dynamics of India for a longer duration, a maximum of 5 years. As mentioned earlier, the previous researches do not focus on forecasting the drought based on rainfall prediction; instead they forecast either rainfall or drought directly from its indices values. Many researchers deal with rainfall forecasts, but the forecast period is limited due to the inabilities of the models discussed above. Those works which forecast the drought directly rely on previous drought indices values alone. They do not consider the parameters based on which drought is calculated. This work determines future drought using SPI based on the rainfall forecasted with LSTM, and analyses are made in several aspects.
2. Materials and Methods
2.1. Descriptive Statistics on Rainfall and Drought in India
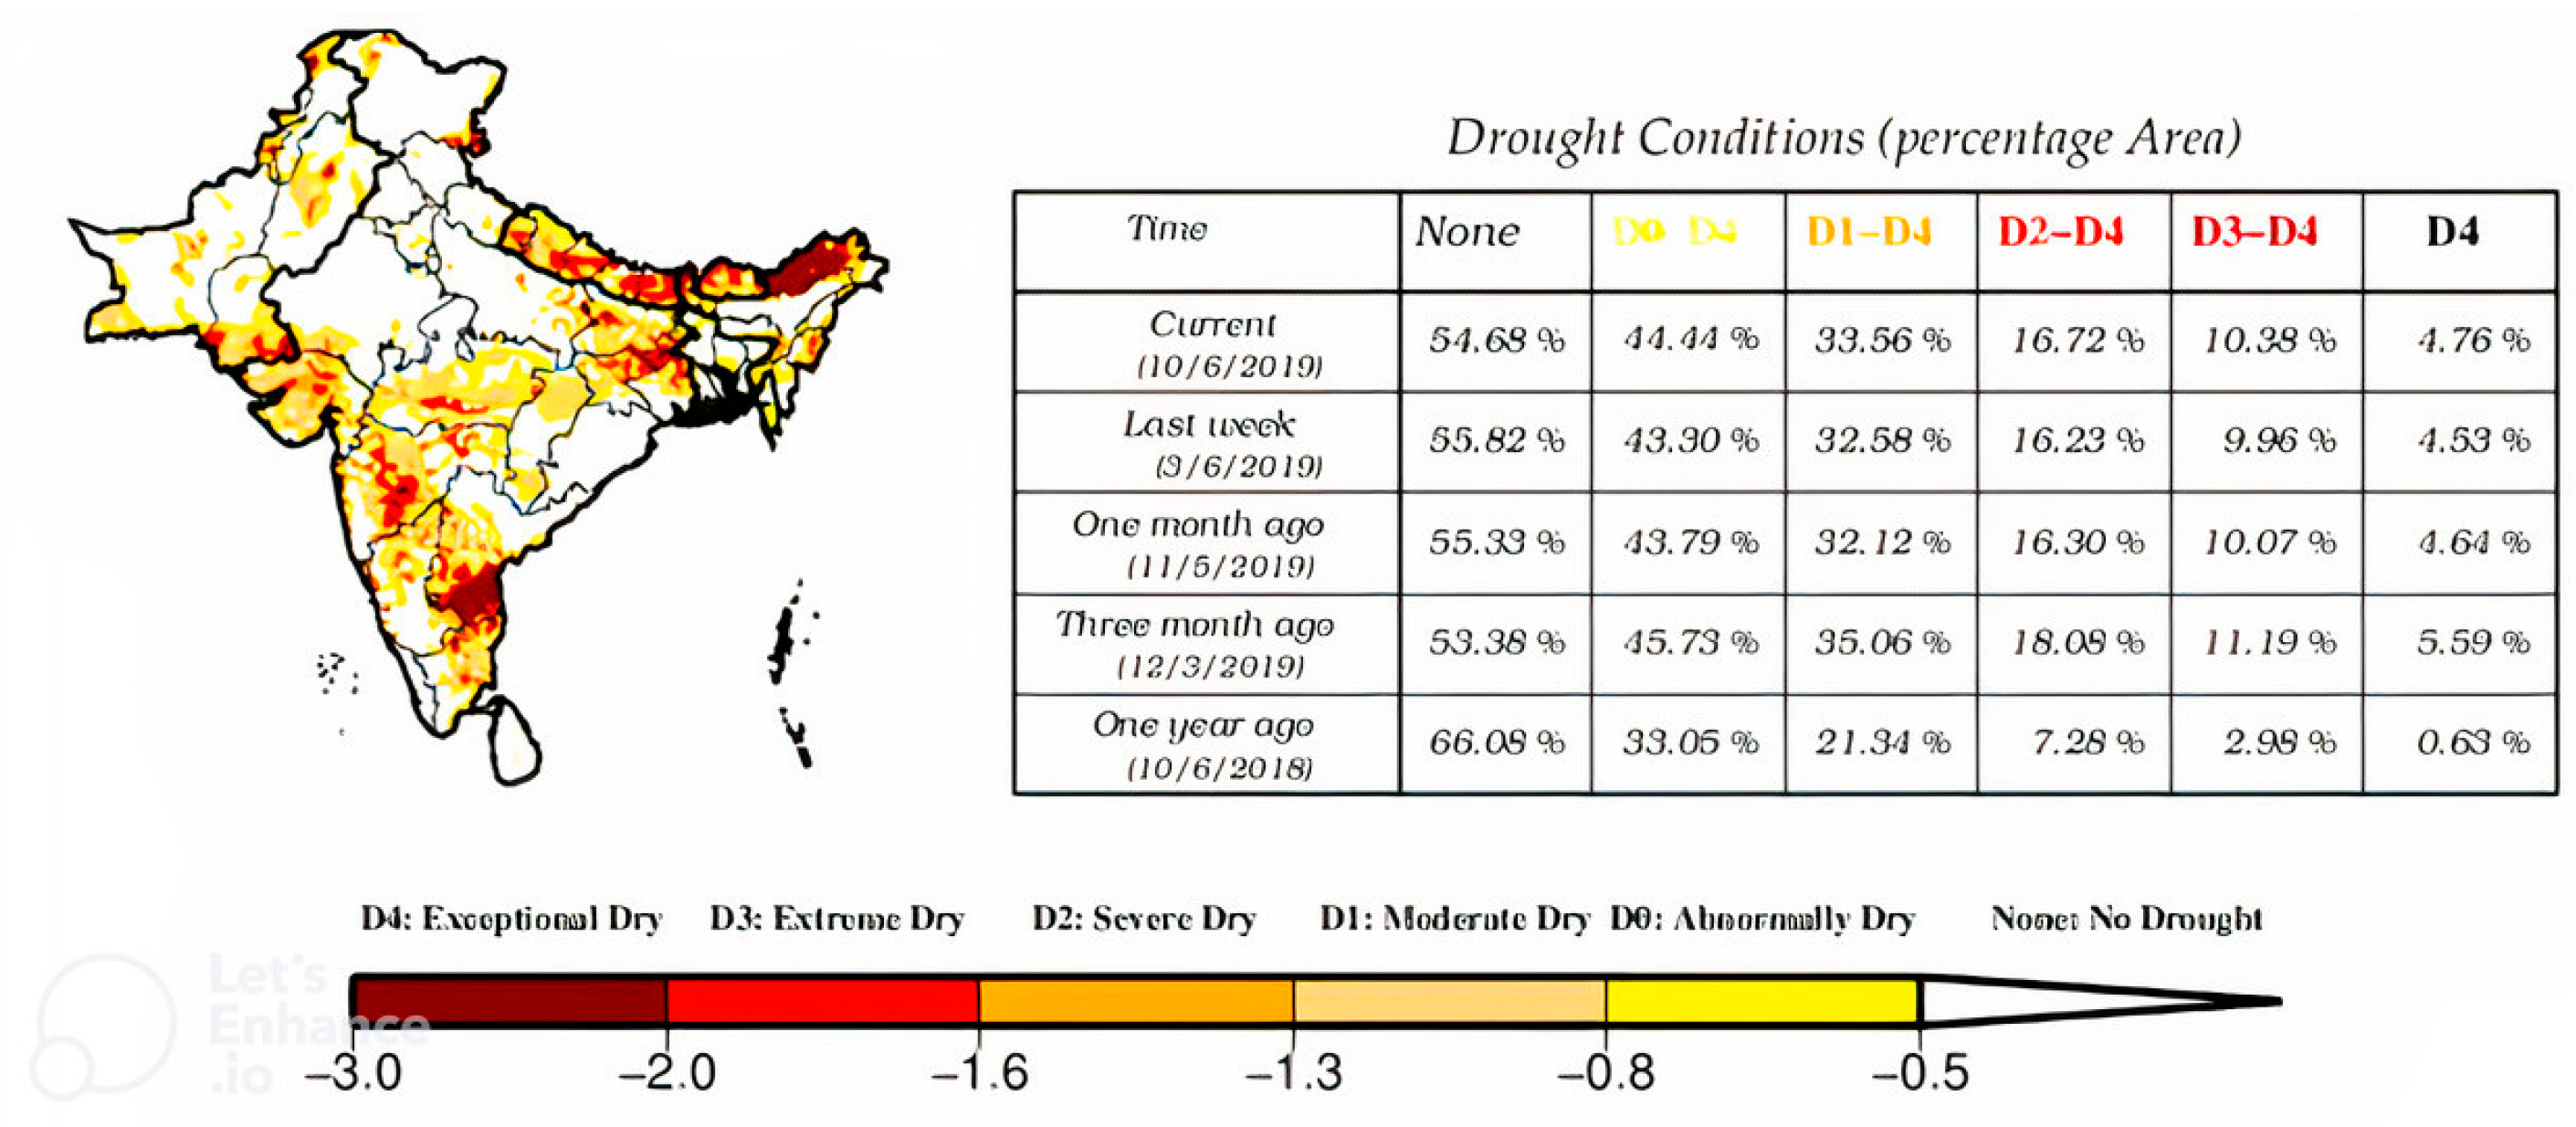
The country’s average annual rainfall is 300–650 mm, and the average temperature is approximately 25 degrees Celsius. India has 29 states and 7 union territories and is divided into several subdivisions by the India Meteorological Department (IMD) for weather monitoring. According to the drought early warning system, more than 40% of land in India was facing drought in mid-2019, with 15% considered extremely dry [21] as shown in Figure 1. It was roughly four times the spatial extent of drought compared to one year before, according to data for the week ending 10 June 2019. Maharashtra, Bihar, Rajasthan, Jharkhand, Gujarat, Andhra Pradesh, Karnataka, parts of the north-east, Telangana, and Tamil Nadu are the worst hit. These states are home to almost 500 million people, which is approximately 40% of the country’s population
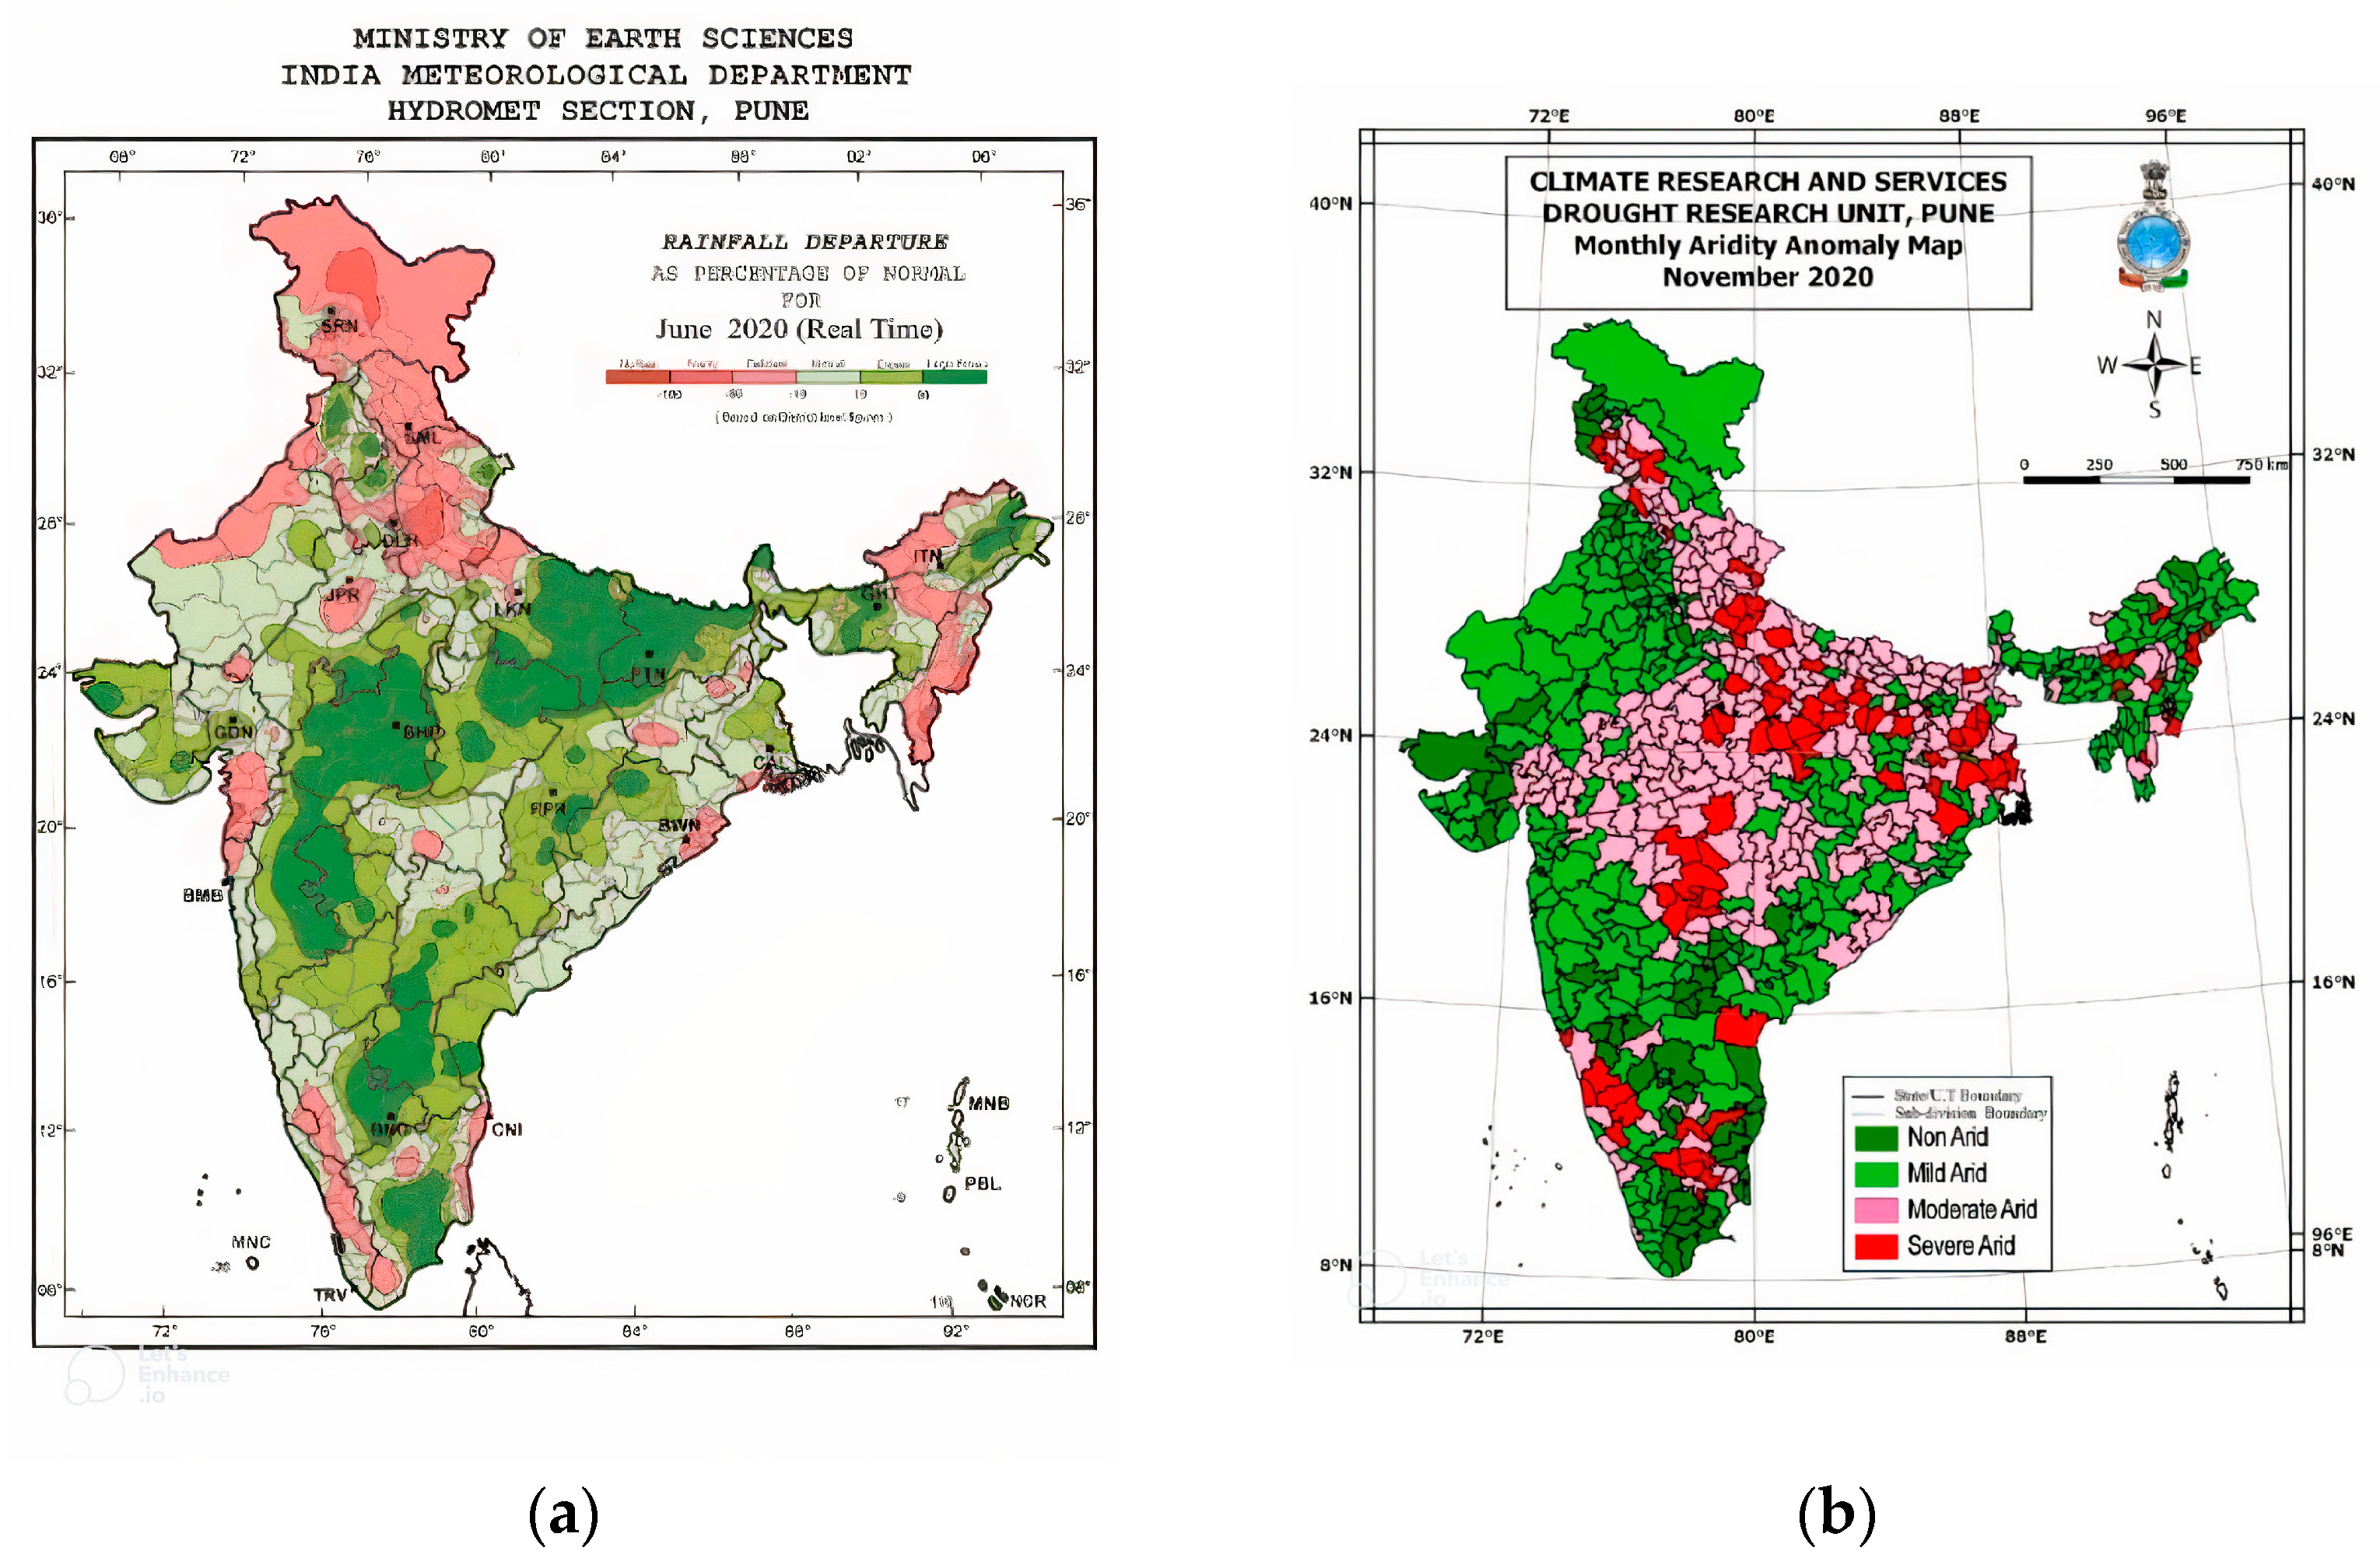
The south-west monsoon starts in June, and the north-east monsoon starts in October in India. The country received significant rainfall over most regions during the southwest monsoon in 2020 except for a few states, such as Jammu and Kashmir, Himachal Pradesh, and Uttarakhand. However, some regions in Tamil Nadu, Karnataka, Madhya Pradesh, and Uttar Pradesh were affected by drought during the north-east monsoon [22]. Figure 2a,b represent the above-mentioned status.
The dataset used for this study is available in the Open Government Data (OGD) platform maintained by the Government of India. It contains 117 years (1901 to 2017) of monthly rainfall readings for 36 subdivisions covering all the regions of the country.
2.1.1. Analysis of Rainfall
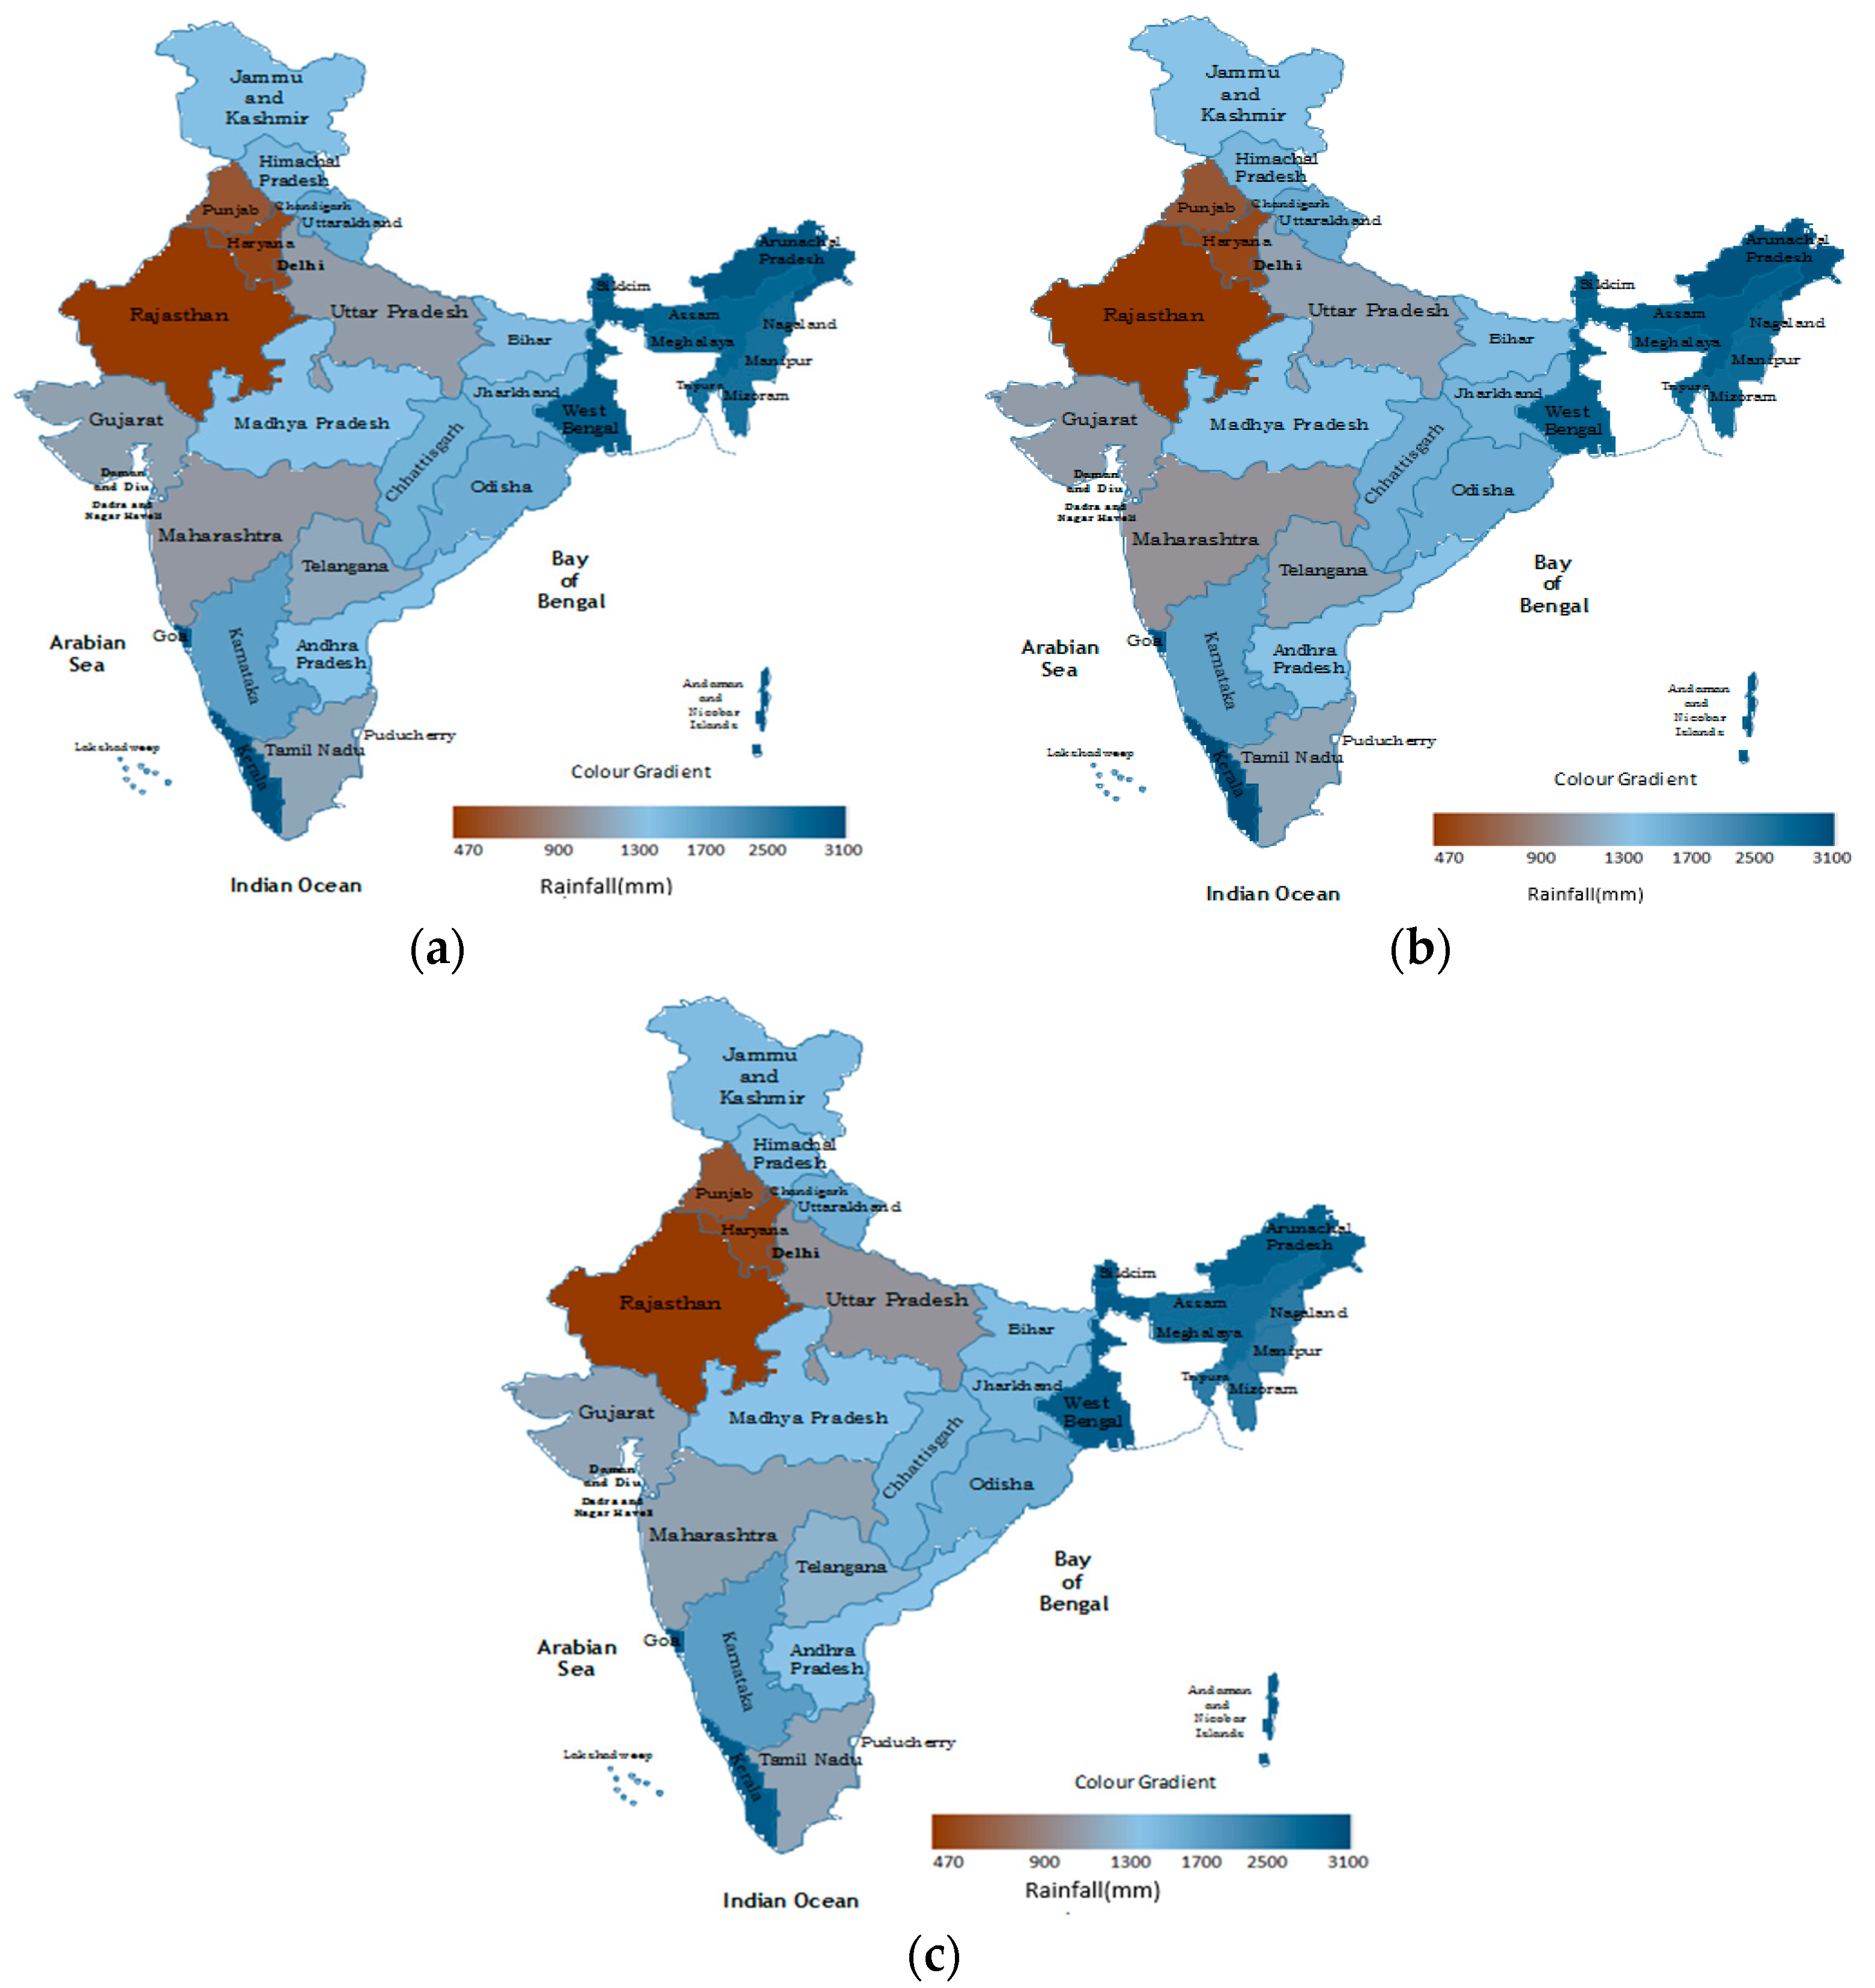
Descriptive analytics is the initial level of data analytics that helps to understand the data, its pattern, and the cause of occurrences [23]. In this study, descriptive analytics have been performed on the rainfall dataset of India in three aspects: (i) the entire 117 years (1901–2017), (ii) the first 67 years (1901–1967), and (ii) the recent 50 years (1968–2017). The first case is helpful in understanding the rainfall status of the country in the 20th century, while the second and third cases allow for a comparison of recent trends with older and long-term ones. This is especially relevant in the context of climate change and the consequent shifts in precipitation and temperature patterns. The average annual rainfall maps of regions in India for the three timelines described above are presented in Figure 3. It can be seen that Rajasthan, Punjab, and Haryana consistently receive very low rainfall, while Tamil Nadu, Maharashtra, Telangana, Gujarat, and Uttar Pradesh receive less rainfall than usual. The north-eastern states, West Bengal, Kerala, and Goa receive the highest levels of rainfall. All other states receive normal rainfall. Slight differences can be seen between the maps in Figure 3.
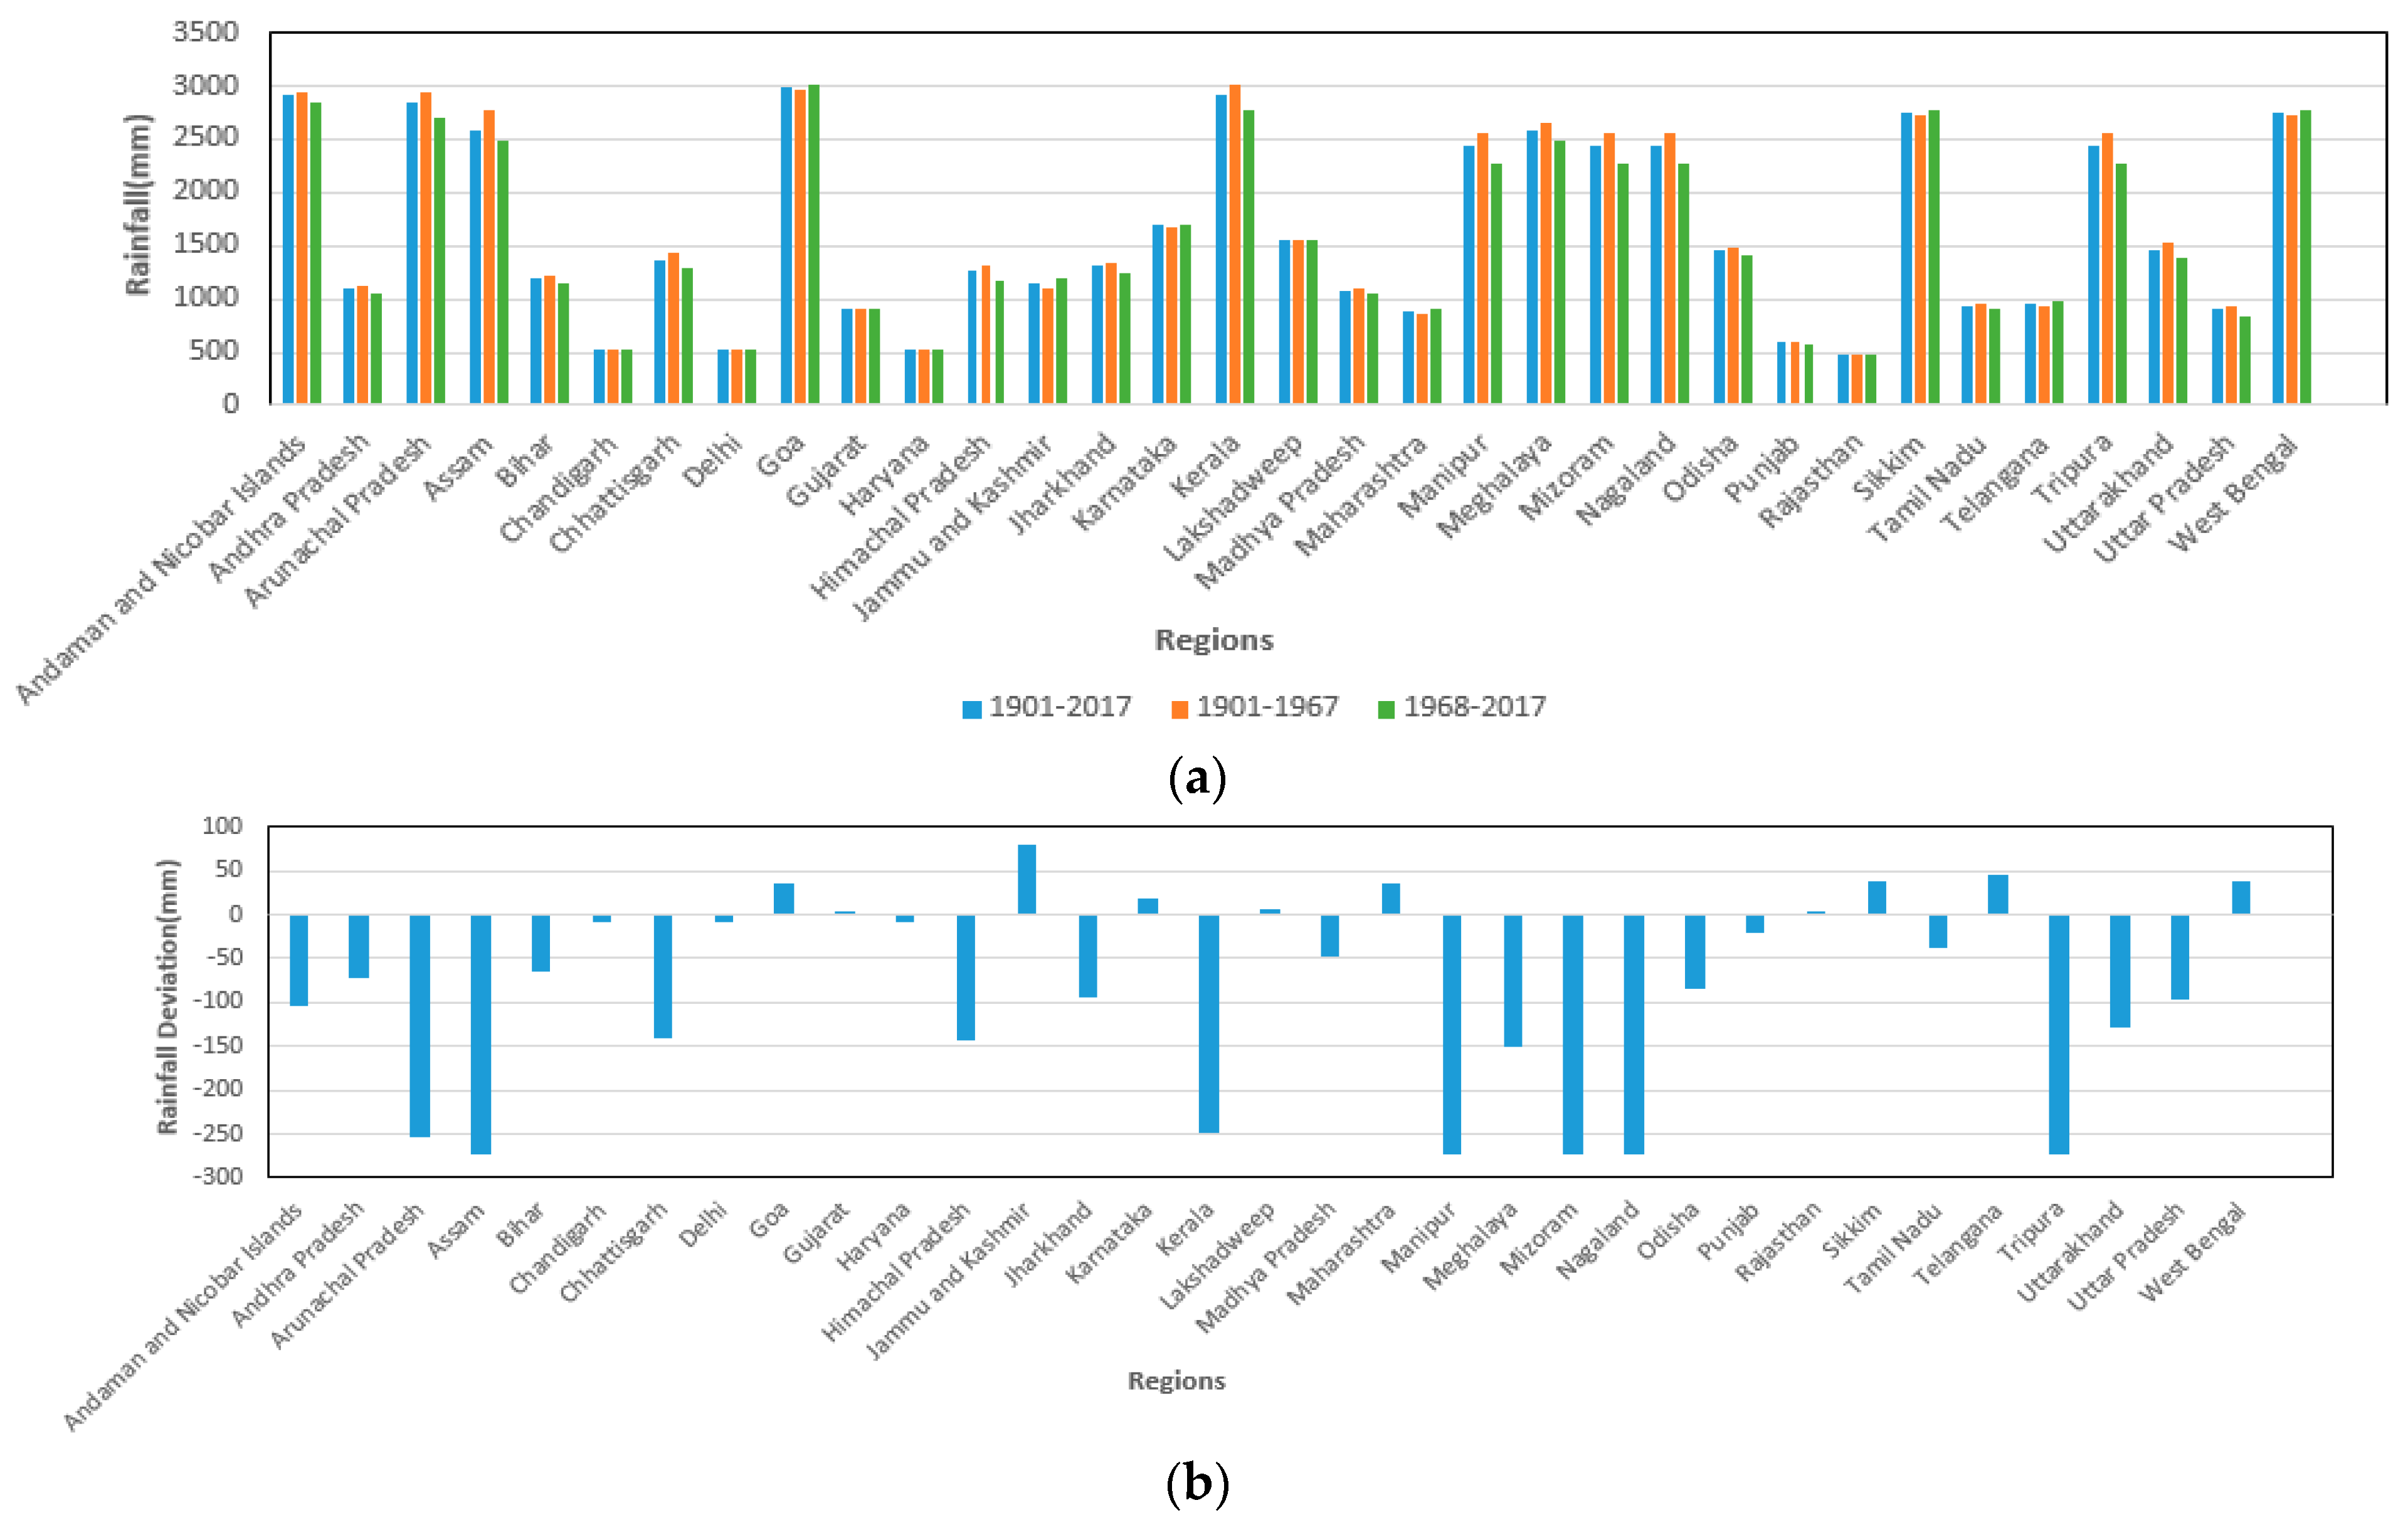
Rainfall received in recent years varies to a certain degree compared to the previous 67 years. Most states received less average annual rainfall from 1968 to 2017 except for a few states, such as Goa, Jammu and Kashmir, Maharashtra, Sikkim, and West Bengal. These state-wise differences are better perceived in Figure 4a. Figure 4b depicts the average rainfall deficit in recent 50 years as compared to the earlier two-thirds of the previous century. The plot shows a significant reduction in many regions of the country, especially the states of Kerala, Uttar Pradesh, Andhra Pradesh, and the generally rain-rich regions of the north-east, etc., up to a maximum of 273 mm. The regions that typically receive heavy rainfall have significantly declined in recent years.
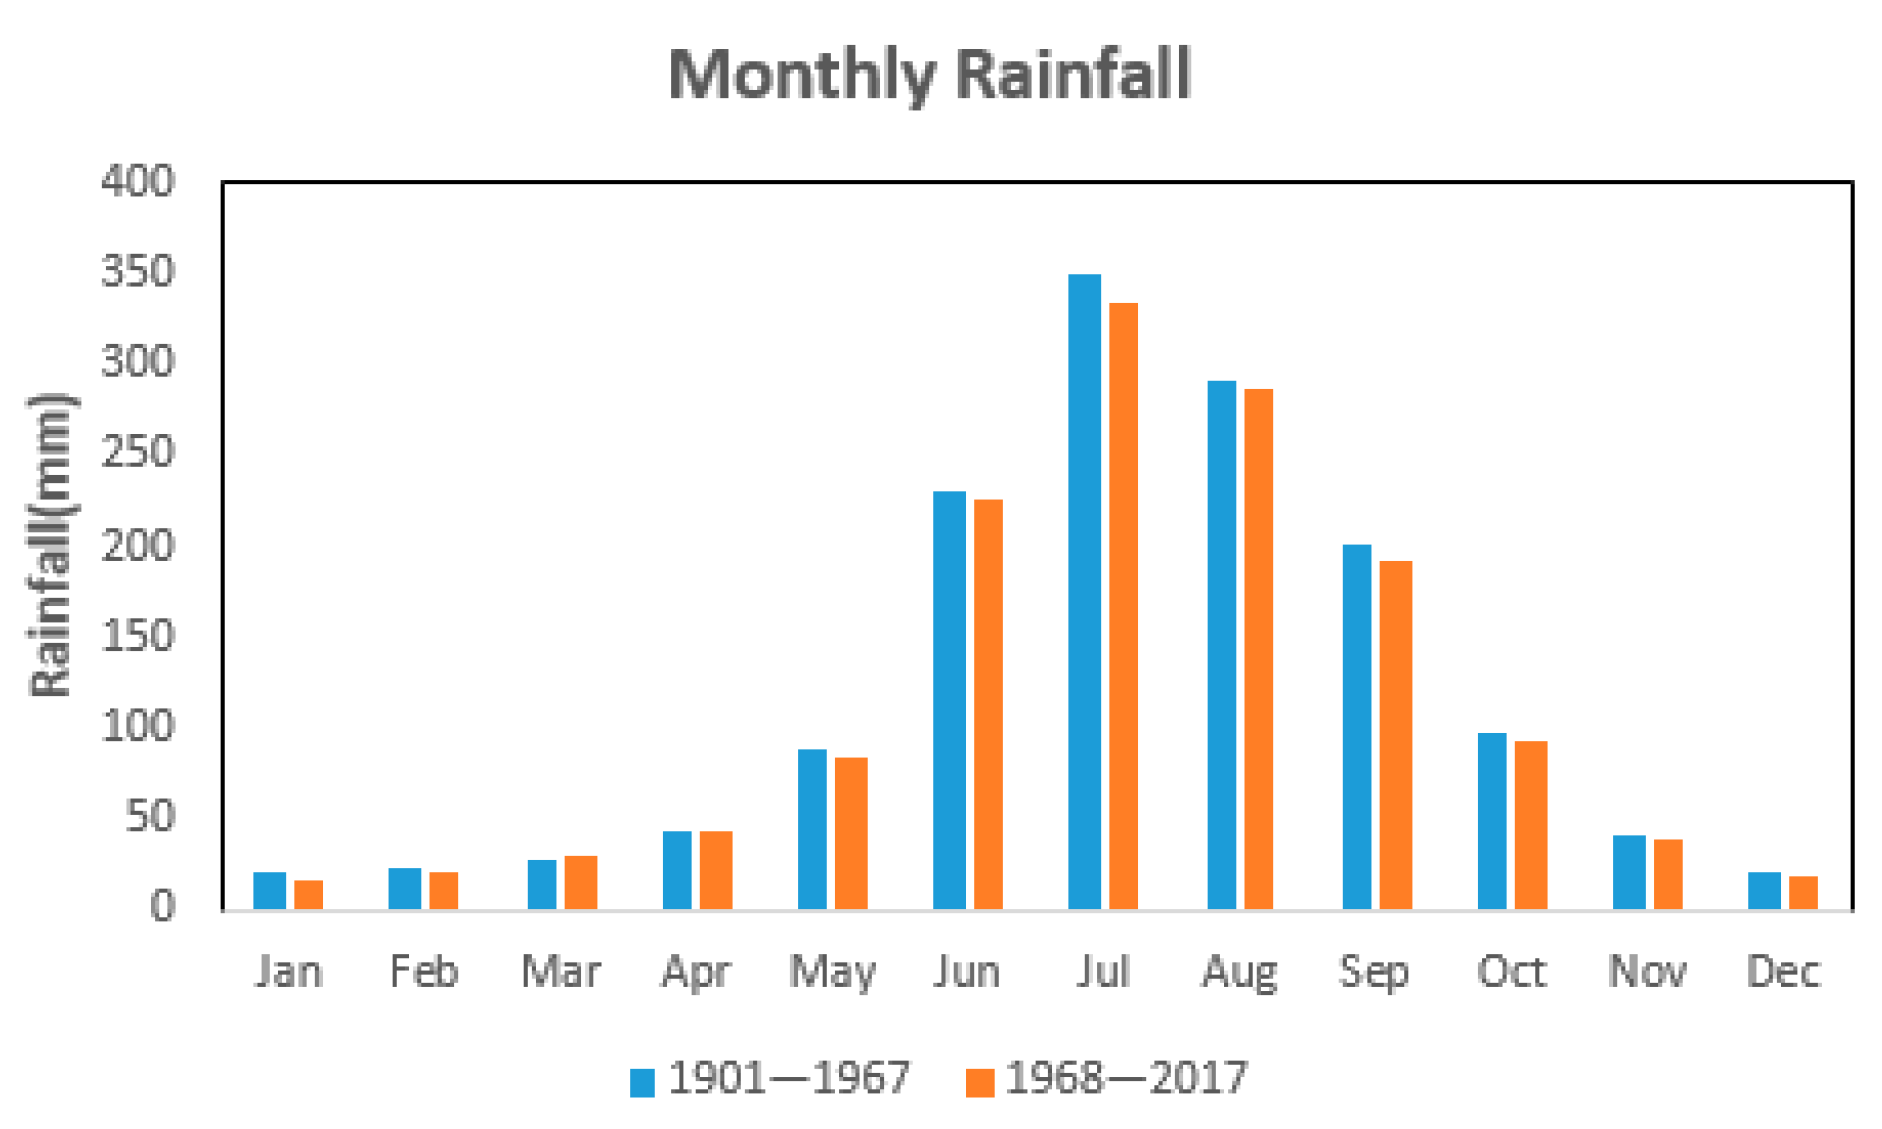
The distribution of annual rainfall across the different months is shown in Figure 5. It is immediately apparent that approximately 75% of the total rainfall is received during the south-west monsoon season, generally starting every year between June and July. The country receives a maximum rainfall of approximately 300–350 mm in July and a minimum rainfall in January of approximately 16–18 mm. It can be seen that the rainfall in July has visibly reduced in recent years as compared to the long-term value. The descriptive statistics of average monthly rainfall for the first 67 years and the recent 50 years are presented in Table 1. While the mean, median, standard deviation, range, maximum, and sum of monthly rainfall have decreased marginally (~2–3%) in recent years, it is seen that the minimum monthly rainfall shows a significant (14%) decline. This suggests that the dry months are getting further drier. Hence, the probability of the scarcity of water in certain regions leading to severe drought is increased. Drought analysis is performed for the past years in the following subsection.
2.1.2. Analysis of Drought
The rainfall analysis in the previous section shows that the country could experience significant drought conditions in the forthcoming years. However, to confirm the occurrence of drought and its severity level, analyses are carried out with drought indices. While quite a few indices exist to quantify drought conditions, the SPI is preferred in this study due to the following advantages of this particular index: (i) ease of use since it requires only precipitation data; (ii) applicable regardless of the region; and (iii) flexible enough to be calculated at different time scales [24]. The performance of SPI was also found to be better than SPEI and PDSI in our previous research work [25]. SPI is formulated based on gamma distribution as follows:
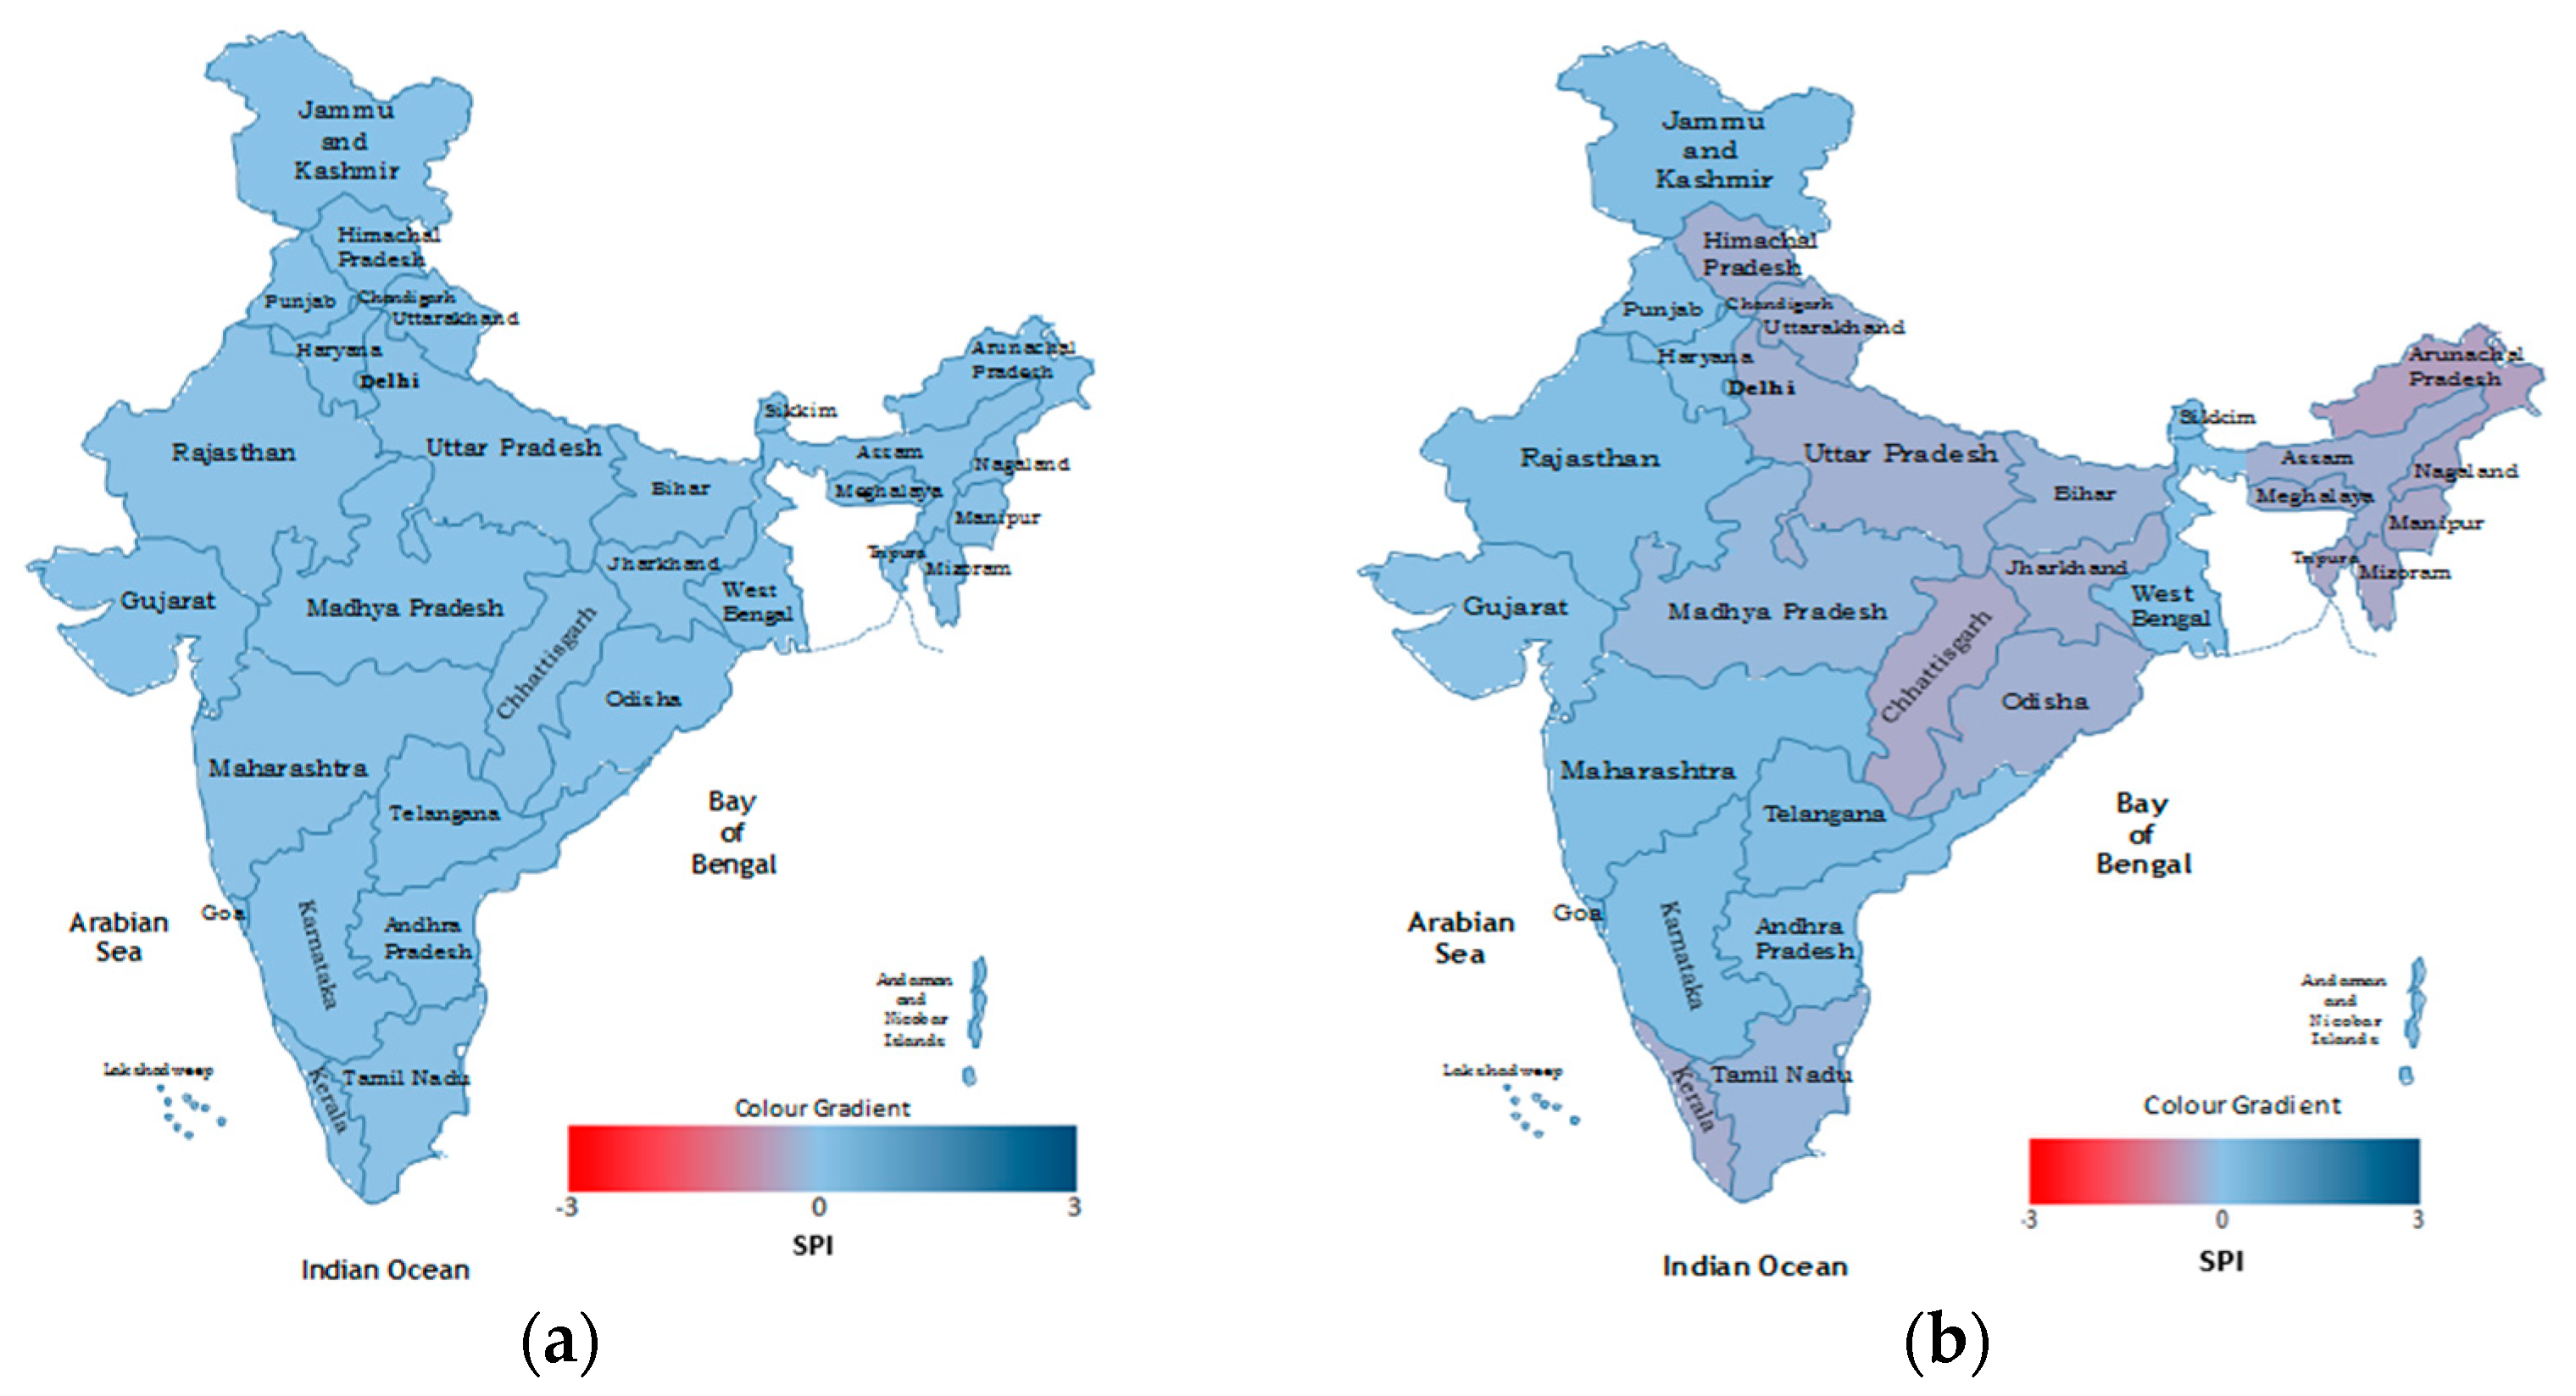
where x is the precipitation, α is a shape parameter, β is a scale parameter, and Γ is the gamma function [26]. A region’s dryness or wetness level is categorised based on the SPI values [27] as listed in Table 2. Drought can be calculated based on a minimum of 1 month to a maximum of a 24 month timescale. To estimate agricultural drought, it is appropriate to apply a 6 month timescale, since the seasonal crops’ maximum growing period lies between 4 to 6 months. Predicting the drought 6 months ahead might help decide upon sowing suitable crops, thus it is implemented in this work. Analysing drought for the past 117 years in India (shown in Figure 6a), the wetness level is near normal all over the country. However, in the recent 50 years (shown in Figure 6b), it is apparent that states such as Kerala, Tamilnadu, and the north-central and eastern regions of the country have been affected by mild drought. Regions that traditionally experience heavy rainfall exhibited a significant decrease in rainfall in recent years. Thus, a notable deviation (maximum value of −0.518) is apparent for the SPI for such regions. Region-wise drought analysis indicates that some states are severely affected for a specific period.
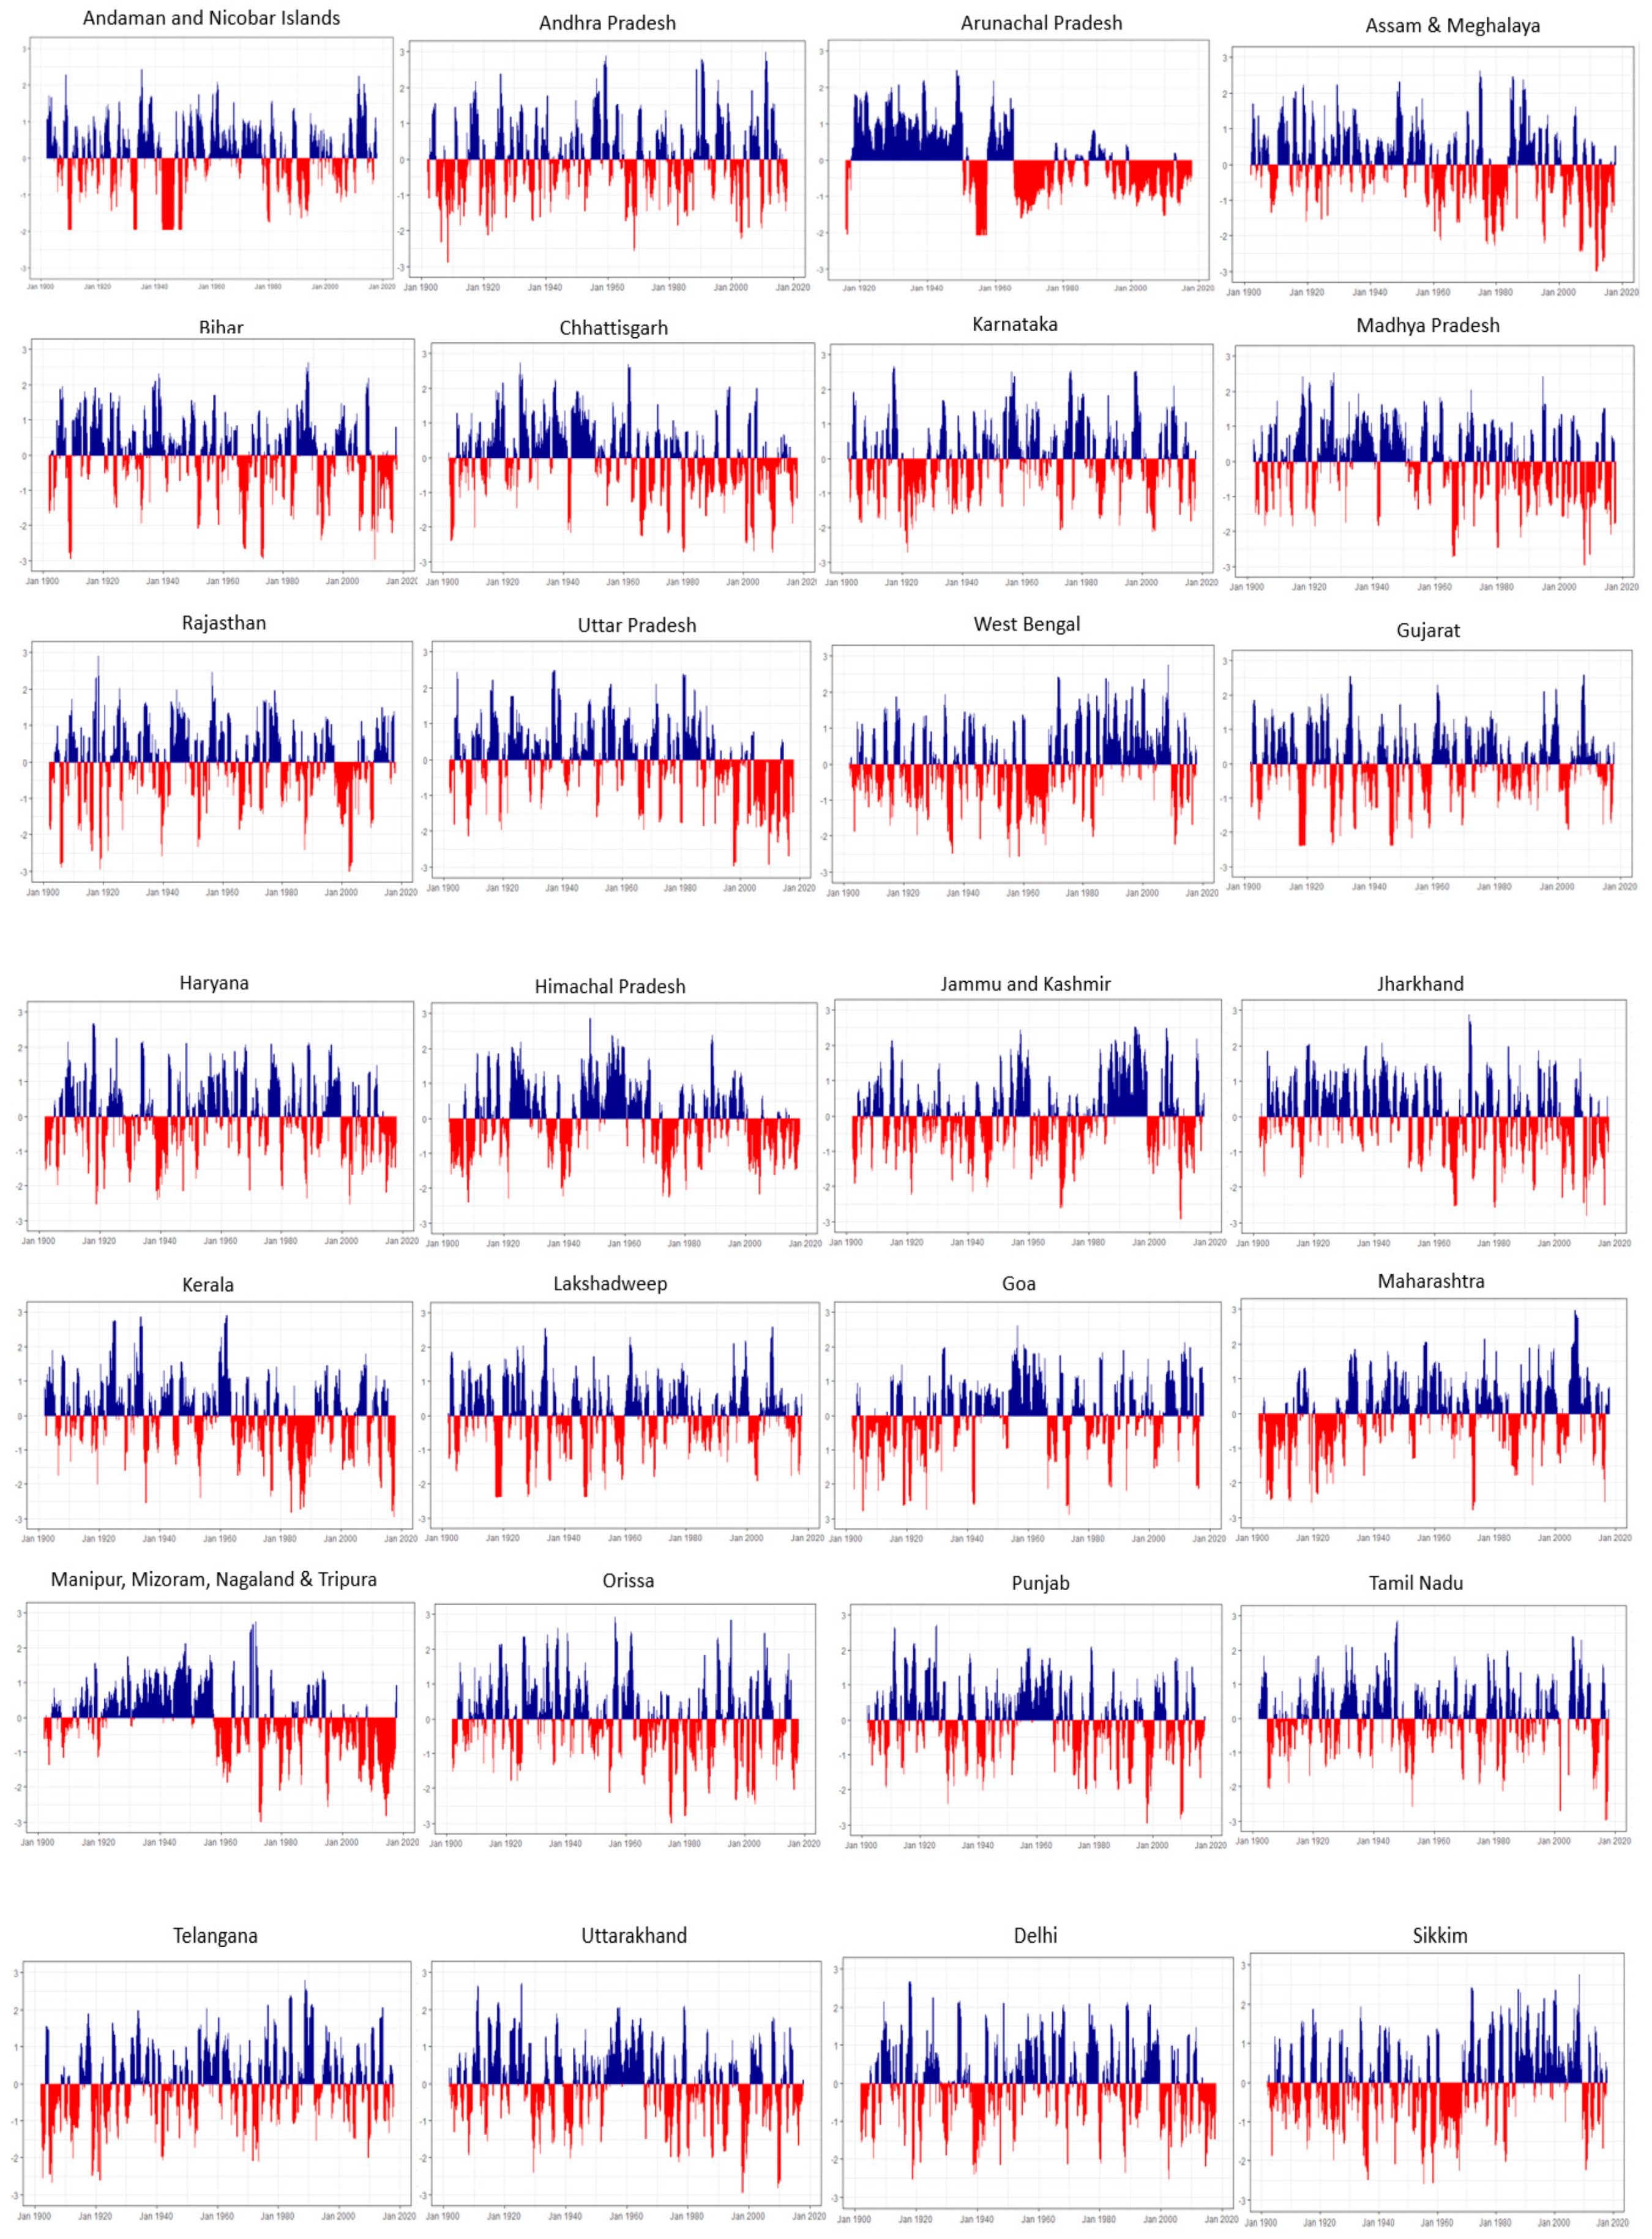
Figure 7 shows the SPI drought index ranges for the various states and territories of India over the past 117 years. Uttar Pradesh, Madhya Pradesh, Haryana, Jharkhand, Punjab, Tamil Nadu, Uttarakhand, and the eastern part of the country suffered moderate to severe drought in recent years. For example, Arunachal Pradesh was a moderately wet area during 1920−1950, whereas after 1965, the region experienced more moderate drought than in the wet years. Similarly, continuous drought was found to exist in most states in recent years due to which crop production was affected significantly. Analyses of rainfall and agricultural production data [28] show that variation in rainfall has historically been the primary reason for a reduction in agricultural production. Several other researches also confirm these facts [29,30,31]. If this situation persists, these regions may suffer from extreme drought in the future which could affect people’s livelihoods. Other regions may also gradually move towards drought.
2.2. Rainfall Forecast Using LSTM
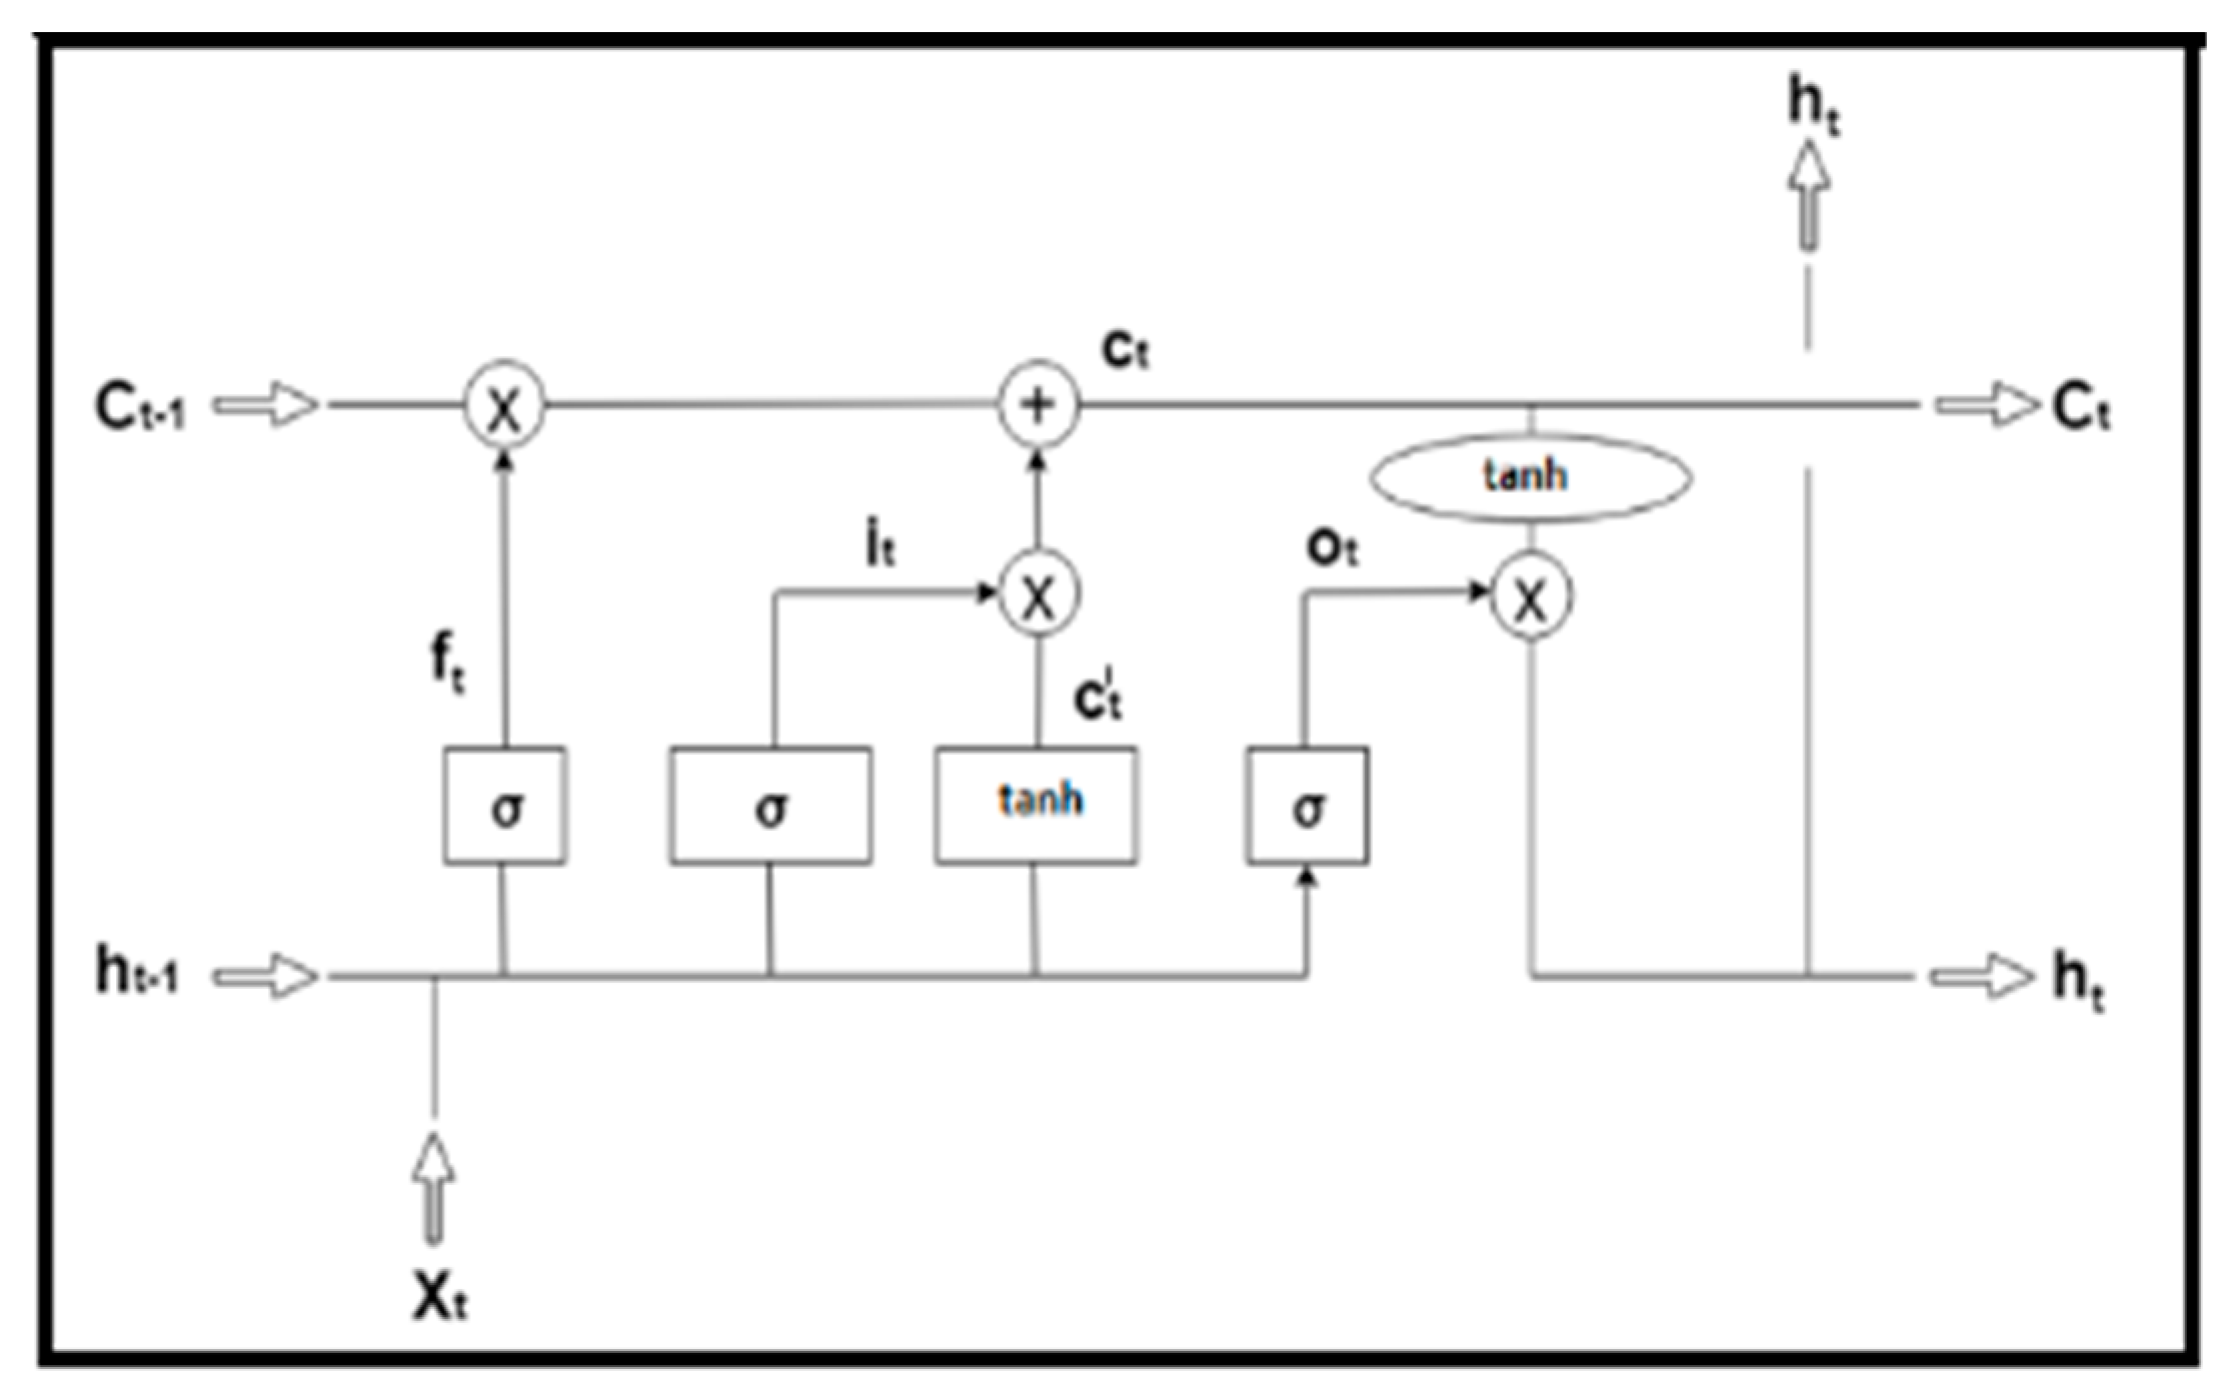
Long short-term memory (LSTM) is a complex unit embedded in the hidden layer neurons of a recurrent neural network (RNN) [20]. It is a model feasible for long-term time series forecasts due to three special gates and a cell state. The cell state (denoted by in the equations below) is the network memory that maintains previous state information of several time steps and is used for future predictions. The special gate units are termed as a forget gate, input gate, and output gate. Forget gate helps to reset the memory blocks in the cell state of LSTM, input gate supports the maintenance of the most relevant data for the current prediction in the , and the output gate delivers the current prediction along with the current hidden state . is the current time step. Every gate is applied with weight and bias which gets updated based on the error gradients during backpropagation. The following mathematical representations express the functionality of the model that is depicted in Figure 8:
The model takes rainfall values as x for t number of months and undergoes training during forward propagation. It compares the predicted rainfall value and the actual rainfall value during backward propagation using error function and gradient function, thereby learning to adjust the parameters to minimise the error. Finally, the optimal parameter values are applied to the model for test data to forecast future rainfall values.
The implementation is done using Python and the rainfall data are normalised using MinMaxScalar. The entire dataset is split into 80:20 ratio for training and testing. The learning rate is initialised as 0.01 with one hidden layer of size 200 neurons. Relu activation function is used in the hidden layer and linear function in the output layer to obtain the forecast rainfall value. The model is trained for 30 epochs with the batch size of 32. The inverse transform function is used to bring back the normalised rainfall values to the range of actual values. The Adam optimiser is used to finetune the network to capture the optimised network parameters, such as weights and bias of forget and the input and output gates. The error function used is mean squared error.
3. Results and Discussion
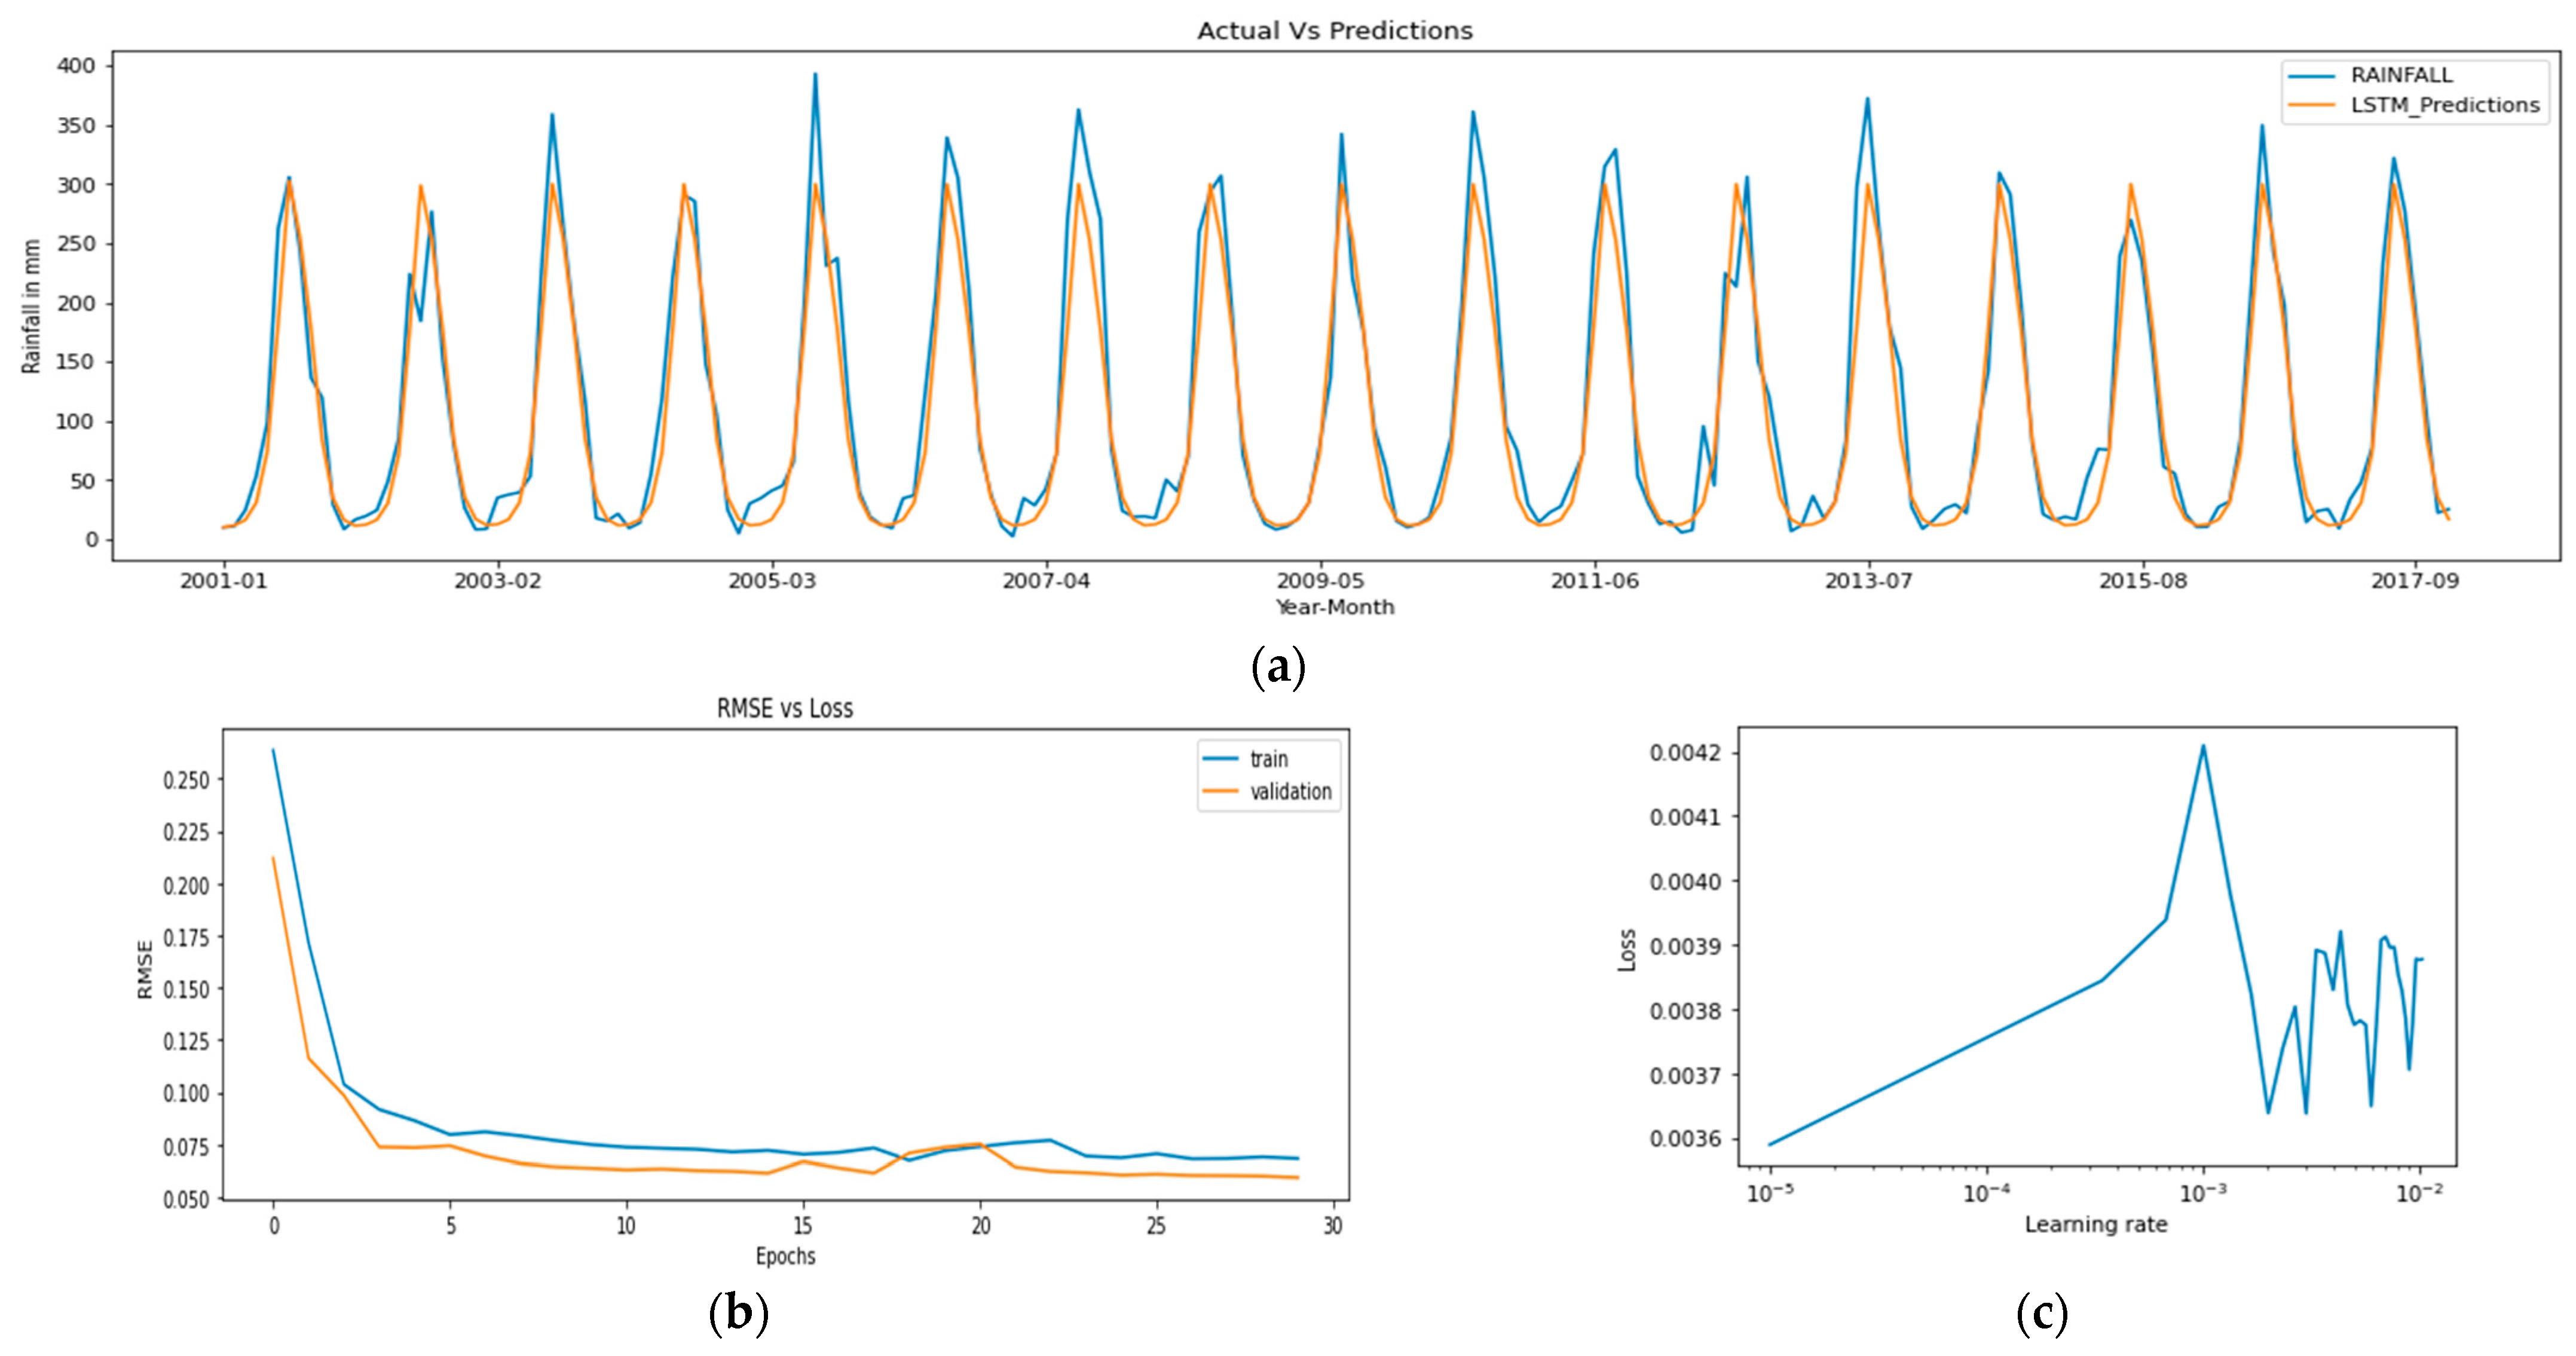
LSTM outperformed compared to other existing models for rainfall forecasting, such as the Holt–Winters method, autoregressive integrated moving average (ARIMA), vector autoregression (VAR), traditional artificial neural network (ANN), the and recurrent neural network (RNN) in the previous work [25]; hence, it is chosen for the current work. The LSTM network is trained using the average monthly rainfall from 1901 to 2000 and the model is tested with the average monthly forecast from 2001 to 2017. Figure 9 shows the model prediction performance for the test dataset (2001–2017) using various evaluation metrics. The predicted rainfall values follow the actual monthly rainfall signal to a large extent, as seen in Figure 9a. Minor seasonal fluctuations aside, the primary mismatch is in capturing the peaks of the wettest months. The performance metrics of the model are computed and it is seen that RMSE for the training data are 0.068 while that for the test data are 0.059. The error is minimised at every epoch initially, with no significant changes identified after 25 epochs, as seen in Figure 9b, and thus the training ends. The network loss drops steeply in the initial phase as it learns the data pattern deeper for a longer time step. Thus, the loss is decreased to 0.0036 at a learning rate of 10−5 as shown in Figure 9c. Significant improvement is not found in the results on increasing the number of hidden layers and thus fixed to 1. Overall, the model produces adequate results by efficiently handling long-term dependencies due to the presence of the cell state vector that uses previous predictions and special gates for enhanced learning.
Rainfall Forecast and Drought Analysis in Future
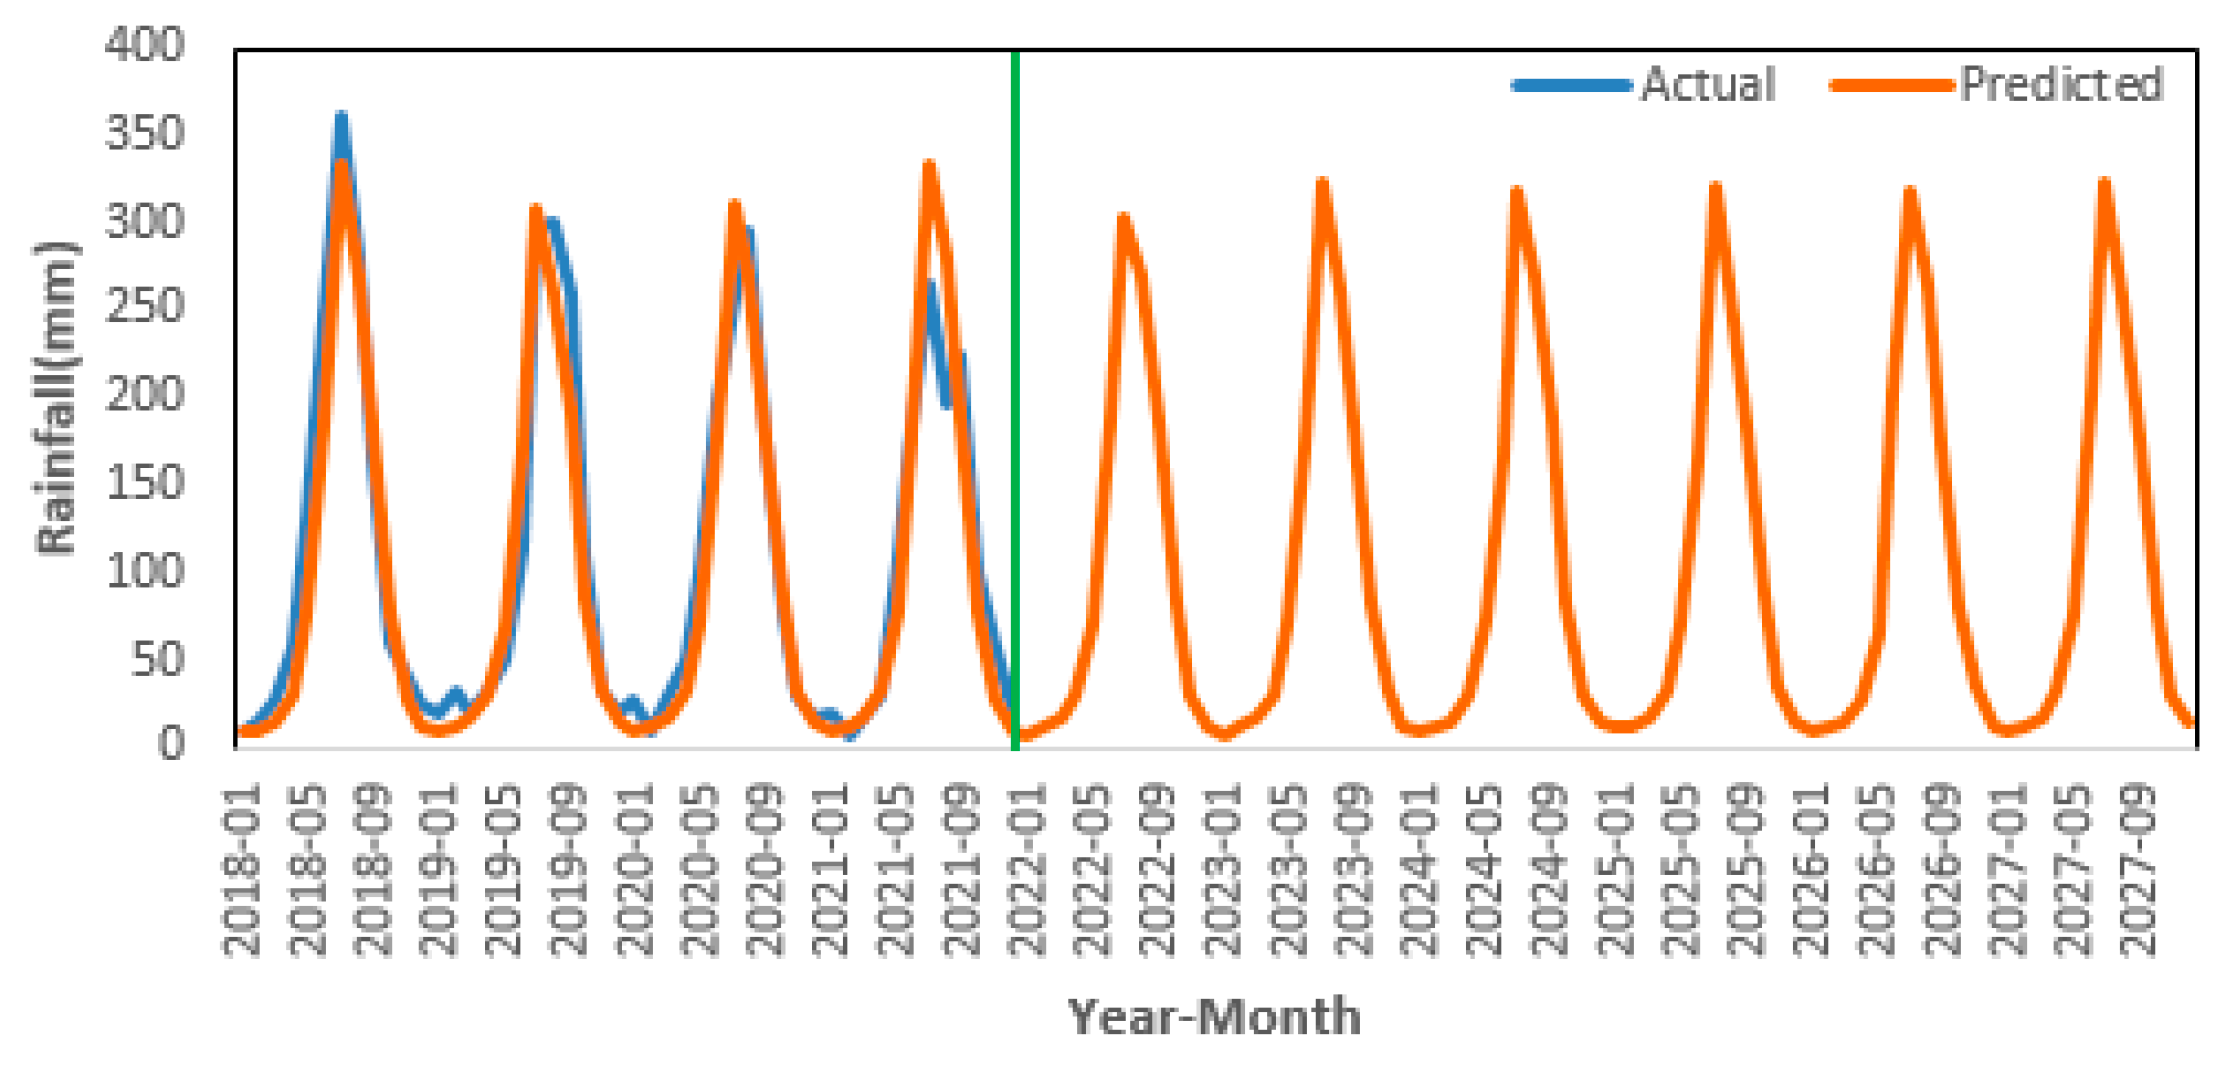
The performance of LSTM was found to be satisfactory; hence, rainfall is forecast for the upcoming years. The forecast of the annual rainfall and maximum rainfall level of India are shown in Figure 10 and Table 3. The current dataset contains rainfall observations until 2017. Data were collected from IMD annual reports for 2018 and 2019 [32,33] and 2020–2021 from several web sources. Forecasts were carried out for the period from 2018 to 2027 in which 2018–2021 was used for further validation and 2022–2027 is a pure forecast. The green line in Figure 10 depicts this split in the timeline. India received 1419.81 mm of rainfall in 2018, whereas it was reduced to 1285.7 mm in 2019, 1267.1 mm in 2020, and 1236.4 mm in 2021. The prediction almost matches the actual level.
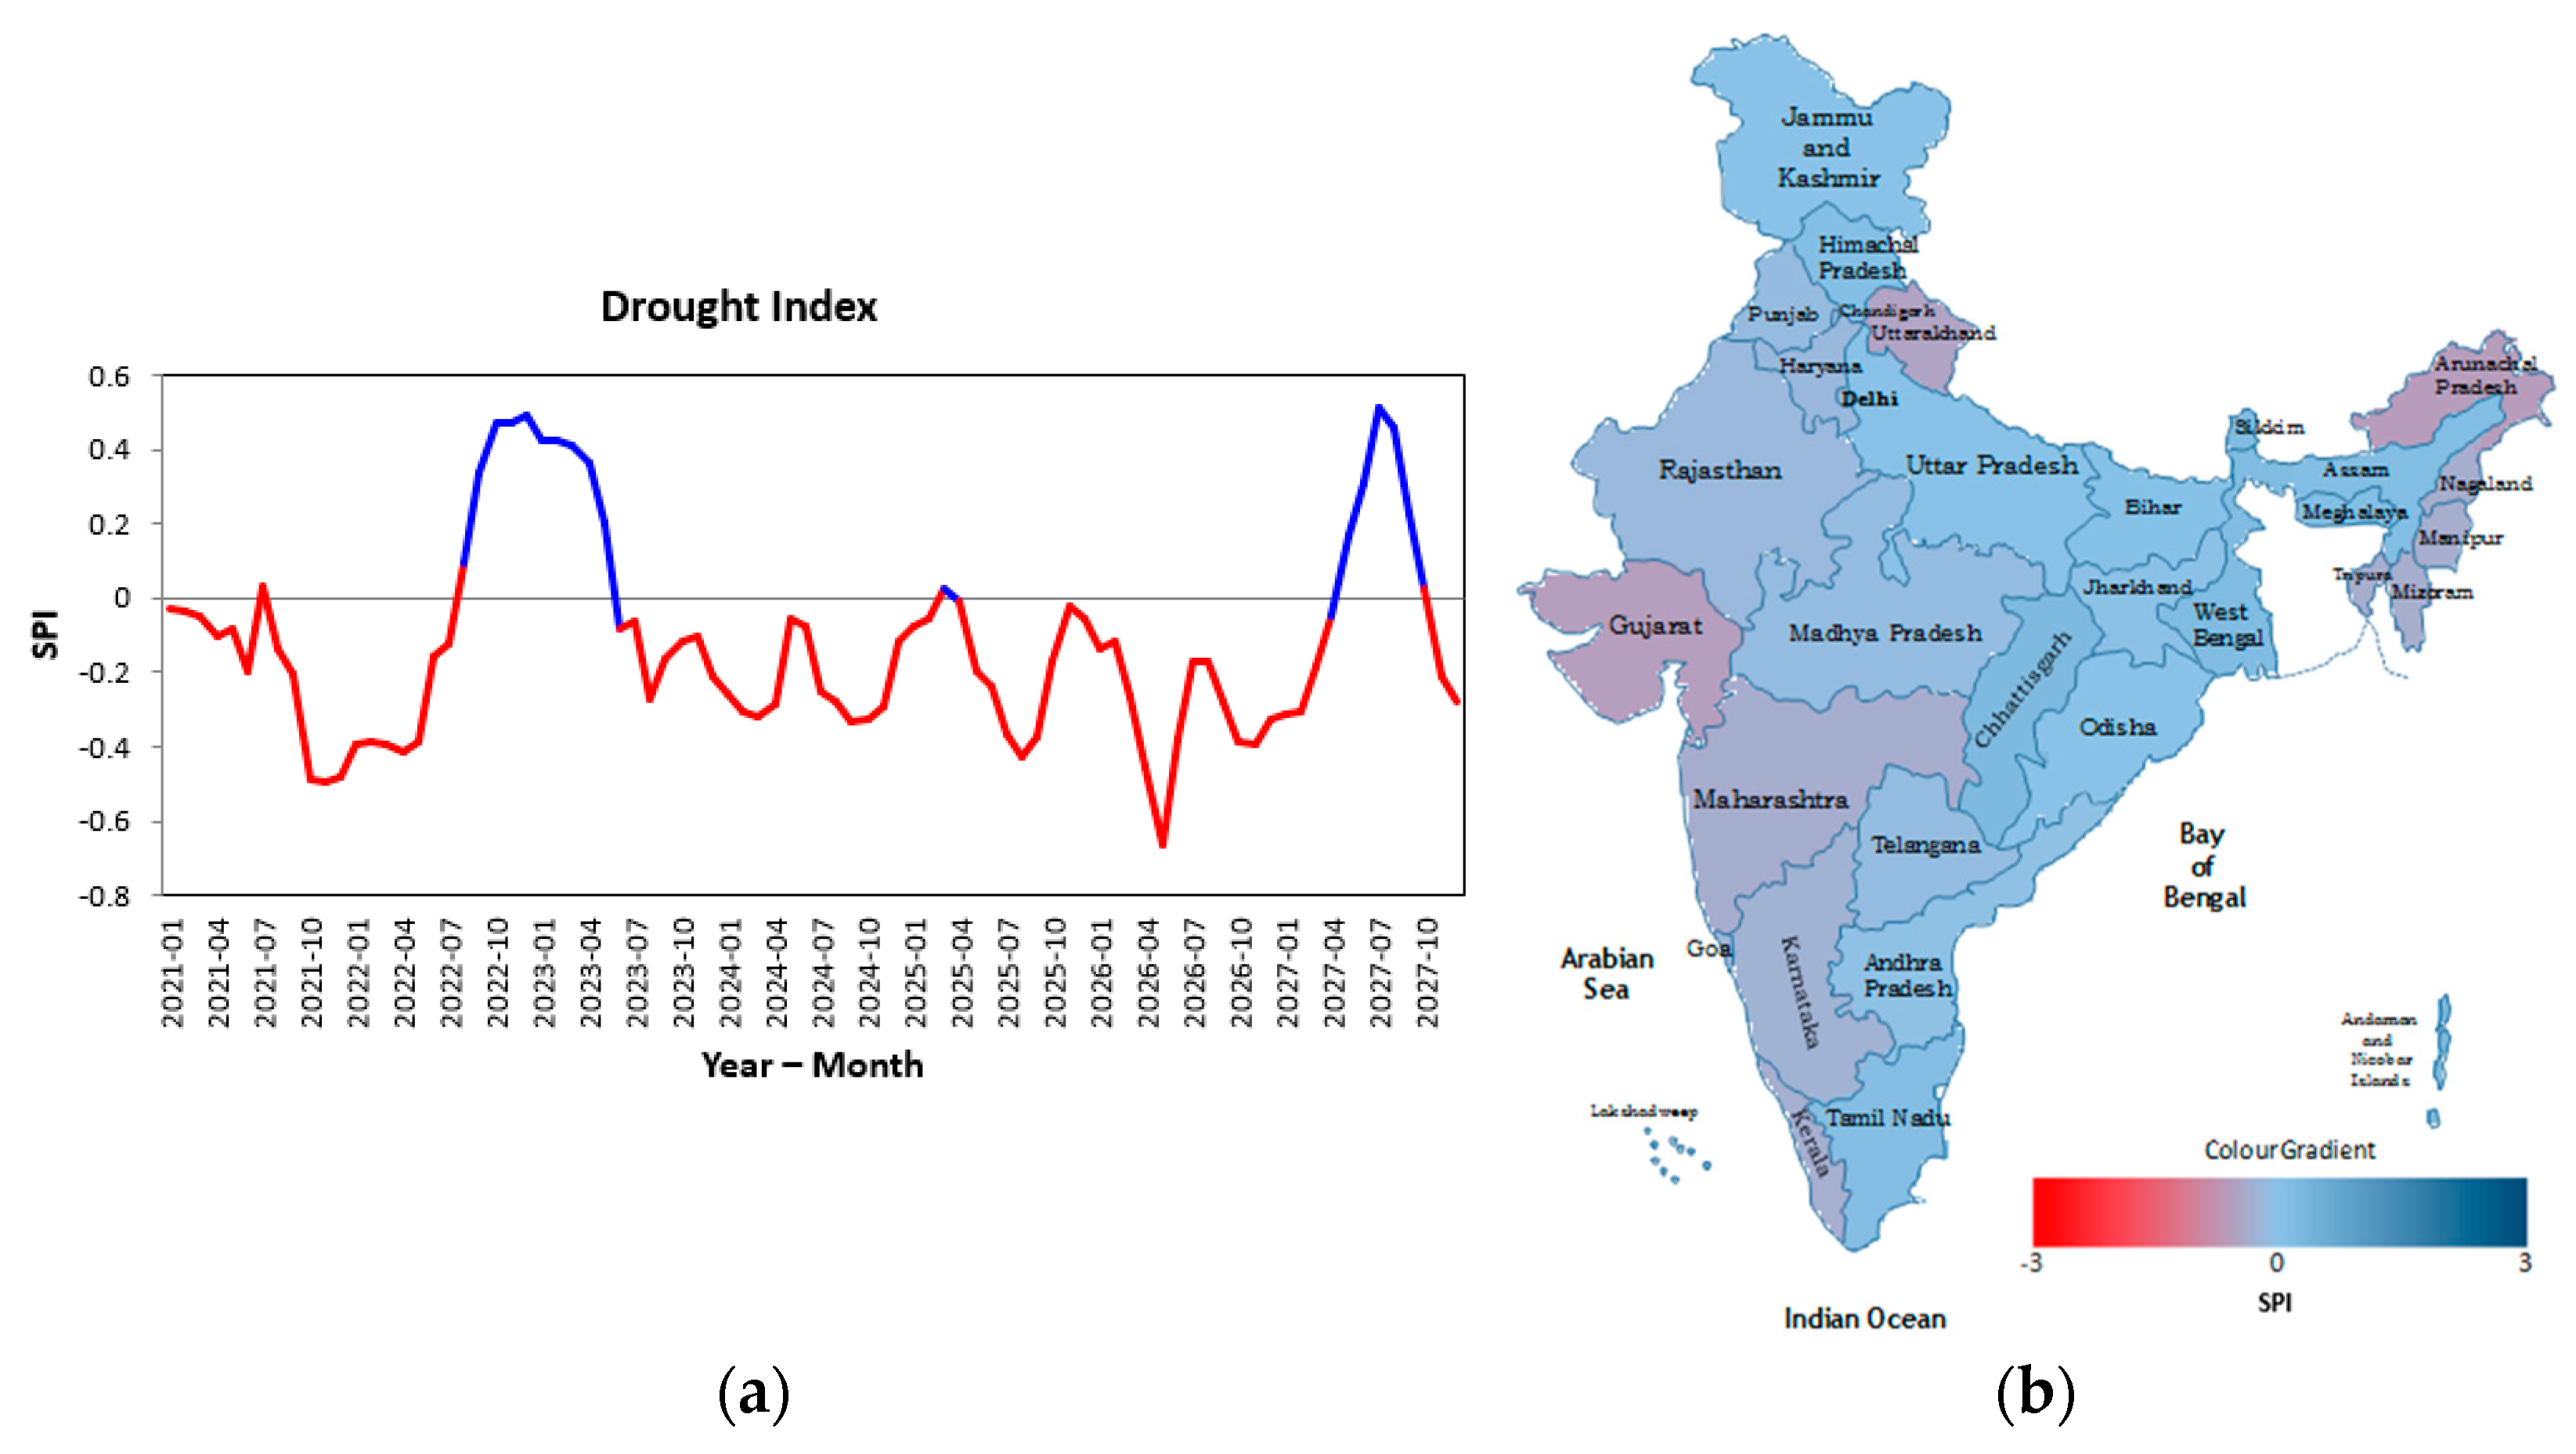
The year 2021 has more rainfall than the next 6 years with 1242.75 mm, whereas 2022 may receive less rainfall with 1206.88 mm as per the forecast. From 2023 to 2027, annual rainfall is almost in the same range and the maximum level are around 300 mm. Referring to Table 1, the average annual rainfall for first 67 years is 1428.34 mm, whereas it was reduced to 1380.15 mm in the recent 50 years, and in the next 7 years, it becomes 1218.2 mm. As per the analysis, the rainfall decreases significantly as the years go on. Based on the rainfall forecast, drought characteristics are estimated for the forthcoming years. The implementation is carried out using R programming and a SPI function with a 6 month timescale is used for calculating the drought index. According to the analysis, there is a possibility of drought occurrence in upcoming years due to a decrease in rainfall as per the prediction. The country is found to be mild wet from July 2022 to April 2023 and from April 2027 to October 2027, as shown in Figure 11a, and the remaining period may be affected by mild drought with a maximum SPI value of 0.7.
On the other hand, the rainfall intensity for 2022 is less than 2021, but the drought index is predicted to be mildly positive during that time. It happens due to the distribution of adequate rainfall over both the south-west and north-east monsoon seasons, whereas the rest of the years, except 2027, receive more rainfall during the south-west monsoon and less rainfall from the north-east monsoon. However, the annual rainfall has been less than normal over the past years. The real time rainfall statistics of India 2021 are compared with the rainfall forecast from this work to demonstrate the efficiency of LSTM model. As per the report of IMD [34], the actual cumulative rainfall of the country is 1236.4 mm and the prediction shows 1242.75 mm, according to the values plotted in Figure 10. The accuracy is approximately 99.49%, which is an outstanding forecast accuracy for real-time data with just 6.35 mm difference in prediction. The report too confirms the existence of mild drought as depicted in Figure 11a. Figure 11b shows the state-wise drought forecast for the upcoming years till 2027. Mild drought may affect the south-west and north-east parts of India.
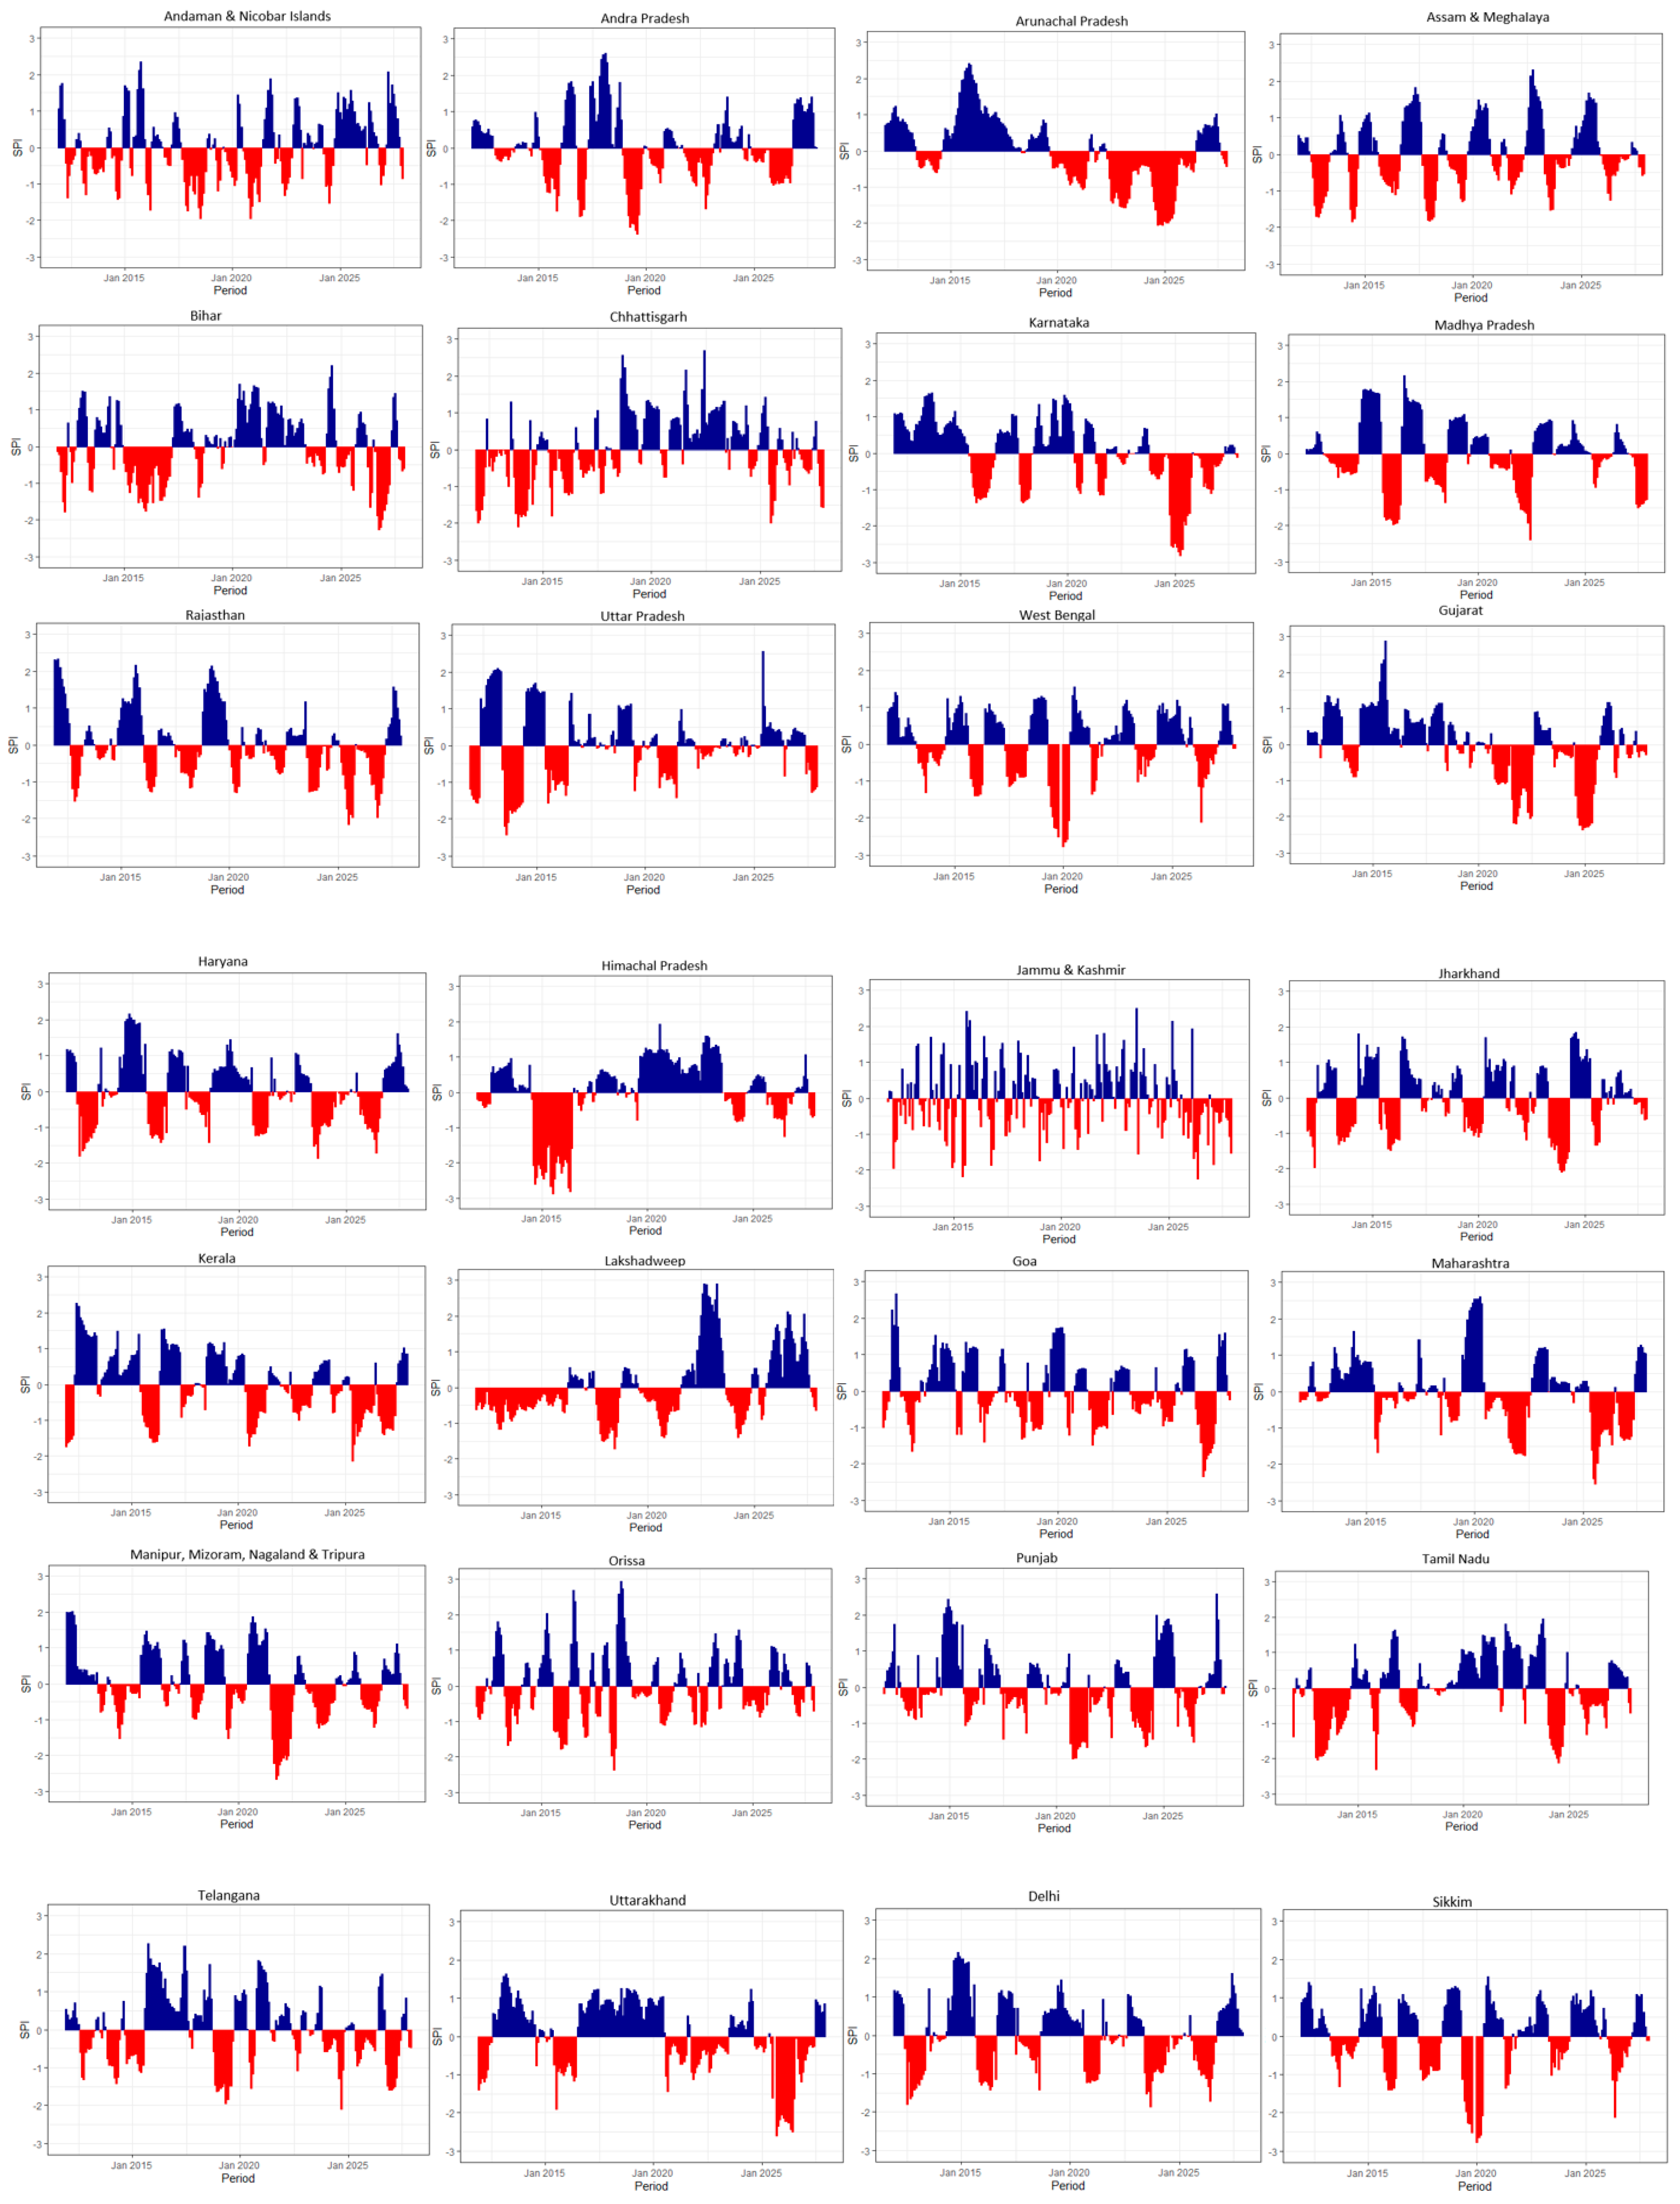
Figure 12 shows a clear picture of region-wise drought analysis for both the past and future. The existing researches utilise the history of rainfall data to estimate the drought of previous or forthcoming seasons, whereas this work determines the drought based on forecasted rainfall using the machine learning model, as discussed above, with preferable outcomes. Except for Arunachal Pradesh, all other states of the country were affected by various levels of drought from 2011 to 2020. After 2020, Chhattisgarh, Uttar Pradesh, and Himachal Pradesh are not expected to be significantly affected by drought, but other regions might be affected at different durations. Specifically, the states of Karnataka, Gujarat, and Uttarakhand may be affected by severe drought in the next 6 years since their SPI values reach −2.8, −2.4, and −2.6, respectively, for those regions. A few states such as Arunachal Pradesh, Rajasthan, Haryana, Kerala, Maharashtra, Punjab, Tamil Nadu, and Telangana may be affected by moderate drought in future years. Even though drought is found to be moderate in these regions, it exists for longer durations of a year or more at a time.
When a meteorological drought exists beyond 3 months, it starts reducing the moisture in the soil leading to agricultural drought. Further existence of drought may decline the underground water that prompts hydrological drought which causes water scarcity. Among the above-mentioned states, Gujarat, Karnataka, Kerala, Maharashtra, and Tamil Nadu are the largest producers of cotton, coffee, rubber, tobacco, and bananas in the country. When these regions get affected by drought for several months, the production of such agricultural cash crops might be at risk. The lowering of the groundwater level also affects irrigation operations in those regions. Hence, the chances of crop failures affecting the farmer’s livelihood and the country’s economy of the country are high. Bihar, Chhattisgarh, Jammu and Kashmir, Jharkhand, Odisha, West Bengal, Telangana, and Sikkim are predicted to receive good rainfall and undergo drought alternatively. Thus, the possibility of severe drought is minimal for these regions in the future. Based on the computed SPI values in Figure 12, the chance of floods occurring is also less in most of the states in future until 2027. Tamil Nadu, Himachal Pradesh, and a few other central parts of India will have sufficient water from 2020 to 2023. Similarly, most of the states may not be affected by drought in 2027.
Even though the rainfall prediction reveals that some of the states may be affected by drought, the country may receive a peak of 300 mm of rainfall every year during the southwest monsoon. Approximately 10–30% of the rainfall enters aquifers for groundwater recharge depending on the region and soil type, while the remaining water is discharged as runoff. Thus, the excavation of lakes, ponds, and other storage reservoirs will help store water during monsoons. This water can be used for irrigation and other agricultural purposes later. On the other hand, these methodologies can be used to forecast floods and determine flood-prone regions. Based on the analysis from Figure 12, Lakshadweep may be affected by floods in 2022, and regions, such as Andaman and Nicobar, Himachal Pradesh, Tamil Nadu, and Sikkim, may receive good rainfall for the forthcoming years without getting affected much by drought.
4. Conclusions
Weather variability in the current years leads to either droughts or floods, depending upon the region. These natural calamities can cause loss of life and property. Additionally, they affect agriculture in several ways, such as water scarcity, crop stress, and crop failure. This decline in food production becomes a great challenge for the country to manage the food supply to the people. Hence, predicting weather conditions, especially rainfall, becomes mandatory for planning water and farm management in agriculture. Precautions may be taken appropriately based on the upcoming scenarios by the determining of floods and droughts.
LSTM is used for monthly long term rainfall forecasts and SPI for drought estimation. The performance measures, such as RMSE, loss, and learning rate of LSTM are 0.059, 0.0036, and 10−5, whose values are adequate for prediction. The main inferences from this work are (1) India’s annual rainfall level is decreasing at the rate of 0.04% every year, (2) the country has been facing mild to moderate drought over the recent 50 years, especially from 1980 onwards, (3) the coming years (2021 to 2027) may be affected with mild drought, and (4) specific regions face moderate to severe drought in the future. The country’s actual rainfall and drought status for 2021 match the forecast obtained from the work. The accuracy of forecasted rainfall for the year 2021 is 99.46%. Unlike the existing works which perform drought analysis with the available rainfall data, this work forecasts the rainfall for upcoming periods using which drought is determined for forthcoming seasons. Insights obtained from the advancement in data analytics have the potential to help the government take necessary actions, such as rainwater harvesting, irrigation and other farm management activities that will reduce the risk of decline in food production.
Future work will focus on implementing the rainfall prediction of India and several regions using the intensified LSTM and incorporating soil parameters into the forecast algorithm for drought conditions based on which the most suitable crops can be recommended for forthcoming seasons. Internet of Things (IoT) technologies will be adopted to incorporate soil parameters, thereby significantly improving rainfall forecast and drought estimation. Finally, it is planned to deliver the outputs of the analyses as a mobile application which farmers may use to decide which crops are to be sown for the upcoming season.
Author Contributions
Experiments, S.P. and L.A.P.; Analysis of results, M.P. and R.B.J. All authors have read and agreed to the published version of the manuscript.
Funding
This research received no external funding.
Data Availability Statement
The data presented in this study are openly available in Open Government Data (OGD) platform repository of Indian government at https://data.gov.in/resource/sub-divisional-monthly-rainfall-1901-2017 (accessed on 15 June 2021).
Conflicts of Interest
The authors declare no conflict of interest.
References
- Graham, S. Tropical Rainfall Measuring Mission. Earth Observatory; NASA Goddard Space Flight Center: Greenbelt, MD, USA, 1999.
- Food and Agriculture Organization of the United Nations. Available online: http://www.fao.org/india/fao-in-india/india-at-a-glance/en/#:~:text=Agriculture%2C%20with%20its%20allied%20sectors,275%20million%20tonnes%20(MT) (accessed on 5 June 2021).
- Ahmed, I.A.; Salam, R.; Naikoo, M.W.; Rahman, A.; Praveen, B.; Hoai, P.N.; Pham, Q.B.; Anh, D.T.; Tri, D.Q.; Elkhrachy, I. Evaluating the variability in long-term rainfall over India with advanced statistical techniques. Acta Geophys. 2022, 70, 801–818. [Google Scholar] [CrossRef]
- Meshram, S.G.; Gautam, R.; Kahya, E. Drought analysis in the Tons River Basin, India during 1969–2008. Theor. Appl. Climatol. 2018, 132, 939–951. [Google Scholar] [CrossRef]
- Carrao, H.; Russo, S.; Sepulcre-Canto, G.; Barbosa, P. An empirical standardized soil moisture index for agricultural drought assessment from remotely sensed data. Int. J. Appl. Earth Obs. Geoinf. 2016, 48, 74–84. [Google Scholar] [CrossRef]
- Yihdego, Y.; Vaheddoost, B.; Al-Weshah, R.A. Drought indices and indicators revisited. Arab. J. Geosci. 2019, 12, 69. [Google Scholar] [CrossRef]
- Xu, Y.; Wang, L.; Ross, K.W.; Liu, C.; Berry, K. Standardized Soil Moisture Index for Drought Monitoring Based on Soil Moisture Active Passive Observations and 36 Years of North American Land Data Assimilation System Data: A Case Study in the Southeast United States. Remote Sens. 2018, 10, 301. [Google Scholar] [CrossRef] [PubMed]
- Pathak, A.A.; Channaveerappa; Dodamani, B. Comparison of two hydrological drought indices. Perspect. Sci. 2016, 8, 626–628. [Google Scholar] [CrossRef]
- Keyantash, J.; Dracup, J.A. The Quantification of Drought: An Evaluation of Drought Indices. Bull. Am. Meteorol. Soc. 2002, 83, 1167–1180. [Google Scholar] [CrossRef]
- Singh, P.; Pandey, P.C.; Petropoulos, G.P.; Pavlides, A.; Srivastava, P.K.; Koutsias, N.; Deng, K.A.K.; Bao, Y. 8-Hyperspectral remote sensing in precision agriculture: Present status, challenges, and future trends. In Earth Observation, Hyperspectral Remote Sensing; Pandey, P.C., Prashant, K., Srivastava, P.K., Balzter, H., Bhattacharya, B., Petropoulos, G.P., Eds.; Elsevier: Amsterdam, The Netherlands, 2020; pp. 121–146. [Google Scholar] [CrossRef]
- Hao, Z.; Singh, V.P.; Xia, Y. Seasonal drought prediction: Advances, challenges, and future prospects. Rev. Geophys. 2018, 56, 108–141. [Google Scholar] [CrossRef]
- Ridwan, W.M.; Sapitang, M.; Aziz, A.; Kushiar, K.F.; Ahmed, A.N.; El-Shafie, A. Rainfall forecasting model using machine learning methods: Case study Terengganu, Malaysia. Ain Shams Eng. J. 2020, 12, 1651–1663. [Google Scholar] [CrossRef]
- Kashiwao, T.; Nakayama, K.; Ando, S.; Ikeda, K.; Lee, M.; Bahadori, A. A neural network-based local rainfall prediction system using meteorological data on the Internet: A case study using data from the Japan Meteorological Agency. Appl. Soft Comput. 2017, 56, 317–330. [Google Scholar] [CrossRef]
- Praveen, B.; Talukdar, S.; Shahfahad; Mahato, S.; Mondal, J.; Sharma, P.; Islam, A.R.M.T.; Rahman, A. Analyzing trend and forecasting of rainfall changes in India using non-parametrical and machine learning approaches. Sci. Rep. 2020, 10, 10342. [Google Scholar] [CrossRef] [PubMed]
- Peña, M.; Vázquez-Patiño, A.; Zhiña, D.; Montenegro, M.; Avilés, A. Improved Rainfall Prediction through Nonlinear Autoregressive Network with Exogenous Variables: A Case Study in Andes High Mountain Region. Adv. Meteorol. 2020, 2020, 1828319. [Google Scholar] [CrossRef]
- Azimi, S.; Moghaddam, M.A. Modeling Short Term Rainfall Forecast Using Neural Networks, and Gaussian Process Classification Based on the SPI Drought Index. Water Resour. Manag. 2020, 34, 1369–1405. [Google Scholar] [CrossRef]
- Danladi, A.; Stephen, M.; Aliyu, B.; Gaya, G.; Silikwa, N.; Machael, Y. Assessing the influence of weather parameters on rainfall to forecast river discharge based on short-term. Alex. Eng. J. 2018, 57, 1157–1162. [Google Scholar] [CrossRef]
- Yen, M.-H.; Liu, D.-W.; Hsin, Y.-C.; Lin, C.-E.; Chen, C.-C. Application of the deep learning for the prediction of rainfall in Southern Taiwan. Sci. Rep. 2019, 9, 12774. [Google Scholar] [CrossRef]
- Poornima, S.; Pushpalatha, M. Prediction of Rainfall Using Intensified LSTM Based Recurrent Neural Network with Weighted Linear Units. Atmosphere 2019, 10, 668. [Google Scholar] [CrossRef]
- Gers, F.A.; Schmidhuber, J.; Cummins, F. Learning to Forget: Continual Prediction with LSTM. Neural Comput. 2000, 12, 2451–2471. [Google Scholar] [CrossRef]
- Drought Early Warning System. Available online: https://sites.google.com/a/iitgn.ac.in/high_resolution_south_asia_drought_monitor/drought-early-warning-system (accessed on 31 June 2019).
- Attri, S.D.; Chug, S.S. Annual Report 2020; Indian Meteorological Department: Pune, India. Available online: https://metnet.imd.gov.in/imdnews/ar2020.pdf (accessed on 22 February 2021).
- Lepenioti, K.; Bousdekis, A.; Apostolou, D.; Mentzas, G. Prescriptive analytics: Literature review and research challenges. Int. J. Inf. Manag. 2020, 50, 57–70. [Google Scholar] [CrossRef]
- Cheval, S. The Standardized Precipitation Index—An overview. Rom. J. Meteorol. 2015, 12, 17–64. [Google Scholar]
- Poornima, S. Prediction of Rainfall Using Intensified LSTM and Rule Based Crop Recommendation over Drought Period; SRM Institute of Science and Technology: Kattankulathur, Tamilnadu, India, 5 May 2021; Available online: http://dspace.srmist.edu.in/jspui/handle/123456789/43686?mode=full&submit_simple=Show+full+item+record (accessed on 17 August 2021).
- Edwards, D.C.; McKee, T.B. Characteristics of 20th Century Drought in the United States at Multiple Time Scales; Atmospheric Science Paper No. 634. Climatology Report 97–2; Department of Atmospheric Science, Colorado State University: Fort Collins, CO, USA, May 1997; Available online: http://hdl.handle.net/10217/170176 (accessed on 4 December 2022).
- Shah, R.; Bharadiya, N.; Manekar, V. Drought Index Computation Using Standardized Precipitation Index (SPI) Method For Surat District, Gujarat. Aquat. Procedia 2015, 4, 1243–1249. [Google Scholar] [CrossRef]
- Cagliarini, A.; Rush, A. Economic Development and Agriculture in India; Bulletin; Reserve Bank of Australia: Sydney, Australia, 2011; pp. 15–22.
- Mishra, V.; Tiwari, A.D.; Aadhar, S.; Shah, R.; Xiao, M.; Pai, D.S.; Lettenmaier, D. Drought and Famine in India, 1870–2016. Geophys. Res. Lett. 2019, 46, 2075–2083. [Google Scholar] [CrossRef]
- Parida, Y.; Dash, D.P.; Bhardwaj, P.; Chowdhury, J.R. Effects of Drought and Flood on Farmer Suicides in Indian States: An Empirical Analysis. Econ. Disasters Clim. Chang. 2018, 2, 159–180. [Google Scholar] [CrossRef]
- Bhushan, C.; Srinidhi, A.; Kumar, V.; Singh, G. Lived Anomaly: How to Enable Farmers in India Cope with Extreme Weather Events; Centre for Science and Environment: New Delhi, India, 2015. [Google Scholar]
- Yadav, B.P.; Saxena, R.; Das, A.K.; Manik, S.K.; Asok Raja, S.K. Rainfall Statistics of India-2018. Indian Meteorological Department, India. Available online: https://hydro.imd.gov.in/hydrometweb/(S(yetk5b2fro4iec55kfzkdkja))/PRODUCTS/Publications/Rainfall%20Statistics%20of%20India%20-%202018/Rainfall%20Statistics%20of%20India%202018.pdf (accessed on 30 November 2020).
- Yadav, B.P.; Saxena, R.; Das, A.K.; Manik, S.K.; Asok Raja, S.K. Rainfall Statistics of India-2019. Indian Meteorological Department, India. Available online: https://hydro.imd.gov.in/hydrometweb/(S(rfunuv45jwjlwhzmz1dbpc55))/PRODUCTS/Publications/Rainfall%20Statistics%20of%20India%20-%202019/Rainfall%20Statistics%20of%20India%20-%202019.pdf (accessed on 30 November 2020).
- Annual Report 2021. Indian Meteorological Department, India. Available online: https://mausam.imd.gov.in/imd_latest/contents/ar2021.pdf (accessed on 25 February 2022).
Figure 1.
Drought affected areas of India in June 2019 (Source: DEWS https://sites.google.com/a/iitgn.ac.in/high_resolution_south_asia_drought_monitor/drought-early-warning-system (accessed on 4 December 2022)).
Figure 1.
Drought affected areas of India in June 2019 (Source: DEWS https://sites.google.com/a/iitgn.ac.in/high_resolution_south_asia_drought_monitor/drought-early-warning-system (accessed on 4 December 2022)).

Figure 2.
Rainfall and drought status of India. (a) Rainfall deviation from normal in June 2020 (Source: IMD, Pune https://www.imdpune.gov.in/hydrology/pdc.html). (b) Drought in November 2020 (Source: IMD, Pune https://www.imdpune.gov.in/hydrology/Drought/ariditymonthly2020.html (accessed on 4 December 2022).

Figure 3.
Average annual rainfall of different regions in India for specific duration: (a) 1901–2017, (b) 1901–1967, (c) 1968–2017 (Source for template: https://indzara.com/wp-content/uploads/2013/04/indzara_Geographic_Heat_Map_India_v4.xlsx (accessed on 4 December 2022).
Figure 3.
Average annual rainfall of different regions in India for specific duration: (a) 1901–2017, (b) 1901–1967, (c) 1968–2017 (Source for template: https://indzara.com/wp-content/uploads/2013/04/indzara_Geographic_Heat_Map_India_v4.xlsx (accessed on 4 December 2022).

Figure 4.
Rainfall comparison and deviation: (a) Comparison between rainfall for 117 years, first 67 years and recent 50 years, and (b) Deviation of rainfall in recent years.
Figure 4.
Rainfall comparison and deviation: (a) Comparison between rainfall for 117 years, first 67 years and recent 50 years, and (b) Deviation of rainfall in recent years.

Figure 5.
Monthly average rainfall comparison between first 67 years and recent 50 years.

Figure 6.
Average drought levels in India (a) 117 years. (b) Recent 50 years (Source for template: https://indzara.com/wp-content/uploads/2013/04/indzara_Geographic_Heat_Map_India_v4.xlsx (accessed on 4 December 2022).
Figure 6.
Average drought levels in India (a) 117 years. (b) Recent 50 years (Source for template: https://indzara.com/wp-content/uploads/2013/04/indzara_Geographic_Heat_Map_India_v4.xlsx (accessed on 4 December 2022).

Figure 7.
Drought estimation from 1901 to 2017 for various regions in India; x-axis specifies the year and y-axis the SPI value (red indicates drought and blue is wet).
Figure 7.
Drought estimation from 1901 to 2017 for various regions in India; x-axis specifies the year and y-axis the SPI value (red indicates drought and blue is wet).

Figure 8.
Diagrammatic representation of LSTM.

Figure 9.
Performance analysis of LSTM model for rainfall forecast from the year 2001 to 2017. (a) Comparison of monthly actual rainfall and forecasted rainfall. (b) RMSE for training and test data. (c) Learning rate and network loss.
Figure 9.
Performance analysis of LSTM model for rainfall forecast from the year 2001 to 2017. (a) Comparison of monthly actual rainfall and forecasted rainfall. (b) RMSE for training and test data. (c) Learning rate and network loss.

Figure 10.
Rainfall forecast for forthcoming years 2022–2027 (green line splits the validation and forecast period).
Figure 10.
Rainfall forecast for forthcoming years 2022–2027 (green line splits the validation and forecast period).

Figure 11.
Drought forecast of India from 2021 to 2027. (a) SPI values for the forecasted period. (b) Forecasted drought status in several regions of the country (Source for template: https://indzara.com/wp-content/uploads/2013/04/indzara_Geographic_Heat_Map_India_v4.xlsx (accessed on 4 December 2022).

Figure 12.
Drought index plotted from 2011 to 2027, estimated using the forecasted rainfall for various regions in India where x-axis specifies the forecasted period and y-axis is the SPI value.
Figure 12.
Drought index plotted from 2011 to 2027, estimated using the forecasted rainfall for various regions in India where x-axis specifies the forecasted period and y-axis is the SPI value.


Table 1.
Descriptive statistics of monthly rainfall.
| Measure | Rainfall_67 years | Rainfall_Recent Years | Percent Change |
|---|---|---|---|
| Mean | 119.029 | 115.012 | −3.37% |
| Standard Error | 33.979 | 32.943 | −3.05% |
| Median | 65.08 | 63.6 | −2.27% |
| Standard Deviation | 117.706 | 114.120 | −3.05% |
| Sample Variance | 13,854.86 | 13,023.449 | −6% |
| Kurtosis | −0.5106 | −0.5679 | 11.22% |
| Skewness | 0.9738 | 0.9662 | −0.78% |
| Range | 329.66 | 317.63 | −3.65% |
| Minimum | 19.43 | 16.66 | −14.26% |
| Maximum | 349.09 | 334.29 | −4.24% |
| Sum | 1428.34 | 1380.15 | −3.37% |
Table 2.
SPI range and its categories.
| SPI Range | Category |
|---|---|
| +2 to more | Extremely wet |
| 1.5 to 1.99 | Very wet |
| 1.0 to 1.49 | Moderately wet |
| 0.99 to 0 | Mild wet |
| 0 to −0.99 | Mild dry |
| −1.0 to −1.49 | Moderately dry |
| −1.5 to −1.99 | Severely dry |
| −2 to less | Extremely dry |
Table 3.
Future rainfall forecast, along with intensity.
| Year | Annual Rainfall (mm) | Maximum Rainfall Level (mm) |
|---|---|---|
| 2021 | 1242.75 | 333.49 |
| 2022 | 1206.88 | 302.29 |
| 2023 | 1212.54 | 323.53 |
| 2024 | 1210.59 | 318.47 |
| 2025 | 1212.76 | 321.40 |
| 2026 | 1217.28 | 319.34 |
| 2027 | 1224.56 | 324.22 |
Disclaimer/Publisher’s Note: The statements, opinions and data contained in all publications are solely those of the individual author(s) and contributor(s) and not of MDPI and/or the editor(s). MDPI and/or the editor(s) disclaim responsibility for any injury to people or property resulting from any ideas, methods, instructions or products referred to in the content. |
© 2023 by the authors. Licensee MDPI, Basel, Switzerland. This article is an open access article distributed under the terms and conditions of the Creative Commons Attribution (CC BY) license (https://creativecommons.org/licenses/by/4.0/).
Share and Cite
MDPI and ACS Style
Poornima, S.; Pushpalatha, M.; Jana, R.B.; Patti, L.A. Rainfall Forecast and Drought Analysis for Recent and Forthcoming Years in India. Water 2023, 15, 592. https://doi.org/10.3390/w15030592
AMA Style
Poornima S, Pushpalatha M, Jana RB, Patti LA. Rainfall Forecast and Drought Analysis for Recent and Forthcoming Years in India. Water. 2023; 15(3):592. https://doi.org/10.3390/w15030592
Chicago/Turabian StylePoornima, S., M. Pushpalatha, Raghavendra B. Jana, and Laxmi Anusri Patti. 2023. "Rainfall Forecast and Drought Analysis for Recent and Forthcoming Years in India" Water 15, no. 3: 592. https://doi.org/10.3390/w15030592
Note that from the first issue of 2016, this journal uses article numbers instead of page numbers. See further details here.