
Effects of Graphene on the Transport of Quinolones in Porous Media
by
Zhou Cheng
1,2,†,
Cehui Mo
1,†,
Ming Wu
1,3,4,*,
Huihui Cao
1,
Yanru Hao
1,
Guoping Lu
1,
Qusheng Li
5,
Jianfeng Wu
3,
Jichun Wu
3 and
Bill X. Hu
6 1
Guangdong Provincial Research Center for Environment Pollution Control and Remediation Materials, College of Life Science and Technology, Jinan University, Guangzhou 510632, China
2
Soil Environment Research Department, Guangdong Provincial Academy of Environmental Science, Guangzhou 510045, China
3
Key Laboratory of Surficial Geochemistry, Ministry of Education, Department of Hydrosciences, School of Earth Sciences and Engineering, Nanjing University, Nanjing 210023, China
4
Guangdong Yixin Ecological Technology Co., Ltd., Guangzhou 510055, China
5
Guangdong Key Laboratory of Environmental Pollution and Health, School of Environment, Jinan University, Guangzhou 510632, China
6
School of Water Conservancy and Environment, University of Jinan, Jinan 250022, China
*
Author to whom correspondence should be addressed.
†
These authors contributed equally to this work.
Water 2023, 15(3), 593; https://doi.org/10.3390/w15030593
Submission received: 18 November 2022
/
Revised: 14 January 2023
/
Accepted: 20 January 2023
/
Published: 2 February 2023
Abstract
:The effect of graphene (GN) on the transport of CIP and NOR in porous media is investigated by a combination of batch experiments, column experiments and mathematical models. The results obtained by batch experiments show that GN has great adsorption capacity to two antibiotic contaminants, and the maximum adsorption amounts based on the Langmuir model calculation are 270.67 mg/g and 178.36 mg/g, respectively. The column experiments suggest the mobility of CIP and NOR decreases with the mass fraction of GN packed in porous media, and the mass recovery rates of CIP and NOR increase with flow velocity. As the concentration of Na+ increases, the mobility of CIP and NOR is enhanced. However, Ca2+ has a significant enhancement effect on the mobility of CIP and NOR. Moreover, the transport processes of CIP and NOR in the column are predicted by a BDST mathematical model, and the calculated results are in good agreement with the experimental results. The relationships between kinetic parameters related to QNs’ mobility and GN content, flow velocity and ionic strength are obtained by a regression analysis, which can be used to predict the mobility of CIP and NOR in porous media.
1. Introduction
As a type of broad-spectrum antimicrobial, quinolones (QNs) are widely used in human health and animal disease control [1,2,3]. QNs have developed rapidly over the past three decades and have become the most widely used synthetic antimicrobial [1,2]. Indeed, QNs are widely used in the treatment of animal and human diseases because of their broad-spectrum antimicrobial activity, rapid action, strong bactericidal activity, no common cross-resistance and low cost [4,5,6]. With widespread production and application, QNs are released into the environment in large quantities and are frequently detected in a variety of environmental media, including soil and groundwater environments [7,8,9,10]. Most antibiotics are not fully absorbed by human beings and animals, so about 90% of antibiotics are released into the environment. Antibiotics have been detected in surface water and groundwater, and they can enter into the environment in a variety of ways, with adverse effects on human health [7,8,9,10]. Ciprofloxacin (CIP), norfloxacin (NOR) and enoxacin (ENO) are the three major antibiotics with the highest consumption. Due to the low degradability and continuous release of QNs [11,12], these pseudo-persistent compounds pose a threat to the activity and composition of microbial communities in the environment [2,13,14]. Meanwhile, various studies have demonstrated that the continuous exposure of QNs may be an important source of the production of resistance genes in the environment [15]. As a result, the widespread detection and potential toxic effects of QNs in the environment have attracted more and more attention. Therefore, the transport, fate and associated environmental behavior of QNs urgently need to be further investigated, especially in groundwater, which is the main source of drinking water.
The transport and fate of QNs in groundwater are significantly influenced by the interaction between themselves and the porous media in the surrounding environment [3]. Although the interaction between QNs and the surrounding porous media plays a key role in the fate of QNs in subsurface environmental systems, there is limited research on the retention and transport behavior of QNs in porous media [16,17,18]. Chen et al. [16] showed that solution pH and ionic strength had a significant effect on the retention and migration of ciprofloxacin in saturated porous media, and the migration capacity of CIP was much lower than that of sulfamethoxazole. Moreover, Dong et al. [18] found that the mobility of levofloxacin was significantly weaker than that of sulfamethoxazole in porous media under the same physicochemical conditions (pH, ionic strength, humic acid concentration, saturation and particle size of porous media). By observing the leaching of three classes of antibiotics in calcareous agricultural fields in China, Ostermann found that the order of antibiotic mobility was as follows: QNs < tetracyclines < sulfonamides [19].
A large number of natural colloids exist in the subsurface environment and can serve as carriers of contaminants due to their good mobility and large adsorption capacity. This process is often referred to as “the facilitating effect of colloid on the transport of contaminant”, which is particularly important for the movement of contaminants with low solubility and strong adsorption on solid surfaces [20,21]. Although the promotion of contaminant migration by natural colloids has been investigated by numerous studies, so far, no domestic or international studies have focused on the promotion of QNs’ migration by engineered nanoparticles in porous media [22,23]. Carbon-based nanomaterials have received increasing attention in the fields of contaminant adsorption and environmental remediation [24,25,26,27]. Graphene (GN) is a promising adsorbent material for the adsorption of organic contaminants among various nanomaterials [28,29]. Most importantly, GN has excellent physicochemical properties, such as a large specific surface area, high chemical stability, many adsorption functional sites, excellent electrical and thermal conductivity, strong mechanical hardness and toughness and high light transmittance [30,31]. At present, GN is widely used in various fields, so it will unavoidably be released into the surface water, soil and even groundwater environment. However, GN involves certain harm to human health and the ecological environment [32,33]. The contaminants containing π electrons in the molecular structure can be adsorbed on the surface of GN by the π-π interaction. Therefore, GN has a good adsorptive ability to the contaminants in the environment and affects the transport of contaminants.
GN has an excellent adsorption capacity for both organic and inorganic pollutants, including heavy metals (Pb2+, Cr6+, Cd2+, etc.) [34,35,36], pharmaceuticals [36], dyes [29,37], petroleum hydrocarbon pollutants [38] and endocrine disruptors, etc. In addition, GN has an excellent adsorption capacity for antibiotics, including QNs, through the electrostatic attraction between them and π-π interactions generated by charged groups and aromatic structures [39,40]. Previous studies have shown that GN nanoparticles could act as carriers to facilitate the transport of Cu, 1-naphthol and phenanthrene in porous media [41,42]. Peng et al. [39] compared the adsorption of 7 antibiotics on 3 carbon-based materials (including 2 biocarbons and graphene), and the results showed that the adsorption rate of GN was the fastest and the adsorption efficiency reached 100%. The adsorption of antibiotics on GN was mainly through the π-π interaction and auxiliary adsorption, including the hydrogen bond interaction, electrostatic interaction, hydrophobic interaction and pore-filling effect [18,43,44]. Although QNs exhibit very weak mobility in soil and groundwater, their strong binding ability to GN nanoparticles makes it possible to greatly enhance the mobility of QNs in porous media, which in turn may increase the associated environmental risk. Therefore, co-transport studies are essential to understand the environmental risks of GN and its carried QNs. However, the effect of GN on the migration of QNs in porous media (especially in unsaturated porous media) has not been investigated.
Based on GN and two typical QNs (CIP and NOR), the effects of GN on the migration of antibiotics in groundwater are systematically investigated by a combination of batch experiments, column experiments and mathematical models. The objectives of this research are as follows: (1) determine the maximum adsorption capacity of GN for CIP and NOR; (2) investigate the mobility of CIP and NOR in porous media containing GN under various physicochemical conditions; (3) simulate and predict the transport behavior of CIP and NOR in porous media containing GN by the bed depth service time (BDST) model.
2. Materials and Methods
2.1. Experimental Material
The GN used in the experiment is the single-layer nano-graphene powder. The average thickness of GN with the particle size of 5 um is 6–8 nm. The specific surface area of GN is 120–150 m2/g and the purity is more than 99%. The porous media packed in the column experiment is silica sand (SS). The diameters of SS are 0.18–0.22 mm, and the porosity is 0.32. Before the column experiment, SS is washed with tap water, soaked with nitric acid (10%) and washed with deionized water to the neutral state, and then dried in the oven at 65 °C. The zeta potentials of SS and GN under different conditions are measured by a Malvern laser particle sizer (Table S1).
The CIP and NOR solutions are configured by adding 125 mg of CIP or 100 mg of NOR into a 500 mL volumetric flask and using deionized water for the constant volume. Afterward, 250 mg/L of CIP reserve solution and 200 mg/L of NOR reserve solution are stored in a refrigerator at 4 °C.
2.2. Batch Experiment
The adsorption of CIP and NOR on GN is carried out in a 200 rpm oscillator at room temperature (25 °C). Next, 5.0 g SS or 60 mg/L GN suspension and antibiotics are mixed into a 50 mL glass centrifuge tube. In the adsorption experiment, GN suspension of 15 mL (200 mg/L) is placed in centrifuge tubes of 50 mL. Afterward, the CIP solution of 10 different volumes (0, 0.2, 0.5, 1, 2, 4, 8, 12 and 16 mL) or the NOR solution of 9 different volumes (0, 0.25, 0.5, 1, 2, 4, 8, 16 and 20 mL) is added into centrifuge tubes as the adsorbates, respectively. In the batch experiment, 5 g SS and adsorbate solutions (CIP: 0, 1, 2.5, 5.0, 10.0, 20.0, 40.0, 60.0, 70.0, 80.0 mg/L; NOR: 0, 1, 2, 4, 8, 16, 32, 64.0, 80.0 mg/L) are added into 50 mL centrifuge tubes. The pH value of the solution is adjusted to 5.0 and centrifuge tubes are shaken in a constant temperature oscillating chamber for 48 h. The mixtures in tubes are sampled using a disposable syringe with a 0.22 um filter head for solid–liquid separation. Afterward, the concentrations of CIP and NOR in the samples are determined using the UV-Vis spectrophotometer (Lambda 365 UV-VIS, Perkin Elmer, Waltham, MA, USA).
The adsorption amounts of CIP and NOR on GN are calculated as follows:
where F is the amount of adsorption of CIP or NOR on GN at adsorption equilibrium (mg/g); Ft is the amount of adsorption of CIP or NOR on GN at t time (mg/g); C0 is the initial concentration of CIP or NOR (mg/L); Ct is the concentration of CIP or NOR in solution at t time (mg/L); Ce is the concentration of CIP or NOR in solution at adsorption equilibrium (mg/L); V is the total volume of solution (L); m is the mass of added GN (g).
A pseudo-first-order kinetic model, pseudo second-order kinetic model and Elovich adsorption kinetic model [38] are used to analyze the CIP/NOR adsorption onto GN varied with time:
where k1 is the first-order kinetic adsorption rate constant (min−1); k2 is the second-order kinetic adsorption rate constant (g ·mg−1·min−1); k3 is the initial adsorption rate (mg·g−1·min); F1 is the amount of adsorption of CIP or NOR on GN at adsorption equilibrium (mg·g−1) for the pseudo-first-order kinetic model; F2 is the amount of adsorption of CIP or NOR on GN at adsorption equilibrium (mg·g−1) for the pseudo-second-order kinetic model; F3 is the desorption constant (mg·g−1) for the Elovich model.
Langmuir, Freundlich and Temkin isothermal adsorption models are applied to describe the adsorption isotherms of CIP and NOR on GN and SS:
where Equation (3) is the Langmuir model, Equation (4) is the Freundlich model; Smax is the maximum adsorption amount (mg·g−1); KL is the constant associated with the interaction energy in the Langmuir model (L·mg−1); KF is the Freundlich constant (L·mg−1)n; n is the Freundlich exponent constant; R is the ideal gas constant (8.314 J·mol−1·K−1); T is the absolute temperature (K); bT is the Temkin constant (J·mol−1); AT is the equilibrium constant in the Temkin model (L·mg−1).
2.3. Column Experiment
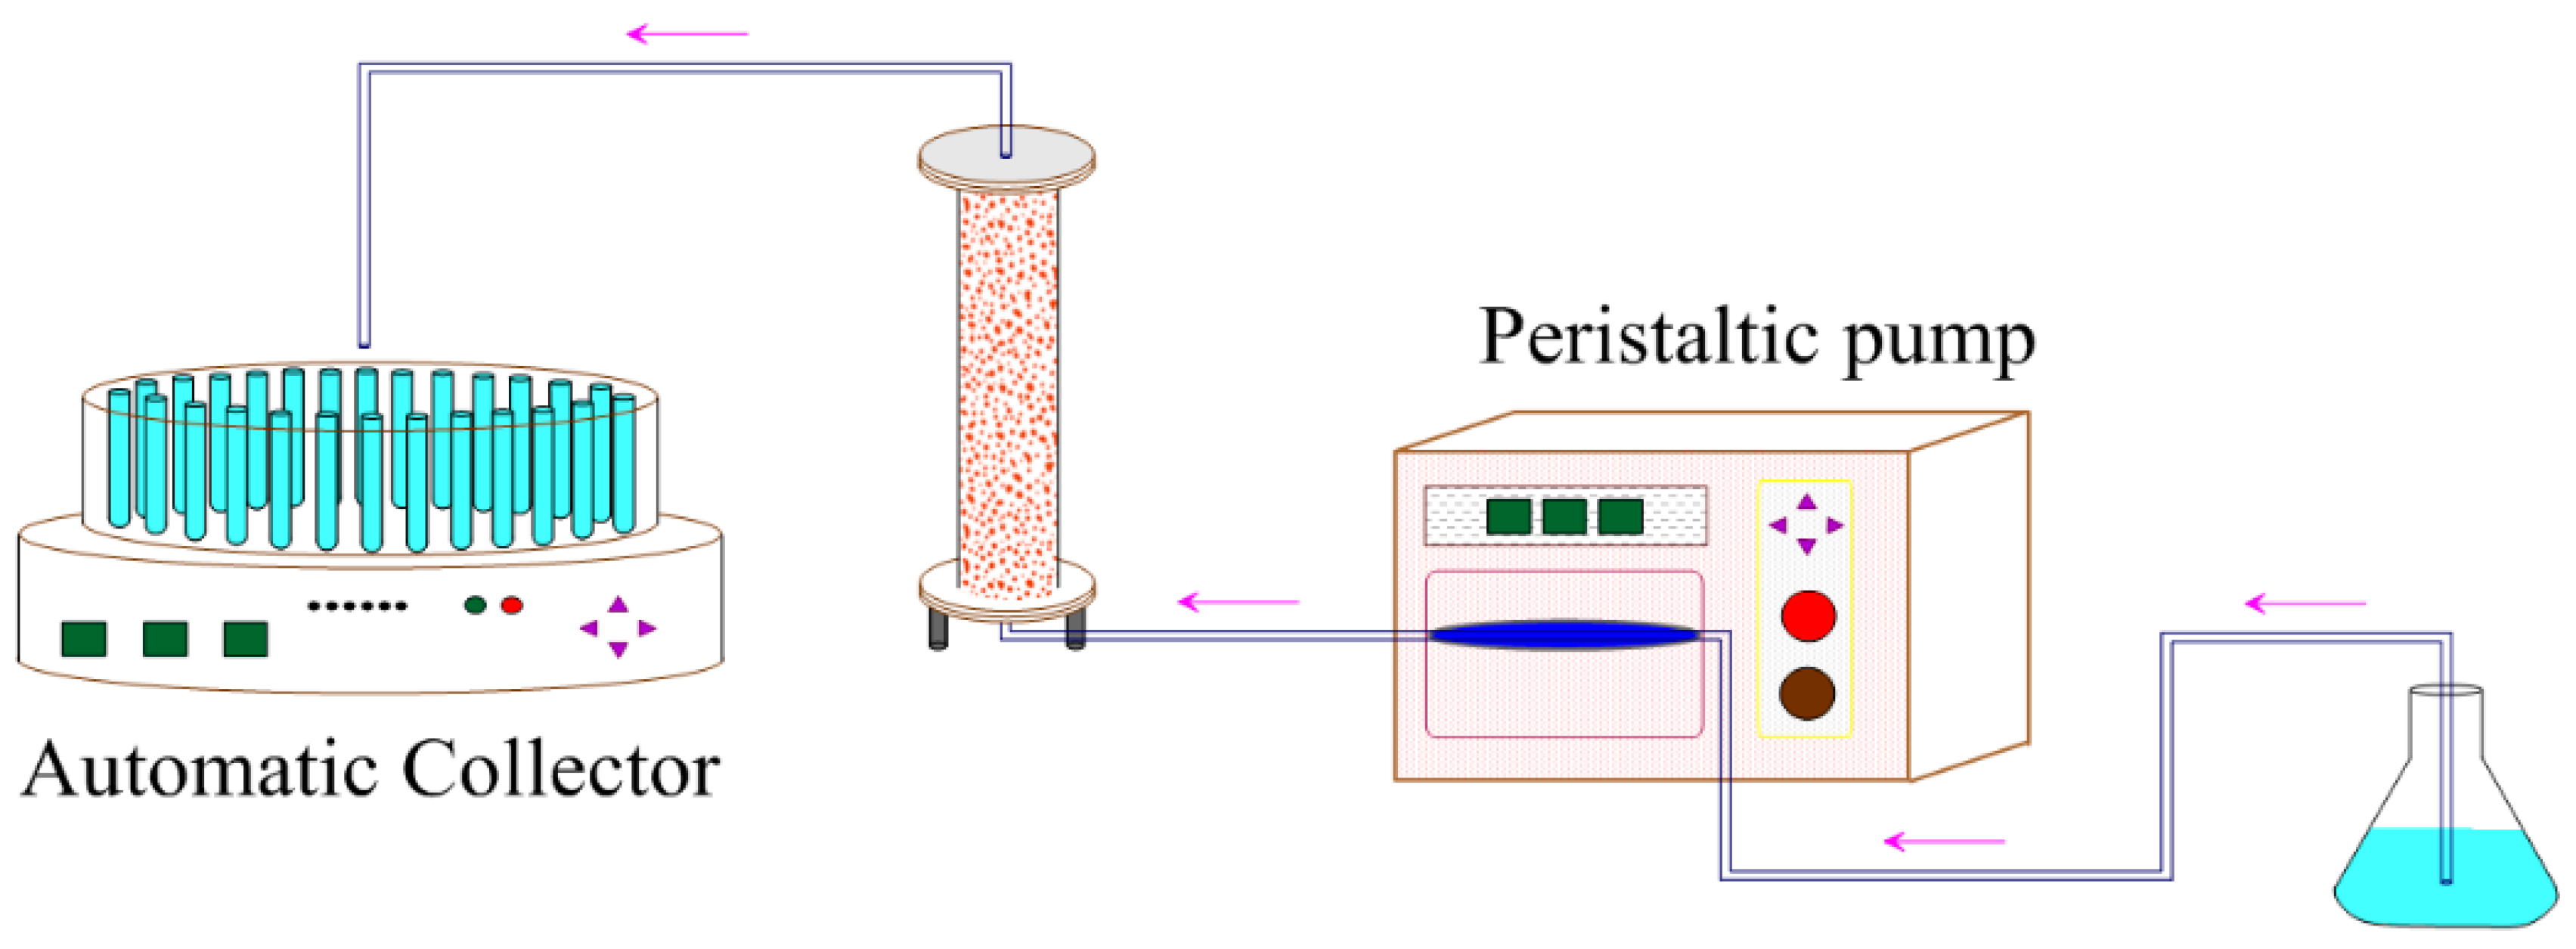
The transport experiments of CIP and NOR are conducted in the column (inner diameter is 2.5 cm, length is 20 cm) packed by SS and GN. The 50 um stainless steel strainer is placed at both ends of the column (the inlet and outlet end) to hold the SS and make the water flow uniformly through the column. Before the column experiment, the SS is packed into the column using the wet sand filling method [45]. After that, a peristaltic pump is connected to the inlet of the column and an automatic collector is connected to the outlet. The experimental setup is shown in Figure 1. In the column experiment, the porous media packed in the column is first flushed with deionized water or background solution for 10 h to remove impurities. Afterward, 2 PVs CIP or NOR solution under different water chemical conditions is injected into the column by a peristaltic pump. After injection, the column is flushed with 20 PVs background solution. The experimental conditions are illustrated in Table 1.
2.4. Mathematical Model
In practical applications, the models used to simulate the breakthrough curve (BTC) include the Thomas model, the Yoon-Nelson model, and the BDST model [18,46]. Compared with the Thomas and Yoon–Nelson models, the BDST model takes into account the dynamic adsorption characteristics’ parameters such as adsorbent thickness, flow velocity and initial concentration, and the accuracy tends to be better [18]. Therefore, the BDST model is applied to simulate the transport process of CIP and NOR in SS-GN porous media:
where C0 is the initial concentration of CIP or NOR (mg·L−1); Ct is the concentration at time point t (mg·L−1); N0 is the adsorption capacity of the adsorbent (mg·L−1); Z is the fixed-bed thickness of the adsorbent (GN) packed in column (cm); ν is the flow velocity (cm·min−1); kb is the rate constant in the BDST model (mg−1·min−1·L).
The above model is used to simulate the transport process of CIP and NOR in the column. Associated simulation results are compared with experimental results to obtain the values of parameters kb and N0.
3. Results and Discussion
3.1. Adsorption of CIP and NOR onto GN
3.1.1. Kinetic Adsorption
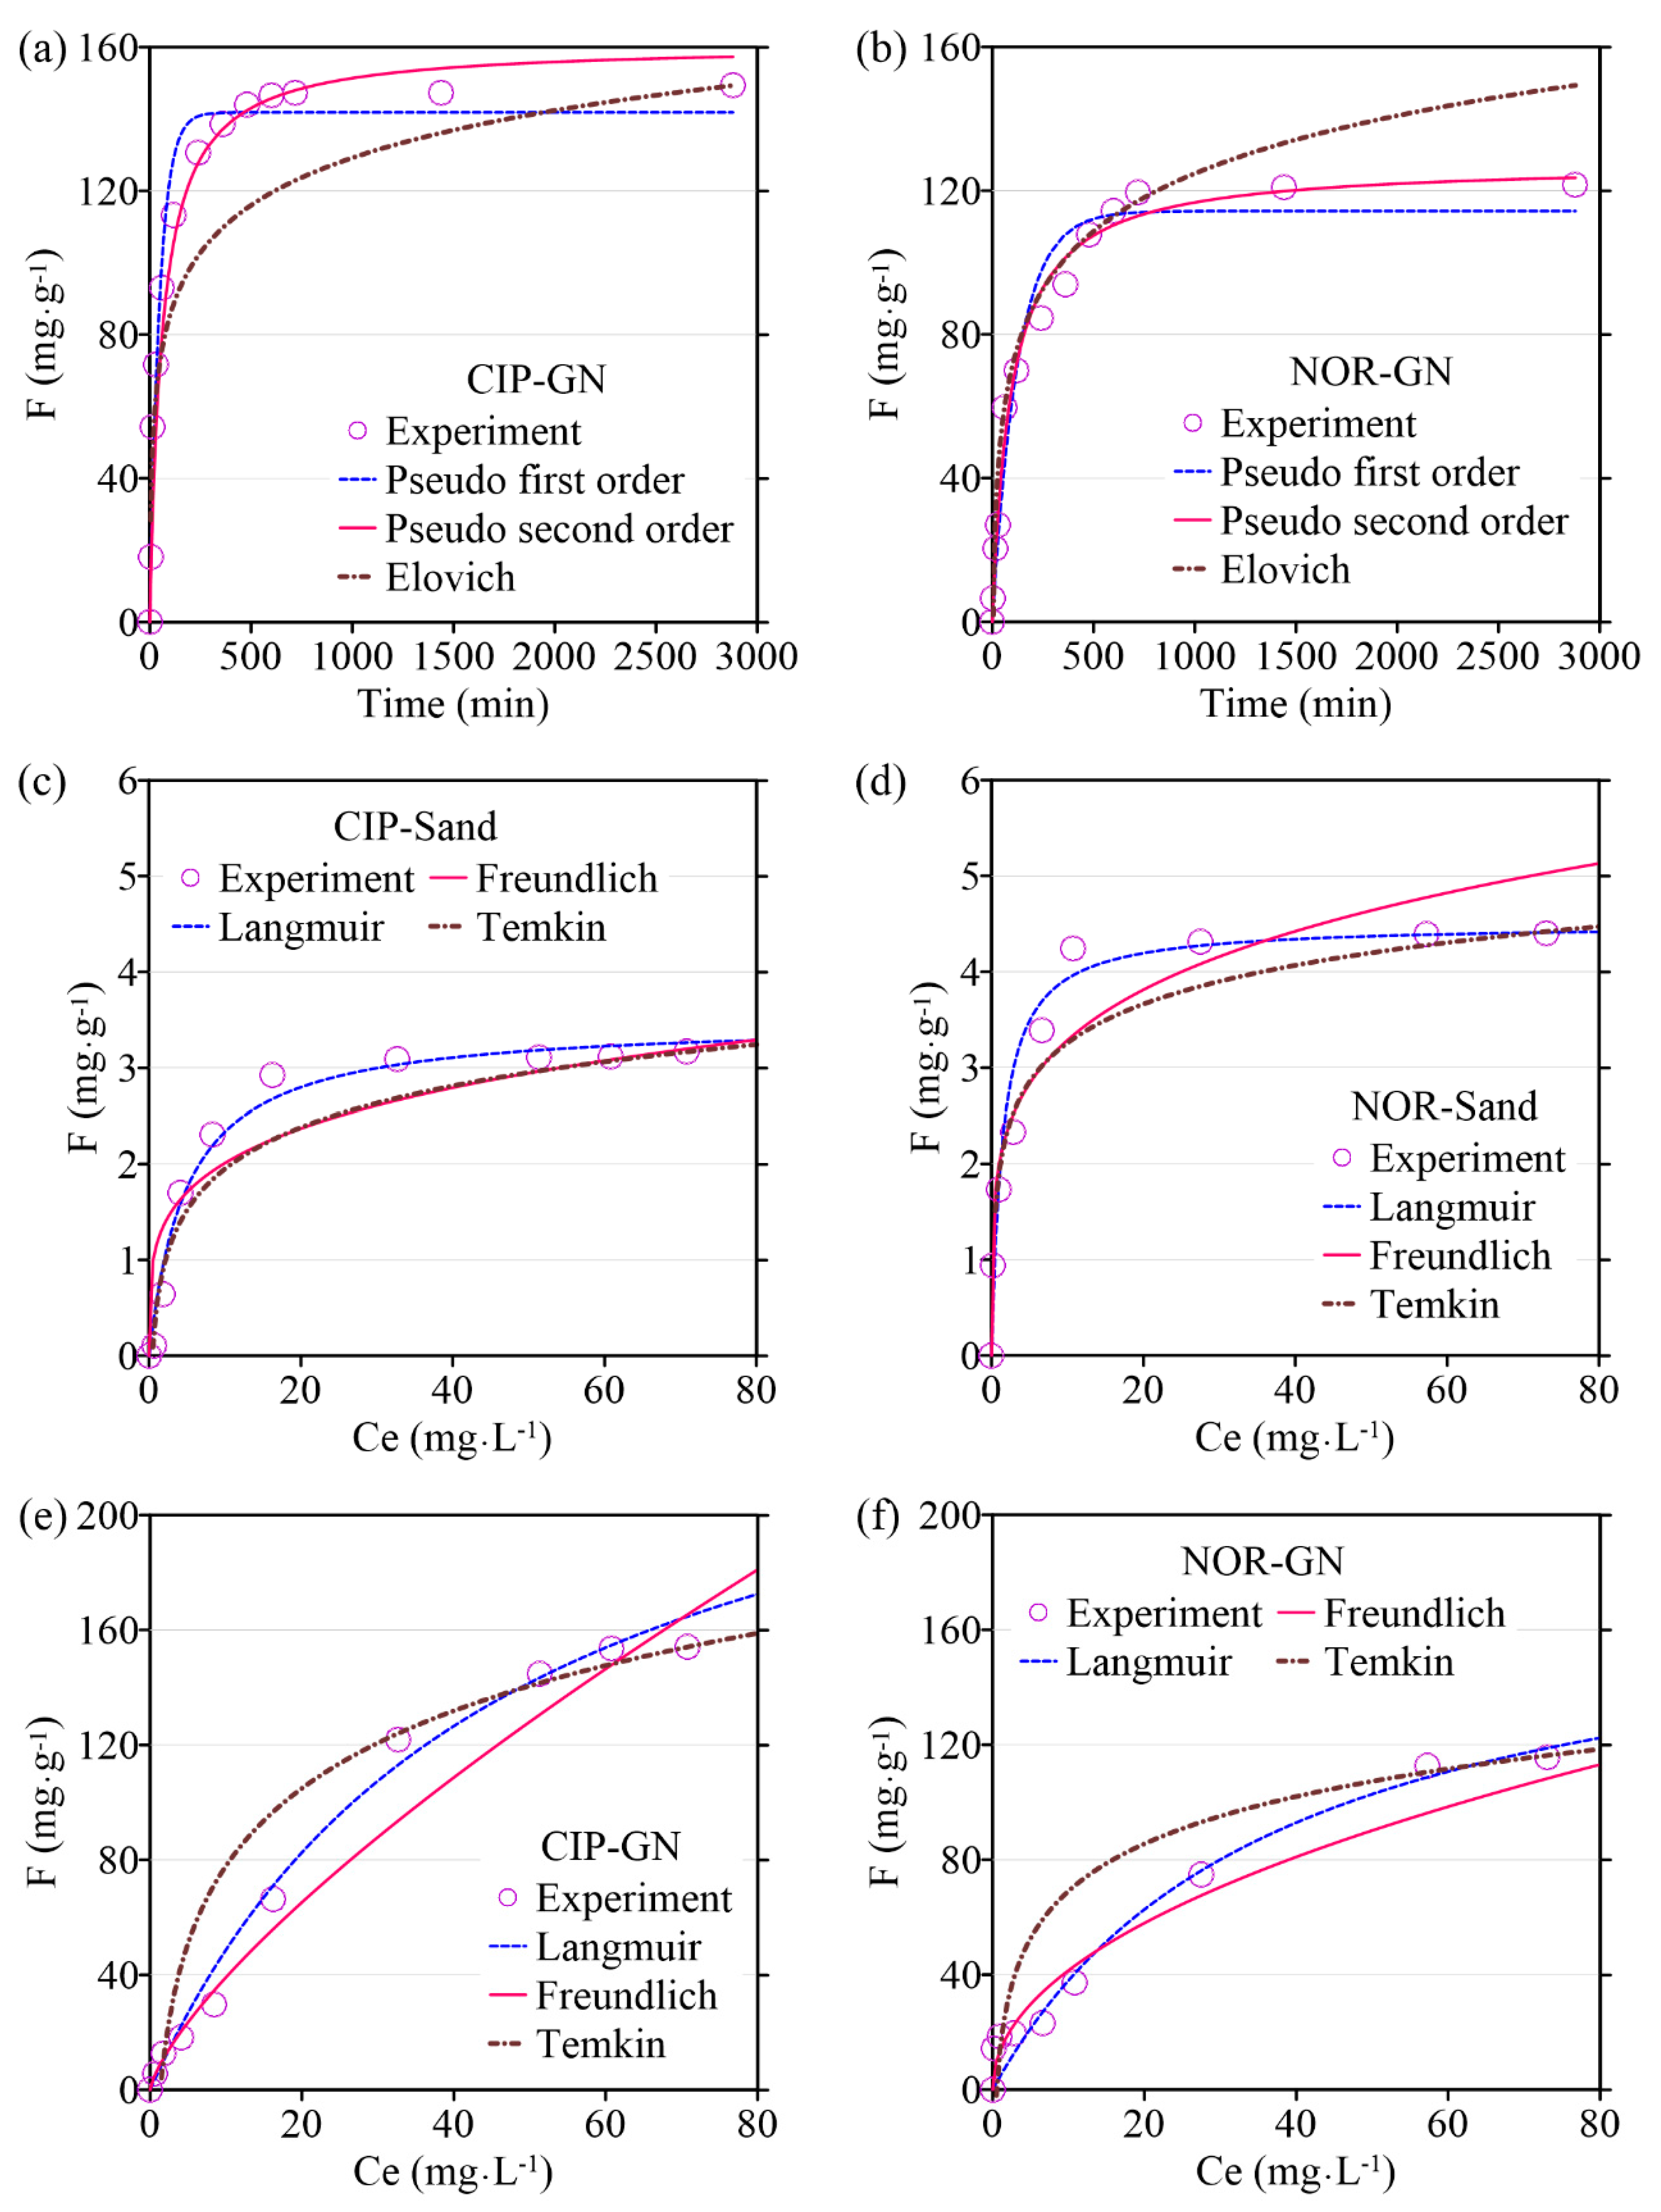
The adsorption experiment is conducted at room temperature (25 °C). Adsorption results are presented in Figure 2a,b. As can be seen from Figure 2a, the adsorption rate of CIP on GN is relatively fast in the initial 240 min, and the adsorption capacity reaches 85% of the maximum adsorption capacity. As time goes on, the adsorption rate gradually decreases, and the adsorption capacity increases slowly. After 600 min, the adsorption of GN to CIP reaches an equilibrium state gradually. Results suggest the maximum adsorption capacity of GN to CIP is 149.3 mg/g. As can be seen from Figure 2b, the adsorption of NOR on GN is a relatively smooth process. After 600 min, the adsorption amount reaches 94% of the maximum adsorption amount. After 2880 min, adsorption reaches the equilibrium state, and the associated maximum adsorption capacity of GN to NOR is 121.6 mg/g.
The adsorptions of CIP and NOR on GN are investigated by the pseudo-first-order kinetic model, the pseudo-second-order kinetic model and the Elovich adsorption kinetic model. Associated fitting results and parameters are presented in Table S2 and Figure 2. All determined coefficients (R2) of the pseudo-first-order kinetic model and Elovich kinetic model for the adsorption process are less than 0.98, and that of the pseudo-second-order kinetic model is more than 0.98. The adsorption amount calculated by the pseudo- second-order kinetic model is closer to the experimental result, indicating that the pseudo-second-order kinetic model better fits the experimental results. Further, the adsorption of CIP and NOR onto GN is determined by a variety of factors.
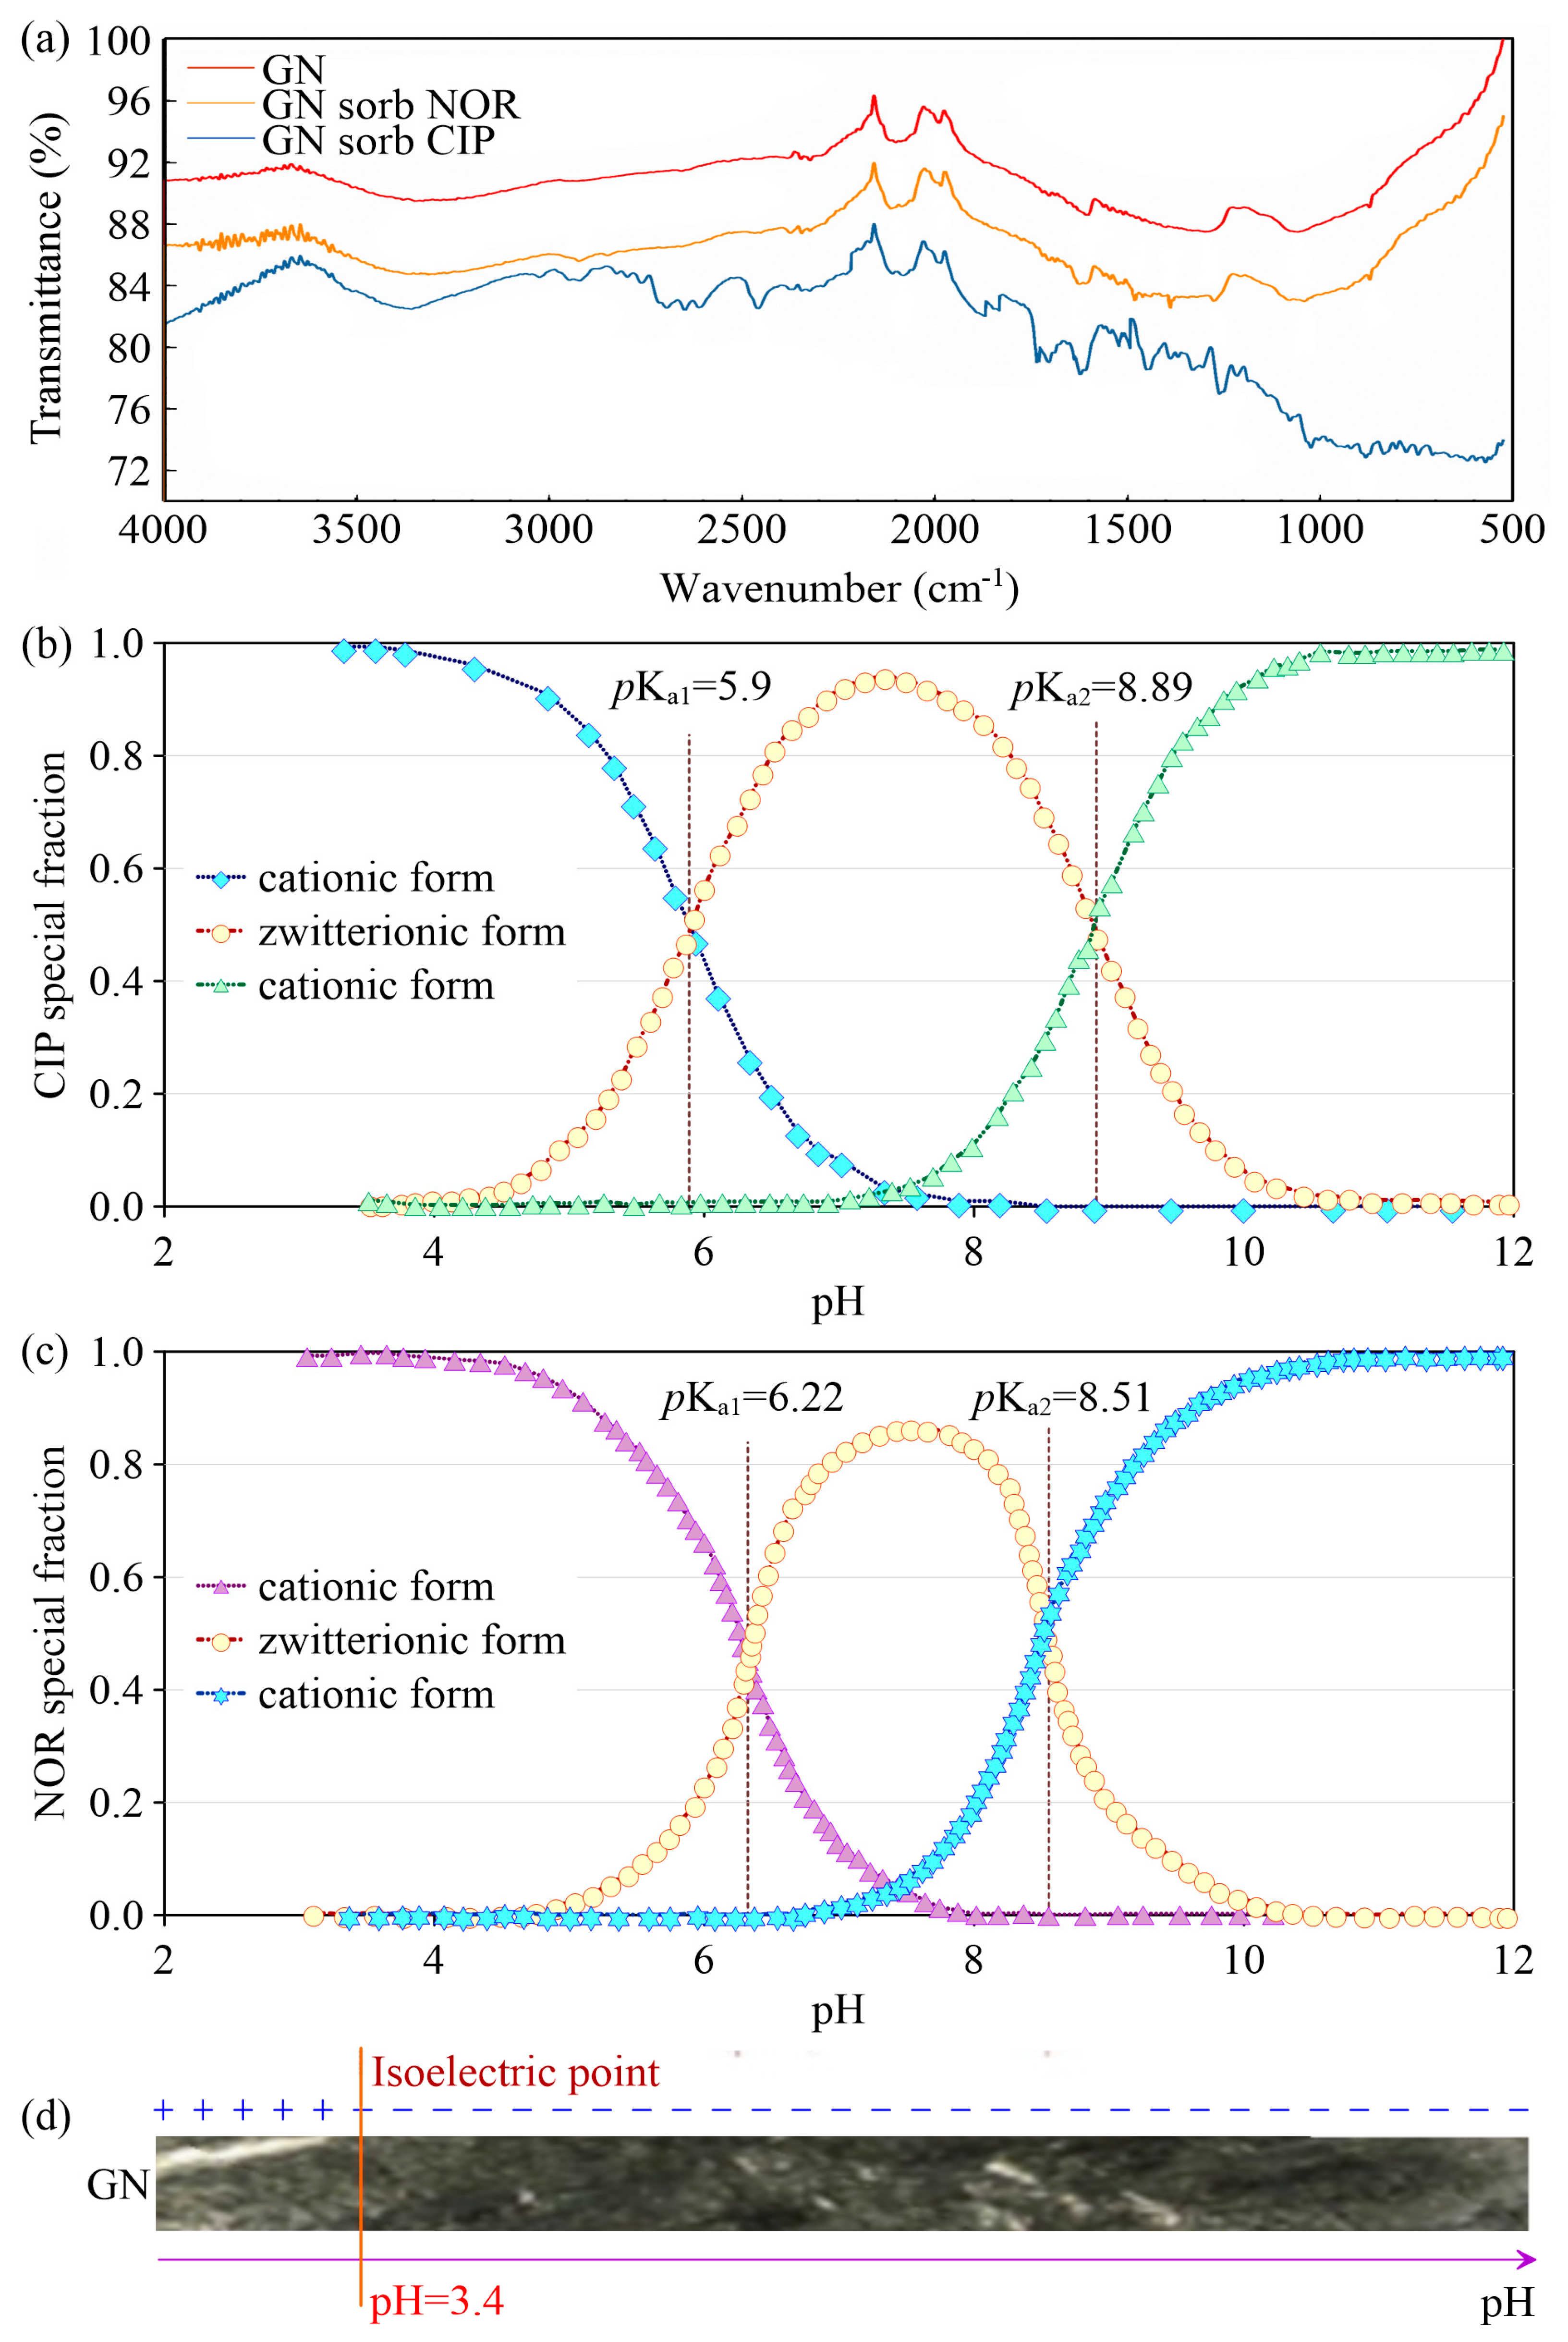
The IR spectra of GN after the adsorption of CIP and NOR show that the absorption peaks are significantly shifted compared with those before adsorption (Figure 3). Further, the IR spectra of GN after the adsorption of CIP show more shifted absorption peaks. From the spectrogram in Figure 3, it can be seen that the weaker absorption peak of GN near 3345 cm−1 is caused by the stretching vibration of –OH on the surface of GN. Furthermore, the absorption peak at 2923 cm−1 belongs to the asymmetric stretching vibration of -CH3, the absorption peak at 1605.04 cm−1 is caused by the stretching vibration of C=O on the carboxyl group of graphene surface, the absorption peak at 1296.73 cm−1 is caused by the stretching vibration of C-C and the absorption peak at 1056.81 cm−1 is caused by of the stretching vibration of C-O-C. These results from the spectrogram indicate that GN contains a certain amount of oxygen and at least five functional groups of -OH, -CH3, -C = 0, C-C and C-O-C.
From the spectrogram in Figure 3, it can be seen that the infrared spectrogram of GN after the adsorption of NOR shows a significant displacement of the absorption peak compared with that before absorption. The absorption peak at 1479.16 cm−1 is caused by the stretching vibration of the benzene ring on the NOR molecule, and the absorption peak at 1387.56 cm−1 belongs to the stretching vibration of the protonated amino group on the NOR molecule, indicating that NOR is adsorbed on the GN surface. The absorption peak at 1448.58 cm−1 is caused by the stretching vibration of the benzene ring on the CIP molecule, and the absorption peak at 1329.83 cm−1 belongs to the stretching vibration of the protonated amino group on the CIP molecule, indicating that CIP is adsorbed on the GN surface.
3.1.2. Adsorption Isotherm
The adsorption behaviors of CIP and NOR on GN and SS are simulated using the Langmuir, Freundlich and Temkin isothermal adsorption models. The nonlinear fitting results and the calculated correlation parameter values are shown in Figure 2c–e and Table S3. It can be seen that the coefficient of determination R2 fitted by the Langmuir isothermal model for the adsorption process of two fluoroquinolone antibiotics by GN is greater than 0.96, which is larger than the R2 fitted by the Freundlich and Temkin isothermal models. Therefore, the Langmuir isothermal model can simulate the isothermal adsorption process of GN and SS on CIP and NOR with higher precision, which also indicates that CIP and NOR to GN and SS is a monolayer adsorption process. The maximum adsorption amounts of CIP and NOR on GN are calculated from the Langmuir isothermal model as 270.68 and 178.36 mg/g, respectively. This result proves that GN has a great adsorption capacity for CIP and NOR, and previous studies also show that GN and its derivatives have a high adsorption capacity for antibiotics containing benzene rings in their molecular structures. These results are mainly caused by such antibiotics interacting with the π-electrons of the benzene ring on the GN surface by forming π-π-electron coupling. The small amount of residual oxygen-containing functional groups on GN can form some hydrogen bonds with such antibiotics. Additionally, under the pH conditions of this experiment (pH = 4), the negatively charged GN interacts strongly with the cationic states of CIP and NOR by electrostatic mutual attraction [13,25,47].
3.1.3. Influence of pH and Electrolyte on Adsorption
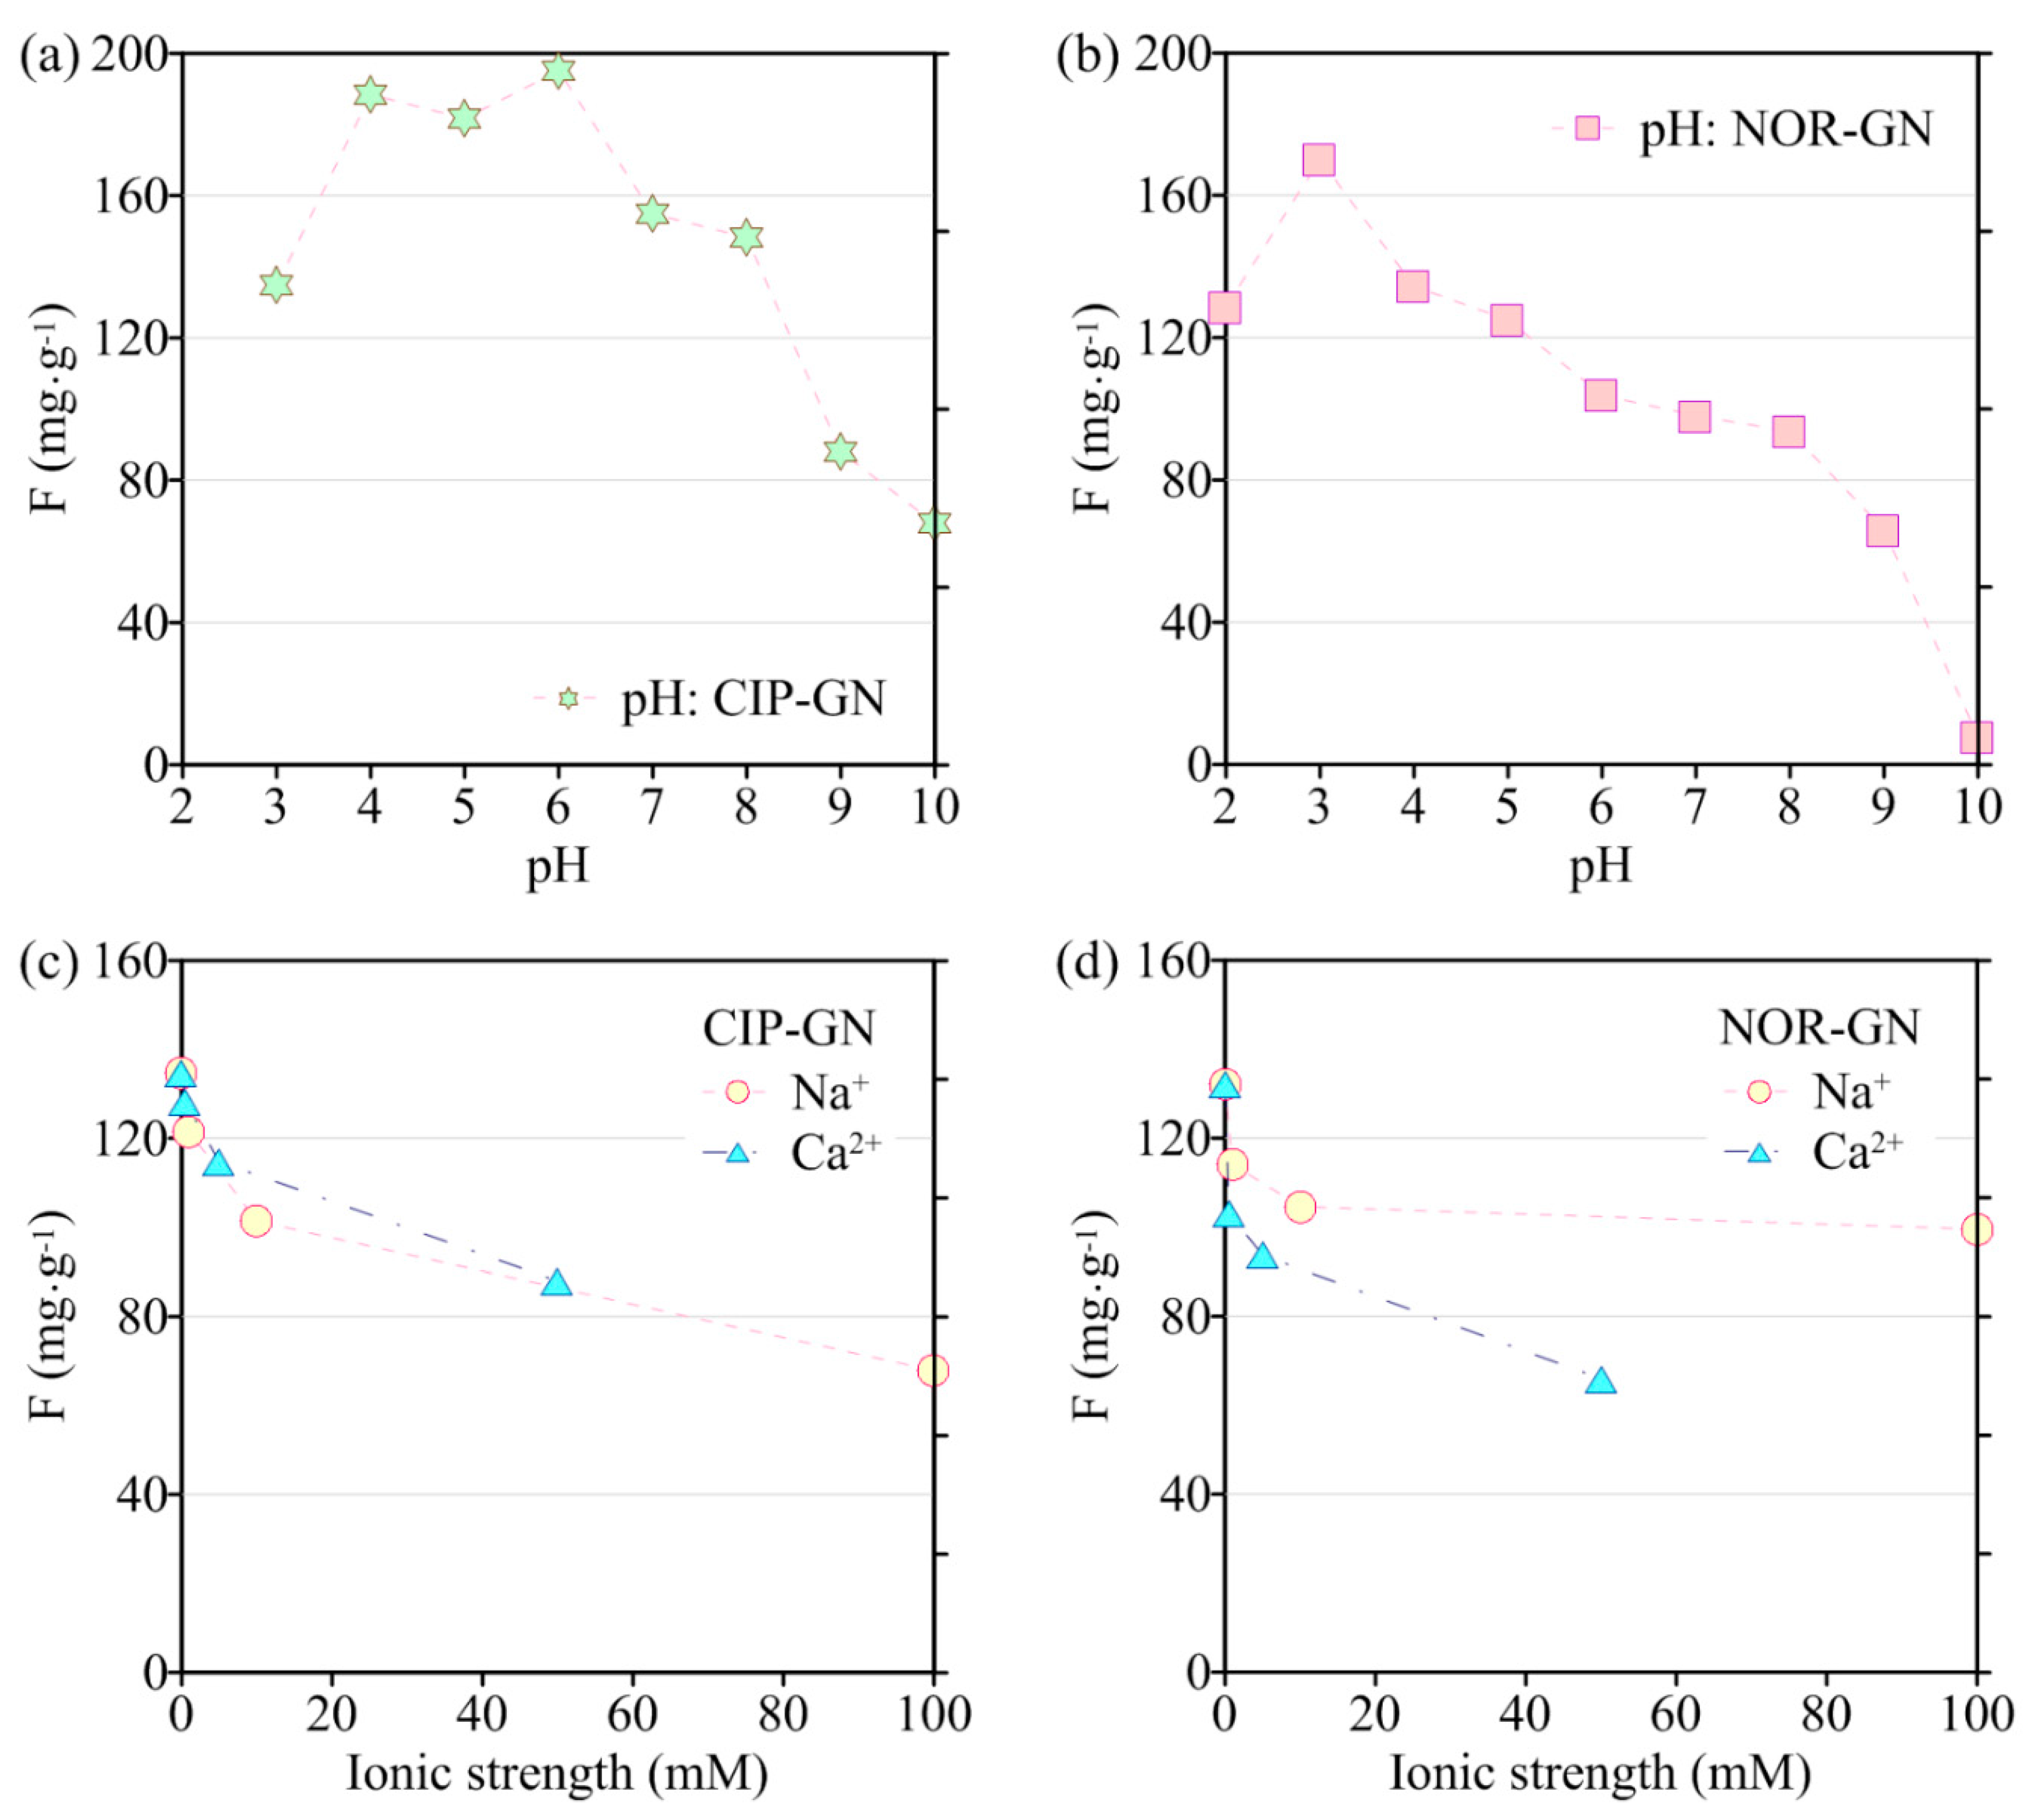
pH not only affects the isoelectric point of the adsorbent, but also determines the form of QNs’ antibiotics that exists in the solution. Therefore, pH is an important factor affecting the adsorption of GN on CIP and NOR. In this experiment, the amount of GN is controlled as 30 mg/L, and the initial concentration of CIP or NOR solution is 40 mg/L. The pH value of the solution is adjusted with NaOH (0.1 mM) and HCl (0.1 mM) to investigate the effect of the initial pH value on the adsorption of CIP or NOR by GN, and the results are shown in Figure 4a,b.
The isoelectric point of GN measured by the experiment is 3.4 (Figure 3d). CIP has two different pKa values (pKa1 = 5.9, pKa2 = 8.89), resulting in different proportions of the three forms of CIP in the aqueous solution under different pH conditions, as shown in Figure 3b. When pH < pKa1, -NH3 on the CIP molecule binds to -H+ in the solution and mainly exists in the form of cationic CIPH+, and the cation exchange occurs between CIPH+ and a small amount of hydroxyl functional groups on the GN surface. On the other hand, when pH < 3.4, the GN surface is positively charged, and electrostatic repulsion occurs between CIPH+ and GN. When 3.4 < pH < 5.9, the GN surface is negatively charged, and CIPH+ and GN undergo electrostatic attraction. With the increase in pH, the CIPH+ concentration decreases, and electrostatic attraction gradually weakens. Therefore, the adsorption capacity at pH < 5.9 is lower than that at pH = 5.9, and when pH > 5.9, the adsorption capacity decreases with pH. When pKa1 < pH < pKa2, the CIP in the solution exists mainly in the form of a neutral facultative ion. When pKa2 > pKa2, the CIP in the solution exists mainly in the form of anions. In both cases, as the pH increases, the electrostatic repulsion between CIP and GN increases, thereby causing a continuous decrease in the adsorption amount (Figure 4a).
Similarly, NOR also has two different pKa values (pKa1 = 6.22, pKa2 = 8.51), enabling the presence of NOR in aqueous solutions in three different forms under different pH conditions (Figure 3c). When pH < pKa1, NOR mainly exists in the form of cationic NORH+, and the cation exchange occurs between NORH+ and a small number of hydroxyl groups on the surface of GN. On the other hand, when pH < 3.4, the surface of GN is positively charged, so NORH+ and GN have electrostatic repulsion. When 3.4 < pH < pKa1, the surface of GN is negatively charged, so NORH+ and GN are electrostatically attracted to each other. With the increase in pH, NORH+ concentration and electrostatic attraction gradually decrease. As a result, the adsorption capacity first reaches a maximum value and then decreases. Therefore, the adsorption capacity at pH < 6.22 is lower than that at pH = 6.22. When pH > 6.22, the adsorption capacity increases first and then decreases with the increase in pH. When pKa1 < pH < pKa2, NOR exists mainly in the form of an electrically neutral facultative ion. When pH > pKa2, NOR in the solution exists mainly in the form of anions. In both cases, as the pH increases, the electrostatic repulsion between NOR and GN increases, resulting in a continuous decrease in adsorption (Figure 4b).
The stability of GN suspension and the adsorption mechanism of GN on antibiotics are influenced by the electrolyte in the solution. In this study, when pH = 5, the GN dosage is 30 mg/L, and the initial concentration of CIP or the NOR solution is 40 mg/L. NaCl and CaCl2 are used as the corresponding background solution to investigate the effect of electrolytes on the adsorption of CIP and NOR by GN.
It can be seen from Figure 4c,d that the electrolyte has an obvious effect on the adsorption effect. The higher the ionic strength, the lower the equilibrium adsorptions of CIP and NOR on GN. When the molar concentration of electrolyte (Na+) increases from 0 mM to 100 mM, the equilibrium adsorption of CIP on GN decreases from 134 mg/g to 67 mg/g and the equilibrium adsorption of NOR on GN decreases from 122 mg/g to 99 mg/g. Because of the electrostatic interaction between Na+ and negatively charged GN, Na+ competes with cationic CIP or NOR for adsorption. In addition, Na+ will enter the double electric layer on the surface of the GN particles, which weakens the mutual repulsive force between GN particles and accelerates the agglomeration of GN, resulting in the reduction of the specific surface area of GN.
When the Ca2+ molar concentration increases from 0 mg to 50 mg, the equilibrium adsorption of CIP on GN decreases from 134 mg/g to 63 mg/g and the equilibrium adsorption of NOR on GN decreases from 122 mg/g to 65 mg. Because a stronger Ca2+ charge can make the GN suspension less stable and the agglomeration effect more effective, the effect of Ca2+ on the adsorption of CIP and NOR by GN is more obvious. Furthermore, previous studies have shown that divalent cations (such as Ca2+, Mg2+) can form stable chelates with hydroxyl functional groups in the molecular structure of QNs’ antibiotics, thus reducing the proportion of CIP and NOR in a free state and further inhibiting the adsorption of QNs by GN.
3.2. The Transport of CIP and NOR under Different Conditions
3.2.1. Mass Fraction of GN
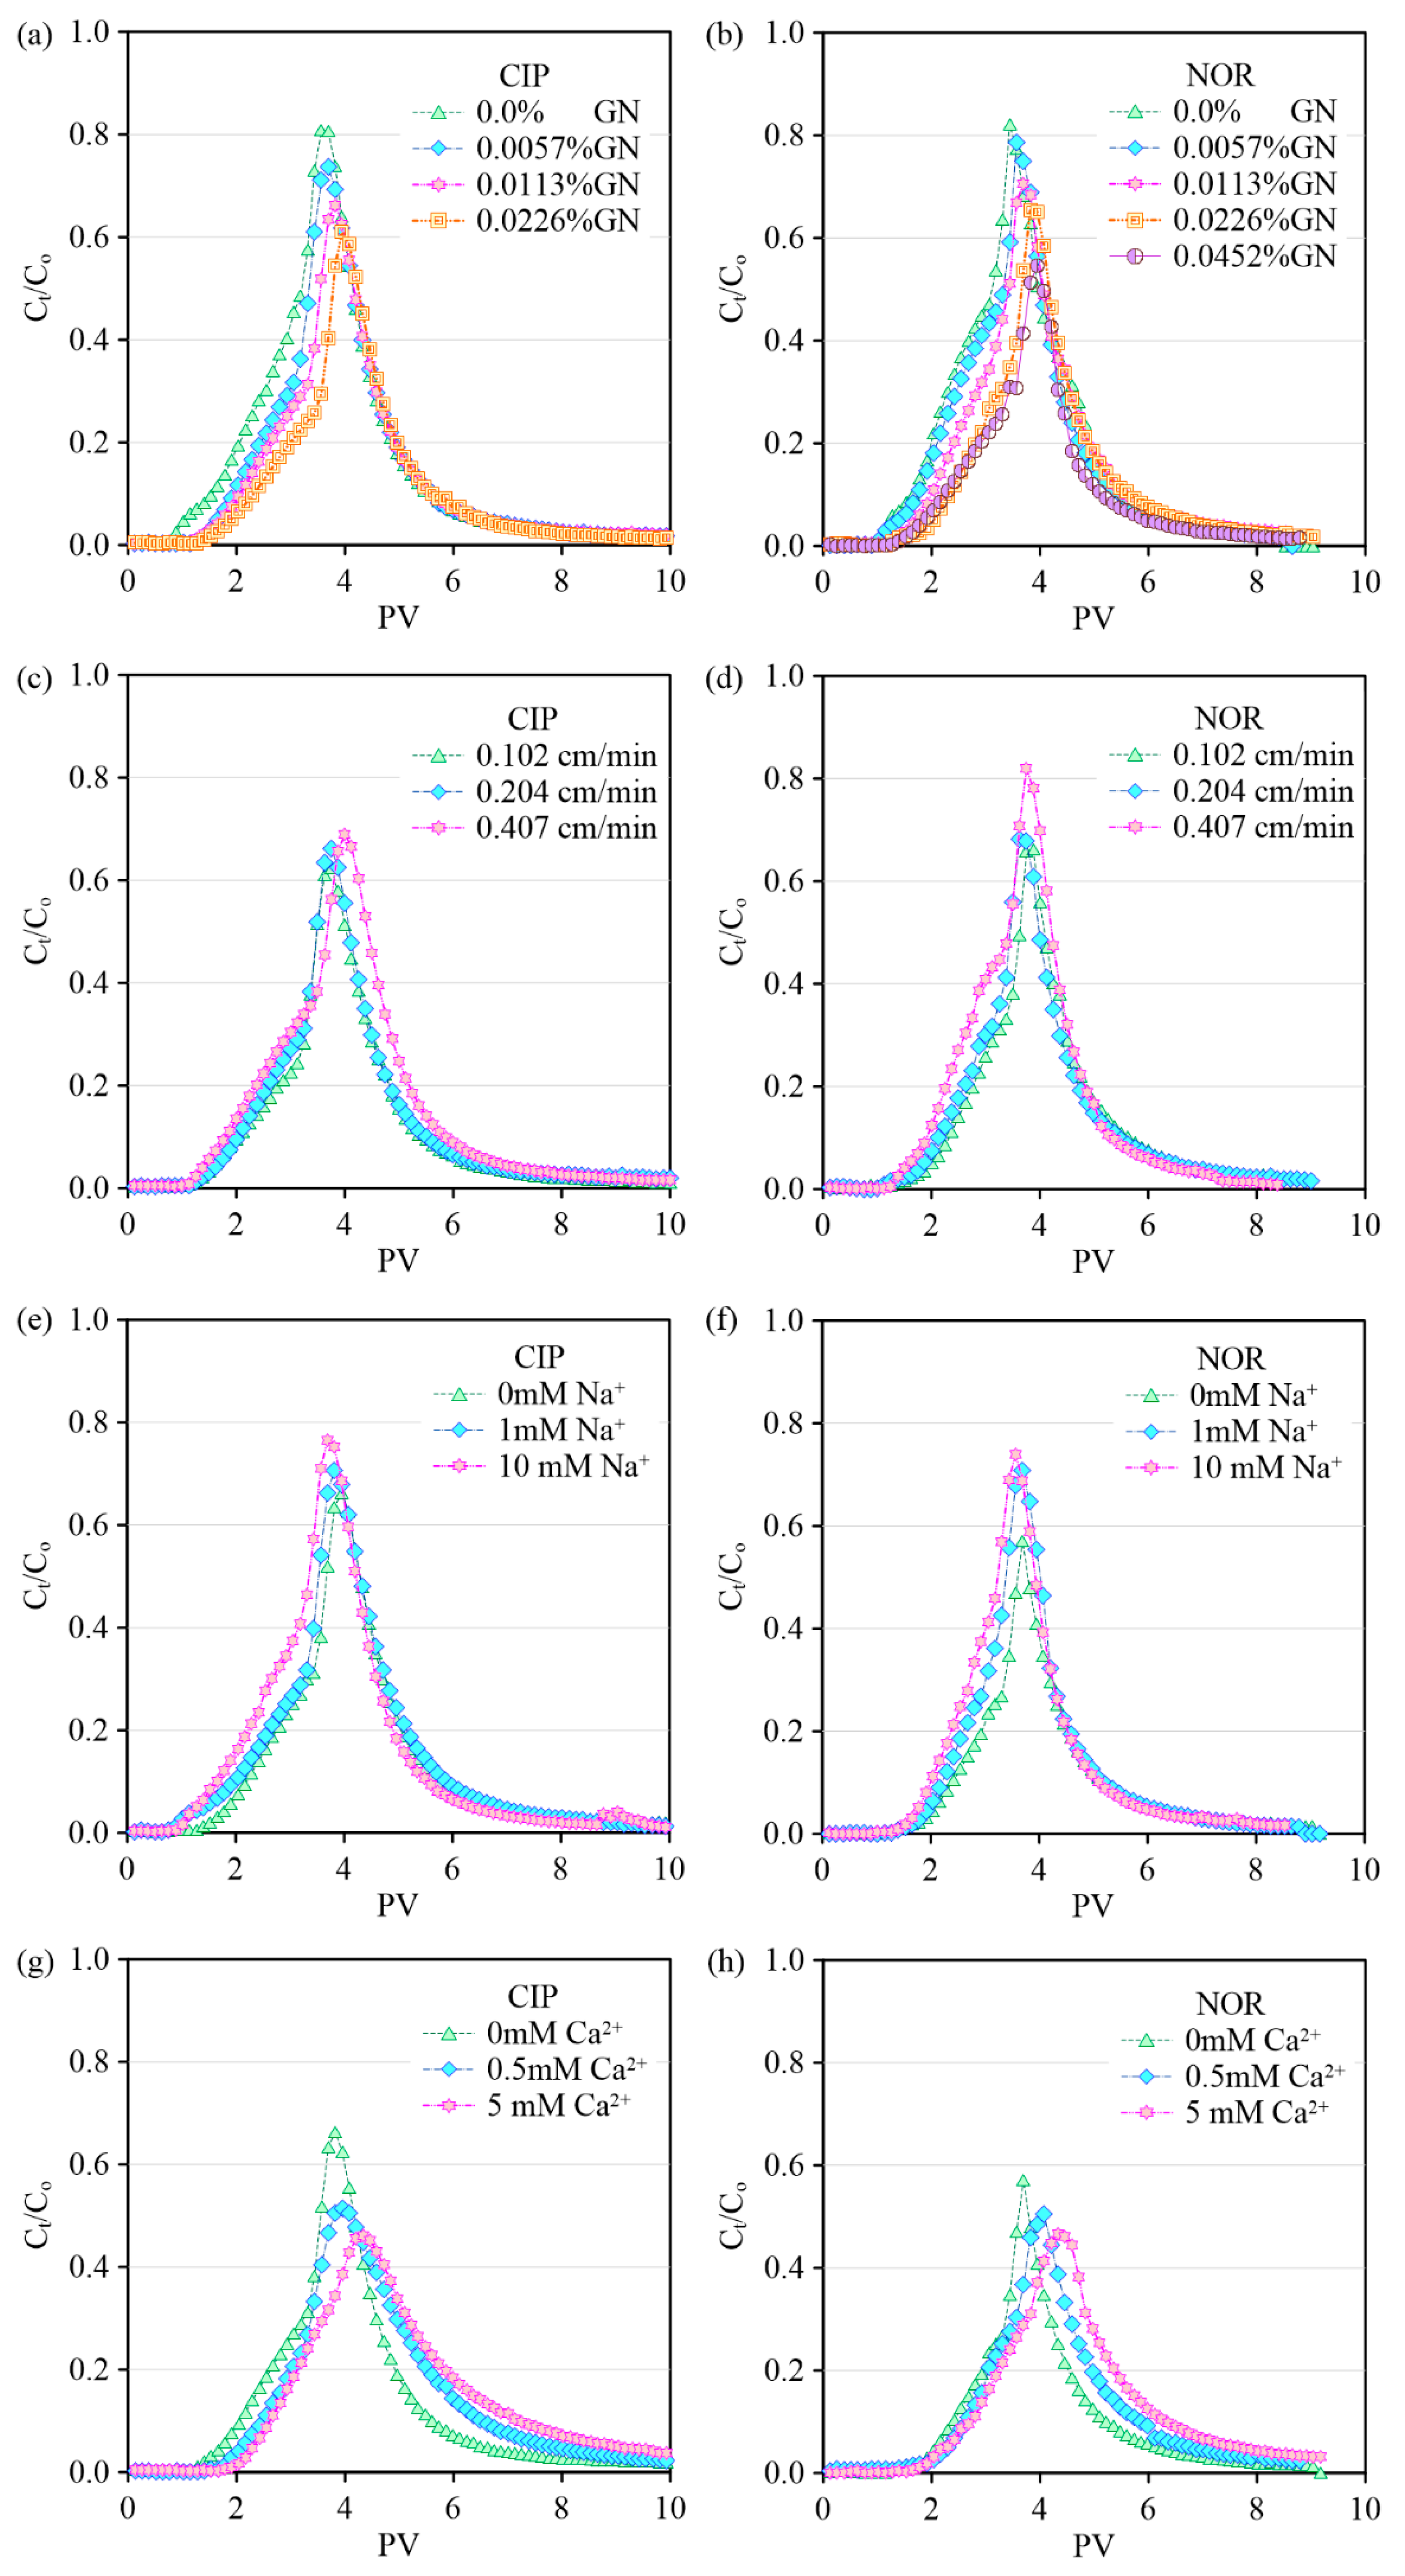
With the increase of the mass fraction of GN in the column, the trailing part of the BTC gradually becomes longer, and C/C0 and the mobility of CIP and NOR all gradually decrease (Figure 5a,b). In addition, the mass balance calculations show that the mass recovery rate of CIP and NOR decreases when the mass fraction of GN is increased (Table 1). In the CIP transport experiments, when the mass fraction of GN increases from 0.0057% mg to 0.0226%, the C/C0 peak value of BTC decreases from 73.7% to 60.9%, the time needed to reach the peak for BTC increases from 116 min to 124 min and the mass recovery rate of CIP decreases from 68.9% to 54.7%. In the NOR transport experiment, when the mass fraction of GN increases from 0.0057% to 0.0452%, the peak value of C/C0 decreases from 78.7% to 54.7% and the recovery rate of NOR decreases from 74.4% to 47.1%. The higher mass fraction of GN will result in a larger surface area for adsorption and increase the active adsorbent sites and contact time between GN and QNs. As a result, the mass recovery rate of QNs is decreased.
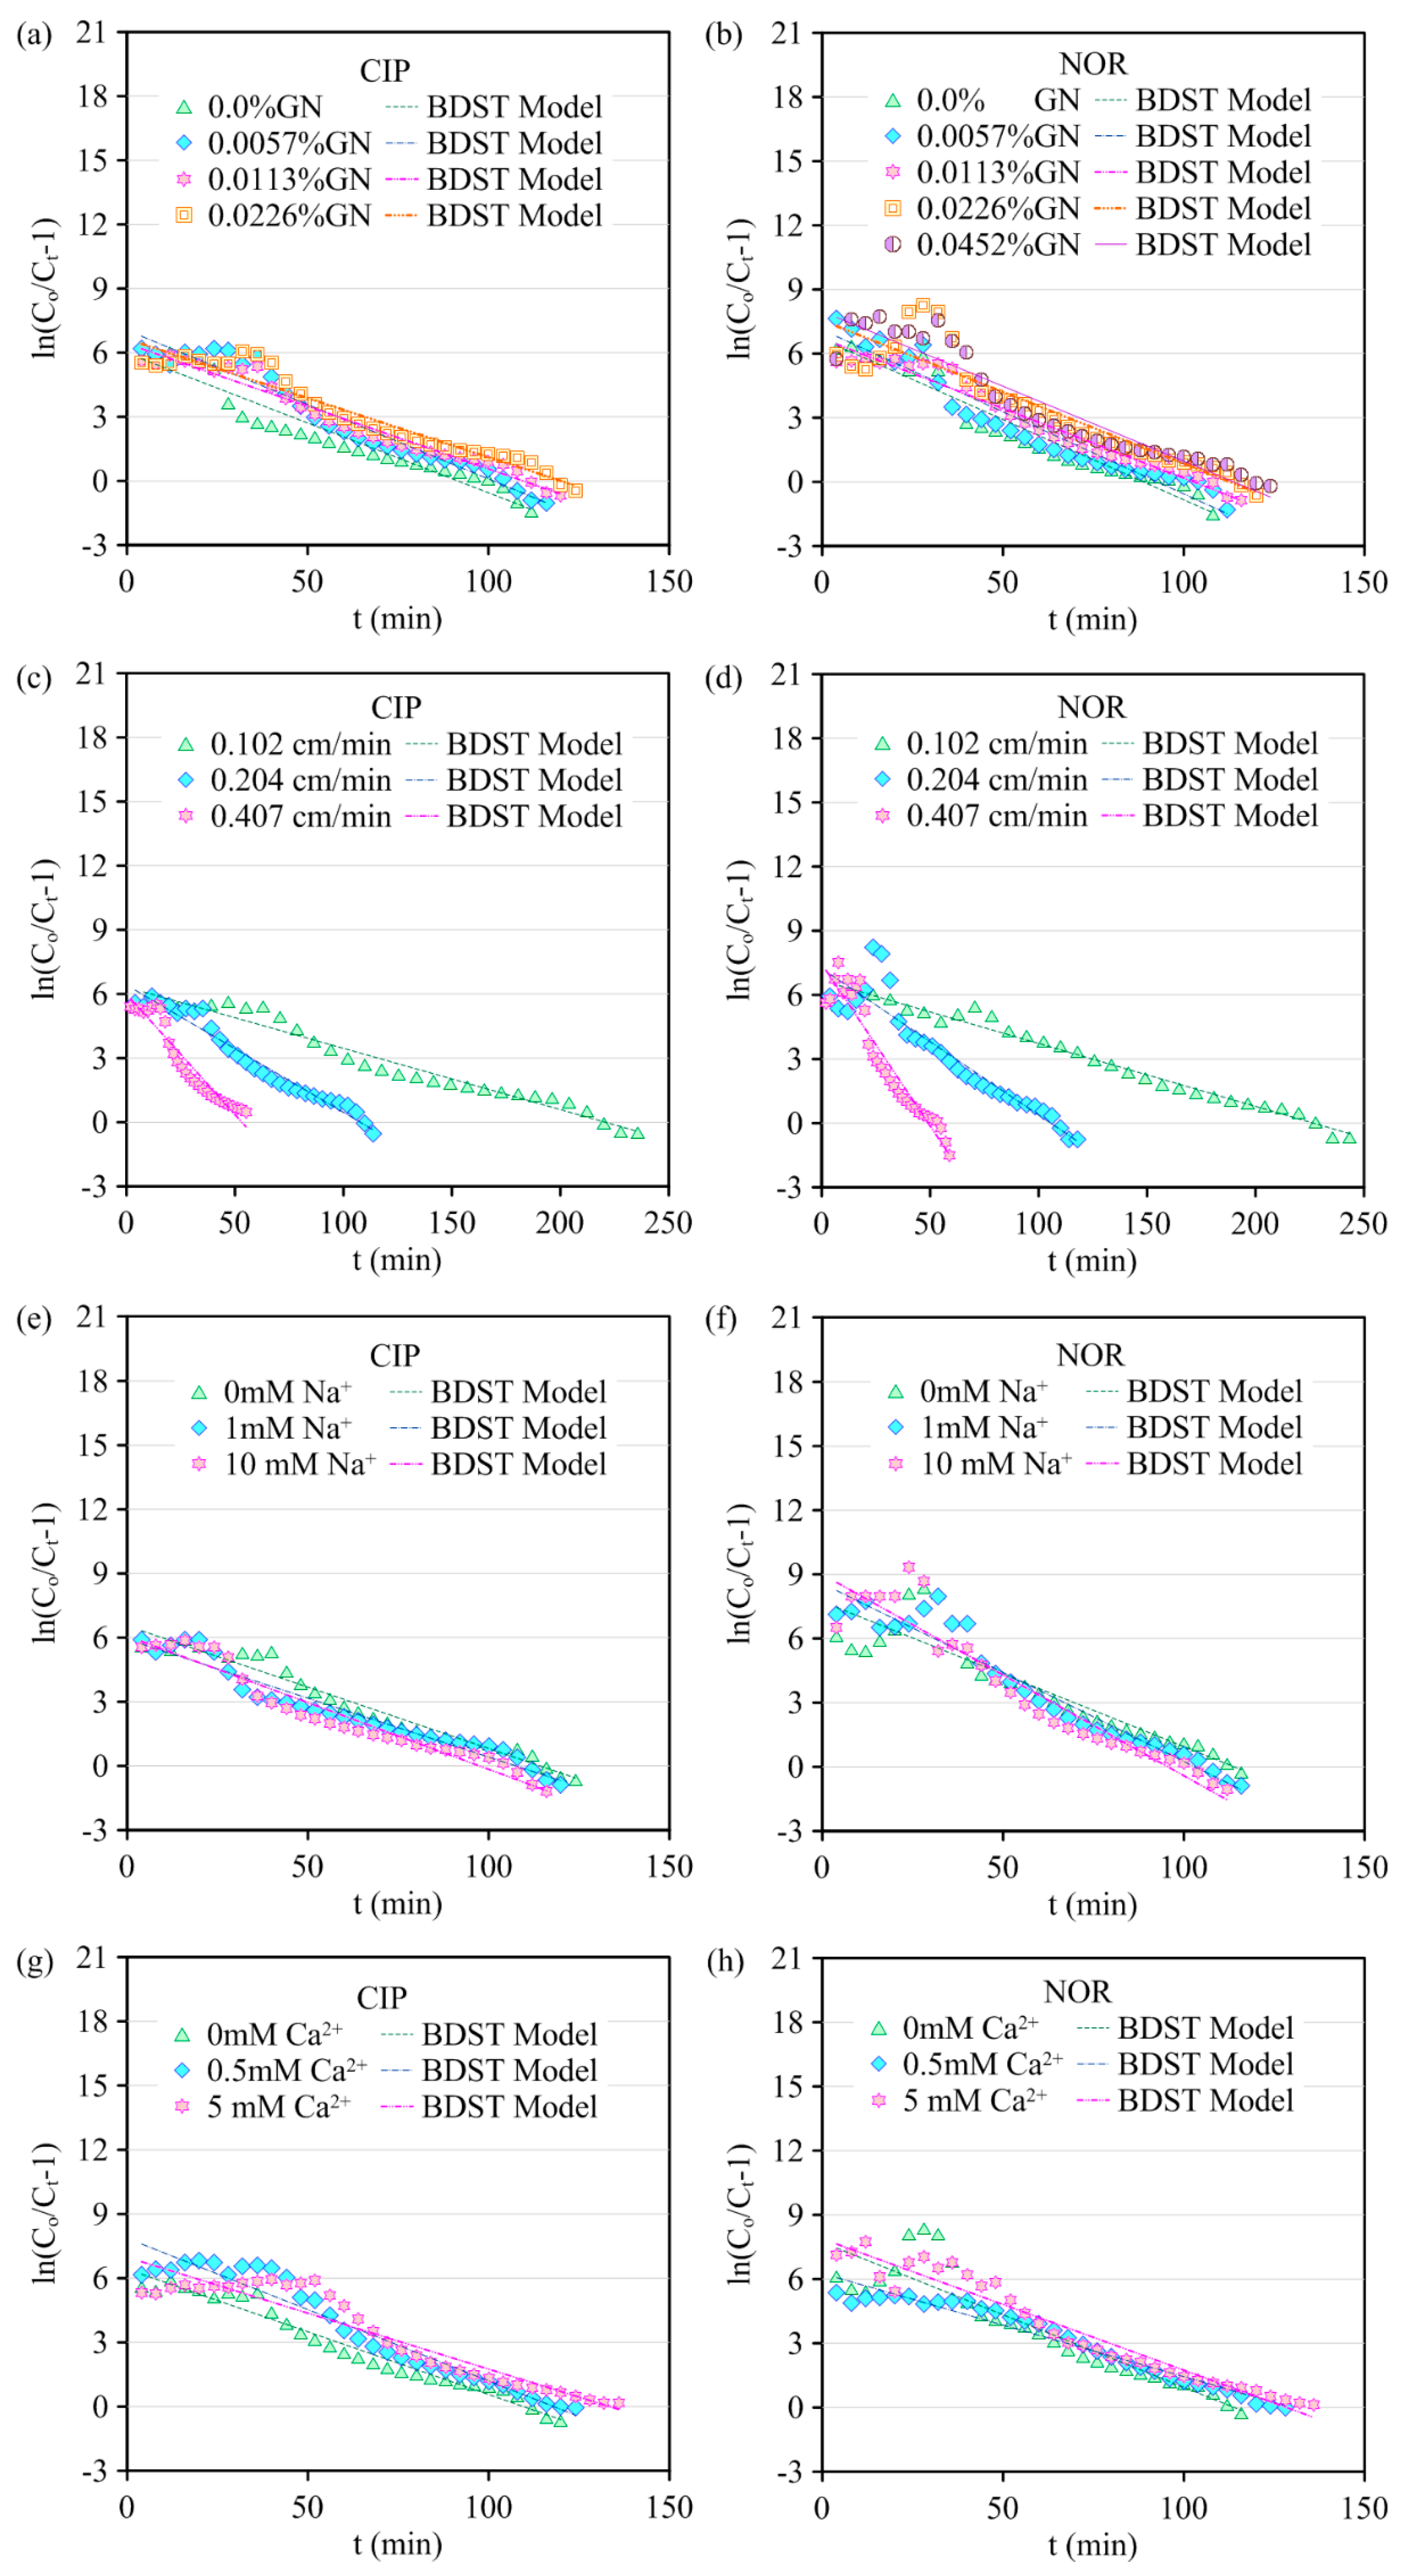
The BDST model ignores the effect of mass transfer resistance and membrane resistance, and the adsorbent is directly adsorbed on the surface of the adsorbent. BDST can be used to calculate the penetration time and adsorption amount under different conditions according to the thickness of the adsorbent in the column without additional experiments. The parameters N0 and kb of the BDST model can be obtained from the slope and intercept of the straight line in Figure 6a–h. The results of the regression analysis are shown in Figures S1–S3 and Tables S4 and S5. Both the values of kb and N0 decrease with the mass fraction of GN (Figures S1 and S2), while the mass recovery rate of CIP and NOR slightly decreases with the mass fraction of GN (Figure S3a,b).
3.2.2. Flow Velocity
The flow rate significantly affects the transport of CIP and NOR in the column experiments (Figure 5c,d). As can be seen from Table 1, with the increase in flow velocity, the mass recovery rate of CIP and NOR also increases, BTCs become steeper and the mobility of CIP and NOR is enhanced. When the flow rate increases from 0.5 mL/min to 2 mL/min, the mass recovery rate of CIP increases from 57.8% to 74.5% and the mass recovery rate of NOR increases from 56.8% to 71.3%. At different flow rates (0.5 mL/min, 1 mL/min and 2 mL/min), the peak values of C/C0 for BTCs of CIP are 62.3%, 66.2% and 68.9%, respectively, and the time needed to reach the peak value is 248 min, 120 min and 64 min, respectively. At flow rates of 0.5 mL/min, 1 mL/min and 2 mL/min, the peak values of C/C0 for BTCs of NOR are 66.19%, 68.12% and 82.02%, respectively, and the time needed to reach the peak value is 248 min, 116 min and 60 min, respectively. The experimental results indicate that the mobility of CIP and NOR by GN is enhanced and the adsorption is inhibited under high flow velocity conditions, which may be attributed to the insufficient contact time between the QNs and GN in the column [7,47]. Therefore, the mass recovery rate of CIP and NOR decreases, and the mobility of CIP and NOR is enhanced at a high flow velocity.
The transport of CIP and NOR is simulated by the BDST model and the results are shown in Figure 6a–h. The BDST model fits well with the experimental results under different physicochemical conditions, and the determined coefficients are all higher than 0.880. A regression analysis suggests the values of kb and mass recovery rate tend to increase with the rise of flow velocity, while the values of N0 decrease with flow velocity (Tables S4 and S5). Both the experimental and model results indicate the mobility of CIP and NOR by GN is enhanced under the condition of high flow velocity.
3.2.3. Ionic Types and Strengths
The experimental and model results show that ionic strength has a significant inhibition effect on the mobility of CIP and NOR (Figure S3e–h). When the concentration of NaCl increases from 0 mM to 10 mM, the zeta potential of SS increases from −22.3 mV to −14.8 mV and the zeta potential of GN increases from −53.5 mV to −32.8 mV (Table S1). Simultaneously, the peak value of C/C0 of BTC for CIP increases from 66.2% to 76.5%, and the mass recovery rate increases from 62.7% to 75.8% (Table 1). The C/C0 peak of NOR BTC increases from 65.4% to 73.9%, and the mass recovery rate increases from 58.5% to 74.5% (Table 1). According to Table 1, Na+ has a significant promotion effect on the mobility of CIP and NOR. This is mainly caused by two reasons: (1) the increase in Na+ ionic strength weakens the electrostatic gravitational force between the GN nanoparticles and antibiotic particles, and the electron-shielding effect of Na+ on the surface charge sites of the GN nanoparticles weakens the electron effect of the π-antibiotic cation; (2) Na+ can enter the diffuse double layer attached to the surface of GN nanoparticles and thus reduce the repulsive force between GN nanoparticles, so Na+ promotes the aggregation of GN nanoparticles.
When the ionic strength (Ca2+) increases from 0.5 mM to 5 mM, the zeta potential of GN decreases obviously (from −22.5 mV to −5.36 mV). Moreover, the peak value of C/C0 of BTCs for CIP decreases from 51.5% to 46.1%, and the mass recovery rate increases from 65.4% to 67.8% (Table 1). The peak value of C/C0 of BTCs for NOR decreases from 50.4% to 46.6%, and the mass recovery rate increases from 60.8% to 67.6% (Table 1). As shown in Table 1, the increase in the Ca2+ concentration significantly increases the mass recovery rate of CIP and NOR, which may be caused by the “bridging effect” of cations. Ca2+ is first adsorbed on the surface of GN particles by electrostatic force, and the adsorbed Ca2+ may provide adsorption sites or a “bridge” to enhance the adsorption capacity of GN. In addition, the BTCs of CIP and NOR exhibit some hysteresis at high concentrations of Ca2+, indicating that CIP and NOR take a longer time to flow out of the column as Ca2+ concentrations increase, which also reflects the existence of reversible interactions between GN particles and QNs’ antibiotics.
The fitted parameters kb and N0 for the CIP and NOR remediation experiments are in the range of 2.87 × 10⁻³~1.52 × 10⁻² and 1.16 × 10⁴~9.05 × 10⁴, respectively (Table 1). The values of the parameters are larger than those of carbon nanomaterials and biological carbon as fixed beds for the removal of heavy metals and organic pollutants [10], further proving that GN can significantly affect the transport of QNs in groundwater. The model can be used to predict the transport of CIP and NOR in porous media containing GN.
4. Conclusions
The adsorption processes of typical QNs (CIP and NOR) on GN and the effects of GN on the transport effects of typical QNs are investigated in this study. The results of the adsorption experiments show that the Langmuir isothermal model can simulate the isothermal adsorption process of GN and SS on CIP and NOR with the highest precision, and the maximum adsorption capacities of CIP and NOR on GN are 270.67 mg/L and 178.36 mg/L, respectively. The results from the column experiments suggest that physicochemical conditions play an important role in the mobility of CIP and NOR. The higher the mass fraction of GN, the stronger the inhibition effect of GN. However, the mass recovery rates of CIP and NOR show a positive correlation with flow velocity and ionic strength. In addition, the BDST model can simulate the column experimental results well and predict the penetration time of CIP and NOR in the column, and the model results further indicate that GN can effectively inhibit the mobility of CIP and NOR in saturated porous media. The findings in this study contribute to an in-depth understanding of the interactions between GN and antibiotics and have a potential application value in the remediation of antibiotic contamination in groundwater systems.
Supplementary Materials
The following supporting information can be downloaded at: https://www.mdpi.com/article/10.3390/w15030593/s1, Figure S1. The value of kb under different physicochemical conditions: (a) Variation of kb with the mass fraction of GN for CIP; (b) Variation of kb with the mass fraction of GN for NOR; (c) Variation of kb with flow velocity for CIP; (d) Variation of kb with flow velocity for NOR; (e) Variation of kb with ionic strength (Na+) for CIP; (f) Variation of kb with ionic strength (Na+) for NOR; (g) Variation of kb with ionic strength (Ca2+) for CIP; (h) Variation of kb with ionic strength (Ca2+) for NOR; Figure S2. The value of N0 under different physicochemical conditions: (a) Variation of N0 with the mass fraction of GN for CIP; (b) Variation of N0 with the mass fraction of GN for NOR; (c) Variation of N0 with flow velocity for CIP; (d) Variation of N0 with flow velocity for NOR; (e) Variation of N0 with ionic strength (Na+) for CIP; (f) Variation of N0 with ionic strength (Na+) for NOR; (g) Variation of N0 with ionic strength (Ca2+) for CIP; (h) Variation of N0 with ionic strength (Ca2+) for NOR; Figure S3. Mass recovery rate of CIP and NOR under different physicochemical conditions: (a) The change of mass recovery rate of CIP with the mass fraction of GN; (b) The change of mass recovery rate of NOR with the mass fraction of GN; (c) The change of mass recovery rate of CIP with flow velocity; (d) The change of mass recovery rate of NOR with flow velocity; (e) The change of mass recovery rate of CIP with ionic strength (Na+); (f) The change of mass recovery rate of NOR with ionic strength (Na+); (g) The change of mass recovery rate of CIP with ionic strength (Ca2+); (h) The change of mass recovery rate of NOR with ionic strength (Ca2+); Table S1. Zeta potential of QS and GN; Table S2. Parameters of adsorption kinetics models; Table S3. Fitting parameters of isothermal models; Table S4. The fitted equations of BDST parameters and mass recovery rate of CIP; Table S5. The fitted equations of BDST parameters and mass recovery rate of NOR.
Author Contributions
Z.C.: conceptualization, methodology, writing—original draft, project administration; C.M.: conceptualization, methodology, writing—review and editing; M.W.: conceptualization, methodology, writing—review and editing, funding acquisition, project administration; H.C.: conceptualization, methodology; Y.H.: conceptualization; G.L.: conceptualization, methodology, writing—review and editing; Q.L.: conceptualization; J.W. (Jianfeng Wu): conceptualization; J.W. (Jichun Wu): conceptualization; B.X.H.: conceptualization, methodology. All authors have read and agreed to the published version of the manuscript.
Funding
This research was funded by the National Natural Science Foundation of China (41902246), the Natural Science Foundation of Guangdong Province (2022A1515010273), the Natural Science Foundation of Guangzhou City (202201010414) and the National Key Research and Development Plan of China (2019YFC1804302). The APC was funded by 2019YFC1804302.
Data Availability Statement
Data will be made available on request.
Conflicts of Interest
The authors declare no conflict of interest.
References
- Georgakakos, C.B.; Hicks, B.J.; Walter, M.T. Farmer perceptions of dairy farm antibiotic use and transport pathways as determinants of contaminant loads to the environment. J. Environ. Manage. 2021, 281, 111880. [Google Scholar] [CrossRef] [PubMed]
- Young, S.; Juhl, A.; O’Mullan, G.D. Antibiotic-resistant bacteria in the Hudson River Estuary linked to wet weather sewage contamination. J. Water Health 2013, 11, 297–310. [Google Scholar] [CrossRef]
- Zhou, L.; Cheng, W.; Marsac, R.; Boily, J.F.; Hanna, K. Silicate surface coverage controls quinolone transport in saturated porous media. J. Colloid Interf. Sci. 2022, 607, 347–356. [Google Scholar] [CrossRef] [PubMed]
- Jiang, Y.; Liu, Y.; Zhang, J. Antibiotic contaminants reduced the treatment efficiency of UV-C on Microcystis aeruginosa through hormesis. Environ. Pollut. 2020, 261, 114193. [Google Scholar] [CrossRef] [PubMed]
- Kaur, A.; Kansal, S.K. Bi2WO6 nanocuboids: An efficient visible light active photocatalyst for the degradation of levofloxacin drug in aqueous phase. Chem. Eng. J. 2016, 302, 194–203. [Google Scholar] [CrossRef]
- Zhang, G.; Liu, X.; Lu, S.; Zhang, J.; Wang, W. Occurrence of typical antibiotics in Nansi Lake’s inflowing rivers and antibiotic source contribution to Nansi Lake based on principal component analysis-multiple linear regression model. Chemosphere 2020, 242, 125269. [Google Scholar] [CrossRef]
- Darweesh, T.M.; Ahmed, M.J. Batch and fixed bed adsorption of levofloxacin on granular activated carbon from date (Phoenix dactylifera L.) stones by KOH chemical activation. Environ. Toxicol. Phar. 2017, 50, 159–166. [Google Scholar] [CrossRef]
- Xing, L.; Liu, H.; Zhou, J.G. Numerical study of the antibiotic transport and distribution in the Laizhou Bay, China. Environ. Sci. Pollut. Res. 2020, 27, 37760–37772. [Google Scholar] [CrossRef]
- Yang, H.; Huang, X.J.; Thompson, J.R.; Flower, R.J. China’s soil pollution: Urban brownfields. Science 2014, 344, 691–692. [Google Scholar] [CrossRef]
- Zhang, D.; Pan, B.; Wu, M.; Wang, B.; Zhang, H.; Peng, H.B.; Wu, D.; Ning, P. Adsorption of sulfamethoxazole on functionalized carbon nanotubes as affected by cations and anions. Environ. Pollut. 2011, 159, 2616–2621. [Google Scholar] [CrossRef]
- Golet, E.M.; Xifra, I.; Siegrist, H.; Alder, A.C.; Giger, W. Environmental exposure assessment of fluoroquinolone antibacterial agents from sewage to soil. Environ. Sci. Technol. 2003, 37, 3243–3249. [Google Scholar] [CrossRef] [PubMed]
- Zheng, D.; Yin, G.; Liu, M.; Chen, C.; Jiang, Y.; Hou, L.; Zheng, Y. A systematic review of antibiotics and antibiotic resistance genes in estuarine and coastal environments. Sci. Total Environ. 2021, 777, 146009. [Google Scholar] [CrossRef]
- Carabineiro, S.A.C.; Thavorn-Amornsri, T.; Pereira, M.F.R.; Figueiredo, J.L. Adsorption of ciprofloxacin on surface-modified carbon materials. Water Res. 2011, 45, 4583–4591. [Google Scholar] [CrossRef] [PubMed]
- Martinez, J.L. Environmental pollution by antibiotics and by antibiotic resistance determinants. Environ. Pollut. 2009, 157, 2893–2902. [Google Scholar] [CrossRef]
- Rutgersson, C.; Fick, J.; Marathe, N.; Kristiansson, E.; Janzon, A.; Angelin, M.; Johansson, A.; Shouche, Y.; Flach, C.F.; Larsson, D.G.J. Fluoroquinolones and qnr Genes in Sediment, Water, Soil, and Human Fecal Flora in an Environment Polluted by Manufacturing Discharges. Environ. Sci. Technol. 2014, 48, 7825–7832. [Google Scholar] [CrossRef]
- Chen, H.; Gao, B.; Li, H. Removal of sulfamethoxazole and ciprofloxacin from aqueous solutions by graphene oxide. J. Hazard. Mater. 2015, 282, 201–207. [Google Scholar] [CrossRef] [PubMed]
- Chen, H.; Gao, B.; Li, H.; Ma, L.Q. Effects of pH and ionic strength on sulfamethoxazole and ciprofloxacin transport in saturated porous media. J. Contam. Hydrol. 2011, 126, 29–36. [Google Scholar] [CrossRef] [PubMed]
- Dong, S.N.; Sun, Y.Y.; Wu, J.C.; Wu, B.J.; Creamer, A.E.; Gao, B. Graphene oxide as filter media to remove levofloxacin and lead from aqueous solution. Chemosphere 2016, 150, 759–764. [Google Scholar] [CrossRef] [PubMed]
- Ostermann, A.; Siemens, J.; Welp, G.; Xue, Q.Y.; Lin, X.Y.; Liu, X.J.; Amelung, W. Leaching of veterinary antibiotics in calcareous Chinese croplands. Chemosphere 2013, 91, 928–934. [Google Scholar] [CrossRef]
- Ma, J.; Guo, H.M.; Weng, L.P.; Li, Y.T.; Lei, M.; Chen, Y. Distinct effect of humic acid on ferrihydrite colloid-facilitated transport of arsenic in saturated media at different Ph. Chemosphere 2018, 212, 794–801. [Google Scholar] [CrossRef]
- Wang, Y.Y.; Zhong, L.; Song, X.M.; Adeel, M.; Yang, Y.S. Natural colloids facilitated transport of steroidal estrogens in saturated porous media: Mechanism and processes. Environ. Pollut. 2022, 315, 120315. [Google Scholar] [CrossRef] [PubMed]
- Afrooz, A.R.M.N.; Das, D.; Murphy, C.J.; Vikesland, P.; Saleh, N.B. Co-transport of gold nanospheres with single-walled carbon nanotubes in saturated porous media. Water Res. 2016, 99, 7–15. [Google Scholar] [CrossRef]
- Zhang, M.Y.; Bradford, S.A.; Šimůnek, J.; Vereecken, H.; Klumpp, E. Co-transport of multi-walled carbon nanotubes and sodium dodecylbenzenesulfonate in chemically heterogeneous porous media. Environ. Pollut. 2019, 247, 907–916. [Google Scholar] [CrossRef] [PubMed]
- Beryani, A.; Alavi Moghaddam, M.R.; Tosco, T.; Bianco, C.; Hosseini, S.M.; Kowsari, E.; Sethi, R. Key factors affecting graphene oxide transport in saturated porous media. Sci. Total Environ. 2020, 698, 134224. [Google Scholar] [CrossRef] [PubMed]
- Sun, K.X.; Dong, S.N.; Sun, Y.Y.; Gao, B.; Du, W.C.; Xu, H.X.; Wu, J.C. Graphene oxide-facilitated transport of levofloxacin and ciprofloxacin in saturated and unsaturated porous media. J. Hazard. Mater. 2018, 348, 92–99. [Google Scholar] [CrossRef]
- Sun, S.; Ma, X. 3D Porous Graphene/Polyvinyl Alcohol Composites: The Effect of Modification on the Adsorption Properties. Nano 2016, 11, 1650125. [Google Scholar] [CrossRef]
- Wu, S.; Zhao, X.; Li, Y.; Zhao, C.T.; Du, Q.J.; Sun, J.K.; Wang, Y.H.; Peng, X.J.; Xia, Y.Z.; Wang, Z.H.; et al. Adsorption of ciprofloxacin onto biocomposite fibers of graphene oxide/calcium alginate. Chem. Eng. J. 2013, 230, 389–395. [Google Scholar] [CrossRef]
- Bin, Q.; Lin, B.; Zhu, K.; Shen, Y.; Man, Y.; Wang, B.; Lai, C.; Chen, W. Superior trichloroethylene removal from water by sulfide-modified nanoscale zero-valent iron/graphene aerogel composite. J. Environ. Sci. 2020, 88, 90–102. [Google Scholar] [CrossRef]
- Kumar, R.; Ansari, M.O.; Parveen, N.; Barakat, M.A.; Cho, M.H. Simple route for the generation of differently functionalized PVC@graphene-polyaniline fiber bundles for the removal of Congo red from wastewater. RSC Adv. 2015, 5, 61486–61494. [Google Scholar] [CrossRef]
- Parveen, N.; Ansari, M.O.; Cho, M.H. Simple route for gram synthesis of less defective few layered graphene and its electrochemical performance. RSC Adv. 2015, 5, 44920–44927. [Google Scholar] [CrossRef]
- Ren, L.; Chi, Z.; Dong, J.; Zhao, Y.; Zhang, C. Deposition mechanism of polydisperse xanthan gum-stabilized graphene oxide/nano-iron composites in saturated porous medium. J. Clean. Prod. 2020, 273, 123069. [Google Scholar] [CrossRef]
- Dong, J.L.; Gao, Z.Y.; Yang, W.J.; Li, A.; Ding, X.L. Adsorption characteristics of Co-anchored different graphene substrates toward O2 and NO molecules. Appl. Surf. Sci. 2019, 480, 779–791. [Google Scholar] [CrossRef]
- Nel, A.; Xia, T.; Mädler, L.; Li, N. Toxic Potential of Materials at the Nanolevel. Science 2006, 311, 622–627. [Google Scholar] [CrossRef]
- Dai, C.; Zhou, H.; You, X.; Duan, Y.; Tu, Y.; Liu, S.; Zhou, F.; Hon, L.K. Silica colloids as non-carriers facilitate Pb2+ transport in saturated porous media under a weak adsorption condition: Effects of Pb2+ concentrations. Environ. Sci. Pollut. Res. 2020, 27, 15188–15197. [Google Scholar] [CrossRef] [PubMed]
- Guo, X.Y.; Du, B.; Wei, Q.; Yang, J.; Hu, L.H.; Yan, L.G.; Xu, W.Y. Synthesis of amino functionalized magnetic graphenes composite material and its application to remove Cr(VI), Pb(II), Hg(II), Cd(II) and Ni(II) from contaminated water. J. Hazard. Mater. 2014, 278, 211–220. [Google Scholar] [CrossRef]
- Sheng, Z.B.; Cao, M.; Hong, Y.; Wang, S.G.; Fan, Z.H.; Xiong, J.B.; Yang, H.C.; Deng, C.L. Preparation of Functionalized Graphene Nano-platelets and Use for Adsorption of Pb2+ from Solution. J. Wuhan Univ. Technol. 2018, 33, 1395–1401. [Google Scholar] [CrossRef]
- Yusuf, M.; Khan, M.A.; Otero, M.; Abdullah, E.C.; Hosomi, M.; Terada, A.; Riya, S.H. Synthesis of CTAB intercalated graphene and its application for the adsorption of AR265 and AO7 dyes from water. J. Colloid Interf. Sci. 2017, 493, 51–61. [Google Scholar] [CrossRef]
- Xu, H.H.; Zhu, S.; Lu, K.; Jia, H.J.; Xia, M.Z.; Wang, F.Y. Preparation of hierarchically floral ZIF-8 derived carbon@polyaniline@Ni/Al layered double hydroxides composite with outstanding removal phenomenon for saccharin. Chem. Eng. J. 2022, 450, 138127. [Google Scholar] [CrossRef]
- Peng, B.Q.; Chen, L.; Que, C.J.; Yang, K.; Deng, F.; Deng, X.Y.; Shi, G.S.; Xu, G.; Wu, M.H. Adsorption of antibiotics on graphene and biochar in aqueous solutions induced by π-π interactions. Sci. Rep. 2016, 6, 31920. [Google Scholar] [CrossRef]
- Xu, H.H.; Zhu, S.; Xia, M.Z.; Wang, F.Y.; Ju, X.H. Three-dimension hierarchical composite via in-situ growth of Zn/Al layered double hydroxide plates onto polyaniline-wrapped carbon sphere for efficient naproxen removal. J. Hazard. Mater. 2022, 423, 127192. [Google Scholar] [CrossRef]
- Qi, Z.C.; Hou, L.; Zhu, D.Q.; Ji, R.; Chen, W. Enhanced transport of phenanthrene and 1-naphthol by colloidal graphene oxide nanoparticles in saturated soil. Environ. Sci. Technol. 2014, 48, 10136–10144. [Google Scholar] [CrossRef] [PubMed]
- Zhou, D.D.; Jiang, X.H.; Lu, Y.; Fan, W.; Huo, M.X.; Crittenden, J.C. Cotransport of graphene oxide and Cu(II) through saturated porous media. Sci. Total Environ. 2016, 550, 717–726. [Google Scholar] [CrossRef] [PubMed]
- Xu, J.; Wang, L.; Zhu, Y. Decontamination of Bisphenol A from Aqueous Solution by Graphene Adsorption. Langmuir 2012, 28, 8418–8425. [Google Scholar] [CrossRef] [PubMed]
- Yang, K.; Xing, B. Adsorption of Organic Compounds by Carbon Nanomaterials in Aqueous Phase: Polanyi Theory and Its Application. Chem. Rev. 2010, 110, 5989–6008. [Google Scholar] [CrossRef]
- Vijayaraghavan, K.; Prabu, D. Potential of Sargassum wightii biomass for copper(II) removal from aqueous solutions: Application of different mathematical models to batch and continuous biosorption data. J. Hazard. Mater. 2006, 137, 558–564. [Google Scholar] [CrossRef]
- Tian, Y.; Gao, B.; Morales, V.L.; Chen, H.; Wang, Y.; Li, H. Removal of sulfamethoxazole and sulfapyridine by carbon nanotubes in fixed-bed columns. Chemosphere 2013, 90, 2597e2605. [Google Scholar] [CrossRef] [PubMed]
- Wang, F.; Yang, B.S.; Wang, H.; Song, Q.X.; Tan, F.J.; Cao, Y.N. Removal of ciprofloxacin from aqueous solution by a magnetic chitosan grafted graphene oxide composite. J. Mol. Liq. 2016, 222, 188–194. [Google Scholar] [CrossRef]
Figure 1.
Column experimental system.

Figure 2.
Adsorption kinetics of QNs onto GN and SS: (a) adsorption kinetics of CIP onto GN; (b) adsorption kinetics of NOR onto GN; (c) adsorption isotherm of CIP onto SS; (d) adsorption isotherm of NOR onto SS; (e) adsorption isotherm of CIP onto GN; (f) adsorption isotherm of NOR onto GN.
Figure 2.
Adsorption kinetics of QNs onto GN and SS: (a) adsorption kinetics of CIP onto GN; (b) adsorption kinetics of NOR onto GN; (c) adsorption isotherm of CIP onto SS; (d) adsorption isotherm of NOR onto SS; (e) adsorption isotherm of CIP onto GN; (f) adsorption isotherm of NOR onto GN.

Figure 3.
(a) Fourier transform infrared spectroscopy (FTIR) of GN before and after CIP/NOR adsorption; (b) the existence form of CIP under different pH; (c) the existence form of NOR under different pH; (d) isoelectric point of GN.
Figure 3.
(a) Fourier transform infrared spectroscopy (FTIR) of GN before and after CIP/NOR adsorption; (b) the existence form of CIP under different pH; (c) the existence form of NOR under different pH; (d) isoelectric point of GN.

Figure 4.
The effects of pH, ionic type and strength on the adsorption of QNs onto GN: (a) effect of pH on the adsorption of CIP onto GN; (b) effect of pH on the adsorption of NOR onto GN; (c) effects of ion types and ionic strength on the adsorption of CIP onto GN; (d) effects of ion types and ionic strength on the adsorption of NOR onto GN.

Figure 5.
BTCs of CIP and NOR under different physicochemical conditions: (a) BTCs of CIP at different mass fractions of GN packed in column; (b) BTCs of NOR at different mass fractions of GN packed in column; (c) BTCs of CIP at different flow velocities; (d) BTCs of NOR at different flow velocities; (e) BTCs of CIP at different ionic strengths (Na+); (f) BTCs of NOR at different ionic strengths (Na+); (g) BTCs of CIP at different ionic strengths (Ca2+); (h) BTCs of NOR at different ionic strengths (Ca2+).

Figure 6.
The results obtained by BDST model: (a) the change of with time and simulated results of BDST for CIP migration under different mass fractions of GN packed in column; (b) the change of with time and simulated results of BDST for NOR migration under different mass fractions of GN packed in column; (c) the change of with time and simulated results of BDST for CIP migration under different flow velocities; (d) the change of with time and simulated results of BDST for NOR migration under different flow velocities; (e) the change of with time and simulated results of BDST for CIP migration under different ionic strengths (Na+); (f) the change of with time and simulated results of BDST for NOR migration under different ionic strengths (Na+); (g) the change of with time and simulated results of BDST for CIP migration under different ionic strengths (Ca2+); (h) the change of with time and simulated results of BDST for NOR migration under different ionic strengths (Ca2+).


Table 1.
Experimental conditions and model results.
| NO. | QNs | C01 (mg/L) | IS 2 (mM) | Ν 3 (cm·min−1) | PGN4 (%) | Peak Value of C/C0 | RE 5 (%) | BDST Model | |||
|---|---|---|---|---|---|---|---|---|---|---|---|
| Na+ | Ca2+ | kb6 (mg−1·min−1·L) | N07 (mg·L−1) | R2 | |||||||
| 1 | CIP | 10 | \ | \ | 0.204 | 0.0 | 0.808 | 78.7 | 6.53 × 10⁻³ | 9.05 × 10⁴ | 0.933 |
| 2 | CIP | 10 | \ | \ | 0.204 | 0.0057 | 0.737 | 68.9 | 6.95 × 10⁻³ | 8.27 × 10⁴ | 0.954 |
| 3 | CIP | 10 | \ | \ | 0.204 | 0.0113 | 0.662 | 62.7 | 5.95 × 10⁻³ | 4.45 × 10⁴ | 0.964 |
| 4 | CIP | 10 | \ | \ | 0.204 | 0.0226 | 0.610 | 54.7 | 5.52 × 10⁻³ | 2.45 × 10⁴ | 0.937 |
| 5 | CIP | 10 | \ | \ | 0.102 | 0.0113 | 0.623 | 57.8 | 2.87 × 10⁻³ | 4.49 × 10⁴ | 0.961 |
| 6 | CIP | 10 | 1 | \ | 0.204 | 0.0113 | 0.706 | 70.6 | 5.51 × 10⁻³ | 4.38 × 10⁴ | 0.946 |
| 7 | CIP | 10 | 10 | \ | 0.204 | 0.0113 | 0.765 | 75.8 | 6.23 × 10⁻³ | 3.97 × 10⁴ | 0.947 |
| 8 | CIP | 10 | \ | 0.5 | 0.204 | 0.0113 | 0.515 | 65.4 | 6.66 × 10⁻³ | 4.81 × 10⁴ | 0.943 |
| 9 | CIP | 10 | \ | 5 | 0.204 | 0.0113 | 0.461 | 67.8 | 5.23 × 10⁻³ | 5.44 × 10⁴ | 0.898 |
| 10 | CIP | 10 | \ | \ | 0.407 | 0.0113 | 0.689 | 74.5 | 1.13 × 10⁻² | 4.33 × 10⁴ | 0.923 |
| 11 | NOR | 10 | \ | \ | 0.204 | 0.0 | 0.820 | 81.2 | 7.51 × 10⁻³ | 8.78 × 10⁴ | 0.944 |
| 12 | NOR | 10 | \ | \ | 0.204 | 0.0057 | 0.787 | 74.4 | 7.67 × 10⁻³ | 7.55 × 10⁴ | 0.933 |
| 13 | NOR | 10 | \ | \ | 0.204 | 0.0113 | 0.706 | 68.9 | 6.53 × 10⁻³ | 4.18 × 10⁴ | 0.966 |
| 14 | NOR | 10 | \ | \ | 0.204 | 0.0226 | 0.654 | 58.5 | 6.85 × 10⁻³ | 2.15 × 10⁴ | 0.880 |
| 15 | NOR | 10 | \ | \ | 0.204 | 0.0452 | 0.547 | 47.1 | 7.01 × 10⁻³ | 1.16 × 10⁴ | 0.913 |
| 16 | NOR | 10 | \ | \ | 0.102 | 0.0226 | 0.636 | 56.8 | 2.94 × 10⁻³ | 2.31 × 10⁴ | 0.978 |
| 17 | NOR | 10 | 1 | \ | 0.204 | 0.0226 | 0.708 | 65.0 | 8.32 × 10⁻³ | 2.10 × 10⁴ | 0.942 |
| 18 | NOR | 10 | 10 | \ | 0.204 | 0.0226 | 0.739 | 74.5 | 9.41 × 10⁻³ | 1.95 × 10⁴ | 0.916 |
| 19 | NOR | 10 | \ | 0.5 | 0.204 | 0.0226 | 0.504 | 60.8 | 4.82 × 10⁻³ | 2.65 × 10⁴ | 0.957 |
| 20 | NOR | 10 | \ | 5 | 0.204 | 0.0226 | 0.466 | 67.6 | 6.14 × 10⁻³ | 2.62 × 10⁴ | 0.950 |
| 21 | NOR | 10 | \ | \ | 0.407 | 0.0226 | 0.788 | 71.3 | 1.52 × 10⁻² | 2.00 × 10⁴ | 0.915 |
Note(s): 1 C0 is initial concentrations of CIP/NOR; 2 IS is ionic strength; 3 ν is flow velocity; 4 PGN is the mass fraction of GN; 5 RECIP is the mass recovery rate of CIP/NOR; 6 kb is the rate constant; 7N0 is the adsorption capacity of GN.Tab.
Disclaimer/Publisher’s Note: The statements, opinions and data contained in all publications are solely those of the individual author(s) and contributor(s) and not of MDPI and/or the editor(s). MDPI and/or the editor(s) disclaim responsibility for any injury to people or property resulting from any ideas, methods, instructions or products referred to in the content. |
© 2023 by the authors. Licensee MDPI, Basel, Switzerland. This article is an open access article distributed under the terms and conditions of the Creative Commons Attribution (CC BY) license (https://creativecommons.org/licenses/by/4.0/).
Share and Cite
MDPI and ACS Style
Cheng, Z.; Mo, C.; Wu, M.; Cao, H.; Hao, Y.; Lu, G.; Li, Q.; Wu, J.; Wu, J.; Hu, B.X. Effects of Graphene on the Transport of Quinolones in Porous Media. Water 2023, 15, 593. https://doi.org/10.3390/w15030593
AMA Style
Cheng Z, Mo C, Wu M, Cao H, Hao Y, Lu G, Li Q, Wu J, Wu J, Hu BX. Effects of Graphene on the Transport of Quinolones in Porous Media. Water. 2023; 15(3):593. https://doi.org/10.3390/w15030593
Chicago/Turabian StyleCheng, Zhou, Cehui Mo, Ming Wu, Huihui Cao, Yanru Hao, Guoping Lu, Qusheng Li, Jianfeng Wu, Jichun Wu, and Bill X. Hu. 2023. "Effects of Graphene on the Transport of Quinolones in Porous Media" Water 15, no. 3: 593. https://doi.org/10.3390/w15030593
Note that from the first issue of 2016, this journal uses article numbers instead of page numbers. See further details here.