Article

Threshold Recognition of Water Turbidity for Clogging Prevention during Groundwater Recharge Using Secondary Effluent from Wastewater Treatment Plant

1
School of Environment, Northeast Normal University, No. 2555, Jingyue Street, Changchun 130117, China
2
Jilin Academy of Agricultural Sciences, No. 1363, Shengtai Street, Changchun 130033, China
3
School of Municipal and Environmental Engineering, Jilin Jianzhu University, Changchun 130118, China
*
Authors to whom correspondence should be addressed.
Water 2023, 15(3), 594; https://doi.org/10.3390/w15030594
Submission received: 27 December 2022 / Revised: 19 January 2023 / Accepted: 30 January 2023 / Published: 2 February 2023
(This article belongs to the Special Issue Water Reclamation and Reuse in a Changing World)

Abstract

:
The recharge efficiency during artificial groundwater recharge (AGR) is reduced primarily by clogging that is triggered by suspended particles. However, there are loopholes in the current standards of recharge-water quality for clogging control during AGR, and the threshold values of turbidity to prevent clogging have not been reasonably determined. In this study, secondary effluents from wastewater treatment plants (WWTPs) were injected into saturated sand columns to simulate the process of AGR. Batch experiments under different turbidity conditions were conducted, and the numerical modeling of particle transport and deposition was performed to assess the clogging processes. Theories of single-collector contact and interfacial interaction energy were applied to elucidate possible microcosmic mechanisms. The results showed that the diluted secondary effluent (SE) with turbidities of 0.540 ± 0.050, 1.09 ± 0.050, and 1.84 ± 0.060 NTU caused considerable clogging in the porous media, which decreased the relative hydraulic conductivities (K/K0) by 13.2%, 17.6%, and 83.6%, respectively. The filtered SE with a turbidity of 0.160 NTU did not cause clogging, and K/K0 was reduced by only 1.70%. The clogging was attributed to the deposition of suspended particles in the sand matrix because they have a high collision efficiency (0.007–1.98) and attachment efficiency (0.029–0.589 kBT). Finally, this paper recommends that the turbidity of the recharge water should not exceed 0.500 NTU during AGR practices.

1. Introduction

With rapid population growth and economic development, the utilization and the exploitation of groundwater have sharply increased, causing continuous declines in groundwater levels, land subsidence, and seawater intrusion [1]. To alleviate the groundwater crisis, reclaimed water is widely used for artificial groundwater recharge (AGR) in many arid and semiarid regions [2,3]. However, AGR implementation is often hampered by clogging that occurs because of physical, chemical, biological, and mechanical processes or their interactions [4,5]. Clogging causes a sharp drop in the recharge rate, which in turn significantly reduces the working life of the recharge facility [6]. Physical clogging from suspended solids (SSs) is considered the most common form of clogging, accounting for 70.0% of all clogging cases in a study examining 40.0 recharged injection wells [7]. Likewise, a series of artificial recharge tests in Southern Australia found that SS-induced clogging accounted for over 92.0% of total clogging [8]. Thus, the foremost goal for preventing physical clogging is to limit SS concentrations in recharge water. Column experiments that injected SSs into porous media found that the clogging rate is further influenced by numerous factors, including temperature [1], flow velocity [9], ionic strength [10], porous media structure [11], particle concentration [12], roughness [13], and particle–size ratio [14]. Understanding the interactions between these factors will benefit the development of anticlogging strategies.
In addition to SSs, turbidity is another frequently used indicator of physical clogging during AGR. Many countries require turbidity measurements in their statutory regulations because the variable is easily measured [15]. The thresholds for SSs and turbidity in recharge water vary across quality standards (Table S1) in different regions/countries, and the two indicators can be used individually or simultaneously. For example, turbidity limits vary from 5.00 to 12.0 NTU in Chinese standards, but they are lower than 0.100 NTU in US standards [15,16]. Additionally, Chinese standards employ only turbidity, whereas foreign standards tend to jointly use SSs and turbidity [16].
Column experiments have also been useful in determining critical SS concentrations that cause clogging. For example, physical clogging was found to still occur when the influent SS concentration was only 3.00–4.00 mg/L1 [8]. Another study suggested that SS concentrations should be less than 2.00 mg/L1 to prevent the clogging of calcareous aquifers [17]. Evidence has also suggested that clogging could be completely avoided with a turbidity level lower than 3.00 NTU [18]. The differences in critical NTU values are due mainly to variations in the properties of particulate matter from different recharge-water sources.
Previously, we conducted simulated AGR experiments using saturated coarse-sand columns [19]. The experiments fed chlorinated secondary effluent (SE) taken from a wastewater treatment plant (WWTP) through the columns. Suspended particles in chlorinated SEs were composed mainly of activated sludge flocs. Effluent turbidity (3.09 NTU) and SSs (17.5 mg/L) complied with requirements in the Water Quality Standard for Urban Sewage Recharge (GB/T19, 772-2005) and the Water Quality Standard for Sewage Recharge (SL368-2006), respectively. After continuous injection for 50.0 h, K/K0 decreased by 85.8%, indicating severe clogging in the porous medium. However, inorganic particles with the same size distribution and concentration (either SSs or turbidity) did not cause clogging, where K/K0 decreased by only 1.80% and 4.03%, respectively. We inferred that the water-quality standards for AGR are insufficient in China, and more research is needed to determine water turbidity thresholds for preventing SE-related clogging.
Therefore, this study aimed to determine the turbidity threshold that avoids clogging during AGR. Using SEs with different turbidities from WWTP, we conducted batch experiments on simulated groundwater recharge. We modeled particle transport and deposition to qualify clogging processes under various conditions. Single-collector contact efficiency and interfacial interaction energy were also calculated to elucidate pore-level mechanisms.

2. Materials and Methods
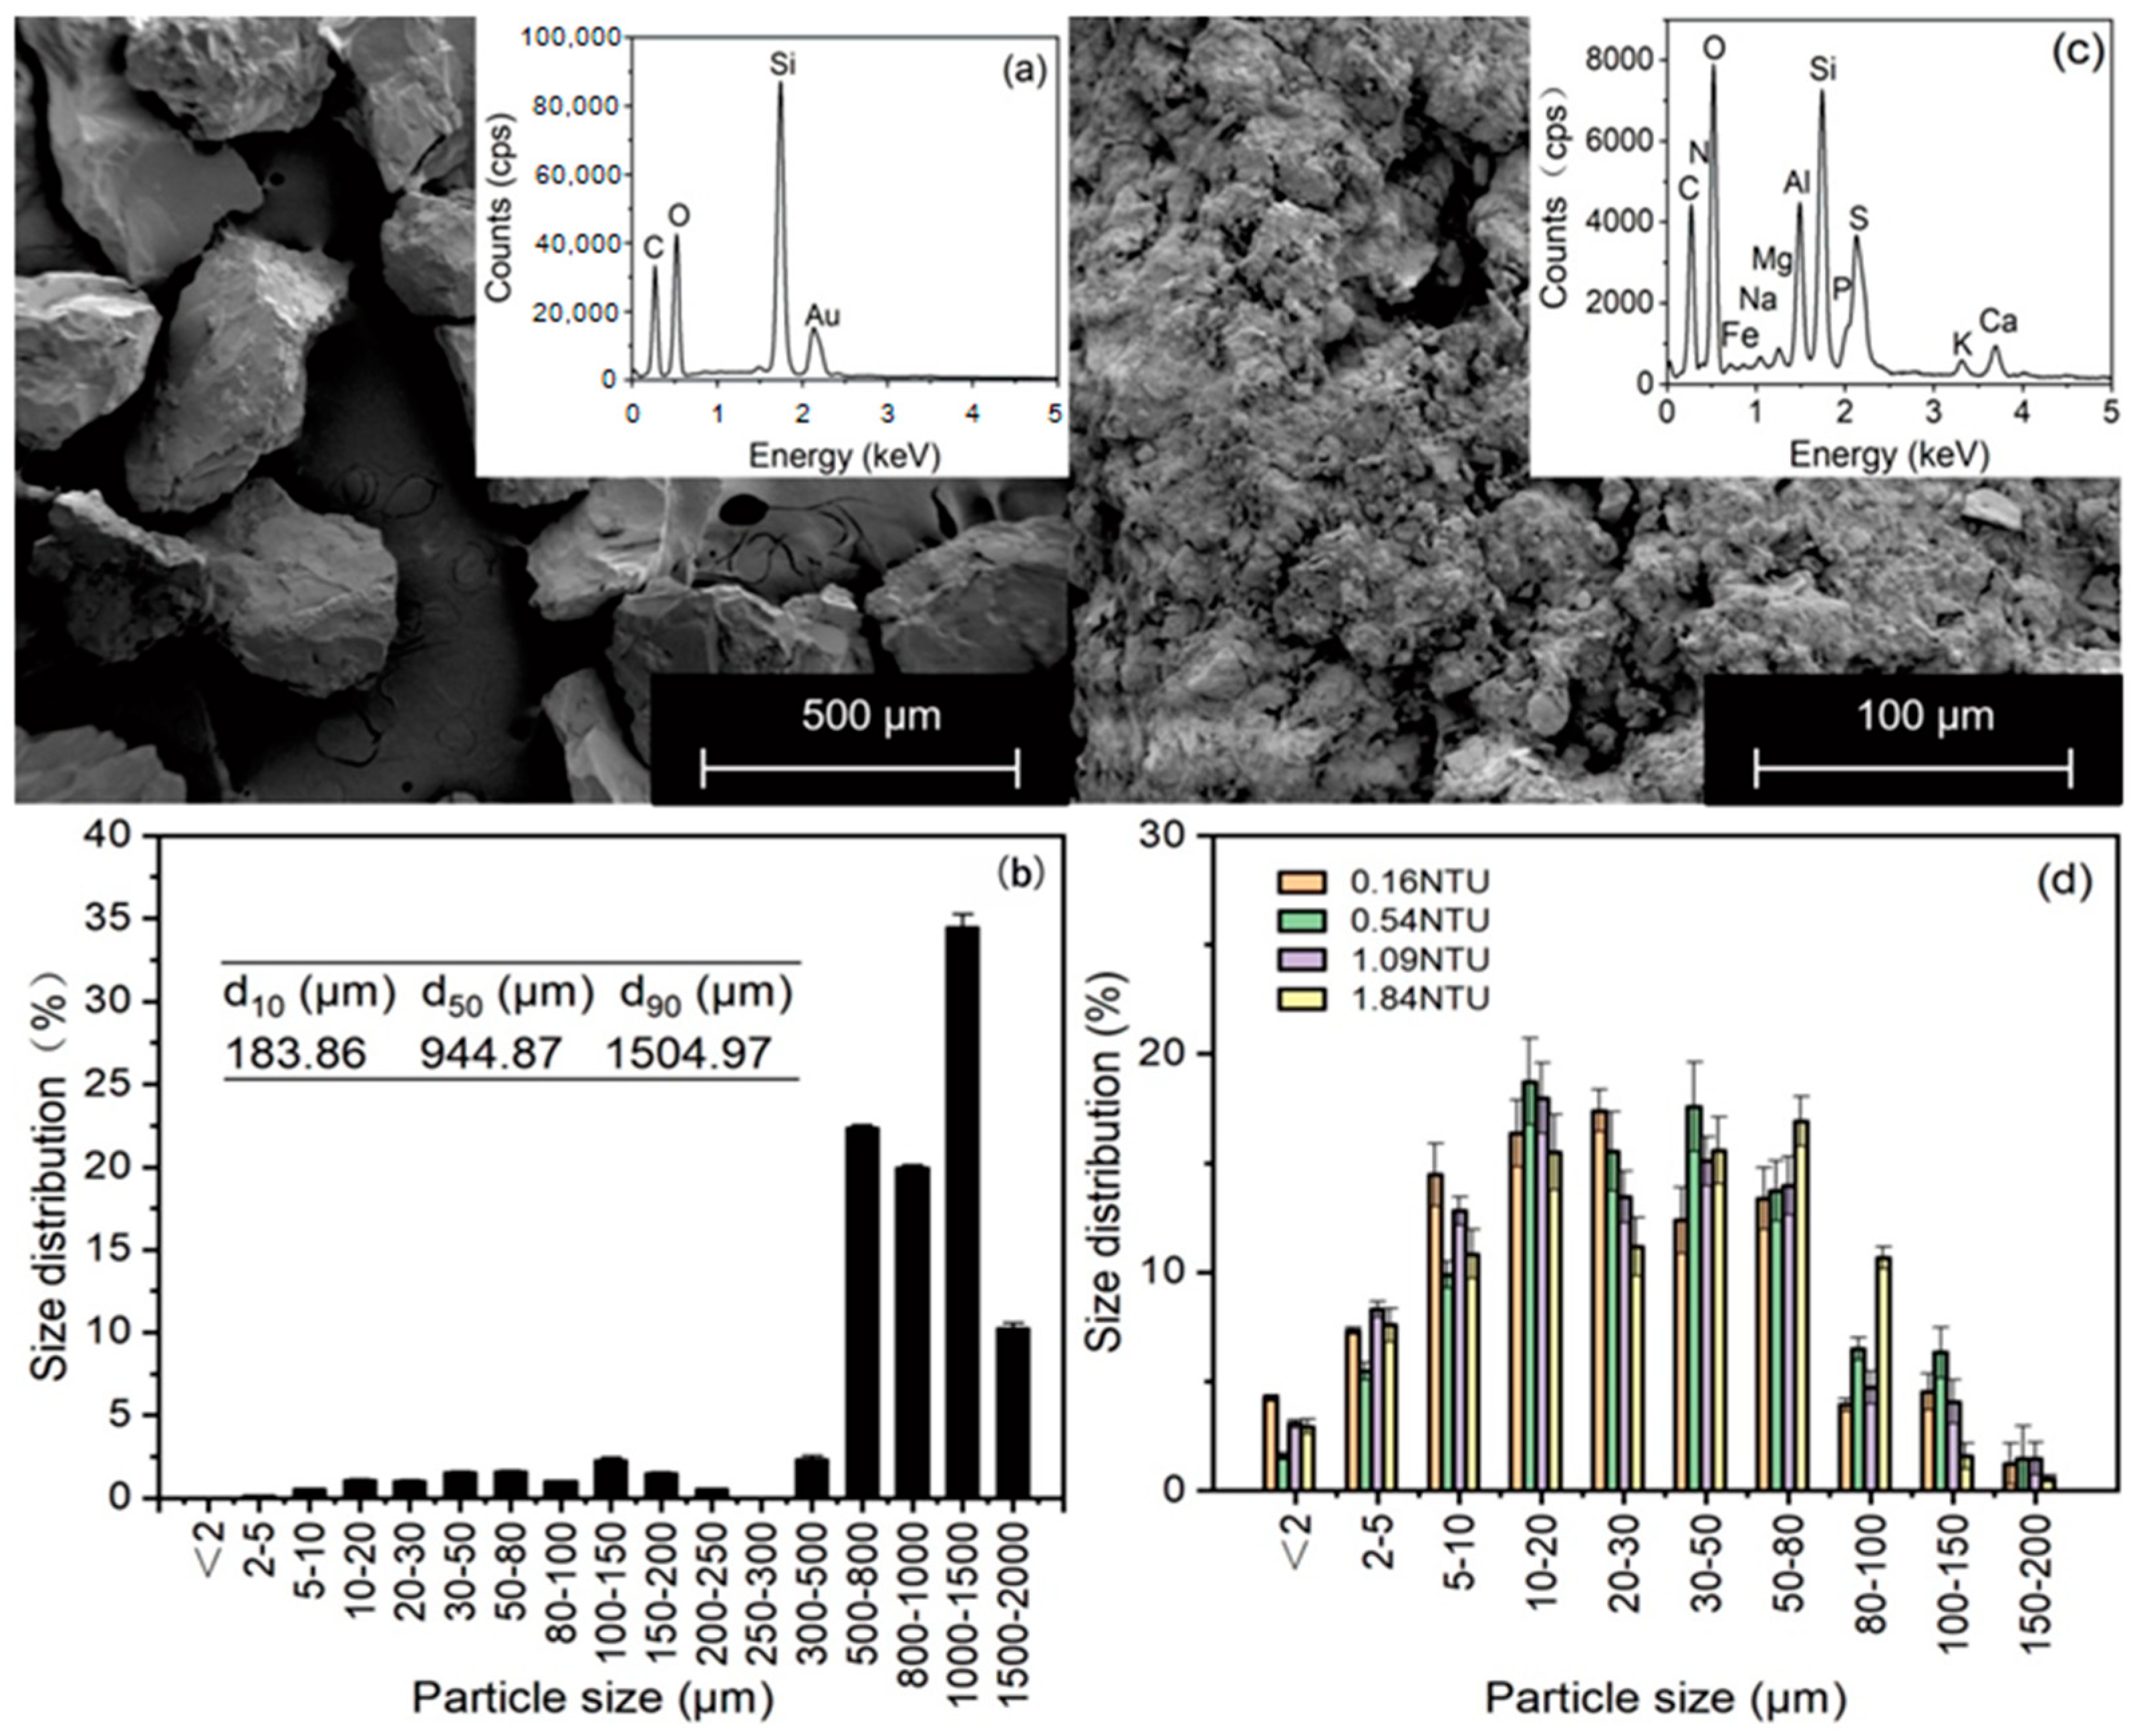
2.1. Porous Medium

Coarse quartz sand (median diameter [d50] = 0.944 mm; Mastersizer 2000, Malvern, UK) was used as the packed porous medium for the column experiments. This sediment represents the most common AGR site, with good hydraulic conductivity and infiltration capacity. Scanning electron microscopy (SEM) (XL-30 FEG-ESEM, FEI, USA) verified that the sand grains were angular in shape (Figure 1a); for grain size distribution, see Figure 1b. Next, the quartz sand was cleaned to remove organics and other impurities, a necessary step to ensure chemical stability. Quartz sand was immersed in deionized water for 24.0 h, washed with concentrated nitric acid and sodium hydroxide, then washed again with deionized water [14]. Finally, samples were dried at 80.0 °C.

2.2. Suspension

Researchers obtained the SE from the secondary settling tank at the Chengkai WWTP in Changchun City, China. To avoid the effects from microbes, the collected SE was disinfected with sodium hypochlorite, ensuring that the Cl−1 concentration was around 0.500 mg/L during recharge [16]. The disinfected SE’s turbidity was 1.84 NTU, and the SS was 16.5 mg/L. The median particle size was 32.4 μm. The particle density was 1088 kg/m3. A background solution (SE filtered through a 0.220 μm membrane) was used to dilute the SE and obtain various turbidity and SS values. The background solution was maintained at an identical set of hydrochemical conditions (turbidity = 0.160 NTU and SS = 1.67 ± 0.380 mg/L) across all experiments.
The study tested two SE dilution conditions: first, turbidity = 0.540 ± 0.050 NTU, SS = 5.02 ± 0.460 mg/L, and mean particle size = 25.8 μm; second, turbidity = 1.09 ± 0.050 NTU, SS = 9.89 ± 0.520 mg/L1, and median particle size = 29.61 μm (see Figure 1c,d for floc characteristics). Overall, particle-size distribution in the SE was similar to typical SS characteristics from a previous report [20]. Water-quality parameters of the SE are listed in Table S2.

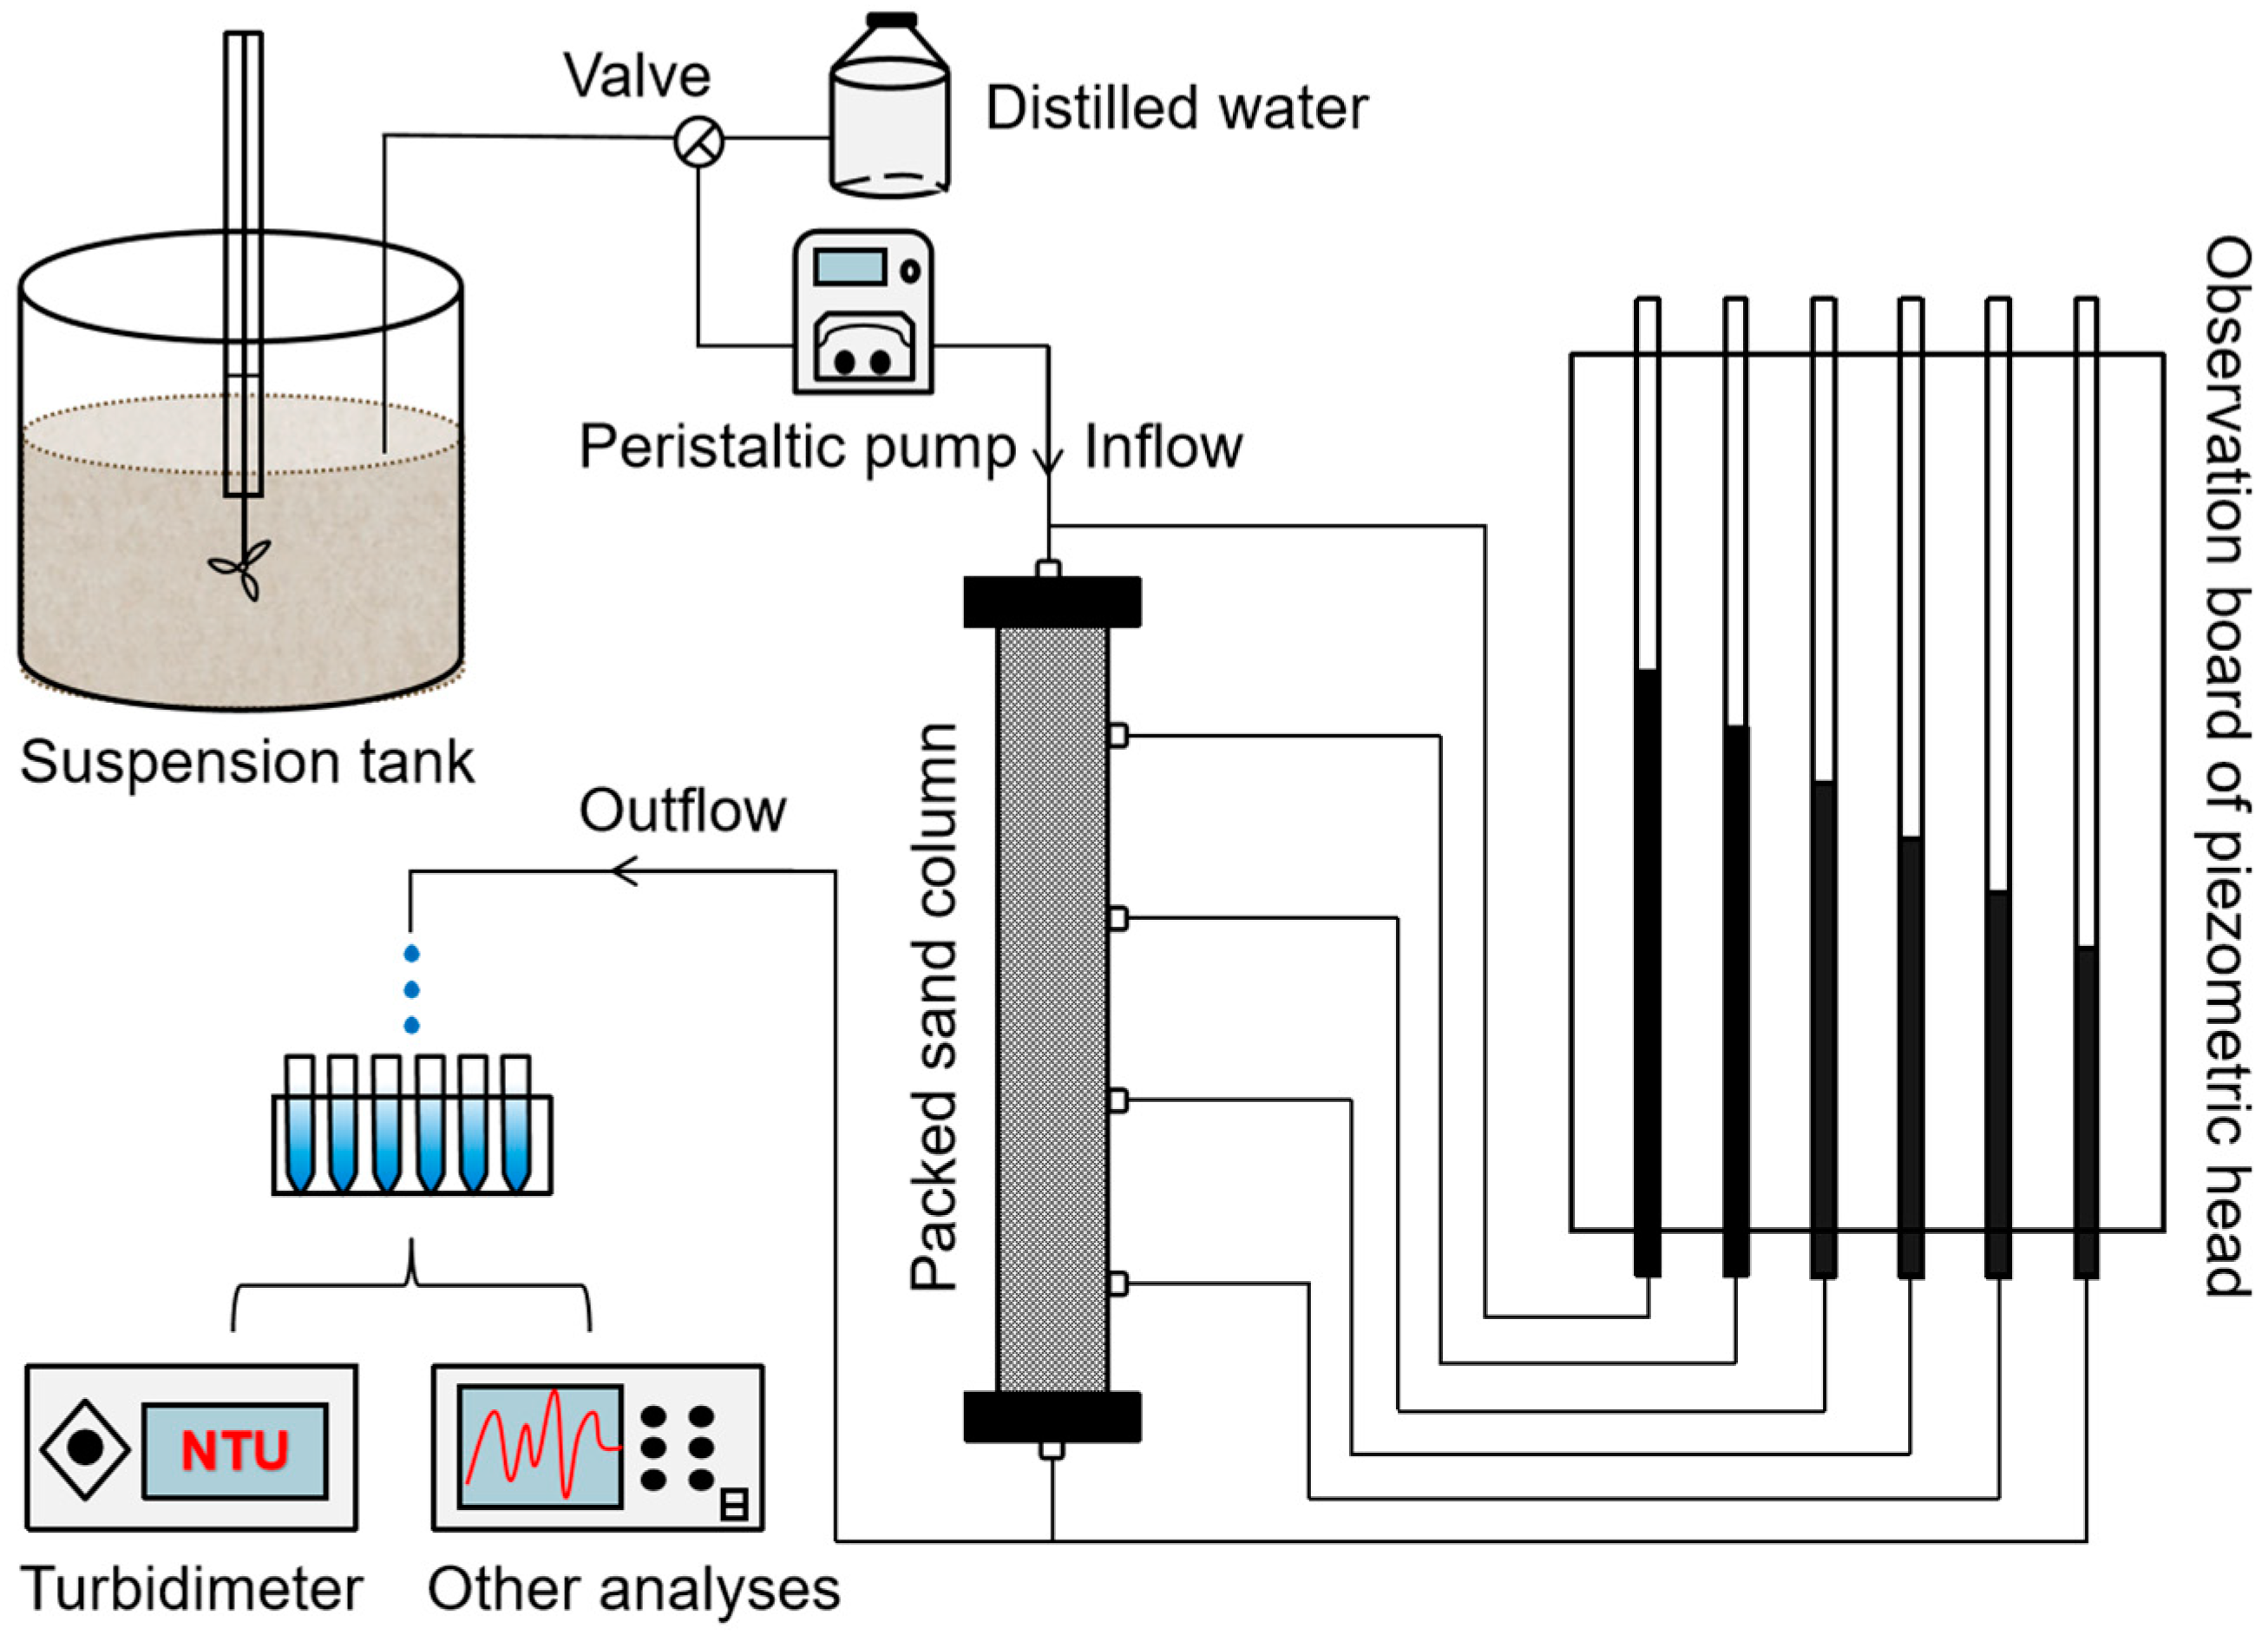
2.3. Column Experiments

A sand column system was constructed to simulate reclaimed-water percolation. All experiments were performed under identical physicochemical conditions: constant pH (7.68 ± 0.120), ionic strength (IS = 10.6 mM), and room temperature (15.6 ± 1.20 °C). The Plexiglas column was 21.0 cm long and had an inner diameter of 3.00 cm (Figure 2). To prevent sand from escaping, a 0.200 mm aperture steel screen was inserted at the column exit. Packed sand had a porosity of 0.430 ± 0.050 and a bulk density of 1.55 g/cm3. Six pressure taps were positioned along column walls to measure variations in hydraulic conductivity (K). Tap positions divided the column into five sections along the flow direction: 0.00–3.00, 3.00–8.00, 8.00–13.0, 13.0–18.0, and 18.0–21.0 cm. An observation board was installed in each section to record water head at different points.
The time-dependent change in K (m/d) of different sections was calculated using Darcy’s law:
K = Q × L S × Δ H
where Q is the flow rate (m3 day−1), L is the length (m) between any two piezometric tubes of the column, ΔH is the difference in water head (m) at a given distance L, and S is the cross-sectional area (m2) of the column.
All column experiments were performed in the downflow mode at a stable Darcy flow rate of 3.40 cm/min using a peristaltic pump. The suspension was constantly stirred to ensure a uniform distribution of particles during recharge. Water head at each location was measured every 2.00 h. Turbidity changes in column out flow were monitored using a turbidity meter (Turbidimeter 2000, Hach, Loveland, CO, USA) at 2.00 h intervals. Next, SS values were determined using a standard curve of turbidity and SSs (Figure S1). At the end of all recharge experiments, dilution and dry-weight measurements were applied to particles deposited in the packed sand of each 1.00 cm section [21]. Suspended particles retained in the porous media at each column cross section were normalized to the total number of injected suspended particles. Particle distribution along the column was represented as a retention curve. Total effluent mass deposition rate (Md) was calculated on the basis of the total input of suspended particles.

2.4. Physical Clogging Model

Physical clogging occurs when suspended particles are deposited in the pore space during AGR. The model must satisfy the following assumptions:
  • The porous medium should be homogeneous and saturated.
  • Darcy’s law governs water migration.
  • Dispersion effects are absent during the transport of suspended particles.
  • No biochemical reaction occurs to change the characteristics of porous media or suspended particles.
The attachment and detachment of suspended particles in porous media typically happen simultaneously, leading to transport and deposition. This kinetic process is governed by the following factors:
C S t = α C β C s
where α is the particle attachment coefficient (min−1), β is the particle detachment coefficient (min−1), and CS is the deposited particle mass per unit pore space (kg/m3).
Porosity decreases as the particles in the fluid are trapped and deposited in the porous medium. A linear relationship exists between porosity and particle retention. Effective porosity is expressed as follows:
n = n 0 b σ C s
where n is the porosity of the medium, b is defined as the effective volume of the deposited particles divided by the solid volume of the deposited particles, and σ is the specific deposit (the occupied volume of the deposited particles per unit mass of pore volume, m3 kg−1).
Changes to the porosity influence permeability of the medium are described by using the Kozeny–Carmen equation [22,23]:
K K 0 = n 3 1 n 2 1 n 0 2 n 0 3
The initial and boundary conditions are included in the transport deposition model of the suspended particles, as follows:
x C · v x = t n C + C s     0 x L ,   t > 0 C S t = α C β C s     t > 0 C t = 0 = 0   0 x L C s t = 0 = 0   0 x L C x = 0 = C 0     t > 0

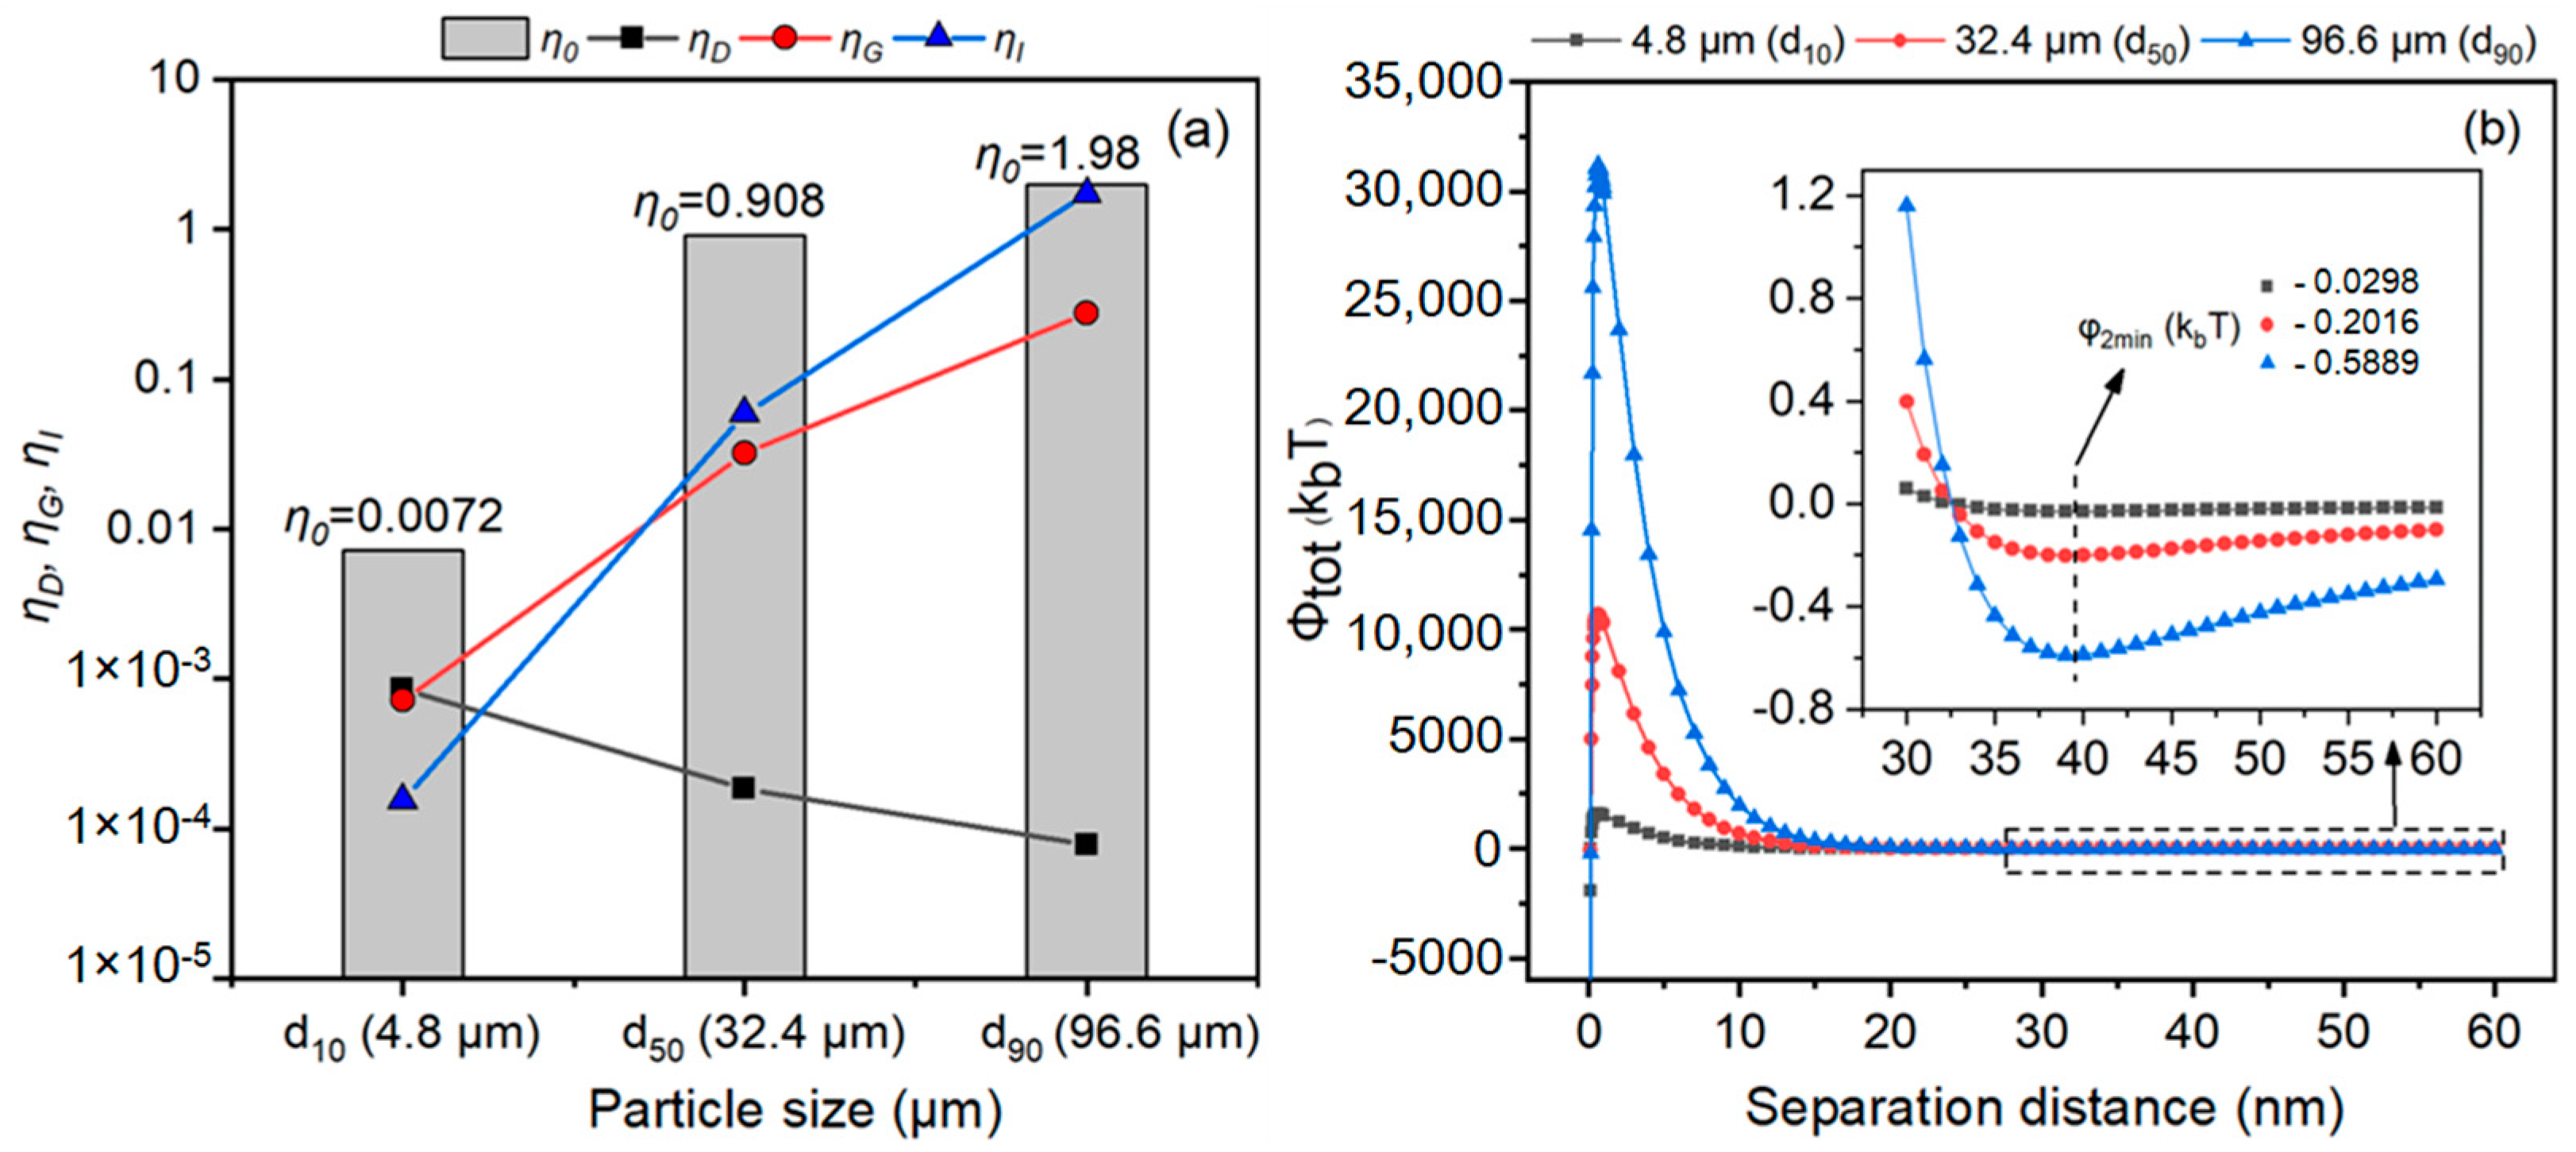
2.5. Contact Efficiency and DLVO Theory

Particle collisions were quantitatively predicted using classical filtration theory. Filtration theory states that diffusion, sedimentation, and interception are the three mechanisms governing particle collision from solutions to sand surfaces. The key formulae are [24]
η D = 2.4 A S 3 N R 0.081 N v d w 1.2 P e 0.715
η I = 0.6 A S N A 1 / 8 N R - 2.675
η G = 0.22 N R 0.24 N v d w 0.053 N G 2.11
where ηD, ηI, and ηG represent collection efficiencies under diffusion, interception, and sedimentation, respectively; AS is the porosity-dependent parameter of Happel’s model; NR is the aspect ratio; Nvdw is the van der Waals number; Pe is the Peclet number; NA is the attractive number; and NG is the gravity number. The formula for calculating the collision efficiency (η0) is as follows:
η 0 = η D + η I + η G
Classical Derjaguin–Landau–Verwey–Overbeek (DLVO) theory incorporates van der Waals force (ΦVDW) and the electric double-layer repulsion force (ΦEDL) to model particle interactions. This theory can be used to predict particle retention stemming from physicochemical factors when suspended particles and sand particles interact [25]. Formulae for ΦVDW and ΦEDL are listed in Text S1 [26].

3. Results and Discussion

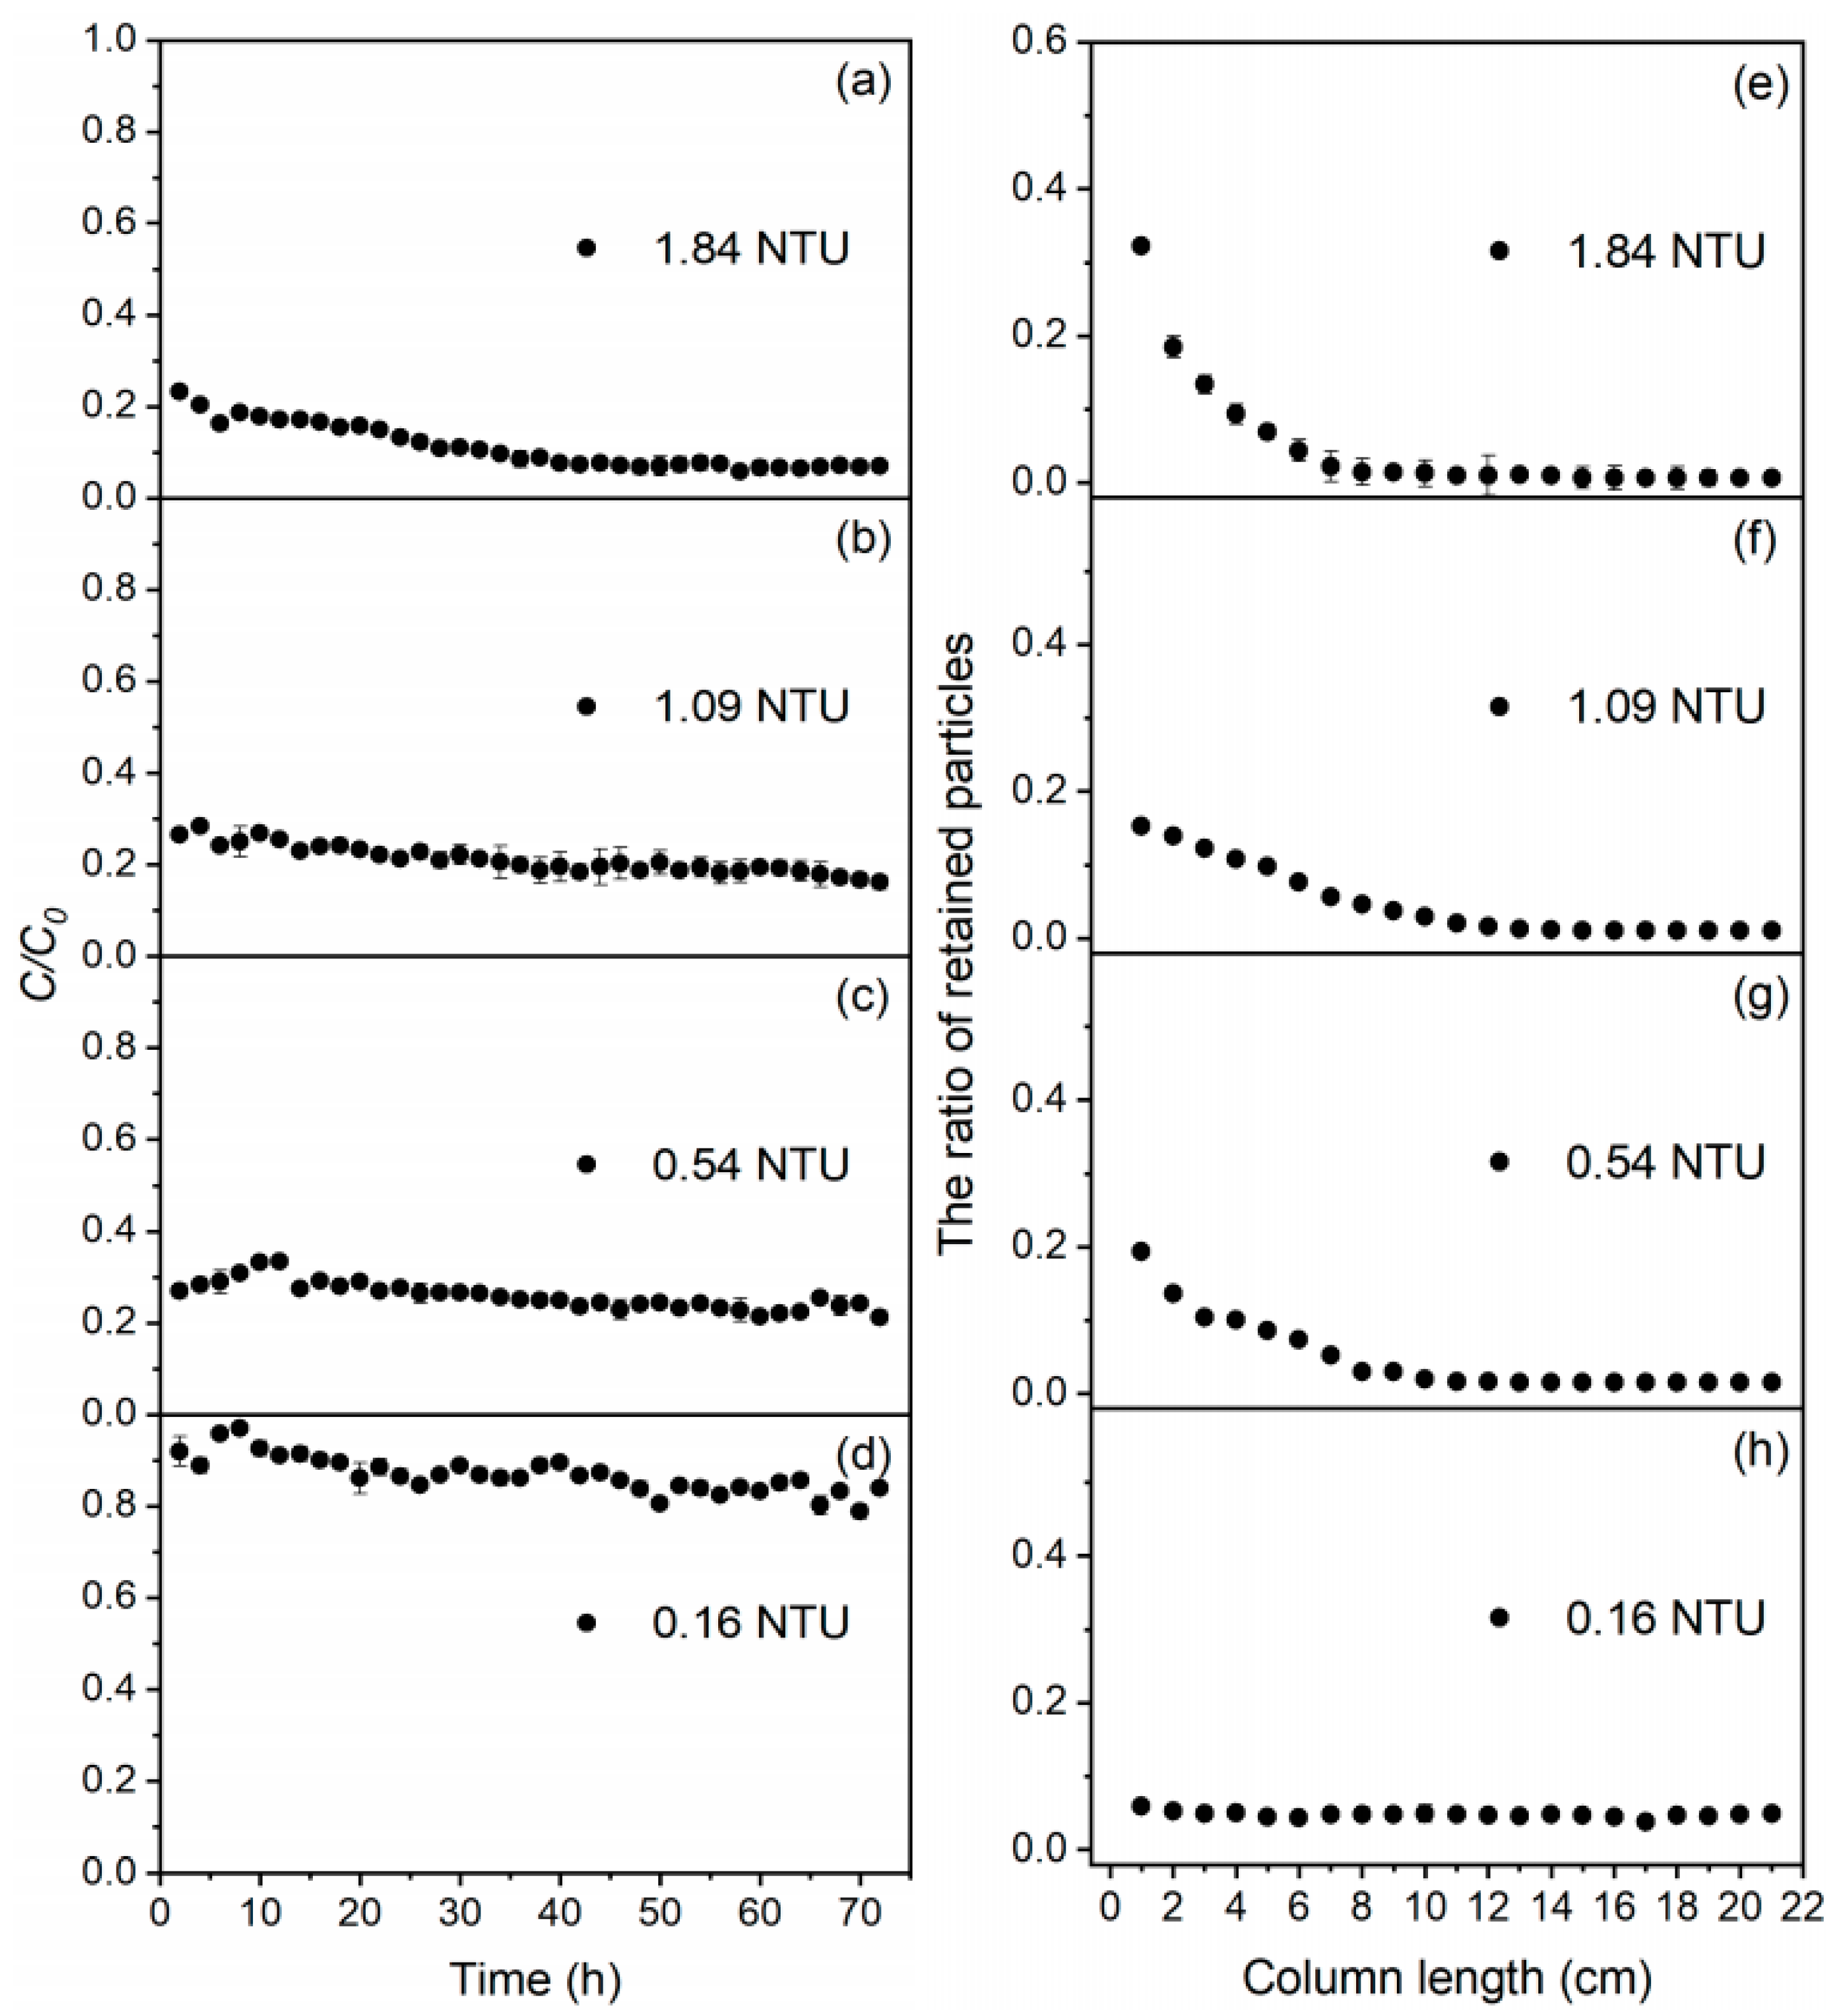
3.1. Breakthrough Curves and Particle Retention

The breakthrough curves (BTCs) of suspended particles in sand columns under different turbidity conditions are shown in Figure 3a–d, with the normalized effluent concentrations (C/C0) on the y-axis and time on the x-axis. After 2.00–10.0 h of water injection, the maximum breakthrough concentrations (C/C0max) were only 0.233 at 1.84 NTU (Figure 3a), 0.283 at 1.09 NTU (Figure 3b), and 0.334 at 0.540 NTU (Figure 3c). The lower effluent particle concentration indicated that more particles were retained in the porous medium. The BTCs of suspended particles showed that for an influent turbidity of 0.160 NTU, C/C0 remained stable at 0.800–0.950 for 72.0 h (Figure 3d). Furthermore, the C/C0max decreased with the increasing turbidity of the suspension, which shows that there were improvements in removal efficiency.
After recharge experiments, the particle retention profile per centimeter of porous media showed clear particle deposition that decreased with increasing infiltration depth (Figure 3e–h). Thus, particle retention in the sand column gradually decreased effluent turbidity. Table 1 summarizes the mass recovery in the effluent (Meff), the deposition in the column (Md), and the injected mass (Min = Meff + Md) for our experiments. The results showed that retained particles were uniformly distributed in the column under a turbidity of 0.160 NTU. Packing media contributed only slightly to removing suspended particles, with a total retention ratio of 22.5%. Nonuniform retention increased when the turbidity of the injected water increased, and suspended particles were removed mainly in the first layer (0.00–3.00 cm) of the column. When turbidity was 0.540, 1.09, and 1.84 NTU, the retention ratios of the first layer reached 33.8%, 30.3%, and 55.0%, respectively, while the total retention ratios reached 86.2%, 73.2%, and 85.7%, respectively. Thus, suspended particles were retained primarily in the first layer, and deposition decreased with increasing depth. Post experiment clogging at the entrance of the porous medium is shown in Figure S2. The retention of particles influences the clogging of porous media, so it is necessary to discuss the mechanisms underlying the transport and deposition processes of particles.

3.2. Particle Transport and Deposition

Suspended particles in porous media can be subjected to either surface-cake filtration or deep filtration. Permeability in surface-cake filtration decreases as larger suspended particles become trapped at the column inlet [27]. Deep filtration occurs when suspended particles enter into porous media and are retained within [28]. The type of filtration that occurs depends on the particle diameter ratio between the suspension and the porous medium (dp/dg). Herzig et al. reported that surface-cake filtration occurs when dp/dg is greater than 0.150 [28], while Huston and Fox found the appropriate conditions to be when dp/dg is above 1/6 [29]. The average particle size of our porous media was 0.944 mm, indicating that surface-cake filtration should occur when the diameter of the suspended particles is higher than 141 μm. However, over 90.0% of the particles in this study were around 96.6 μm, suggesting that deep filtration was the main form of particle removal. During internal clogging, collision and adhesion interact to remove suspended particles from porous media. During internal clogging, particles are transported from the pores to the vicinity of the collector. Thereafter, the suspended particles of the solution are removed by collision and attachment with porous media [19]. To investigate clogging mechanisms, we combined the transport model with the DLVO theory to calculate η0 and the attachment efficiency between the suspended particles and the porous media.

3.2.1. Calculation of Contact Efficiency

After calculating the contact efficiency as a function of the size distribution (d10, d50, d90), we can see that the main factors controlling particle–sand contact are sedimentation and interception (Figure 4a). While ηI and ηG significantly increased with the increasing particle size, ηD showed the reverse trend. Using Equation (9), we calculated η0 between the suspended and collected particles with size distributions of d10, d50, and d90 (0.007, 0.908, and 1.98, respectively). A previous report found that graphene oxide was retained by collected particles in a Na-Ca electrolyte background, and η0 was calculated to be less than 0.050 [30]. In contrast, Rahman et al. reported an η0 value of less than 0.019 when aluminum oxide nanoparticles were retained in saturated sand at different ionic strengths (0.00–100 mM) [31]. Scott et al. showed that straining is an important mechanism for particles with a particle size of 3.20 μm to be retained in a porous medium with a median diameter of 0.700 mm in the process of studying the physical factors affecting particle transport, where η0 is less than 0.029 [32]. The collision efficiency of particles in this study is significantly higher than that in the above study, and we calculated that the particle–sand contact efficiency is greater than 0.050 when the size distributions are 32.4 μm and 96.6 μm. Therefore, this study obtained higher contact efficiencies, and we can infer that the particles easily collided with sand grains during percolation.

3.2.2. Effect of Attachment Efficiency

To verify whether sand grains can capture suspended particles, we evaluated the effect of particle–sand attachment efficiency using DLVO theory to calculate the secondary minimum (φmin). Both the suspended particles and the quartz sand were negatively charged, and our experiments were performed under conditions unfavorable for attachment. After calculating the energy distribution of DLVO interactions with the separation distance at different size distributions (d10, d50, d90), we observed that the depth of φmin increases as the size increases (Figure 4). Because the particle deposition increases as the depth of φmin increases [25], the retention also increases as the particle size increases. As expected, at an ionic strength of 10.6 mM, the depth of φmin was −0.029 kBT at 4.80 μm, −0.202 kBT at 32.4 μm, and −0.589 kBT at 96.6 μm, with corresponding separation distances at around 39.0 nm.
Transport experiments using a Na-Ca electrolyte system demonstrated that graphene oxide was retained by collected particles, and φmin was less than −0.030 kBT, which is lower than the depth of φmin (−0.589 kBT) in this study [30]. Additionally, a transport experiment performed under unfavorable attachment conditions showed the adsorption of sand particles by saturated sand, and φmin calculated with DLVO theory was −10.6 kBT, which is an order of magnitude higher than the depth of φmin in this study [10]. Prior research also demonstrated that different types of suspended particles clogged aquifers to various degrees; for example, organic particles were adsorbed by porous media during transport, and their φmin was −2.69 kBT [19]. Therefore, the depth of φmin in our study falls within the range conducive to the retention of particles in saturated porous media, indicating that the particles used were easily captured by the column during contact. In particular, the larger particles were more easily adsorbed.

3.3. Variations in Hydraulic Conductivity

The variation in K/K0 and Ki/K0 over time in the experiment of different turbidity is shown in Figure 5. An analysis of K/K0 variation under different turbidity conditions revealed that an SE with a turbidity of 1.84 NTU significantly lowered the K/K0 of the porous media and decreased the initial permeability by 83.6% (Figure 5a). When the influent turbidity was 1.09, 0.540, and 0.160 NTU, K/K0 decreased by 17.6%, 13.2%, and 1.70%, respectively. The permeability more rapidly decreased when the influent turbidity was higher. Because most of the suspended particles were retained in the first layer, the K1/K0 of this layer decreased the fastest throughout the experiment. When the influent turbidity was 1.84, 1.09, 0.540, and 0.160 NTU, K1/K0 decreased by 96.1%, 33.3%, 25.0%, and 6.20%, respectively (Figure 5b–e). Our results showed that the K/K0 of porous media decreased by less than 1.70% when the turbidity was 0.160 NTU. Thus, the suspension with this turbidity was the only one that did not cause clogging.

3.4. Comparison of Simulation and Experimental Results

We observed significant agreement between the modeled and experimental results for K/K0 (Figure 5). The coefficients of determination (R2) between modeled and experimental values for K/K0 were all greater than 0.900. The physical clogging model predicted that Ki/K0 would more rapidly decrease as the influent turbidity increased, especially in the first layer. When the influent turbidity was 0.160 NTU, the simulated K1/K0 remained almost unchanged. The model predictions agreed very well with the experimental results: when the influent turbidity was 1.84, 1.09, and 0.540 NTU, the K1/K0 changed dramatically over time and was controlled mainly by the number of particles retained in the first layer. The model and experiments both indicated that 0.160 NTU was the threshold for preventing clogging during AGR. A further simulation of AGR with an influent turbidity of 0.160 NTU verified that this threshold does not cause clogging even after continuous infiltration for 100 days (Figure S3).
Our results showed that the SE did not cause clogging when the turbidity was 0.160 NTU. However, this threshold is close to the current standards for drinking water, and maintaining this level for AGR is quite strict and costly. Therefore, in combination with drinking water standards in various regions/countries, an appropriate critical threshold for preventing clogging caused by SEs was obtained. Worldwide, SS, and NTU thresholds for potable water vary depending on local regulations. For example, Washington state stipulates that water used in AGR should be pretreated using oxidation, flocculation, filtration, and disinfection to achieve suitable quality; drinking water turbidity should be less than 0.500 NTU, and SS should be less than 5.00 mg L−1 [20]. In Spain, the turbidity threshold for drinking water is 1.00 NTU [33]. In China, turbidity thresholds for drinking water standards (GB 5749-2006) are 1.00 NTU. Overall, the lowest turbidity threshold for drinking water did not exceed 0.500 NTU. Therefore, to prevent clogging during AGR, we recommend that the turbidity threshold of SE from WWTPs not exceed 0.500 NTU.

4. Conclusions

Through laboratory experiments, DLVO theory, contact-efficiency calculations, and a physical clogging model, we obtained the critical threshold for preventing SE-induced clogging during AGR. Our findings revealed that SE with a turbidity of 1.84 ± 0.060 NTU caused serious clogging, as did diluted SE with turbidities of 0.540 ± 0.050 and 1.09 ± 0.050 NTU. However, filtered SE with a turbidity of 0.160 NTU did not cause clogging. As suspended particles are transported, they likely collide with the sand matrix and are retained. Therefore, the turbidity threshold to prevent clogging should not exceed 0.500 NTU. Overall, this study provides a basis for setting water turbidity thresholds to limit physical clogging during AGR when using WWTP-derived SE. However, the nature of the aquifer in a recharge project is complex, usually mixed with various types of sand and soil. The clogging risk of simulated aquifers containing different particle-size distributions, types, and packing densities still needs further study.

Supplementary Materials

The following supporting information can be downloaded at https://www.mdpi.com/article/10.3390/w15030594/s1, Figure S1: Linear calibration curves of NTU and SS for suspended particles; Figure S2: The pictures of the surface of porous medium at the end of the experiments; Figure S3: Clogging of infiltration safety threshold recharge water at a large-scale site; Table S1: Threshold values of suspended solid concentration and turbidity for reclaimed-water-quality standards in different regions; Table S2: The main water-quality parameters of secondary wastewater; Text S1: Formulae for ΦVDW and ΦEDL.

Author Contributions

Conceptualization, W.F. and D.X.; methodology, S.L. and Y.W.; validation, S.L., S.W. and S.Z.; writing—original draft, S.L.; writing—review and editing, W.F. and D.X. All authors have read and agreed to the published version of the manuscript.

Funding

This work was funded by the National Natural Science Foundation of China (no. 51978135 and 52270089). It was also supported by the Scientific and Technological Development Plan Project of Changchun City (no. 21ZY30) and Jilin Province (no. 20200201042JC).

Data Availability Statement

Not applicable.

Conflicts of Interest

The authors declare no conflict of interest.

References

  1. Bai, B.; Long, F.; Rao, D.; Xu, T. The effect of temperature on the seepage transport of suspended particles in a porous medium. Hydrol. Process. 2017, 31, 382–393. [Google Scholar] [CrossRef]
  2. Liu, S.; Persson, K.M. Situations of water reuse in China. Water Policy 2013, 15, 705–727. [Google Scholar] [CrossRef]
  3. Yuan, J.; Van Dyke, M.I.; Huck, P.M. Water reuse through managed aquifer recharge (MAR): Assessment of regulations/guidelines and case studies. Water Qual. Res. J. Can. 2016, 51, 357–376. [Google Scholar] [CrossRef]
  4. Sultana, S.; Ahmed, K.M. Assessing risk of clogging in community scale managed aquifer recharge sites for drinking water in the coastal plain of south-west Bangladesh. Bangladesh J. Sci. Res. 2016, 27, 75–86. [Google Scholar] [CrossRef]
  5. Ye, X.Y.; Cui, R.J.; Du, X.N.A.; Ma, S.J.; Zhao, J.T.; Lu, Y.; Wan, Y.Y. Mechanism of Suspended Kaolinite Particle Clogging in Porous Media During Managed Aquifer Recharge. Groundwater 2019, 57, 764–771. [Google Scholar] [CrossRef] [PubMed]
  6. Dillon, P.; Pavelic, P.; Massmann, G.; Barry, K.; Correll, R. Enhancement of the membrane filtration index (MR) method for determining the clogging potential of turbid urban stormwater and reclaimed water used for aquifer storage and recovery. Desalination 2001, 140, 153–165. [Google Scholar] [CrossRef]
  7. Dillon, P.J.; Hickinbotham, M.R.; Pavelic, P. Review of International Experience in Injecting Water into Aquifers for Storage and Reuse. In Water Down under 94: Groundwater Papers; Institution of Engineers: Barton, Australia, 1994. [Google Scholar]
  8. Rinck-Pfeiffer, S.; Ragusa, S.; Sztajnbok, P.; Vandevelde, T. Interrelationships between biological, chemical, and physical processes as an analog to clogging in aquifer storage and recovery (ASR) wells. Water Res. 2000, 34, 2110–2118. [Google Scholar] [CrossRef]
  9. Ahfir, N.-D.; Benamar, A.; Alem, A.; Wang, H. Influence of Internal Structure and Medium Length on Transport and Deposition of Suspended Particles: A Laboratory Study. Transp. Porous Media 2009, 76, 289–307. [Google Scholar] [CrossRef]
  10. Mesticou, Z.; Kacem, M.; Dubujet, P. Influence of Ionic Strength and Flow Rate on Silt Particle Deposition and Release in Saturated Porous Medium: Experiment and Modeling. Transp. Porous Media 2014, 103, 1–24. [Google Scholar] [CrossRef]
  11. Liu, Q.; Cui, X.; Zhang, C.; Zhan, T. Effects of particle size on characteristics of transportation and deposition of suspended particles in porous media. Chin. J. Geotech. Eng. 2014, 36, 1777–1783. [Google Scholar] [CrossRef]
  12. Alem, A.; Ahfir, N.D.; Elkawafi, A.; Wang, H.Q. Hydraulic Operating Conditions and Particle Concentration Effects on Physical Clogging of a Porous Medium. Transp. Porous Media 2015, 106, 303–321. [Google Scholar] [CrossRef]
  13. Du, X.; Song, Y.; Ye, X.; Luo, R. Colloid clogging of saturated porous media under varying ionic strength and roughness during managed aquifer recharge. J. Water Reuse Desalination 2019, 9, 225–231. [Google Scholar] [CrossRef]
  14. Porubcan, A.A.; Xu, S. Colloid straining within saturated heterogeneous porous media. Water Res. 2011, 45, 1796–1806. [Google Scholar] [CrossRef]
  15. Fan, W.; Yang, X.; Wang, Y.; Huo, M. Loopholes in the current reclaimed water quality standards for clogging control during aquifer storage and recovery in China. Water Cycle 2020, 1, 13–18. [Google Scholar] [CrossRef]
  16. US EPA. Guidelines for Water Reuse; US Environmental Protection Agency: Washington, DC, USA, 2004.
  17. Okubo, T.; Matsumoto, J. Biological clogging of sand and changes of organic constituents during artificial recharge. Water Res. 1983, 17, 813–821. [Google Scholar] [CrossRef]
  18. Pavelic, P.; Dillon, P.J.; Barry, K.E.; Vanderzalm, J.L.; Correll, R.L.; Rinck-Pfeiffer, S.M. Water quality effects on clogging rates during reclaimed water ASR in a carbonate aquifer. J. Hydrol. 2007, 334, 1–16. [Google Scholar] [CrossRef]
  19. Wang, Y.; Huo, M.X.; Li, Q.; Fan, W.; Yang, J.K.; Cui, X.C. Comparison of clogging induced by organic and inorganic suspended particles in a porous medium: Implications for choosing physical clogging indicators. J. Soils Sediments 2018, 18, 2980–2994. [Google Scholar] [CrossRef]
  20. Wu, J.; Jiang, X.Y.; Wheatley, A. Characterizing activated sludge process effluent by particle size distribution, respirometry and modelling. Desalination 2009, 249, 969–975. [Google Scholar] [CrossRef]
  21. Xu, S.P.; Gao, B.; Saiers, J.E. Straining of colloidal particles in saturated porous media. Water Resour. Res. 2006, 42. [Google Scholar] [CrossRef]
  22. Krauss, E.D.; Mays, D.C. Modification of the Kozeny-Carman Equation to Quantify Formation Damage by Fines in Clean, Unconsolidated Porous Media. SPE Reserv. Eval. Eng. 2014, 17, 466–472. [Google Scholar] [CrossRef] [Green Version]
  23. Lu, Y.; Du, X.Q.; Chi, B.M.; Yang, Y.S.; Fan, W. Numerical modelling of physical clogging during groundwater artificial recharge. In Proceedings of the 7th International Conference on Calibration and Reliability in Groundwater Modeling, Wuhan, China, 20–23 September 2009; pp. 121–126. [Google Scholar]
  24. Tufenkji, N.; Elimelech, M. Correlation equation for predicting single-collector efficiency in physicochemical filtration in saturated porous media. Environ. Sci. Technol. 2004, 38, 529–536. [Google Scholar] [CrossRef]
  25. Redman, J.A.; Walker, S.L.; Elimelech, M. Bacterial adhesion and transport in porous media: Role of the secondary energy minimum. Environ. Sci. Technol. 2004, 38, 1777–1785. [Google Scholar] [CrossRef]
  26. Mesticou, Z.; Kacem, M.; Dubujet, P. Coupling Effects of Flow Velocity and Ionic Strength on the Clogging of a Saturated Porous Medium. Transp. Porous Media 2016, 112, 265–282. [Google Scholar] [CrossRef]
  27. McGechan, M.B.; Lewis, D.R. Transport of particulate and colloid-sorbed contaminants through soil, part 1: General principles. Biosyst. Eng. 2002, 83, 255–273. [Google Scholar] [CrossRef]
  28. Herzig, J.P.; Leclerc, D.M.; Golf, P.L. Flow of suspensions through porous media—Application to deep filtration. Ind. Eng. Chem. 1970, 62, 8–35. [Google Scholar] [CrossRef]
  29. Huston, D.L.; Fox, J.F. Clogging of Fine Sediment within Gravel Substrates: Dimensional Analysis and Macroanalysis of Experiments in Hydraulic Flumes. J. Hydraul. Eng. 2015, 141, 04015015. [Google Scholar] [CrossRef]
  30. Fan, W.; Jiang, X.H.; Yang, W.; Geng, Z.; Huo, M.X.; Liu, Z.M.; Zhou, H. Transport of graphene oxide in saturated porous media: Effect of cation composition in mixed Na-Ca electrolyte systems. Sci. Total Environ. 2015, 511, 509–515. [Google Scholar] [CrossRef] [PubMed]
  31. Rahman, T.; George, J.; Shipley, H.J. Transport of aluminum oxide nanoparticles in saturated sand: Effects of ionic strength, flow rate, and nanoparticle concentration. Sci. Total Environ. 2013, 463, 565–571. [Google Scholar] [CrossRef]
  32. Bradford, S.A.; Yates, S.R.; Bettahar, M.; Simunek, J. Physical factors affecting the transport and fate of colloids in saturated porous media. Water Resour. Res. 2002, 38, 63-1-63-12. [Google Scholar] [CrossRef]
  33. Camprovin, P.; Hernandez, M.; Fernandez, S.; Martin-Alonso, J.; Galofre, B.; Mesa, J. Evaluation of Clogging during Sand-Filtered Surface Water Injection for Aquifer Storage and Recovery (ASR): Pilot Experiment in the Llobregat Delta (Barcelona, Spain). Water 2017, 9, 263. [Google Scholar] [CrossRef] [Green Version]
Figure 1. (a) Scanning electron microscopy (SEM) equipped with energy-dispersive X-ray (EDX) spectra of quartz sand. (b) SEM micrograph and EDX spectrum of suspended particles in the SE. (c) Size distribution of sand grains. (d) Size distribution of suspended particles in the SE.
Water 15 00594 g001
Figure 2. Schematic of setup for column experiments.
Water 15 00594 g002
Figure 3. Breakthrough curves (ad) and retained particle ratios (eh) for four sets of experiments. C/C0: normalized effluent concentration.
Water 15 00594 g003
Figure 4. Change in contact efficiencies with size distributions of d10, d50, and d9 (a); change represented as free energy and second energy minimum on the surface of suspended particles and sand (b).
Water 15 00594 g004
Figure 5. Experimental and simulated values of K/K0 (a) and Ki/K0 (i = 1, 2, 3, 4, 5) (be) for four sets of experiments over time.
Water 15 00594 g005
Table 1. Spatial mass distribution of differently sized particles in the columns (or mass balances), including mass percentages retrieved in the effluent (Meff), deposition in each of the five column sections as a whole (Md), and injection mass (Min = Meff + Md).
SuspensionMass Deposited in Each Section (%)Md (%)Meff (%)Min (%)
12345
1.84 NTU55.020.94.963.171.6785.711.196.8
1.09 NTU30.328.38.423.922.2673.220.894.0
0.540 NTU33.830.59.797.654.5386.321.3108.0
0.160 NTU3.635.275.325.043.2222.582.3105.0
Disclaimer/Publisher’s Note: The statements, opinions and data contained in all publications are solely those of the individual author(s) and contributor(s) and not of MDPI and/or the editor(s). MDPI and/or the editor(s) disclaim responsibility for any injury to people or property resulting from any ideas, methods, instructions or products referred to in the content.

