
Quality and Health Risk Assessment of Groundwater for Drinking and Irrigation Purpose in Semi-Arid Region of India Using Entropy Water Quality and Statistical Techniques
 ,
,  and
and
Abstract
:1. Introduction
2. Materials and Methods
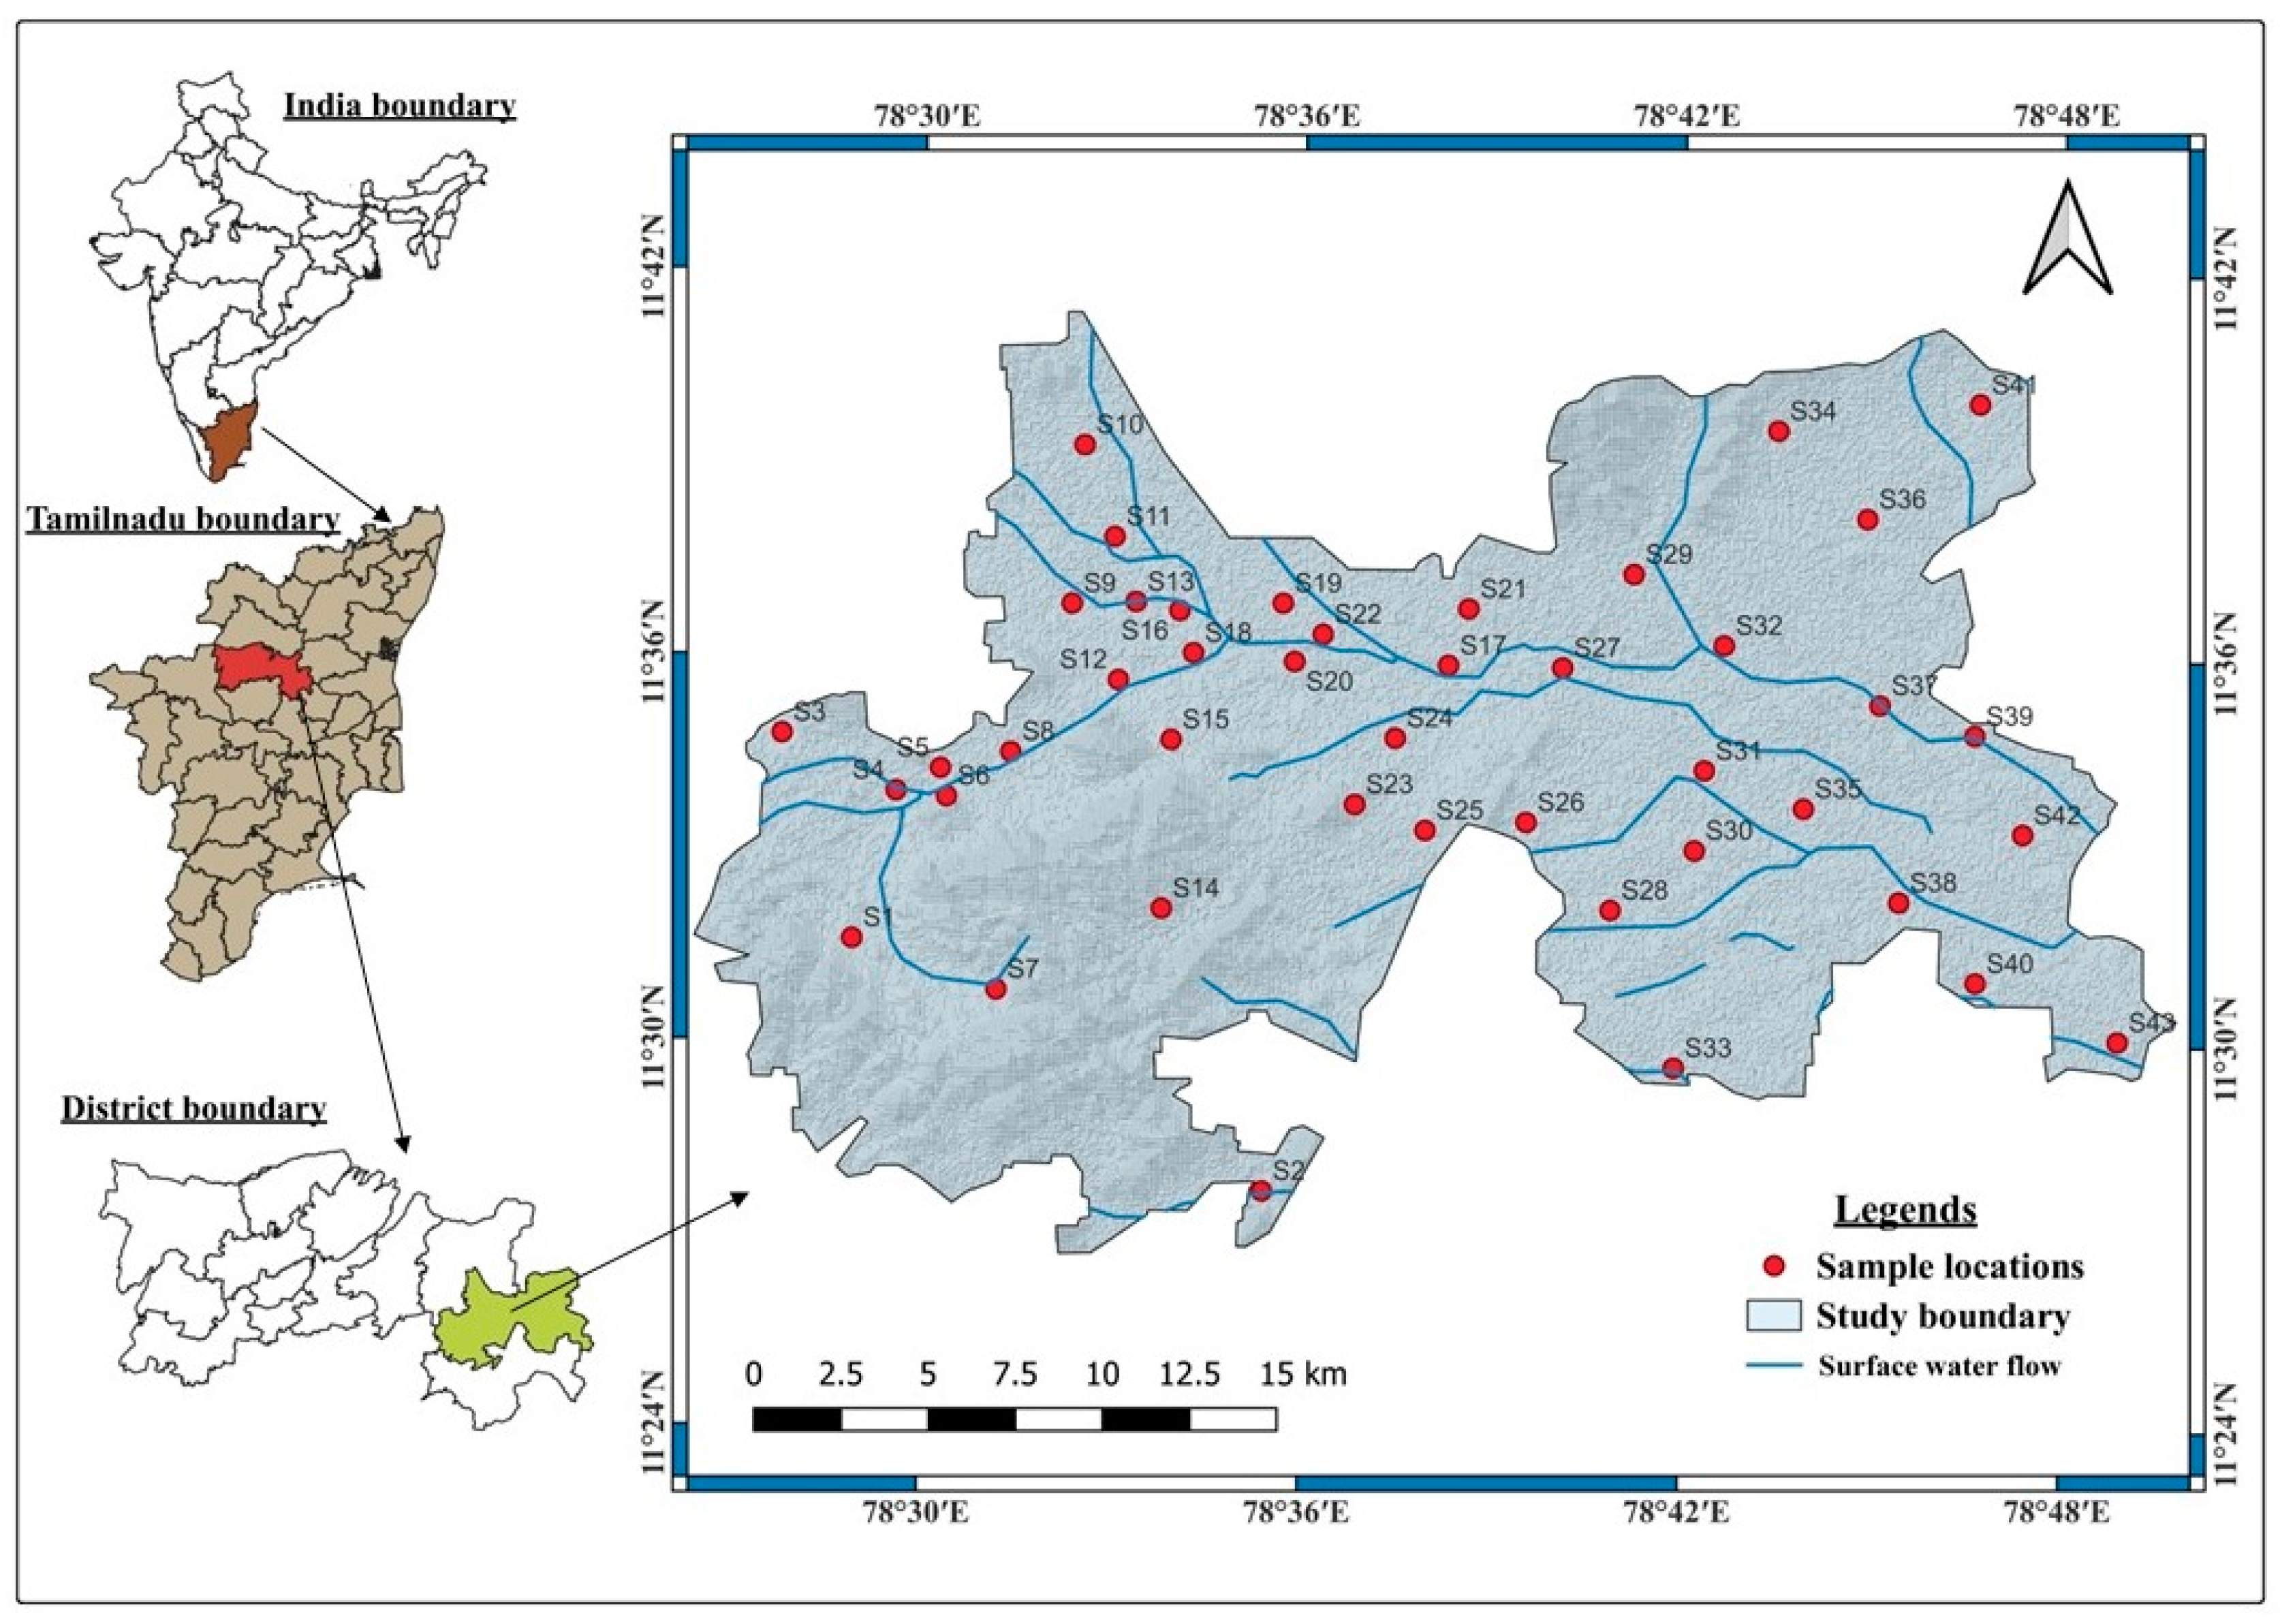
2.1. Study Area Description
2.2. Geology and Hydrology
2.3. Methods
2.3.1. Sample Collection and Analysis
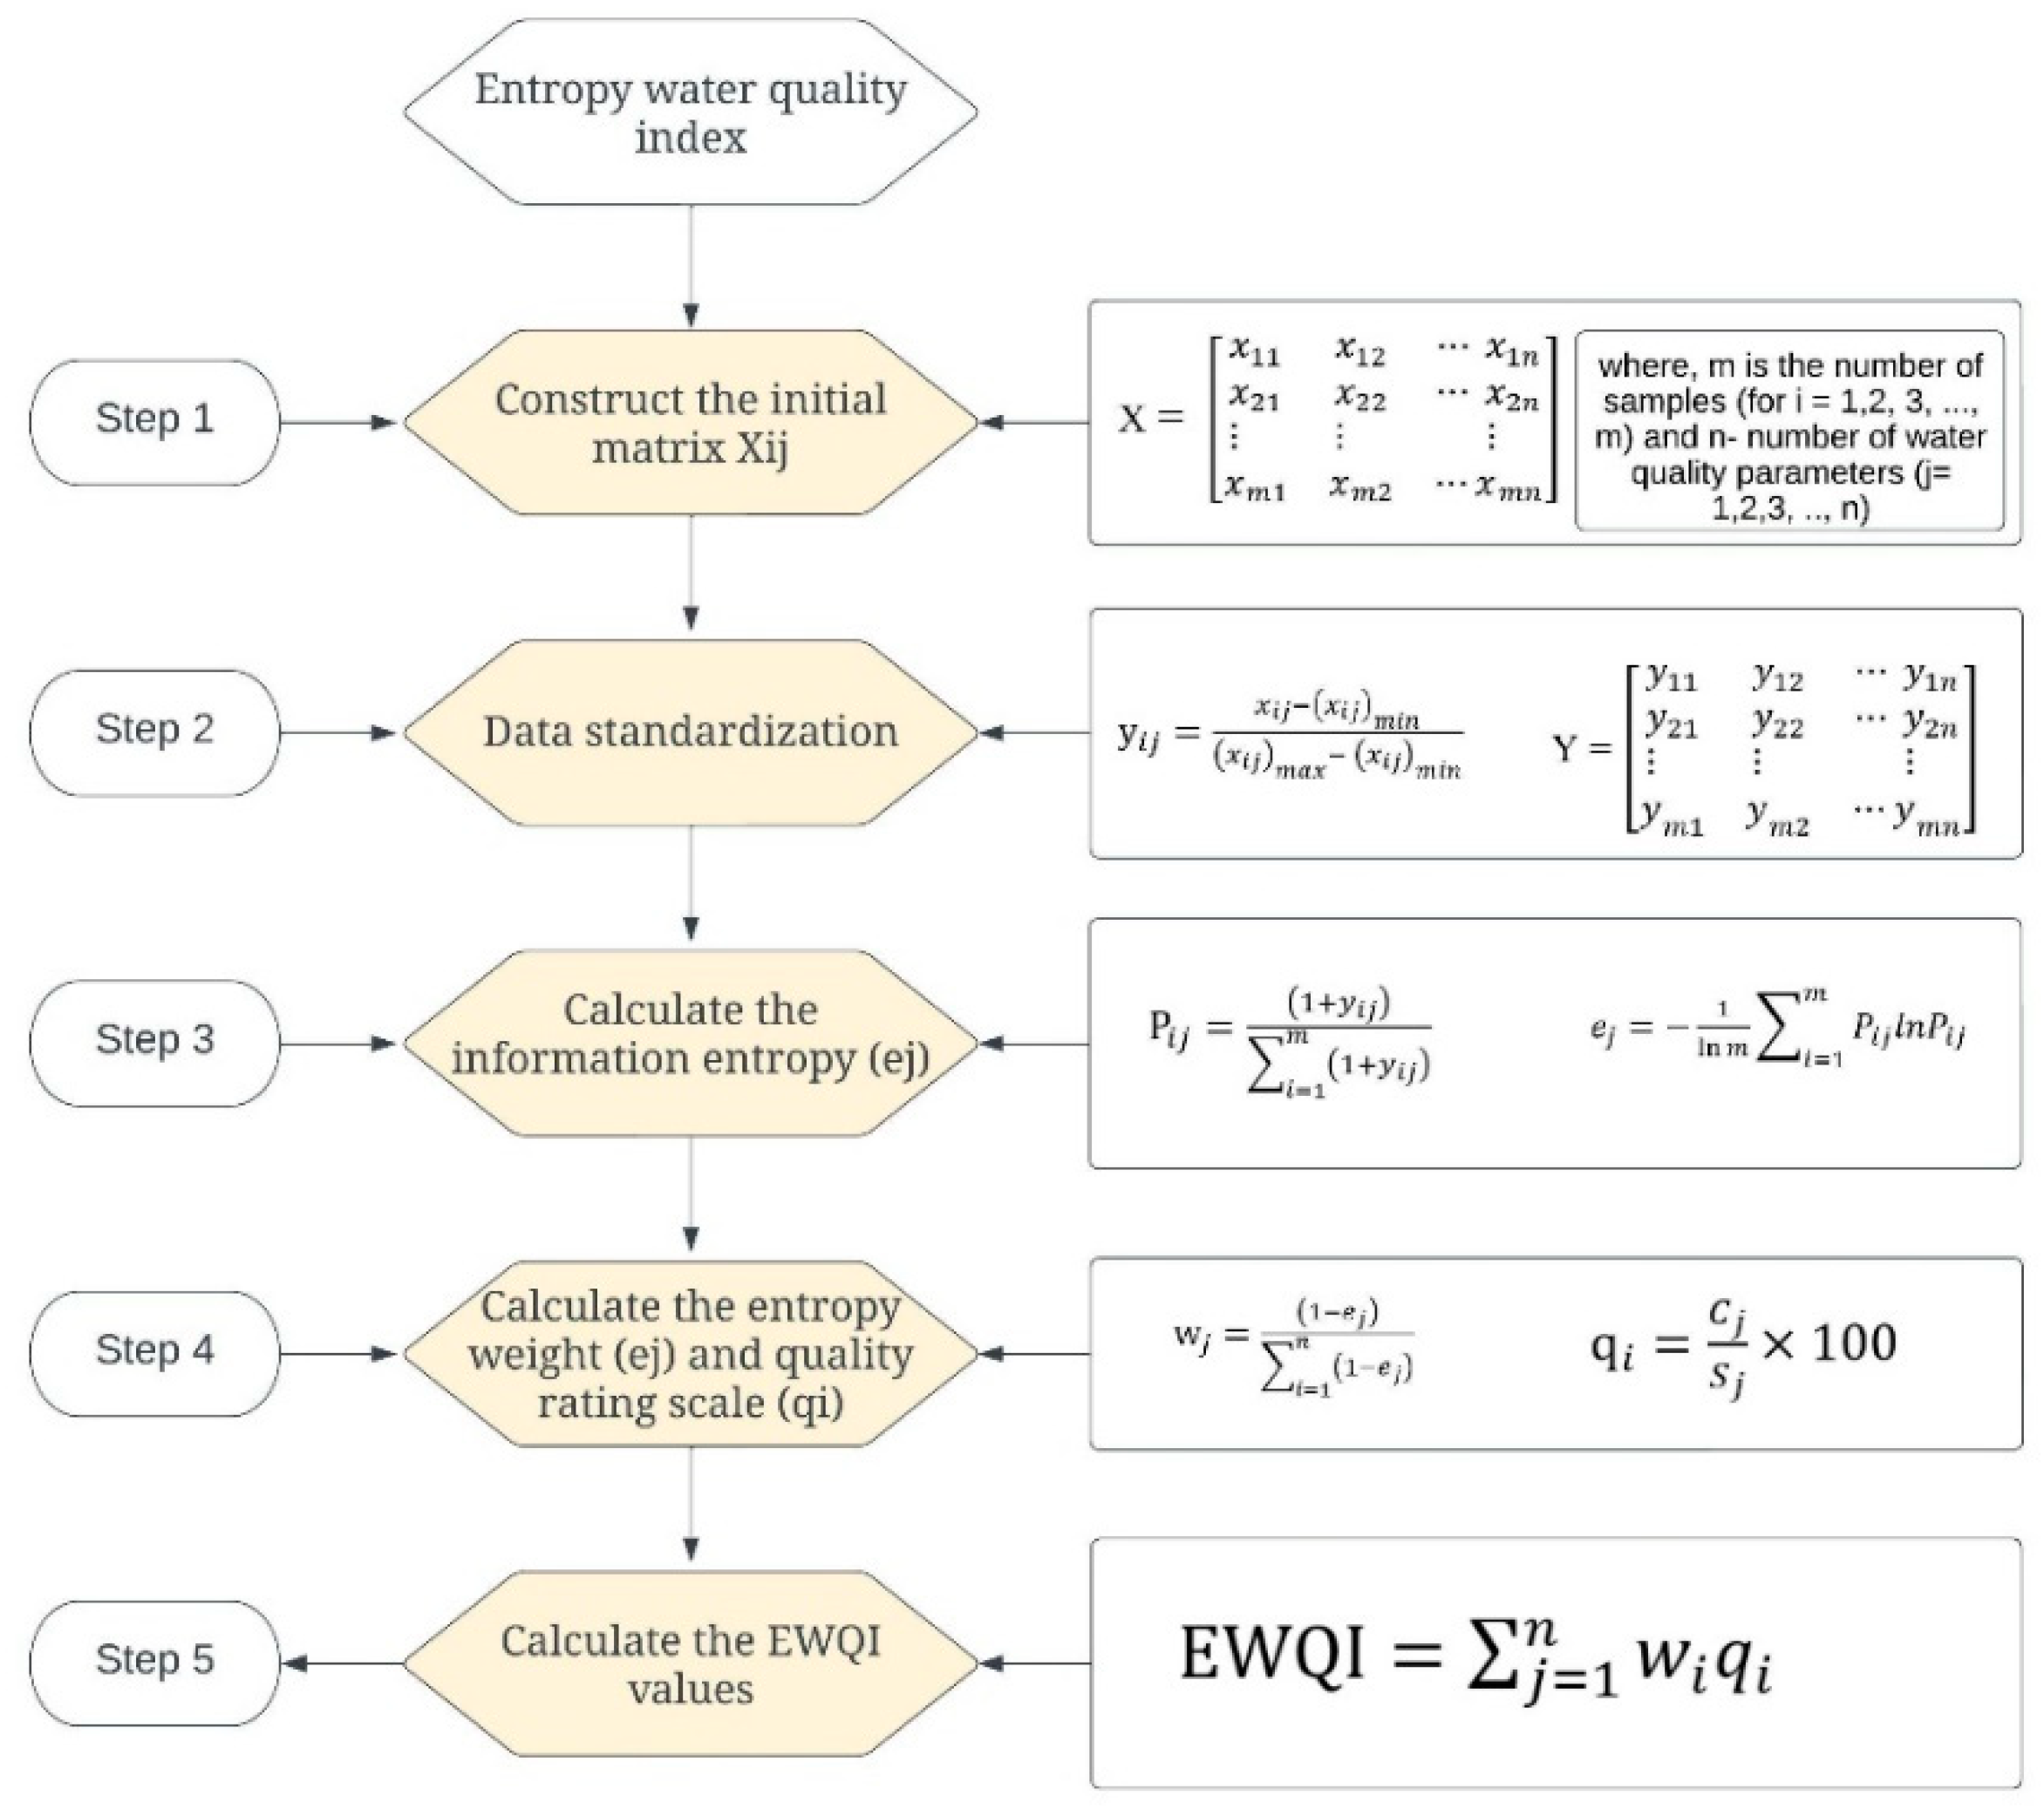
2.3.2. Entropy Water Quality Index
2.3.3. Nitrate Pollution Index
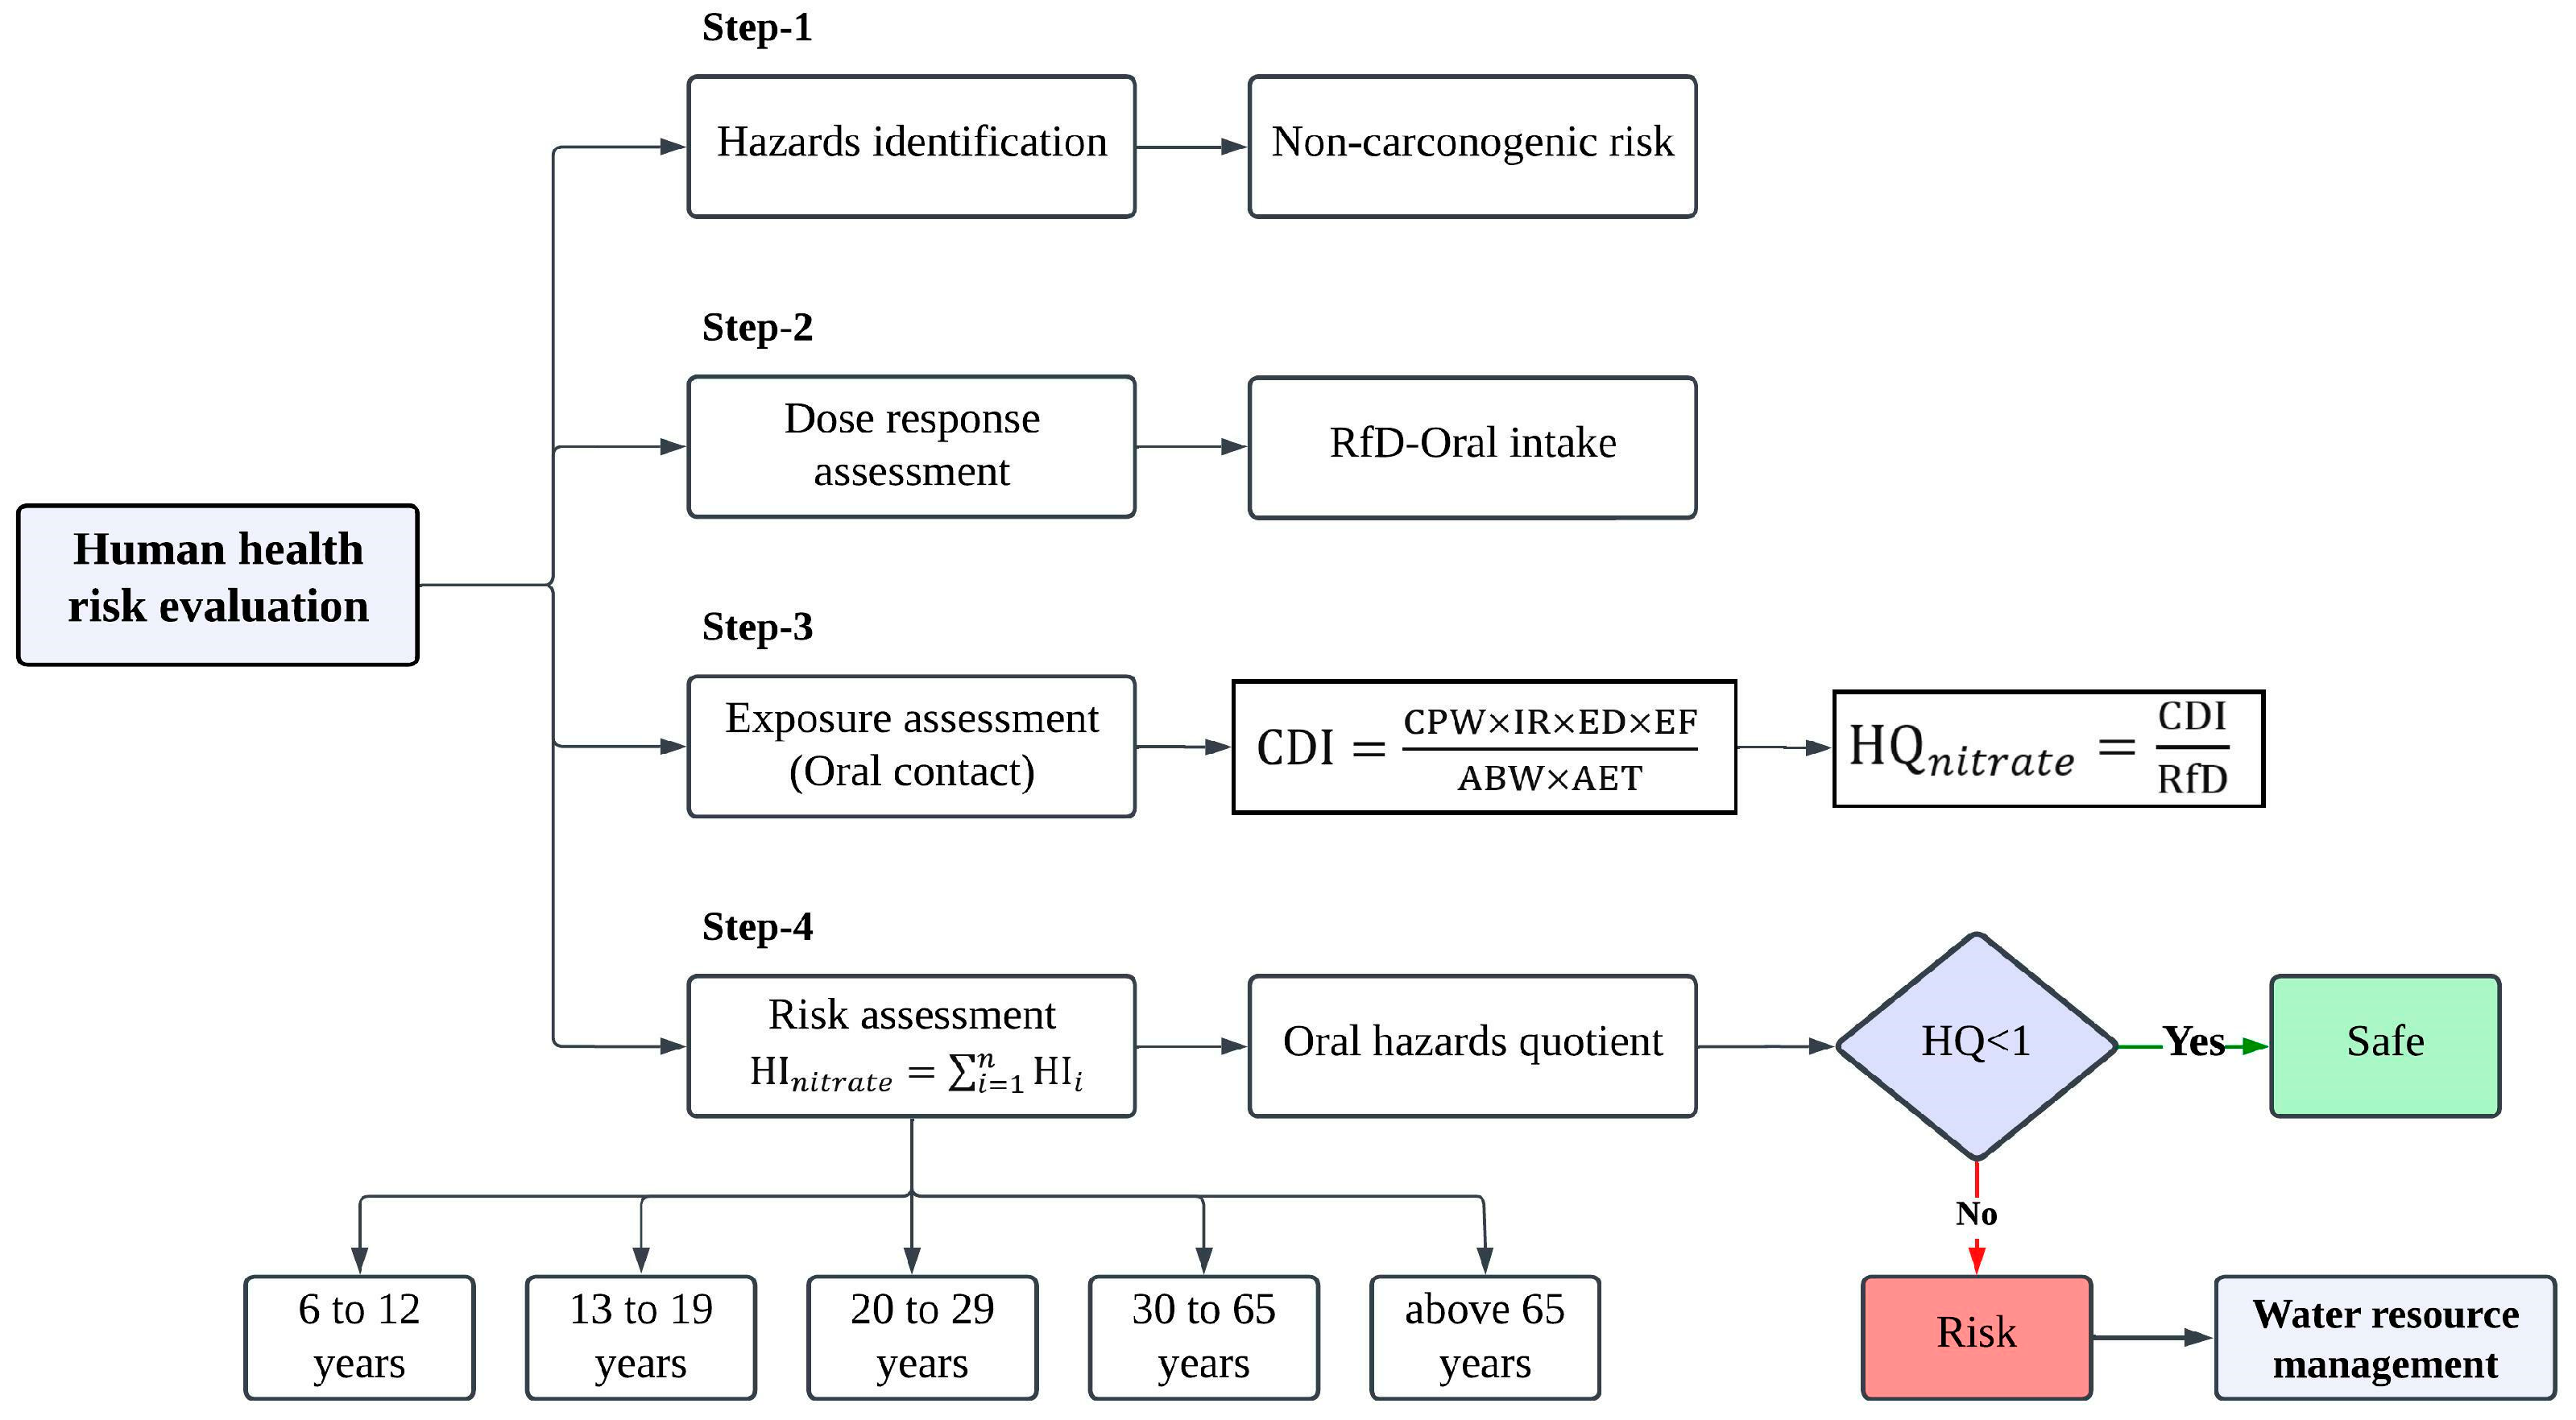
2.3.4. Human Health Risk Evaluation (HHRE)
2.3.5. Irrigation Indices
2.3.6. Principal Component Analysis (PCA)
2.3.7. Identification of Contaminant Sources
3. Results and Discussion
3.1. Hydrochemical Composition of Groundwater
3.2. EWQI
3.3. NPI
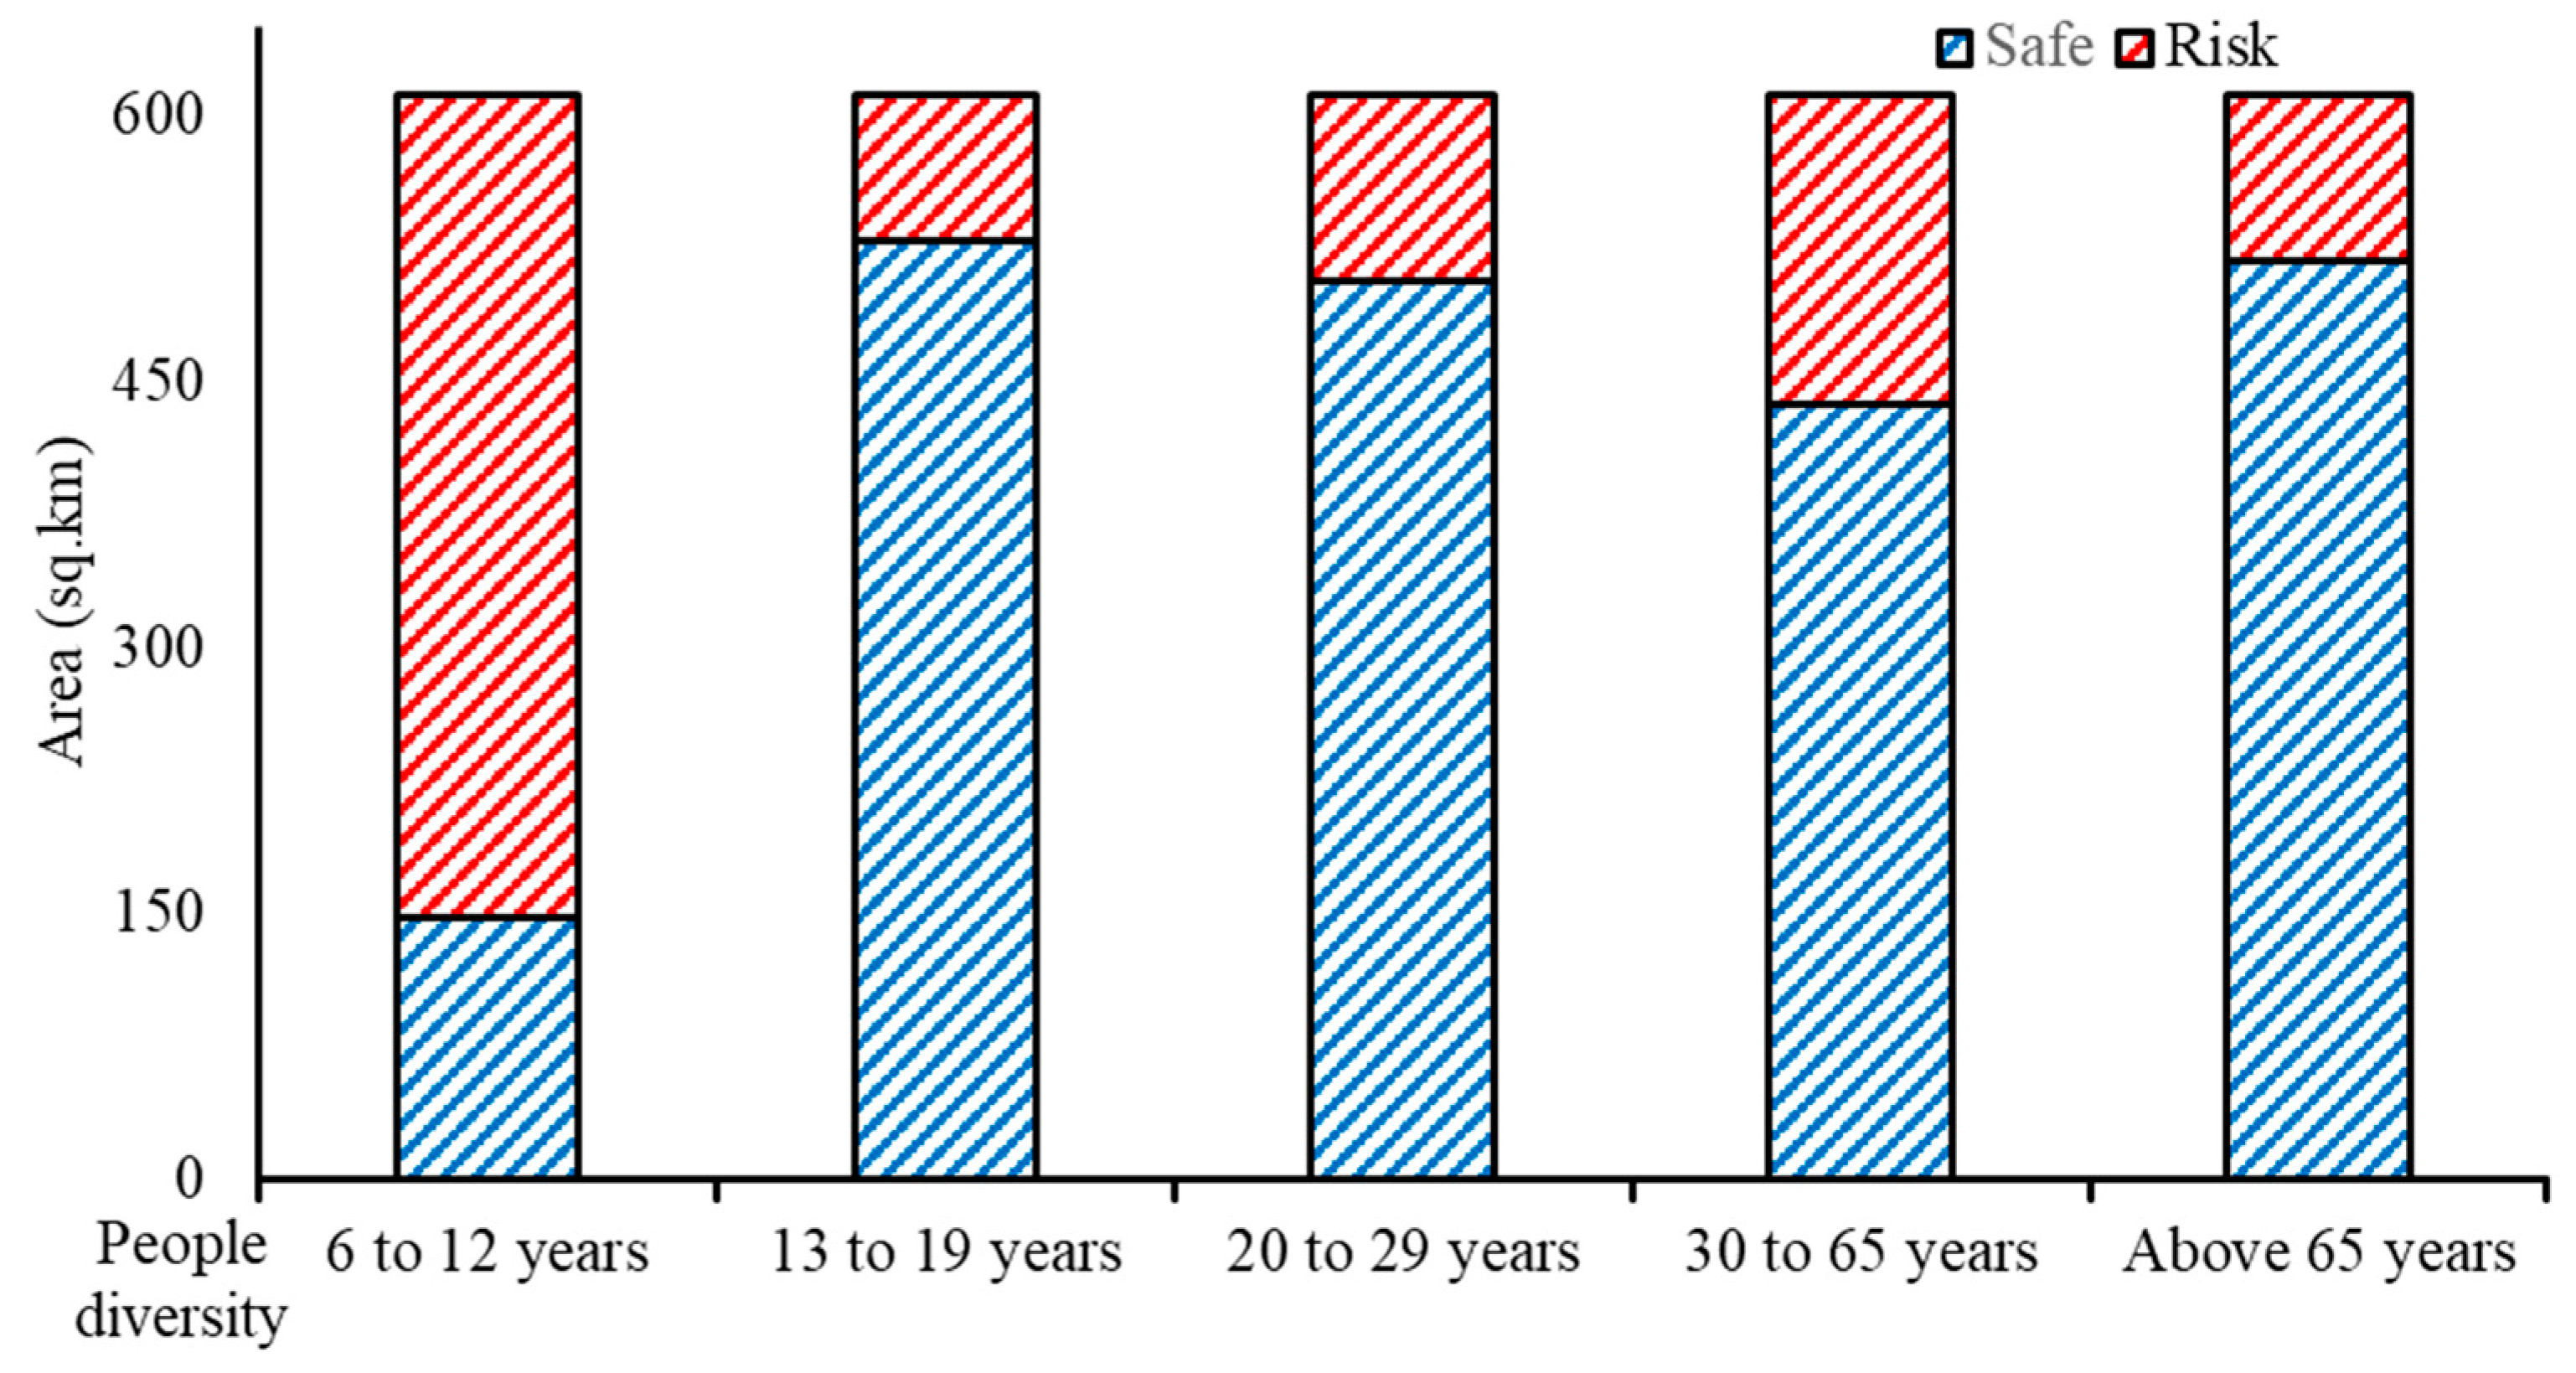
3.4. HHRE
3.4.1. Effect on 6–12-Year-Olds
3.4.2. Effect on 13–19-Year-Olds
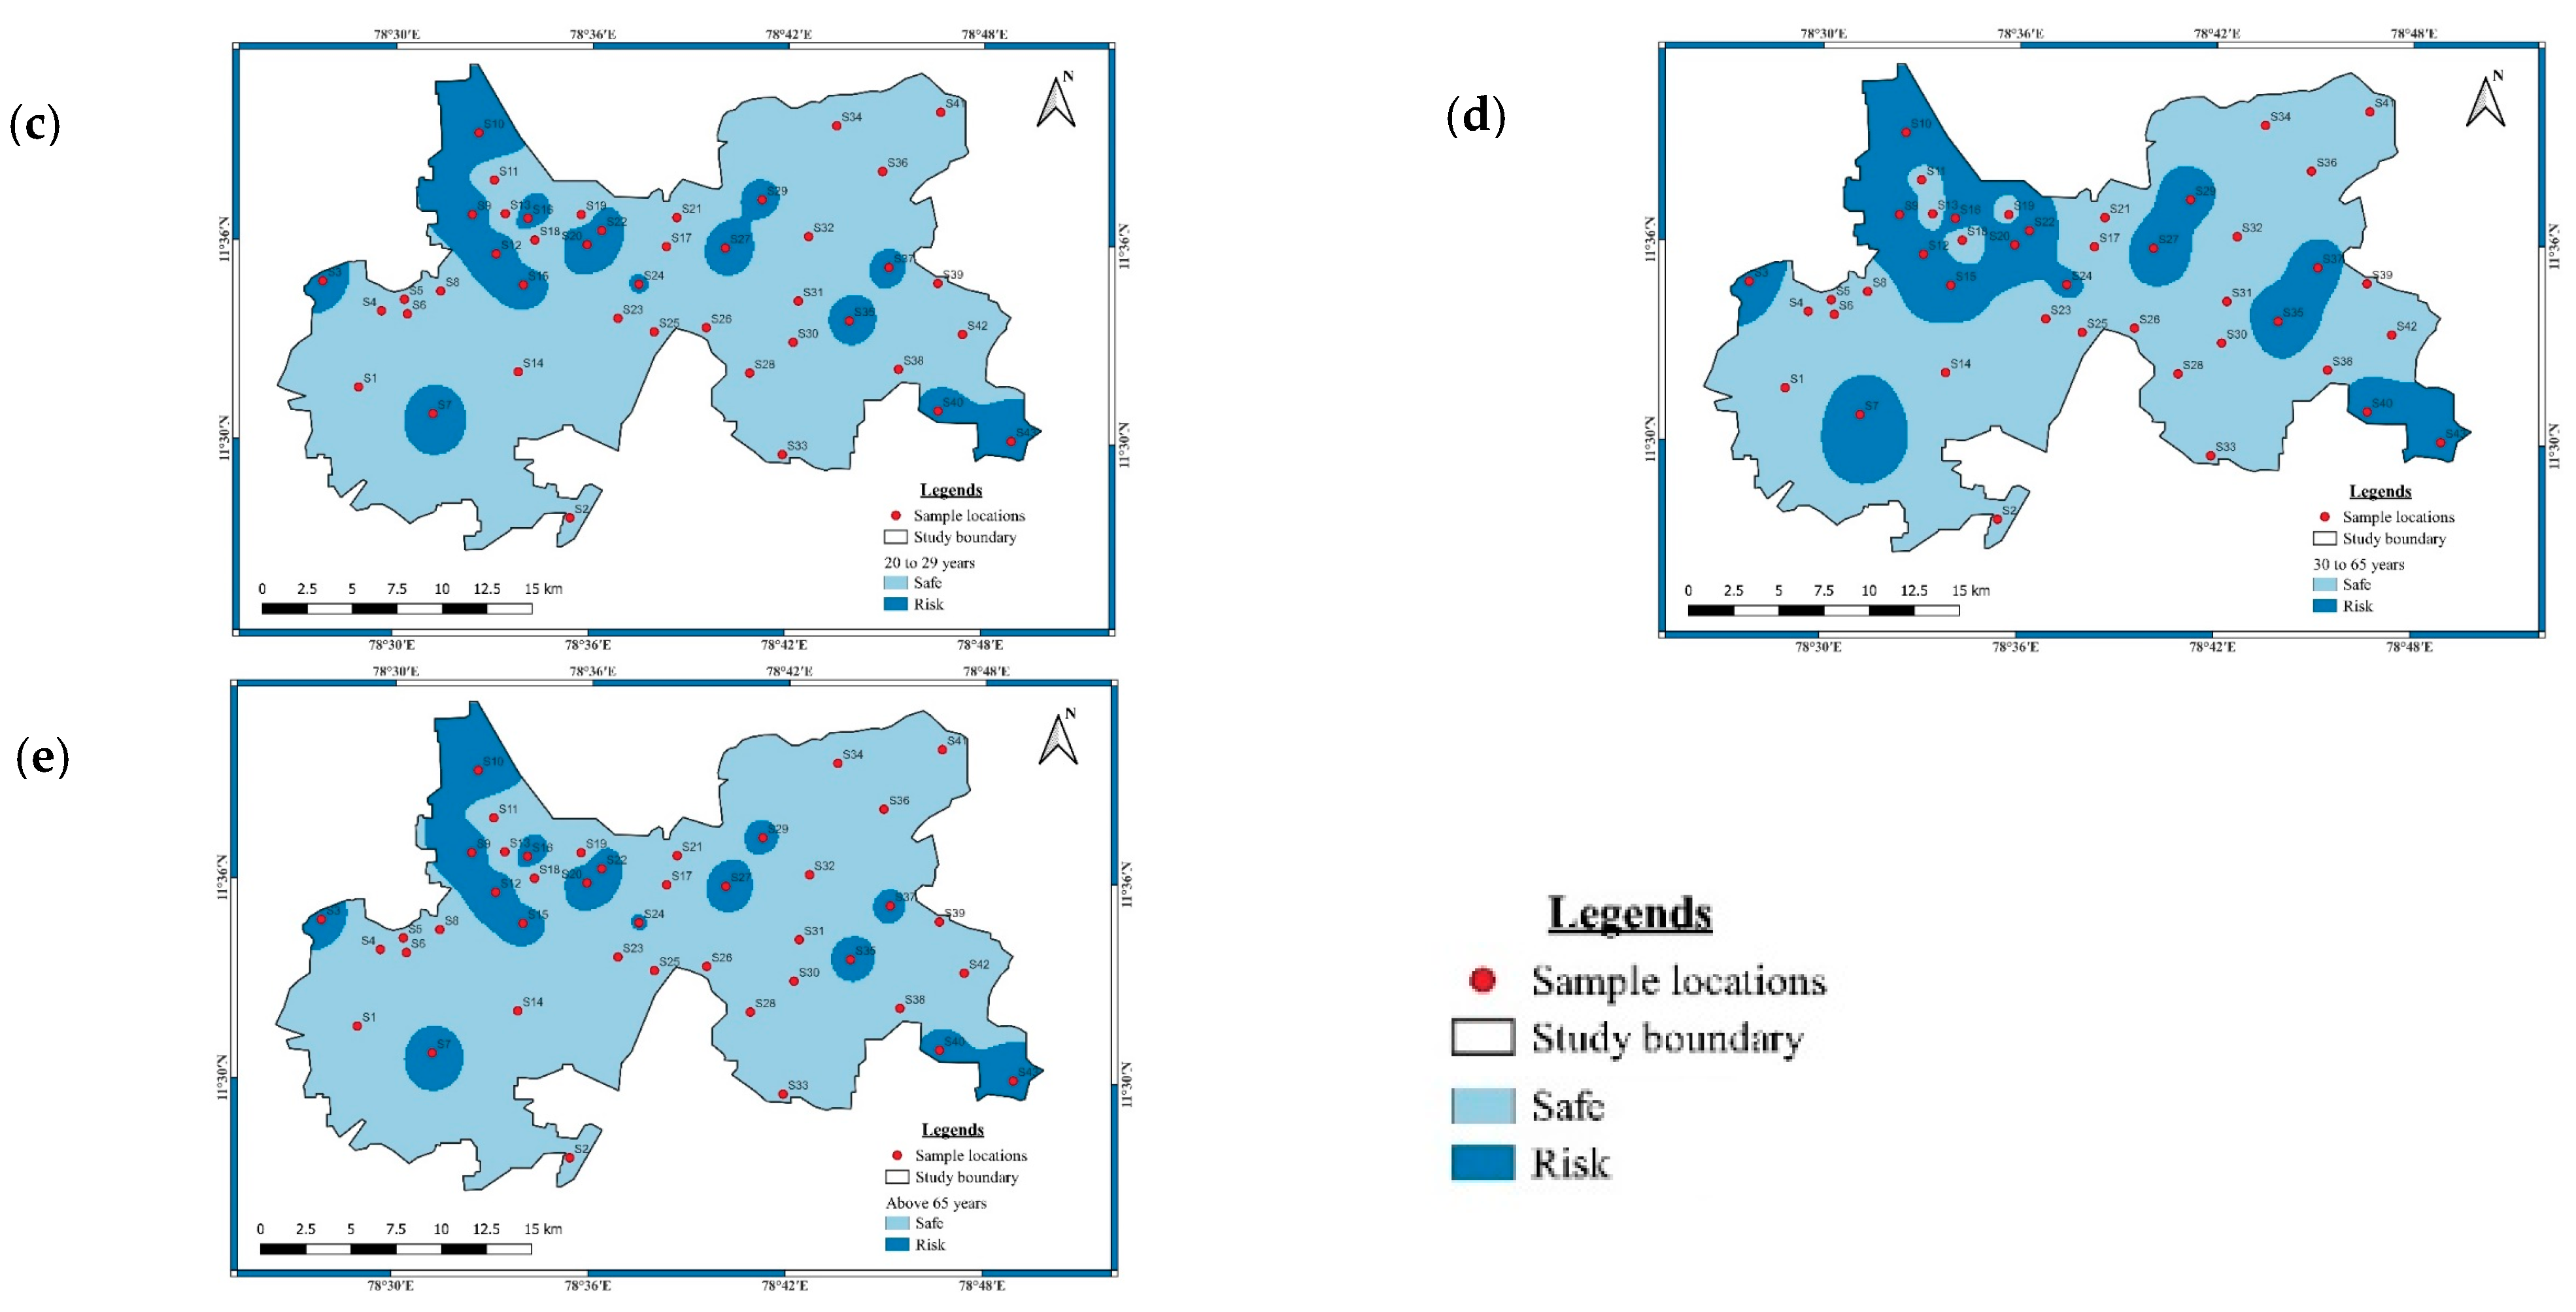
3.4.3. Effect on 20–29-Year-Olds
3.4.4. Effect on 30–65-Year-Olds
3.4.5. Effect on People Aged over 65 Years
3.5. Irrigation Indices
3.6. Statistical Analysis
3.7. Geogenic Sources
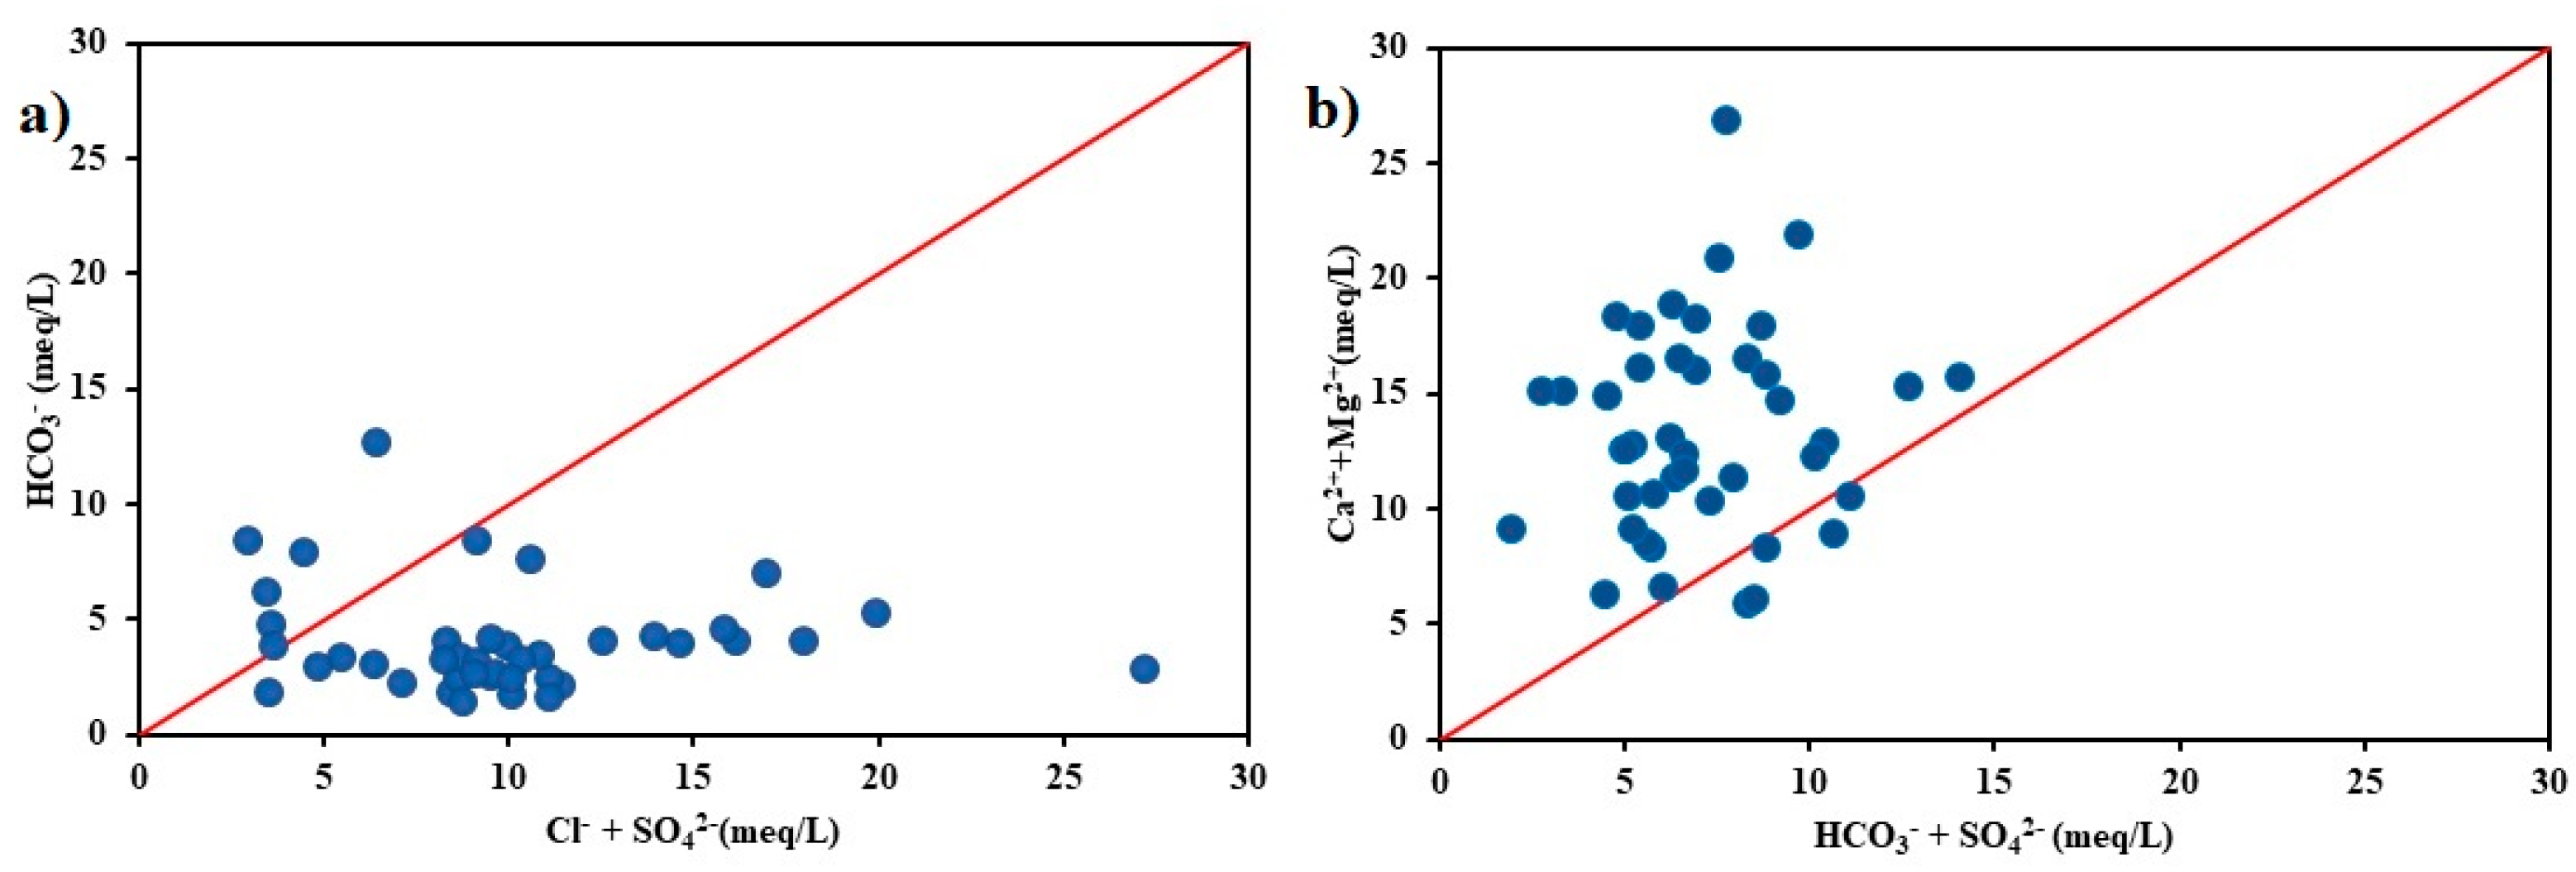
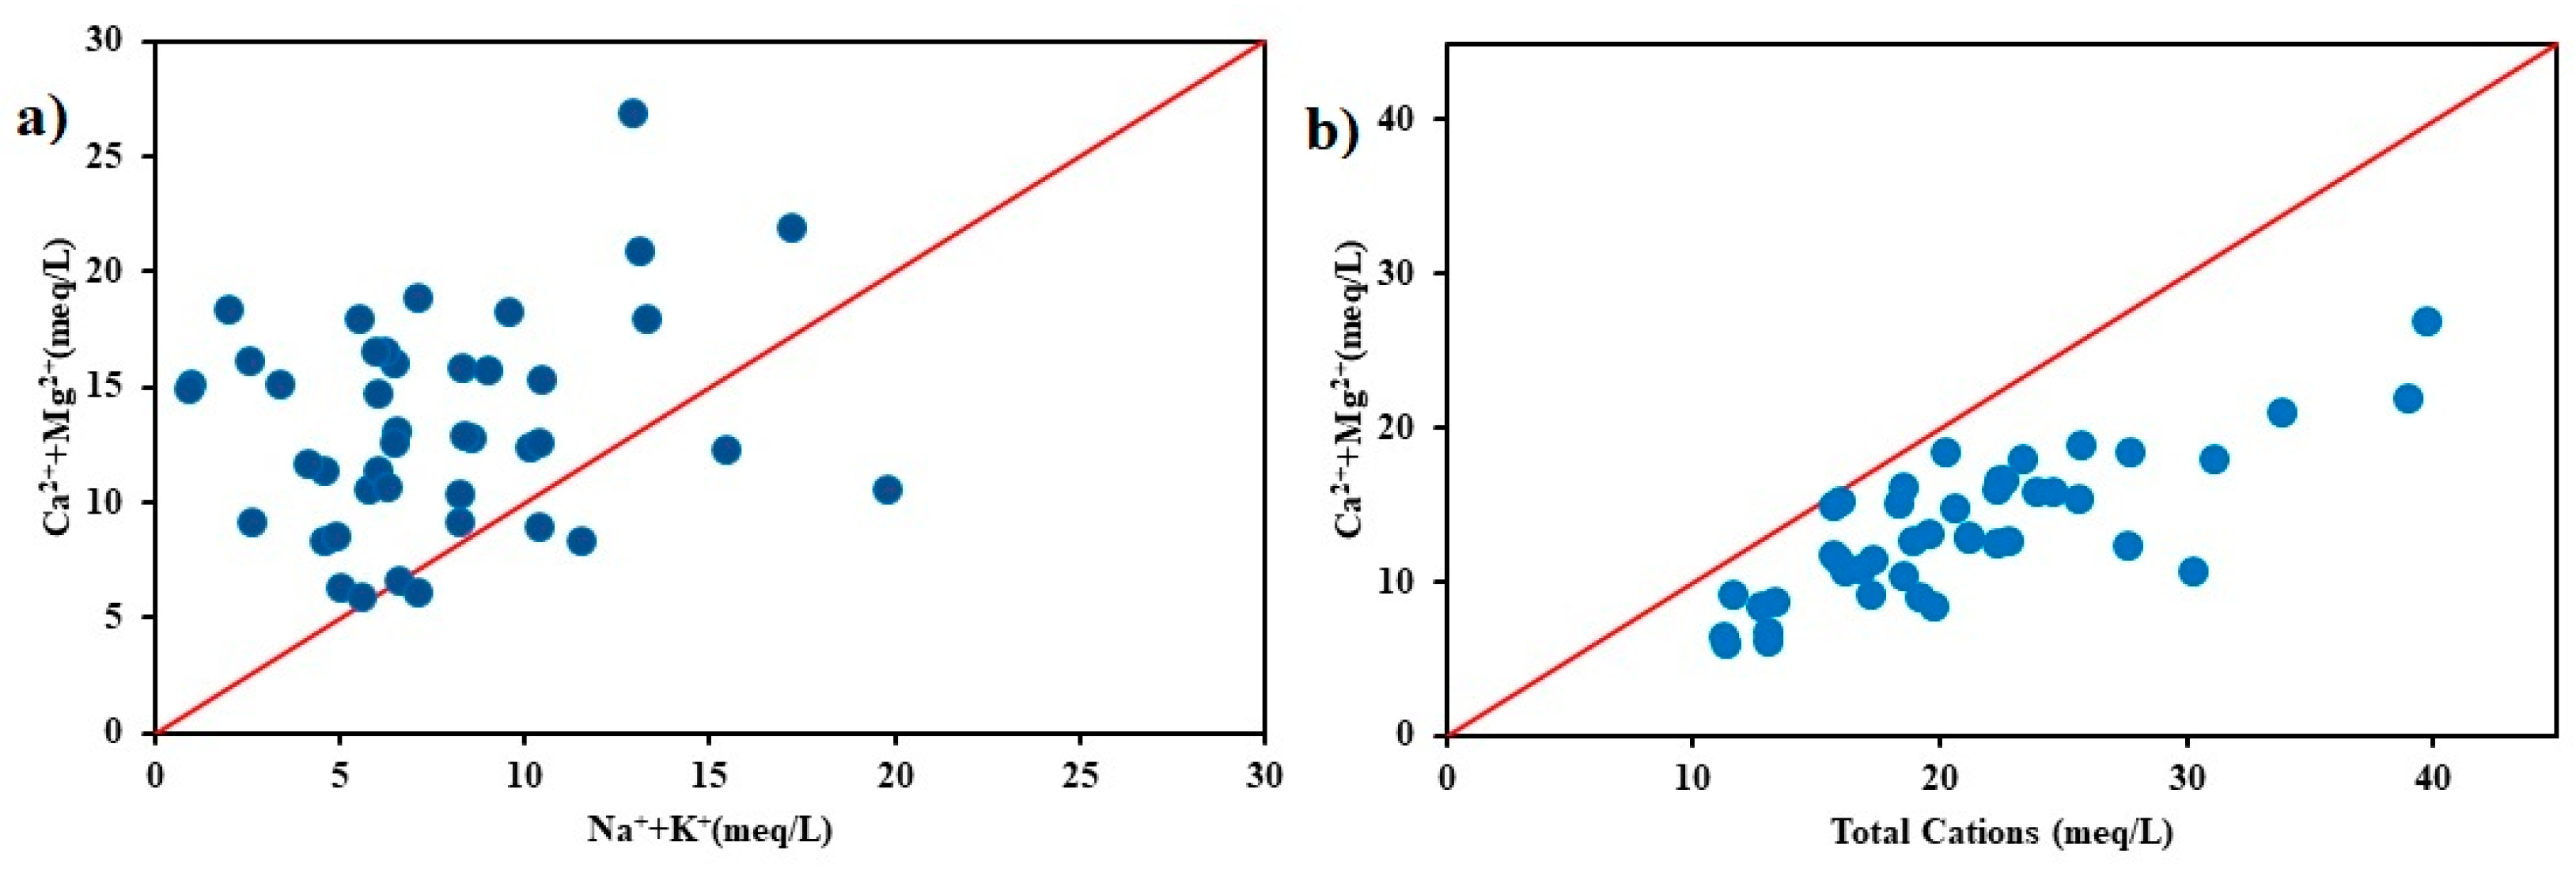
3.7.1. Rock Weathering’s Dominance of Groundwater Chemistry
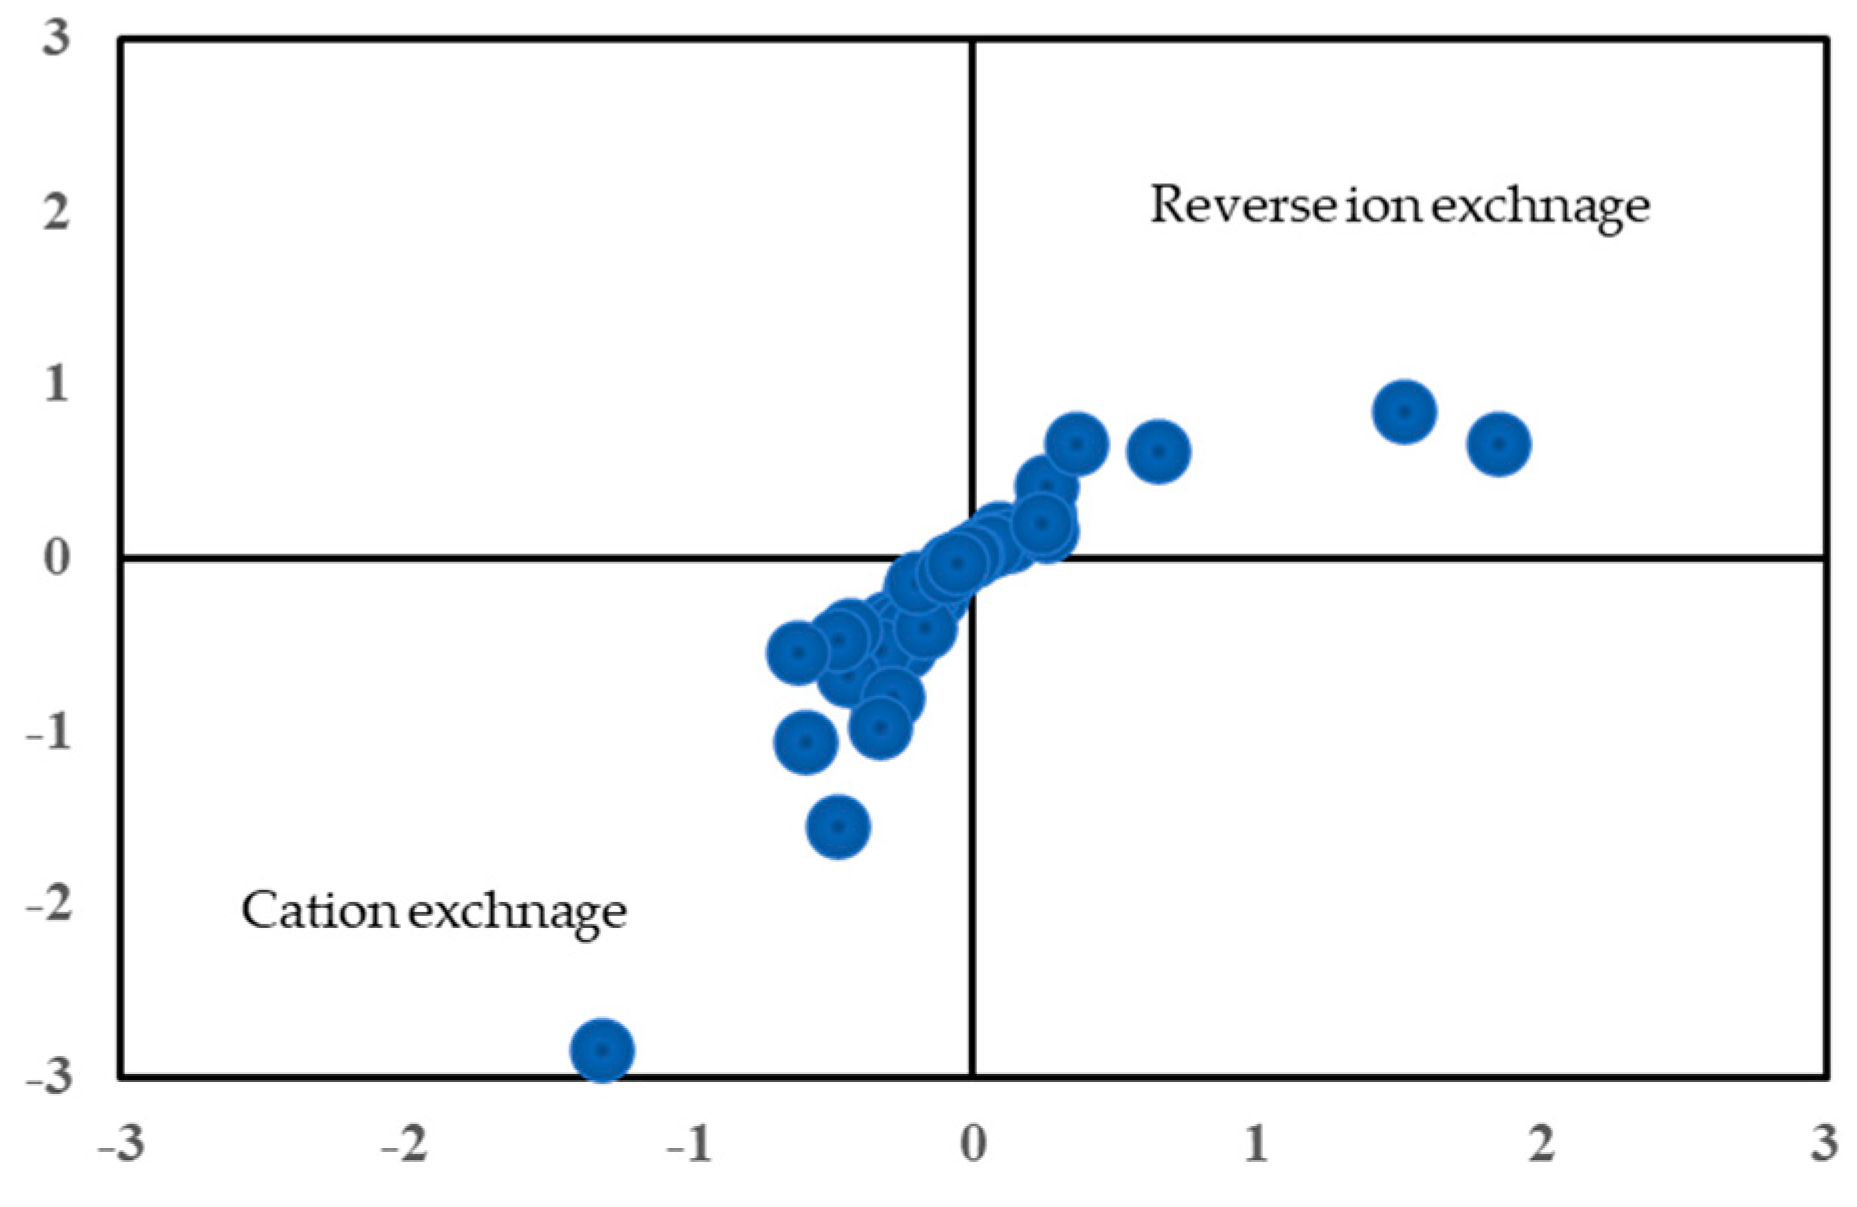
3.7.2. Ion Exchange’s Dominance of Groundwater Chemistry
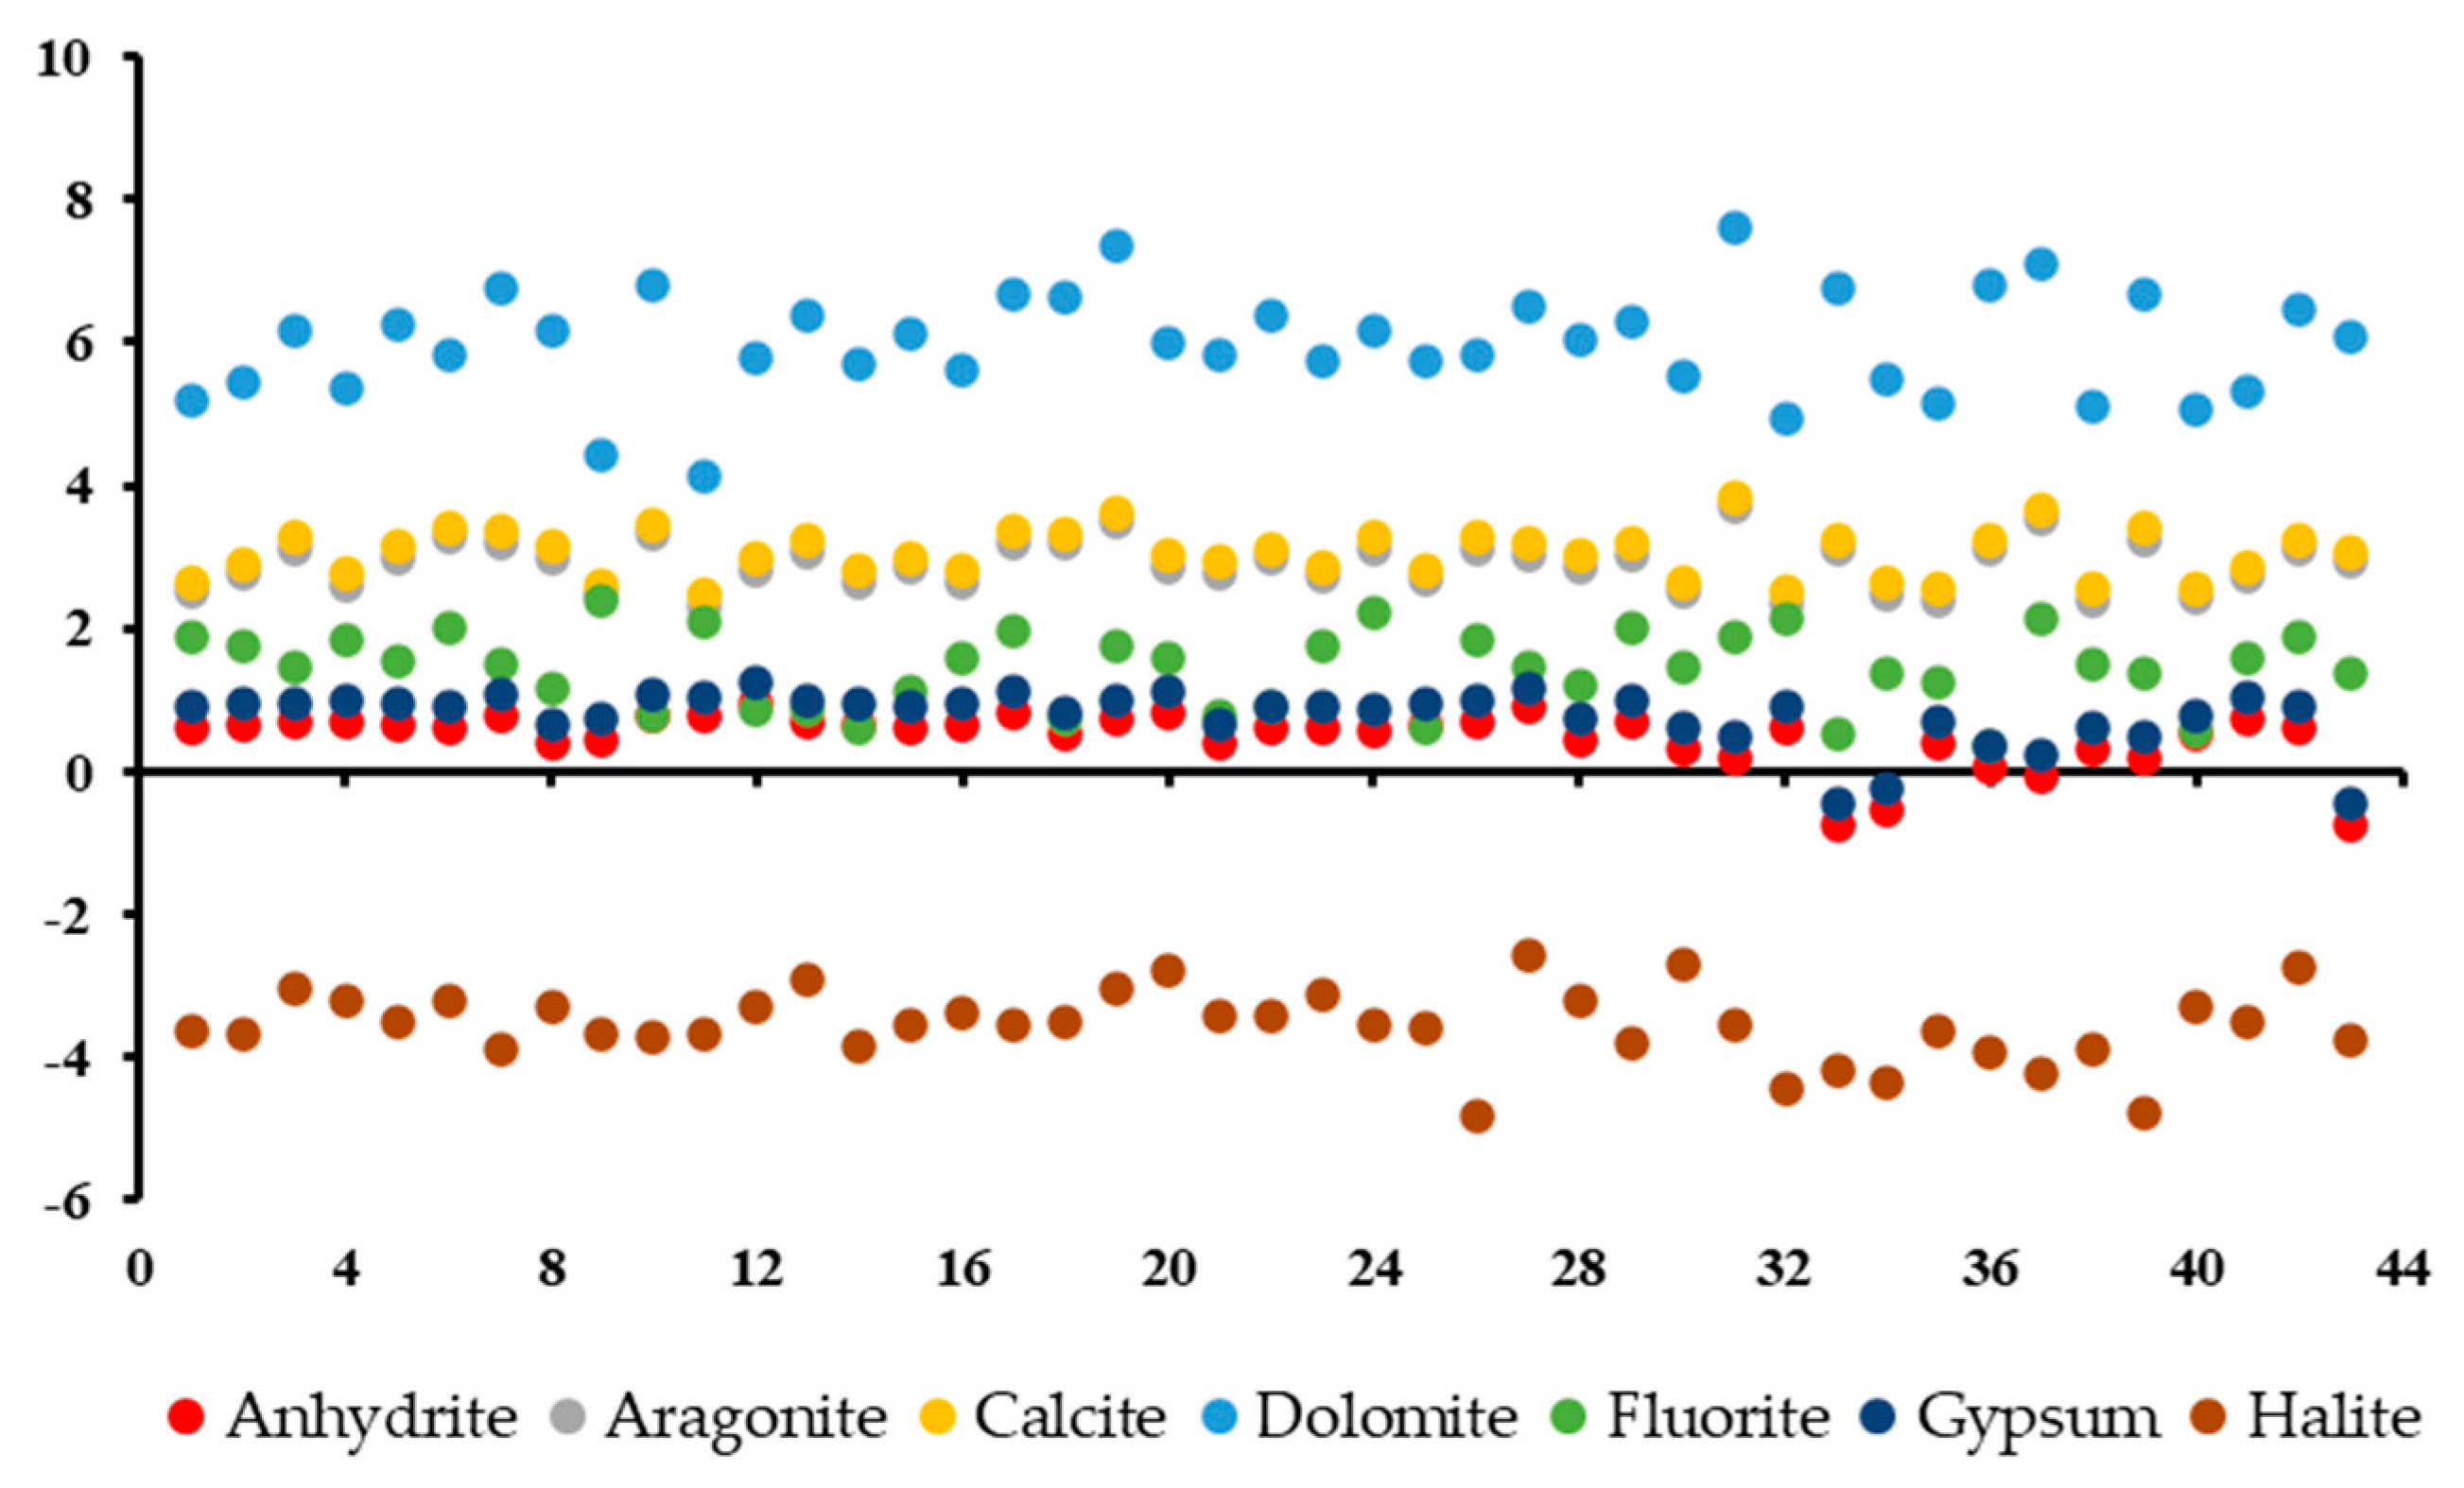
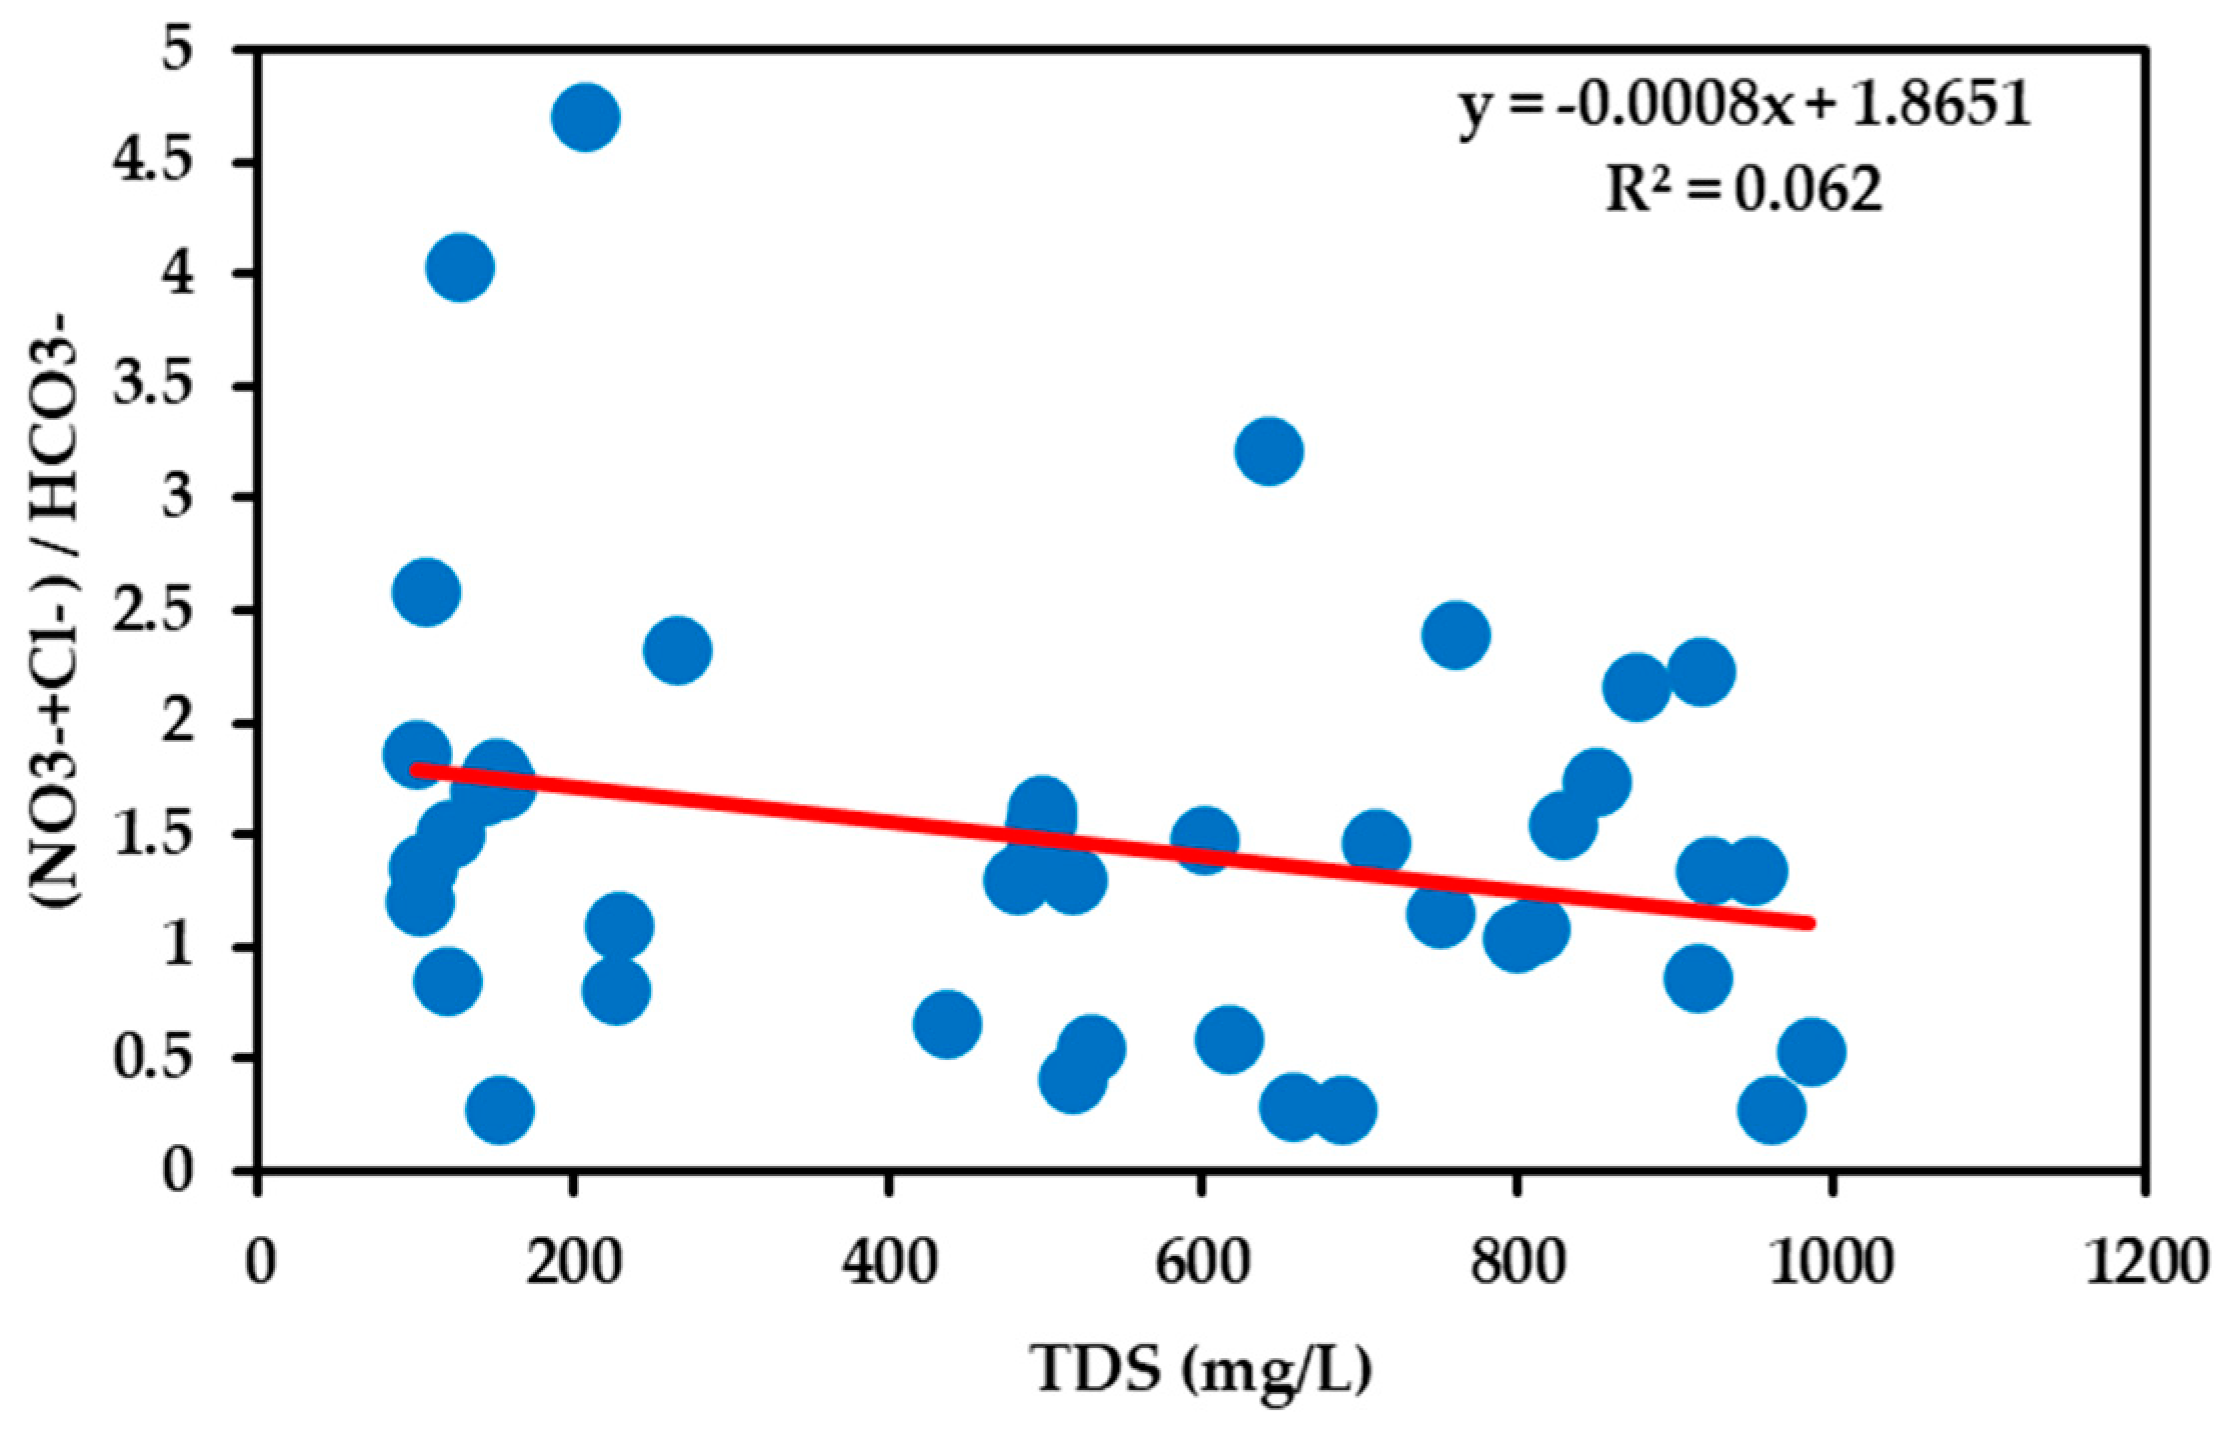
3.7.3. Evaporation’s Governance of Groundwater Chemistry
3.8. Non-Geogenic Source
4. Conclusions
Author Contributions
Funding
Data Availability Statement
Acknowledgments
Conflicts of Interest
References
- Aragaw, T.T.; Gnanachandrasamy, G. Evaluation of Groundwater Quality for Drinking and Irrigation Purposes Using GIS-Based Water Quality Index in Urban Area of Abaya-Chemo Sub-Basin of Great Rift Valley, Ethiopia. Appl. Water Sci. 2021, 11, 148. [Google Scholar] [CrossRef]
- Kom, K.P.; Gurugnanam, B.; Sunitha, V.; Reddy, Y.S.; Kadam, A.K. Hydrogeochemical Assessment of Groundwater Quality for Drinking and Irrigation Purposes in Western Coimbatore, South India. Int. J. Energy Water Res. 2021, 6, 475–494. [Google Scholar] [CrossRef]
- Li, Y.; Li, P.; Cui, X.; He, S. Groundwater Quality, Health Risk, and Major Influencing Factors in the Lower Beiluo River Watershed of Northwest China. Hum. Ecol. Risk Assess. 2021, 27, 1987–2013. [Google Scholar] [CrossRef]
- Panneerselvam, B.; Muniraj, K.; Pande, C.; Ravichandran, N. Prediction and Evaluation of Groundwater Characteristics Using the Radial Basic Model in Semi-Arid Region, India. Int. J. Environ. Anal. Chem. 2021, 1–17. [Google Scholar] [CrossRef]
- Shukla, S.; Saxena, A.; Khan, R.; Li, P. Spatial Analysis of Groundwater Quality and Human Health Risk Assessment in Parts of Raebareli District, India. Environ. Earth Sci. 2021, 80, 800. [Google Scholar] [CrossRef]
- Adimalla, N. Application of the Entropy Weighted Water Quality Index (EWQI) and the Pollution Index of Groundwater (PIG) to Assess Groundwater Quality for Drinking Purposes: A Case Study in a Rural Area of Telangana State, India. Arch. Environ. Contam. Toxicol. 2021, 80, 31–40. [Google Scholar] [CrossRef]
- Nath, A.V.; Selvam, S.; Reghunath, R.; Jesuraja, K. Groundwater Quality Assessment Based on Groundwater Pollution Index Using Geographic Information System at Thettiyar Watershed, Thiruvananthapuram District, Kerala, India. Arab. J. Geosci. 2021, 14, 557. [Google Scholar] [CrossRef]
- Raza, M.J. Groundwater Quality Evaluation and Vulnerability Assessment of Wadi Al-Arj Alluvium Aquifer. Master’s Thesis, King Fahd University of Petroleum and Minerals, Dhahran, Saudi Arabia, 2004. [Google Scholar]
- Panneerselvam, B.; Muniraj, K.; Thomas, M.; Ravichandran, N. GIS-based legitimatic evaluation of groundwater’s health risk and irrigation susceptibility using water quality index, pollution index, and irrigation indexes in semi-arid region. In Groundwater Resources Development and Planning in the Semi-Arid Region; Pande, C.B., Moharir, K.N., Eds.; Springer: Cham, Switzerland, 2021; pp. 239–268. [Google Scholar]
- Liu, J.; Jin, D.; Wang, T.; Gao, M.; Yang, J.; Wang, Q. Hydrogeochemical Processes and Quality Assessment of Shallow Groundwater in Chenqi Coalfield, Inner Mongolia, China. Environ. Earth Sci. 2019, 78, 347. [Google Scholar] [CrossRef]
- Ismail, A.H.; Hassan, G.; Sarhan, A.H. Hydrochemistry of Shallow Groundwater and Its Assessment for Drinking and Irrigation Purposes in Tarmiah District, Baghdad Governorate, Iraq. Groundw. Sustain. Dev. 2020, 10, 100300. [Google Scholar] [CrossRef]
- Abdel Moneim, A.A.; Seleem, E.M.; Zeid, S.A.; Abdel Samie, S.G.; Zaki, S.; Abu El-Fotoh, A. Hydrogeochemical Characteristics and Age Dating of Groundwater in the Quaternary and Nubian Aquifer Systems in Wadi Qena, Eastern Desert, Egypt. Sustain. Water Resour. Manag. 2015, 1, 213–232. [Google Scholar] [CrossRef] [Green Version]
- Wang, Z.R.; Tian, X.; Wu, X. Hydrochemical Characteristics and Quality Assessment of Shallow Groundwater and CBM Co-Produced Water in the Shizhuangnan Block, Qinshui Basin, China. Environ. Earth Sci. 2018, 77, 57. [Google Scholar] [CrossRef]
- Baloch, M.Y.J.; Zhang, W.; Chai, J.; Li, S.; Alqurashi, M.; Rehman, G.; Tariq, A.; Talpur, S.A.; Iqbal, J.; Munir, M.; et al. Shallow Groundwater Quality Assessment and Its Suitability Analysis for Drinking and Irrigation Purposes. Water 2021, 13, 3361. [Google Scholar] [CrossRef]
- Sarkar, M.; Pal, S.C.; Islam, A.R.M.T. Groundwater Quality Assessment for Safe Drinking Water and Irrigation Purposes in Malda District, Eastern India. Environ. Earth Sci. 2022, 81, 52. [Google Scholar] [CrossRef]
- Ayejoto, D.A.; Egbueri, J.C.; Enyigwe, M.T.; Chiaghanam, O.I.; Ameh, P.D. Application of HMTL and Novel IWQI Models in Rural Groundwater Quality Assessment: A Case Study in Nigeria. Toxin Rev. 2022, 41, 918–932. [Google Scholar] [CrossRef]
- Khan, R.; Jhariya, D.C. Hydrogeochemistry and Groundwater Quality Assessment for Drinking and Irrigation Purpose of Raipur City, Chhattisgarh. J. Geol. Soc. India 2018, 91, 475–482. [Google Scholar] [CrossRef]
- Jeihouni, M.; Toomanian, A.; Shahabi, M.; Alavipanah, S.K. Groundwater Quality Assessment for Drinking Purposes Using GIS Modelling (Case Study: City of Tabriz). In The International Archives of the Photogrammetry, Remote Sensing and Spatial Information Sciences, Proceedings of the 1st ISPRS International Conference on Geospatial Information Research; Copernicus Publications: Tehran, Iran, 2014; p. 163. [Google Scholar]
- Mahaqi, A.; Moheghi, M.M.; Mehiqi, M.; Moheghy, M.A. Hydrogeochemical Characteristics and Groundwater Quality Assessment for Drinking and Irrigation Purposes in the Mazar-i-Sharif City, North Afghanistan. Appl. Water Sci. 2018, 8, 133. [Google Scholar] [CrossRef]
- Khan, R.; Jhariya, D.C. Groundwater Quality Assessment for Drinking Purpose in Raipur City, Chhattisgarh Using Water Quality Index and Geographic Information System. J. Geol. Soc. India 2017, 90, 69–76. [Google Scholar] [CrossRef]
- Liu, F.; Zhen, P.; Wang, S. Groundwater Quality Assessment and Health Risks from Nitrate Contamination in the Heilongdong Spring Basin, a Typical Headwater Basin of the North China Plain. Environ. Sci. Pollut. Res. 2022, 29, 17655–17670. [Google Scholar] [CrossRef]
- Li, P.; Tian, R.; Xue, C.; Wu, J. Progress, Opportunities, and Key Fields for Groundwater Quality Research under the Impacts of Human Activities in China with a Special Focus on Western China. Environ. Sci. Pollut. Res. 2017, 24, 13224–13234. [Google Scholar] [CrossRef]
- Jayne, T.; Yeboah, K.F.; Carla, H. The Future of Work in African Agriculture: Trends and Drivers of Change; ILO Research Department Working Paper No.25; International Labour Organization: Geneva, Switzerland, 2017. [Google Scholar]
- Li, P.; Li, X.; Meng, X.; Li, M.; Zhang, Y. Appraising Groundwater Quality and Health Risks from Contamination in a Semi-arid Region of Northwest China. Expo. Health 2016, 8, 361–379. [Google Scholar] [CrossRef]
- He, X.; Li, P.; Ji, Y.; Wang, Y.; Su, Z.; Elumalai, V. Groundwater Arsenic and Fluoride and Associated Arsenicosis and Fluorosis in China: Occurrence, Distribution and Management. Expo. Health 2020, 12, 355–368. [Google Scholar] [CrossRef]
- Gugulothu, S.; Subba Rao, N.; Das, R.; Duvva, L.K.; Dhakate, R. Judging the Sources of Inferior Groundwater Quality and Health Risk Problems through Intake of Groundwater Nitrate and Fluoride from a Rural Part of Telangana, India. Environ. Sci. Pollut. Res. 2022, 29, 49070–49091. [Google Scholar] [CrossRef] [PubMed]
- Li, P.; Wu, J. Drinking Water Quality and Public Health. Expo. Health 2019, 11, 73–79. [Google Scholar] [CrossRef]
- Li, P.; He, X.; Guo, W. Spatial Groundwater Quality and Potential Health Risks Due to Nitrate Ingestion through Drinking Water: A Case Study in Yan’an City on the Loess Plateau of Northwest China. Hum. Ecol. Risk Assess. 2019, 25, 11–31. [Google Scholar] [CrossRef]
- Abdulsalam, A.; Ramli, M.F.; Jamil, N.R.; Ashaari, Z.H.; Umar, D.A. Hydrochemical Characteristics and Identification of Groundwater Pollution Sources in Tropical Savanna. Environ. Sci. Pollut. Res. 2022, 29, 37384–37398. [Google Scholar] [CrossRef] [PubMed]
- Egbi, C.D.; Anornu, G.K.; Ganyaglo, S.Y.; Appiah-Adjei, E.K.; Li, S.L.; Dampare, S.B. Nitrate Contamination of Groundwater in the Lower Volta River Basin of Ghana: Sources and Related Human Health Risks. Ecotoxicol. Environ. Saf. 2020, 191, 110227. [Google Scholar] [CrossRef]
- Balamurugan, P.; Kumar, P.S.; Shankar, K.; Nagavinothini, R.; Vijayasurya, K. Non-Carcinogenic Risk Assessment of Groundwater in Southern Part of Salem District in Tamilnadu, India. J. Chil. Chem. Soc. 2020, 65, 4697–4707. [Google Scholar] [CrossRef]
- Balamurugan, P.; Kumar, P.S.; Shankar, K. Dataset on the Suitability of Groundwater for Drinking and Irrigation Purposes in the Sarabanga River Region, Tamil Nadu, India. Data Brief 2020, 29, 105255. [Google Scholar] [CrossRef]
- Kaliyappan, S.P.; Panneerselvam, B.; Muniraj, K.; Rajendran, G.; Bidorn, B.; Thomas, M. Evaluation of Groundwater Quality for Drinking Purposes Using the WQI and EWQI in Semi-Arid Regions in India. In Climate Change Impact on Groundwater Resources; Panneerselvam, B., Pande, C.B., Muniraj, K., Balasubramanian, A., Ravichandran, N., Eds.; Springer: Cham, Switzerland, 2022; pp. 139–162. ISBN 978-3-031-04706-0. [Google Scholar]
- Shukla, S.; Saxena, A. Appraisal of Groundwater Quality with Human Health Risk Assessment in Parts of Indo-Gangetic Alluvial Plain, North India. Arch. Environ. Contam. Toxicol. 2021, 80, 55–73. [Google Scholar] [CrossRef]
- Shukla, S.; Saxena, A. Sources and Leaching of Nitrate Contamination in Groundwater. Curr. Sci. 2020, 118, 883–891. [Google Scholar] [CrossRef]
- United States Environmental Protection Agency. Risk Assessment Guidance for Superfund Volume I: Human Health Evaluation Manual (Part B, Development of Risk-Based Preliminary Remediation Goals) Final. Evaluation 2004. EPA/540/R/99/005 Washington, D.C. Available online: https://www.epa.gov/sites/default/files/2015-09/documents/part_e_final_revision_10-03-07.pdf (accessed on 2 January 2023).
- Ramalingam, S.; Panneerselvam, B.; Kaliappan, S.P. Effect of High Nitrate Contamination of Groundwater on Human Health and Water Quality Index in Semi-Arid Region, South India. Arab. J. Geosci. 2022, 15, 242. [Google Scholar] [CrossRef]
- Egbueri, J.C. Incorporation of information entropy theory, artificial neural network, and soft computing models in the development of integrated industrial water quality index. Environ. Monit. Assess. 2022, 194, 693. [Google Scholar] [CrossRef] [PubMed]
- Kumar, P.J.; Augustine, C.M. Entropy-weighted water quality index (EWQI) modeling of groundwater quality and spatial mapping in Uppar Odai Sub-Basin, South India. Model. Earth Syst. Environ. 2022, 8, 911–924. [Google Scholar] [CrossRef]
- Ober, J.; Karwot, J. Tap water quality: Seasonal user surveys in Poland. Energies 2021, 14, 3841. [Google Scholar] [CrossRef]
- Peters, M.; Guo, Q.; Strauss, H.; Wei, R.; Li, S.; Yue, F. Seasonal effects on contamination characteristics of tap water from rural Beijing: A multiple isotope approach. J. Hydrol. 2020, 588, 125037. [Google Scholar] [CrossRef]
- Zhang, H.; Xu, L.; Huang, T.; Yan, M.; Liu, K.; Miao, Y.; He, H.; Li, S.; Sekar, R. Combined effects of seasonality and stagnation on tap water quality: Changes in chemical parameters, metabolic activity and co-existence in bacterial community. J. Hazard. Mater. 2021, 403, 124018. [Google Scholar] [CrossRef]
- WHO. Guidelines for Drinking Water Quality: Fourth Edition Incorporating the First Addendum; World Health Organization: Geneva Switzerland, 2011. [Google Scholar]
- Unigwe, C.O.; Egbueri, J.C.; Omeka, M.E. Geospatial and Statistical Approaches to Nitrate Health Risk and Groundwater Quality Assessment of an Alluvial Aquifer in SE Nigeria for Drinking and Irrigation Purposes. J. Indian Chem. Soc. 2022, 99, 100479. [Google Scholar] [CrossRef]
- Jabbo, J.N.; Isa, N.M.; Aris, A.Z.; Ramli, M.F.; Abubakar, M.B. Geochemometric Approach to Groundwater Quality and Health Risk Assessment of Heavy Metals of Yankari Game Reserve and Its Environs, Northeast Nigeria. J. Clean. Prod. 2022, 330, 129916. [Google Scholar] [CrossRef]
- Adimalla, N.; Li, P. Occurrence, Health Risks, and Geochemical Mechanisms of Fluoride and Nitrate in Groundwater of the Rock-Dominant Semi-Arid Region, Telangana State, India. Hum. Ecol. Risk Assess. 2019, 25, 81–103. [Google Scholar] [CrossRef]
- Edet, A.E. Vulnerability Evaluation of a Coastal Plain Sand Aquifer with a Case Example from Calabar, Southeastern Nigeria. Environ. Geol. 2004, 45, 1062–1070. [Google Scholar] [CrossRef]
- APHA. Standard Methods for the Examination of Water and Wastewater; Federation. Water Environmental American Public Health Association (APHA): Washington, DC, USA, 2017. [Google Scholar]
- Panneerselvam, B.; Muniraj, K.; Pande, C.; Ravichandran, N.; Thomas, M.; Karuppannan, S. Geochemical Evaluation and Human Health Risk Assessment of Nitrate-Contaminated Groundwater in an Industrial Area of South India. Environ. Sci. Pollut. Res. 2021, 29, 86202–86219. [Google Scholar] [CrossRef] [PubMed]
- Panneerselvam, B.; Muniraj, K.; Duraisamy, K.; Pande, C.; Karuppannan, S.; Thomas, M. An Integrated Approach to Explore the Suitability of Nitrate-Contaminated Groundwater for Drinking Purposes in a Semiarid Region of India. Environ. Geochem. Health 2022, 1–17. [Google Scholar] [CrossRef] [PubMed]
- El Mountassir, O.; Bahir, M.; Ouazar, D.; Chehbouni, A.; Carreira, P.M. Temporal and Spatial Assessment of Groundwater Contamination with Nitrate Using Nitrate Pollution Index (NPI), Groundwater Pollution Index (GPI), and GIS (Case Study: Essaouira Basin, Morocco). Environ. Sci. Pollut. Res. 2022, 29, 17132–17149. [Google Scholar] [CrossRef]
- Gao, S.; Li, C.; Jia, C.; Zhang, H.; Guan, Q.; Wu, X.; Wang, J.; Lv, M. Health Risk Assessment of Groundwater Nitrate Contamination: A Case Study of a Typical Karst Hydrogeological Unit in East China. Environ. Sci. Pollut. Res. 2020, 27, 9274–9287. [Google Scholar] [CrossRef]
- Adimalla, N. Spatial Distribution, Exposure, and Potential Health Risk Assessment from Nitrate in Drinking Water from Semi-Arid Region of South India. Hum. Ecol. Risk Assess. 2020, 26, 310–334. [Google Scholar] [CrossRef]
- He, S.; Wu, J. Hydrogeochemical Characteristics, Groundwater Quality, and Health Risks from Hexavalent Chromium and Nitrate in Groundwater of Huanhe Formation in Wuqi County, Northwest China. Expo. Health 2019, 11, 125–137. [Google Scholar] [CrossRef]
- Panneerselvam, B.; Karuppannan, S.; Muniraj, K. Evaluation of Drinking and Irrigation Suitability of Groundwater with Special Emphasizing the Health Risk Posed by Nitrate Contamination Using Nitrate Pollution Index (NPI) and Human Health Risk Assessment (HHRA). Hum. Ecol. Risk Assess. 2020, 27, 1324–1348. [Google Scholar] [CrossRef]
- Panneerselvam, B.; Muniraj, K.; Thomas, M.; Ravichandran, N.; Bidorn, B. Identifying Influencing Groundwater Parameter on Human Health Associate with Irrigation Indices Using the Automatic Linear Model (ALM) in a Semi-Arid Region in India. Environ. Res. 2021, 202, 111778. [Google Scholar] [CrossRef]
- Kouadri, S.; Pande, C.B.; Panneerselvam, B.; Moharir, K.N.; Elbeltagi, A. Prediction of irrigation groundwater quality parameters using ANN, LSTM, and MLR models. Environ. Sci. Pollut. Res. 2022, 29, 21067–21091. [Google Scholar] [CrossRef]
- Chen, J.; Gao, Y.; Qian, H.; Ren, W.; Qu, W. Hydrogeochemical Evidence for Fluoride Behavior in Groundwater and the Associated Risk to Human Health for a Large Irrigation Plain in the Yellow River Basin. Sci. Total Environ. 2021, 800, 149428. [Google Scholar] [CrossRef] [PubMed]
- Sudheer Kumar, M.; Dhakate, R.; Yadagiri, G.; Srinivasa Reddy, K. Principal component and multivariate statistical approach for evaluation of hydrochemical characterization of fluoride-rich groundwater of Shaslar Vagu watershed, Nalgonda District, India. Arab. J. Geosci. 2017, 10, 83. [Google Scholar] [CrossRef]
- Schoeller, H. Geochemistry of groundwater. In Groundwater Studies: An International Guide for Research and Practice; UNESCO: Paris, France, 1977. [Google Scholar]
- Abendong, A.A.; Emmanuel, E.; Fongoh, E.J.; Akoachere, R.A. Assessment of Groundwater Quality in Bamenda–Cameroon for Suitable Applications. SN Appl. Sci. 2019, 1, 1389. [Google Scholar] [CrossRef]
- Chen, F.; Yao, L.; Mei, G.; Shang, Y.; Xiong, F.; Ding, Z. Groundwater Quality and Potential Human Health Risk Assessment for Drinking and Irrigation Purposes: A Case Study in the Semi-arid Region of North China. Water 2021, 13, 783. [Google Scholar] [CrossRef]
- Sajil Kumar, P.J. Hydrogeochemical and Multivariate Statistical Appraisal of Pollution Sources in the Groundwater of the Lower Bhavani River Basin in Tamil Nadu. Geol. Ecol. Landsc. 2020, 4, 40–51. [Google Scholar] [CrossRef]
- Sajil Kumar, P.J.; Mohanan, A.A.; Ekanthalu, V.S. Hydrogeochemical Analysis of Groundwater in Thanjavur District, Tamil Nadu; Influences of Geological Settings and Land Use Pattern. Geol. Ecol. Landsc. 2020, 4, 306–317. [Google Scholar] [CrossRef]
- Dossou, J.F.; Li, X.X.; Sadek, M.; Sidi Almouctar, M.A.; Mostafa, E. Hybrid Model for Ecological Vulnerability Assessment in Benin. Sci. Rep. 2021, 11, 2449. [Google Scholar] [CrossRef]
- Annan, S.T.; Frimpong, B.; Owusu-Fordjour, C.; Boasu, B.Y. Assessing Localized Contamination Hazard and Groundwater Quality Challenges in Water-Stressed Peri-Urban Accra, Ghana. J. Geosci. Environ. Prot. 2022, 10, 13–28. [Google Scholar] [CrossRef]
- Ahamad, A.; Madhav, S.; Singh, P.; Pandey, J.; Khan, A.H. Assessment of Groundwater Quality with Special Emphasis on Nitrate Contamination in Parts of Varanasi City, Uttar Pradesh, India. Appl. Water Sci. 2018, 8, 115. [Google Scholar] [CrossRef]
- Adimalla, N. Groundwater Quality for Drinking and Irrigation Purposes and Potential Health Risks Assessment: A Case Study from Semi-Arid Region of South India. Expo. Health 2019, 11, 109–123. [Google Scholar] [CrossRef]
- Adimalla, N. Controlling Factors and Mechanism of Groundwater Quality Variation in Semi-arid Region of South India: An Approach of Water Quality Index (WQI) and Health Risk Assessment (HRA). Environ. Geochem. Health. 2020, 42, 1725–1752. [Google Scholar] [CrossRef]
- Gaikwad, S.; Gaikwad, S.; Meshram, D.; Wagh, V.; Kandekar, A.; Kadam, A. Geochemical Mobility of Ions in Groundwater from the Tropical Western Coast of Maharashtra, India: Implication to Groundwater Quality. Environ. Dev. Sustain. 2020, 22, 2591–2624. [Google Scholar] [CrossRef]
- Wagh, V.M.; Mukate, S.V.; Panaskar, D.B.; Muley, A.A.; Sahu, U.L. Study of Groundwater Hydrochemistry and Drinking Suitability through Water Quality Index (WQI) Modelling in Kadava River Basin, India. SN Appl. Sci. 2019, 1, 1251. [Google Scholar] [CrossRef]
- Wagh, V.M.; Panaskar, D.B.; Mukate, S.V.; Aamalawar, M.L.; Laxman Sahu, U. Nitrate Associated Health Risks from Groundwater of Kadava River Basin Nashik, Maharashtra, India. Hum. Ecol. Risk Assess. 2020, 26, 654–672. [Google Scholar] [CrossRef]
- Wagh, V.; Mukate, S.; Muley, A.; Kadam, A.; Panaskar, D.; Varade, A. Study of Groundwater Contamination and Drinking Suitability in Basaltic Terrain of Maharashtra, India through Pig and Multivariate Statistical Techniques. J. Water Supply Res. Technol. 2020, 69, 398–414. [Google Scholar] [CrossRef] [Green Version]


| Minimum | Maximum | Mean | Kurtosis | Skewness | WHO 2011 | % of the Sample Exceeds | |
|---|---|---|---|---|---|---|---|
| pH | 7.30 | 8.54 | 7.77 | −0.27 | 0.49 | 6.5–8.5 | 0.00 |
| TDS | 100.30 | 985.00 | 511.60 | −1.43 | −0.03 | 1000 | 0.00 |
| TH | 50.00 | 640.31 | 268.76 | −0.79 | 0.68 | 500 | 13.95 |
| EC | 96.00 | 2023.00 | 931.38 | −0.37 | 0.32 | 1500 | 9.30 |
| Ca2+ | 60.00 | 250.00 | 126.99 | 2.04 | 0.74 | 200 | 4.65 |
| Mg2+ | 12.00 | 174.00 | 84.23 | −0.29 | 0.10 | 150 | 6.97 |
| Na+ | 13.00 | 457.00 | 157.12 | 1.56 | 0.99 | 200 | 18.60 |
| K+ | 0.00 | 64.46 | 34.29 | −1.35 | 0.53 | 12 | 27.90 |
| Cl2− | 12.50 | 716.00 | 239.62 | 2.91 | 1.44 | 250 | 32.55 |
| HCO3− | 82.00 | 769.00 | 237.86 | 4.37 | 1.90 | 500 | 4.65 |
| SO4− | 7.00 | 421.00 | 154.93 | 1.07 | 0.60 | 250 | 9.30 |
| NO3− | 21.00 | 64.00 | 40.53 | −1.31 | 0.24 | 50 | 37.20 |
| F− | 0.22 | 1.18 | 0.67 | −1.25 | 0.07 | 1.5 | 0.00 |
| EWQI | Class of Water | Sample Count | % of Samples | Area Occupied |
|---|---|---|---|---|
| <50 | Excellent | 4 | 9.30 | 3.96 |
| 50–100 | Good | 20 | 46.51 | 285.92 |
| 100–150 | Medium | 12 | 27.91 | 304.98 |
| 150–200 | Poor | 7 | 16.28 | 16.84 |
| >200 | Extreme poor | 0 | 0.00 | 0.00 |
| NPI Value | Contamination Type | No. of Samples | % of Samples |
|---|---|---|---|
| <0 | Clean | 0 | 0.00 |
| 0 to 1 | Light pollution | 25 | 58.14 |
| 1 to 2 | Moderate pollution | 12 | 27.91 |
| 2 to 3 | Significant pollution | 6 | 13.95 |
| >3 | Very Significant pollution | 0 | 0.00 |
| Range | No. of Samples | Samples (%) | Class |
|---|---|---|---|
| Sodium absorption ratio | |||
| Less than 10 | 43 | 100 | Excellent |
| 10–18 | 0 | 0 | Good |
| 18–26 | 0 | 0 | Doubtful |
| Greater than 26 | 0 | 0 | Unsuitable |
| Percentage of sodium | |||
| 0–20 | 5 | 11.63 | Excellent |
| 20–40 | 23 | 53.49 | Good |
| 40–60 | 15 | 34.88 | Permissible |
| 60–80 | 0 | 0.00 | Doubtful |
| Greater than 80 | 0 | 0.00 | Unsuitable |
| Residual sodium carbonate | |||
| Less than 1.25 | 42 | 97.67 | Satisfactory |
| 1.25–2.5 | 1 | 2.33 | Marginal |
| Greater than 2.5 | 0 | 0.00 | Unsatisfactory |
| Magnesium absorption ratio | |||
| Less than 50 | 18 | 41.86 | Suitable |
| Greater than 50 | 25 | 58.14 | Unsuitable |
| Permeability index | |||
| Greater than 75 | 0 | 0.00 | Class I |
| 75–25 | 39 | 90.70 | Class II |
| Less than 25 | 4 | 9.30 | Class III |
| Kelly ratio | |||
| Less than 1 | 38 | 88.37 | Good |
| 1–2 | 5 | 11.63 | Doubtful |
| Greater than 2 | 0 | 0.00 | Unsuitable |
| Variables | Principal Component (PC) | |||||
|---|---|---|---|---|---|---|
| 1 | 2 | 3 | 4 | 5 | 6 | |
| pH | 0.06 | −0.23 | 0.49 | 0.40 | 0.52 | −0.05 |
| TDS | −0.24 | 0.56 | 0.18 | −0.22 | 0.16 | 0.28 |
| TH | 0.23 | 0.34 | 0.48 | 0.12 | 0.03 | −0.05 |
| EC | 0.14 | −0.35 | −0.39 | 0.42 | −0.10 | 0.45 |
| Ca2+ | 0.59 | 0.27 | −0.19 | 0.30 | −0.15 | −0.35 |
| Mg2+ | 0.55 | 0.50 | −0.19 | 0.25 | −0.18 | 0.06 |
| Na+ | 0.71 | −0.11 | −0.01 | −0.53 | 0.22 | 0.28 |
| K+ | 0.28 | 0.33 | −0.09 | 0.48 | 0.38 | −0.10 |
| Cl− | 0.86 | −0.07 | −0.20 | −0.28 | −0.10 | −0.02 |
| HCO3− | 0.04 | 0.03 | −0.43 | −0.03 | 0.75 | 0.25 |
| SO42− | 0.62 | −0.15 | 0.63 | −0.10 | 0.02 | 0.08 |
| NO3− | 0.29 | −0.57 | 0.14 | 0.34 | −0.17 | 0.25 |
| F− | 0.14 | −0.418 | −0.19 | −0.18 | 0.27 | −0.68 |
| Total | 2.64 | 1.62 | 1.45 | 1.33 | 1.26 | 1.13 |
| % variance | 20.33 | 12.43 | 11.13 | 10.23 | 9.68 | 8.69 |
| Cumulative % | 20.33 | 32.76 | 43.89 | 54.12 | 63.80 | 72.49 |
| Parameters | Minimum | Maximum | Mean |
|---|---|---|---|
| Chloro-alkaline index (CAI) | |||
| CAI-I | −1.30 | 1.86 | −0.05 |
| CAI-II | −2.86 | 0.84 | −0.24 |
| Saturation index | |||
| Anhydrite | −0.75 | 0.97 | 0.47 |
| Aragonite | 2.31 | 3.70 | 2.91 |
| Calcite | 2.46 | 3.84 | 3.05 |
| Dolomite | 4.12 | 7.60 | 5.98 |
| Fluorite | 0.36 | 2.40 | 1.43 |
| Gypsum | −0.46 | 1.26 | 0.76 |
| Halite | −4.80 | −2.58 | −3.56 |
Disclaimer/Publisher’s Note: The statements, opinions and data contained in all publications are solely those of the individual author(s) and contributor(s) and not of MDPI and/or the editor(s). MDPI and/or the editor(s) disclaim responsibility for any injury to people or property resulting from any ideas, methods, instructions or products referred to in the content. |
© 2023 by the authors. Licensee MDPI, Basel, Switzerland. This article is an open access article distributed under the terms and conditions of the Creative Commons Attribution (CC BY) license (https://creativecommons.org/licenses/by/4.0/).
Share and Cite
Panneerselvam, B.; Ravichandran, N.; Kaliyappan, S.P.; Karuppannan, S.; Bidorn, B. Quality and Health Risk Assessment of Groundwater for Drinking and Irrigation Purpose in Semi-Arid Region of India Using Entropy Water Quality and Statistical Techniques. Water 2023, 15, 601. https://doi.org/10.3390/w15030601
Panneerselvam B, Ravichandran N, Kaliyappan SP, Karuppannan S, Bidorn B. Quality and Health Risk Assessment of Groundwater for Drinking and Irrigation Purpose in Semi-Arid Region of India Using Entropy Water Quality and Statistical Techniques. Water. 2023; 15(3):601. https://doi.org/10.3390/w15030601
Chicago/Turabian StylePanneerselvam, Balamurugan, Nagavinothini Ravichandran, Shunmuga Priya Kaliyappan, Shankar Karuppannan, and Butsawan Bidorn. 2023. "Quality and Health Risk Assessment of Groundwater for Drinking and Irrigation Purpose in Semi-Arid Region of India Using Entropy Water Quality and Statistical Techniques" Water 15, no. 3: 601. https://doi.org/10.3390/w15030601