Article

Effect of Rotational Speed on Pressure Pulsation Characteristics of Variable-Speed Pump Turbine Unit in Turbine Mode

1
Department of Energy and Power Engineering, Xihua University, Chengdu 610039, China
2
Department of Energy and Power Engineering, Tsinghua University, Beijing 100084, China
3
Hebei Fengning Pumped Storage Energy Co., Ltd., Chengde 067000, China
*
Author to whom correspondence should be addressed.
Water 2023, 15(3), 609; https://doi.org/10.3390/w15030609
Submission received: 8 January 2023 / Revised: 31 January 2023 / Accepted: 2 February 2023 / Published: 3 February 2023
(This article belongs to the Special Issue Advancements in the Complex Vortex Flow in Hydraulic Machinery)

Abstract

:
The pumped storage power station plays a vital role in modern power systems, where the key component is the pump turbine. Variable-speed operation can improve the operating efficiency of the pump turbine and increase the operating efficiency under turbine operating conditions and the automatic frequency regulation capability under pump operating conditions, thus obtaining higher efficiency and better stability. However, its operation characteristics are different from many conventional pumped storage units, which makes the study of variable-speed pump turbines more difficult. Therefore, in this paper, 10 representative pressure monitoring points are selected in the model to compare and study the flow characteristics and pressure pulsation characteristics of a variable-speed pump turbine at three speeds (N1-398.57 m/s, N2-412.16 m/s, and N3-428.6 m/s). According to our results, it is shown that the maximum pressure and pressure pulsation are small at low rotational speeds, which means that the unit will maintain better stability during the reduction in rotational speed and reducing the speed will not affect the safety and stability of the equipment. The purpose of this paper is to provide guidance for the safe operation of the unit and to improve the effect of speed in terms of dynamic behavior of variable-speed water pump turbine units. Meanwhile, this study will lay the groundwork for the optimal design of variable-speed pump turbines.

1. Introduction

Among the many energy storage technologies, pumped storage stands out among renewable energy sources such as wind and solar due to its excellent technical availability [1]. Pumped hydro storage is a more mature method of energy storage in the market today. It can use the gravitational potential energy of water, and has the characteristics of faster and more flexible regulation, higher efficiency, and larger scale of energy storage [2]. Pumped storage power plants have a crucial impact on modern power systems, providing two primary benefits: pumped storage and power generation [3]. As the most developed technology and the most cost-effective method of storing energy on a large scale [4,5], it is a green energy source that can be relied on for a long time. At present, the normal-speed pumped storage units solve the problems of frequent starting and stopping, switching working conditions, increasing and decreasing loads, and shifting peaks and valleys [5]. However, the units of conventional pumped storage power plants are fixed-speed units, which inherently have the disadvantages of non-adjustable power of the pump working condition, low efficiency of the hydraulic turbine working condition, and cannot operate in the best stability zone [6]. Variable-speed operation can improve the operation efficiency of the pump turbine and increase the automatic frequency regulation ability of the pump under working conditions, so as to obtain higher efficiency and better stability [7]. In recent years, the pressure pulsation characteristic is a very important indicator when assessing whether the equipment can operate safely and stably, and the complex and variable hydraulic conditions, especially the pressure pulsation, have put the hydraulic design and structural strength safety of the unit to a great test [8].
At present, many scholars have studied the pressure pulsation of constant-speed units more comprehensively. Wang et al. [9] performed transient calculations of the three-dimensional flow path of a pump turbine under low-flow conditions in three modes. The pressure pulsation of the pump turbine under the pump mode is mainly from the rotor–stator interface interference in the vaneless area between the guide vane and the runner, followed by the pressure pulsation between the runner and the cover, and the vortex rope vibration inside the draft tube under part-load operating conditions. The blade pass frequency represents the main frequency of pressure pulsation at this position. Zhang et al. [10] reviewed the rotational stall phenomenon in pump turbines and the fact that the rotational stall phenomenon causes low-frequency pressure pulsations in the runner. Svarstadand and Nielsen [11] investigated the pressure pulsations generated during the rapid changeover from pump to turbine operating mode and showed that even with different sizes and shapes of benches and generators there was still similarity, with the highest pressure amplitudes occurring in the power-off mode. Liu et al. [12] used numerical simulations to study the variation in pressure pulsation at different monitoring points under turbine operating conditions and to study the transfer characteristics of the pressure pulsations. The main frequency of pressure pulsation at the outlet of the guide vane varies with the pressure and suction surface of the guide vane, and the pressure pulsation generated by the rotating and stationary parts has different characteristics, with the rotating part having a small influence and the stationary part vice versa. Liao et al. [13] used both steady and transient numerical simulations to simulate the internal flow of a pump turbine and analyzed the internal flow field and pressure pulsations under small opening conditions. In turbine mode, pressure pulsation occurs in the vaneless region under small opening conditions. In addition, pressure pulsations (dominant frequency is the rotational frequency) also occur in the diversion pipe. This pressure fluctuation is related to the structure of the spiral vortex.
Pumped storage units with variable speed can improve the operating efficiency in the turbine model and increase the automatic frequency regulation capability in pump mode, which is helpful for improving the power grid stability. Therefore, the application of variable-speed pumped storage units is gradually becoming widespread [3,14]. I Iliev et al. [15] measured the pressure pulsation of a pump turbine in low specific speed turbine conditions operating at variable speed. For example, it is 1% more efficient contrasted to synchronous speed operation at optimal head, and 2.2% more efficient compared to a head 10% lower than optimal. Pavesi et al. [16] demonstrated that for lower rotational velocities, only the intensity and structure of the vortices undergo random changes. Liu et al. [17] describe the variable-speed regulation of variable-speed pump turbines under hydraulic turbine operating conditions. Uruba [18] detected the spatial structure responsible for the dominant oscillations in the water stream using the oscillatory mode decomposition OPD method. Yu et al. [19] obtained that the lower the speed of the variable-speed unit, the smaller the pressure pulsation in the bladeless zone, so the variable-speed unit is often operated at low speed in the turbine operating conditions. For variable-speed devices, the operating range of the turbine can be operated in the optimal working zone by reducing speed, thus obtaining higher efficiency and better stability.
Determining the pressure pulsation in variable-speed turbines depends on the choice of the numerical model. Under variable-speed operating conditions, the choice of turbulence model has a great influence on the calculation results of pressure pulsation and vortex flow [20], and scientists are constantly researching new computational techniques and building more detailed computational models to obtain more reliable results [21,22]. The RNG k-ε turbulence model [23] numerically predicts the pressure pulsation of a model Kaplan turbine using 3D unsteady turbulence simulations with complete flow paths, and this computational method of numerical prediction is effective for performance prediction at the design stage and/or operational optimization after experimenting and adjusting. The current k-ε model of shear stress transport (SST) is more widely used. The SST k-ω model improves on the BSL k-ω model, which also includes the definition of shear stress transport in turbulent flows in terms of turbulent viscosity, and the model shows good performance in predicting turbine pressure pulsations [24,25,26].
The focus of this study is on the flow feature of a variable-speed pump turbine in turbine mode, and the analysis of the effect of rotational speed on flow characteristics is explained by analyzing three rotational speed models. The ANSYS CFX was adopted as the computational fluid dynamics (CFD) tool. The results can provide leadership for the safe operation of the unit and provide a foundation for the optimized conception of the variable-speed pump turbine.

2. Numerical Method and Setup

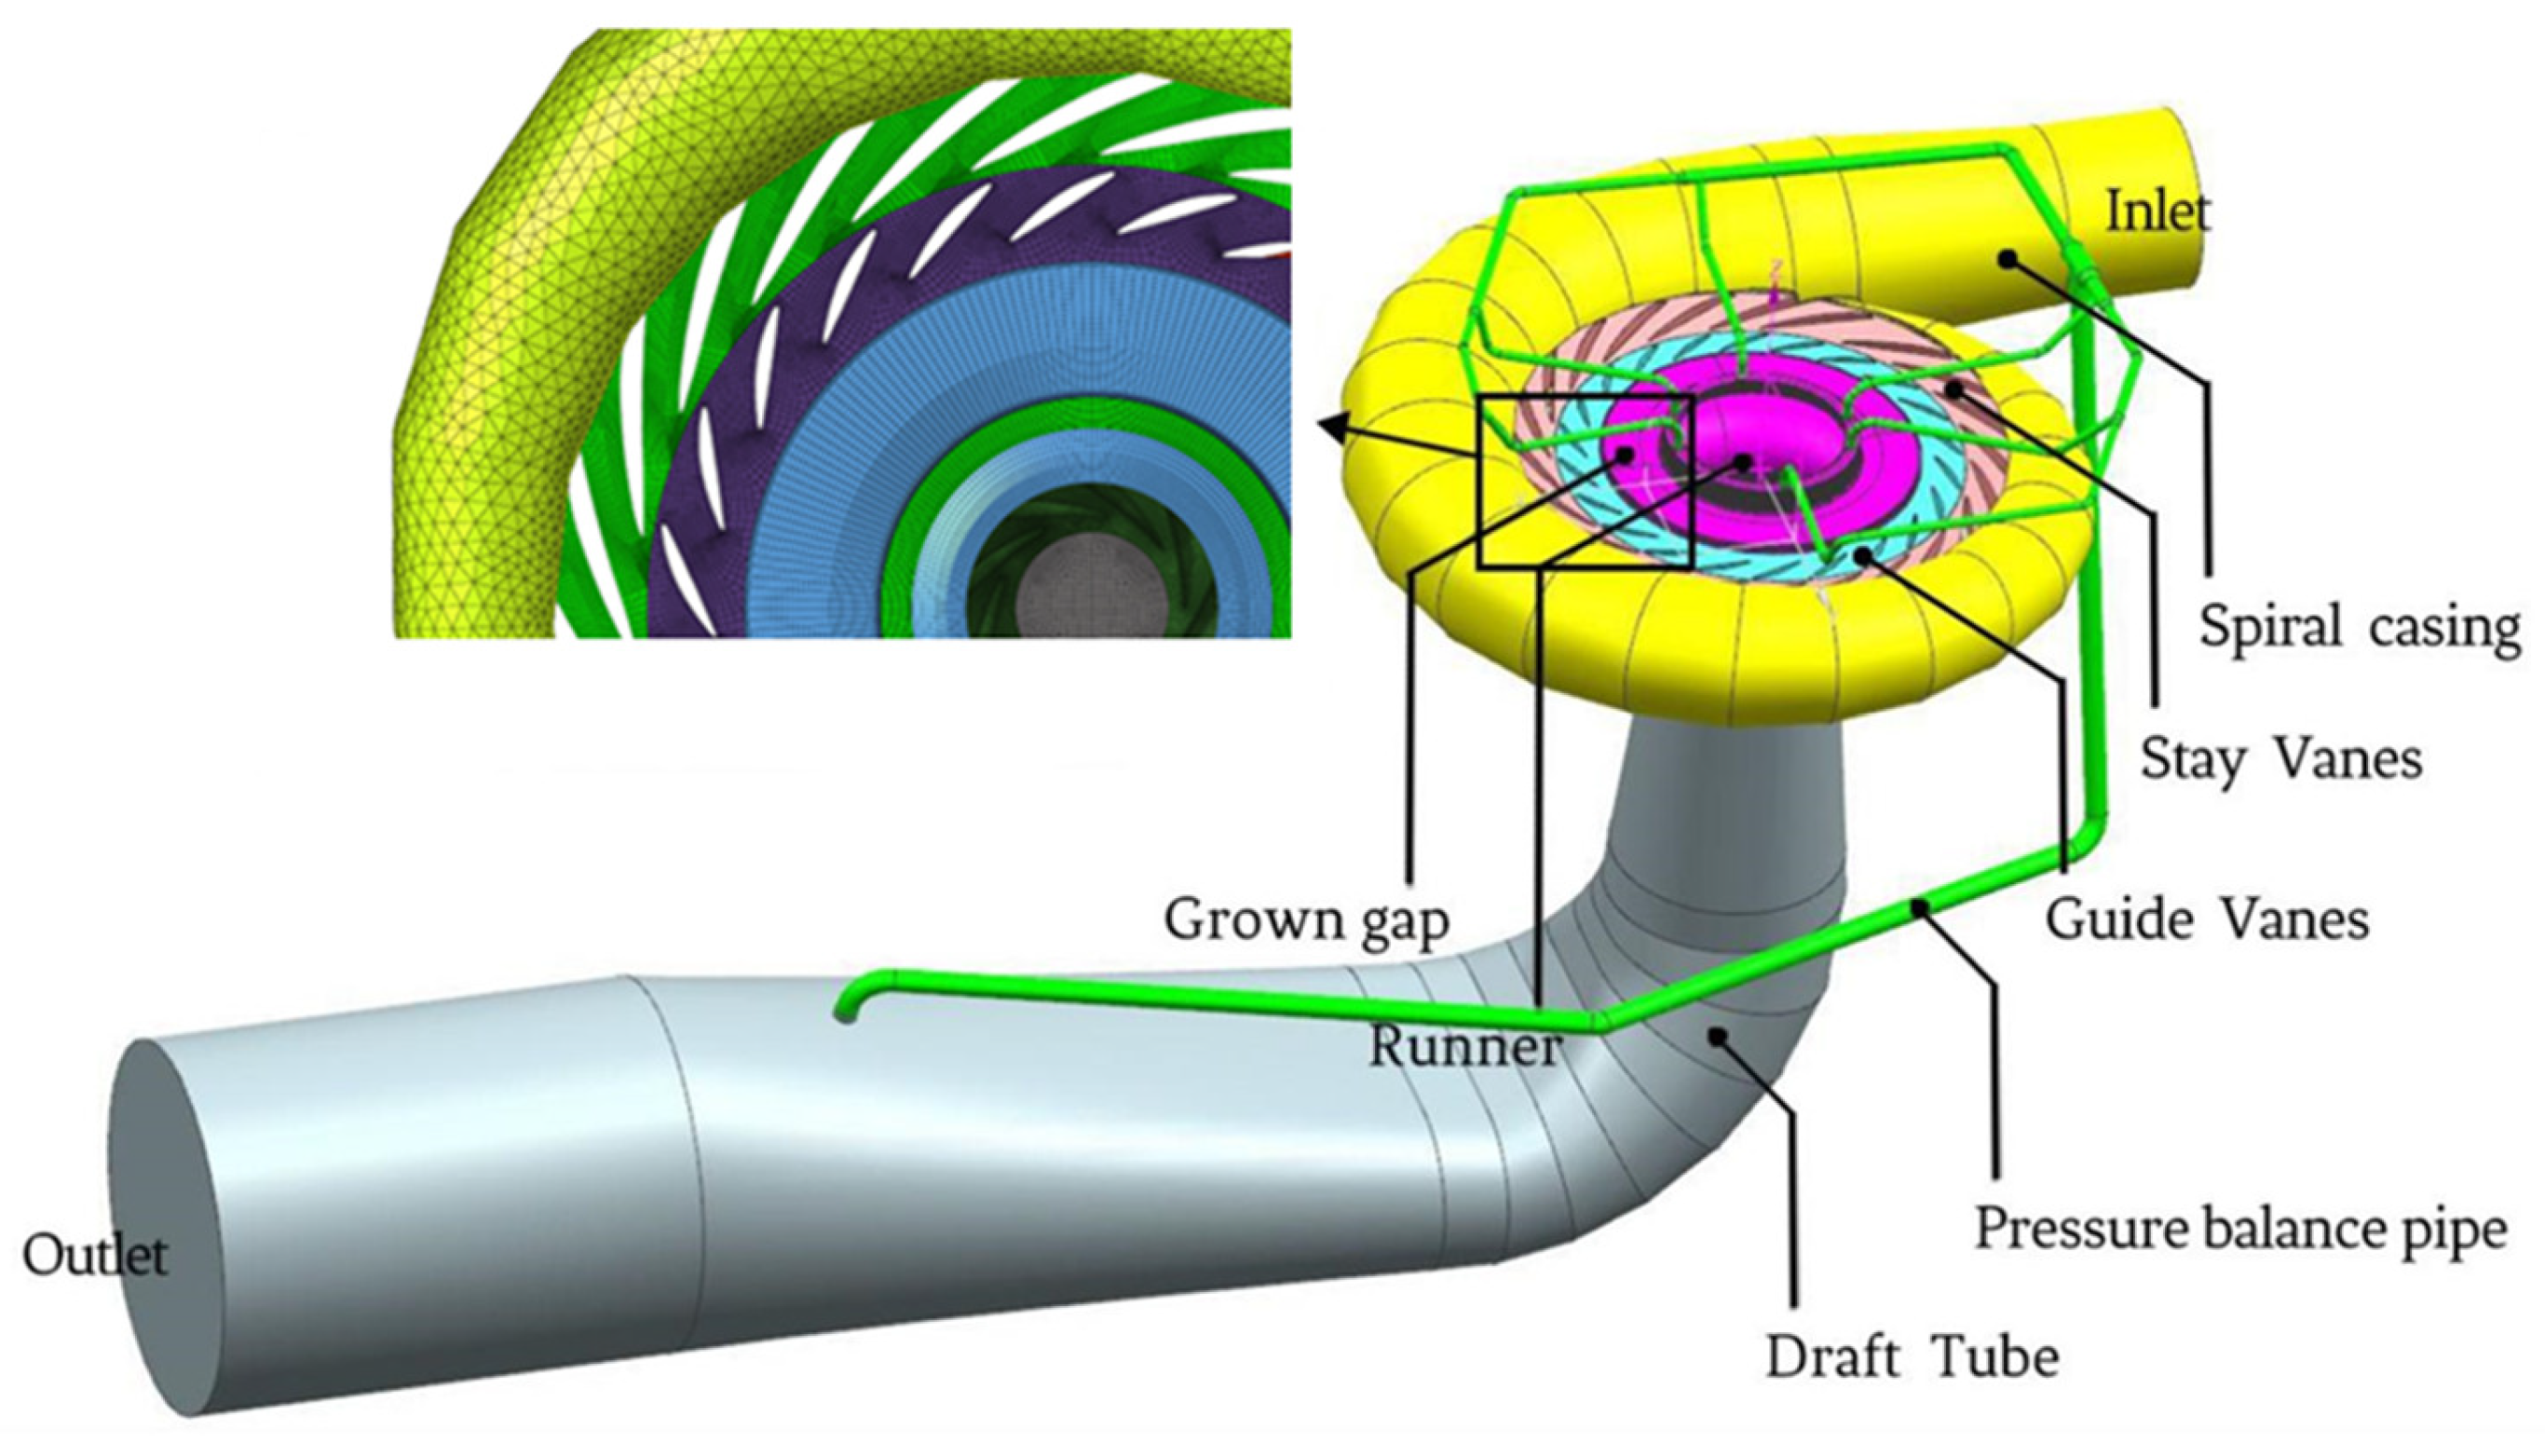
2.1. Pump Turbine Model

This paper analyzes a variable-speed pump turbine modeled according to the Fengning pumped storage power plant. The computational domain shown in Figure 1 is simulated. It includes 22 guide vanes, 22 stay vanes, 9 blades of the runner, a spiral case, and a draft tube. Hexahedral mesh is used for the spiral case, and a mixture of hexahedral mesh and tetrahedral mesh is used for the stay vanes, guide vanes, crown gap. Hexahedral meshes are used in the runner and draft tube. The mesh generated by ICEM CFD software is shown in Figure 1 and 4.4 ×   10 6 elements are employed in calculated domain, to meet the industrial unit parameters n 11 and Q 11 of the pump turbine, wherein n 11 = n D / H , Q 11 = Q / D 2 H .
As shown in Table 1, the three speed models (the three speed models determined by the operating conditions of the prototype) were selected for the calculation and analysis, wherein N1-N2 is the speed range in variable-speed mode, and N3 is the max operating speed. In this way, the effect of speed on the variable-speed pump turbine pressure pulsation can be determined (398.57 m/s, 412.16 m/s, and 428.6 m/s for N1–N3, respectively).

2.2. Grid Independence

In order to verify the grid independence, several sets of whole mesh were divided and compared, and the mesh quality which is judged by quality item in ICEM was above 0.5, which could meet the simulation conditions. An efficiency check of the turbine design conditions was performed in Figure 2, and the measured results are shown in Table 2.

2.3. CFD Simulation Setup

The SST k-ω model combines the merits of the Wilcox k-ω model and the standard k-ε model. The shear stress transport (SST) k-ω model is successfully used in the simulations of pump turbines [27,28]. In this paper, we use the turbulence equation.
The equations are as follows:
u i ¯ x i = 0
ρ u i ¯ t + ρ u j ¯ u i ¯ x j = ρ f j p ¯ x i + μ u i ¯ x j ρ u i u j ¯ x j
where u i ¯ denotes the Reynolds averaged velocity components along the Cartesian coordinate axes, x i , ρ u i u j ¯ are the Reynolds stresses for the turbulent flow, p ¯ is the averaged pressure, 𝜌 is the fluid density, 𝜇 is the kinetic viscosity of the fluid, and f i are the body forces acting on the unit volume fluid.
In the equations:
ρ k t + ρ u i k x i = P k 3 2 l k ω + μ + σ k μ t k x i x i
ρ ω t + ρ u i ω x i = C ω P β ρ ω 2 + μ l + σ ω μ t ω x i x i + 2 1 F 1 ρ σ ω 2 ω k x i ω x i
where l k ω = k 1 2 β k ω is the turbulence scale, μ is dynamic viscosity, P is the production term, C ω is the production term coefficient, F 1 is the blending function, and σ k , σ ω , and β k are model constants.

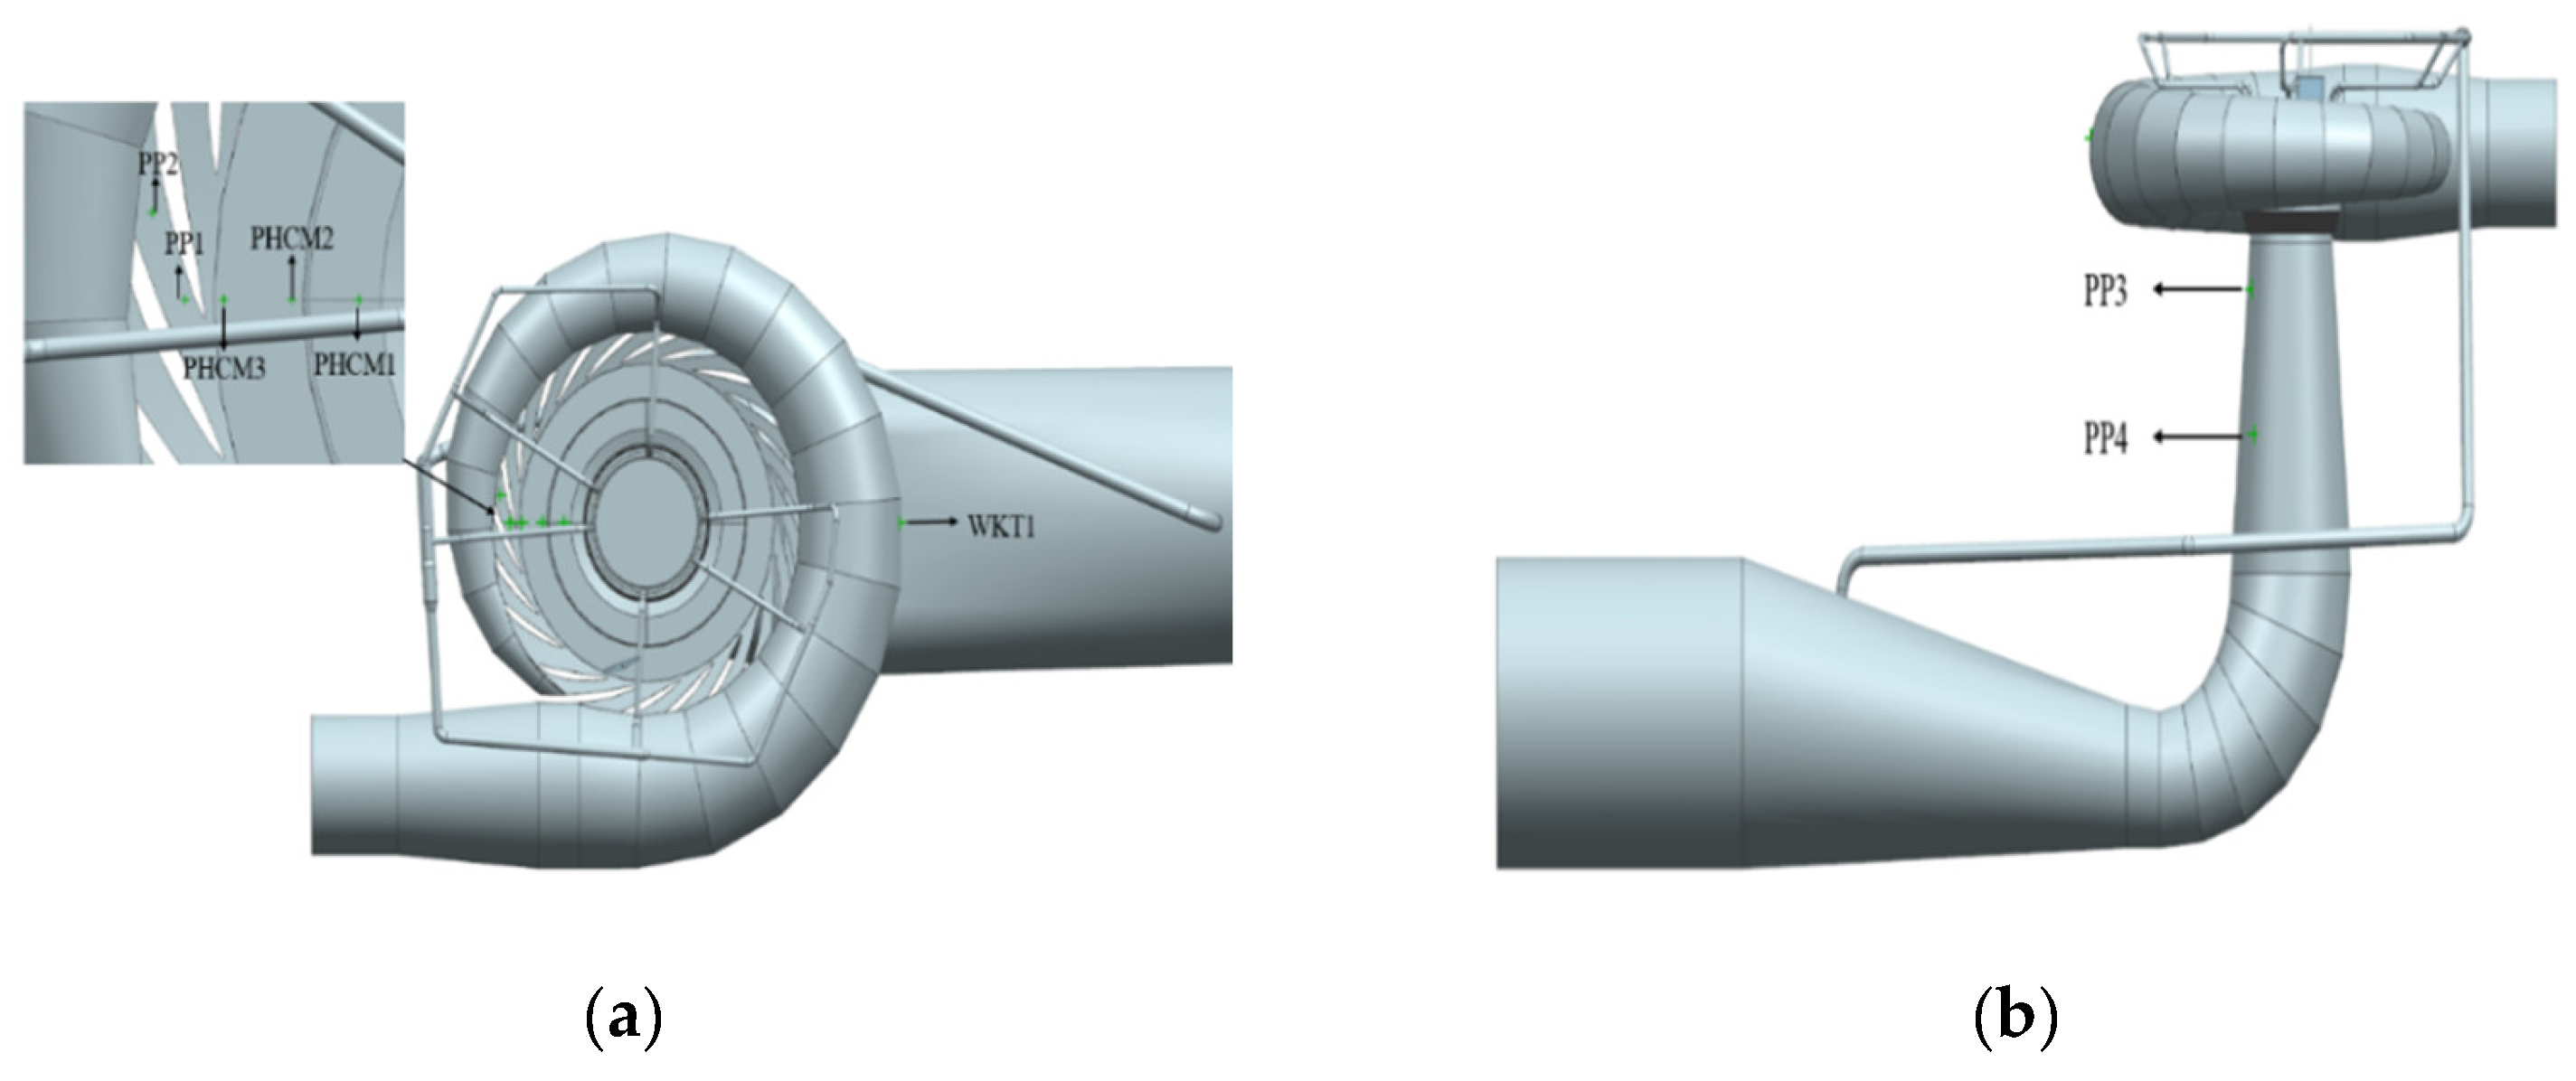
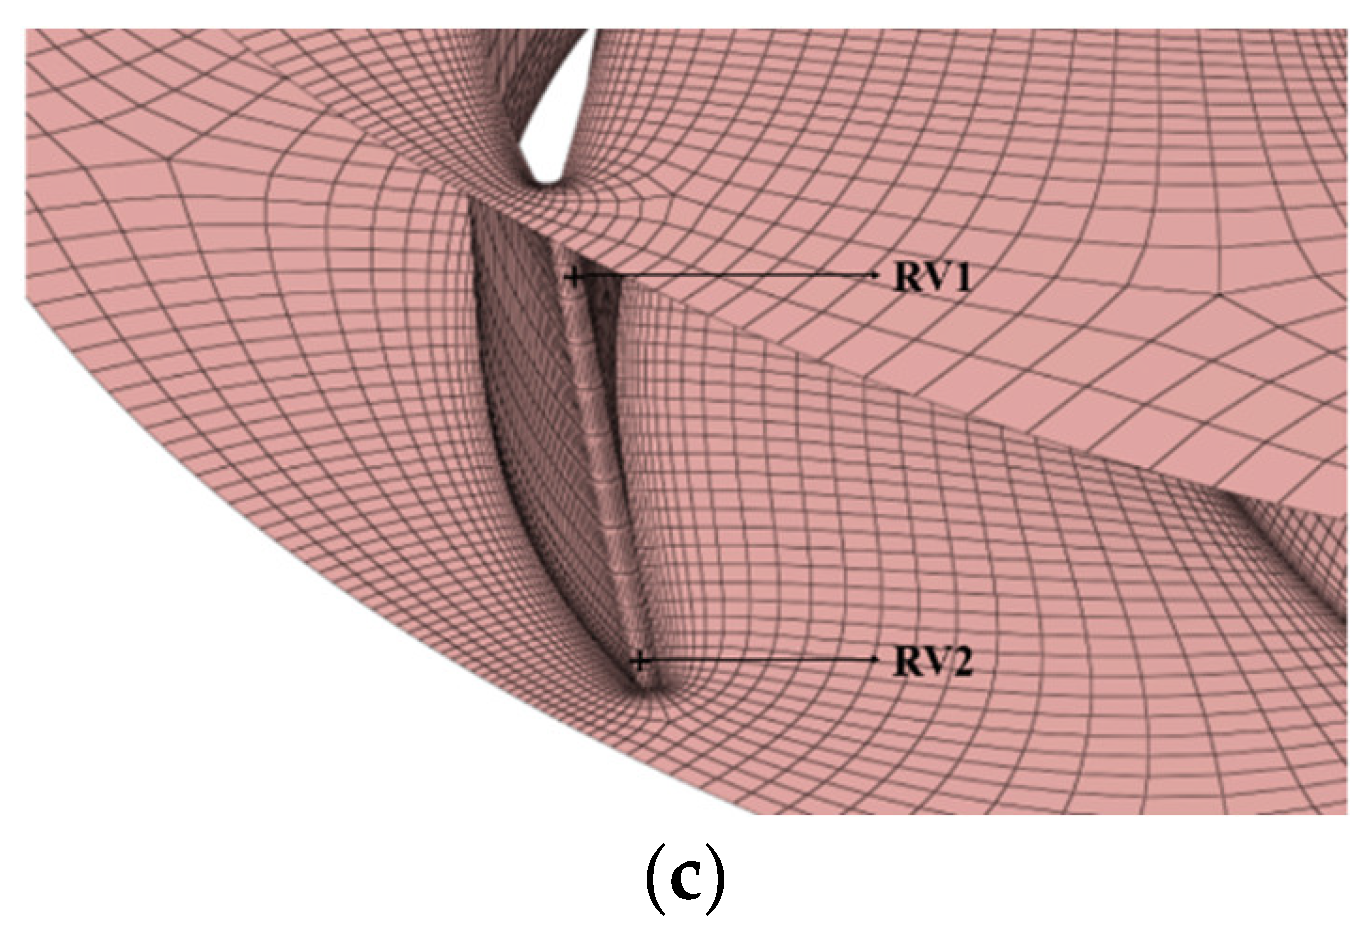
2.4. Operating Conditions and Monitoring Points

Adjusting the rotational speed has a very significant influence on the pressure pulsation of the variable-speed pump turbine. For variable-speed units in turbine operation, the effect of pressure pulsation in the vane-free zone can be reduced by reducing the speed, resulting in higher efficiency and better stability. Therefore, the operating conditions of three typical water pump turbines were analyzed and compared separately. In addition, the pressure pulsations were calculated for the three CFD models (N1∼N3).
Ten pressure monitoring points from the prototype were selected for observation and calculation, as shown in Figure 3. One monitoring point (WKT1) was measured at the spiral case and two monitoring points (PP1 and PP2) at the stay vane. There are two monitoring points PP3 and PP4 on the draft tube wall. There are two monitoring points (PHCM2 and PHCM3) at the guide vane. Two monitoring points (RV1 and RV2) were measured at the runner surface and one monitoring point (PHCM1) was analyzed at the crown gap. The time step was 0.001 s, the duration of the simulation was 0.642 s, and the time to start saving the signal for analysis was 0.141 s.

3. Results and Discussion

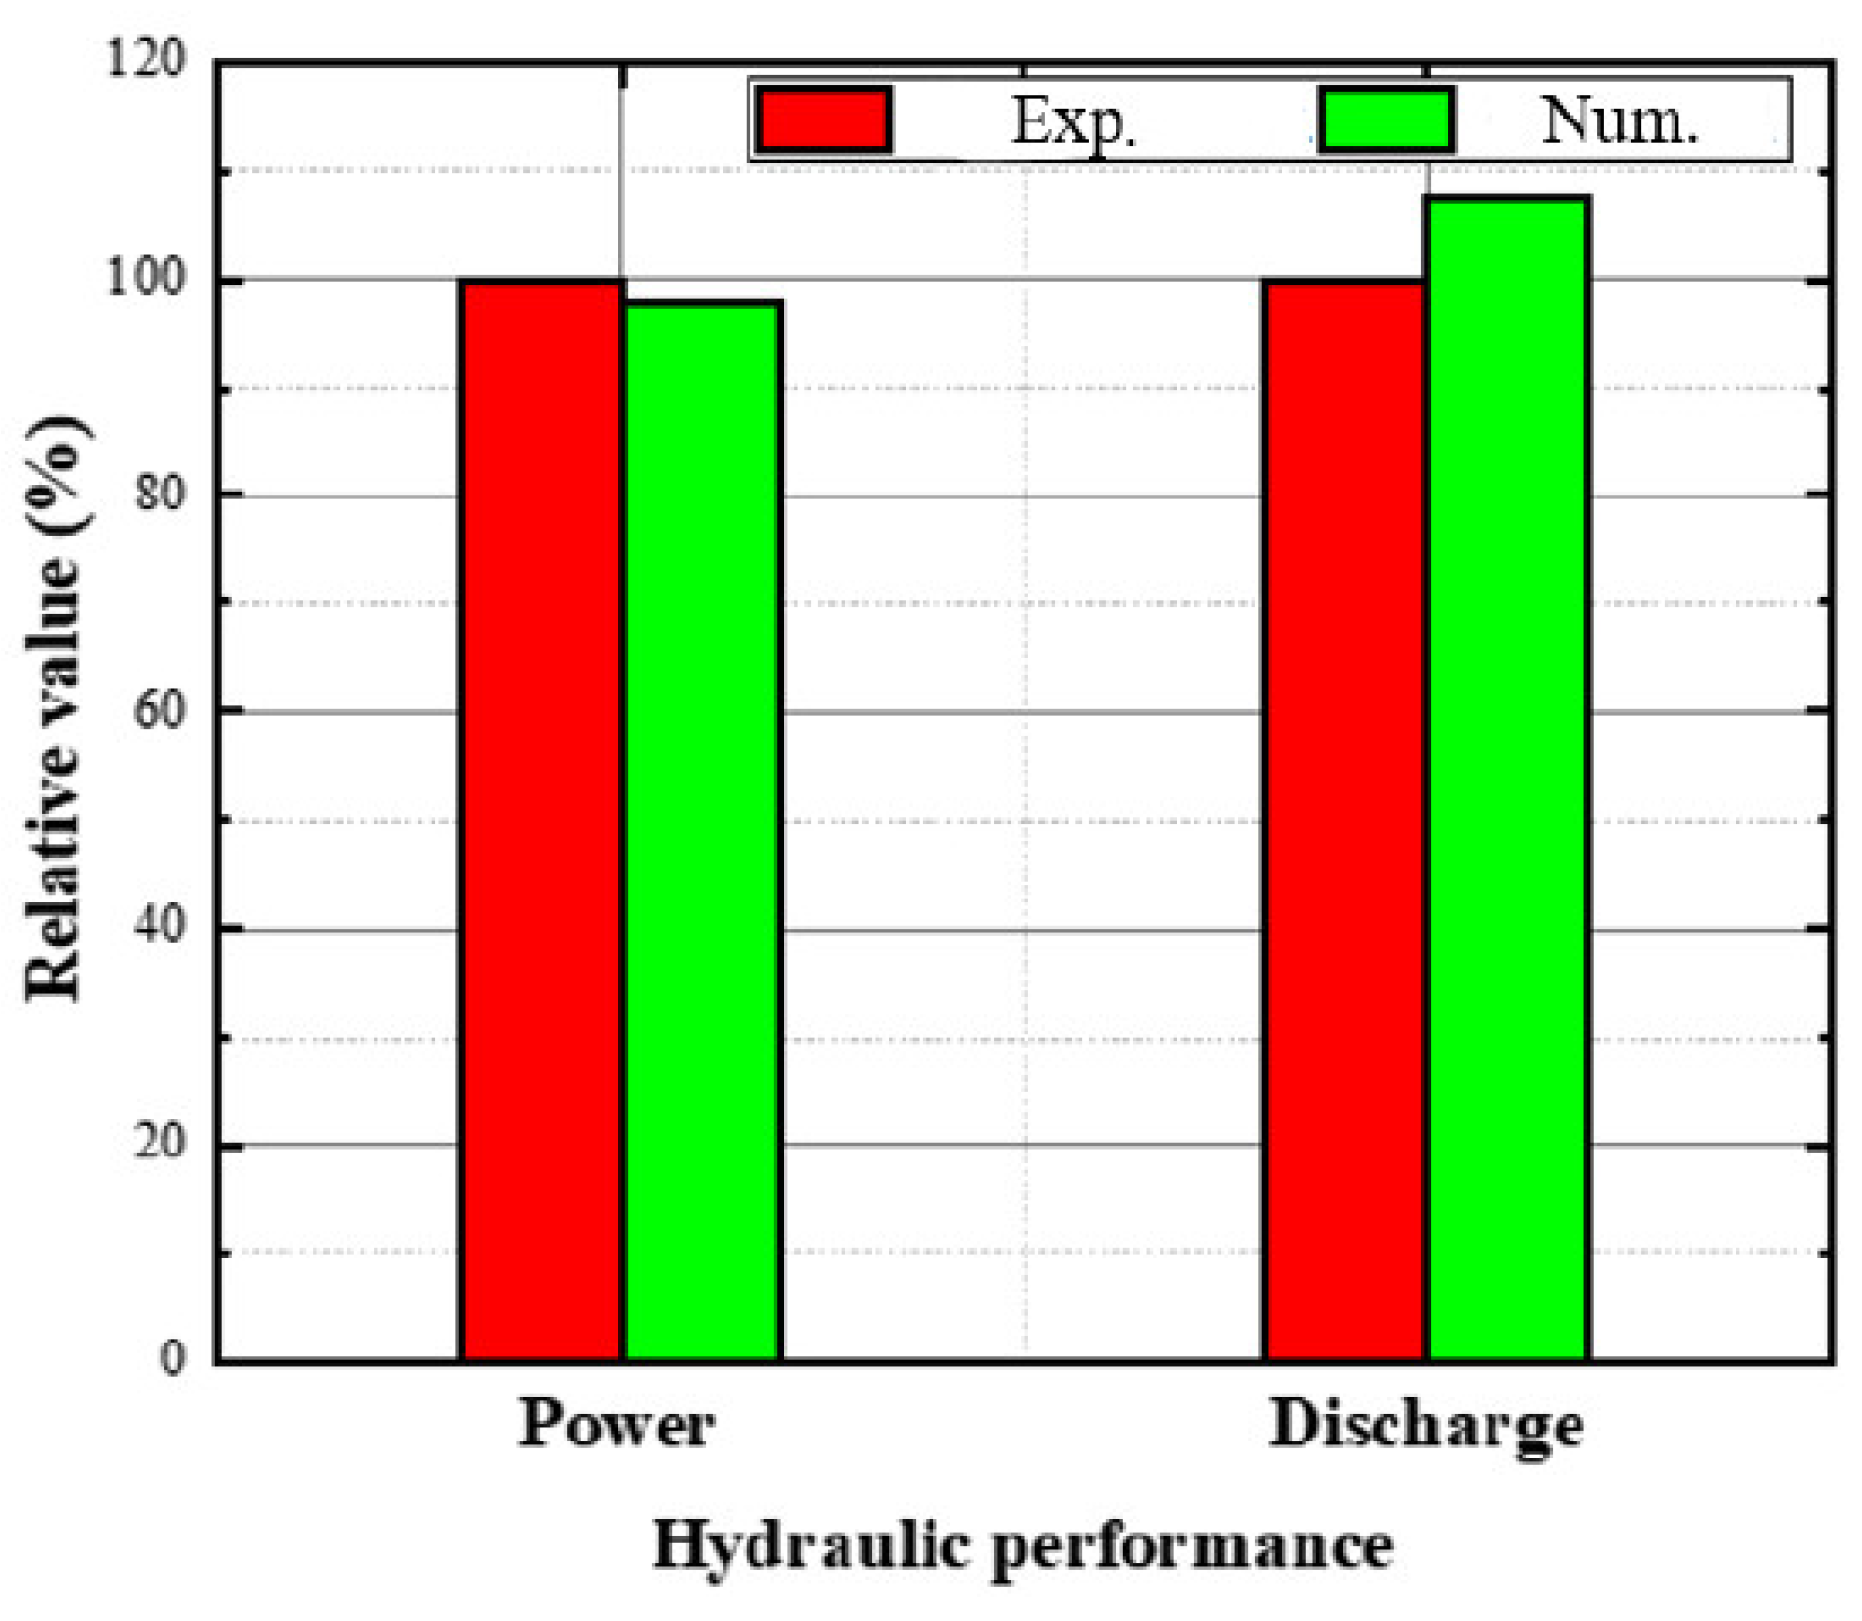
3.1. Numerical Method Verification

The power and discharge at rated operating conditions were used to validate the numerical method, in Figure 2, where the computed hydraulic performance was normalized to the values of the experimental results. We can see that the consequences are similar to the text results. The discrepancy in the output is 2.05% and the discrepancy in the flow rate is 7.62%.

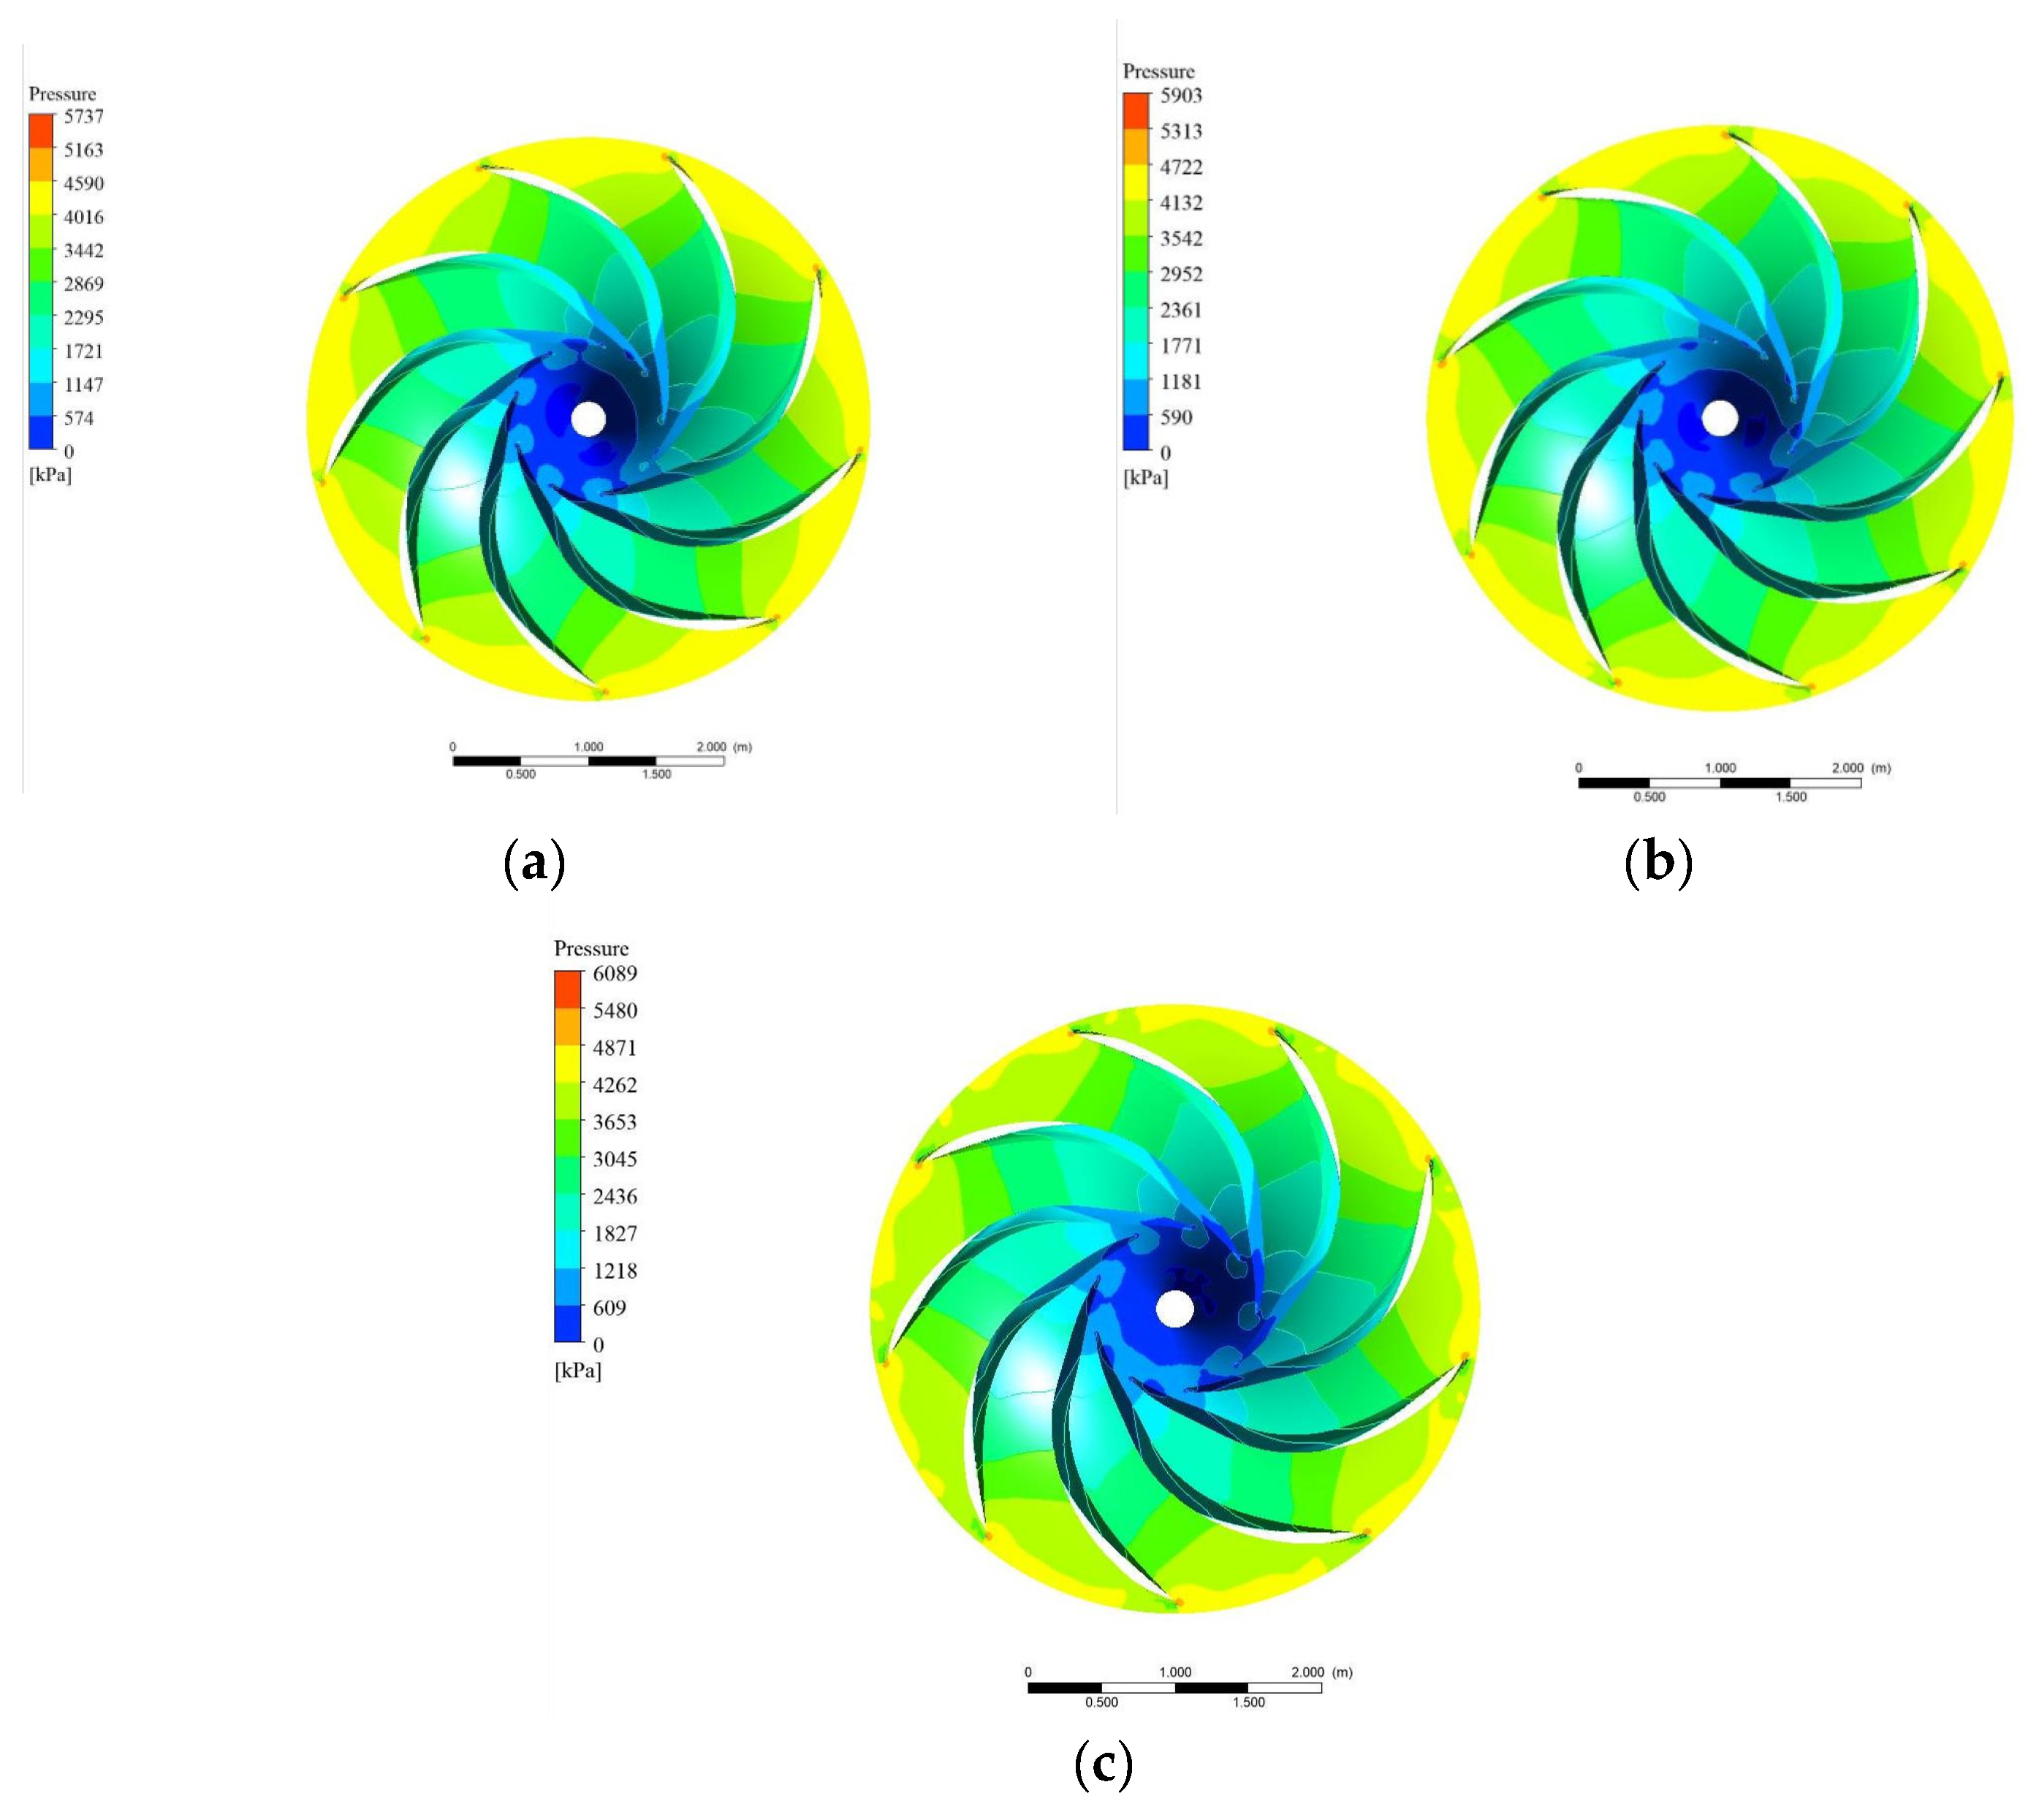
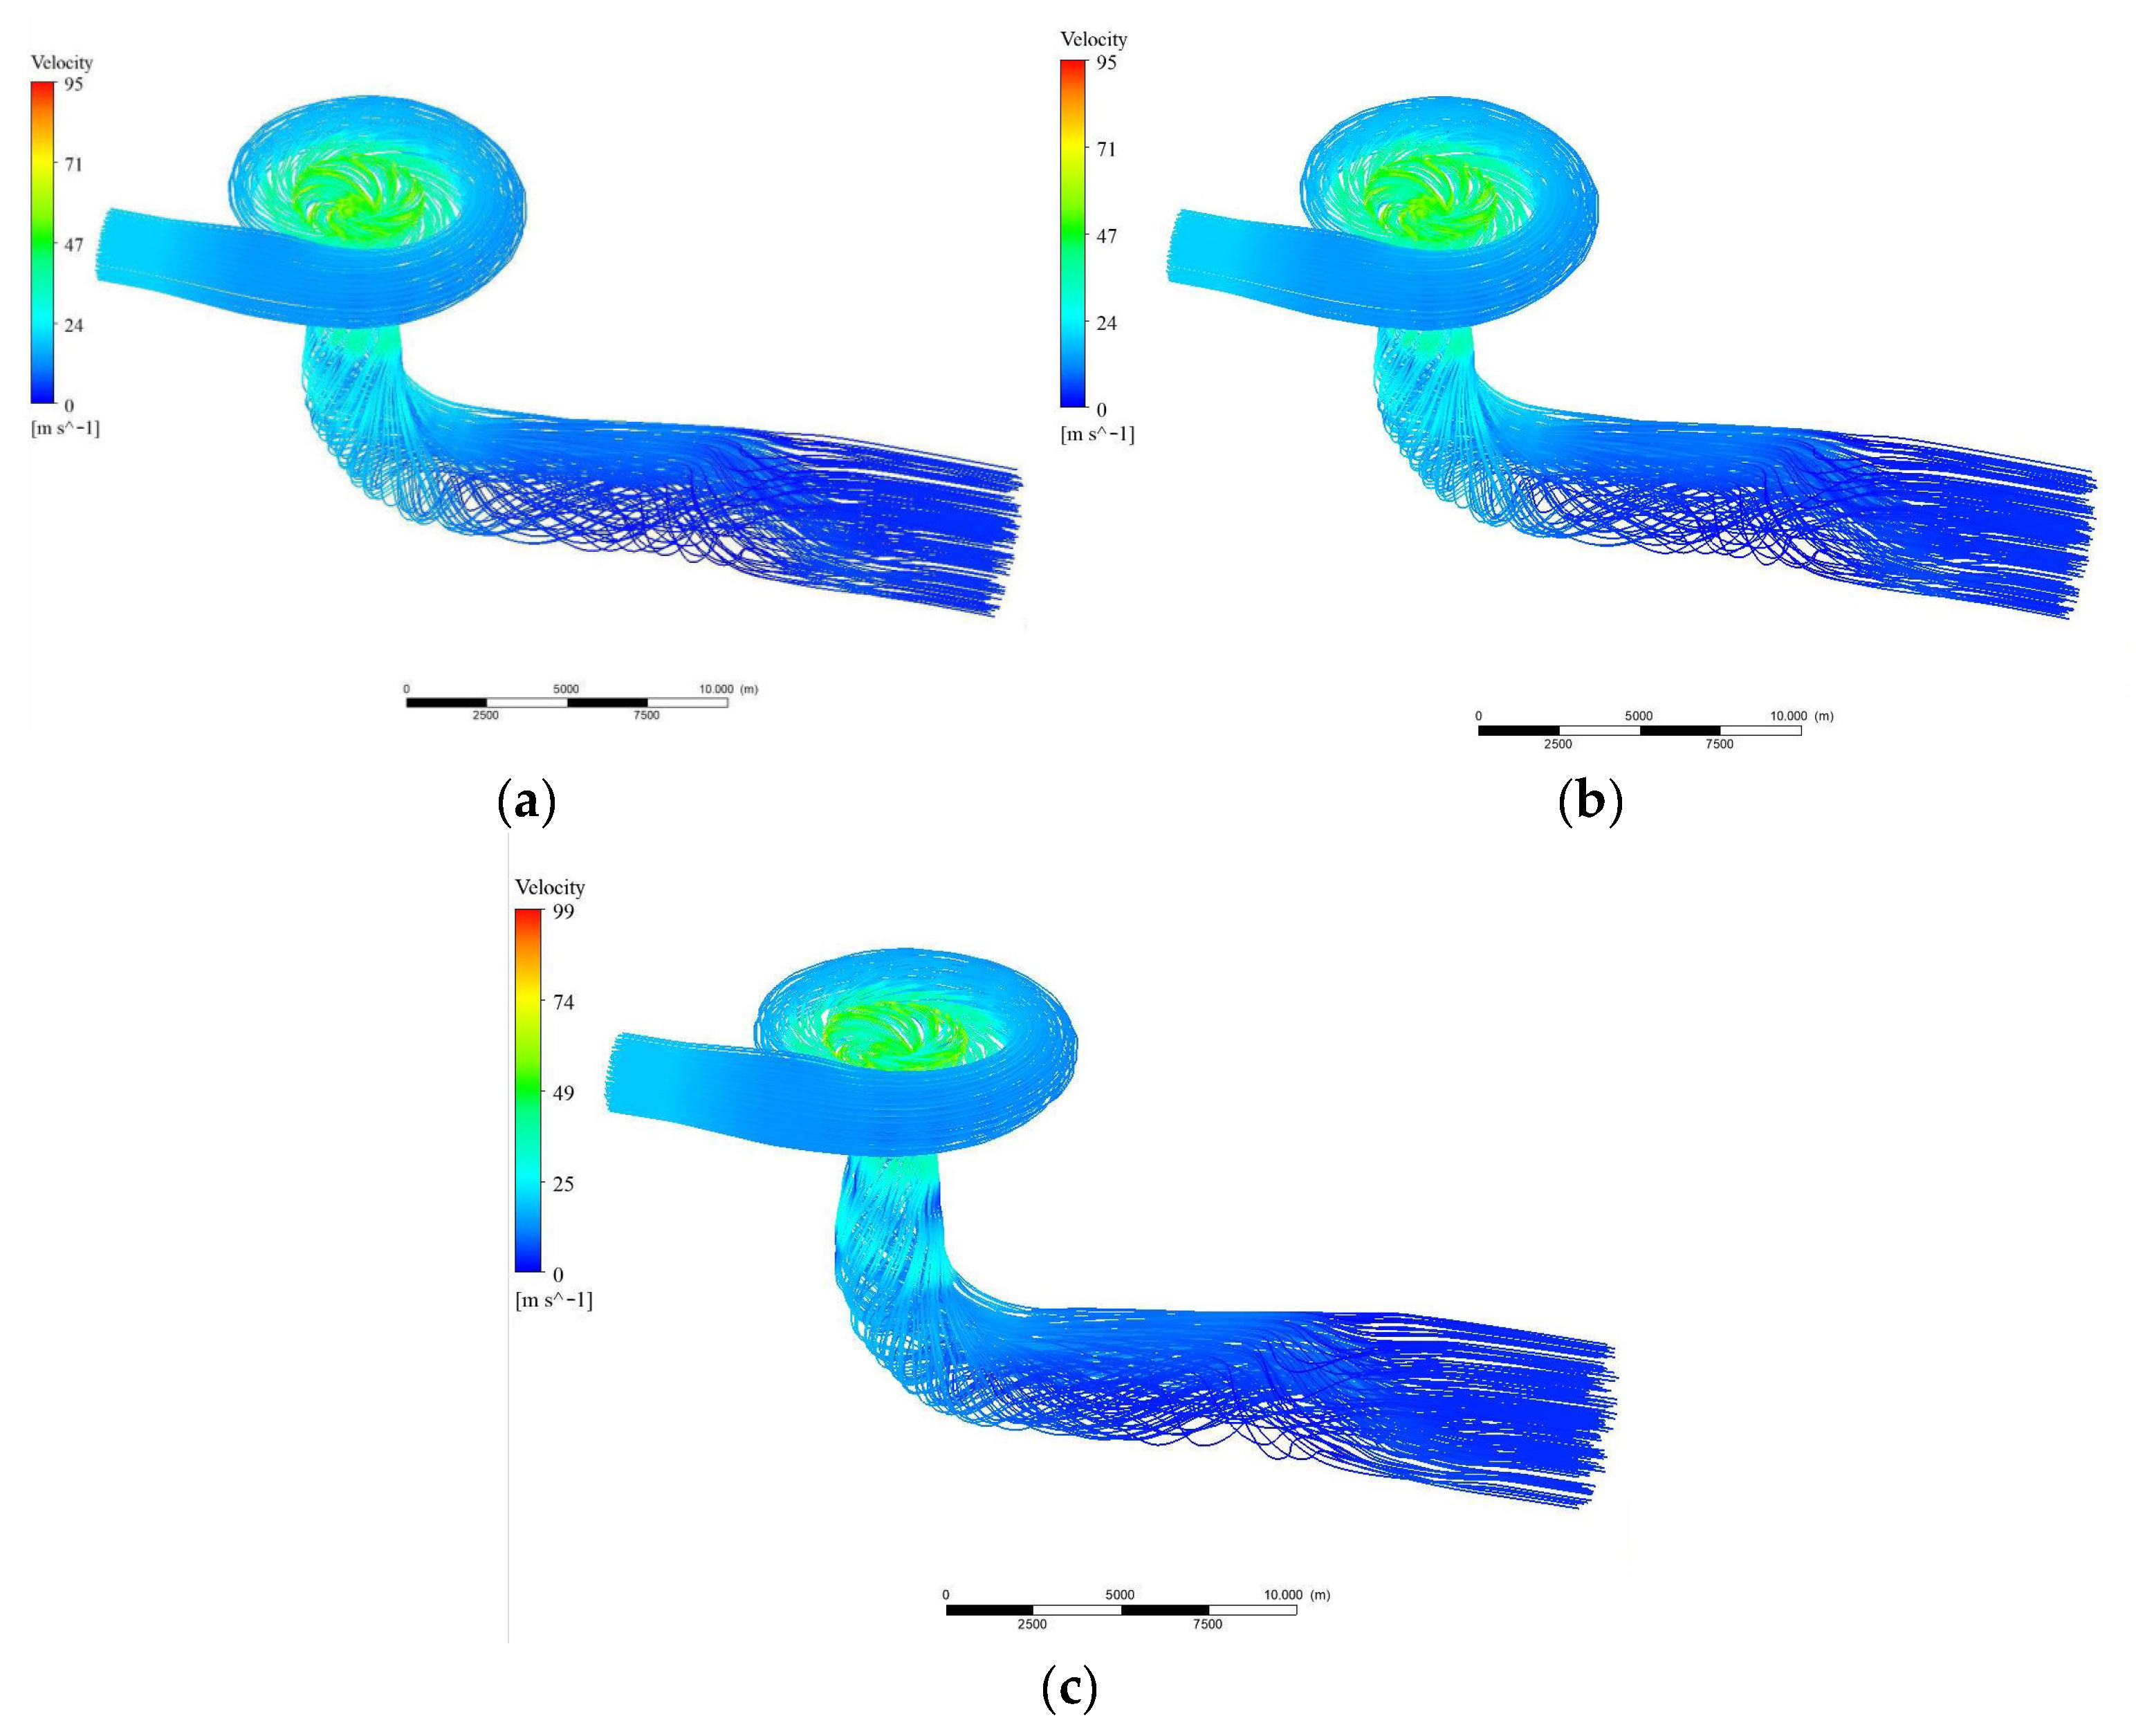
3.2. Flow Characteristics

The pressure distribution at the runner inner surface provides more intuitive comparison, as shown in Figure 4. The pressure is maximum at the crown and minimum at the drain cone, and the maximum pressure at the crown becomes larger as the speed increases. The maximum pressure on the runner surface increases with the rotational speed from 5737 kPa in N1 to 6089 kPa in N3. In other words, the increase in speed is accompanied by an increase in centrifugal force, and then the increase the maximum pressure on the runner surface.
In the analysis of the pressure pulsation features at the three rotational speeds, the streamline in N1-N3 was drawn in Figure 5. We can see clearly that the flow lines in the flow path are generally smooth, but some vortices appear in the draft tube. The streamline inside the draft tube gradually becomes more chaotic with the increase in the rotational speed; in other words, the growth in the rotational speed leads to a growth in the vortex flow in the flow path. Therefore, the growth in pressure pulsation amplitude may be caused by the increase in rotational speed.

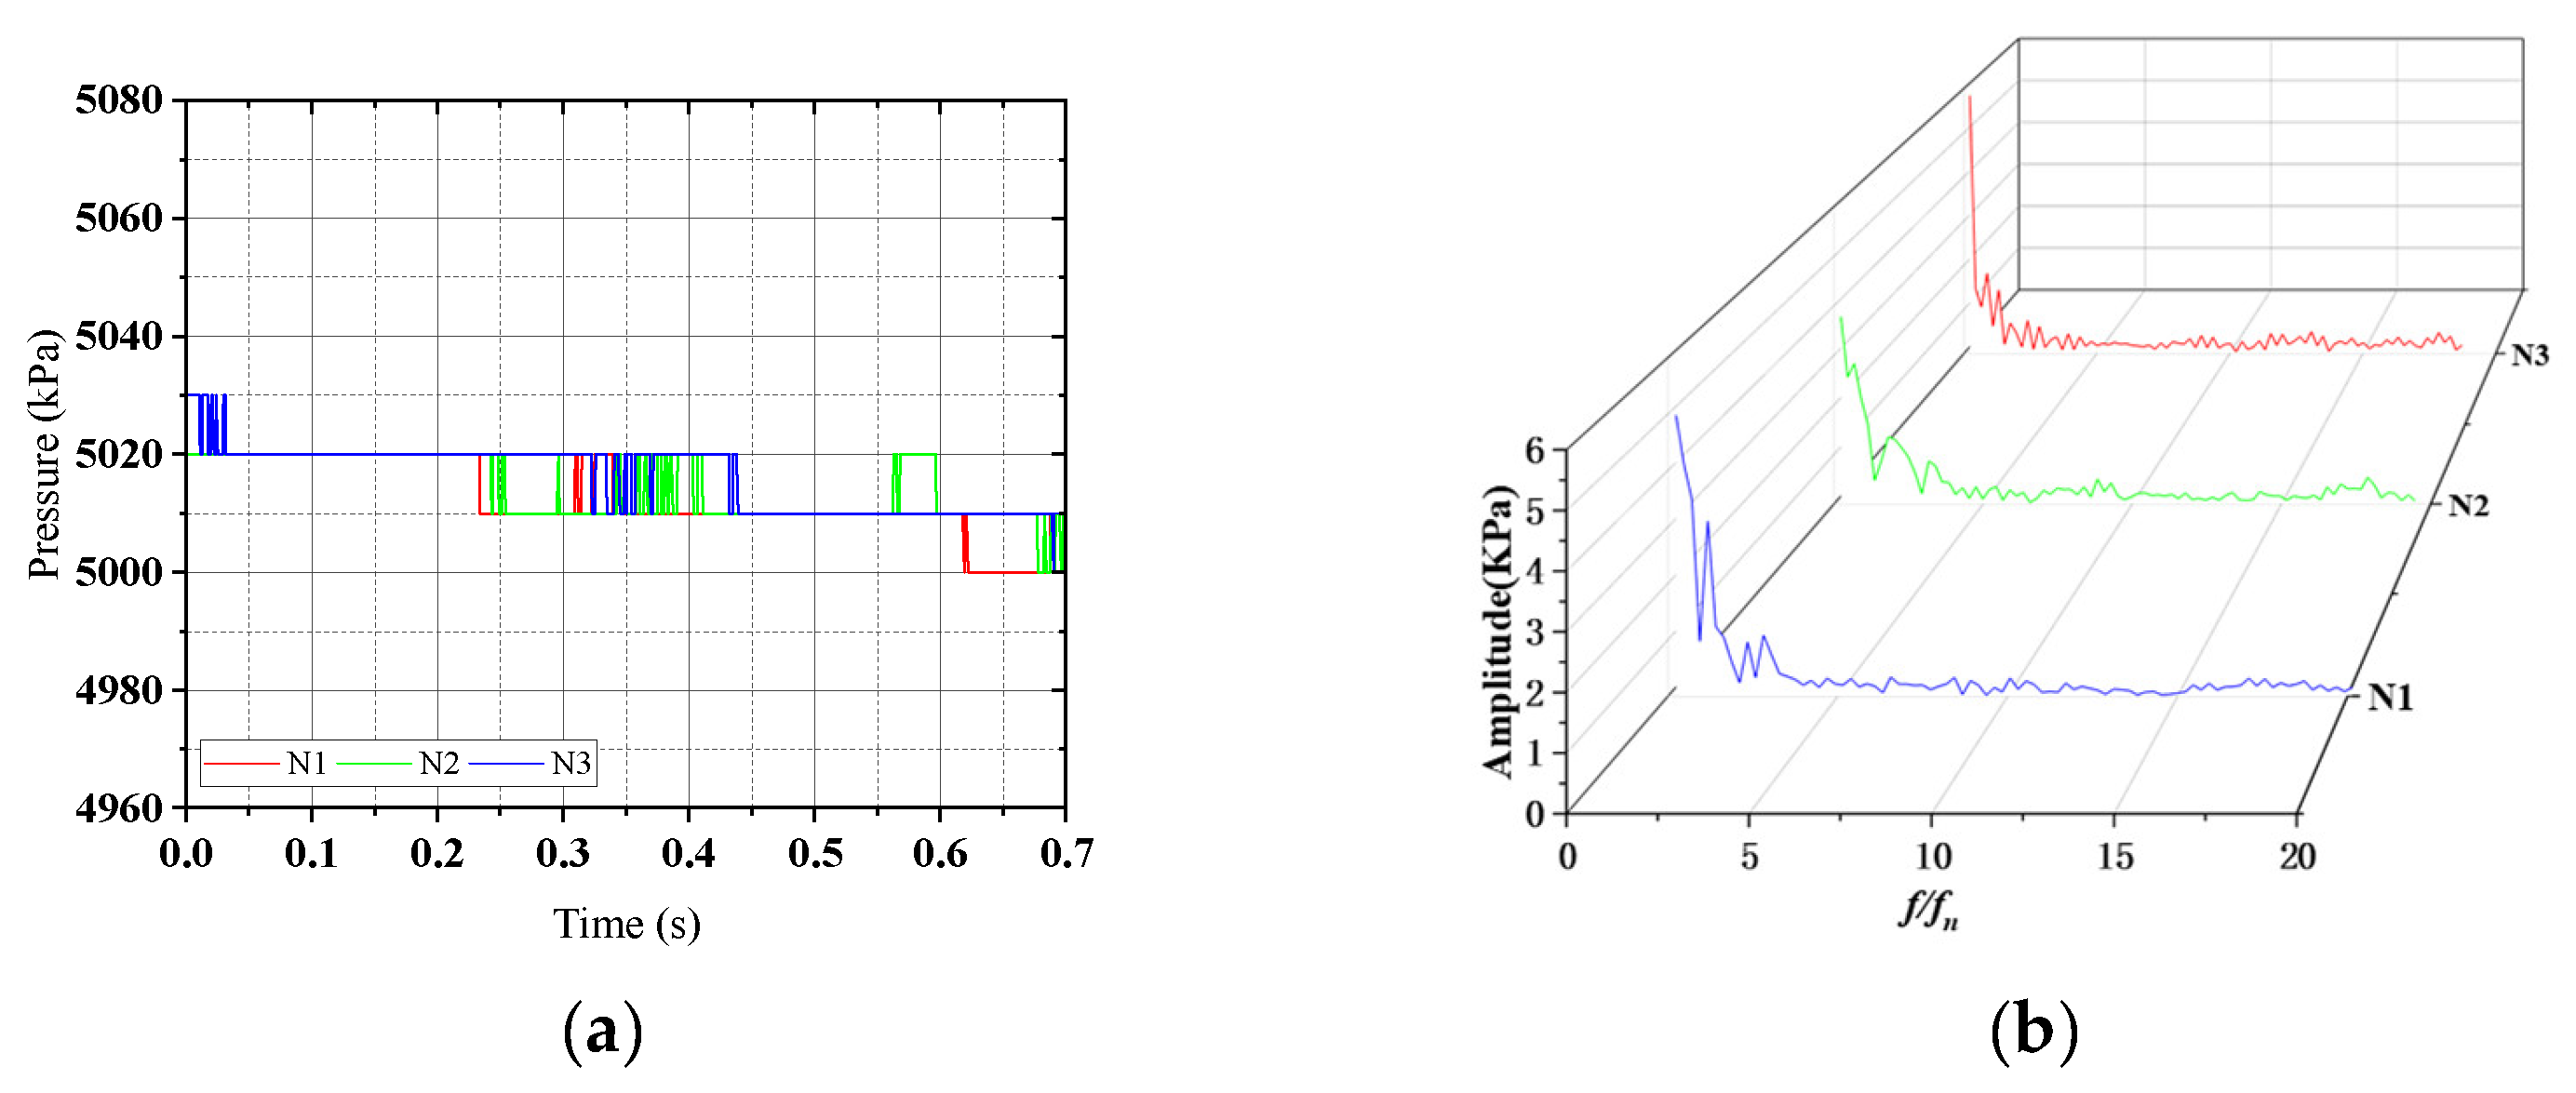
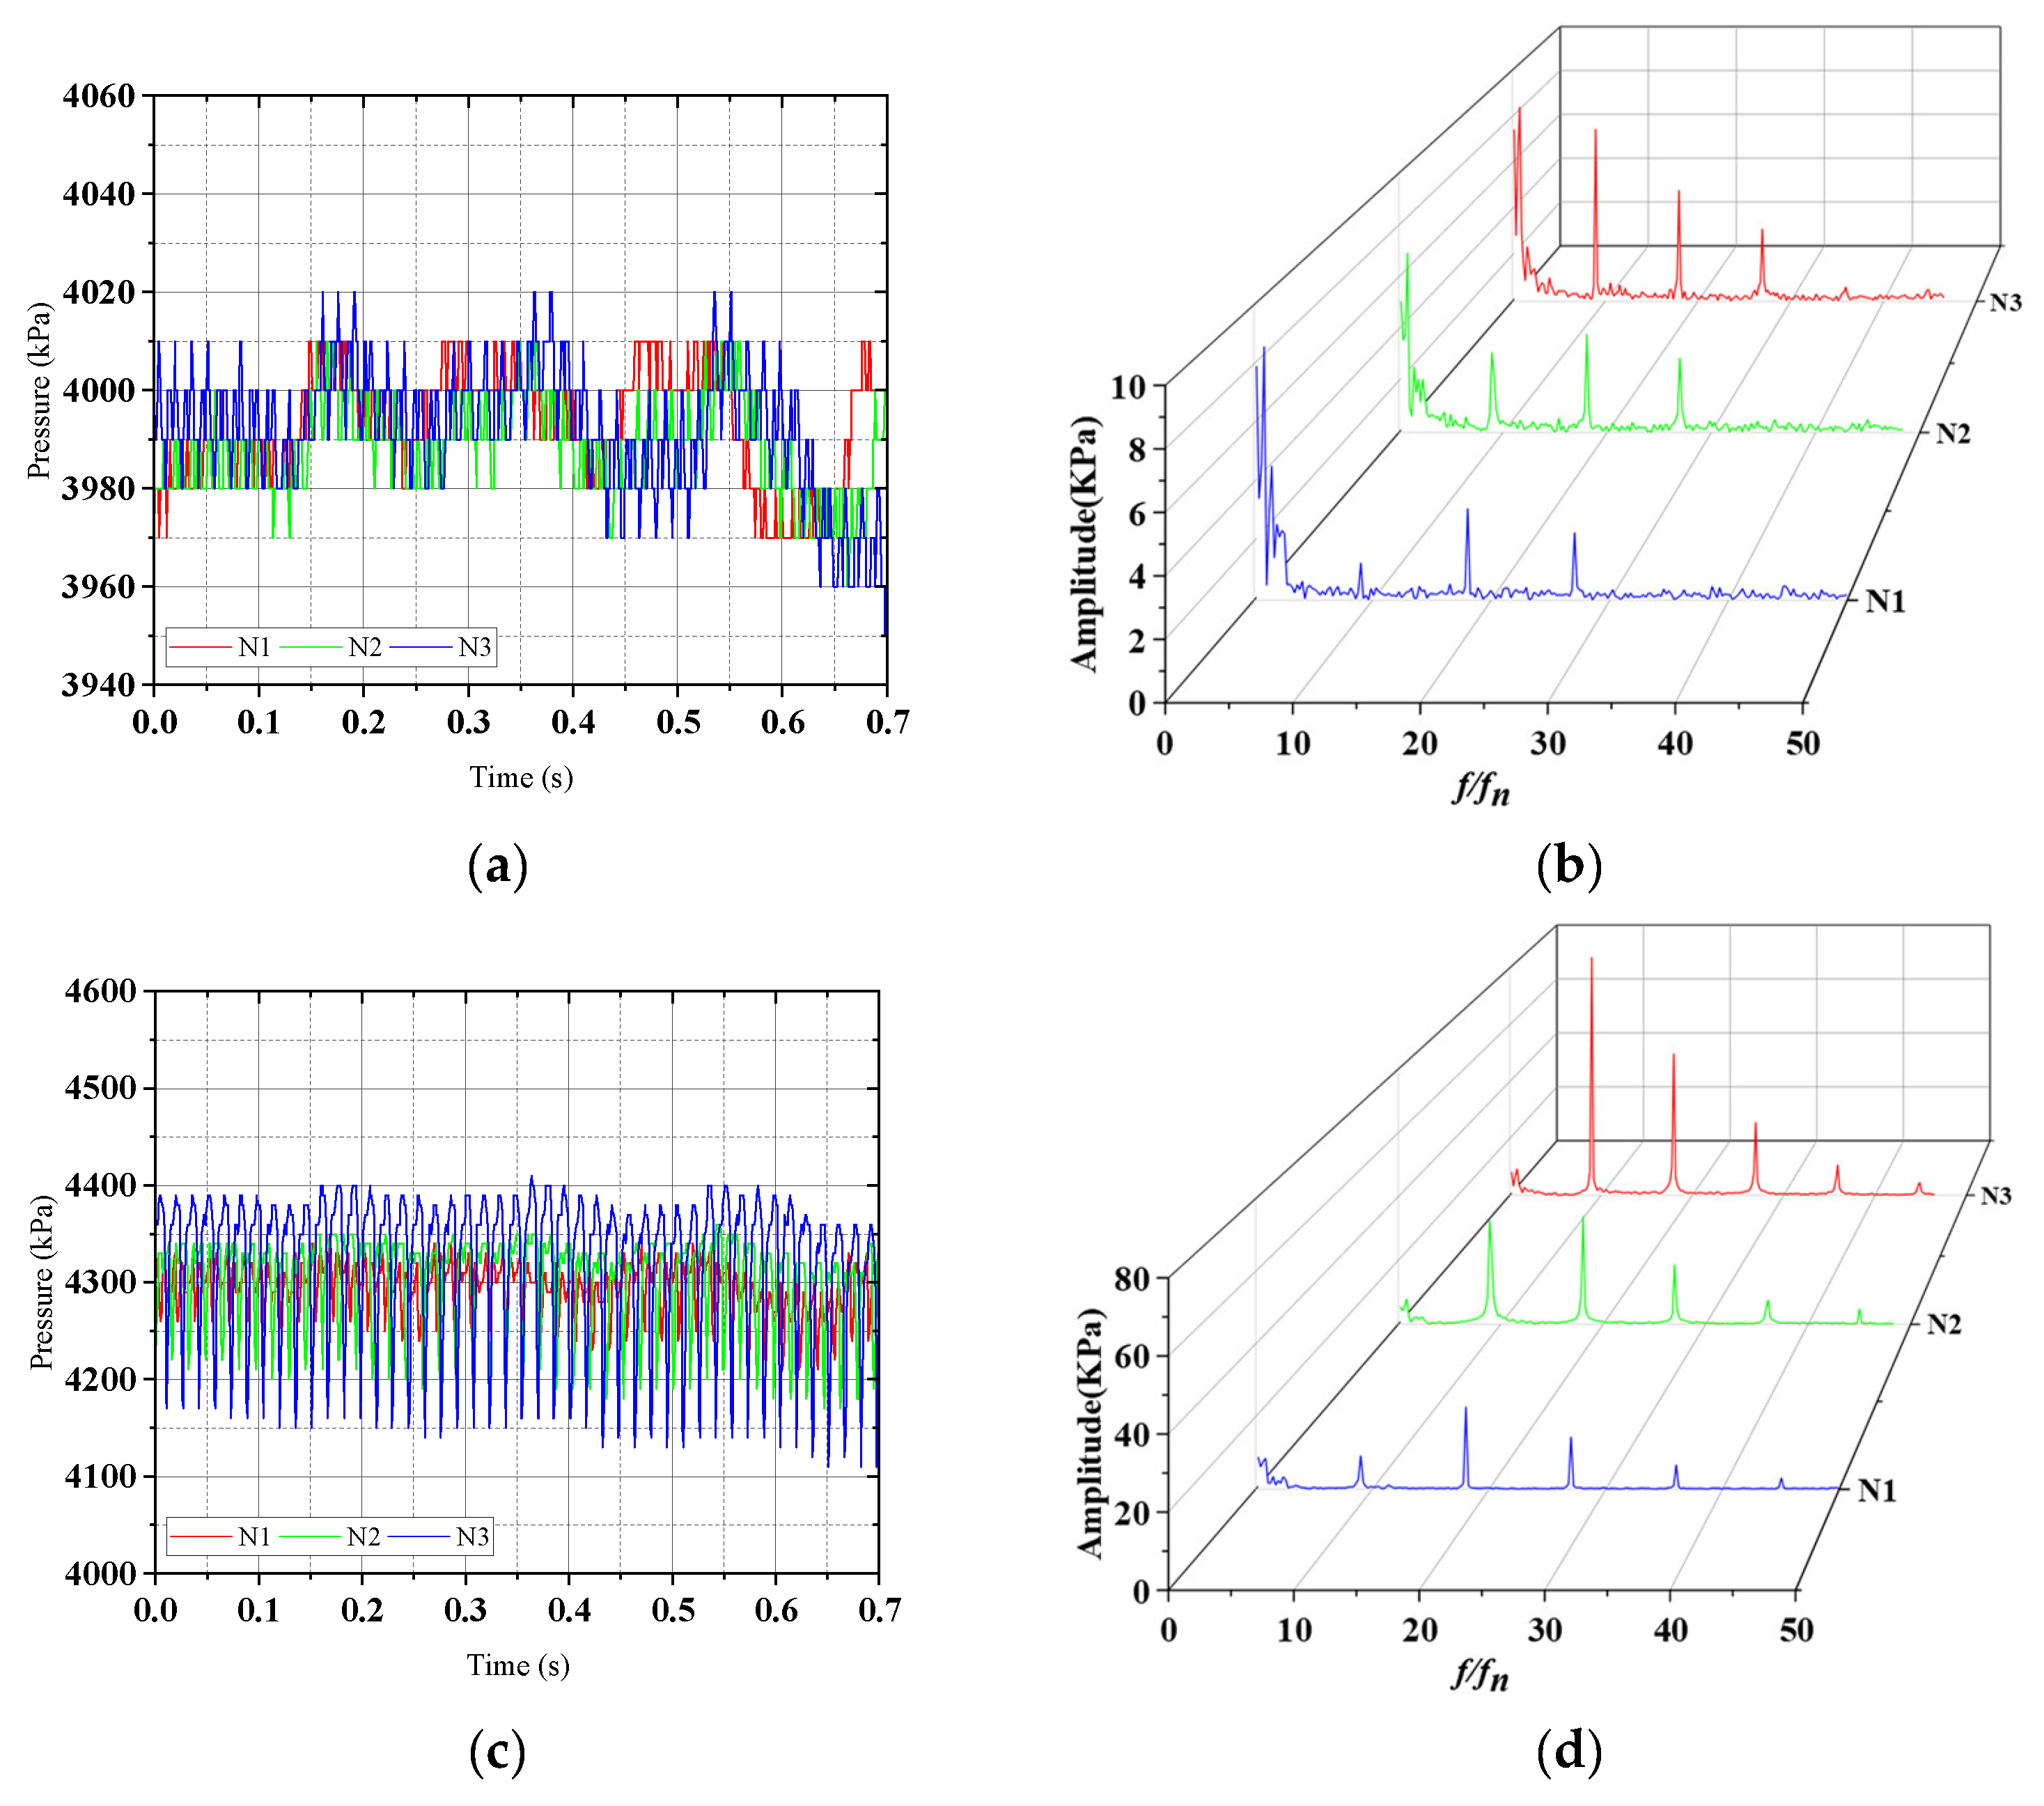
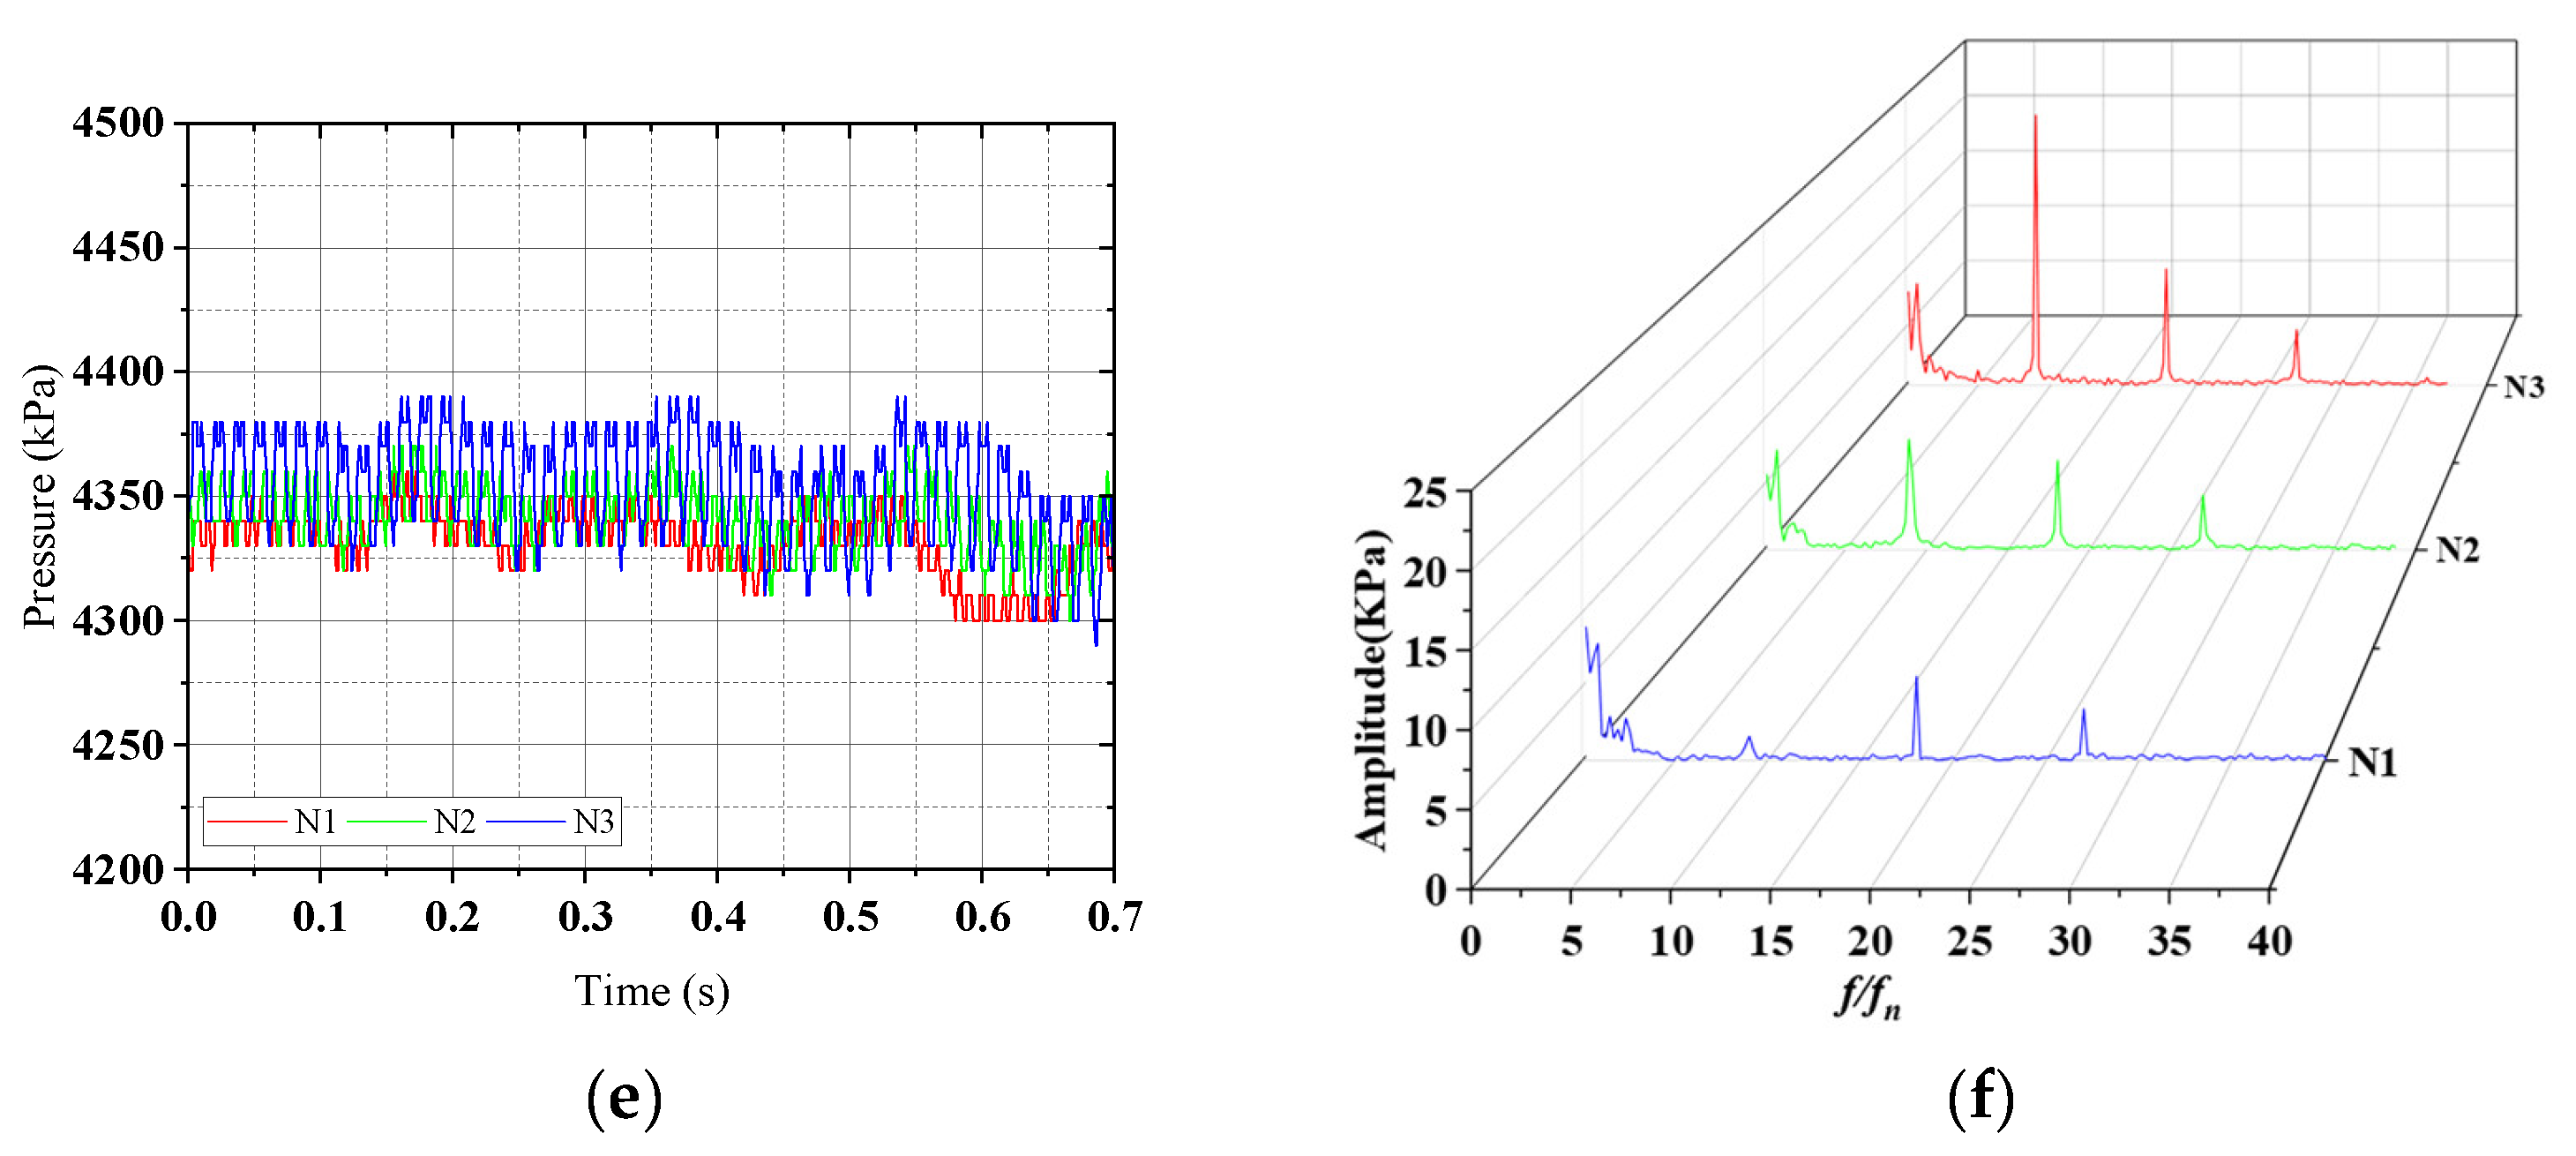
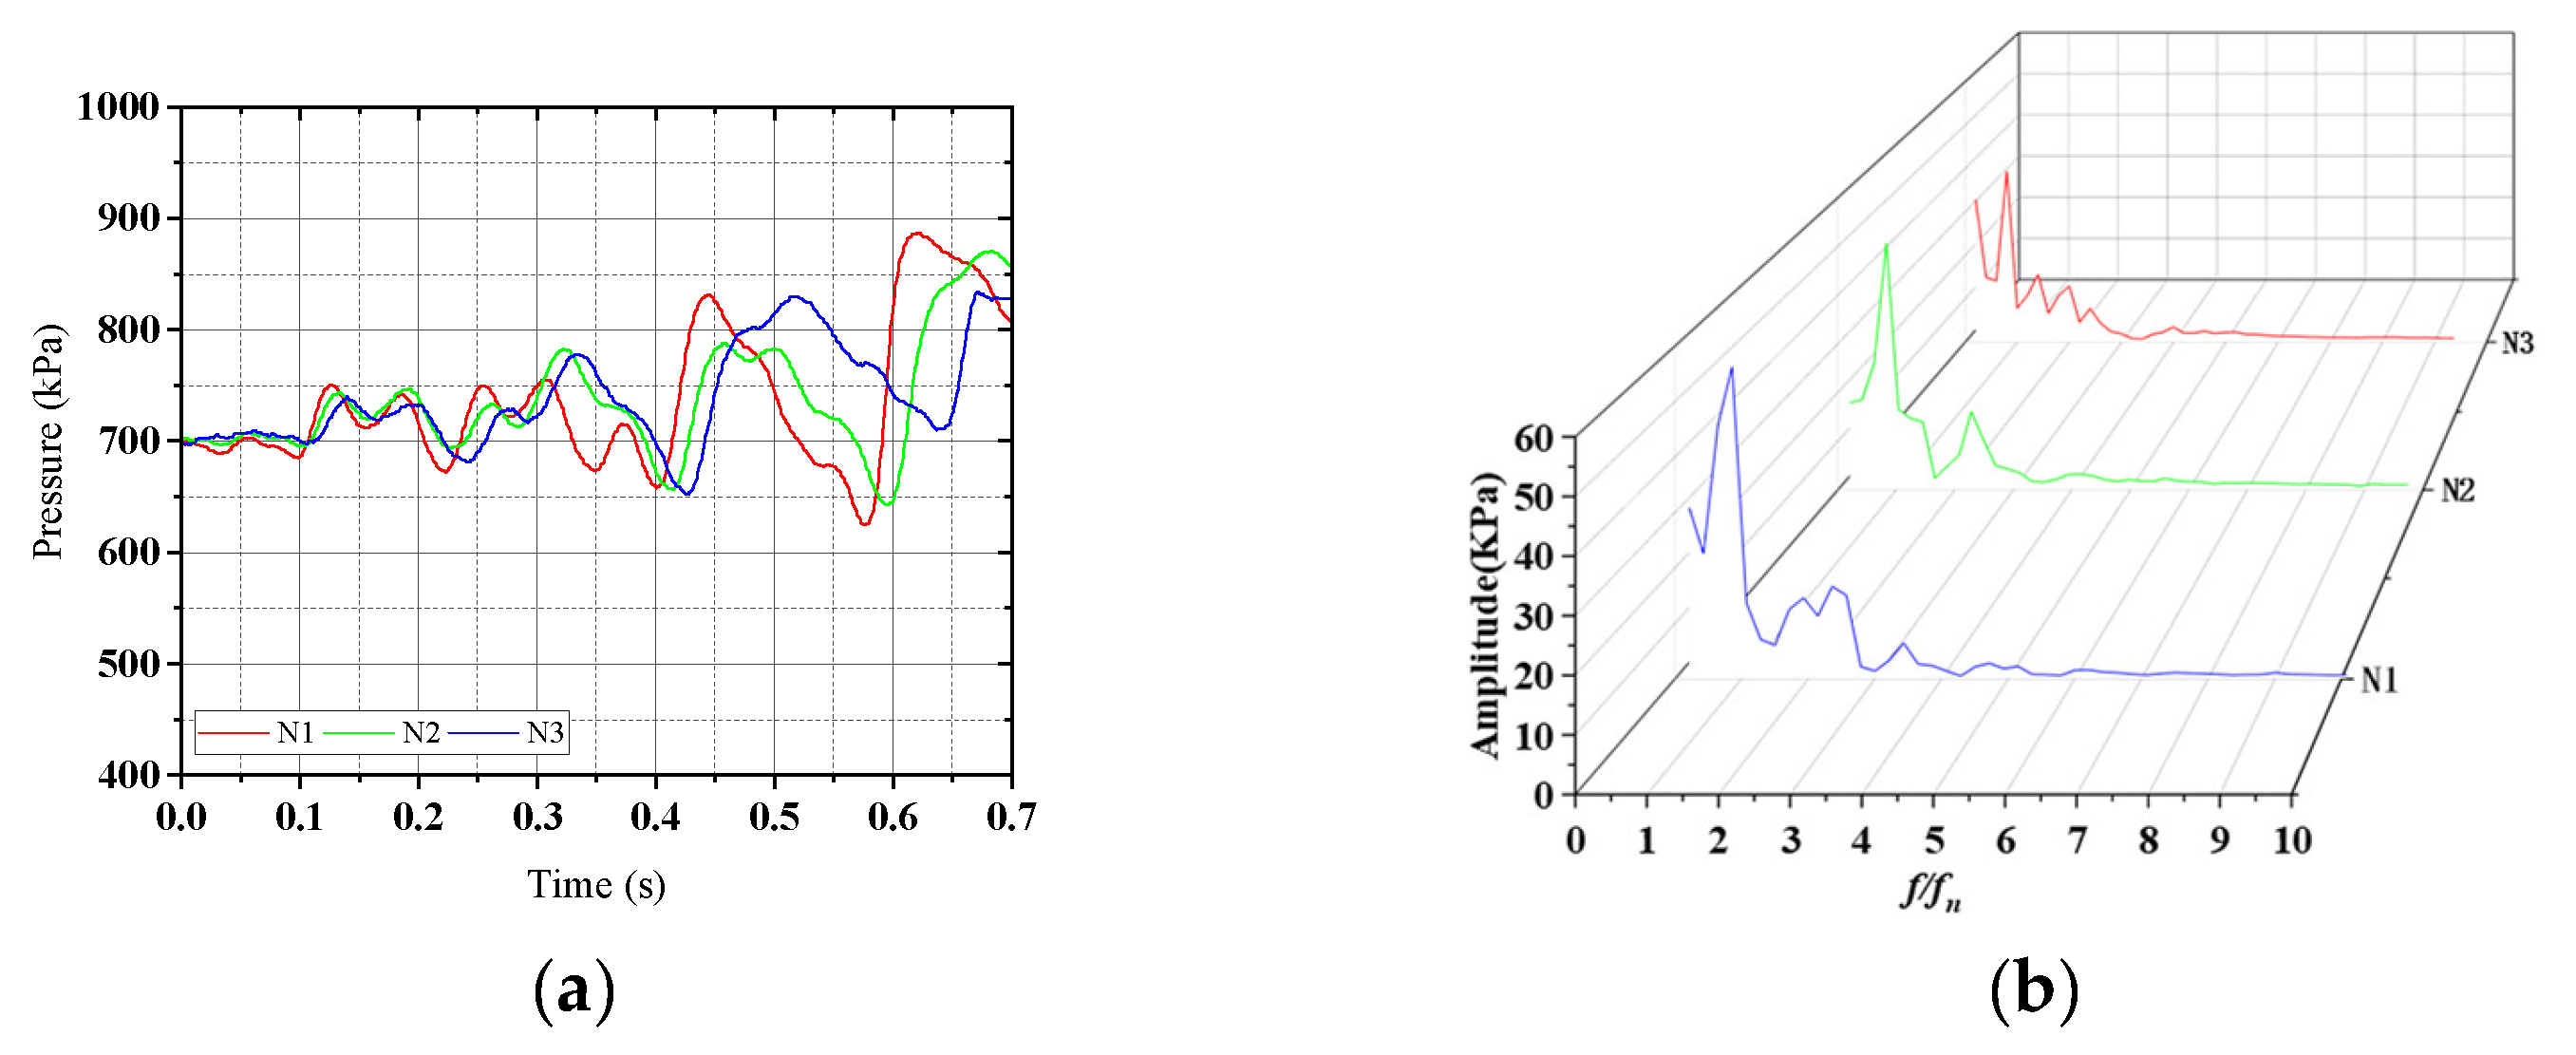
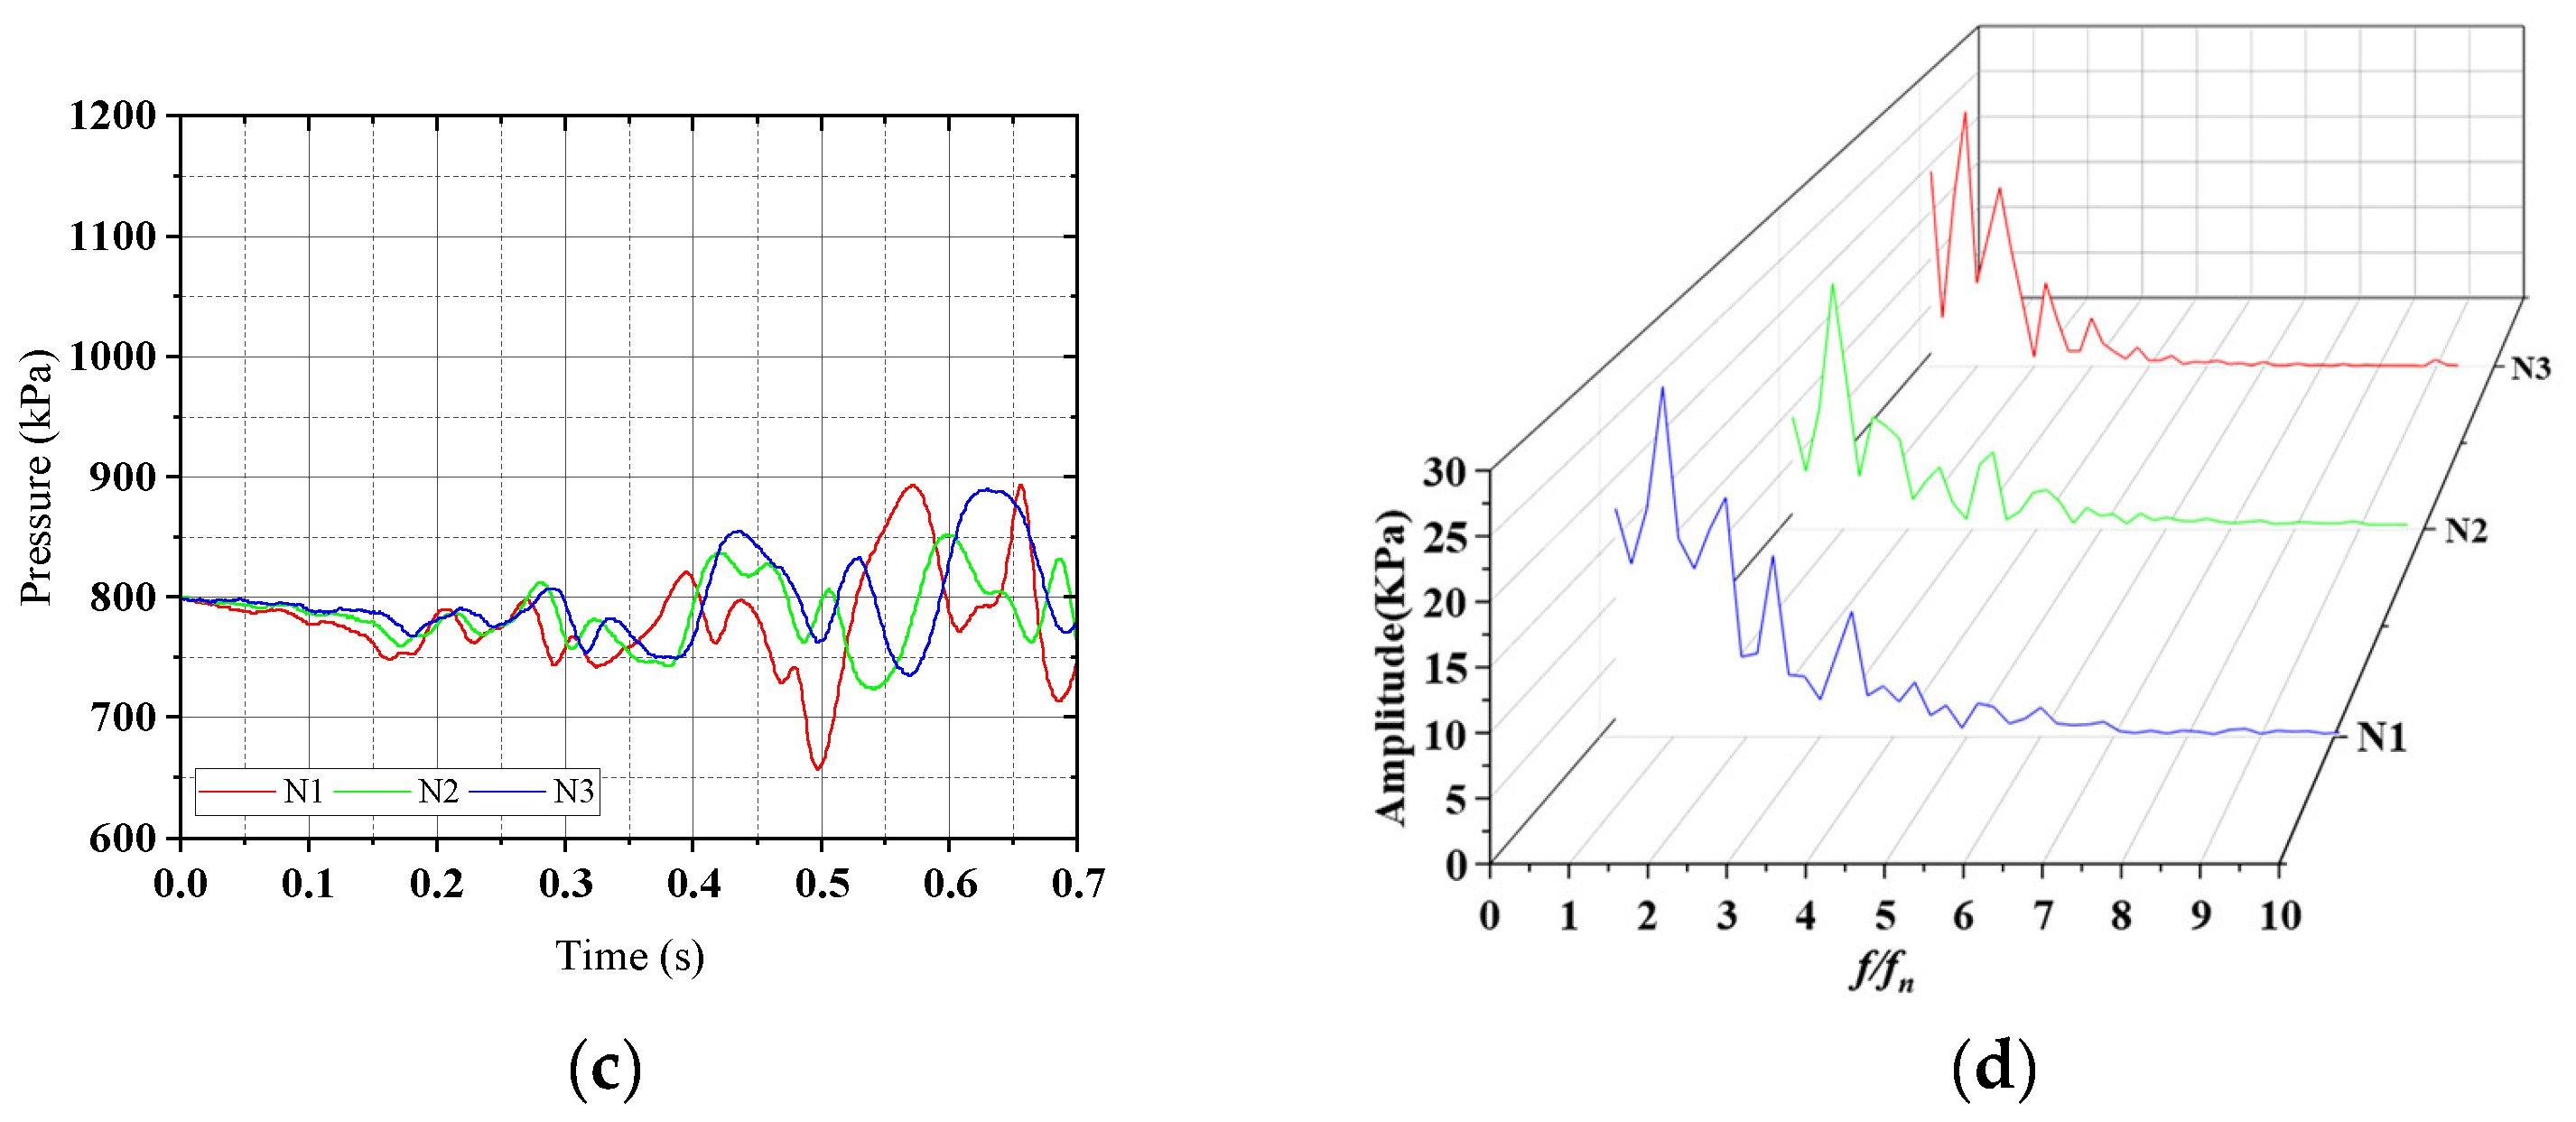
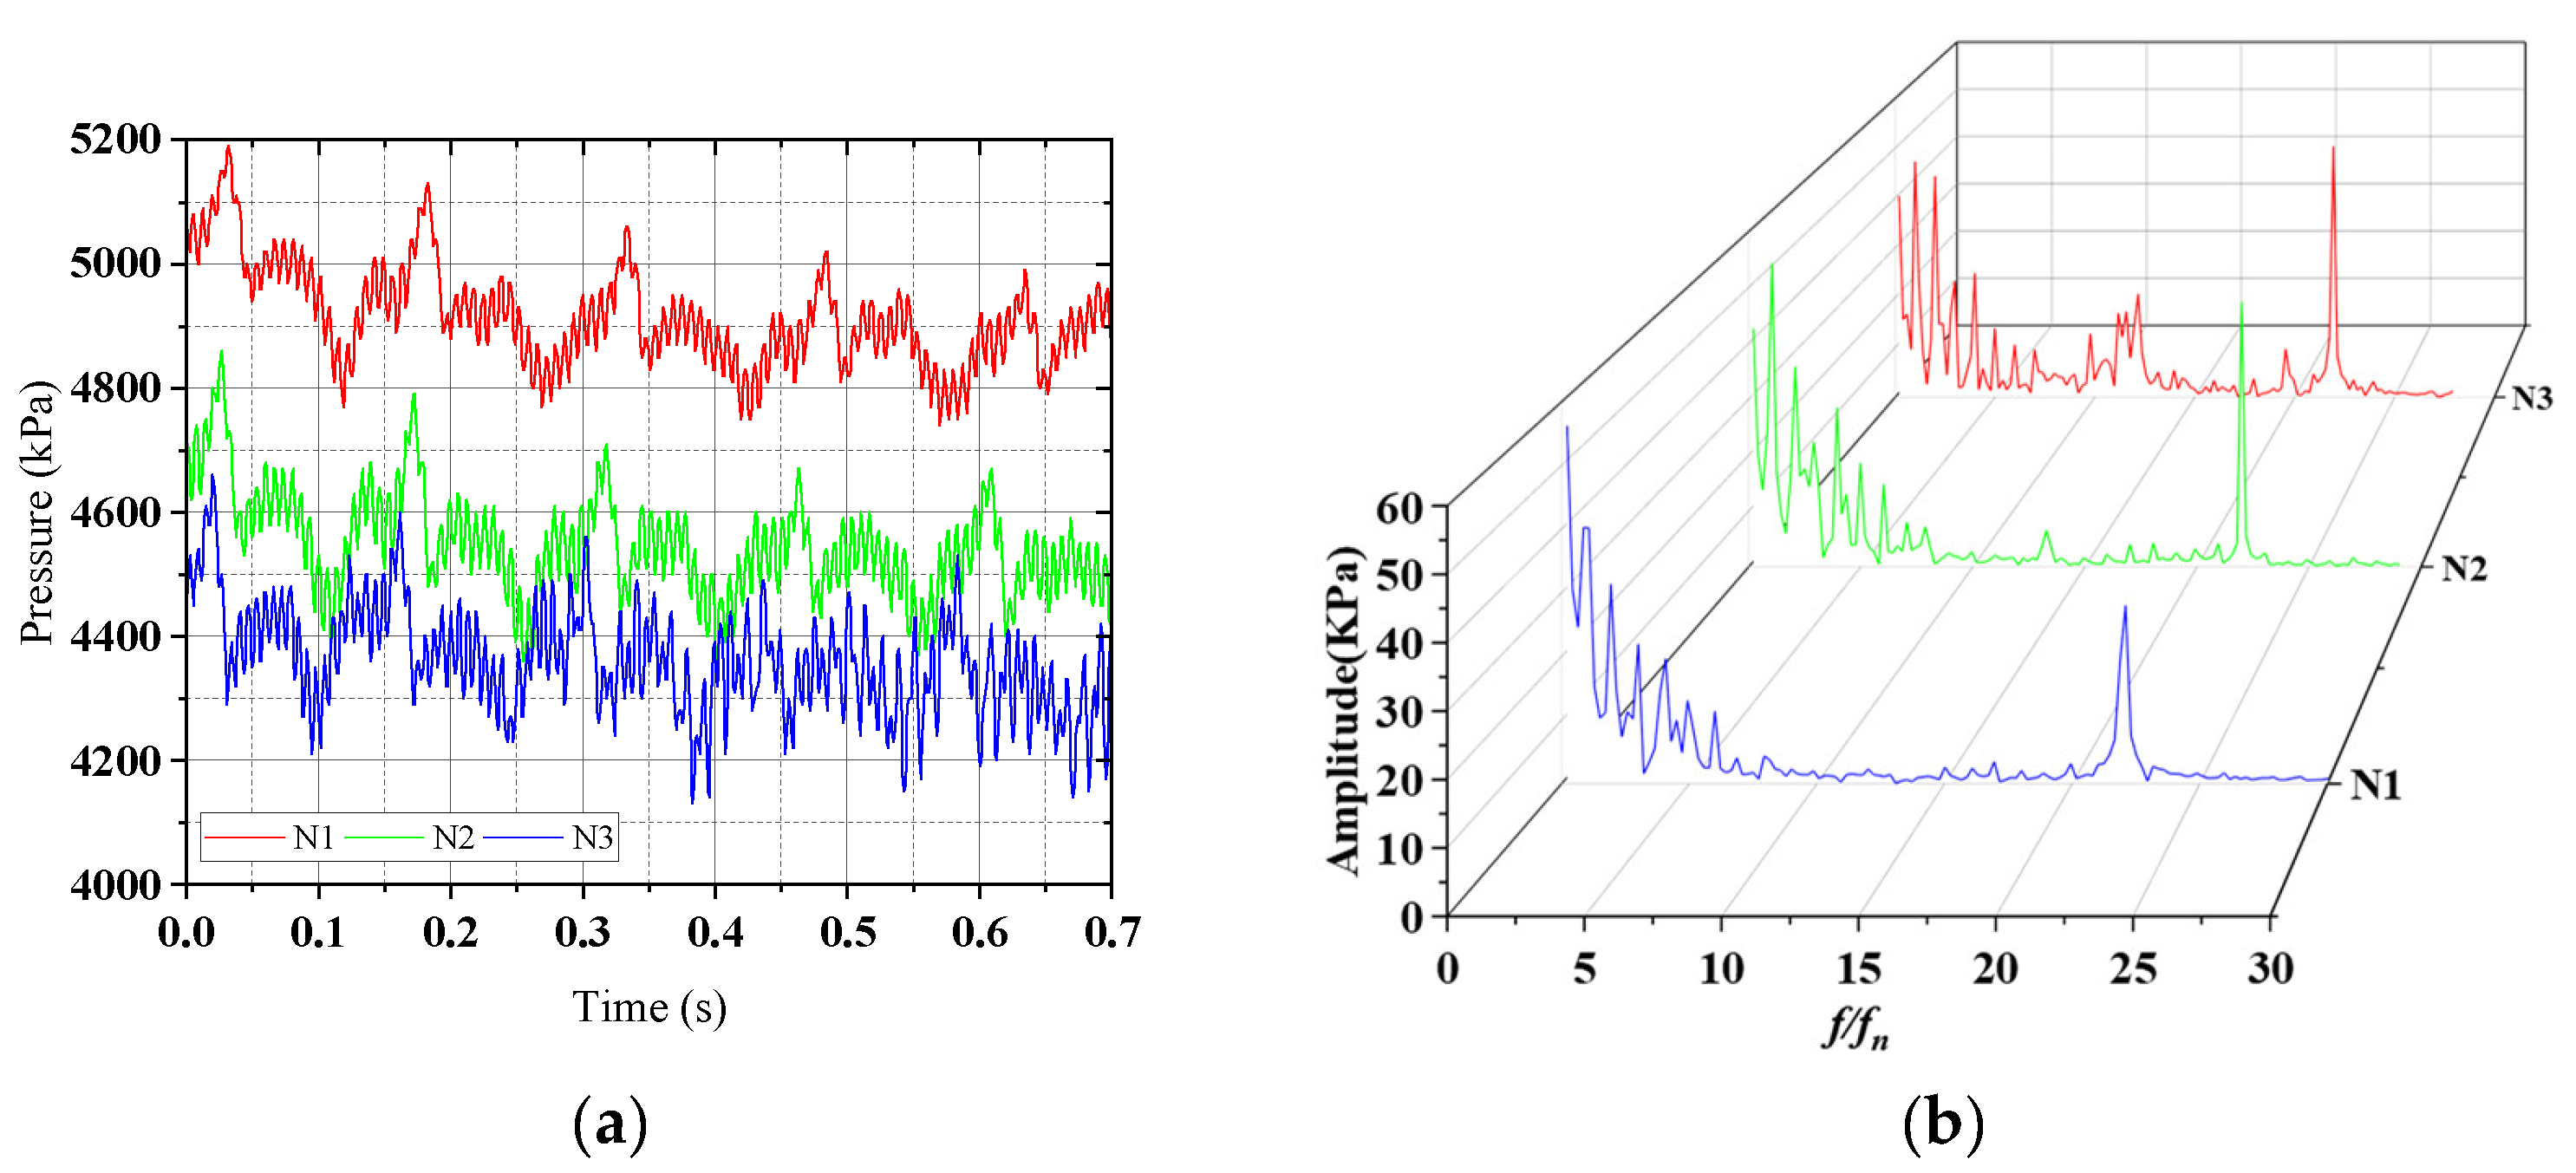
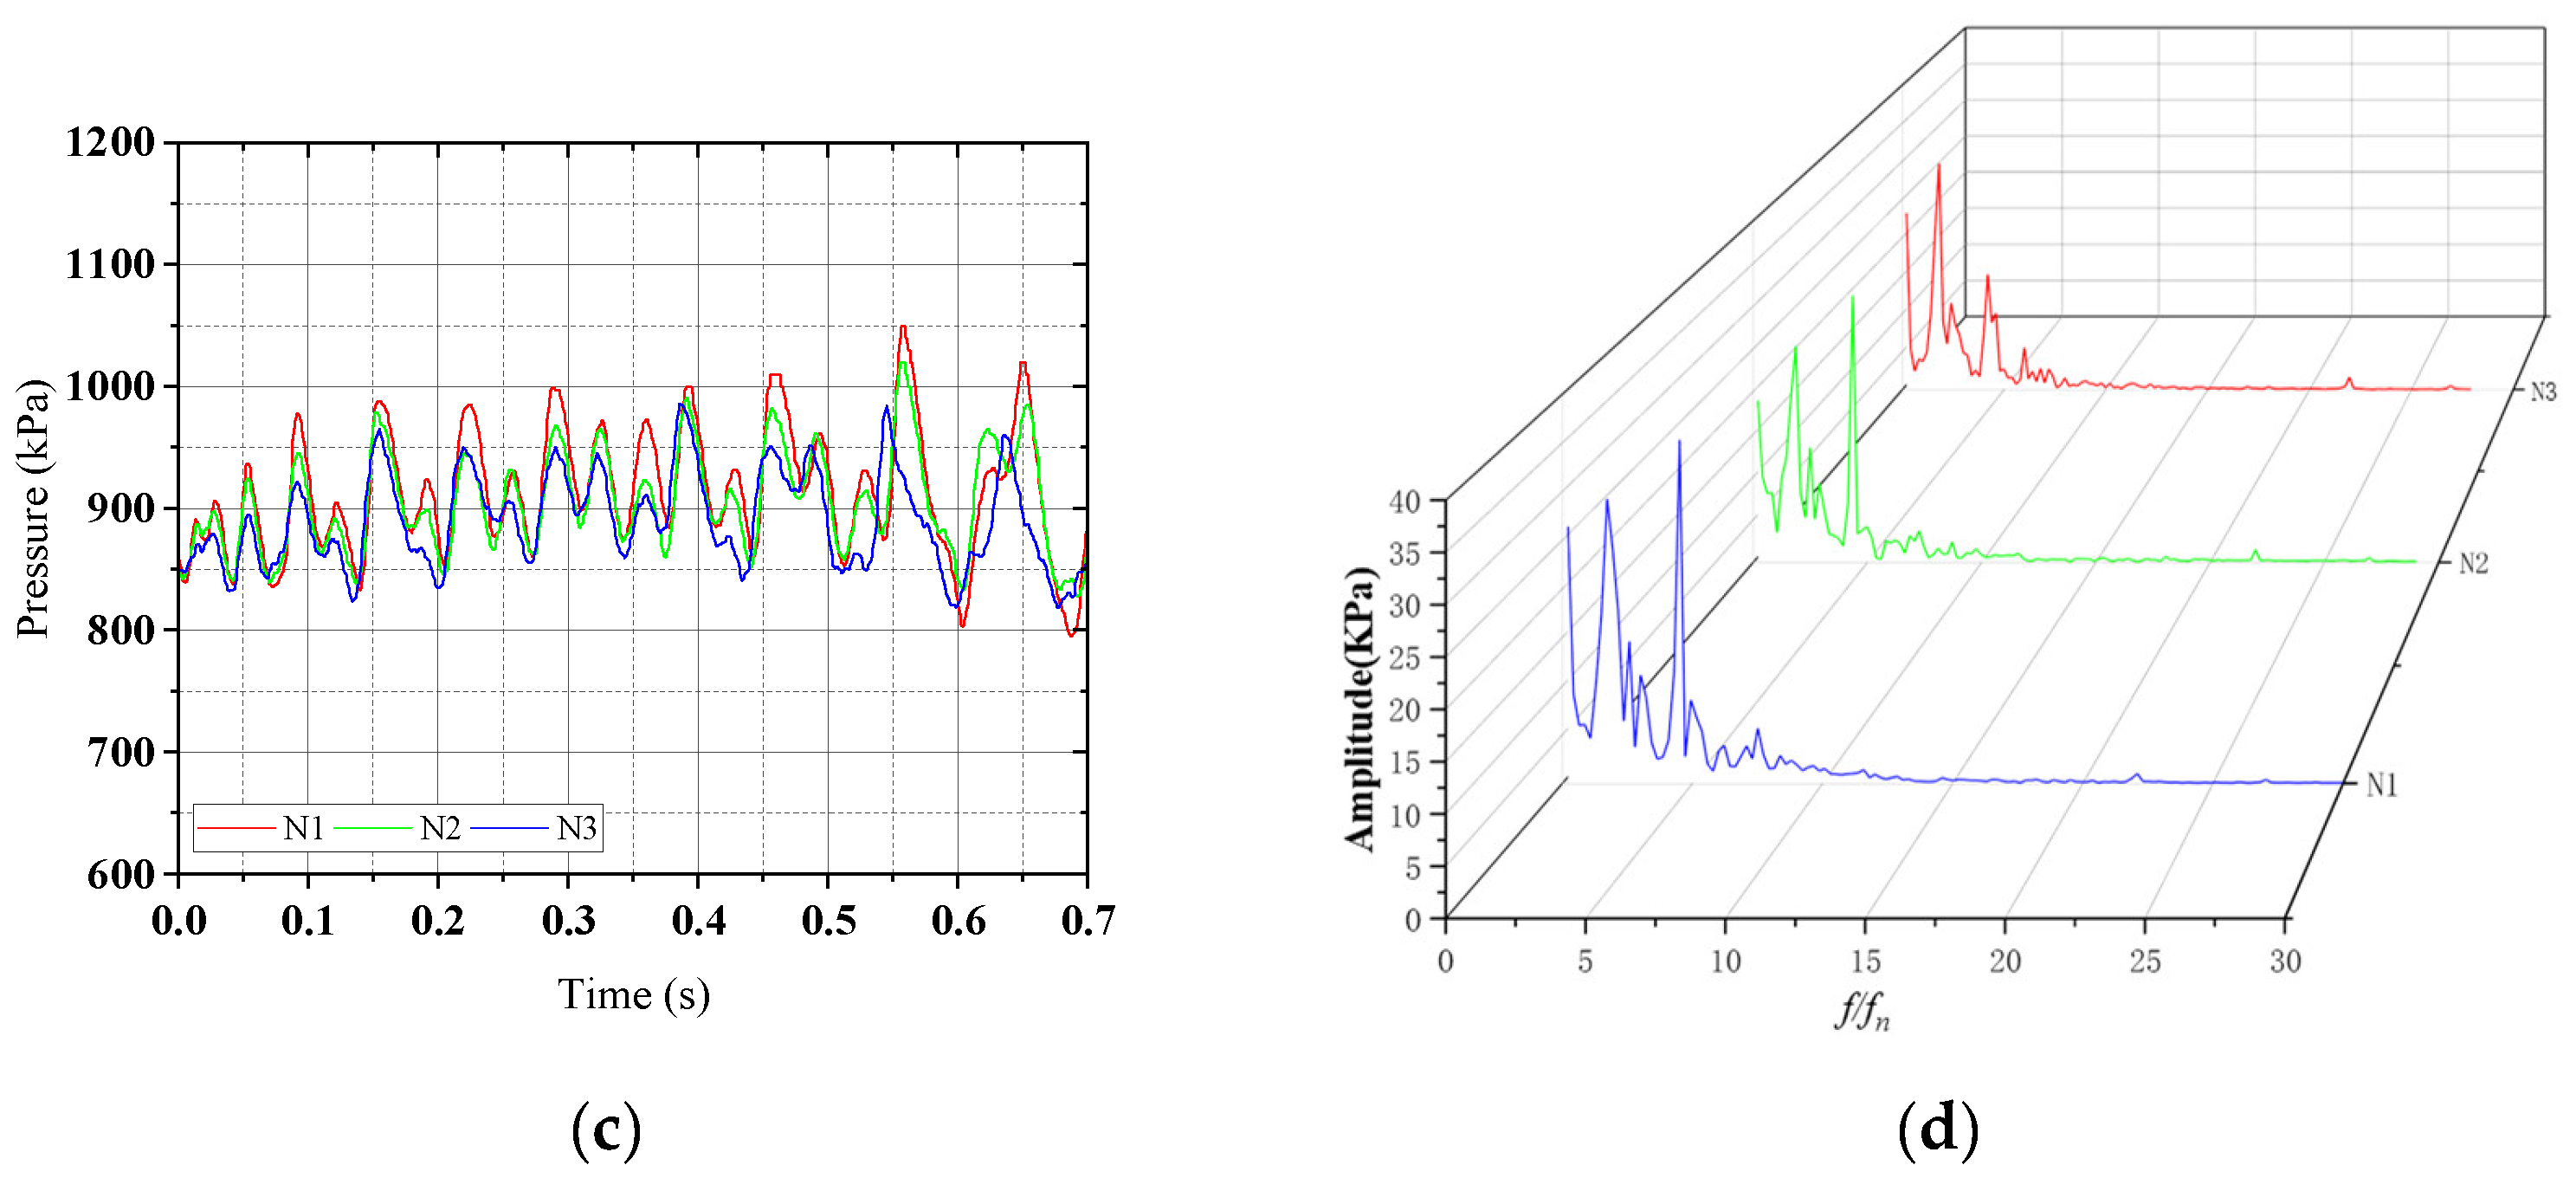
3.3. Pressure Pulsation Characteristics

The time history and frequency spectra of pressure pulsation with time at the monitoring point WKT1 (spiral case) at the three rotational speeds is shown in Figure 6. It can be seen that there is not an obvious difference in the pressure pulsations at N1~N3, wherein f is the frequency value, fn is the rotational frequency, and f/fn is the ratio of frequency to rotational frequency. It can be seen that the dominant frequency in WKT1 is a low-frequency component.
The time histories and spectra of the pressure pulsations at the monitoring points PHCM1, PHCM2, and PHCM3 (guide vane) at three speeds are shown in Figure 7, with PHCM1 located on the crown gap and PHCM2 and PHCM3 points on the same guide vane. There is sufficient evidence to show that the pressure pulsation values of N3 at three velocities in PHCM1 vary considerably, showing a general trend of increasing and then decreasing, with a particularly pronounced decrease from 0.5 s to 0.7 s. The changes of N1 and N2 were almost the same before 0.55 s, and after 0.55 s first N2 was larger than N1, and after 0.65 s N1 was larger than N2. For monitoring point PHCM1 at N1 and N2, the main frequency is the multiplicative frequency of blade passage (f/fn = 18), and at N3 is the blade passage frequency (f/fn = 9, the number of blades is 9). The dominant low frequency is 0.86 fn.
The patterns of variation in N1, N2, and N3 at PHCM2 and PHCM3 points in Figure 7 are basically the same, and the variation in N3 is significantly larger compared with N1 and N2. However, the PHCM2 point is closer to the runner than the PHCM3 point, so the closer to the runner, the more obvious the variation in pressure pulsation. The main frequency of PHCM2 at N1 and N2 is the multiplicative frequency of the blades (f/fn = 18, the number of blades is 9) and at N3 is the blade passage frequency (f/fn = 9, the number of blades is 9). The essential frequency of PHCM3 at N1 is the multiplicative frequency of the blades (f/fn = 9, number of blades is 9) and under N2 and N3 the predominant frequency is the blade passing frequency (f/fn = 9, number of blades is 9). This is aroused by the dynamic and static interference of the runner and guide vane. With the increase in speed, the main frequency amplitude gradually increases. The higher the speed, the higher the main frequency amplitude. In the N1 and N2 models, the main frequency increases and then decreases, and in the N3 model it keeps decreasing. It can be found that there are more low-frequency components with larger pressure pulsation amplitude at each speed, which may be due to the operating condition of the turbine, where the movable guide vanes and runners create a large number of vortices and secondary currents are formed in the bladeless zone, resulting in more low-frequency components.
Regarding the PP1 point and PP2 point on the same stay vane, as can be seen from Figure 8, in the vast majority of cases, N3 has higher values of pressure pulsation than N1 and N2, which are the lowest, but between 0.65 s and 0.7 s, N1 and N2 are elevated, and N1 changes more than N2. The frequency spectrum at the detection points PP1 and PP2 at the cone tube is shown in Figure 8, when the speed is greater than 412.16 m/s, the dominant frequency is dominated by twice the blade passing frequency. The low frequency is 0.86 fn at N1, 0.83 fn at N2, and 0.8 fn at N3. In addition to this, in the high-frequency section there is mainly three times the blade overcurrent frequency.
Points PP3 and PP4 belong to the two monitoring points on the draft tube but point PP3 is closer to the inlet end of the draft tube than point PP4. We can see from Figure 9 that the pressure pulsation values of the two points change, and the three show irregular curve changes, but the pressure pulsation values of 0–0.4 s for N1–N3 in figure PP3 and figure PP4 change more closely with smaller changes, but after that all three produce larger changes. In particular, there is a substantial downward trend in all three between 0.5 s and 0.55 s. As shown in Figure 9, the pressure pulsation spectrum of the two measurement points of the draft tube is basically similar, and there is the internal existence of vortex bands and the existence of obvious leakage phenomenon. The low-frequency concentration in N1 is 0.86 fn, in N2 is 0.83 fn, and in N3 is 0.8 fn, and taking into account that these frequency components and the frequency of rotation are not a regular change, the cause of this aspect may be the inherent frequency of the pressure pulsation excited by the test bench piping system and its water body.
The monitoring points RV1 and RV2 are on the runner, where RV1 is shown in Figure 10, N1 is significantly larger than N2 and N3, the changes in N2 and N3 are basically the same, and the changes gradually decrease. RV2 is shown in Figure 10, and the three speeds show the same irregular curve variation, with N1 being larger than N2 and N3 most of the time, but not as significant as in the figure showing RV1. The pressure pulsation at point RV1 is significantly larger than at point RV2. The corresponding spectra of the monitoring points RV1 and RV2 inside the rotor are shown in Figure 10. There is an obvious main frequency of 22 fn for the high-frequency component, and this pressure pulsation is mostly caused by the static and dynamic interference, and the pressure pulsation caused by the static and dynamic interference has the characteristics of isolated and clear spectral lines. As the speed increases, the flow field at the runner is gradually disturbed, making the pressure pulsation increase. The amplitude of pressure pulsation reduces gradually with spindling down.

3.4. Discussion

The changeable speed operating features of the variable-speed unit make it different from many conventional pumped storage units. Comparing the flow features and pressure pulsation features at three speeds, there is sufficient evidence to show the pressure pulsation at low-speed operation, which means that the unit will maintain better stability during the reduction in speed and will not threaten the equipment stability due to the reduction in speed.
This paper mainly analyzes the flow characteristics of a variable-speed pump turbine under hydraulic turbine conditions. In fact, variable-speed units also involve pumping conditions, which are not analyzed in this paper. Therefore, in the future research, we need to focus on analyzing the flow characteristics of the variable-speed unit at pumping conditions in depth. In addition, since the simulation of the variable-speed unit process requires a lot of computational resources, this work has not been carried out in this paper, but the simulation of this process is also of great engineering interest.

4. Conclusions

This paper studies the flow characteristics of a pump turbine in variable-speed operation at three typical speeds under hydraulic turbine operating conditions. The pressure pulsation under three speed conditions is compared, and the effect of speed on pressure pulsation is discussed. The conclusions drawn here will be of great help to the stability of future pump turbine designs. At present, the greater the speed the lower the stability of the pump turbine operation, to ensure that the pump turbine speed is in a reasonable range, as well as to avoid the unbalance phenomenon and serious vibration phenomenon caused by unreasonable speed. In addition, many similar failures have already occurred in pumped storage power plants, and some failures in pumped storage power plants can be avoided if there is a more in-depth study of the mechanism that causes the unbalance of the pump turbine. The following conclusions are drawn:
(1) The pressure pulsation clouds of the two monitoring points RV1 and RV2 on the runner can show the pressure pulsation distribution on the inner surface of the runner under power generation conditions, and the pressure distribution on the runner surface shows a trend that N3 is greater than N2 is greater than N1 in three modes from N1 to N3. Combined with the pressure pulsation monitoring points RV1 and RV2 in Figure 10, the pressure pulsation under RV1 point N1 is significantly larger than N2 and N3, which is related to the position of the RV1 monitoring point on the runner, which means that there is more upward pressure pulsation along the center line.
(2) The second part of the study is a study of the advantages of variable-speed units under power generation conditions, where three speed conditions are calculated and the guide vane opening is adjusted to determine a constant output power. It can be seen that the pressure pulsation in the N3 condition is larger than that in N1 and N2 during variable-speed operation, except at the runner. Combined with the frequency spectra of each monitoring point, the higher the speed, the more chaotic the flow lines are, so changing the speed affects the presence of flow lines in the flow channel, which in turn affects the pressure pulsation, and variable-speed technology allows for greater flexibility in pump turbines. Generally speaking, the variable-speed technology allows to explore several operating intervals within a certain range, which is achieved by controlling the speed and guide vane opening. This paper can conclude that the following speed represents a trade-off between pump turbine load and efficiency that requires further technical evaluation.

Author Contributions

Data curation, writing—original draft, L.S.; investigation, J.C.; formal analysis, X.J.; methodology, S.Y.; project administration, S.L.; software, L.W.; validation, Z.W.; conceptualization, funding acquisition, writing—review and editing, X.L. All authors have read and agreed to the published version of the manuscript.

Funding

This research was funded by Science and Technology Project of State Grid Xinyuan Group Co., Ltd.

Data Availability Statement

Not applicable.

Conflicts of Interest

The authors declare no conflict of interest.

References

  1. Zhu, H.; Gao, X.; Liu, Y.; Liu, S. Numerical and experimental assessment of the water discharge segment in a pumped-storage power station. Energy 2023, 265, 126375. [Google Scholar] [CrossRef]
  2. Tao, R.; Song, X.; Ye, C. Pumped Storage Technology, Reversible Pump Turbines and Their Importance in Power Grids. Water 2022, 14, 3569. [Google Scholar] [CrossRef]
  3. Zhang, T.; Wang, H.; Qin, D. Variable speed water pump turbine water pump selection characteristics analysis. Large Mot. Technol. 2020, 2, 65–69. [Google Scholar]
  4. Lin, B. China Energy Outlook 2019; Peking University Press: Beijing, China, 2019. (In Chinese) [Google Scholar]
  5. Cavazzini, G.; Houdeline, J.B.; Pavesi, G. Unstable behaviour of pump-turbines and its effects on power regulation capacity of pumped-hydro energy storage plants. Renew. Sustain. Energy Rev. 2018, 94, 399–409. [Google Scholar] [CrossRef]
  6. An, Z.; Wu, J.; Liao, W.; Tong, J.; Chen, C.; Yu, J. Application of AC Excitation Variable Speed Pumped Storage Technology and Its Prospects. Pumped Storage Power Plant Eng. Constr. Anthol. 2018, 5, 268–272. [Google Scholar]
  7. Guo, H. Technology and Application of AC Excitation Variable Speed Energy Storage Unit. South. Power Grid Technol. 2011, 5, 97–100. [Google Scholar] [CrossRef]
  8. Dompierre, F.; Sabourin, M. Determination of turbine runner dynamic behaviour under operating condition by a two-way staggered fluid-structureinteraction method. IOP Conf. Ser. Earth Environ. Sci. 2010, 12, 012085. [Google Scholar] [CrossRef]
  9. Wang, L.; Liu, Y.; Liu, W.; Qin, D.; Jiao, L. Pressure pulsation characteristics of water pump turbine pumping conditions. J. Irrig. Drain. Mach. Eng. 2013, 31, 7–10. [Google Scholar]
  10. Zhang, Y.; Zhang, Y.; Wu, Y. A review of rotating stall in reversible pump turbine. Proc. Inst. Mech. Eng. Part C J. Mech. Eng. Sci. 2016, 231, 1181–1204. [Google Scholar] [CrossRef]
  11. Svarstad, M.F.; Nielsen, T.K. Pressure pulsations during a fast transition from pump to turbine mode of operation in laboratory and field experiment. IOP Conf. Ser. Earth Environ. Sci. 2019, 240, 082006. [Google Scholar] [CrossRef]
  12. Liu, S.; Sun, Y.; Zuo, Z.; Liu, J.; Wu, Y. Numerical simulation and analysis of the pressure pulsation transfer characteristics of a prototype water pump turbine. In Proceedings of the Nineteenth China Hydropower Equipment Symposium, Dalian, China, 21–24 November 2013; pp. 58–65. [Google Scholar]
  13. Liao, W.; Lei, J.; Zhao, Z.; Ruan, H.; Li, D. Pressure pulsation in small opening operating mode of pump turbine’s turbine mode. IOP Conf. Ser. Earth Environ. Sci. 2018, 163, 012051. [Google Scholar] [CrossRef]
  14. Zhao, J.; Luan, F.; Yang, X. A preliminary study on pre-planning strategies for pumped storage variable speed units. Hydroelectr. Power 2018, 44, 57–59. [Google Scholar]
  15. Iliev, C.I.; Trivedi, E.; Agnalt, O.G.; Dahlhaug. Variable-speed operation and pressure pulsations in a Francis turbine and a pump-turbine. IOP Conf. Ser. Earth Environ. Sci. 2019, 240, 072034. [Google Scholar] [CrossRef]
  16. Pavesi, G.; Cavazzini, G.; Ardizzon, G. Numerical Analysis of the Transient Behaviour of a Variable Speed Pump-Turbine during a Pumping Power Reduction Scenario. Energies 2016, 9, 534. [Google Scholar] [CrossRef] [Green Version]
  17. Liu, D.; Xu, W.; Zhao, Y. Study of cavitation characteristics and operating characteristics of variable speed pumped storage units. Hydropower Pumped Storage 2020, 6, 36–45. [Google Scholar] [CrossRef]
  18. Uruba, V. Near Wake Dynamics around a Vibrating Airfoil by Means of PIV and Oscillation Pattern Decomposition at Reynolds number of 65,000. J. Fluids Struct. 2015, 55, 372–383. [Google Scholar] [CrossRef]
  19. Yu, R.; Yang, W.; Sun, W.; Zhang, Q.; Liu, R.; Zhang, C. A brief analysis of the operating range of pumping and generation conditions of pumped storage variable speed units. Hydropower Pumped Storage 2021, 7, 87–90. [Google Scholar] [CrossRef]
  20. Chen, F.; Bi, H.; Ahn, S.-H.; Mao, Z.; Luo, Y.; Wang, Z. Investigation on Dynamic Stresses of Pump-Turbine Runner during Start Up in Turbine Mode. Processes 2021, 9, 499. [Google Scholar] [CrossRef]
  21. Ahn, S.-H.; Zhou, X.; He, L.; Luo, Y.; Wang, Z. Numerical estimation of prototype hydraulic efficiency in a low head power station based on gross head conditions. Renew. Energy 2020, 153, 175–181. [Google Scholar] [CrossRef]
  22. Song, X.; Liu, C. Experimental investigation of floor-attached vortex effects on the pressure pulsation at the bottom of the axial flow pump sump. Renew. Energy 2020, 145, 2327–2336. [Google Scholar] [CrossRef]
  23. Liu, C.; Li, D.; Wu, J. Pressure Fluctuation Prediction of a Model Kaplan Turbine by Unsteady Turbulent Flow Simulation. J. Fluids Eng. 2009, 131, 101102. [Google Scholar] [CrossRef]
  24. Li, D.; Song, Y.; Lin, S.; Wang, H.; Qin, Y.; Wei, X. Effect mechanism of cavitation on the hump characteristic of a pump-turbine. Renew. Energy 2021, 167, 369–383. [Google Scholar] [CrossRef]
  25. Li, Z.; Bi, H.; Karney, B.; Wang, Z.; Yao, Z. Three-dimensional transient simulation of a prototype pump-turbine during normal turbine shutdown. J. Hydraul. Res. 2017, 55, 520–537. [Google Scholar] [CrossRef]
  26. Zuo, Z.; Fan, H.; Liu, S.; Wu, Y. S-shaped characteristics on the performance curves of pump-turbines in turbine mode—A review. Renew. Sustain. Energy Rev. 2016, 60, 836–851. [Google Scholar] [CrossRef]
  27. Luo, Y.; Wang, Z.; Liu, X.; Xiao, Y.; Chen, C.; Wang, H.; Yan, J. Numerical prediction of pressure pulsation for a low head bidirectional tidal bulb turbine. Energy 2015, 89, 730–738. [Google Scholar] [CrossRef]
  28. Qian, Z.; Wang, F.; Guo, Z.; Lu, J. Performance evaluation of an axial-flow pump with adjustable guide vanes in turbine mode. Renew. Energy 2016, 99, 1146–1152. [Google Scholar] [CrossRef]
Figure 1. Model of variable-speed pump turbine and partial grid schematic.
Water 15 00609 g001
Figure 2. Hydraulic performance of the unit.
Water 15 00609 g002
Figure 3. Pressure monitoring points. (a) Top view; (b) side view; (c) runner surface.
Water 15 00609 g003aWater 15 00609 g003b
Figure 4. Pressure distribution of N1~N3 at the runner inner surface. (a) Pressure distribution of runner inner surface at N1; (b) pressure distribution of runner inner surface at N2; (c) pressure distribution of runner inner surface at N3.
Water 15 00609 g004
Figure 5. Streamline in the flow passage of N1~N3. (a) Streamline in the flow passage at N1; (b) streamline in the flow passage at N2; (c) streamline in the flow passage at N3.
Water 15 00609 g005
Figure 6. Pressure pulsation and frequency spectra at monitoring point WKT1. (a) WKT1 pressure pulsation; (b) WKT1-frequency spectra.
Water 15 00609 g006
Figure 7. Pressure pulsation and frequency spectra at monitoring points PHCM1~PHCM3. (a) PHCM1 pressure pulsation; (b) PHCM1 frequency spectra; (c) PHCM2 pressure pulsation; (d) PHCM2 frequency spectra; (e) PHCM3 pressure pulsation; (f) PHCM3 frequency spectra.
Water 15 00609 g007aWater 15 00609 g007b
Figure 8. Pressure pulsation and frequency spectra at monitoring points PP1~PP2. (a) PP1 pressure pulsation; (b) PP1 frequency spectra; (c) PP2 pressure pulsation; (d) PP2 frequency spectra.
Water 15 00609 g008
Figure 9. Pressure pulsation and frequency spectra at monitoring points PP3~PP4. (a) PP3 pressure pulsation; (b) PP3 frequency spectra; (c) PP4 pressure pulsation; (d) PP4 frequency spectra.
Water 15 00609 g009aWater 15 00609 g009b
Figure 10. Pressure pulsation and frequency spectra at monitoring points RV1~RV2. (a) RV1 pressure pulsation; (b) RV1 frequency spectra; (c) RV2 pressure pulsation; (d) RV2 frequency spectra.
Water 15 00609 g010aWater 15 00609 g010b
Table 1. The three speed models (the three speed models determined by the operating conditions of the prototype).
Model NumberSpeed (m/s)
N1398.57
N2412.16
N3428.6
Table 2. Mesh element number and type.
ComponentElement TypeNumber of Elements
Spiral casingTetrahedra493,696
Stay vanesHexahedral579,660
Guide vanesHexahedral383,780
RunnerHexahedral2,008,124
GapHexahedral598,200
Pressure balance pipeHybrid72,236
Draft tubeHexahedral372,265
Total-4,389,241
Disclaimer/Publisher’s Note: The statements, opinions and data contained in all publications are solely those of the individual author(s) and contributor(s) and not of MDPI and/or the editor(s). MDPI and/or the editor(s) disclaim responsibility for any injury to people or property resulting from any ideas, methods, instructions or products referred to in the content.

