
Quantification of Evapotranspiration and Water Chemistry in a Remediated Wetland in Everglades National Park, USA


1
Department of Earth and Environment, Florida International University, Miami, FL 33199, USA
2
Stearns, Conrad and Schmidt Consulting Engineers, Inc., Miami, FL 33156, USA
3
Institute of Environment, Florida International University, Miami, FL 33199, USA
*
Author to whom correspondence should be addressed.
Water 2023, 15(4), 611; https://doi.org/10.3390/w15040611
Submission received: 3 January 2023
/
Revised: 25 January 2023
/
Accepted: 2 February 2023
/
Published: 4 February 2023
(This article belongs to the Special Issue Recent Advances in Remote Sensing for Wetland and Inland Water Sources)
Abstract
:Similar to most wetlands, the Florida Everglades landscape was altered to promote agriculture and human settlement, significantly altering the natural hydrologic regime. Once former agricultural land located within Everglades National Park (ENP), the Hole-in-the-Donut (HID) wetland restoration program became the first mitigation bank project in Florida. The HID program utilized a restoration technique of complete soil removal to effectively eradicate an invasive plant species. This research investigated the effects of the vegetation and soil removal on the hydrologic conditions of the HID, specifically evapotranspiration and water chemistry. Annual evapotranspiration rates were determined for the region using remotely sensed data and compared to the acres restored over a 15-year period. Groundwater and surface waters were collected from both inside the HID and from adjacent areas within ENP for major cations and anions and total nutrient concentrations. Evapotranspiration rates were found to decrease from a mean of 1083.4 mm year−1 in the year 2000 to 891.6 mm year−1 in 2014 as the restored area increased to 4893 acres. Concentrations of ions and nutrients were lower in groundwater and surface water within the restored areas compared to adjacent areas. We conclude that the lack of soil cover (along with reduced evapotranspiration rates) contributed to the lower ion and nutrient concentrations in the surface water and groundwater within the HID.
1. Introduction
Wetlands link terrestrial ecosystems with the hydrologic cycle. Wetlands provide a habitat for vegetation and wildlife while also providing ecosystem services such as filtering out pollutants from water, altering and storing floodwaters, processing nutrients, and interacting with groundwater [1,2]. Unfortunately, as much as 50% of wetland area has been lost globally since the turn of the 19th century due to anthropogenic actions [3]. The iconic wetland of the Florida Everglades has similarly been reduced in half of its original size as wetland area was repurposed for agriculture and urban/suburban uses [4], thereby profoundly altering its hydrologic setting and ecosystem services [5]. The Everglades is at the center of a large hydrologic restoration effort aimed at rehabilitating the landscape by increasing water flow and lowering nutrient concentrations in surface water produced from agricultural runoff [6]. The Comprehensive Everglades Restoration Plan (CERP) was passed by the United Stated Congress in 2000 with the goal of restoring the remaining Everglades ecosystem while providing flood protection to population areas from seasonal flooding and ensuring a robust water supply [7]. Currently, ENP encompasses a 600,000 ha protected area that contains an approximately 2700 ha parcel of abandoned agricultural land undergoing restoration [8] known as the Hole-in-the-Donut (HID).
To make the previously inundated land more suitable for farming, a portion of the HID was subjected to rock-plowing—crushing of the limestone bedrock into smaller particles which were then combined with the overlying marl and organic substrate—during the 1950s and 1960s [9,10]. Rock-plowing completely transformed the physical properties of the natural soil in the HID [10]. Prior to farming operations, the HID was inhabited by sawgrass and pine trees, but once farming ceased an exotic species of plant, Brazilian pepper (Schinus terebinthifolius), overgrew areas of the HID where farming was most active [11]. The invasion of exotic plant species into any setting threatens biodiversity, ecosystem functioning, and can alter geomorphological, biogeochemical, and hydrological processes, including groundwater and surface water flow patterns [12,13]. Decades of agricultural practices changed the soil in the HID, allowing for Brazilian pepper to flourish once farming ceased [14].
Within ENP, Brazilian pepper has invaded both disturbed areas (e.g., fallow agricultural fields) and natural areas such as pinelands, hardwood hammocks, and mangrove forests [15]. As recently as 2014, Brazilian pepper occupied approximately 30,000 ha, giving it the unsavory title as the most extensive and abundant invasive species within ENP [16]. Initially, the occurrence of Brazilian pepper in the HID was attributed to the actions of rock plowing combining calcium carbonate with phosphorus (P) fertilizers, creating conditions of high P in an otherwise naturally oligotrophic landscape [17]. However, subsequent studies determined that the presence of arbuscular mycorrhizal (AM) fungi in the soil paired with seed dispersal by birds facilitated the establishment and growth of Brazilian pepper in the HID [18,19,20]. Subsequent efforts taken by land managers with the aim of eradicating Brazilian pepper included mowing, burning, and soil removal. Complete soil removal (CSR) was deemed the most effective method in eradicating Brazilian pepper in the HID [8] when soil substrate was scraped down to the bedrock in an initial trial plot in 1989 [8].
Other studies have documented the removal of top soil as an effective method for wetland restoration around the world. Positive benefits of the method include changes in nutrient concentrations, groundwater levels, and recolonization of native species after restoration. In Dutch fen meadows, top soil removal increased groundwater discharge to the wetland and decreased nutrient availability, conditions conducive for the reestablishment of the native fen-meadow species [21,22]. In German fen meadows, removal of degraded peat top soils resulted in less P release after rewetting and promoted long-term low nutrient conditions after prolonged rewetting [23]. Furthermore, a study of top-soil removal from former agricultural land in northeastern Ohio documented increased water levels and removal of the seed banks of invasive species thereby promoting the reestablishment of obligate wetland species [24].
There is a lack of literature documenting the effects of soil removal as a restoration method to changes in local hydrologic conditions as top soil removal is often considered a, “radical restoration method” [22]. For the most part, investigations in the HID of ENP have centered on the ecophysiology of Brazilian pepper and how it became established in the area [9,15,25]. There was an effort to examine surface water levels in some restored areas [11,26]. Another study documented changes in nutrient limitation from a dominantly nitrogen (N)-limited condition immediately after restoration to both P and N limiting after 16 years [27]. Conspicuously missing from these prior investigations of remediation efforts in the HID are documented changes in evapotranspiration an important component of the water cycle or assessment of groundwater chemistry. The earlier research provides a basic understanding of hydrologic conditions within the HID, but additional research is needed to further understand how restoration efforts in the HID has benefited ENP.
The goal of many wetland restoration projects is to restore the hydrologic conditions necessary to support the native vegetation [1]. As evapotranspiration (ET) is a mechanism responsible for loss of water from an area, accurate quantification of ET is considered paramount [1]. In terms of Brazilian pepper, ET rates are considered to be high ranging from a maximum of 5.48 mm day−1 in October to a minimum of 2.86 mm day−1 in May [28]. A complete removal of Brazilian pepper is expected to decrease ET rates within the HID [28,29]. Moreover, the replacement of the deeper-rooting Brazilian pepper with more shallow-rooting plants, namely grasses, has the potential to reduce ET since shallow-rooting grasses cannot tap into deeper groundwater [30,31].
Remote sensing techniques have proven useful in estimating changes in ET of remediated wetlands before and after restoration in Minnesota and Florida [1]. In those settings, ET was found to increase after restoration [1]. In a California river valley, with areas designated for wetland restoration, a combination of remote sensing methods detected a reduction in ET in fallow areas that were previously croplands [32].
Water quality, specifically ion and nutrient concentrations, are of importance for the restoration of many wetlands. For instance, in California’s Central Valley, restored wetland areas were found to retain nutrients [33]. The Everglades is classified as oligotrophic and the input of additional constituents and nutrients can cause cascading ecological effects such as shifts in species composition of primary producers [34]. Major ions (cations and anions) have proven useful in identifying sources of water as well as groundwater-surface water interactions in ENP [35]. Furthermore, one study found that major ion and nutrient concentrations of surface water and groundwater of coastal mangroves in the Everglades correlated with satellite measured spectral reflectance data [36]. Despite the more than 25 years of restoration efforts in the HID, the water chemistry of surface water or groundwater in the area, is still unknown.
Understanding the hydrologic response to the CSR effort is needed to assess the overall health of the restored wetland area of the HID and for evaluating the restoration efforts going forward. The goals of this investigation are to identify changes in evapotranspiration within the HID as restoration progressed as well as to document surface water and groundwater quality. Two main hypotheses were tested: (1) ET rates decrease as a result of CSR and (2) concentrations of dissolved ions and nutrients are lower outside of the restored HID where neither farming nor Brazilian pepper were prevalent. To test these hypotheses, changes in ET with time were quantified by a remote sensing technique. Furthermore, water chemistry was determined for both surface water and groundwater within and adjacent to the HID. The CSR restoration effort was expected to result in a decrease in rates of ET as well as a decrease in the concentration of major ions and nutrients in the restored area’s groundwater. This research is novel in investigating both changes in ET and the potential for improving water quality of a wetland remediation effort aimed at eradicating an invasive plant.
2. Study Area and Methods
2.1. Site Description
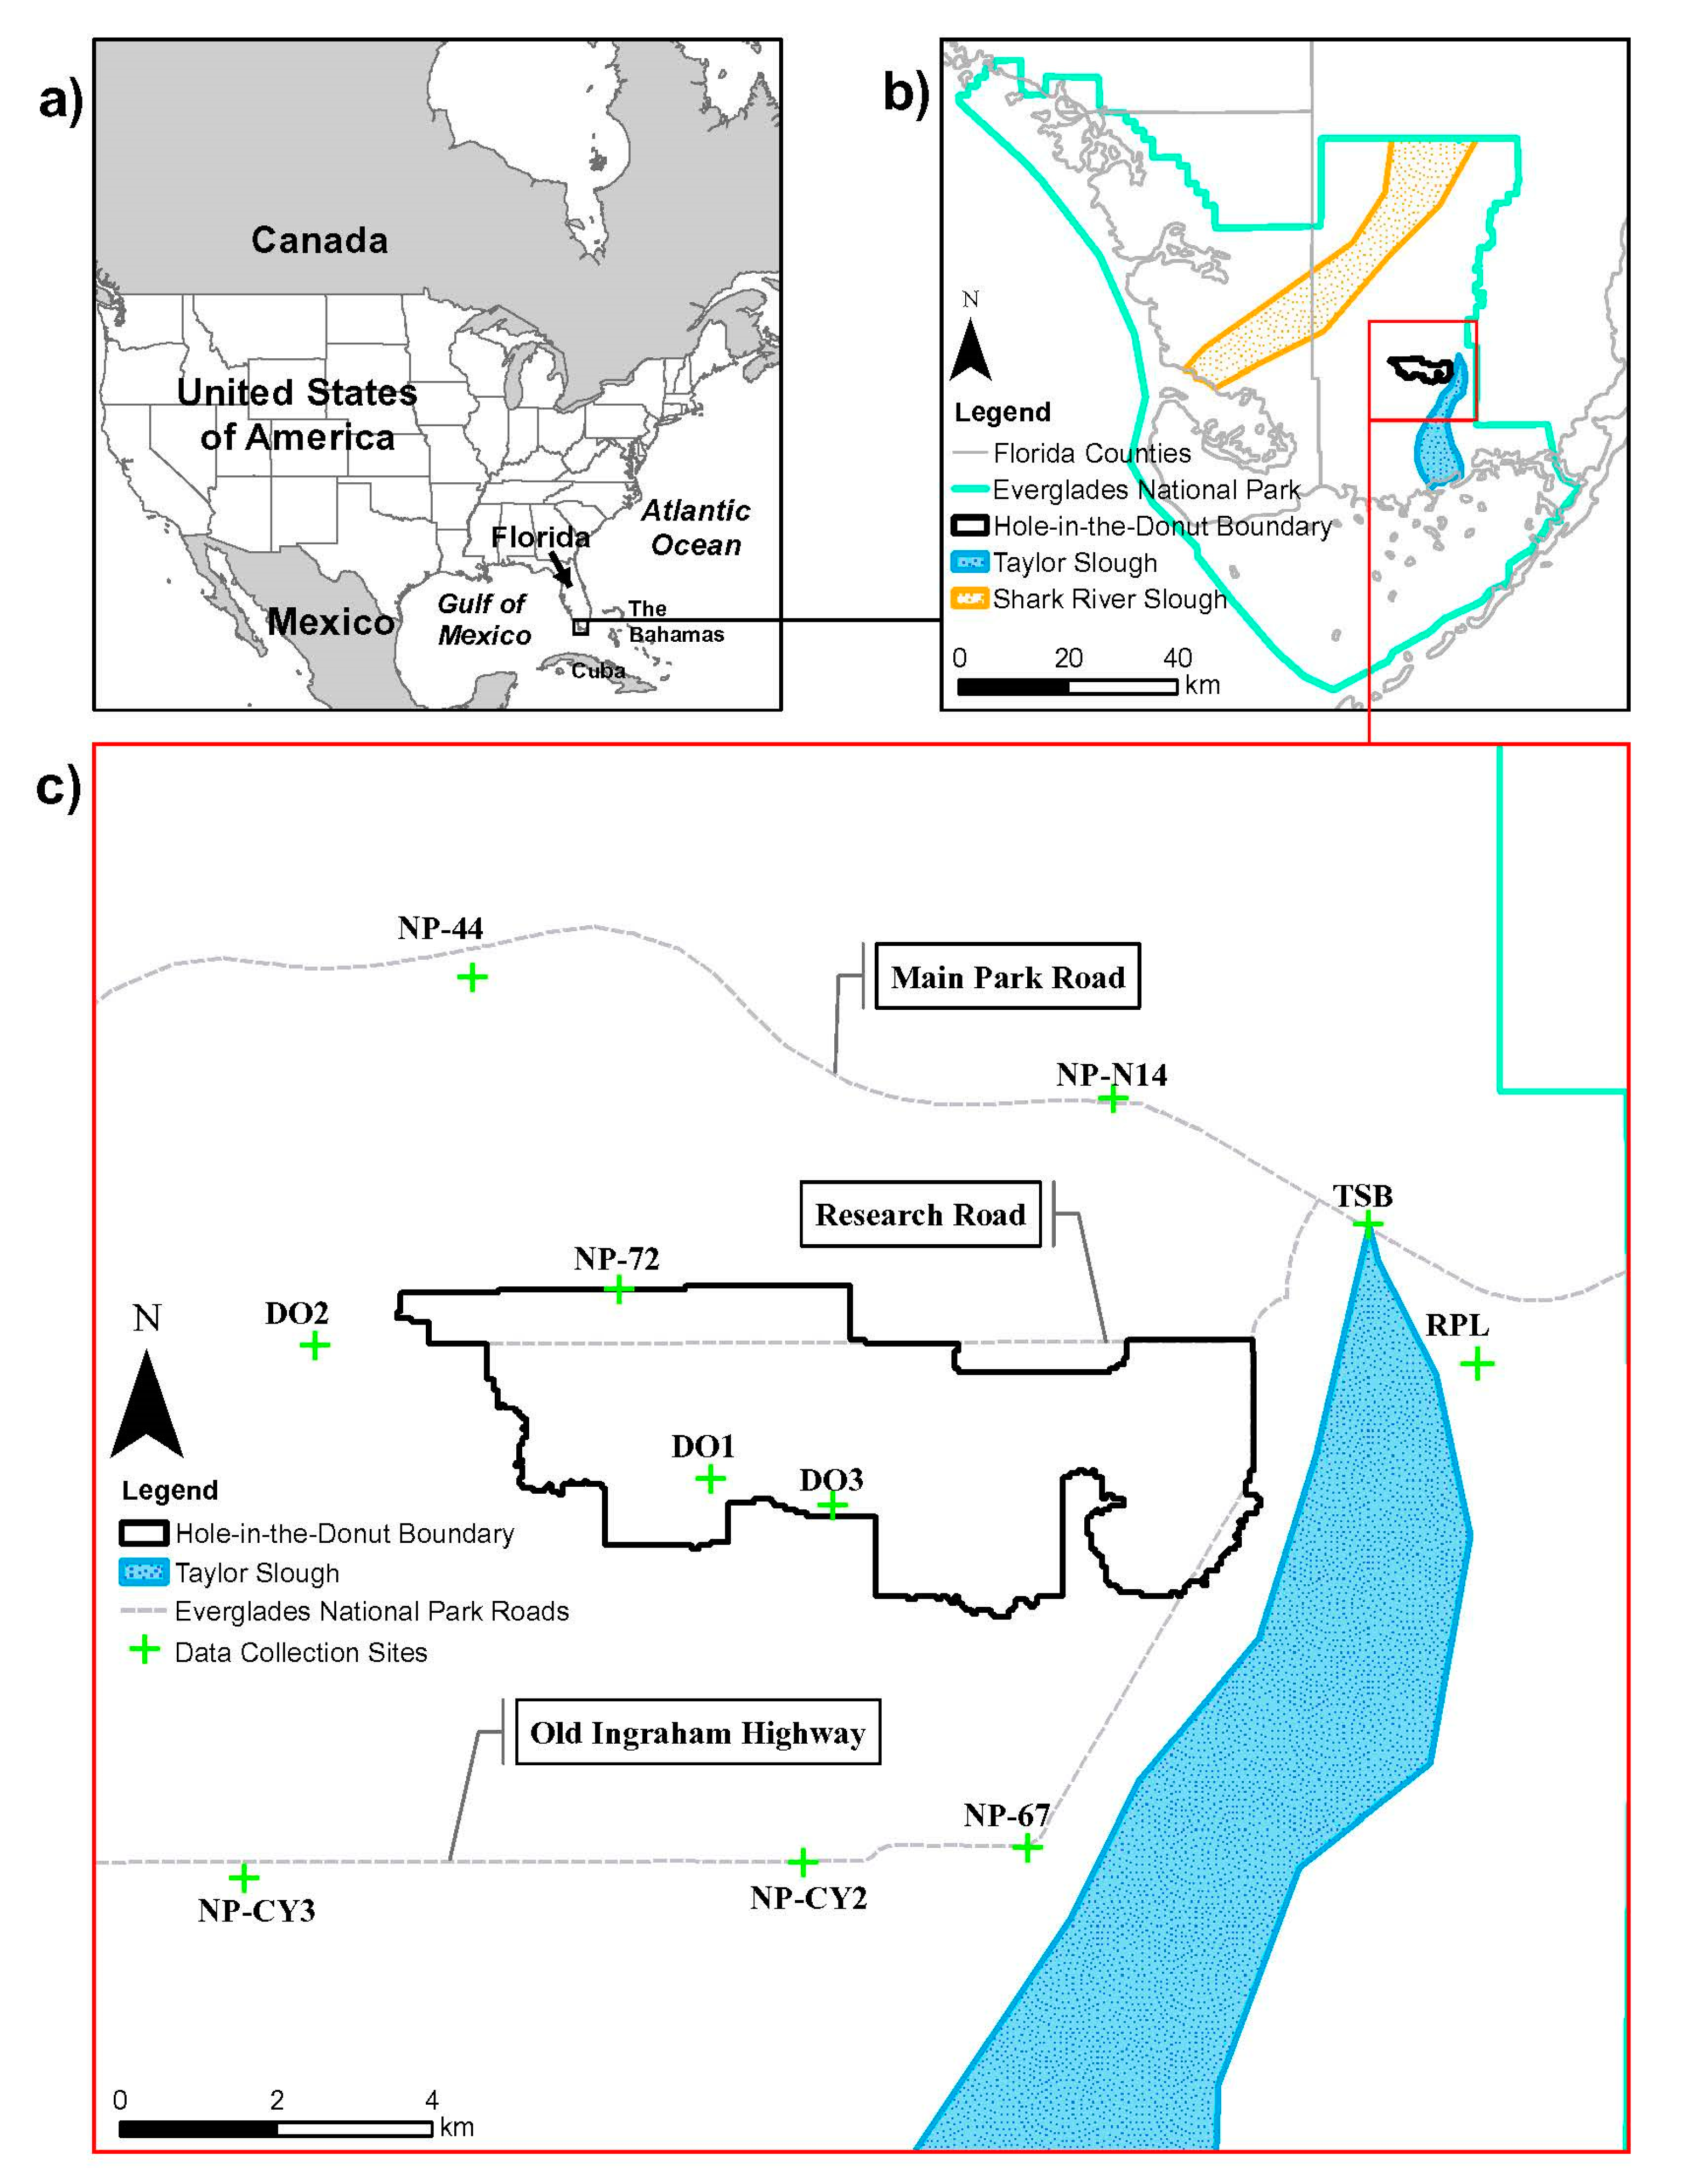
This research was conducted in the HID (25°40′~25°32′ N, −80°69′~−80°60′ W) located in the southern region of Florida (USA) in ENP (Figure 1). The HID is a 2670 ha parcel of land located on a slightly elevated region of limestone bedrock just to the west of Taylor Slough (Figure 2). Prior to farming, the land cover in the HID was characterized as a mixture of pine rockland in the north and marl prairie in the south [25,37]. By 1940, land cover was dominantly marl prairie (63.3%), followed by agriculture (21.6%), pine rockland (14.7%) and hardwood hammock (0.4%) [37]. Soils in the HID are classified according to the depth to the bedrock. Soil is classified as Biscayne marl in areas where the depth to limestone bedrock is ≤51 cm, and Perrine marl if the depth to the bedrock is between 51 and 102 cm [38]. The average soil depth was reported as 56.3 cm in the unfarmed, native vegetation areas of the HID and ranged from 5.8 cm to 9.5 cm in the restored areas [26].
The climate of south Florida is subtropical divided into wet (May–October) and dry seasons (November–April), with most of the rain (70%) falling in the wet season [39,40]. Average annual rainfall is about 140 cm as determined at the Royal Palm Ranger Station (RPL), just outside the HID (Figure 2) [40]. ET is higher in the summer months when solar irradiance is highest and surface water is available for evaporation [39].
The underlying bedrock of south Florida consists of highly porous and permeable limestone units of the Miami Limestone and Fort Thompson Formations of the Biscayne Aquifer [41]. An unconfined aquifer, the Biscayne Aquifer forms the top of the surficial aquifer system (SAS) [41]. The thickness of the SAS varies laterally, extending to a depth of ~30 m beneath ENP and increasing to a depth of 240 m along the eastern coastline of peninsula Florida [41]. The Biscayne Aquifer is considered the sole source aquifer for south Florida. With a high transmissivity exceeding 3 × 10⁷ m2 year−1 and hydraulic conductivities as high as 4.4 × 10⁶ m year−1, the Biscayne Aquifer may be of the most productive aquifers in the world [41].
Figure 1.
The location of the Hole-in-the-Donut area of Everglades National Park (ENP), Florida, USA. Adapted from [42]. The green crosses represent long-term hydrologic data collection sites within ENP.
Figure 1.
The location of the Hole-in-the-Donut area of Everglades National Park (ENP), Florida, USA. Adapted from [42]. The green crosses represent long-term hydrologic data collection sites within ENP.

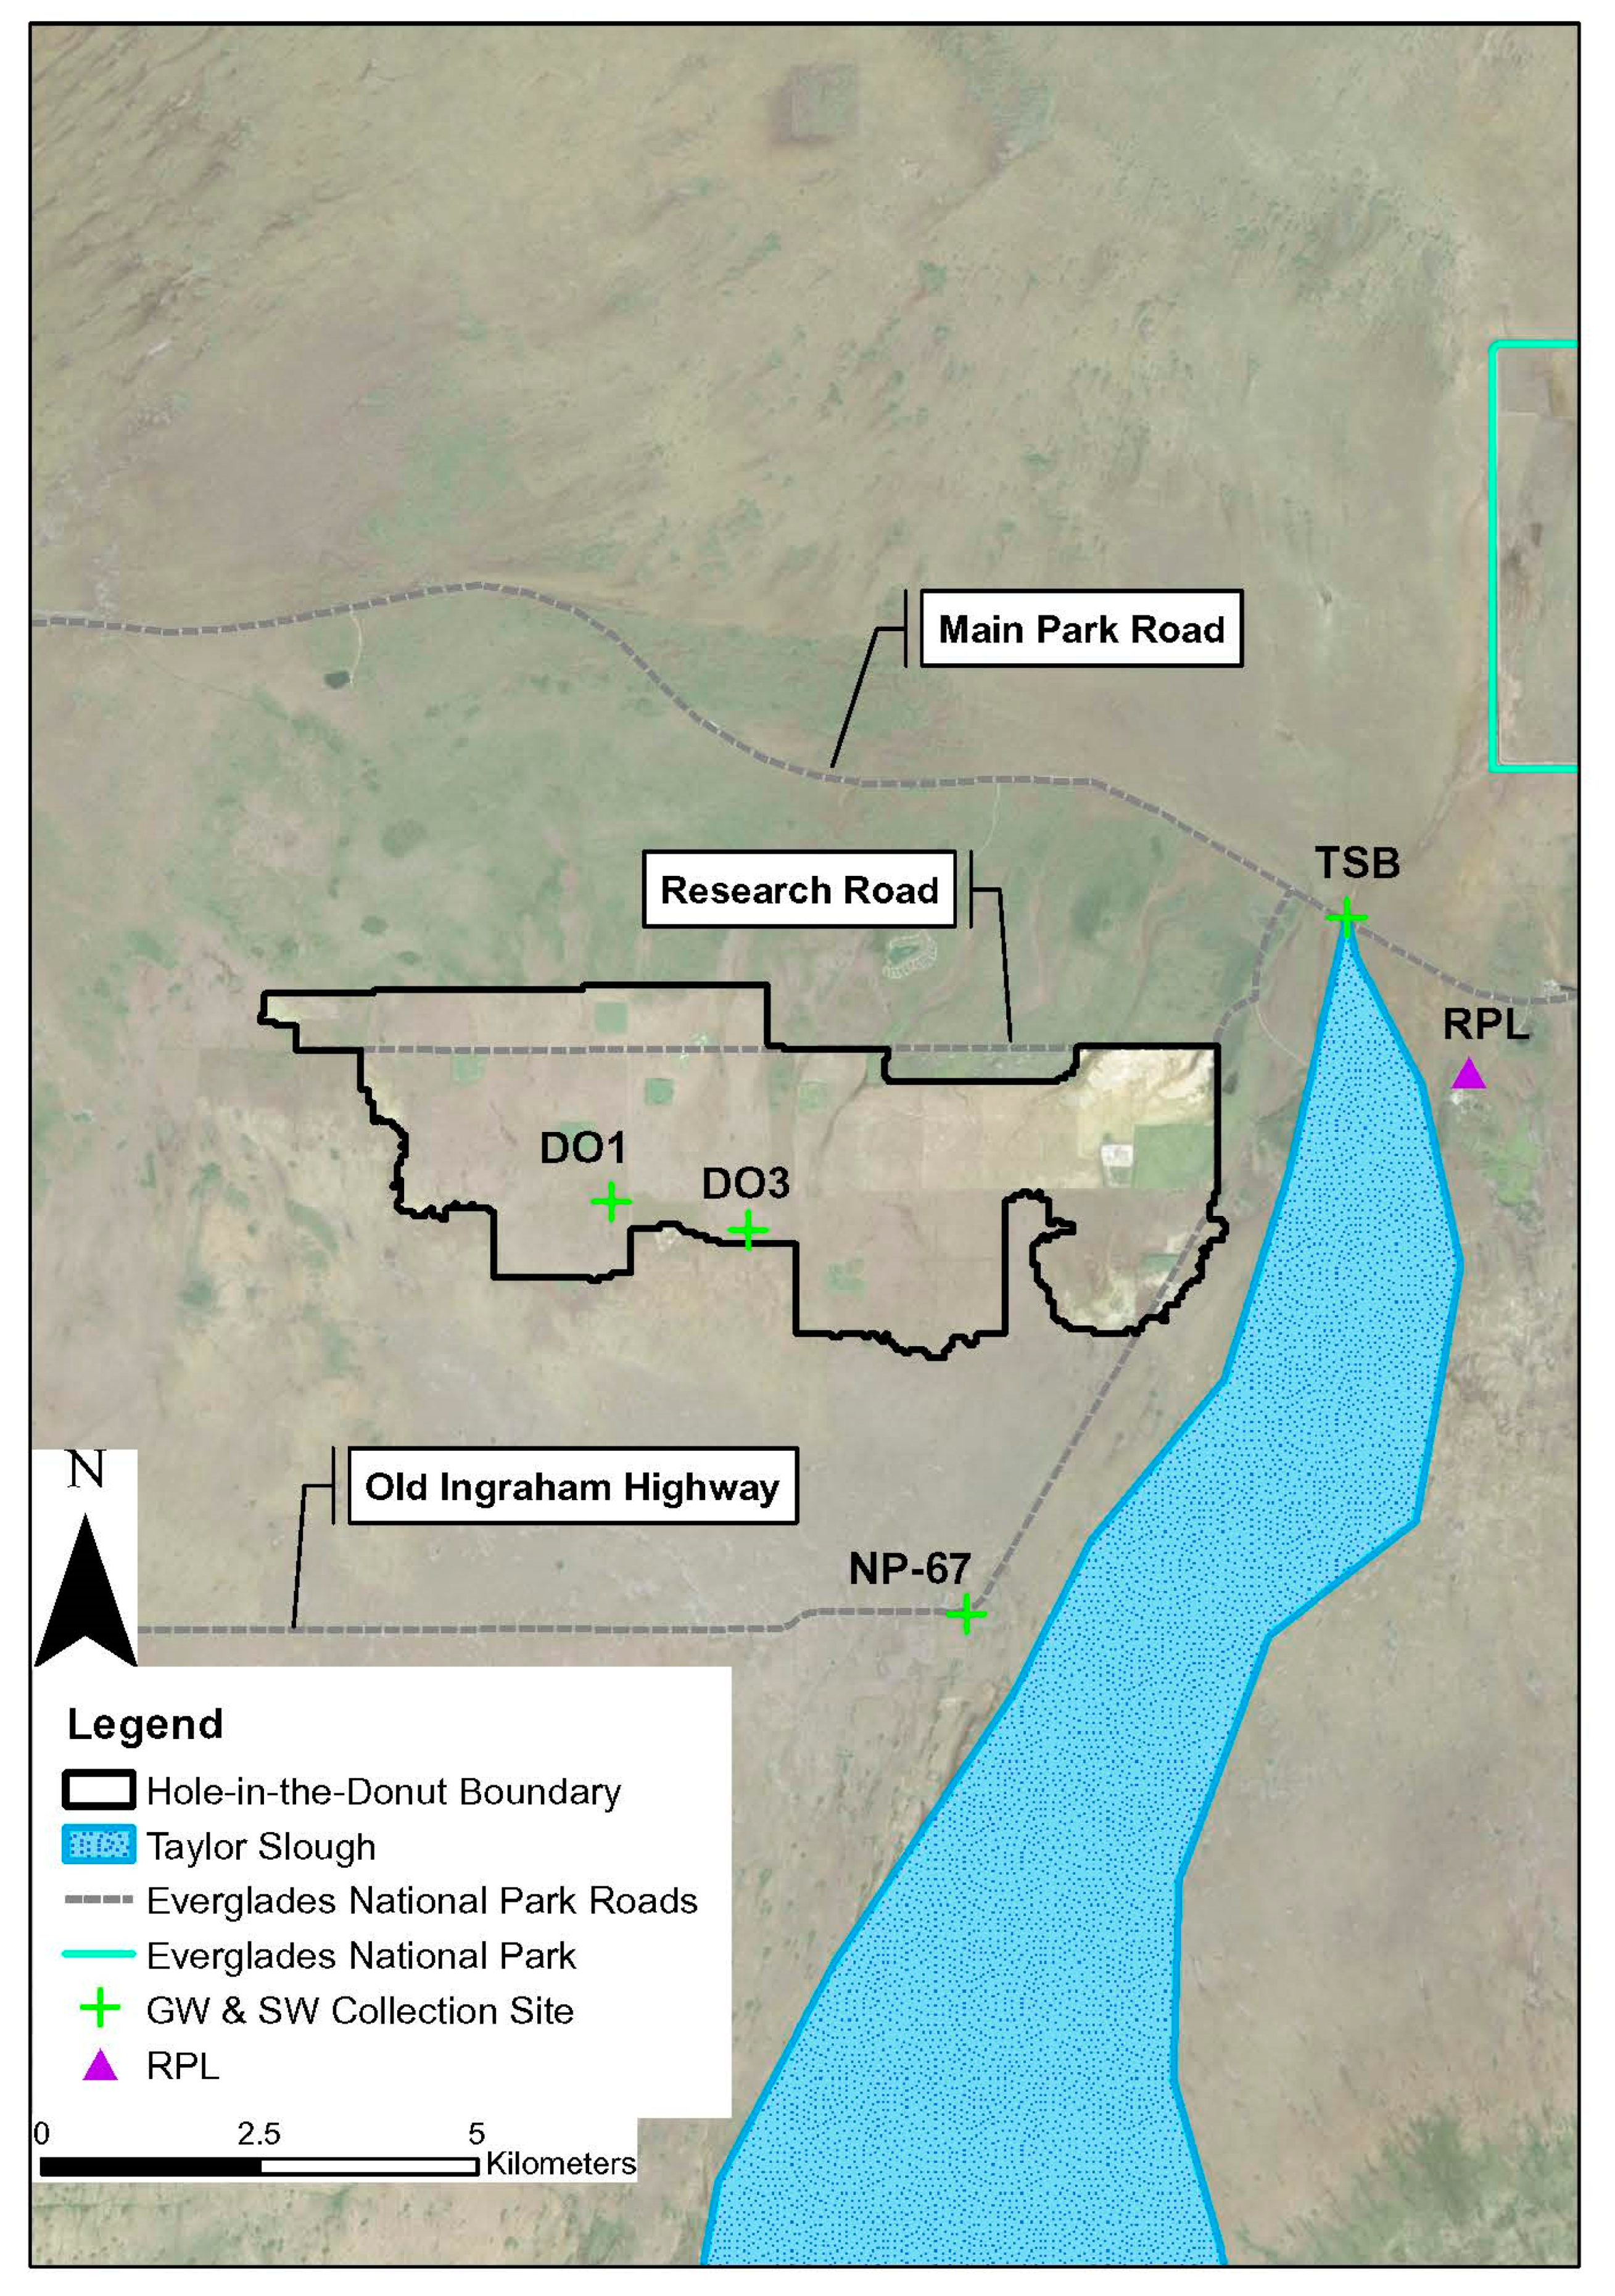
Figure 2.
The Hole-in-the-Donut as visible from satellite imagery (courtesy of ESRI, 2022). A green cross symbolizes a groundwater (GW) and surface water (SW) collection site and the purple triangle denotes a rain collection station. DO indicates a monitoring well inside the HID; TSB corresponds to ‘Taylor Slough Bridge’; NP indicates ‘National Park’; and RPL is ‘Royal Palm’.

The entirety of the HID is underlain by the highly permeable units of the Biscayne Aquifer, and overlain by mixtures of marl and peat soils of lower hydraulic conductivity [41]. Left in place, the marl and peat soils may impede the interactions between groundwater and surface water in the area. Upon removal of the topsoil in the HID, the potential for groundwater and surface water interaction is expected to increase.
As a result of the low elevation and relatively flat topography of south Florida, measured groundwater levels produce a low hydraulic gradient of 0.00005 across ENP [35]. The near horizontal landscape causes surface water in ENP to flow slowly in sloughs. Shark Slough, the largest slough in ENP flows into the Gulf of Mexico (Figure 1). Taylor Slough is a smaller slough in ENP and flows south into Florida Bay [43] (Figure 1).
2.2. Evapotranspiration Modeling
The methods for this research were first described in detail in [42] and summarized herein. The first hypothesis (that ET rates would decrease as a result of CSR) was tested from remotely sensed data of ET in the HID. Remote sensing provides an efficient method to monitor regional and global ET information across the Earth’s surface [44]. NASA’s Terra and Aqua satellites have the Moderate Resolution Imaging Spectroradiometer (MODIS) onboard, allowing for the collection of information on vegetation dynamics and surface energy variations [45]. MODIS sensors record data to provide high radiometric sensitivity in 36 spectral bands ranging in wavelengths from 0.4 to 14.4 μm (https://modis.gsfc.nasa.gov/about/design.php accessed on 1 January 2016). Wavelength of 29 spectral bands are collected at a resolution of 1 km, which was the resolution used for this project. Remotely sensed parameters, including albedo, land cover, leaf area index (LAI), fraction of photosynthetically active radiation (FPAR), are combined with surface meteorological observations including air temperature, humidity, solar radiation, and wind speed [44]. These parameters are input into an algorithm that uses the logic of the Penman–Monteith equation, which results in an estimate of land surface ET. The ET data has been calibrated and validated with ET measured at Eddy Flux towers from 232 watersheds around the world [44]. Limitations of the method are that the algorithm does not account for the vegetation age, disturbance history, or species composition, resulting in differences between tower ET measurements and ET estimates by the algorithm [44].
The MODIS ET data were obtained from the Numerical Terradynamic Simulation Group (NTSG) (http://files.ntsg.umt.edu/data/NTSG_Products/MOD16/MOD16A3.105_MERRAGMAO/ accessed on 1 January 2016). at the University of Montana. The data were provided in a 1 km × 1 km grid, and collected monthly for the years 2000–2005 and 2009–2014. The monthly data was averaged into one image for the entire year. After the data were obtained from NTSG, they were transferred and stored in a geodatabase in ArcGIS for further analysis. Once in ArcGIS, the data were first converted to the “UTM_17_N” coordinate system using the Project Raster tool in the ArcToolbox. The coordinate system had units of meters and preserved the original pixel size of the data. All maps created in this study used the coordinate projection. After the data were projected to the new coordinate system, the image was clipped to only include the HID using the Extract by Mask tool in the ArcToolbox. Since the HID was a relatively small component of ENP and the cell size of the MODIS image was coarse, a resampling of the cell size was performed. The Resample tool in ArcToolbox allowed for the pixel size to be changed to a smaller size. The cubic resampling method was selected to reduce the pixel size of the MODIS images to 46 m × 46 m, to improve the appearance of the data and remove the sharp corners of the images.
The resulting annual ET data for the HID were compared to estimates of the acres restored each year. The annual acreage restored was computed by creating polygons in Google Earth to measure the extent of soil removal each December in the following years: 2000–2005 and 2009–2014. Google Earth’s historical aerial photographs (provided from Landsat/Copernicus satellites) clearly depicted restoration progress as the complete soil removal left the white, native limestone bedrock visible by eyesight in the photographs.
2.3. Groundwater and Surface-Water Chemistry
The second hypothesis (that concentrations of dissolved ions and nutrients would be lower outside of the HID where farming and Brazilian pepper were not prevalent) was addressed by collecting groundwater and surface-water samples inside and outside the HID. Water collection and analytical methods were described first in detail in [42] and summarized herein. Groundwater and four surface waters were collected from four sites (Figure 2). The sites were sampled four times: in December 2015 and in May, September, and December 2016. The four sites included: DO1, DO3, NP-67, and TSB (Figure 2). Wells DO1 and DO3 were located within two restored parcels of the HID wetland, while wells NP-67 and TSB were in wetland areas outside of the HID. Wells DO1, DO3, and NP-67 were encased in PVC pipe and circumscribed into wooden platforms fitted with metal covers. Well TSB was flush mounted with the ground surface and protected at the surface by a metal cover. The installation and depths of the three wells varied: DO1 was 7.5 m deep and installed in 1989; DO3 was 3 m deep and installed in 2000; NP-67 was 5.6 m deep and installed in 1960; TSB was 4.1 m deep and installed in 1997.
To collect groundwater and surface-water samples in the field, a gas-powered pump was used to purge three well volumes before sampling and then a peristaltic pump was used to collect the samples. If present, surface-water samples were collected adjacent to each well. At each sampling location, two samples were filtered through a 0.45 μm membrane filter, and two unfiltered samples were collected and stored on ice at 4 °C and transported to Florida International University (FIU) for final storage. Samples for total phosphorus and cations were preserved with 10% hydrochloric acid.
The Nutrient Analysis Laboratory at FIU analyzed the groundwater and surface-water samples for total nitrogen (TN) using an Antek TN analyzer (Antek Instruments, Houston, TX, USA) and for total organic carbon (TOC) using a Shimadzu TOC-V, Analyzer (Shimadzu Corporation, Columbia, MD, USA). Total phosphorus (TP) was analyzed following [46]. The FIU Soil/Sediment Biogeochemistry Laboratory analyzed the groundwater and surface-water samples for soluble reactive phosphorus (SRP), nitrate (NO3), and ammonium (NH4) using an Alpkem Rapid Flow Analyzer with 2-Channel ER Detector. The FIU Hydrogeology Laboratory analyzed the groundwater and surface-water samples for total alkalinity using a Gran titration method with a Brinkman TitrinoTM 751 Titrator. As the pH of the water samples varied between 6.02 and 7.69 [42], the total alkalinity results were reported in mg/L of HCO3−. Major anions (chloride [Cl−] and sulfate [SO42−]) and cations (calcium [Ca2+], magnesium [Mg2+], sodium [Na+], and potassium [K+]) were determined using a Dionex-120TM Ion Chromatograph.
2.4. Statistical Analysis
Box-and-whisker plots were created to graphically depict the statistical distribution of nutrient concentrations as a function of sampling location [42]. A one-way analysis of variance (ANOVA) was used to test if differences among sites were significant. Then a Tukey’s honest significance difference (HSD) post hoc test was performed to identify which sites differed from others.
3. Results
3.1. Evapotranspiration Modeling
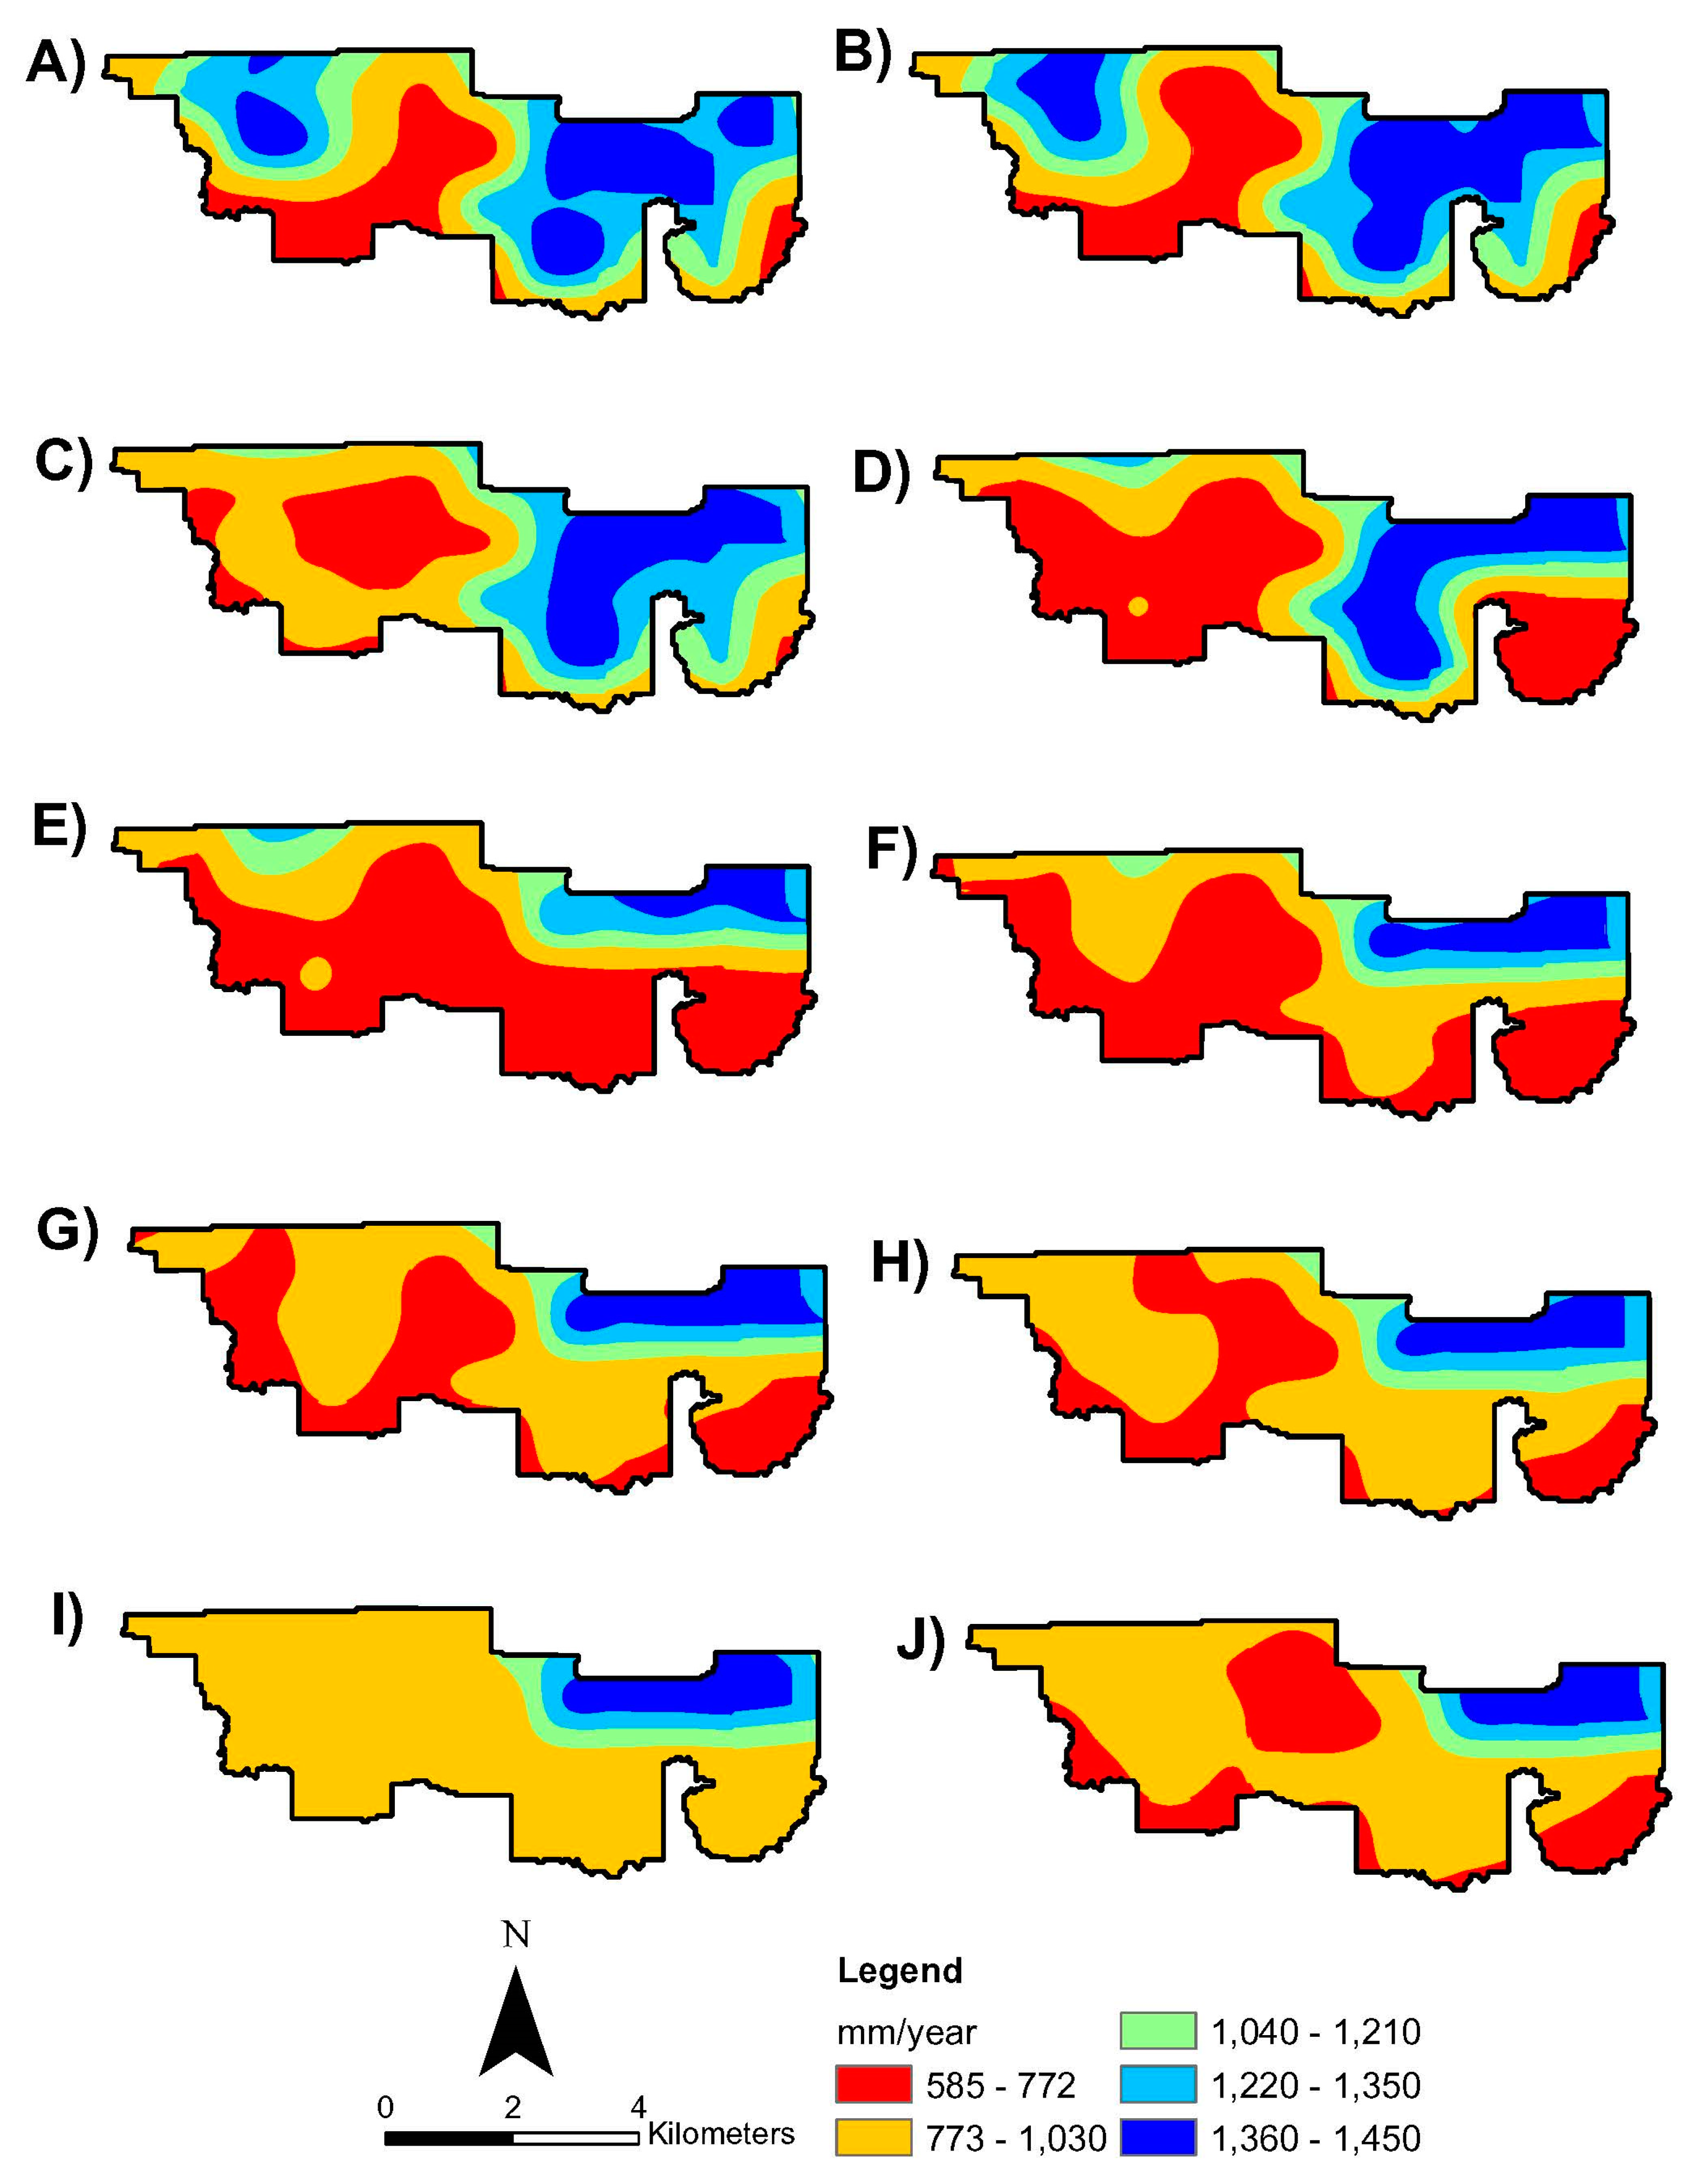
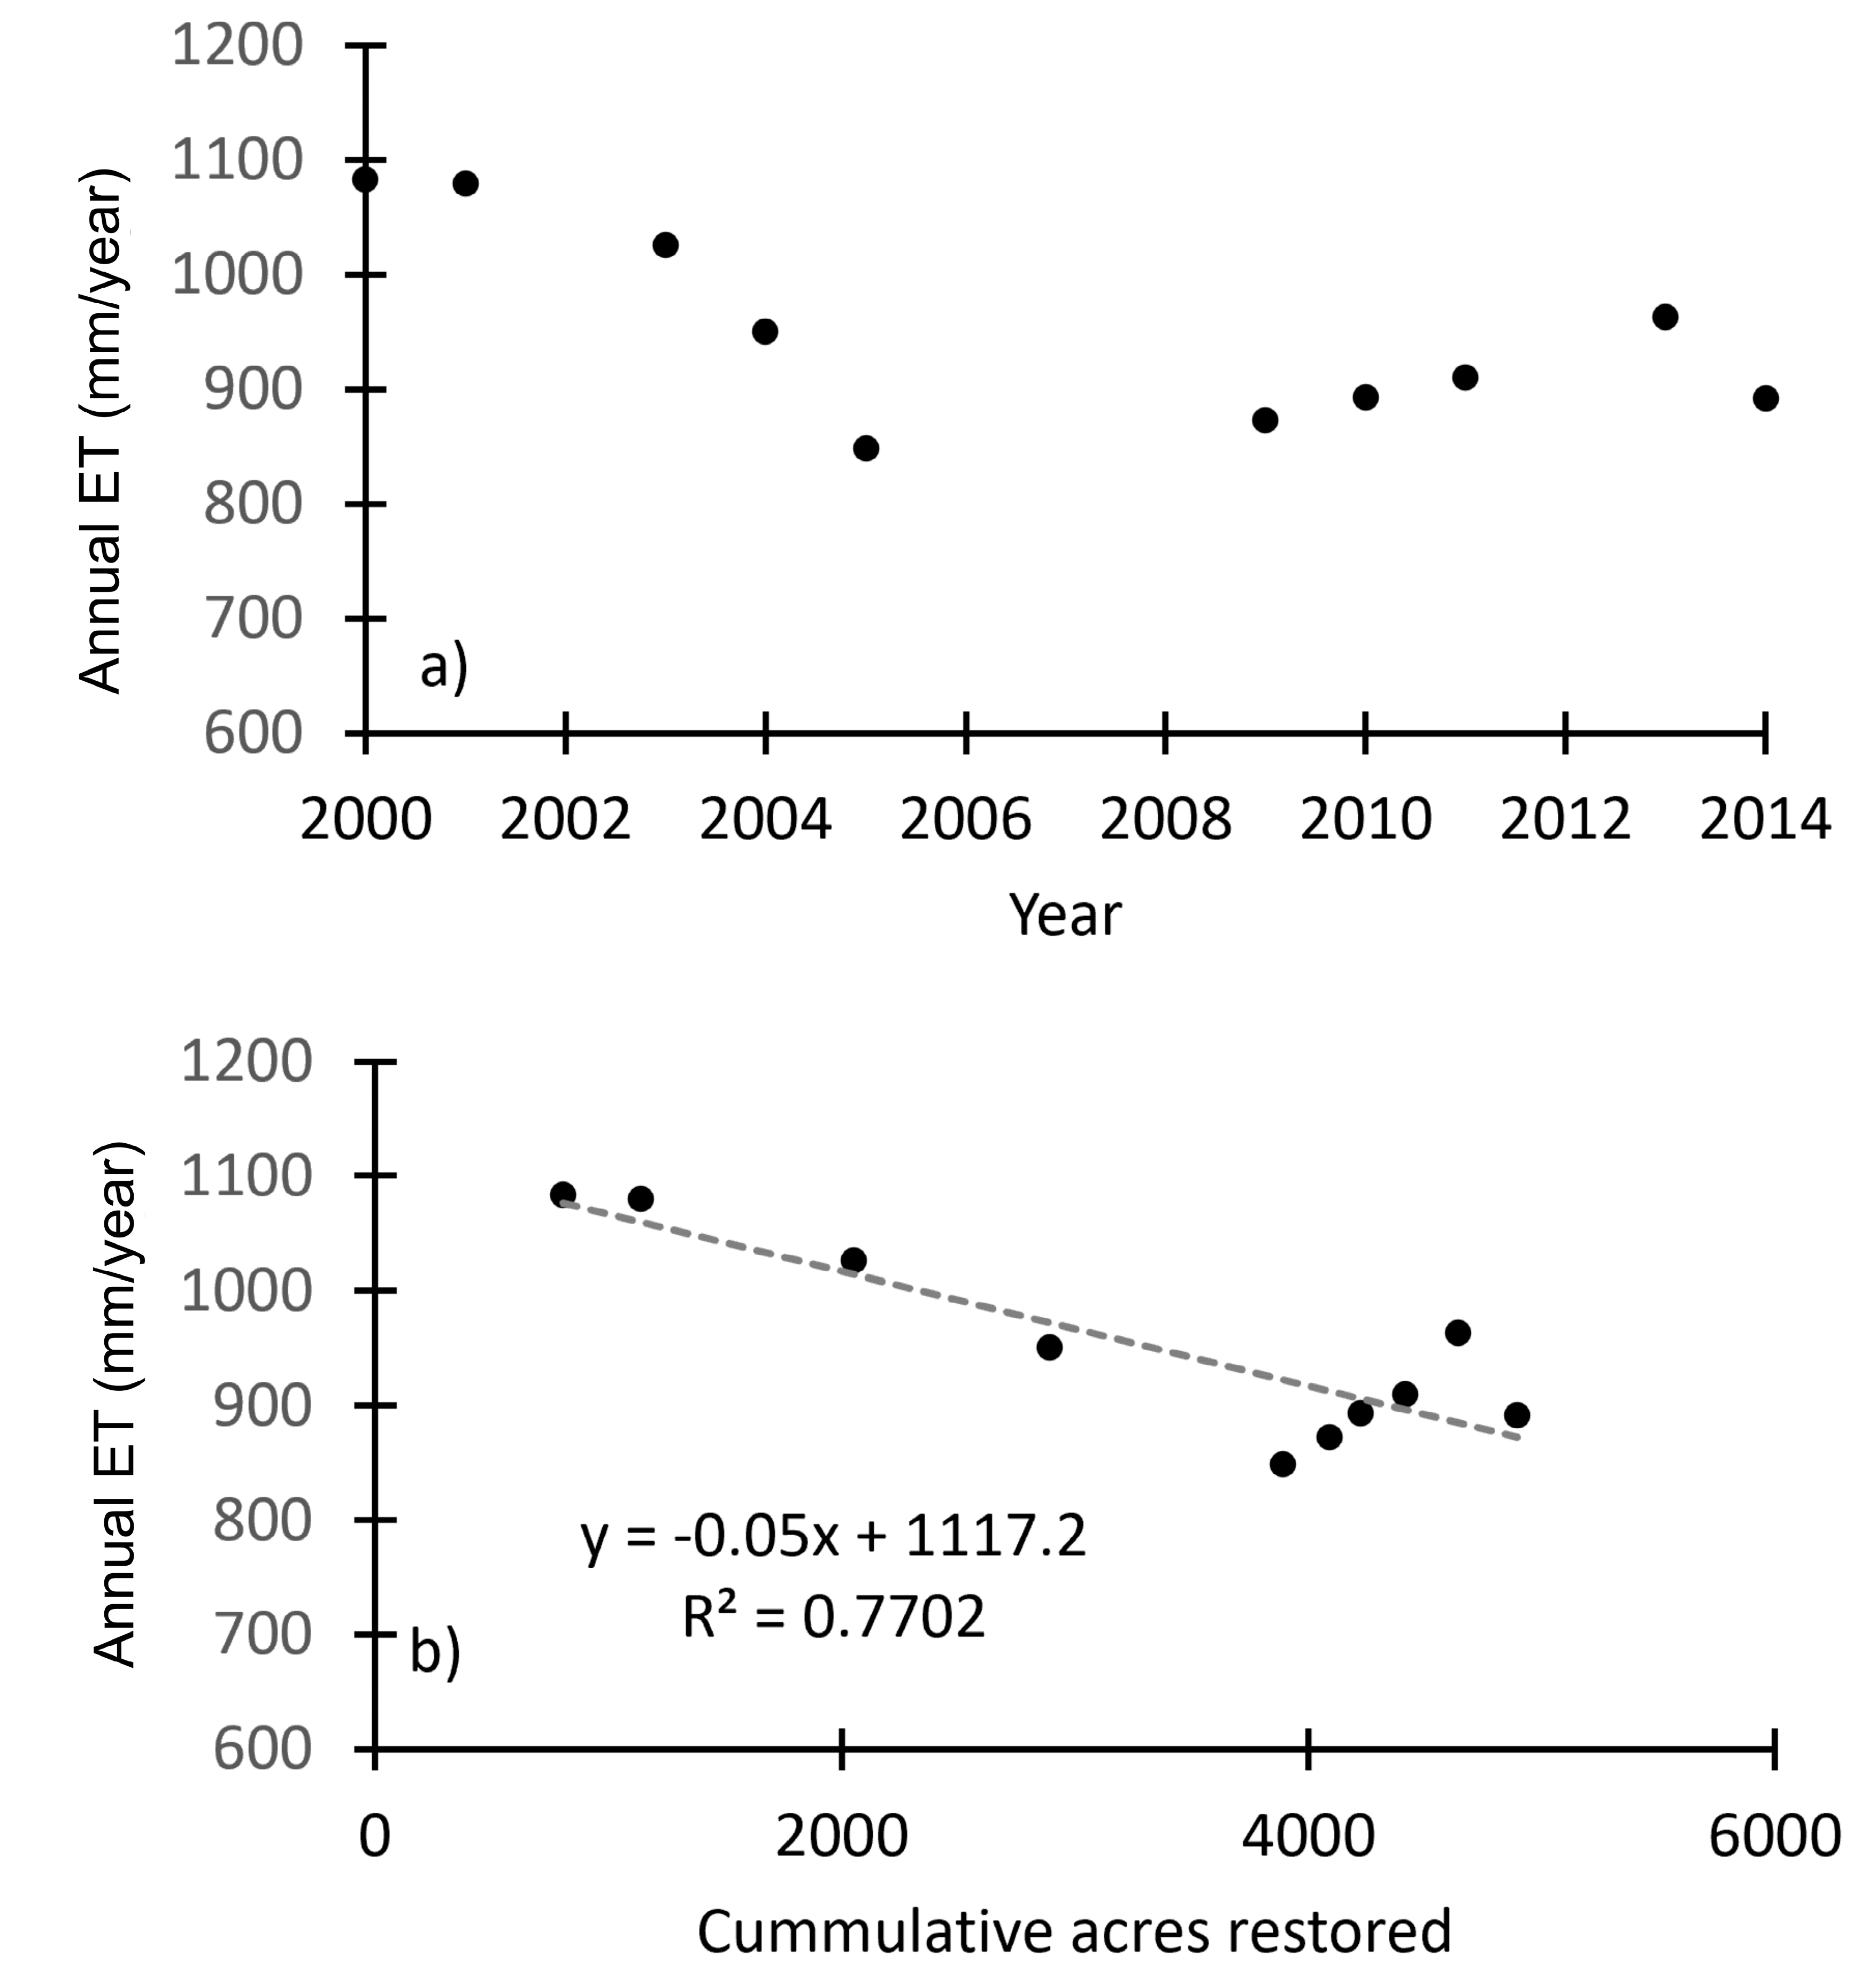
Annual ET maps from 2000–2014 showed a reduction in ET rates over time (Figure 3). After CSR was employed to remove the invasive Brazilian pepper, the ET rate was reduced approximately by a factor of two in each restored plot. For example, the restoration plot area restored in 2004 had a maximum ET of 1326.2 mm year−1 in 2003 the year prior to restoration, indicative of the high rates of ET associated with the Brazilian pepper. After completion of restoration in 2004, the maximum ET observed in Res2004 was 773.7 mm year−1. A similar trend in reduction of ET following restoration was observed in every plot restored in the HID, although the magnitude differed slightly. The highest mean ET obtained for the HID was 1083.4 mm year−1 in 2000, when only 808 acres was restored (Table 1). The lowest mean ET value observed was 848.7 mm year−1, after 3890 acres had been restored (Table 1). The downward trend in ET following active restoration continued through the end of 2005. There was no active restoration from 2006 through the end of 2008 (Figure 4a), thereby allowing natural vegetation re-establishment. As a result of the break in active restoration, increases in mean ET were observed from 2009 through 2013, although they were still lower than observed at the start of 2000 (Figure 4a). There was another observed downturn in ET following restoration in 2014 (Figure 4a). A linear regression between acres restored as the predictor variable and mean ET rate as the response variable (Figure 4b), resulted in a significant negative relationship (R2 = 0.77; p < 0.001).
3.2. Groundwater and Surface-Water Chemistry
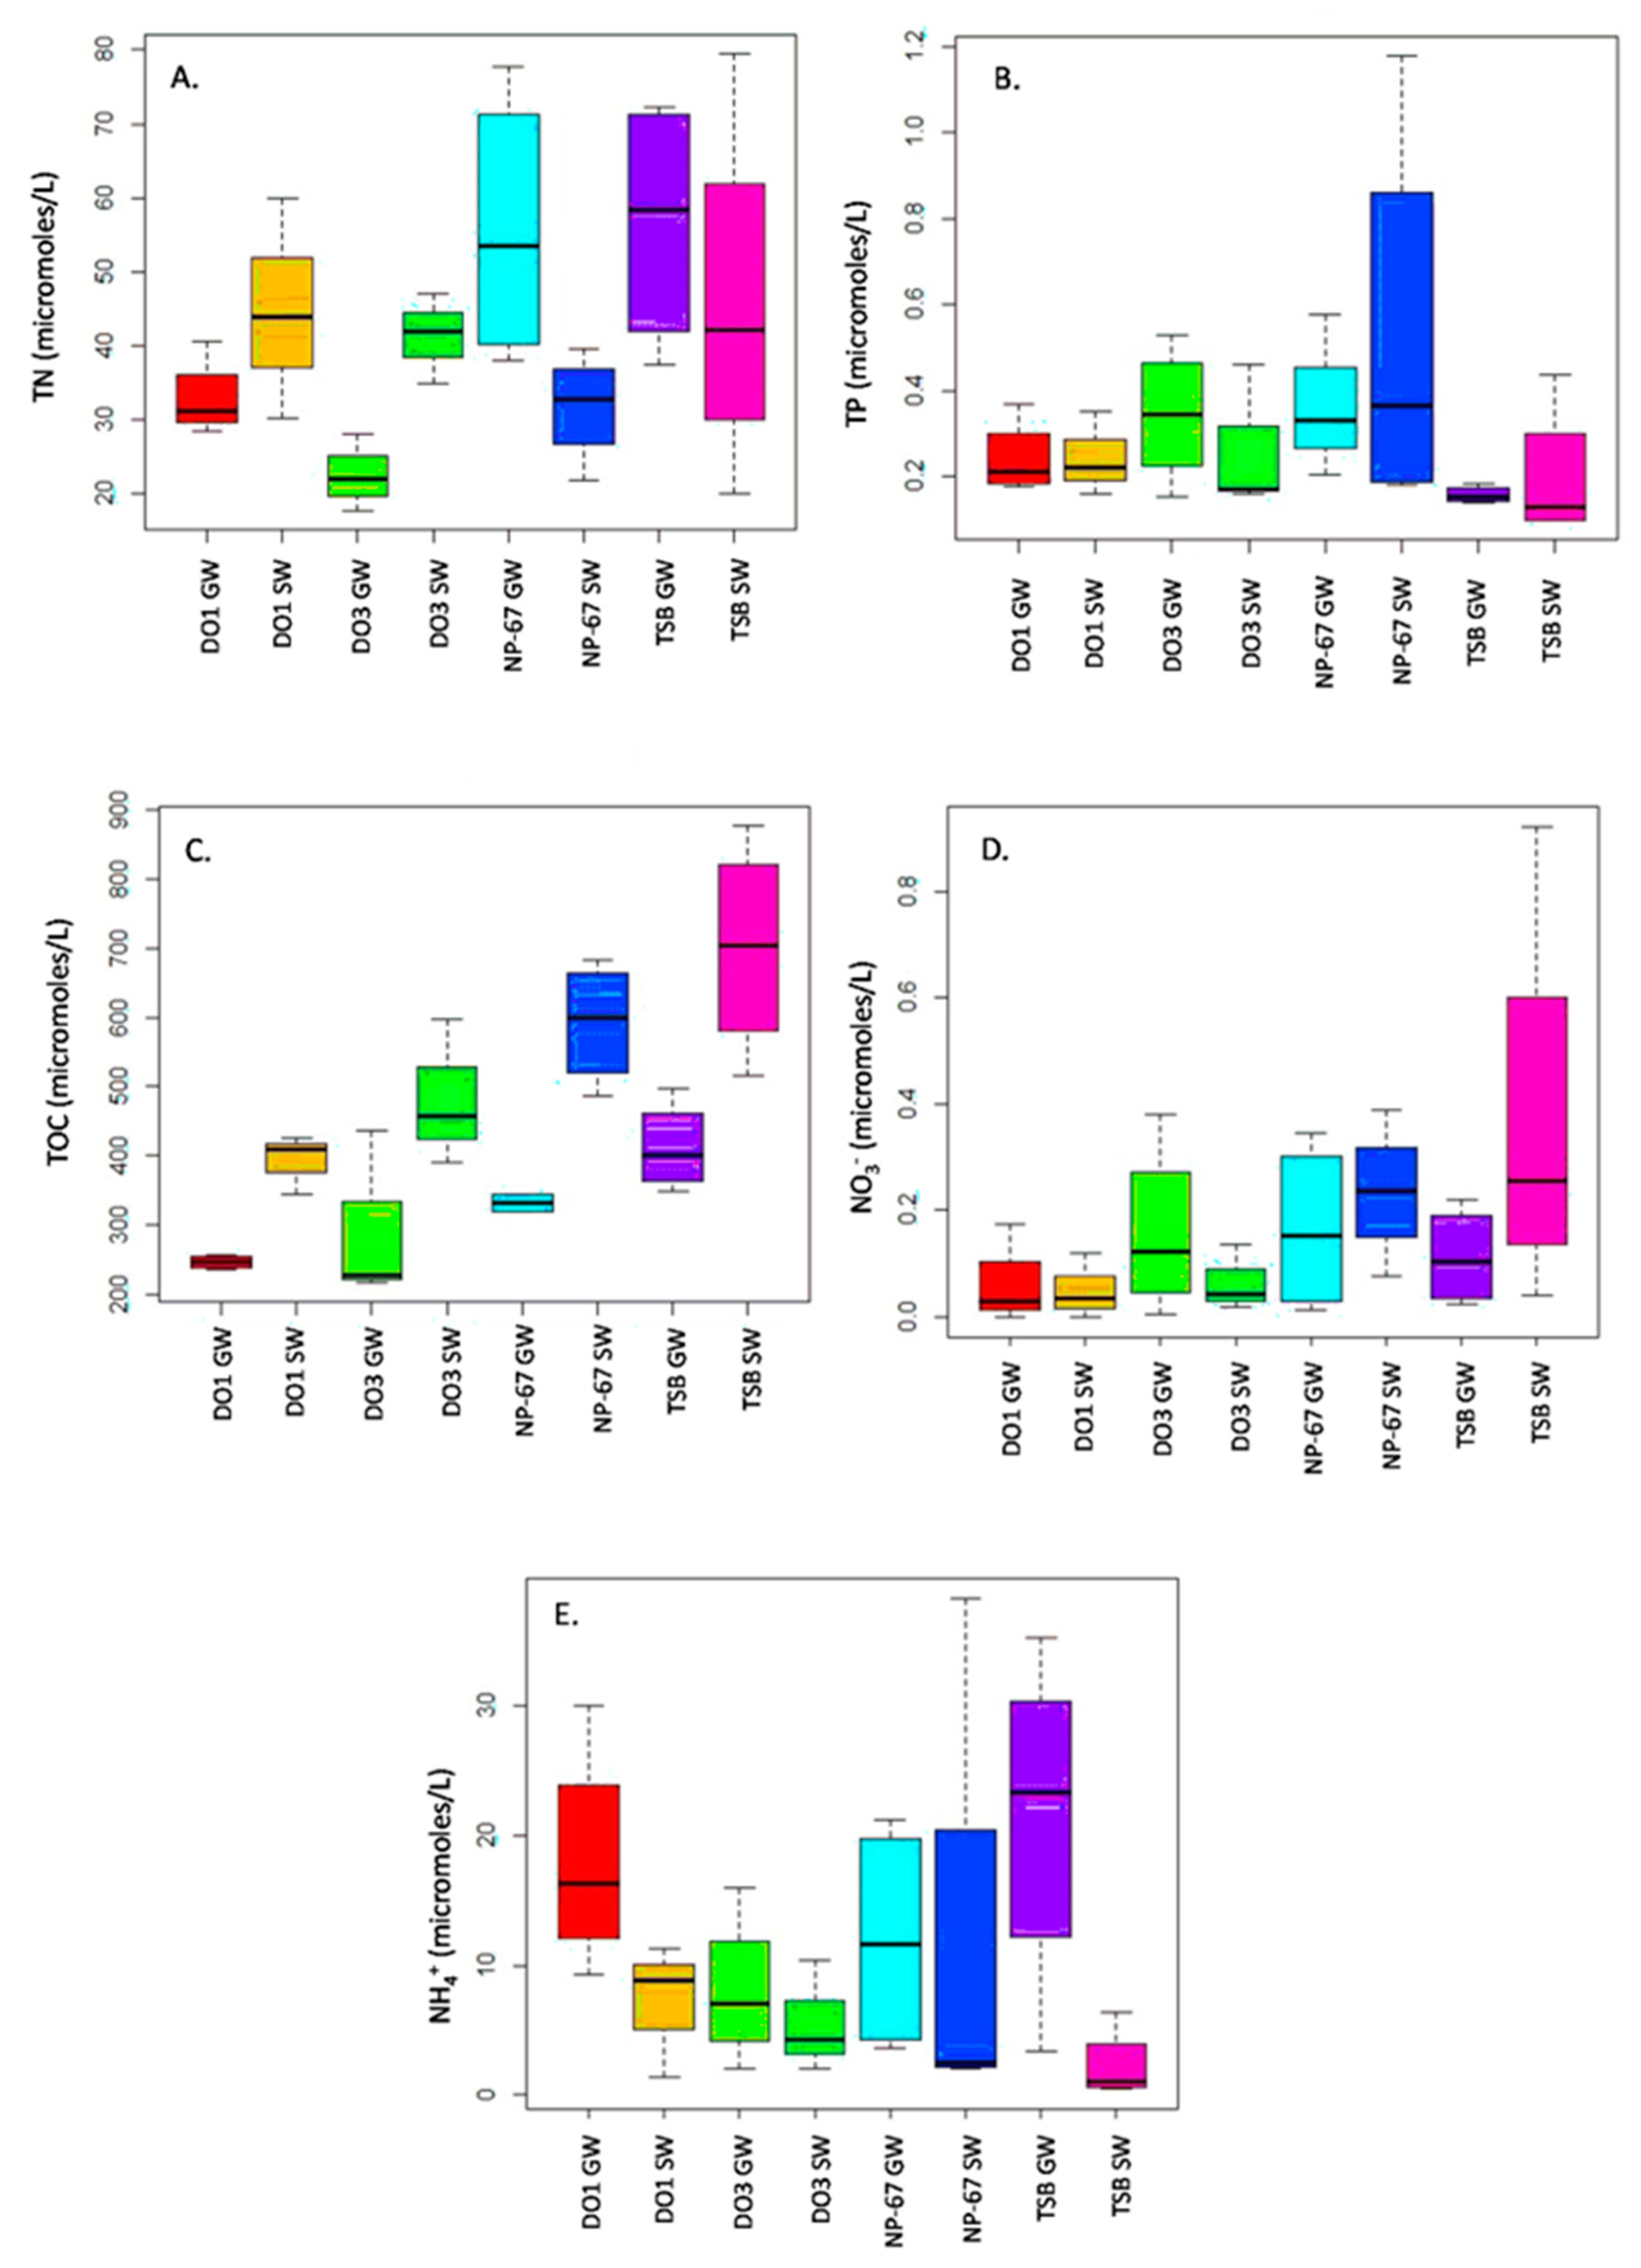
Calcium and bicarbonate were the dominant ions in the both the groundwater and surface-water samples followed by sodium and chloride (Table 2). Average concentrations of TOC by sampling location ranged from 246 μmol/L to nearly 700 μmol/L. The average TN concentrations by sampling location ranged from 22 to 56 μmol/L. Ammonium concentrations were higher (2–21 μmol/L) than nitrate concentrations (<1 μmol/L). The TP concentrations were typically low (<1 μmol/L) and the SRP results were all below the method detection limit of 0.4 μmol/L so they are not reported here.
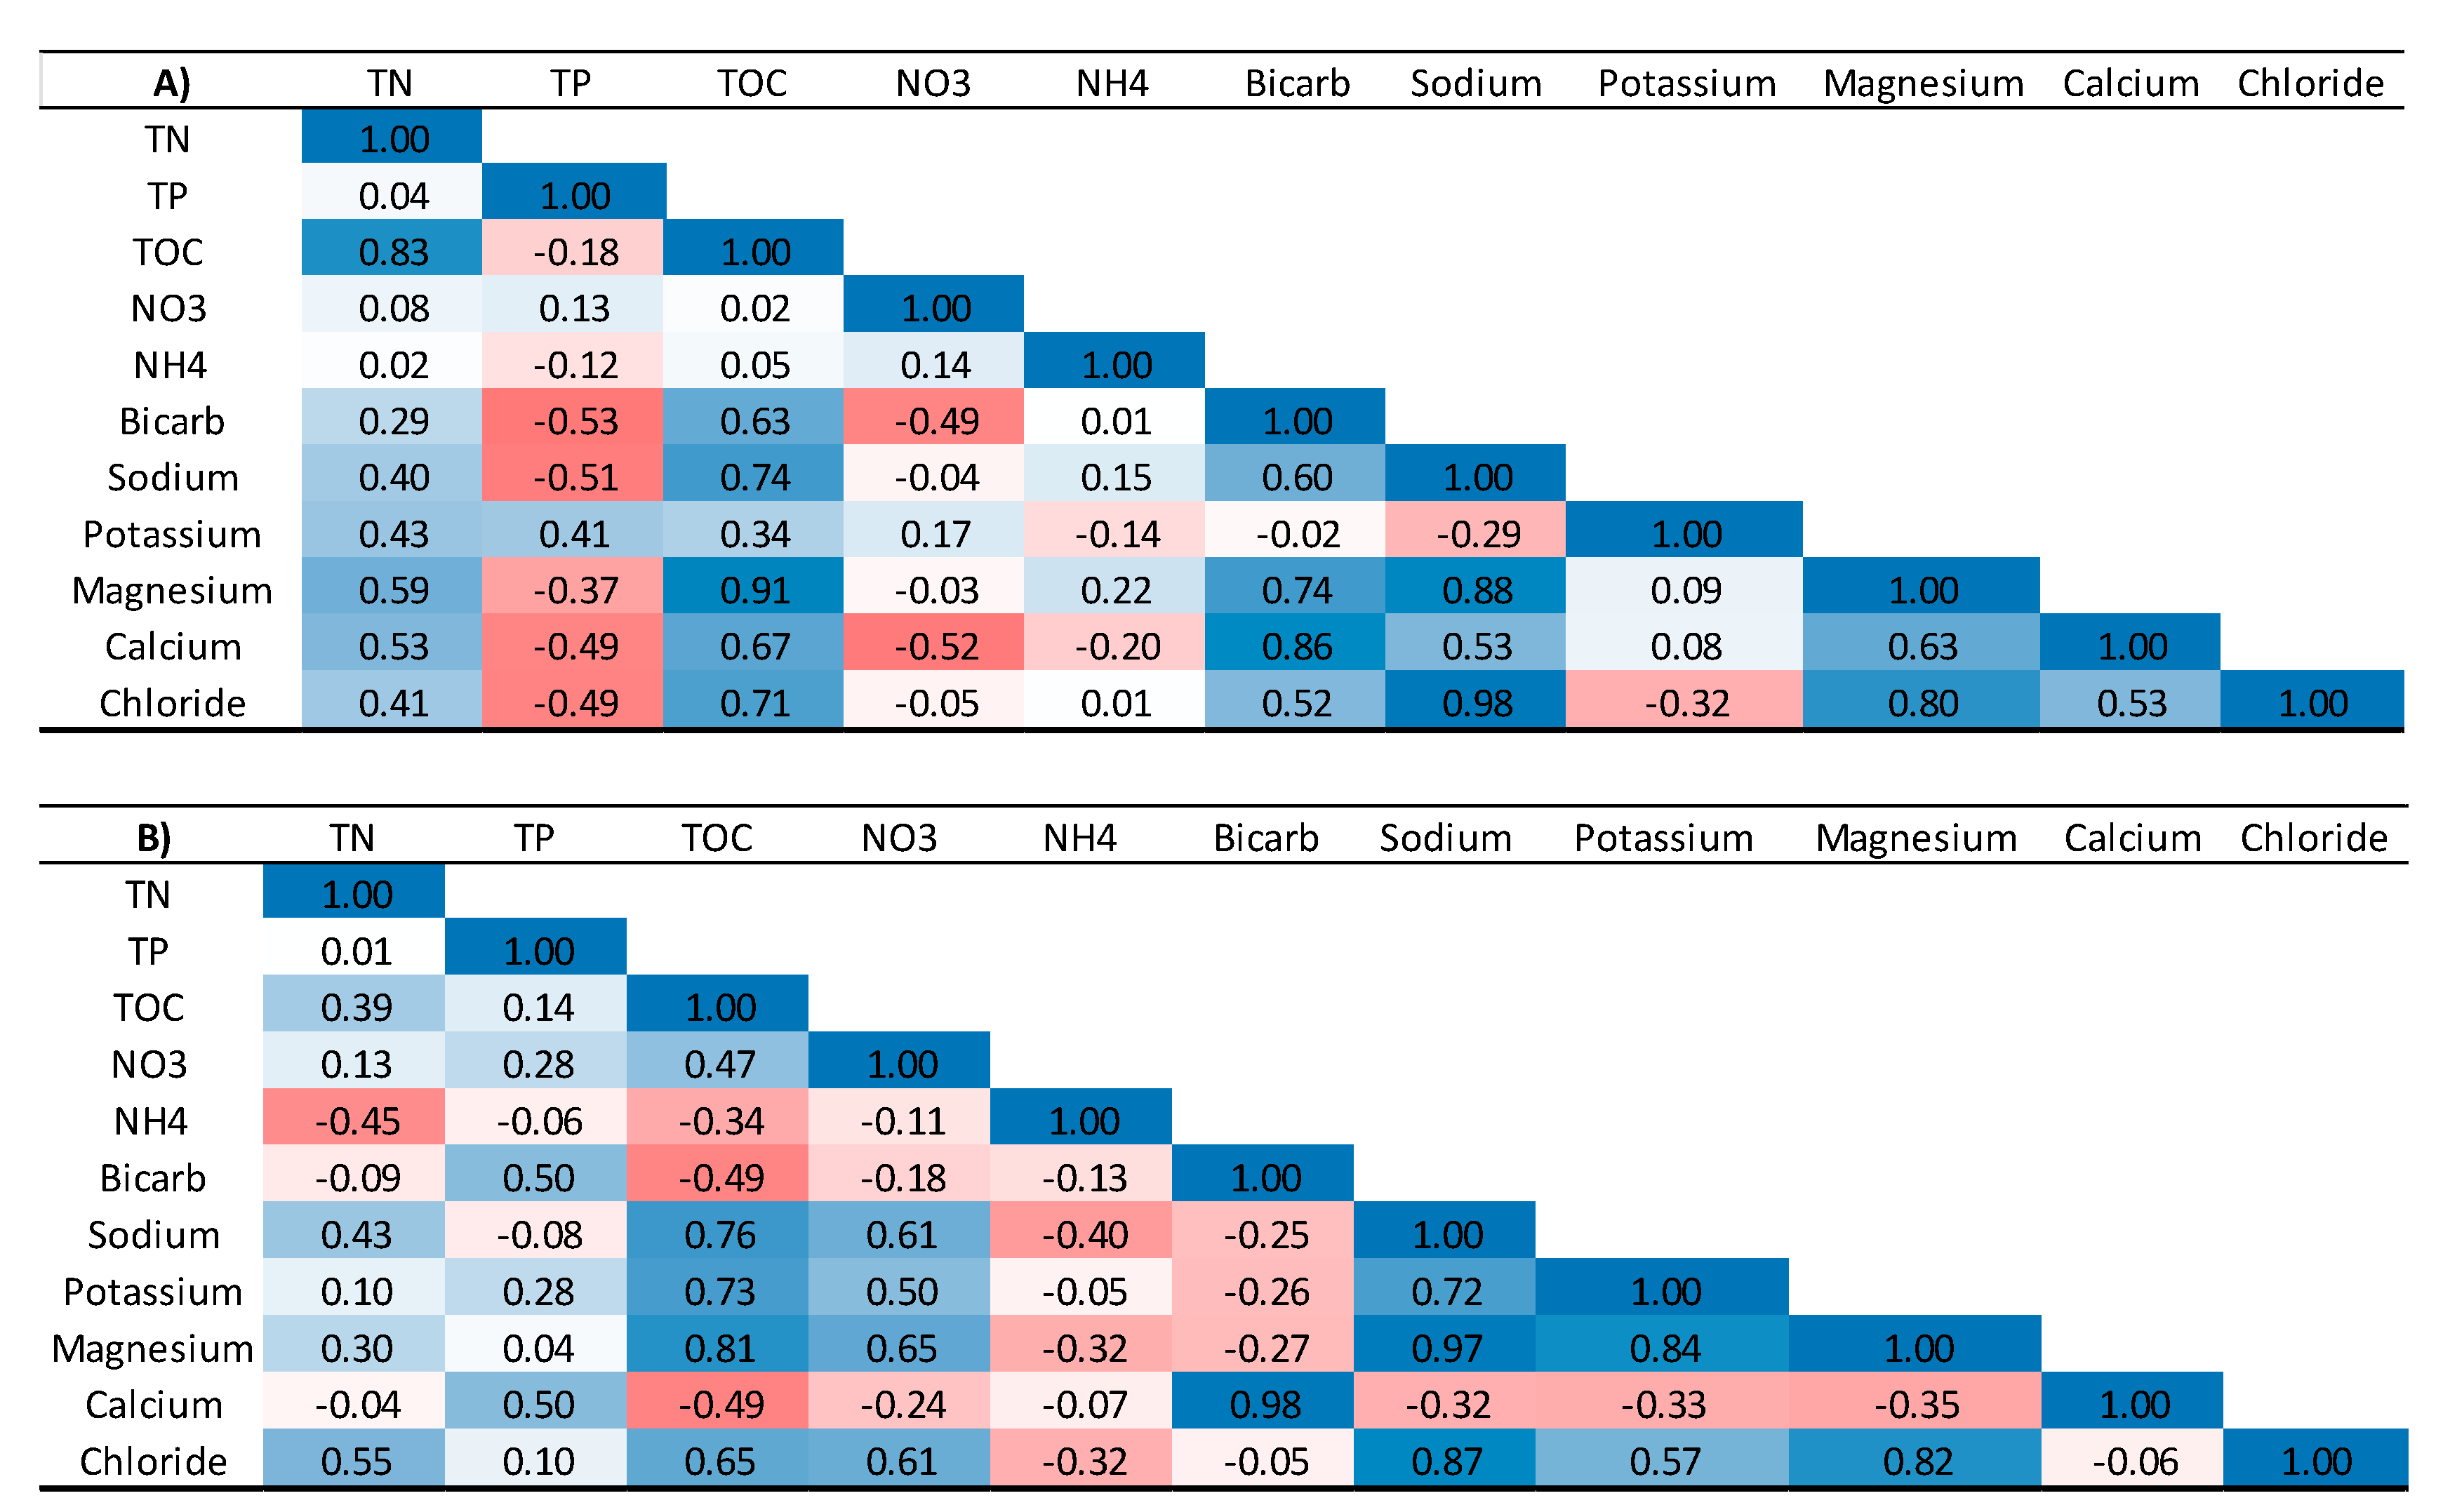
Graphical analysis of nutrient concentrations in the water samples displayed a tendency to cluster based on sampling locality and type, whether groundwater or surface-water (Figure 5). Correlation matrices were developed separately for groundwater and surface-water samples (Figure 6A,B). In groundwater samples, positive correlations were observed between TN and the other constituents. TOC also was positively correlated with the other constituents in groundwater. Negative correlations were observed in the groundwater between TP and the other constituents except potassium. Groundwater NO3− concentrations were negatively correlated with both bicarbonate and calcium concentrations. In surface-water samples, TN was positively correlated with fewer constituents than in the groundwater and negatively correlated with NH4+. TP was positively correlated with bicarbonate and calcium as well as NO3− and potassium in the surface water. Also in the surface water, TOC was positively correlated with NO3− and other constituents except bicarbonate and calcium. Overall, more constituents were negatively correlated with each other in the surface-water samples than the groundwater samples.
Results of the ANOVA with respect to the constituents revealed significant differences among sampling localities and TN (p < 0.05), TOC (p < 0.001), bicarbonate (p < 0.01), sodium (p < 0.001), potassium (p < 0.001), calcium (p < 0.001), and chloride (p < 0.01). No significant differences were observed among sampling locations in TP (p = 0.37), NO3− (p = 0.26), and NH4+ (p = 0.20). The results of the Tukey’s HSD post hoc analysis indicated significant differences in some of the constituent concentrations between sites (Table 3). The main finding of the post hoc test was that the mean groundwater concentrations of several constituents (TN, TOC, Na+, K+ and Mg2+) were significantly higher at TSB located outside the HID compared to the sites DO1 and DO3 located inside the HID. Similarly, mean surface-water concentrations of TOC, Na+, K+, and Mg2+ were significantly higher at TSB than compared to DO1 or DO3.
4. Discussion
4.1. Changes in Evapotranspiration as A Function of Restoration
The range of ET values reported in the present study (585–1450 mm year−1) were similar to values published for South Florida. Published estimates of ET using lysimeters in mixed marsh and open water/algae environments were reported as 1277.5 mm year−1 and 1350 mm year−1, respectively [48]. The average ET determined at two marsh sites in the Everglades was 1410 mm year−1 [49]. Using a water balance approach, annual ET rates for Shark Slough and Taylor Slough were estimated as 1367 mm year−1 and 1296 mm year−1, respectively [50,51]. Likewise, average estimates of ET for the Brazilian pepper forest in the HID using White’s method (1932) was found to be 1522 mm year−1, slightly higher than predicted by the MOD16 algorithm; however, [28] cautioned that ET measurements determined from the White method may have been overestimated as a result of the measurement taken in close proximity to a Hammock forest. Estimates of ET have been determined for various plant types around the world [52] and our estimates of ET using the MOD16 algorithm are assumed to be reasonable for our study area.
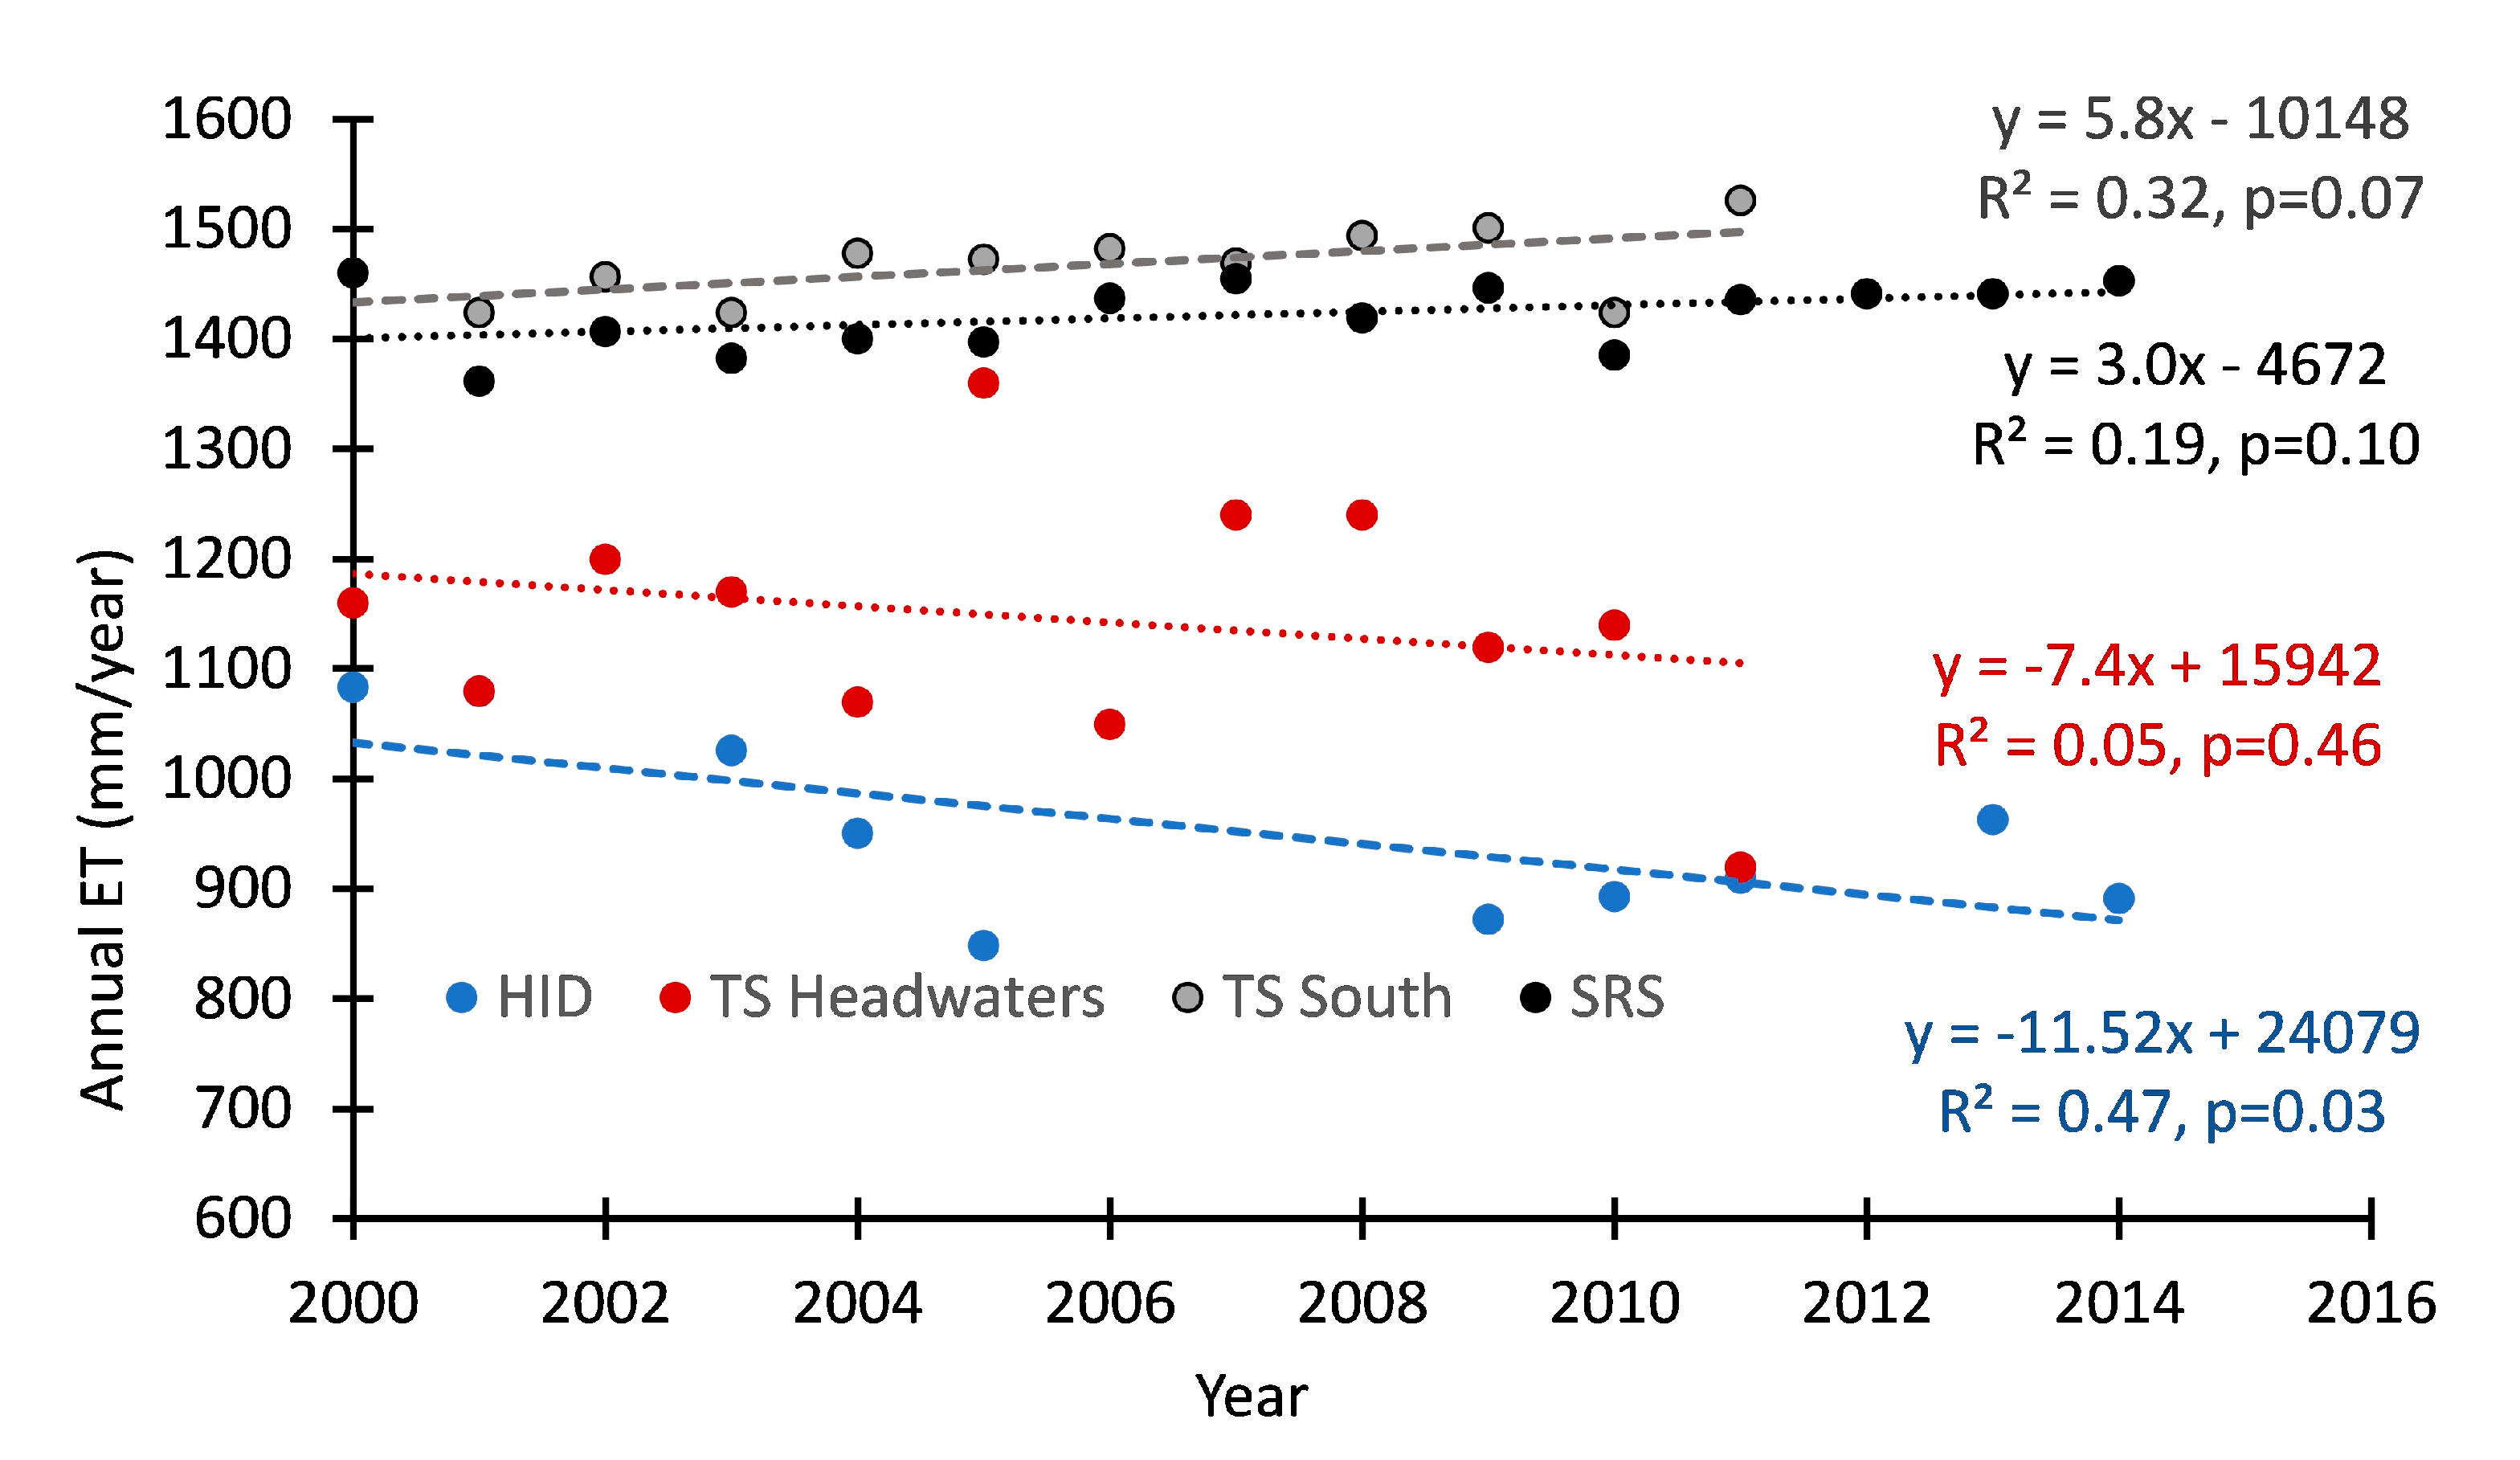
The first hypothesis (ET rates decrease as a result of CSR) was confirmed as ET was found to decrease across the HID from 1083.4 mm year−1 to 891.6 mm year−1 as the acreage restored by CSR increased (Figure 4; Table 1). The ET values obtained in this investigation were compared to annual ET values determined for adjacent regions in ENP (Figure 7), specifically the headwaters of Taylor Slough [53], the southern reaches of Taylor Slough [43] and Shark River Slough located west of the HID [54]. Similar to the HID, the headwaters region of Taylor Slough was the subject of a wetland restoration effort initiated in 2001 [40,53,55]. However, the restoration effort in the headwaters region of Taylor Slough was different from the HID in that it consisted of the construction of a series of retention basins aimed at delivering water to the region via a diffuse water delivery method as opposed to the historical method of a point source of water delivery from an adjacent canal via a single pump [53]. Neither the southern reaches of Taylor Slough nor Shark River Slough were exposed to direct modification between 2000 and 2014, although there were efforts to direct more water flow into southern Taylor Slough via the adjacent C-111 basin [55] and into Shark River Slough via the construction of bridges along its northern boundary [54]. A comparison between the four areas indicated the HID had the lowest ET rates (Figure 7). Differences in the ET estimates between the HID and the other areas may be related to the methods used to estimate ET. In this study, ET was estimated in the HID using MODIS data obtained from NASA satellites. For the headwater region of Taylor Slough, ET was determined using the Priestley–Taylor method based on net radiation and air temperature data collected from a ground-based station [53]. For southern Taylor Slough and SRS, ET was calculated as potential evapotranspiration using the Priestley–Taylor method from USGS EDEN stations located throughout those regions. The ET estimates for southern Taylor Slough and Shark River Slough were similar and higher than the other two areas (Figure 7), which is not surprising as potential evapotranspiration estimates are often higher than actual ET. Differences in the slopes of the trendlines of ET with time were unexpected, however. Slopes were negative for both the HID and the headwaters of Taylor Slough, areas undergoing restoration efforts, compared to positive slopes in ET with time for the untreated background wetlands of southern Taylor Slough and Shark River Slough.
Land-cover change, especially deforestation, can decrease the amount of ET of the deforested area [29]. Furthermore, changes in vegetation type and density can cause changes in water flow and water storage [56]. Land cover change may also impact local climate by reducing evaporation which in turn can affect the recycling of local precipitation [56]. The findings from this study cannot be extrapolated to suggest that the observed reductions in ET in the HID and headwaters of Taylor Slough promoted changes in local climatic conditions, mainly due to the small sizes of the HID (2800 ha) and the headwaters of Taylor Slough compared to the size of the ENP (610,670 ha). Furthermore, the amount of acres restored each year was small given the scope of the Everglades National Park. The largest portion restored occurred in 2005 (404 ha), which represents 0.23% of the entire Everglades ecosystem. Finally, the HID restoration has been discontinuous, as large gaps between restoration episodes were observed throughout the years (e.g., 1990–1997; 2002; 2006–2008; 2012). The gaps between restorations provided the barren landscape with the opportunity to regrow and thus contribute to the total ET in the HID.
4.2. Water Chemistry Inside and Outside the HID
The water chemistry analyses indicated that groundwater and surface water are significantly different inside the HID vs. outside the HID. However, the second hypothesis was not confirmed as the concentrations of several ions and nutrients were found to be higher in the surface water and groundwater outside the HID compared inside. The differences mainly occurred between site TSB and the HID wells, DO1 and DO3, with some differences occurring between NP-67 and the HID wells.
Differences in water chemistry between Taylor Slough and the region occupied by the HID have been observed by others [35,57]. The dominant source of water to the upper Taylor Slough region is an extensive canal system that forms the eastern boundary of ENP [40]. Major ions found to be higher in Taylor Slough compared to the HID included Na+, K+, and Mg2+, ions that may be indicative of fertilizer runoff, and agriculture is a dominant land use of the area located just to the east of ENP. The HID located west of Taylor Slough, is at slightly higher elevation [40] and serves as a region of groundwater recharged by rainfall [35]. The skeletal nature of HID soils [58] likely contributes to the lower ion concentrations in the groundwater there as it allows for rapid infiltration of rainwater to the karst aquifer with minimal contact time with geologic materials. Additionally, removal of the Brazilian pepper may facilitate lower concentrations of ions in the groundwater because of the absence of transpiration-driven ion accumulation [53].
The second hypothesis was formulated around the idea that CSR would remove the elevated concentrations of nutrients previously found in the disturbed soils, thereby reducing concentrations in the groundwater and surface water [14,17]. Research has been conducted domestically and around the world to evaluate the efficacy of top-soil removal as it pertains to reducing nutrient loads in soils as well as the retention of nutrients by restored wetlands [33]. For example, [23] showed that removal of highly decomposed peat soil layers on old agricultural lands supported wetland recovery to low nutrient conditions, especially with respect to P. Likewise, [22] and [59] found that topsoil removal in Dutch fen meadows resulted in a decrease in nutrient availability, promoting reestablishment of less competitive fen-meadow species. Inside the HID, it has been established that removal of the altered, rock-plowed soil removes nutrients, thereby lowering nutrient availability [10]. The lower TN data observed in the groundwater within the HID compared to outside the HID supports the second hypothesis and also supports the literature that CSR reduces the nutrient availability in the restored wetland. [27] evaluated the biogeochemistry of soils in the HID, specifically the ability of the soils to sequester macro-nutrients like N and P. They proposed that approximately 16 years post restoration, restored sites would undergo a shift from N-limitation to P-limitation [27]. The land around station DO1 was restored in 1989, 27 years before the time of this study. Conversely, the land around station DO3 was restored in 2000, 16 years before this study. Higher TN:TP ratios (164–186) observed in both the groundwater and surface water at station DO1 compared to DO3 (66–158) may support their hypothesis. However, further groundwater and surface-water chemistry sampling is needed to assess when and if DO3 does switch to becoming fully P-limited, as hypothesized by [27].
4.3. Recommendations
The CSR technique, even to this day, is considered a costly and radical way to restore degraded wetlands [22,24]. The estimated total cost of the HID restoration is USD 90–120 million [60]. While the cost must be considered for a project of this magnitude, the research is clear that CSR is an effective way to restore and revive native wetlands that have been overcome by invasive plant species [8,10,11]. Furthermore, the restoration has been successful in its two main goals: eradicating the Brazilian pepper and increasing seasonal water levels above the land surface, a necessity for Everglades wetlands [10,11].
The present study determined that ET was significantly reduced in restored areas. This project provides a baseline for remotely sensed ET measurements in the HID, such that future estimates can be compared as native vegetation rebound. Coupling remotely sensed ET data with ground-based empirical measurements of vegetation communities could provide useful information on how ET rates in successional communities change along the restoration gradient. Additionally, it would be interesting to assess if the changes in mean ET in the HID have any sort of impact on microclimate variation, specifically with regards to rainfall. Future research in these areas would prove beneficial not only to restoration managers but also to research scientists interested in how extreme restoration methods can impact fundamental components of the hydrologic cycle.
In 2008, a recommendation was made for one groundwater monitoring well be installed in the HID for every 642 acres restored [26]. Presently, only two such monitoring wells exist (DO1 and DO3). Based upon the acreage restored through 2014 (~4893 acres), there should be 7 wells across the area. The installation of additional monitoring wells could allow for more intensive water level and water chemistry monitoring to assess spatial variability solely inside the HID. Besides the spatial component, the additional wells could be used to assess temporal changes in the major ions and nutrients. Such data could provide valuable information pertaining to major ion and nutrient gradients that across restored wetlands.
5. Conclusions
In the HID, the CSR restoration technique was effective in removing the invasive species (Schinus terebinthifolius) and reducing mean annual ET by 18% over 14 years. Groundwater and surface-water chemical analyses revealed lower concentrations in some ions (Na+, K+, Mg2+) and nutrients (TN) inside the HID compared to outside the HID. The complete removal of plants and soil from within the HID, along with the reduced rates of ET, most likely contributed to the lower concentrations of ions and nutrients in both the surface water and groundwater. This research confirmed that the CSR restoration efforts in the HID were successful in changing hydrologic conditions with the HID towards more oligotrophic conditions characteristic of the natural Everglades.
Author Contributions
Conceptualization, R.M.P. and D.N.R.; methodology, D.N.R.; software, D.N.R.; validation, R.M.P., A.M.M. and M.R.; formal analysis, D.N.R.; investigation, D.N.R.; resources, R.M.P.; data curation, D.N.R.; writing—original draft preparation, D.N.R.; writing—review and editing, R.M.P., A.M.M. and M.R.; visualization, D.N.R.; supervision, R.M.P.; project administration, R.M.P.; funding acquisition, R.M.P. All authors have read and agreed to the published version of the manuscript.
Funding
This research was partially funded by the Florida Coastal Everglades Long-Term Ecological Research program under National Science Foundation Grant Nos. DEB-1237517 and DEB-2025954.
Data Availability Statement
Publicly available data sets were analyzed for this study and can be found here: (https://modis.gsfc.nasa.gov/about/design.php accessed on 1 January 2016); (http://files.ntsg.umt.edu/data/NTSG_Products/MOD16/MOD16A3.105_MERRAGMAO/ accessed on 1 January 2016); (https://doi.org/10.6073/pasta/6fe45693ddb454a0e151bd722243de37 accessed on 2 January 2023).
Acknowledgments
We dedicate this manuscript to Joshua Allen for his assistance in the laboratory and field. We acknowledge the following individuals: Andres Prieto, Anteneh Abiy, Paul Kuhn, and Kalli Unthank, Pete Lorenzo, and Mark Kershaw from FIU; Jonathan Taylor from Everglades National Park and his team at the Daniel Beard Center for access to ENP and the HID; and Francisco Jaramillo, who provided assistance with MODIS during his time at FIU. This is contribution #1512 of the Institute of Environment at Florida International University.
Conflicts of Interest
The authors declare no conflict of interest. The funders had no role in the study’s design, in the collection, analyses, or interpretation of data, in the writing of the manuscript, or in the decision to publish the results.
References
- Abtew, W.; Melesse, A.M. Evaporation and Evapotranspiration: Measurements and Estimations; Springer: Dordrecht, The Netherlands, 2013. [Google Scholar]
- Maltby, E.; Dugan, P.J. Wetland ecosystem protection, management, and restoration: An international perspective. In Everglades: The Ecosystem and Its Restoration; Davis, S.M., Ogden, J.C., Eds.; St. Lucie Press: Delray Beach, FL, USA, 1994; pp. 29–46. [Google Scholar]
- Zedler, J.B.; Kercher, S. Wetland Resources: Status, Trends, Ecosystem Services, and Restorability. Annu. Rev. Environ. Resour. 2005, 30, 39–74. [Google Scholar] [CrossRef]
- Graf, W.L. Water resources science, policy, and politics for the Florida everglades. Ann. Assoc. Am. Geogr. 2013, 103, 353–362. [Google Scholar] [CrossRef]
- Light, S.S.; Dineen, J.W. Water control in the Everglades: A Historical Perspective. In Everglades: The Ecosystem and Its Restoration; Davis, S.M., Ogden, J.C., Eds.; St. Lucie Press: Boca Raton, FL, USA, 1994; pp. 47–84. [Google Scholar]
- Fling, H.; Aumen, N.; Armentano, T.; Mazzotti, F. The Role of Flow in the Everglades Landscape; University of Florida Cooperative Extension Service, Institute of Food and Agricultural Sciences: Gainesville, FL, USA, 2004; pp. 1–7. [Google Scholar]
- Chimney, M.; Goforth, G. Environmental impacts to the Everglades ecosystem: A historical perspective and restoration strategies. Water Sci. Technol. 2001, 44, 93–100. [Google Scholar] [CrossRef] [PubMed]
- Doren, R.F.; Whiteaker, L.D.; Molnar, G.; Sylvia, D. Restoration of former wetlands within the Hole-in-the-Donut in Everglades National Park. In Proceedings of the Seventeenth Annual Conference on Wetlands Restoration and Creation, Hillsborough Community College, Plant City, FL, USA, 10–11 May 1990; pp. 33–50. [Google Scholar]
- Loope, L.L.; Dunevitz, H.L. Investigations of early plant succession on abandoned farmland in Everglades National Park; National Park Service, South Florida Research Center, Everglades National Park: Homestead, FL, USA, 1981.
- Smith, C.S.; Serra, L.; Li, Y.; Inglett, P.; Inglett, K. Restoration of Disturbed Lands: The Hole-in-the-Donut Restoration in the Everglades. Crit. Rev. Environ. Sci. Technol. 2011, 41, 723–739. [Google Scholar] [CrossRef]
- Dalrymple, G.H.; Doren, R.F.; O’Hare, N.K.; Norland, M.R.; Armentano, T.V. Plant colonization after complete and partial removal of disturbed soils for wetland restoration of former agricultural fields in Everglades National Park. Wetlands 2003, 23, 1015–1029. [Google Scholar] [CrossRef]
- Macdonald, I.A.; Loope, L.L.; Usher, M.B.; Hamann, O. Wildlife conservation and the invasion of nature reserves by introduced species: A global perspective. In Biological Invasions: A Global Perspective; Wiley: New York, NY, USA, 1989; pp. 215–255. [Google Scholar]
- Gordon, D.R. Effects of invasive, non-indigenous plant species on ecosystem processes: Lessons from Florida. Ecol. Appl. 1998, 8, 975–989. [Google Scholar] [CrossRef]
- Li, Y.; Norland, M. The role of soil fertility in invasion of Brazilian Pepper (Schinus terebinthifolious) in Everglades National Park, Florida. Soil Sci. 2001, 166, 400–405. [Google Scholar] [CrossRef]
- Ewel, J.J.; Ojima, D.S.; Karl, D.A.; DeBusk, W.F. Schinus in Successional Ecosystems of Everglades National Park; Report T-676; South Florida Research Center: Homestead, FL, USA, 1982. [Google Scholar]
- Rodgers, L.; Pernas, T.; Hill, S.D. Mapping Invasive Plant Distributions in the Florida Everglades Using the Digital Aerial Sketch Mapping Technique. Invasive Plant Sci. Manag. 2014, 7, 360–374. [Google Scholar] [CrossRef]
- Orth, P.G.; Conover, R.A. Changes in nutrients resulting from farming the Hole-in-the-Donut, Everglades National Park. Proc. Fla. State Hortic. Soc. 1975, 28, 221–225. [Google Scholar]
- Meador, R.E. The Role of Mycorrhizae in Influencing Succession on Abandoned Everglades Farmland. Unpublished Master’s Thesis, University of Florida, Gainesville, FL, USA, 1977. [Google Scholar]
- Ewel, J.J. Invasibility: Lessons from south Florida. In Ecology of Biological Invasions of North America and Hawaii; Springer: New York, NY, USA, 1986; pp. 214–230. [Google Scholar]
- Aziz, T.; Sylvia, D.M.; Doren, R.F. Activity and Species Composition of Arbuscular Mycorrhizal Fungi Following Soil Removal. Ecol. Appl. 1995, 5, 776–784. [Google Scholar] [CrossRef]
- Klimkowska, A.; Van Diggelen, R.; Bakker, J.P.; Grootjans, A.P. Wet meadow restoration in Western Europe: A quan-titative assessment of the effectiveness of several techniques. Biol. Conserv. 2007, 140, 318–328. [Google Scholar] [CrossRef]
- Klimkowska, A.; Elst, D.J.; Grootjans, A.P. Understanding long-term effects of topsoil removal in peatlands: Over-Coming thresholds for fen meadows restoration. Appl. Veg. Sci. 2015, 18, 110–120. [Google Scholar] [CrossRef]
- Zak, D.; Meyer, N.; Cabezas, A.; Gelbrecht, J.; Mauersberger, R.; Tiemeyer, B.; Wagner, C.; McInnes, R. Topsoil removal to minimize internal eutrophication in rewetted peatlands and to protect downstream systems against phosphorus pollution: A case study from NE Germany. Ecol. Eng. 2017, 103, 488–496. [Google Scholar] [CrossRef]
- Hausman, C.E.; Fraser, L.H.; Kershner, M.W.; Szalay, F.A. Plant community establishment in a restored wetland: Effects of soil removal. Appl. Veg. Sci. 2007, 10, 383–390. [Google Scholar] [CrossRef]
- Krauss, P. Old Field Succession in Everglades National Park; Report SFRC-87/03; South Florida Research Center: Homestead, FL, USA, 1987. [Google Scholar]
- O’Hare, N.K. Biological Monitoring of Restored Wetlands in the Hole-in-the- Donut; Final Annual Report, HID Year 10; Everglades National Park: Homestead, FL, USA, 2008.
- Inglett, P.; Inglett, K. Biogeochemical changes during early development of restored calcareous wetland soils. Geoderma 2013, 192, 132–141. [Google Scholar] [CrossRef]
- Villalobos-Vega, R. Water Table and Nutrient Dynamics in Neotropical Savannas and Wetland Ecosystems. Ph.D. Thesis, University of Miami, Coral Gables, FL, USA, 2010. Available online: http://scholarlyrepository.miami.edu/oa_dissertations/389 (accessed on 2 January 2023).
- Mahmood, R.; Pielke, R.A., Sr.; Hubbard, K.; Niyogi, D.; Dirmeyer, P.A.; McAlpine, C.; Carleton, A.M.; Hale, R.; Gameda, S.; Beltrán-Przekurat, A.; et al. Land cover changes and their biogeophysical effects on climate. Int. J. Clim. 2013, 34, 929–953. [Google Scholar] [CrossRef]
- Fetter, C.W. Regional Groundwater Flow; Inc. Applied Hydrogeology: Geneve, Switzerland, 1980. [Google Scholar]
- Hibbert, A.R. Increases in Streamflow after Converting Chaparral to Grass. Water Resour. Res. 1971, 7, 71–80. [Google Scholar] [CrossRef]
- Anderson, M.; Gao, F.; Knipper, K.; Hain, C.; Dulaney, W.; Baldocchi, D.; Eichelmann, E.; Hemes, K.; Yang, Y.; Medellin-Azuara, J.; et al. Field-Scale Assessment of Land and Water Use Change over the California Delta Using Remote Sensing. Remote Sens. 2018, 10, 889. [Google Scholar] [CrossRef]
- Kahara, S.N.; Madurapperuma, B.D.; Hernandez, B.K.; Scaroni, L.; Hopson, E. Hydrology and Nutrient Dynamics in Managed Restored Wetlands of California’s Central Valley, USA. Water 2022, 14, 3574. [Google Scholar] [CrossRef]
- Harvey, J.W.; McCormick, P.V. Groundwater’s significance to changing hydrology, water chemistry, and biological communities of a floodplain ecosystem, Everglades, South Florida, USA. Hydrogeol. J. 2008, 17, 185–201. [Google Scholar] [CrossRef]
- Price, R.M.; Swart, P.K. Geochemical Indicators of Groundwater Recharge in the Surficial Aquifer System, Everglades National Park, Florida, USA; Geological Society of America: Boulder, CO, USA, 2006. [Google Scholar] [CrossRef] [Green Version]
- Lagomasino, D.; Price, R.M.; Whitman, D.; Campbell, P.K.; Melesse, A. Estimating major ion and nutrient con-centrations in mangrove estuaries in Everglades National Park using leaf and satellite reflectance. Remote Sens. Environ. 2014, 154, 202–218. [Google Scholar] [CrossRef]
- Serra, L.A. Identifying Suitable areas for the Reestablishment of Pinus elliottii var. densa on Previously Farmed Lands in the Hole-in-the-Donut Restoration, Everglades National Park. Unpublished Ph.D. Thesis, University of Florida, Gainesville, FL, USA, 2009. [Google Scholar]
- USDA. Soil Survey of Dade County, Florida; Natural Resources Conservation Service, U.S. Government Printing Office: Washington, DC, USA, 1996.
- Duever, M.J.; Meeder, J.F.; Meeder, L.C.; McCollom, J.M. The climate of south Florida and its role in shaping the Everglades ecosystem. In Everglades: The Ecosystem and Its Restoration; St. Lucie Press: Boca Raton, FL, USA, 1994; pp. 225–248. [Google Scholar]
- Kotun, K.; Renshaw, A. Taylor Slough Hydrology. Wetlands 2013, 34, 9–22. [Google Scholar] [CrossRef]
- Fish, J.E.; Stewart, M.T. Hydrogeology of the Surficial Aquifer System, Dade County, Florida; Water-Resources Investigations Report No. 90-4108; U.S. Geological Survey: Tallahassee, FL, USA, 1991.
- Reio, D. Investigating the Effects of Land-Cover Change on the Hydrologic Conditions of a Restored Agricultural Area in Everglades National Park. Master’s Thesis, Florida International University, Miami, FL, USA, 2018. [Google Scholar] [CrossRef]
- Sandoval, E.; Price, R.M.; Whitman, D.; Melesse, A.M. Long-term (11 years) study of water balance, flushing times and water chemistry of a coastal wetland undergoing restoration, Everglades, Florida, USA. Catena 2016, 144, 74–83. [Google Scholar] [CrossRef]
- Mu, Q.; Zhao, M.; Running, S.W. Improvements to a MODIS global terrestrial evapotranspiration algorithm. Remote Sens. Environ. 2011, 115, 1781–1800. [Google Scholar] [CrossRef]
- Justice, C.; Townshend, J.; Vermote, E.; Masuoka, E.; Wolfe, R.; Saleous, N.; Roy, D.; Morisette, J. An overview of MODIS Land data processing and product status. Remote Sens. Environ. 2002, 83, 3–15. [Google Scholar] [CrossRef]
- Solórzano, L.; Sharp, J.H. Determination of total dissolved phosphorus and particulate phosphorus in natural waters1. Limnol. Oceanogr. 1980, 25, 754–758. [Google Scholar] [CrossRef]
- Price, R.M.; Reio, D. Groundwater and Surface Water Chemistry from the Hole-in-the-Donut and Nearby Taylor Slough in Everglades National Park, Florida, USA: 2015–2016 ver 4. Environmental Data Initiative. 2023. Available online: https://portal.edirepository.org/nis/mapbrowse?packageid=knb-lter-fce.1252.4 (accessed on 2 January 2023).
- Abtew, W. Evapotranspiration measurements and modeling for three wetland systems in south florida. JAWRA J. Am. Water Resour. Assoc. 1996, 32, 465–473. [Google Scholar] [CrossRef]
- Douglas, E.M.; Jacobs, J.M.; Sumner, D.M.; Ray, R.L. A comparison of models for estimating potential evapotranspi-ration for Florida land cover types. J. Hydrol. 2009, 373, 366–376. [Google Scholar] [CrossRef]
- Saha, A.K.; Moses, C.S.; Price, R.; Engel, V.; Smith, T.J.; Anderson, G. A Hydrological Budget (2002–2008) for a Large Subtropical Wetland Ecosystem Indicates Marine Groundwater Discharge Accompanies Diminished Freshwater Flow. Estuaries Coasts 2011, 35, 459–474. [Google Scholar] [CrossRef]
- Zapata-Rios, X.; Price, R.M. Estimates of groundwater discharge to a coastal wetland using multiple techniques: Taylor Slough, Everglades National Park, USA. Hydrogeol. J. 2012, 20, 1651–1668. [Google Scholar] [CrossRef]
- Chen, H.; Wei, Z.; Lin, R.; Cai, J.; Han, C. Estimation of Evapotranspiration and Soil Water Content at a Regional Scale Using Remote Sensing Data. Water 2022, 14, 3283. [Google Scholar] [CrossRef]
- Sullivan, P.L.; Price, R.M.; Ross, M.S.; Stoffella, S.L.; Sah, J.P.; Scinto, L.J.; Cline, E.; Dreschel, T.W.; Sklar, F.H. Trees: A powerful geomorphic agent governing the landscape evolution of a subtropical wetland. Biogeochemistry 2016, 128, 369–384. [Google Scholar] [CrossRef]
- Dessu, S.B.; Price, R.M.; Troxler, T.G.; Kominoski, J.S. Effects of sea-level rise and freshwater management on long-term water levels and water quality in the Florida Coastal Everglades. J. Environ. Manag. 2018, 211, 164–176. [Google Scholar] [CrossRef] [PubMed]
- Troxler, T.G.; Childers, D.L.; Madden, C.J. Drivers of Decadal-Scale Change in Southern Everglades Wetland Macrophyte Communities of the Coastal Ecotone. Wetlands 2013, 34, 81–90. [Google Scholar] [CrossRef]
- Bounoua, L.; DeFries, R.; Collatz, G.J.; Sellers, P.; Khan, H. Effects of Land Cover Conversion on Surface Climate. Clim. Chang. 2002, 52, 29–64. [Google Scholar] [CrossRef]
- Harvey, J.W.; Jackson, J.M.; Mooney, R.H.; Choi, J. Interaction between Ground Water and Surface Water in Taylor Slough and Vicinity, Everglades National Park, South Florida: Study Methods and Appendixes; U.S.G.S. Open File Report 2000-248; US Geological Survey: Reason, VA, USA, 2000. [CrossRef]
- Wang, Q.; Li, Y.; Zhang, M. Soil recovery across a chronosequence of restored wetlands in the Florida Everglades. Sci. Rep. 2015, 5, 17630. [Google Scholar] [CrossRef]
- Verhagen, R.; Klooker, J.; Bakker, J.; Diggelen, R. Restoration success of low-production plant communities on former agricultural soils after top-soil removal. Appl. Veg. Sci. 2001, 4, 75–82. [Google Scholar] [CrossRef]
- Everglades National Park. Hole-in-the-Donut Restoration; National Park Service, U.S. Dept. of the Interior, South Florida Natural Resources Center, Everglades National Park: Homestead, FL, USA, 2009.
Figure 3.
Maps of ET rates in mm/year across the HID in (A) 2000; (B) 2001; (C) 2003; (D) 2004; (E) 2005; (F) 2009; (G) 2010; (H) 2011; (I) 2013; (J) 2014. (Adapted from [42]).
Figure 3.
Maps of ET rates in mm/year across the HID in (A) 2000; (B) 2001; (C) 2003; (D) 2004; (E) 2005; (F) 2009; (G) 2010; (H) 2011; (I) 2013; (J) 2014. (Adapted from [42]).

Figure 4.
Mean ET for determined for the HID by (a) year and (b) cumulative acres restored [42].
Figure 4.
Mean ET for determined for the HID by (a) year and (b) cumulative acres restored [42].

Figure 5.
Box-and-whisker plots of nutrients from groundwater (GW) and surface water (SW) inside (DO1, DO3) and outside (NP-67, TSB) the HID: (A) TN; (B) TP; (C) TOC; (D) NO3−; (E) NH4+ (Source [42]).
Figure 5.
Box-and-whisker plots of nutrients from groundwater (GW) and surface water (SW) inside (DO1, DO3) and outside (NP-67, TSB) the HID: (A) TN; (B) TP; (C) TOC; (D) NO3−; (E) NH4+ (Source [42]).

Figure 6.
Correlation matrices for: (A) groundwater and (B) surface water. Blue represents positive correlations and red represents negative correlations. The darker hue of the color is proportional to the strength of the correlation (Adapted from [42]).
Figure 6.
Correlation matrices for: (A) groundwater and (B) surface water. Blue represents positive correlations and red represents negative correlations. The darker hue of the color is proportional to the strength of the correlation (Adapted from [42]).

Figure 7.
Evapotranspiration (ET) with time as determined from this study for the HID and compared to Taylor Slough (TS) Headwaters [53], Taylor Slough (TS) south [43], and Shark River Slough [54].


Table 1.
Summary statistics of ET for each year of restoration [42]. Values reported in mm year−1.
Table 1.
Summary statistics of ET for each year of restoration [42]. Values reported in mm year−1.
| Year | Minimum | Maximum | Range | Acres Restored | Mean | Standard Deviation |
|---|---|---|---|---|---|---|
| 2000 | 584.8 | 1450.7 | 865.9 | 808 | 1083.4 | 256.7 |
| 2001 | 590.0 | 1442 | 852.0 | 1141 | 1079.6 | 263.1 |
| 2003 | 698.6 | 1429.4 | 730.8 | 2051 | 1025.9 | 246.0 |
| 2004 | 603.9 | 1490.8 | 886.9 | 2890 | 950.5 | 281.4 |
| 2005 | 594.7 | 1437 | 842.3 | 3890 | 848.7 | 225.3 |
| 2009 | 627.3 | 1442.6 | 815.3 | 4091 | 872.6 | 223.1 |
| 2010 | 667.3 | 1434.6 | 767.3 | 4225 | 893.4 | 212.9 |
| 2011 | 675.1 | 1419.9 | 744.8 | 4414 | 909.9 | 203.8 |
| 2013 | 775.0 | 1425.2 | 650.2 | 4639 | 963.4 | 174.8 |
| 2014 | 677.5 | 1447 | 769.5 | 4893 | 891.6 | 195.3 |
Table 2.
Average concentrations of major ions and nutrients for groundwater (GW) and surface-water (SW) samples [47].
Table 2.
Average concentrations of major ions and nutrients for groundwater (GW) and surface-water (SW) samples [47].
| Site | HCO3− (mg/L) | Na+ (mg/L) | K+ (mg/L) | Mg2+ (mg/L) | Ca2+ (mg/L) | Cl− (mg/L) | TN (μmol/L) | TP (μmol/L) | TOC (μmol/L) | NH4+ (μmol/L) | NO3− (μmol/L) |
|---|---|---|---|---|---|---|---|---|---|---|---|
| DO1 GW | 256.52 | 9.3 | 0.42 | 1.99 | 81.89 | 18.43 | 32.84 | 0.24 | 246.75 | 18.01 | 0.06 |
| DO3 GW | 245.56 | 11.22 | 0.29 | 2.01 | 77.65 | 22.69 | 22.43 | 0.34 | 277.46 | 8 | 0.16 |
| NP-67 GW | 254.59 | 8.37 | 1.01 | 2.45 | 81.44 | 16.72 | 48.94 | 0.36 | 332.52 | 12.04 | 0.17 |
| TSB GW | 276.3 | 19.36 | 0.47 | 3.67 | 85.23 | 33.88 | 56.61 | 0.16 | 411.52 | 21.3 | 0.11 |
| DO1 SW | 264.07 | 10.29 | 0.41 | 2.18 | 81.35 | 21.45 | 44.69 | 0.24 | 393.26 | 7.17 | 0.05 |
| DO3 SW | 244.34 | 12.23 | 0.26 | 2.16 | 77.85 | 25.06 | 41.3 | 0.26 | 481.39 | 5.55 | 0.07 |
| NP-67 SW | 192.61 | 8.11 | 0.8 | 2.23 | 59.38 | 16.45 | 31.76 | 0.52 | 592.04 | 11.3 | 0.23 |
| TSB SW | 179.44 | 22.9 | 1.19 | 4.26 | 49.67 | 34.56 | 45.99 | 0.2 | 699.94 | 2.25 | 0.37 |
Table 3.
Tukey’s HSD post hoc analysis results comparing constituent concentrations between sites showing only those results with p values ≤ 0.10. SW = surface water and GW = groundwater (Source: [42]).
Table 3.
Tukey’s HSD post hoc analysis results comparing constituent concentrations between sites showing only those results with p values ≤ 0.10. SW = surface water and GW = groundwater (Source: [42]).
| Comparison Between Location | Constituent | p-Value |
|---|---|---|
| NP-67 SW-DO1 SW | HCO3− | 0.10 |
| TSB SW-DO1 SW | HCO3− | 0.03 |
| TSB GW-DO1 GW | Na+ | 0.01 |
| TSB SW-DO1 SW | Na+ | 0.00 |
| TSB GW-DO3 GW | Na+ | 0.07 |
| TSB SW-DO3 SW | Na+ | 0.01 |
| NP-67 GW-DO1 GW | K+ | 0.08 |
| TSB SW-DO1 SW | K+ | 0.02 |
| NP-67 GW-DO3 GW | K+ | 0.04 |
| TSB SW-DO3 SW | K+ | 0.00 |
| TSB GW-DO1 GW | Mg2+ | 0.00 |
| TSB SW-DO1 SW | Mg2+ | 0.00 |
| TSB GW-DO3 GW | Mg2+ | 0.01 |
| TSB SW-DO3 SW | Mg2+ | 0.00 |
| TSB SW-DO1 SW | Ca2+ | 0.01 |
| TSB SW-DO3 SW | Ca2+ | 0.02 |
| NP-67 GW-DO3 GW | TN | 0.06 |
| TSB GW-DO3 GW | TN | 0.05 |
| NP-67 SW-DO1 SW | TOC | 0.10 |
| TSB SW-DO1 SW | TOC | 0.00 |
| TSB SW-DO3 SW | TOC | 0.06 |
Disclaimer/Publisher’s Note: The statements, opinions and data contained in all publications are solely those of the individual author(s) and contributor(s) and not of MDPI and/or the editor(s). MDPI and/or the editor(s) disclaim responsibility for any injury to people or property resulting from any ideas, methods, instructions or products referred to in the content. |
© 2023 by the authors. Licensee MDPI, Basel, Switzerland. This article is an open access article distributed under the terms and conditions of the Creative Commons Attribution (CC BY) license (https://creativecommons.org/licenses/by/4.0/).
Share and Cite
MDPI and ACS Style
Reio, D.N.; Price, R.M.; Melesse, A.M.; Ross, M. Quantification of Evapotranspiration and Water Chemistry in a Remediated Wetland in Everglades National Park, USA. Water 2023, 15, 611. https://doi.org/10.3390/w15040611
AMA Style
Reio DN, Price RM, Melesse AM, Ross M. Quantification of Evapotranspiration and Water Chemistry in a Remediated Wetland in Everglades National Park, USA. Water. 2023; 15(4):611. https://doi.org/10.3390/w15040611
Chicago/Turabian StyleReio, Dillon Nicholas, René M. Price, Assefa M. Melesse, and Michael Ross. 2023. "Quantification of Evapotranspiration and Water Chemistry in a Remediated Wetland in Everglades National Park, USA" Water 15, no. 4: 611. https://doi.org/10.3390/w15040611
Note that from the first issue of 2016, this journal uses article numbers instead of page numbers. See further details here.