

The Pretreatment of Micro-Polluted Source Water through Phototrophic Biofilms under Variant Light Conditions

1
School of Environmental Engineering, Nanjing Institute of Technology, Nanjing 211167, China
2
Key Laboratory of Integrated Regulation and Resource Development on Shallow Lakes, Ministry of Education, Hohai University, Nanjing 210098, China
3
College of Environment, Hohai University, Nanjing 210098, China
*
Authors to whom correspondence should be addressed.
Water 2023, 15(4), 621; https://doi.org/10.3390/w15040621
Submission received: 8 January 2023
/
Revised: 31 January 2023
/
Accepted: 2 February 2023
/
Published: 5 February 2023
(This article belongs to the Special Issue Nitrification-Denitrification Processes in Bioreactors for Wastewater and Sludge Treatment)
Abstract
:The imbalance of inorganic nutrients in micro-polluted source water poses a huge threat to aquatic environments and human health. To pretreat micro-polluted source water, some biological reactors have been conducted at lab-scale. However, using phototrophic biofilms to pretreat micro-polluted source water at pilot-scale has yet to be explored, and the effects of light on the practical operation of phototrophic biofilms are poorly understood. In this study, the potential of pretreating micro-polluted source water by phototrophic biofilms was explored. The high light intensity (4500 lx, 60.75 μmol/m2/s) promoted the growth of phototrophic biofilms and the secretion of extracellular polymeric substance. The removal efficiency of inorganic nitrogen and total phosphorus in synthetic micro-polluted water was 56.82% and 40.90%, respectively. When interacting with actual micro-polluted source water, the nutrients in the actual micro-polluted source water were reduced by the stable pilot-scale phototrophic biofilms. The final concentration of effluent nutrients was lower than the Grade II surface water quality standard in China. Therefore, using phototrophic biofilms as a pretreatment facility in water treatment plants is a promising solution to this issue.
1. Introduction
To deal with the increasing wastewater produced by diverse industries, wastewater treatment technologies have been developed rapidly in the last decades [1,2]. However, a small amount of dissolved organic matter, inorganic nitrogen, and phosphorus, still enter into natural water bodies due to the defects of current treatment technologies [3]. Moreover, non-point source pollutants from agriculture increase nutrient loading in surface water [4]. These problems result in the emergence of micro-polluted source water [5,6].
In contrast to wastewater, the micro-polluted source water has a relatively low concentration of nitrogen, phosphorus, and chemical organic demand (COD). However, nutrients in the micro-polluted surface water normally cannot meet the Grade III surface water quality standard in China (GB3838-2002), which requires total nitrogen (TN) and total phosphorus (TP) in surface water (e.g., lakes and reservoirs) to be less than 1.0 mg/L and 0.05 mg/L, respectively [7]. These excess nutrients may cause algal blooms and eutrophication, which pose a huge threat to drinking water sources and humans [5,8]. Therefore, several phototrophic biofilm technologies have been proposed to solve this issue, such as the algal turf scrubber [9], the algal biofilm membrane photobioreactor [10,11] and the tubular biofilm photobioreactor [12]. The phototrophic biofilms in these reactors are composed of cyanobacteria, green algae, diatoms, autotrophic and heterotrophic bacteria [13,14]. The microorganisms embedded in a mucilaginous matrix of extracellular polymeric substance (EPS) support each other through cooperative interaction [7]. The phototrophic biofilm with species-rich microbial communities can remove nutrients in the wastewater in multiple ways, such as photosynthesis, assimilation, nitrification, denitrification and adsorption [15]. For example, Gao et al. (2015) [10] designed an algal biofilm membrane photobioreactor equipped with solid carriers and a submerged membrane module. The pollutants in a secondary effluent were well removed by the metabolism of phototrophic biofilm and the filtration of the submerged membrane module. Amini et al. (2020) [11] reported that the cocultivation of algae and activated sludge in photobioreactors achieved the highest final NH4+-N and PO43−-P removal efficiencies (88.0 ± 1.0% and 84.0 ± 1.0%, respectively). Although these technologies have achieved some success, they need complex carriers, or bioreactors, to support the growth of phototrophic biofilms, which not only require additional material costs but are also inconvenient for the in situ pretreating of micro-polluted source water.
The phototrophic biofilms can also grow in natural environments, such as shoals, river banks, paddy fields and the walls of secondary sedimentation tanks exposed to sunlight in wastewater treatment plants (WWTPs) [16,17,18,19]. Compared with free-living microorganisms in water, attached bacteria are more active in low-nutrient aquatic environments [20,21]. On the one hand, solid surfaces may bind nutrients and slow down their molecular activity, which is beneficial for the phototrophic biofilms to capture nutrients [20]. On the other hand, the attached bacteria can release more exoenzymes and help them obtain nutrients due to the support of solid surfaces [21]. Therefore, a potential solution for micro-polluted problems may be developed based on the combination of phototrophic biofilms and the solid surfaces provided by facilities in water treatment plants.
To save operating costs, the phototrophic biofilm facility in water treatment plants should be operated in natural environments, which are very different from artificial bioreactors regulated by engineers. For example, the intensity of sunlight changes throughout the day, whereas artificial light sources can keep the light intensity at a set point. Other parameters, such as environmental temperature, water flow rate, pH and dissolved oxygen (DO), also vary in the natural environment and cannot be easily controlled. However, the great performance of artificial phototrophic biofilm bioreactors normally depends on strict operating conditions controlled at set points [22,23,24]. A more economical and environmentally friendly method for pretreating micro-polluted source water remains to be established.
In this study, the treatment performance of phototrophic biofilms under nutrient and environmental parameter variation was investigated. To explore bioremediation ability and EPS releasement by cultured phototrophic biofilms, synthetic micro-polluted water was first treated under different intensities of artificial light. Then, interactions between phototrophic biofilms and actual source water collected from Taihu, China, were studied under sunlight without artificial control. The nutrient variation, pH and DO fluctuation regarding the natural water body were monitored during the day and night. Finally, the practical application of phototrophic biofilms at the pilot-scale was evaluated. In this way, this study can provide useful information for utilizing phototrophic biofilms to pretreat micro-polluted source water in water treatment plants.
2. Materials and Methods
2.1. The Source of Phototrophic Biofilms
The initial phototrophic biofilms were collected from the wall of a secondary sedimentation tank underwater 10–20 cm at a municipal wastewater treatment plant (N 32.01975°, E 118.69340°) in spring, when the phototrophic biofilms grew vigorously. Then, the collected phototrophic biofilms were transported to the laboratory and stored at 4 °C.
2.2. The Cultivation of Raw Phototrophic Biofilms
A photobioreactor made up of black plexiglass with four individual flow lanes was used to cultivate raw phototrophic biofilms (Figure S1a). The dimension of the lane was 1200 mm × 80 mm × 100 mm. The effective width was set as 60 mm. In each lane, the medium flowed over the polycarbonate (PC) substratum (78 mm × 30 mm) used for biofilm adhesion. The biofilm carrier was spread along the flow channel and fastened by a pressure block to create a stable hydraulic condition. The dimming device consisted of a straight tube fluorescent lamp (PHILIPS, TL/D-36w), a digital electronic ballast and a potentiometer (HEP, Germany) (Figure S1b). The circulating pump (Qmax = 660 L/h) and supporting rotor flowmeter were also implemented.
The biofilm samples were inoculated on the polycarbonate carrier in the photobioreactor with the first 2–3 days of static culture. After the microbial adhesion, the water flow rate increased gradually to 0.05 m/s with a 0.1% hydraulic slope. Before subsequent experiments, three channels were first used to cultivate the biofilms with light intensities of 4500 lx (photosynthetic photon flux density (PPFD) of 60.75 μmol/m2/s), 3000 lx (40.50 μmol/m2/s) and 1500 lx (20.25 μmol/m2/s), respectively. The cycle of lighting mode was 16 h for the day and 8 h for the night. The culture medium was changed twice a week. After 30 days of cultivation, the total organic carbon (TOC), biomass, photosynthesis pigments and EPS of three cultured phototrophic biofilms were measured.
The improved BG11 culture medium was used to culture phototrophic biofilms [25]. The compositions of medium were 1.5 g/L NaNO3, 0.075 g/L MgSO4·7H2O, 0.02 g/L Na2CO3, 0.001 g/L FeCl3, 0.057 g/L Na2SiO3·9H2O, 0.04 g/L K2HPO4, 0.036 g/L CaCl2·7H2O, 0.006 g/L citric acid, 0.001 g/L EDTA and 1 mL trace element solution. The compositions of trace element solution were 2.86 g/L H3BO4, 0.222 g/L ZnSO4·7H2O, 0.079 g/L CuSO4·5H2O, 1.81 g/L MnCl2·4H2O, 0.39 g/L Na2MoO4, 0.494 g/L Co(NO3)2·6H2O, 0.04 mg/L VB1 and 0.04 mg/L VB12.
2.3. The Compositions of Micro-Polluted Water
To test the ability of the cultured phototrophic biofilms, the concentration of nutrients in synthetic water (6–10 mg/L CODMn, 0.75–6.00 mg/L NH4+-N, 2.0–3.75 mg/L NO3−-N, 2–16 mg/L TN, 0.05–0.1 mg/L TP) were relatively higher than those of real micro-polluted source water. In addition, the trace element solution was added to meet the growing needs of the phototrophic biofilms. The actual micro-polluted water for the experiments was collected from Taihu, China. The compositions of actual micro-polluted source water were 2.40–4.36 mg/L CODMn, 0.035–0.139 mg/L NH4+-N, 0.054–0.122 mg/L NO3−-N and 0.015–0.052 mg/L TP.
2.4. The Setup of Treatment Experiments
After the cultivation of phototrophic biofilms, synthetic water was used to estimate the treatment performance of the cultured phototrophic biofilms. The treatment experiments were carried out in the photobioreactor with different light intensities of 4500 lx, 3375 lx, 2250 lx and the lighting mode was 14 h/10 h (day/night cycle). The synthetic water flowed over the cultured phototrophic biofilms through the circulating pump. The treatment performance in 48 h was investigated, and effluents were gathered to be monitored when day and night alternated.
Then, the actual micro-polluted source water was used to simulate the natural aquatic environments. The effects of different light spectra on the bioremediation performance of the cultured phototrophic biofilms were investigated. Four mature biofilms harvested from the previous culture period with the same area were inoculated in four 2 L beakers. Sunlight (SL) is the only light source during the day and the beakers were put in a black box at night. Three beakers were wrapped in different types of light-filter membrane to create red light (RL, 200–460 nm), light-green light (LGL, 330–440 nm, 460–600 nm, 720–800 nm) and dark-green light (DGL, 450–600 nm), respectively, whereas the last breaker was set as control (sunlight). These light-filter membranes were utilized to create different light conditions, which helped understand the effects of different light conditions on the treatment of actual micro-polluted source water by the phototrophic biofilms. During the culture period, water in the beaker was replaced by actual micro-polluted water through a trickle siphon every 12 h; before that, DO, pH, CODMn, NH4+-N, NO3−_N and TP were monitored. Other parameters, such as DO, pH and temperature (room temperature around 25 °C) were not controlled.
2.5. The Development of Pilot-Scale Phototrophic Biofilm Equipment
The pilot-scale phototrophic biofilm equipment was established at a water treatment plant in Suzhou, China. The schematic of the pilot-scale equipment for cultivating phototrophic biofilms is shown in Figure S2. This equipment consisted of a pre-sedimentation zone, a reaction zone, a drainage zone and a flat carrier. The size of flow channel in the reaction zone was 280 × 60 cm. Polycarbonate plates were laid flat at the bottom of the flat carrier. A gauze with coarse-holes (2 × 2 cm) was laid on the polycarbonate plates. The micro-polluted source water was pumped to the pre-sedimentation zone and flowed to the reaction zone through a triangle weir. An adjustable flat weir was set at the end of the reaction zone to control the water level.
The raw phototrophic biofilms were inoculated at the polycarbonate plates. After two weeks of static cultivation, the thickness of phototrophic biofilms reached 2–3 cm with an autotrophic index of 127.03. Then, the pretreatment experiments were conducted for 60 days with an influent volume of 12 m3/d, a hydraulic load of 7 m3/(m2·d) and a water depth of 0.20 m.
2.6. Analysis Methods
The biofilm biomass was determined by the biofilm lipid phosphorus method [26], which was expressed as the number of cells. The algae number was measured with a microscope count method [27]. The concentrations of chlorophyll a (Chl-a), chlorophyll b (Chl-b), chlorophyll c (Chl-c), CODMn, NH4+-N, NO2−_N, NO3−_N and TP were measured using the standard methods [28]. Total organic carbon (TOC) was determined with an OIAnaltica apparatus (Model 1030). The EPS extraction and determination processes were the same as the methods used in the previous study [29].
Phototrophic biofilms were freeze-dried by vacuum freeze dryer (Labconco, USA), then the dry weight (DW) of the phototrophic biofilms was weighed. After drying for 2 h at 85 °C, the biofilms were burned for 1 h at 550 °C in the muffle furnace, then the ash-free dry weight (ADW) was weighed.
The autotrophic index (AI) was used to describe the relative growth level of the autotrophic and heterotrophic microorganisms in the biofilm. The autotrophic index of phototrophic biofilms was measured by Equation (1) [30]:
3. Results and Discussions
3.1. The Characterization of Cultured Phototrophic Biofilms
As shown in Figure 1a, the TOC of three cultured phototrophic biofilms reached 1.25 × 10⁴, 2.39 × 10⁴ and 3.76 × 10⁴ mg C/m2, respectively. The DW also increased from 8.04 ± 0.8 to 20.25 ± 2.58 g/m2 as the enhancement of light intensity. The biomass of the cultured phototrophic biofilms is illustrated in Figure 1b. The biomass per unit area increased from 3.68 × 10⁶ to 4.80 × 10⁶ Cells/m2 while the biomass per unit mass slightly decreased from 1.16 × 10⁵ to 1.06 × 10⁵ Cells/g DW. The higher light intensities provided more photons for the photosynthesis of the phototrophic microorganisms, leading to the increase of total biomass, as well as an increasing biomass in the single phototrophic cell [31].
The content of photosynthesis pigment in the phototrophic biofilms affects the photosynthetic reaction rate. The contents of Chl-a, Chl-b, Chl-c and the ratio of Chl-a/Chl-b are presented in Table 1. Under the highest light intensity, the Chl-a content reached 90.10 mg/m2. The content of Chl-a in the biofilms was much higher than that of Chl-b and Chl-c, which suggested that Chl-a was the antenna pigment in the phototrophic biofilms [32]. With the increase of Chl-a/Chl-b from 25.48 to 75.08, the phototrophic biofilms system had the ability to absorb more photons and had better adaptability to strong light [29]. In addition, the autotrophic indexes (AI) of the mature phototrophic biofilms under varying light intensities were 72.91, 90.59 and 40.73, respectively (Figure 1c). The decrease of AI under the highest light intensity implied that the concentration of Chl-a was greatly increased in the phototrophic cells (Table 1).
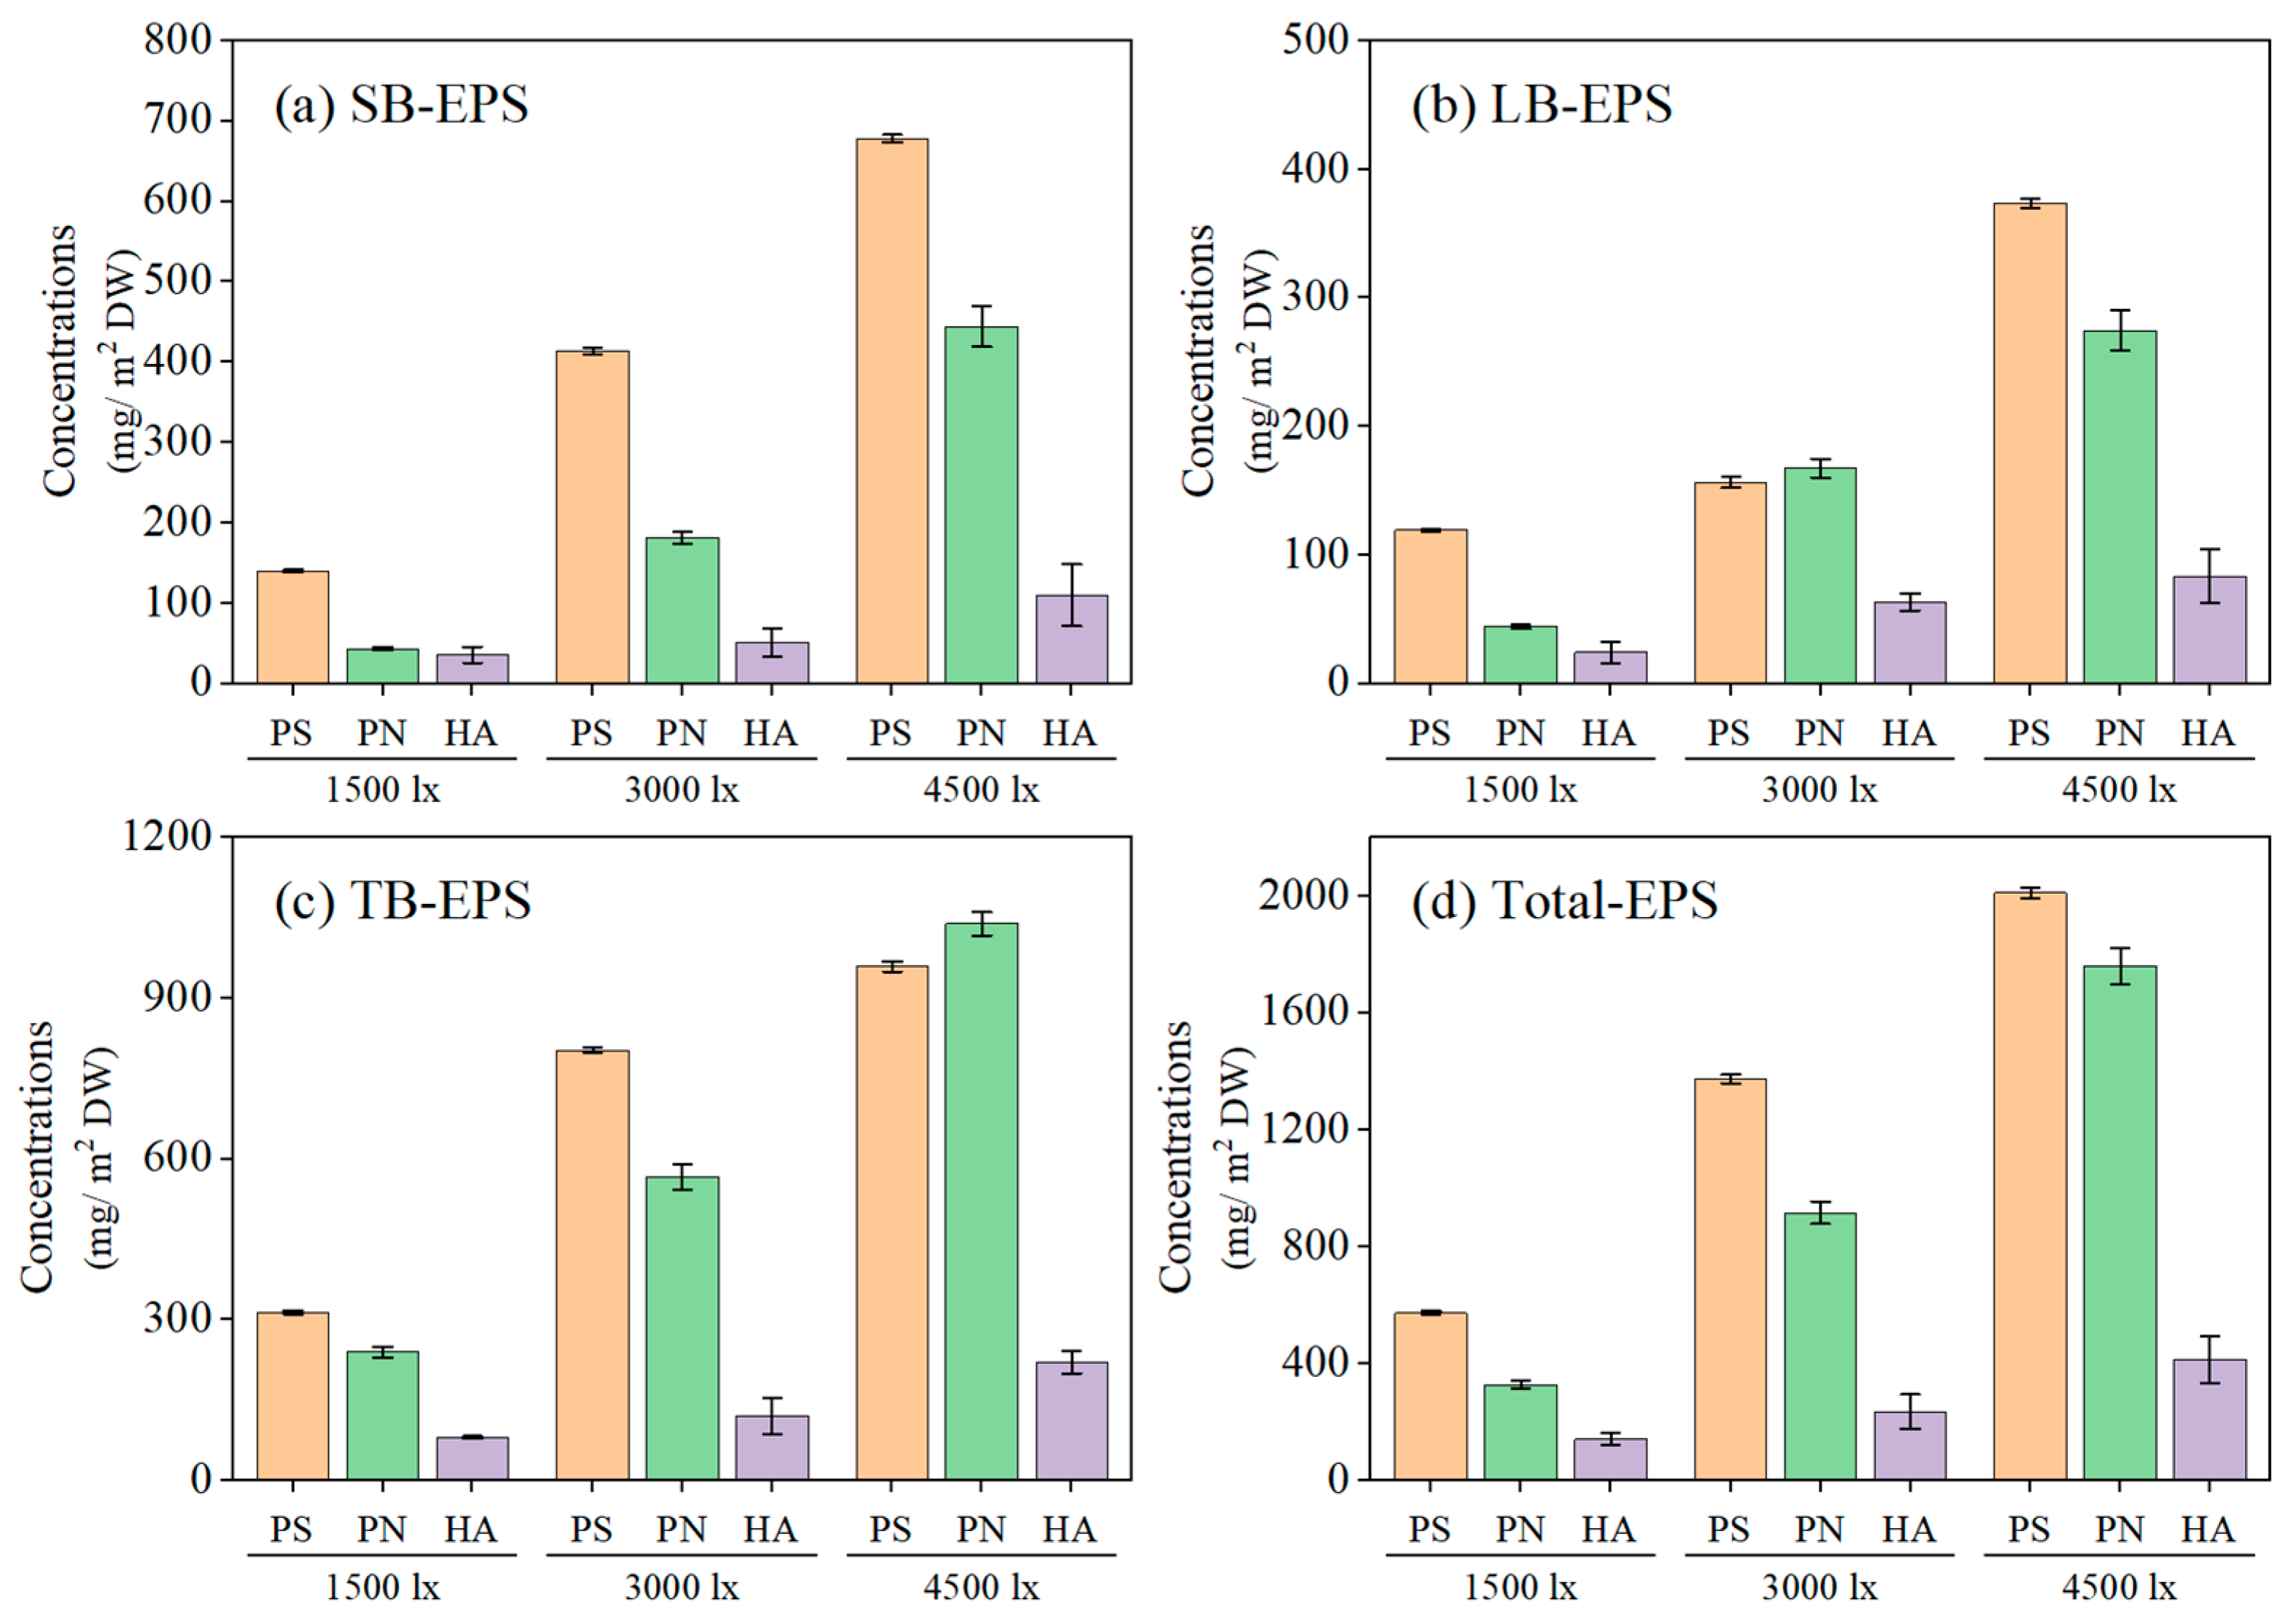
The contents of total EPS, soluble EPS (SB-EPS), loosely-bound EPS (LB-EPS) and tightly-bound EPS (TB-EPS) in the phototrophic biofilms under different light intensities are shown in Figure 2. The total EPS contents reached 1085 ± 40, 2523 ± 111 and 4181 ± 160 mg/m2 DW, respectively, at the light intensities of 1500 lx, 3000 lx and 4500 lx. Further, TB-EPS was the main EPS in the phototrophic biofilms in all light conditions, but the relative amount of TB-EPS in the total EPS decreased (61% > 59% > 53%) with the increase of light intensity. Meanwhile, the increase of SB-EPS (21% < 26% < 29%) revealed that more biodegradable SB-EPS was produced by heterotrophic microorganisms under strong light and low organic substrate conditions [33]. The subcomponents of EPS, humic acid (HA), protein (PN) and polysaccharide (PS) in the phototrophic biofilms are also presented in Figure 2. The distribution of PS, PN and HA in EPS changed obviously due to the varying light intensity. The content of PS in SB-EPS decreased (64% > 63% > 55%), but the content of PN in SB-EPS increased (20% < 28% < 36%) with the increase in light intensity. Similarly, the content of PN in TB-EPS increased (37% < 38% < 47%). The PN/PS ratios of the total EPS at 1500 lx, 3000 lx and 4500 lx were 0.57, 0.67 and 0.87, respectively. The EPS contents of the phototrophic biofilms are affected by environmental conditions and the corresponding metabolism of mixed microbial communities [29,34]. In natural environments, EPS play a key role in protecting phototrophic biofilms from UV irradiation and drought under high sunlight intensity [35]. The increasing content of PN in the EPS suggested that PN not only participated in the formation of a stable EPS matrix, but also possessed the function of preventing light damage [34,36,37].
3.2. The Ability of Phototrophic Biofilms to Pretreat Synthetic Micro-Polluted Water
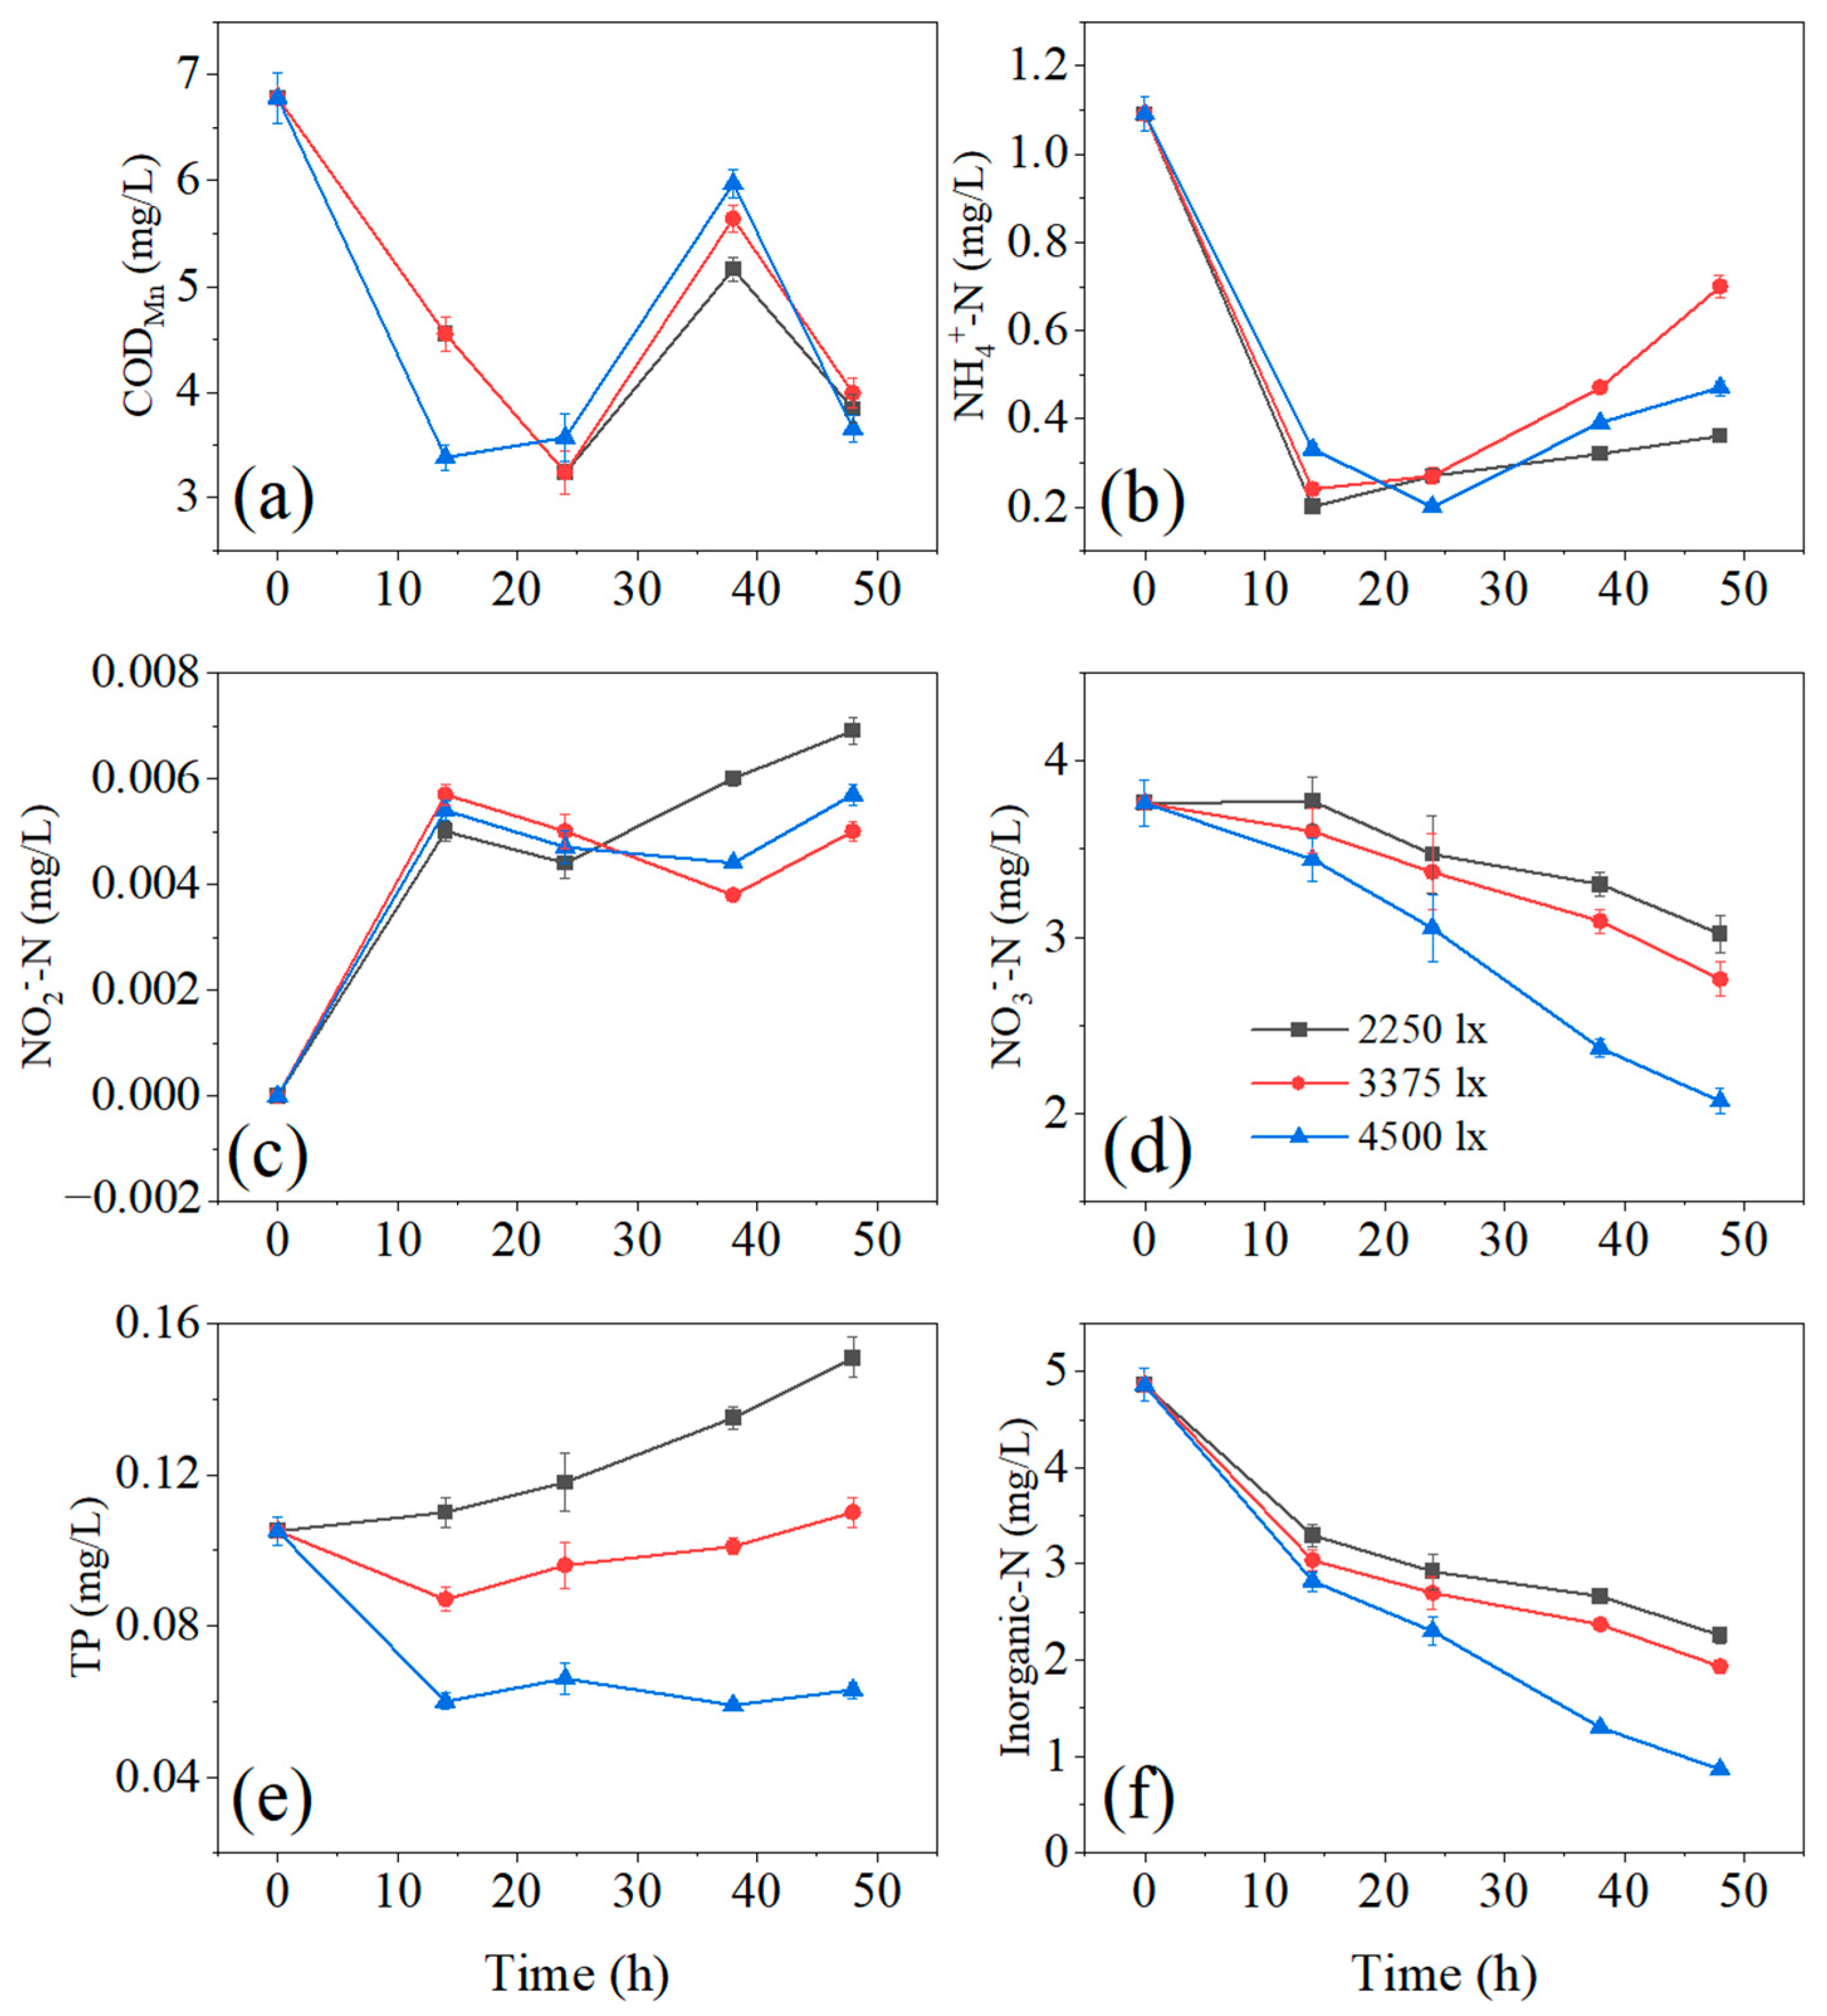
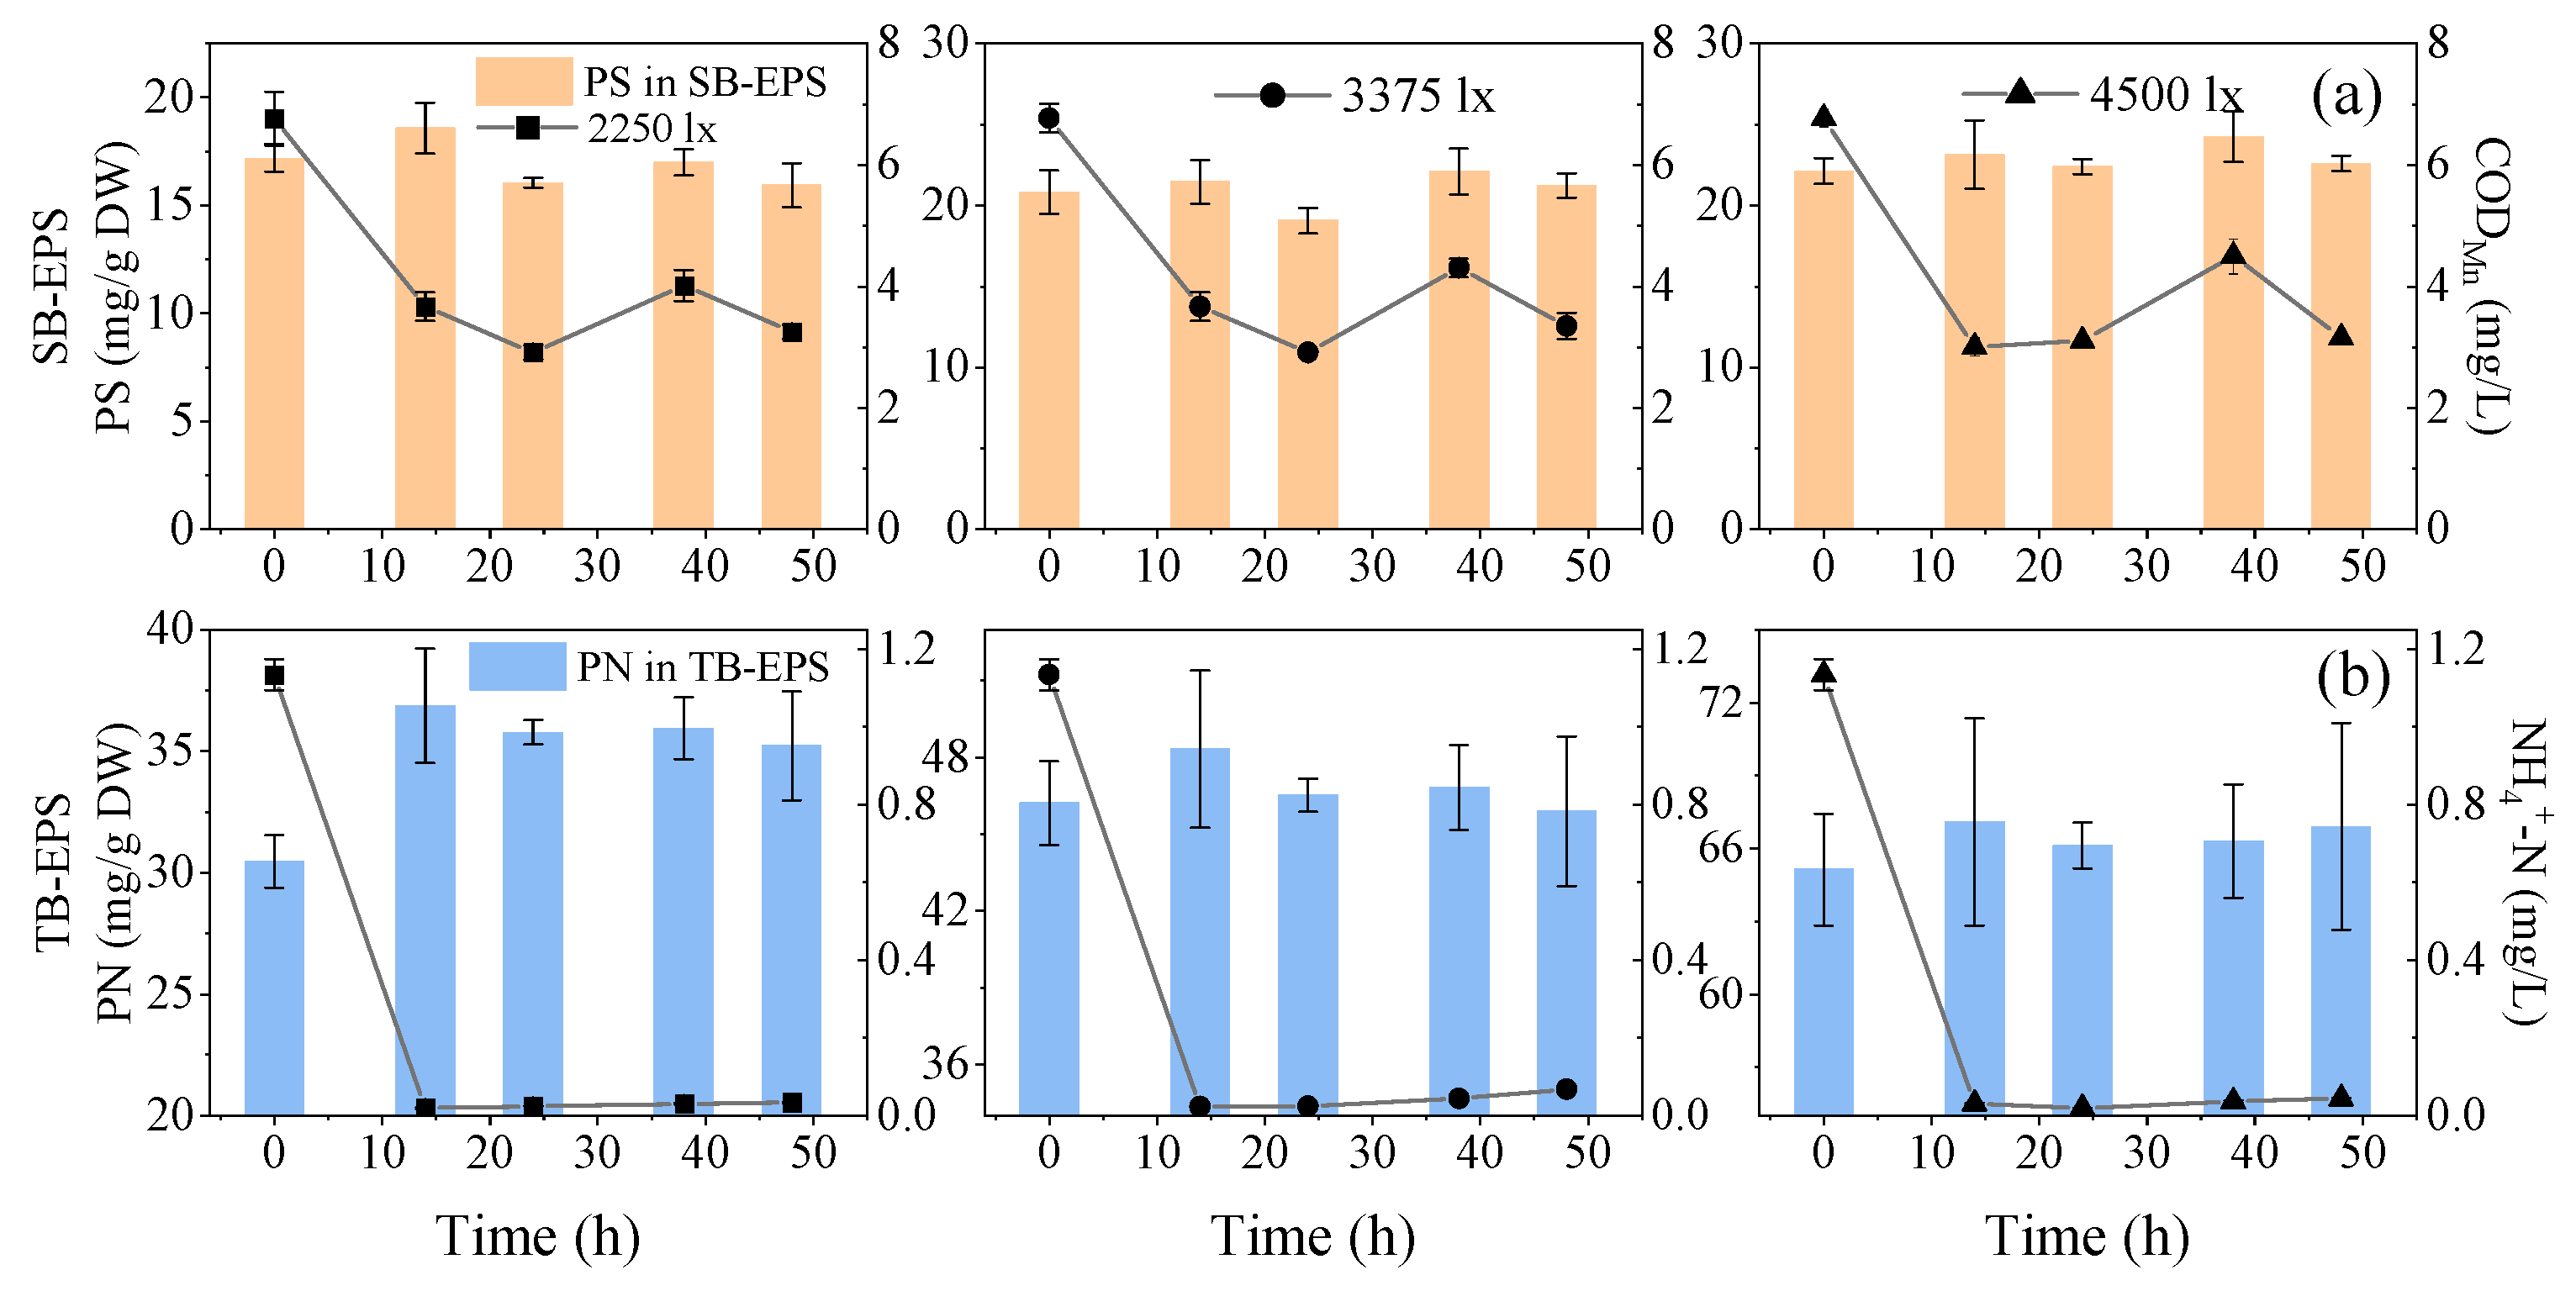
The pretreatment results of synthetic micro-polluted water by cultured phototrophic biofilms are presented in Figure 3. After 14 h light exposure at three light intensities, the removal efficiency of CODMn reached 45.80%, 45.80% and 55.60%, respectively (Figure 3a). In 14–24 h, CODMn concentration continuously decreased at 2250 lx and 3375 lx due to the metabolism of heterotrophic microorganisms without light. In 24–38 h, CODMn concentration increased by approximately 20% and increased more under strong light. As shown in Figure 4a, the content of polysaccharide in SB-EPS increased under three light intensities in 24–38 h, leading to an increase of CODMn. However, CODMn concentration decreased in 38–48 h, with the decrease of protein in SB-EPS.
The removal efficiency of NH4+-N reached 97% under varying light intensity in 0–14 h (Figure 3b). Meanwhile, the extracellular proteins in EPS increased in 0–14 h (Figure 4b). In this phase, NH4+-N was fixed by microbial communities and utilized for microbial growth and the synthesis of extracellular proteins [7,38]. The slight change of NO2−-N implied that the contribution of nitrification in phototrophic biofilms on the removal of NH4+-N was negligible (Figure 3c). Besides, NO3−-N was reduced by 4.30% at 3375 lx and 8.60% at 4500 lx in 0–14 h (Figure 3d). Algae can utilize NO3−-N and NH4+-N at the same time under strong light intensity [39]. However, NH4+-N was the first choice for algae assimilation under low light intensity. After 14 h, NH4+-N concentration increased slightly due to the ammonization of organic nitrogen without light. In 24–48 h, NO3−-N decreased sharply due to the lack of NH4+-N. To sum up, the removal efficiency of inorganic nitrogen reached 37.48%, 42.20% and 56.82% under three light intensities, respectively (Figure 3f). This result indicated that cultured phototrophic biofilms could effectively remove inorganic nitrogen in synthetic micro-polluted water.
The removal efficiency of TP by the phototrophic biofilms was poor in this study (Figure 3e). After 48 h treatment, TP was reduced by 40.90% at 4500 lx but increased under low light intensity. In addition, the anaerobic environment may be created in the depth of the phototrophic biofilms due to the low light intensity of 2250 lx and 3375 lx. Therefore, the anaerobic release of phosphorus occurred under low light intensity, leading to an increase of TP in water [40]. These results implied that high light intensity was a prerequisite for the phototrophic biofilms to remove TP in micro-polluted water.
3.3. The Pretreatment of Actual Micro-Polluted Water under Varying Light Spectra
The cultured phototrophic biofilms were also used to pretreat actual micro-polluted water for 24 days under different light spectra. The transmittance of different light filter films was measured. As shown in Figure S3, the RL filter membrane cannot filter out two main absorption bands of Chl-a, but the LGL filter membrane can filter out the absorption band in the blue zone, and the DGL filter membrane can filter out two main absorption bands.
The pH fluctuation in four beakers during 24 days is illustrated in Figure S4. The sharp increase of pH was observed in the first 7 days and this period was set as an adaption period. In the adaption period (stage A), the average increase of pH under SL, RL, LGL and DGL reached 0.67, 0.86, 0.75 and 0.19, respectively. Similarly, the fluctuation of DO measured in the adaption period was higher than that in 8–24 d, which was set as a stabilization period (stage B) (Figure S5). The average increase of DO under SL, RL, LGL and DGL reached 2.28 mg/L, 2.84 mg/L, 2.23 mg/L and 0.91 mg/L, respectively. Photosynthesis performed by phototrophs can increase the pH and DO levels in aqueous environments by absorbing CO2 and releasing O2 [7]. The changes in pH and DO shows that the highest photosynthetic reaction rate of phototrophic biofilms was achieved under RL.
The fluctuation of CODMn during 24 days is given in Figure S6a. The actual micro-pollutant source water contained fewer nutrients than the synthetic micro-polluted water for the cultivation of phototrophic biofilms. Therefore, adaption periods occurred in all four phototrophic biofilms, which involved the death of excess microorganisms because the biomass of the phototrophic biofilms exceeded environmental capacity. In the adaption period (stage A), the concentration of CODMn in the effluent was higher than that in the influent because of the releasement of intracellular microbial substances and the production of SB-EPS by microorganisms. However, in the stabilization period (stage B), the concentration of CODMn in the effluent was lower than that in stage A due to the decrease of microbial death in the phototrophic biofilms.
In stage A, the concentration of NH4+-N in the effluent was higher than that in actual micro-polluted water under varying light spectra. In stage B, the assimilation of NH4+-N was limited because of the low NH4+-N concentration (0.04–0.05 mg/L). In stages A and B, NO3−-N was removed effectively under all light spectra. This result revealed that NO3−-N became the main inorganic nitrogen source for the growth of biomass under low NH4+-N condition [39]. Nitrogen conversions performed by the phototrophic biofilms are associated with many intermediated products, such as organic nitrogen, NH4+-N, NO2−-N, NO3−-N, NH2OH, NO, N2O and N2 [22]. The utilization of microbial growth, the release of cell lysis, nitrification/denitrification and ammonification make nitrogen conversions into dynamic processes. The autotrophic bacteria and algae in the phototrophic biofilms competed for NH4+-N, and the algae had advantages over autotrophic bacteria in this process. On one hand, algae assimilated NH4+-N and released oxygen by photosynthesis during the day. On the other hand, autotrophic bacteria accepted oxygen released by algae to assimilate NH4+-N. It indicated that NH4+-N in micro-polluted water could be assimilated by the high activity of algae in the phototrophic biofilms during the daytime, rather than nitrification by autotrophic bacteria. In addition, NH4+-N can volatilize from water as ammonia gas at high pH (>8), in this study. Therefore, phototrophic biofilms are promising for NH4+-N removal through multiple pathways.
In the initial period of stage A (2 days), TP decreased due to the assimilation by microorganisms in a new environment. Then, under varying light spectra, TP decreased during the daytime but increased at night, which was caused by algal respiration [10,39]. The change of pH may lead to the fluctuation of TP concentration in the water, because of the chemical precipitation of P with calcium and magnesium ions under high pH (8.5–9.5) [41]. Extracellular polysaccharides secreted by the microorganisms in the phototrophic biofilms also provide bind sites for phosphorus through hydrogen bonds [42]. The highest removal efficiency of TP was observed under RL, indicating that the high photosynthetic reaction rate can enhance the removal efficiency of TP.
In this study, the red light spectrum in the sunlight provided the biggest contribution to the pretreatment of actual micro-polluted source water. Similarly, Sharp et al. (2017) [43] have recently found that the volumetric and surface area productivity of phototrophic community reached the highest volume under red light and were stable over time. The photosynthetic reaction rate of the phototrophic biofilms under SL was lower than RL because the light intensity of SL exceeded the light saturation point, and light inhibition occurred [44]. These results implied that when the strength of sunlight was stronger than the light saturation point of phototrophic biofilms, preserving the red light spectrum by RL filter membrane was better for the operating of the phototrophic biofilms.
3.4. The Practical Applications of Phototrophic Biofilms
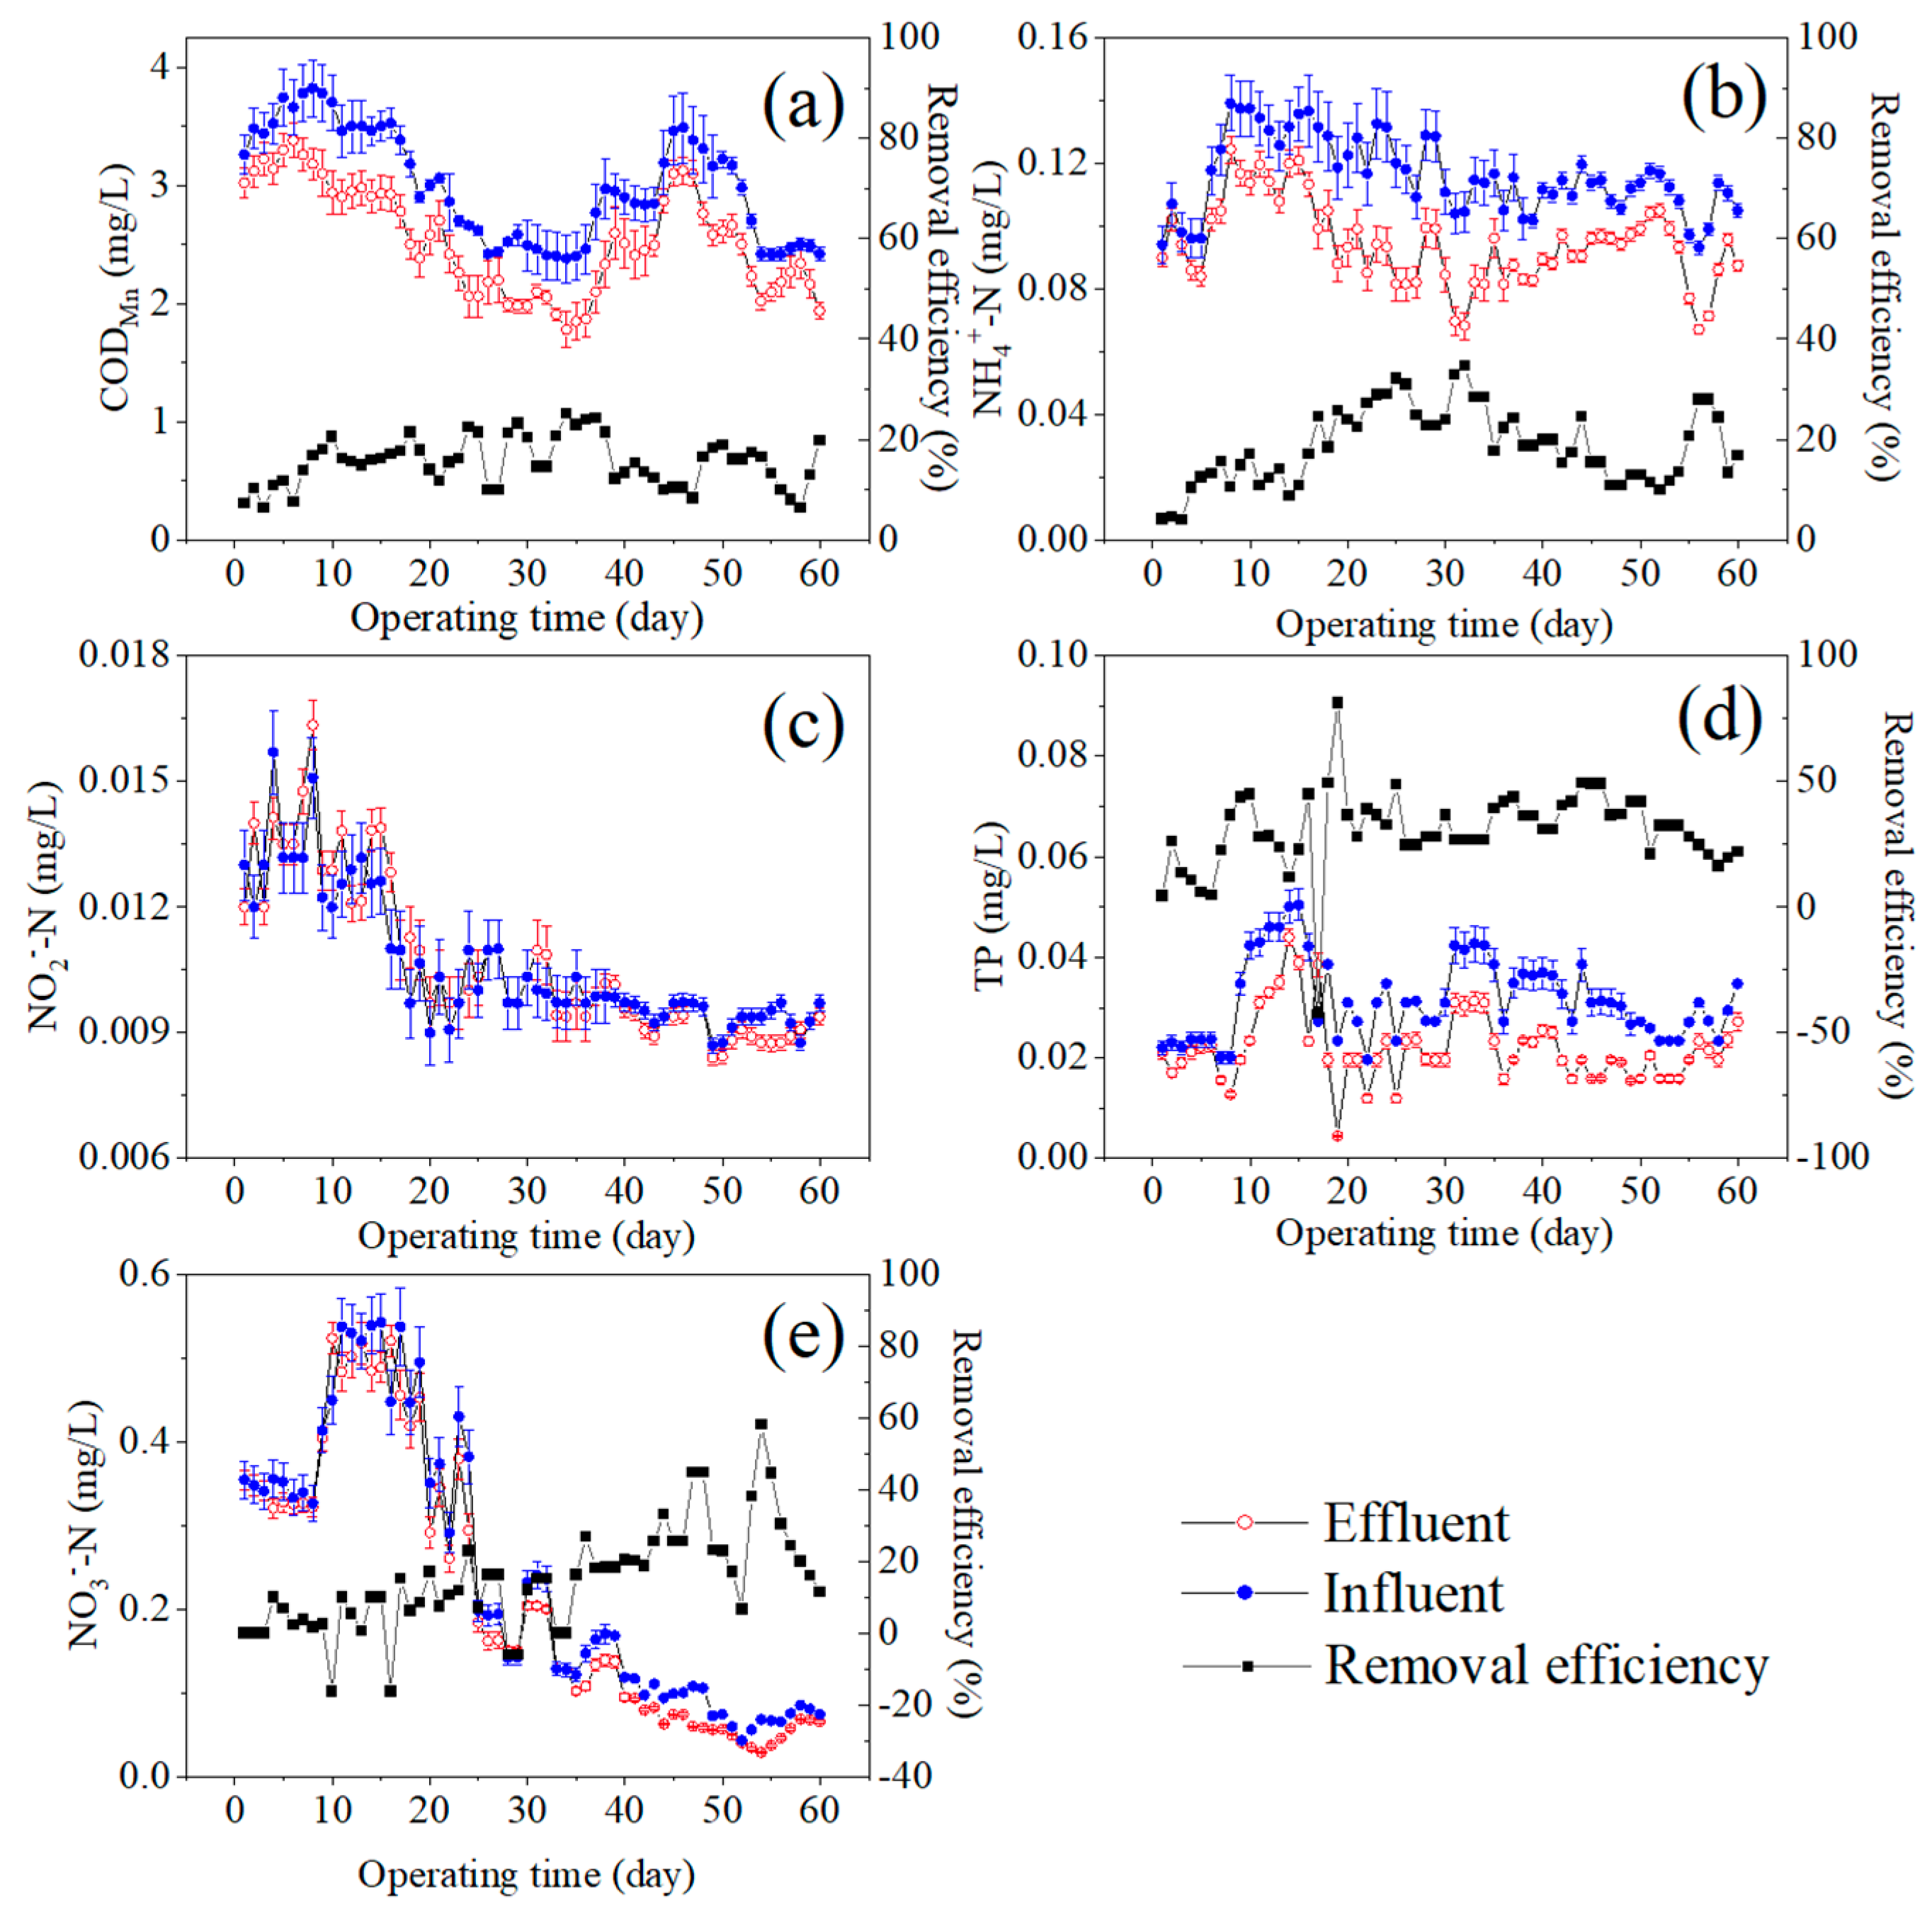
To evaluate the practical ability of phototrophic biofilms for pretreating micro-polluted source water, the pilot-scale phototrophic biofilm equipment was implemented. The concentrations and removal efficiency of nutrients in the actual micro-polluted source water by the pilot-scale phototrophic biofilms are illustrated in Figure 5. In the 60-day experiment, the average removal efficiency of CODMn, NH4+-N and TP were 17.5%, 25.0% and 34.38%, respectively, whereas the removal efficiency of NO3−-N and NO2−-N were negligible. The concentrations of CODMn and NH4+-N in the actual micro-polluted water met the Grade I surface water quality standard in China. However, the average concentration of TP in influent was 0.032 mg P/L, which exceeded the Grade II surface water quality standard for lakes. After pretreating by the pilot-scale phototrophic biofilms, the average concentration of TP in effluent was reduced to 0.021 mg P/L. Therefore, the effluent of the pilot-scale phototrophic biofilms fulfilled the Grade II surface water quality standard.
To identify the main removal pathway of TP, the correlation efficiency between TP removal rate (TPR) and the concentration of biofilm lipid phosphorus (LP), and the correlation efficiency between TPR and ADW, were evaluated (Figure S7). Phosphorus can be immobilized in the biomass of phototrophic biofilms through assimilation and adsorption [7]. The log value of TRP and LP showed higher R2 (0.85) than that of TPR and ADW (0.72), indicating that the microbial assimilation dominated the removal of TP by the phototrophic biofilms [45]. Guzzon et al. (2008) [45] also found that the TRP have a great correlation with the maximum P concentration in phototrophic biofilms (R2 = 0.89).
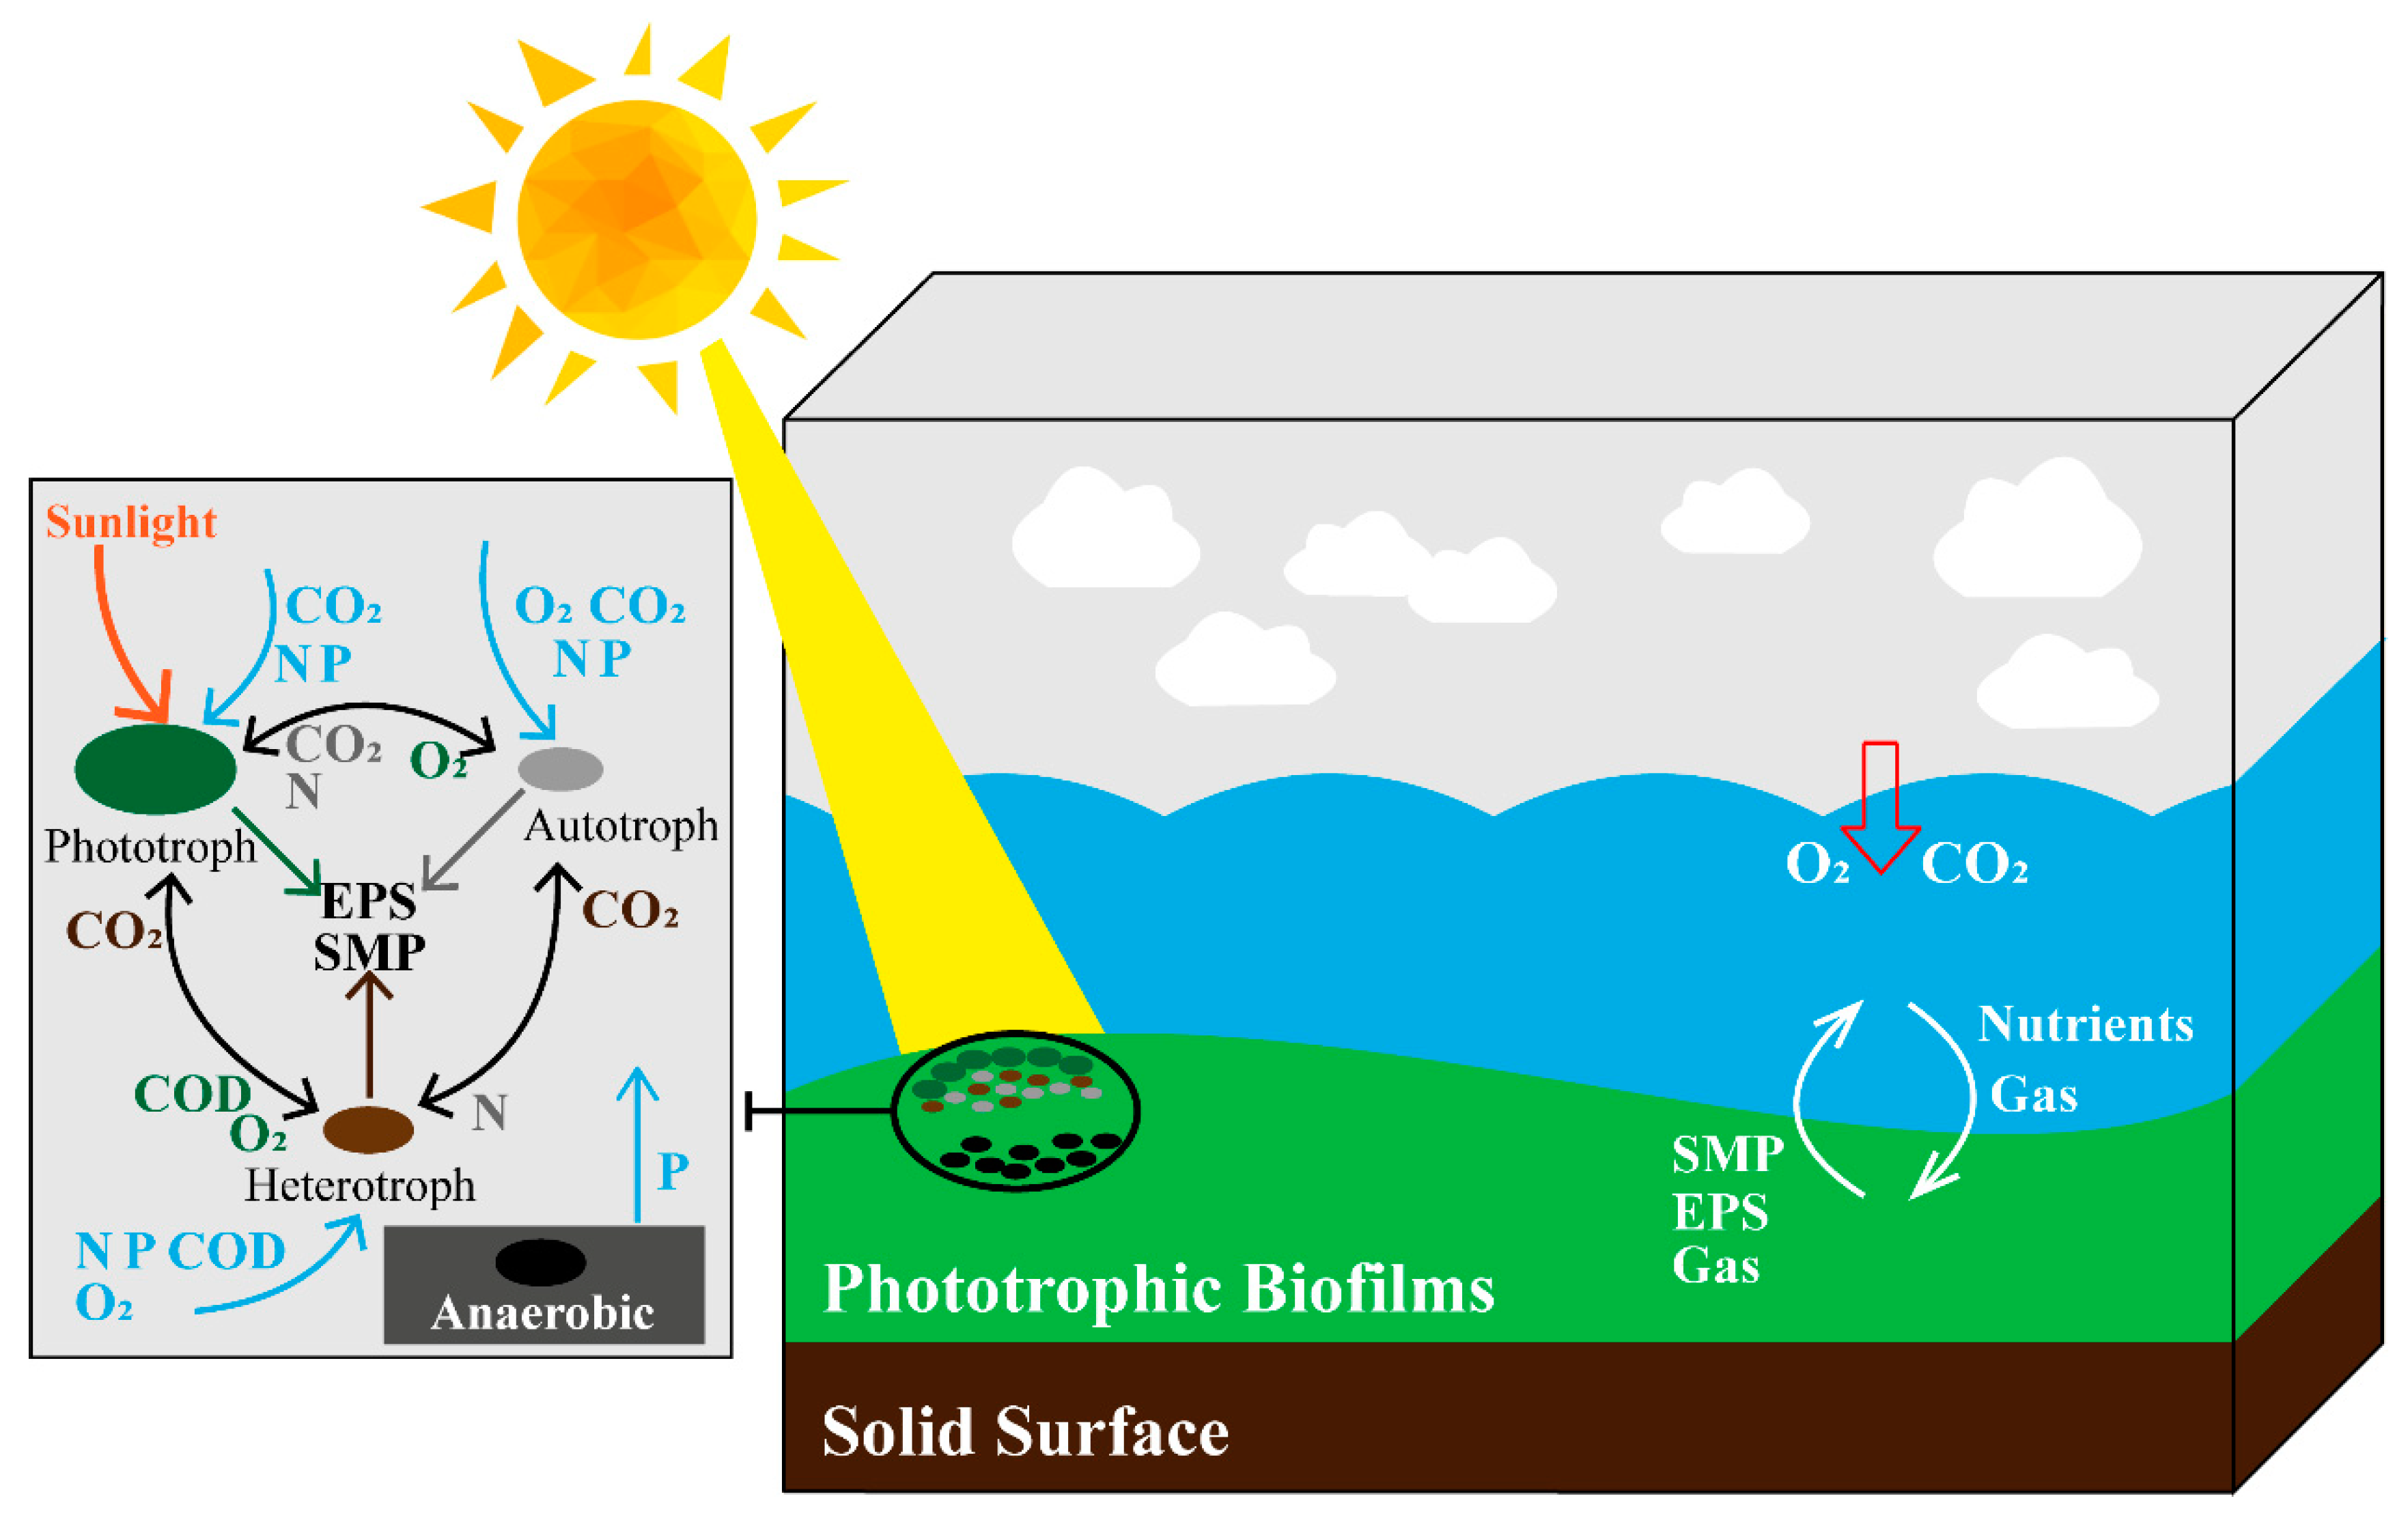
The main pathways for removing excess nutrients in the micro-polluted source water by the phototrophic biofilms are the assimilations of phototroph, autotroph and heterotroph (Figure 6). These symbiotic bacteria not only compete for external nutrients, but also support each other by releasing gases, (i.e., CO2 and O2) or secreting extracellular substances (i.e., SMP and EPS) [20,32]. The anoxic and anaerobic zones that existed at the bottom of phototrophic biofilms bring more complex biochemical processes, such as N conversion and P releasement [46]. In the pilot-scale test, the phototrophic biofilms gradually become a stable microecosystem in which the excess nutrients in the influent were absorbed by mixed microbial communities. The results in this study showed that phototrophic biofilms had the ability to remove excess nutrients in the micro-polluted source water and keep stability when nutrients were relatively low in these dynamic processes. Except for the basic organic and inorganic nutrients monitored in this study, trace amounts of emerging pollutants and heavy metals in the micro-polluted water also can be removed by the phototrophic biofilms via adsorption, or degradation pathways [15,47]. Microalgae stains existing in phototrophic biofilms are capable of adsorbing many types of heavy metals, such as As, Cd, Cr, Pb and Hg [48]. Different microalgae stains showed different adsorption capacities for these heavy metals (e.g., Cd: 6.5–35.7 mg/g, Cr: 45.5–174.6 mg/g, Pb: 2.3–308.7 mg/g and Hg: 0.3–106.6 mg/g) [49]. Therefore, phototrophic biofilms may be a promising way to pretreat the micro-polluted source water.
4. Conclusions
This paper explored the potential of phototrophic biofilms for pretreating micro-polluted source water. Higher light intensities below the light saturation point are conducive to the absorption of inorganic nutrients in the micro-polluted source water. Red light spectra of sunlight contributed the most photons to the phototrophic biofilms with Chl-a as the dominant photosynthesis pigment. When nutrients in the micro-polluted water were excessive, the phototrophic biofilms could assimilate excess nutrients and grow accordingly. Phototrophs in the phototrophic biofilms dominated the NH4+-N removal process under adequate light intensities. Then, the phototrophic biofilms stabilized themselves and nutrient levels in the source water by multiple pathways. The effluent of pilot-scale phototrophic biofilms met the Grade II surface water quality standard in China.
Supplementary Materials
The following supporting information can be downloaded at: https://www.mdpi.com/article/10.3390/w15040621/s1. Figure S1: The prototype of the photobioreactor used to culture the phototrophic biofilms: (a) the flow lane of photobioreactor, (b) dimming device; Figure S2: The schematic of pilot-scale equipment for cultivating phototrophic biofilms; Figure S3: The transmittance of different light filter membranes. LG: light green, R: red, DG: dark green; Figure S4: The fluctuation of pH in effluent under four light spectra: (a) sunlight (SL), (b) red light (RL), (c) light-green light (LGL), (d) dark-green light (DGL). The pH value was directly recorded from pH equipment without error bar; Figure S5: The fluctuation of DO in effluent under four light spectra: (a) sunlight (SL), (b) red light (RL), (c) light-green light (LGL), (d) dark-green light (DGL). The DO value was directly recorded from DO equipment without error bar; Figure S6: The pretreatment results of actual micro-polluted water collected from TaiHu: (a) CODMn, (b) NH4+-N, (c) NO3-_N, (d) TP. SL: sunlight, RL: red light, LGL: light-green light, DGL: dark-green light; Figure S7: The correlation scatter plot for TP: (a) TP removal rate (TPR) vs. biofilm lipid phosphorus (LP), (b) TPR vs. ash-free dry weight (ADW).
Author Contributions
Conceptualization, H.-Y.L. and R.X.; formal analysis, T.-F.L. and Z.-X.H.; investigation, H.-Y.L. and R.X.; methodology, H.-Y.L. and R.X.; supervision, H.-Y.L.; writing—original draft, H.-Y.L. and R.X.; writing—review and editing, H.-Y.L., R.X., T.-F.L. and Z.-X.H. All authors have read and agreed to the published version of the manuscript.
Funding
This research received no external funding.
Informed Consent Statement
Not applicable.
Data Availability Statement
Supporting data can be found by emailing: [email protected].
Conflicts of Interest
The authors declare no conflict of interest.
References
- Ali, A.; Shaikh, I.A.; Abbasi, N.A.; Firdous, N.; Ashraf, M.N. Enhancing water efficiency and wastewater treatment using sustainable technologies: A laboratory and pilot study for adhesive and leather chemicals production. J. Water Process. Eng. 2020, 36, 10. [Google Scholar] [CrossRef]
- Espinoza-Tofalos, A.; Daghio, M.; Palma, E.; Aulenta, F.; Franzetti, A. Structure and Functions of Hydrocarbon-Degrading Microbial Communities in Bioelectrochemical Systems. Water 2020, 12, 343. [Google Scholar] [CrossRef]
- Wan, Y.; Huang, X.; Shi, B.; Shi, J.; Hao, H. Reduction of organic matter and disinfection byproducts formation potential by titanium, aluminum and ferric salts coagulation for micro-polluted source water treatment. Chemosphere 2019, 219, 28–35. [Google Scholar] [CrossRef] [PubMed]
- Xu, P.; Xiao, E.; He, F.; Xu, D.; Zhang, Y.; Wang, Y.; Wu, Z. High performance of integrated vertical-flow constructed wetland for polishing low C/N ratio river based on a pilot-scale study in Hangzhou, China. Environ. Sci. Pollut. Res. 2019, 26, 22431–22449. [Google Scholar] [CrossRef] [PubMed]
- Xie, K.; Wang, B.; Qiu, L.; Zhang, S.; Wang, J.; Liu, G.; Sun, S. Performance and bacterial community composition of volcanic scoria particles (VSP) in a biological aerated filter (BAF) for micro-polluted source water treatment. Water Environ. Res. 2019, 91, 954–967. [Google Scholar] [CrossRef] [PubMed]
- Gao, J.; Li, Q.; Zhang, J.; Wang, S.; Song, B.; Huang, Z. Purification of Micro-Polluted Lake Water by Biofortification of Vertical Subsurface Flow Constructed Wetlands in Low-Temperature Season. Water 2022, 14, 896. [Google Scholar] [CrossRef]
- Liu, J.; Wu, Y.; Wu, C.; Muylaert, K.; Vyverman, W.; Yu, H.Q.; Munoz, R.; Rittmann, B. Advanced nutrient removal from surface water by a consortium of attached microalgae and bacteria: A review. Bioresour. Technol. 2017, 241, 1127–1137. [Google Scholar] [CrossRef]
- Zhao, Q.H.; Wang, J.; Wang, J.J.; Wang, J.X.L. Seasonal dependency of controlling factors on the phytoplankton production in Taihu Lake, China. J. Environ. Sci. 2019, 76, 278–288. [Google Scholar] [CrossRef]
- Adey, W.H.; Kangas, P.C.; Mulbry, W. Algal Turf Scrubbing: Cleaning Surface Waters with Solar Energy while Producing a Biofuel. BioScience 2011, 61, 434–441. [Google Scholar] [CrossRef]
- Gao, F.; Yang, Z.H.; Li, C.; Zeng, G.M.; Ma, D.H.; Zhou, L. A novel algal biofilm membrane photobioreactor for attached microalgae growth and nutrients removal from secondary effluent. Bioresour. Technol. 2015, 179, 8–12. [Google Scholar] [CrossRef]
- Amini, E.; Babaei, A.; Mehrnia, M.R.; Shayegan, J.; Safdari, M.S. Municipal wastewater treatment by semi -continuous and membrane algal-bacterial photo-bioreactors. J. Water Process. Eng. 2020, 36, 8. [Google Scholar] [CrossRef]
- Shangguan, H.; Liu, J.; Zhu, Y.; Tong, Z.; Wu, Y. Start-up of a spiral periphyton bioreactor (SPR) for removal of COD and the characteristics of the associated microbial community. Bioresour. Technol. 2015, 193, 456–462. [Google Scholar] [CrossRef]
- Borderie, F.; Denis, M.; Barani, A.; Alaoui-Sosse, B.; Aleya, L. Microbial composition and ecological features of phototrophic biofilms proliferating in the Moidons Caves (France): Investigation at the single-cell level. Environ. Sci. Pollut. Res. 2016, 23, 12039–12049. [Google Scholar] [CrossRef] [PubMed]
- Li, S.S.; Wang, C.; Qin, H.J.; Li, Y.X.; Zheng, J.L.; Peng, C.R.; Li, D.H. Influence of phosphorus availability on the community structure and physiology of cultured biofilms. J. Environ. Sci. 2016, 42, 19–31. [Google Scholar] [CrossRef] [PubMed]
- Yang, J.; Shi, W.; Fang, F.; Guo, J.; Lu, L.; Xiao, Y.; Jiang, X. Exploring the feasibility of sewage treatment by algal-bacterial consortia. Crit. Rev. Biotechnol. 2020, 40, 169–179. [Google Scholar] [CrossRef] [PubMed]
- Zammit, G. Phototrophic biofilm communities and adaptation to growth on ancient archaeological surfaces. Ann. Microbiol. 2019, 69, 1047–1058. [Google Scholar] [CrossRef]
- Liu, J.; Sun, P.; Sun, R.; Wang, S.; Gao, B.; Tang, J.; Wu, Y.; Dolfing, J. Carbon-nutrient stoichiometry drives phosphorus immobilization in phototrophic biofilms at the soil-water interface in paddy fields. Water Res. 2019, 167, 115129. [Google Scholar] [CrossRef]
- Liu, X.Y.; Xu, X.Y.; Ma, Q.I.; Wu, W.H. Biological formation of 5-aminolevulinic acid by photosynthetic bacteria. J. Environ. Sci. 2005, 17, 152–155. [Google Scholar]
- Ma, X.Y.Y.; Dong, K.; Tang, L.; Wang, Y.K.; Wang, X.C.C.; Ngo, H.H.; Chen, R.; Wang, N. Investigation and assessment of micropollutants and associated biological effects in wastewater treatment processes. J. Environ. Sci. 2020, 94, 119–127. [Google Scholar] [CrossRef]
- Stal, L.J.; Bolhuis, H.; Cretoiu, M.S. Phototrophic marine benthic microbiomes: The ecophysiology of these biological entities. Environ. Microbiol. 2019, 21, 1529–1551. [Google Scholar] [CrossRef]
- ZoBell, C.E. The Effect of Solid Surfaces upon Bacterial Activity. J. Bacteriol. 1943, 46, 39–56. [Google Scholar] [CrossRef] [Green Version]
- Kang, D.; Zhao, Q.; Wu, Y.; Wu, C.; Xiang, W. Removal of nutrients and pharmaceuticals and personal care products from wastewater using periphyton photobioreactors. Bioresour. Technol. 2018, 248, 113–119. [Google Scholar] [CrossRef]
- Miranda, A.F.; Ramkumar, N.; Andriotis, C.; Höltkemeier, T.; Yasmin, A.; Rochfort, S.; Wlodkowic, D.; Morrison, P.; Roddick, F.; Spangenberg, G.; et al. Applications of microalgal biofilms for wastewater treatment and bioenergy production. Biotechnol. Biofuels 2017, 10, 120. [Google Scholar] [CrossRef] [PubMed]
- Wang, Y.; Tahir, N.; Cao, W.; Zhang, Q.; Lee, D.J. Grid columnar flat panel photobioreactor with immobilized photosynthetic bacteria for continuous photofermentative hydrogen production. Bioresour. Technol. 2019, 291, 121806. [Google Scholar] [CrossRef]
- Zippel, B.; Rijstenbil, J.; Neu, T.R. A flow-lane incubator for studying freshwater and marine phototrophic biofilms. J. Microbiol. Methods 2007, 70, 336–345. [Google Scholar] [CrossRef] [PubMed]
- Wu, Z.-l.; Yu, X.; Zhu, L.; Liu, B.; Shen, B.; Fu, L. Microbial biomass and activity in a full-scale O3-BAC filter. Huanjing Kexue 2010, 31, 1211–1214. [Google Scholar]
- Jiang, X.C.; Tu, Q.Y. Specification of Investigation of Lake Eutrophication; Chinese Environmental Science Publishing: Beijing, China, 1990. [Google Scholar]
- American Public Health Association. Standard Methods for the Examination of Water and Wastewater, 21st ed.; American Public Health Association: Washington, DC, USA, 2005. [Google Scholar]
- Fang, F.; Lu, W.T.; Shan, Q.; Cao, J.S. Characteristics of extracellular polymeric substances of phototrophic biofilms at different aquatic habitats. Carbohydr. Polym. 2014, 106, 1–6. [Google Scholar] [CrossRef]
- Wang, D.; Wang, M.; Luo, S. Aquatic Life Monitoring Manual; Southeast University Press: Nanjing, China, 1993. [Google Scholar]
- Wagner, K.; Bengtsson, M.M.; Findlay, R.H.; Battin, T.J.; Ulseth, A.J. High light intensity mediates a shift from allochthonous to autochthonous carbon use in phototrophic stream biofilms. J. Geophys. Res-Biogeo. 2017, 122, 1806–1820. [Google Scholar] [CrossRef]
- Carvalho, A.P.; Silva, S.O.; Baptista, J.M.; Malcata, F.X. Light requirements in microalgal photobioreactors: An overview of biophotonic aspects. Appl. Microbiol. Biotechnol. 2011, 89, 1275–1288. [Google Scholar] [CrossRef] [PubMed]
- Laspidou, C.S.; Rittmann, B.E. A unified theory for extracellular polymeric substances, soluble microbial products, and active and inert biomass. Water Res. 2002, 36, 2711–2720. [Google Scholar] [CrossRef]
- Xiao, R.; Zheng, Y. Overview of microalgal extracellular polymeric substances (EPS) and their applications. Biotechnol. Adv. 2016, 34, 1225–1244. [Google Scholar] [CrossRef] [PubMed]
- Rossi, F.; Micheletti, E.; Bruno, L.; Adhikary, S.P.; Albertano, P.; Philippis, R.D. Characteristics and role of the exocellular polysaccharides produced by five cyanobacteria isolated from phototrophic biofilms growing on stone monuments. Biofouling 2012, 28, 215–224. [Google Scholar] [CrossRef] [PubMed] [Green Version]
- Fang, F.; Xu, R.Z.; Wang, S.N.; Zhang, L.L.; Huang, Y.Q.; Luo, J.Y.; Feng, Q.; Cao, J.S. Characterization of interactions between a metabolic uncoupler O-chlorophenol and extracellular polymeric substances of activated sludge. Environ. Pollut. 2019, 247, 1020–1027. [Google Scholar] [CrossRef]
- Foulquier, A.; Morin, S.; Dabrin, A.; Margoum, C.; Mazzella, N.; Pesce, S. Effects of mixtures of dissolved and particulate contaminants on phototrophic biofilms: New insights from a PICT approach combining toxicity tests with passive samplers and model substances. Environ. Sci. Pollut. Res. 2015, 22, 4025–4036. [Google Scholar] [CrossRef] [PubMed]
- Ni, B.-J.; Yu, H.-Q. Microbial Products of Activated Sludge in Biological Wastewater Treatment Systems: A Critical Review. Crit. Rev. Environ. Sci. Technol. 2011, 42, 187–223. [Google Scholar] [CrossRef]
- Kesaano, M.; Sims, R.C. Algal biofilm based technology for wastewater treatment. Algal Res. 2014, 5, 231–240. [Google Scholar] [CrossRef]
- Carvalheira, M.; Oehmen, A.; Carvalho, G.; Reis, M.A.M. The effect of substrate competition on the metabolism of polyphosphate accumulating organisms (PAOs). Water Res. 2014, 64, 149–159. [Google Scholar] [CrossRef]
- Kumari, S.; Jose, S.; Jagadevan, S. Optimization of phosphate recovery as struvite from synthetic distillery wastewater using a chemical equilibrium model. Environ. Sci. Pollut. Res. 2019, 26, 30452–30462. [Google Scholar] [CrossRef]
- Li, S.-S.; Li, J.-H.; Xia, M.-S.; Meng, Y.-Y.; Zhang, H. Adsorption of nitrogen and phosphorus by intact cells and cell wall polysaccharides of Microcystis. J. Appl. Phycol. 2013, 25, 1539–1544. [Google Scholar] [CrossRef]
- Sharp, C.E.; Urschel, S.; Dong, X.; Brady, A.L.; Slater, G.F.; Strous, M. Robust, high-productivity phototrophic carbon capture at high pH and alkalinity using natural microbial communities. Biotechnol. Biofuels 2017, 10, 84. [Google Scholar] [CrossRef]
- Mantzorou, A.; Ververidis, F. Microalgal biofilms: A further step over current microalgal cultivation techniques. Sci. Total Environ. 2019, 651, 3187–3201. [Google Scholar] [CrossRef] [PubMed]
- Guzzon, A.; Bohn, A.; Diociaiuti, M.; Albertano, P. Cultured phototrophic biofilms for phosphorus removal in wastewater treatment. Water Res. 2008, 42, 4357–4367. [Google Scholar] [CrossRef] [PubMed]
- Wang, J.; Liu, W.; Liu, T. Biofilm based attached cultivation technology for microalgal biorefineries-A review. Bioresour. Technol. 2017, 244, 1245–1253. [Google Scholar] [CrossRef]
- Coutaud, M.; Méheut, M.; Viers, J.; Rols, J.-L.; Pokrovsky, O.S. Copper isotope fractionation during excretion from a phototrophic biofilm. Chem. Geol. 2019, 513, 88–100. [Google Scholar] [CrossRef]
- Abdelfattah, A.; Ali, S.S.; Ramadan, H.; El-Aswar, E.I.; Eltawab, R.; Ho, S.-H.; Elsamahy, T.; Li, S.; El-Sheekh, M.M.; Schagerl, M.; et al. Microalgae-based wastewater treatment: Mechanisms, challenges, recent advances, and future prospects. Environ. Sci. Ecotechnol. 2023, 13, 100205. [Google Scholar] [CrossRef]
- Leong, Y.K.; Chang, J.-S. Bioremediation of heavy metals using microalgae: Recent advances and mechanisms. Bioresour. Technol. 2020, 303, 122886. [Google Scholar] [CrossRef] [PubMed]
Figure 1.
Effects of different light intensities on the growth of phototrophic biofilms: (a) ash-free dry weight (DW) and total organic carbon (TOC), (b) the number of cells, (c) the concentration of chlorophyll a (Chl-a) and autotrophic index (AI).
Figure 1.
Effects of different light intensities on the growth of phototrophic biofilms: (a) ash-free dry weight (DW) and total organic carbon (TOC), (b) the number of cells, (c) the concentration of chlorophyll a (Chl-a) and autotrophic index (AI).

Figure 2.
The concentrations of EPS components in mature phototrophic biofilms cultivated under varying light intensities: (a) soluble EPS (SB-EPS), (b) loosely bound EPS (LB-EPS), (c) tightly bound EPS (TB-EPS), and (d) total-EPS. The EPS components were humic acid (HA), protein (PN) and carbohydrate (PS).

Figure 3.
The pretreatment results of synthetic micro-polluted water under different light intensities: (a) CODMn, (b) NH4+-N, (c) NO2−_N, (d) NO3−_N, (e) TP and (f) inorganic nitrogen.
Figure 3.
The pretreatment results of synthetic micro-polluted water under different light intensities: (a) CODMn, (b) NH4+-N, (c) NO2−_N, (d) NO3−_N, (e) TP and (f) inorganic nitrogen.

Figure 4.
The variation of EPS components responding to CODMn and NH4+-N concentration under different light intensities: (a) the changes of CODMn and carbohydrate (PS) in SB-EPS, (b) NH4+-N and protein in total-EPS in the pretreatment process.
Figure 4.
The variation of EPS components responding to CODMn and NH4+-N concentration under different light intensities: (a) the changes of CODMn and carbohydrate (PS) in SB-EPS, (b) NH4+-N and protein in total-EPS in the pretreatment process.

Figure 5.
The pretreatment results of micro-polluted water in the pilot-scale phototrophic biofilms: (a) CODMn, (b) NH4+-N, (c) NO2−_N, (d) TP and (e) NO3−_N.
Figure 5.
The pretreatment results of micro-polluted water in the pilot-scale phototrophic biofilms: (a) CODMn, (b) NH4+-N, (c) NO2−_N, (d) TP and (e) NO3−_N.

Figure 6.
The interaction mechanisms between the phototrophic biofilms and micro-polluted source water. SMP: soluble microbial products; EPS: extracellular polymeric substance.
Figure 6.
The interaction mechanisms between the phototrophic biofilms and micro-polluted source water. SMP: soluble microbial products; EPS: extracellular polymeric substance.


Table 1.
The concentrations of chlorophyll a, b and c in the phototrophic biofilms.
| Light Intensity | Chl-a (mg/m2) | Chl-b (mg/m2) | Chl-c (mg/m2) | Chl-a/Chl-b |
|---|---|---|---|---|
| 1500 lx | 70.4 ± 4.5 | 2.6 ± 0.2 | 7.7 ± 0.6 | 25.48 |
| 3000 lx | 72.6 ± 1.6 | 1.2 ± 0.1 | 8.0 ± 0.5 | 60.82 |
| 4500 lx | 90.1 ± 2.6 | 1.2 ± 0.1 | 8.0 ± 0.4 | 75.08 |
Disclaimer/Publisher’s Note: The statements, opinions and data contained in all publications are solely those of the individual author(s) and contributor(s) and not of MDPI and/or the editor(s). MDPI and/or the editor(s) disclaim responsibility for any injury to people or property resulting from any ideas, methods, instructions or products referred to in the content. |
© 2023 by the authors. Licensee MDPI, Basel, Switzerland. This article is an open access article distributed under the terms and conditions of the Creative Commons Attribution (CC BY) license (https://creativecommons.org/licenses/by/4.0/).
Share and Cite
MDPI and ACS Style
Li, H.-Y.; Xu, R.; Liu, T.-F.; Hu, Z.-X. The Pretreatment of Micro-Polluted Source Water through Phototrophic Biofilms under Variant Light Conditions. Water 2023, 15, 621. https://doi.org/10.3390/w15040621
AMA Style
Li H-Y, Xu R, Liu T-F, Hu Z-X. The Pretreatment of Micro-Polluted Source Water through Phototrophic Biofilms under Variant Light Conditions. Water. 2023; 15(4):621. https://doi.org/10.3390/w15040621
Chicago/Turabian StyleLi, Hong-Yi, Runze Xu, Ting-Feng Liu, and Zhi-Xin Hu. 2023. "The Pretreatment of Micro-Polluted Source Water through Phototrophic Biofilms under Variant Light Conditions" Water 15, no. 4: 621. https://doi.org/10.3390/w15040621
Note that from the first issue of 2016, this journal uses article numbers instead of page numbers. See further details here.