Author Contributions
Conceptualization, K.R.d.M., A.T.S., M.V., P.B., M.Ř., M.M., M.P. and J.K.; investigation and manuscript preparation and writing, K.R.d.M., A.T.S., M.V., D.B., P.B., M.M., M.P., T.R., M.Ř., J.T., M.T., V.Ž. and J.K.; supervision, resources and funding acquisition and project administration J.K., data curation, K.R.d.M., A.T.S., M.V. and P.B. All authors have read and agreed to the published version of the manuscript.
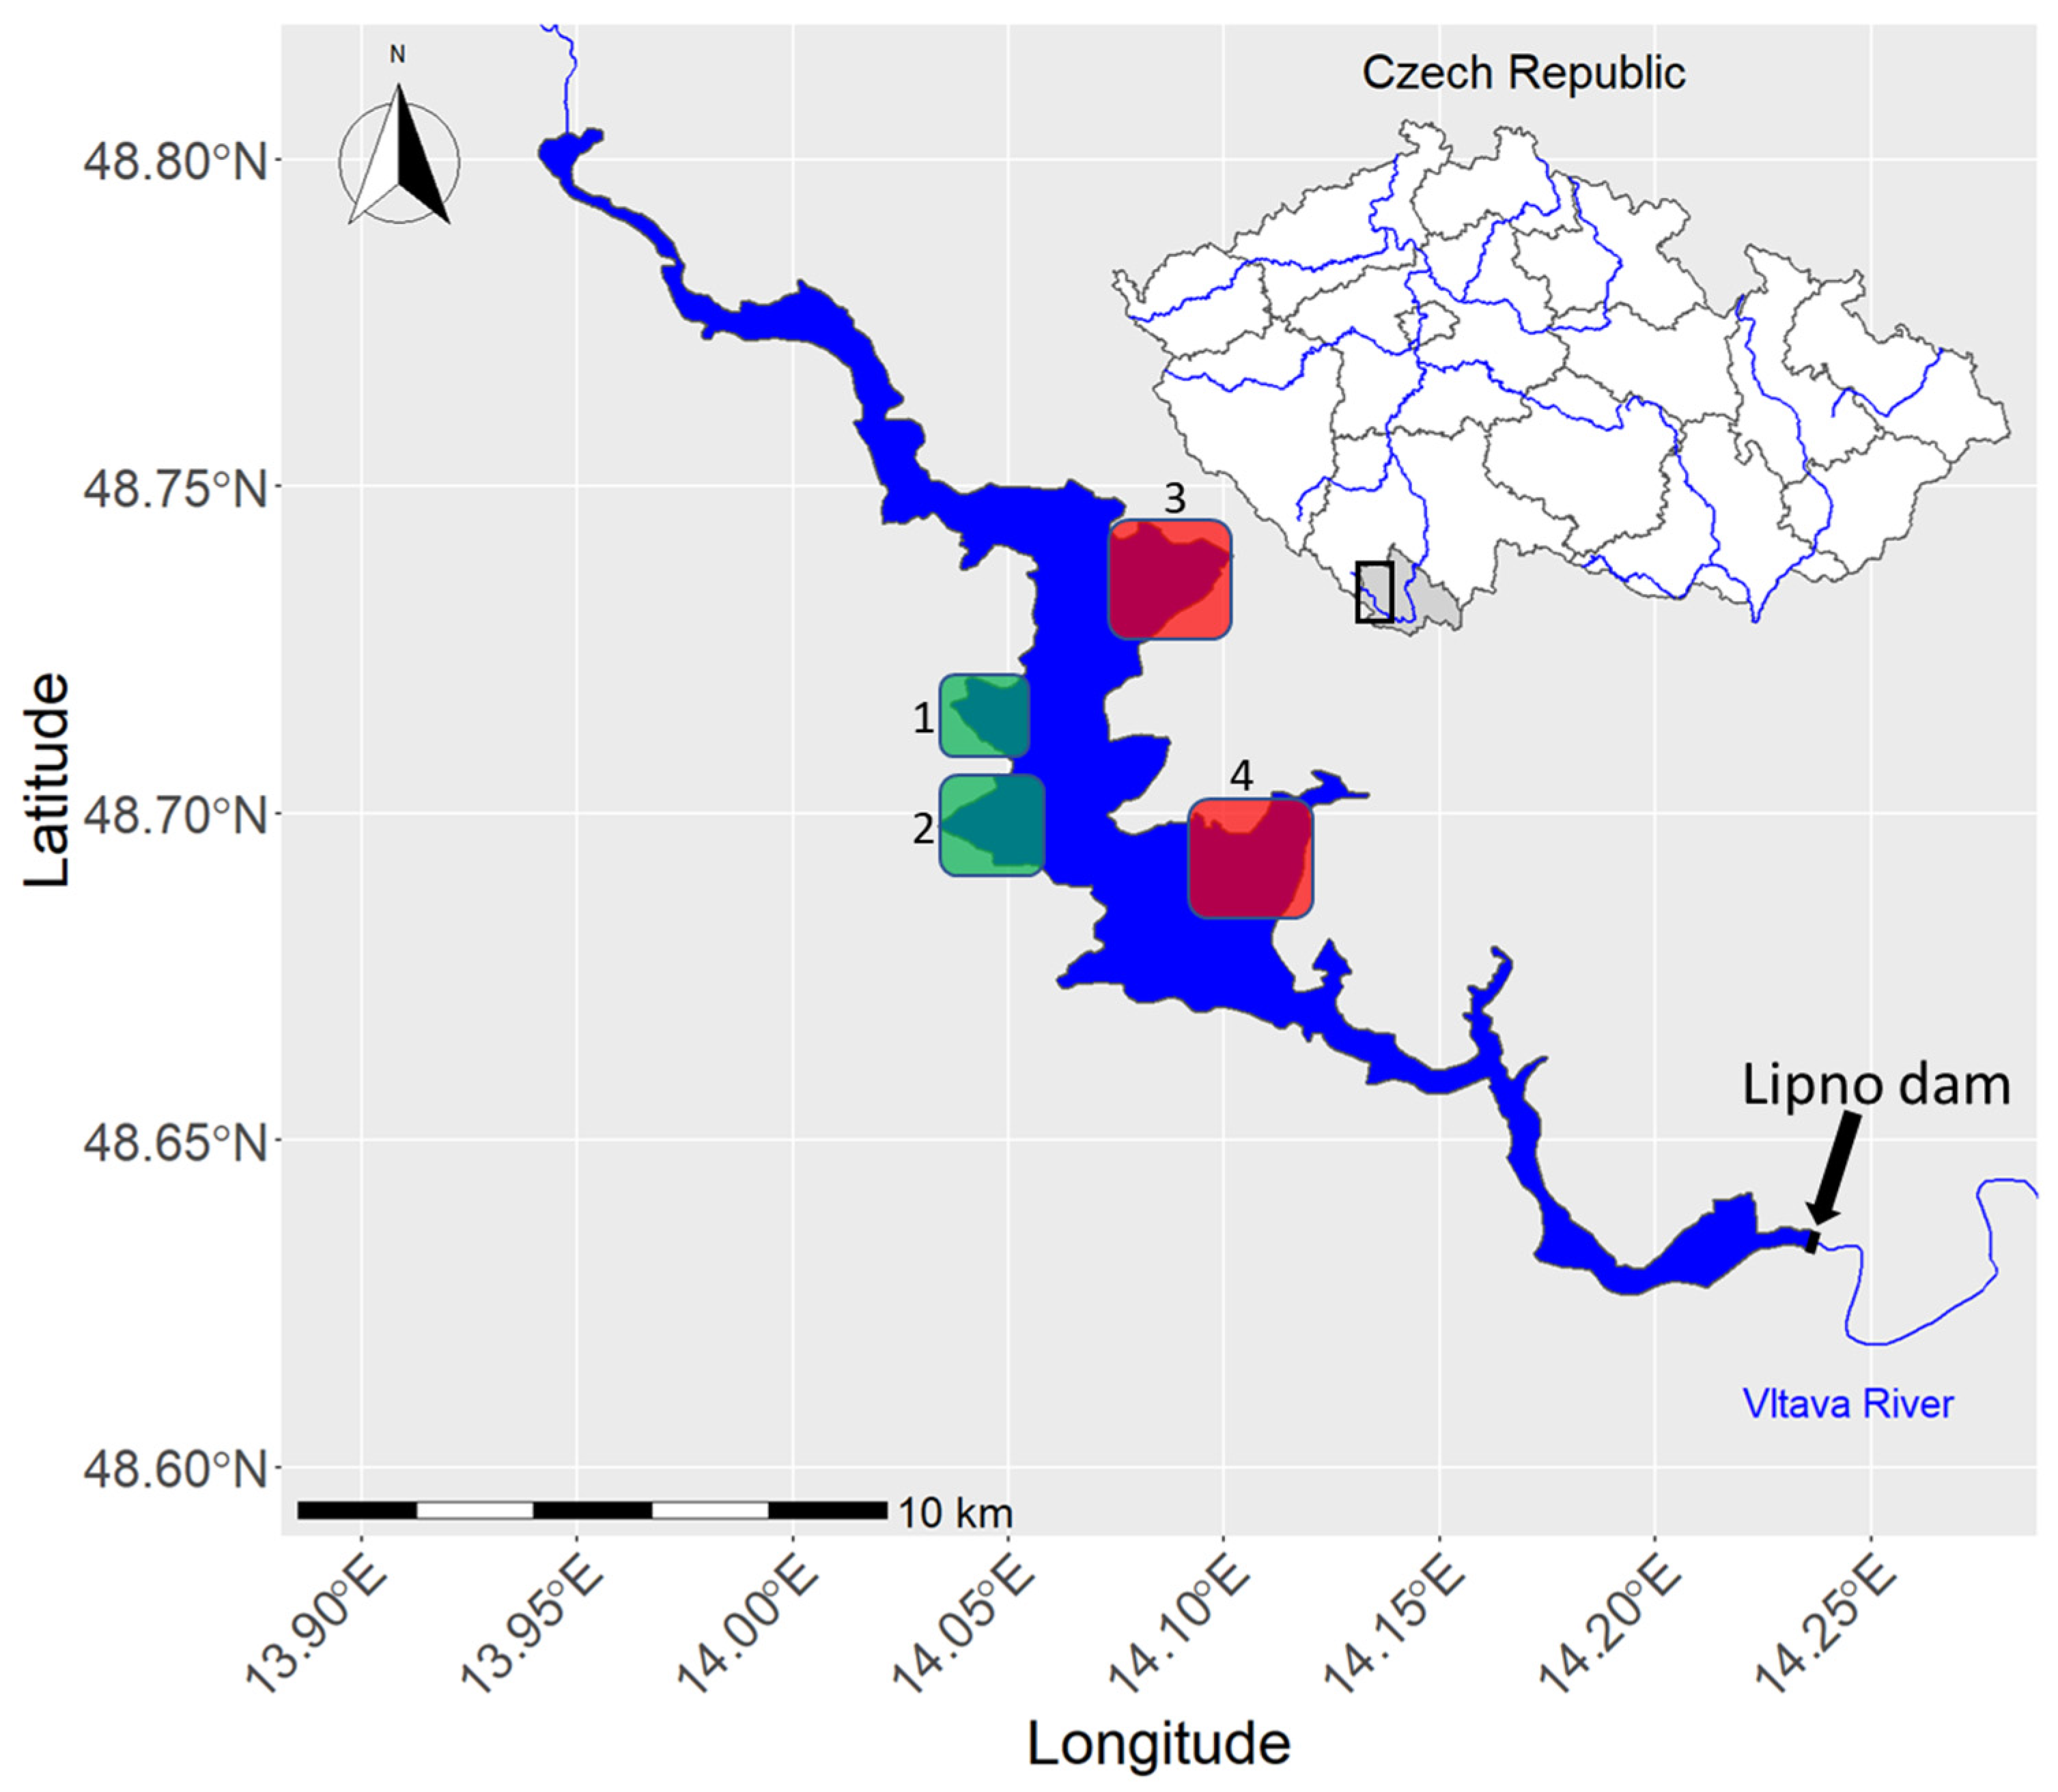
Figure 1.
Outline map of Lipno reservoir, with its location in the Czech Republic (black rectangle) and the detailed location of the low anthropogenic impact areas (Green squares, 1. Racinska zatoka; and 2. Kyselovska zatoka) and the control high anthropogenic impact sites (Red squares, 3. Hurka; and 4. Dolni Vltavice).
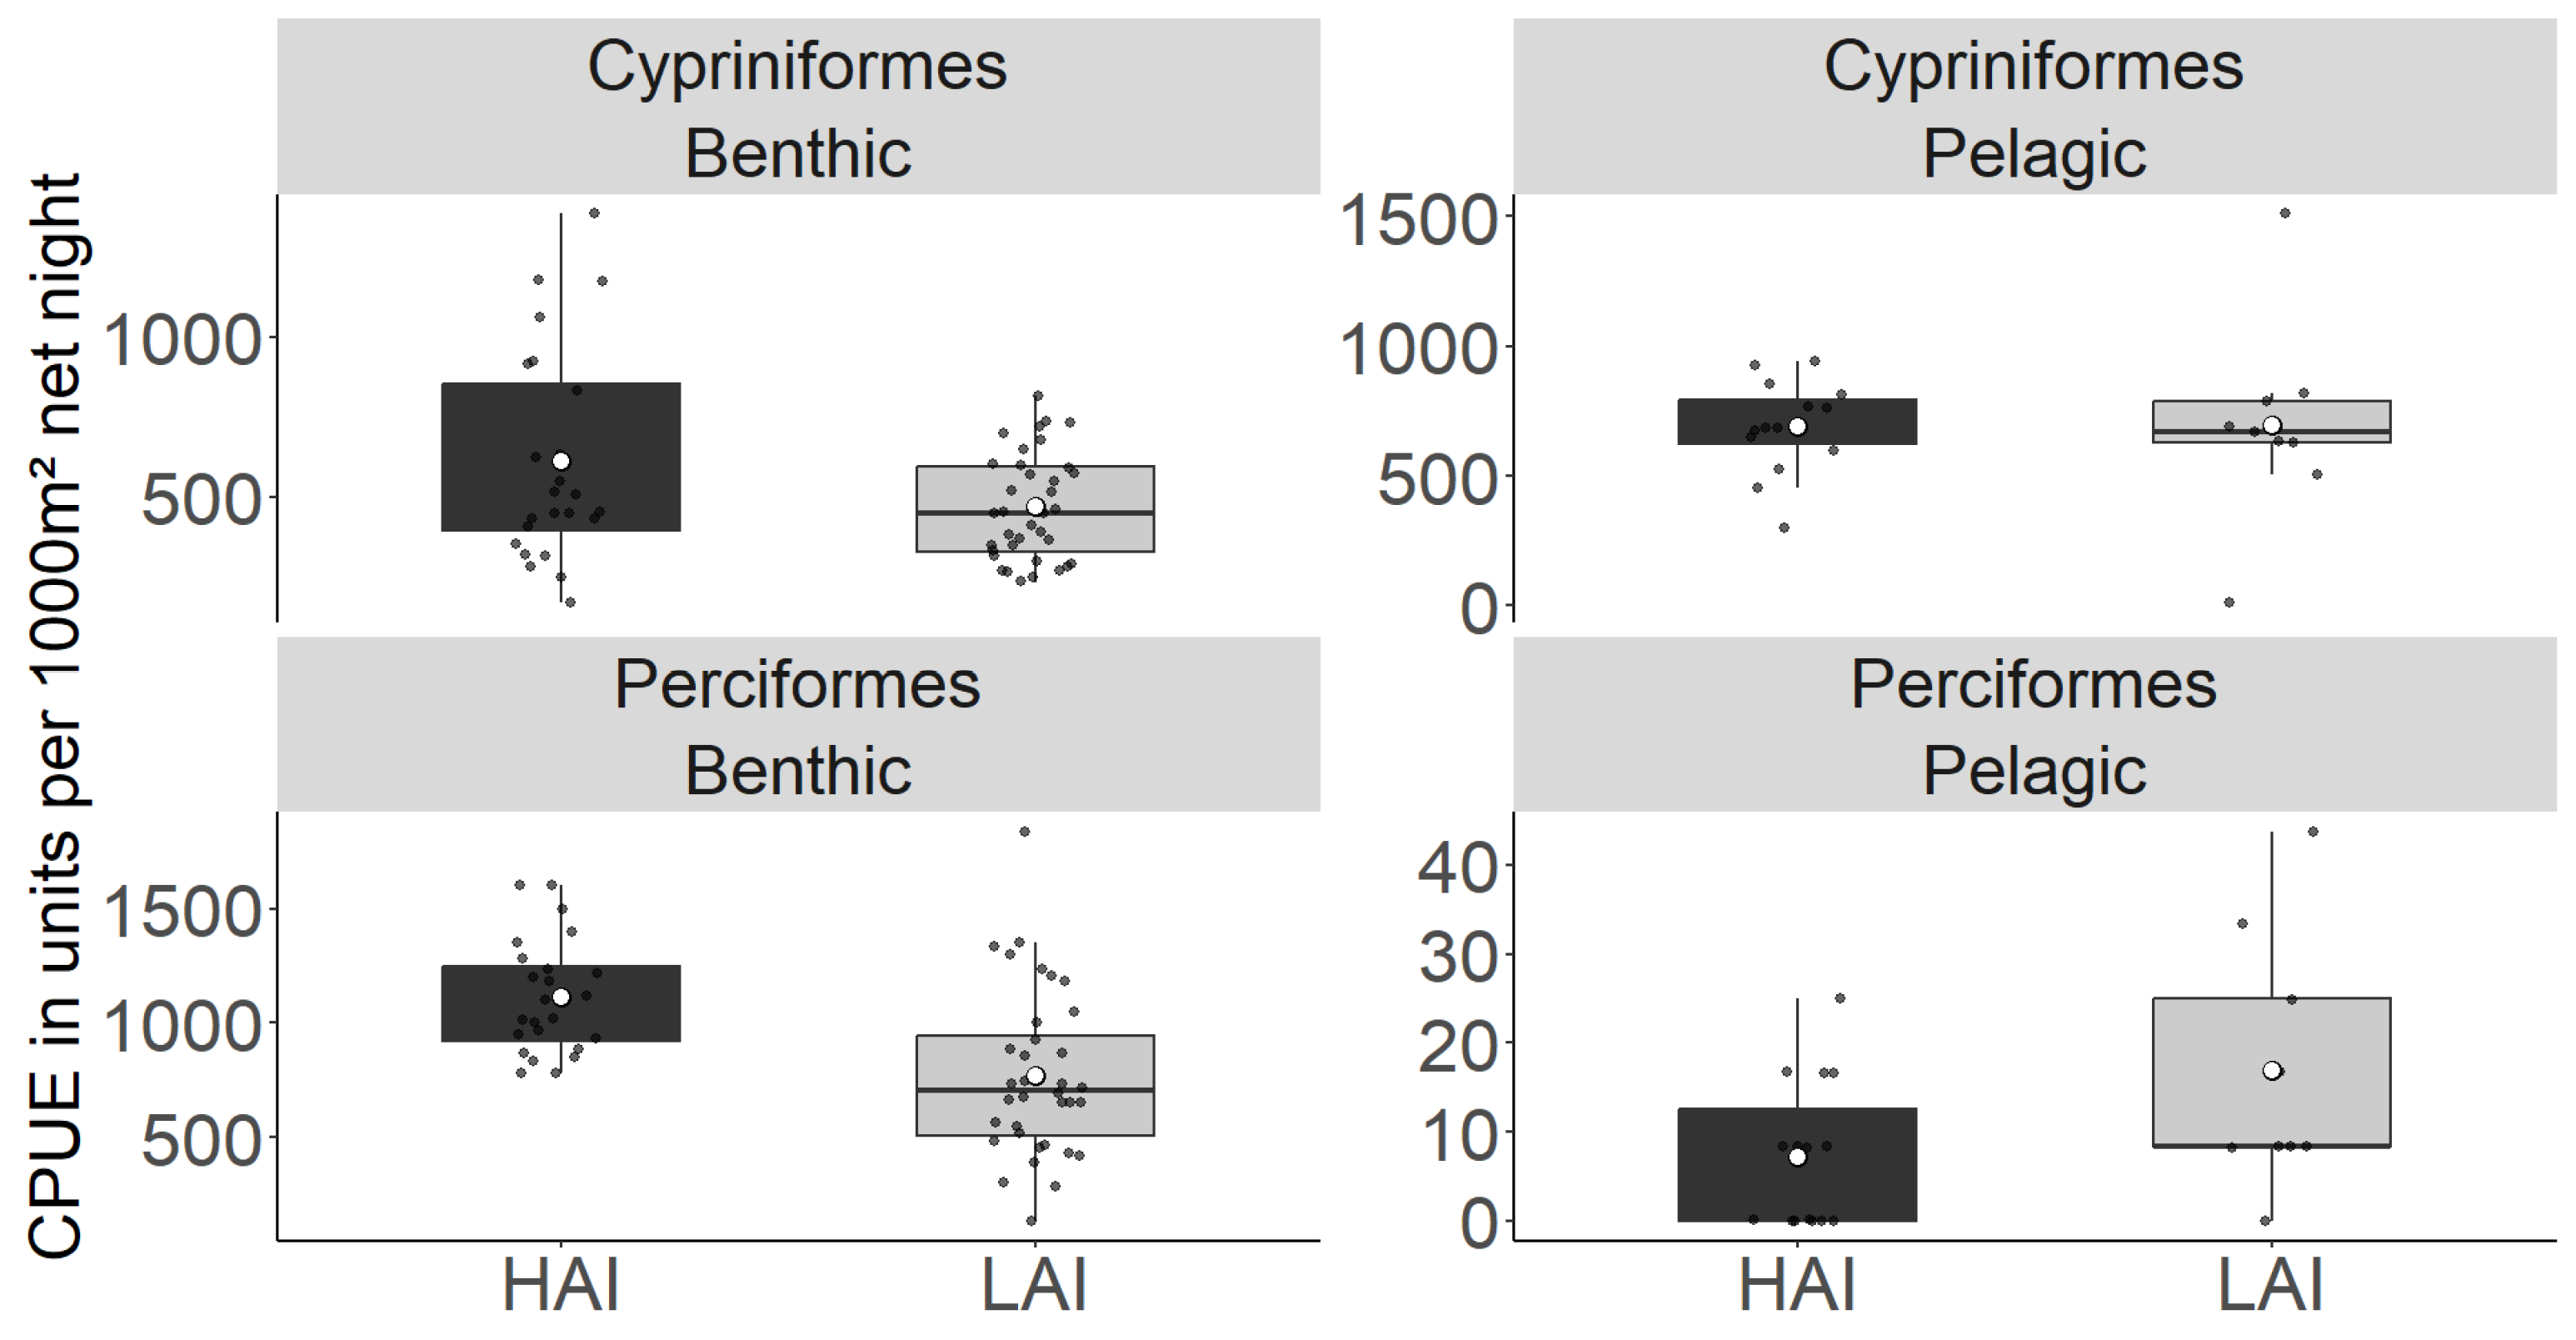
Figure 2.
A Total catch-per-unit effort (CPUE; individuals per point) of fish older than young-of-the-year from gillnetting at high-impact sites (HAI) and low-impact (LAI) areas of the Lipno reservoir. The boxplot represents the quartile value of CPUE, the black dots represent the means of individual nets, the thick middle line represents the median, the white dot represents the overall mean of all measurements, and the whiskers represent the lowest and highest actual value of the quartile.
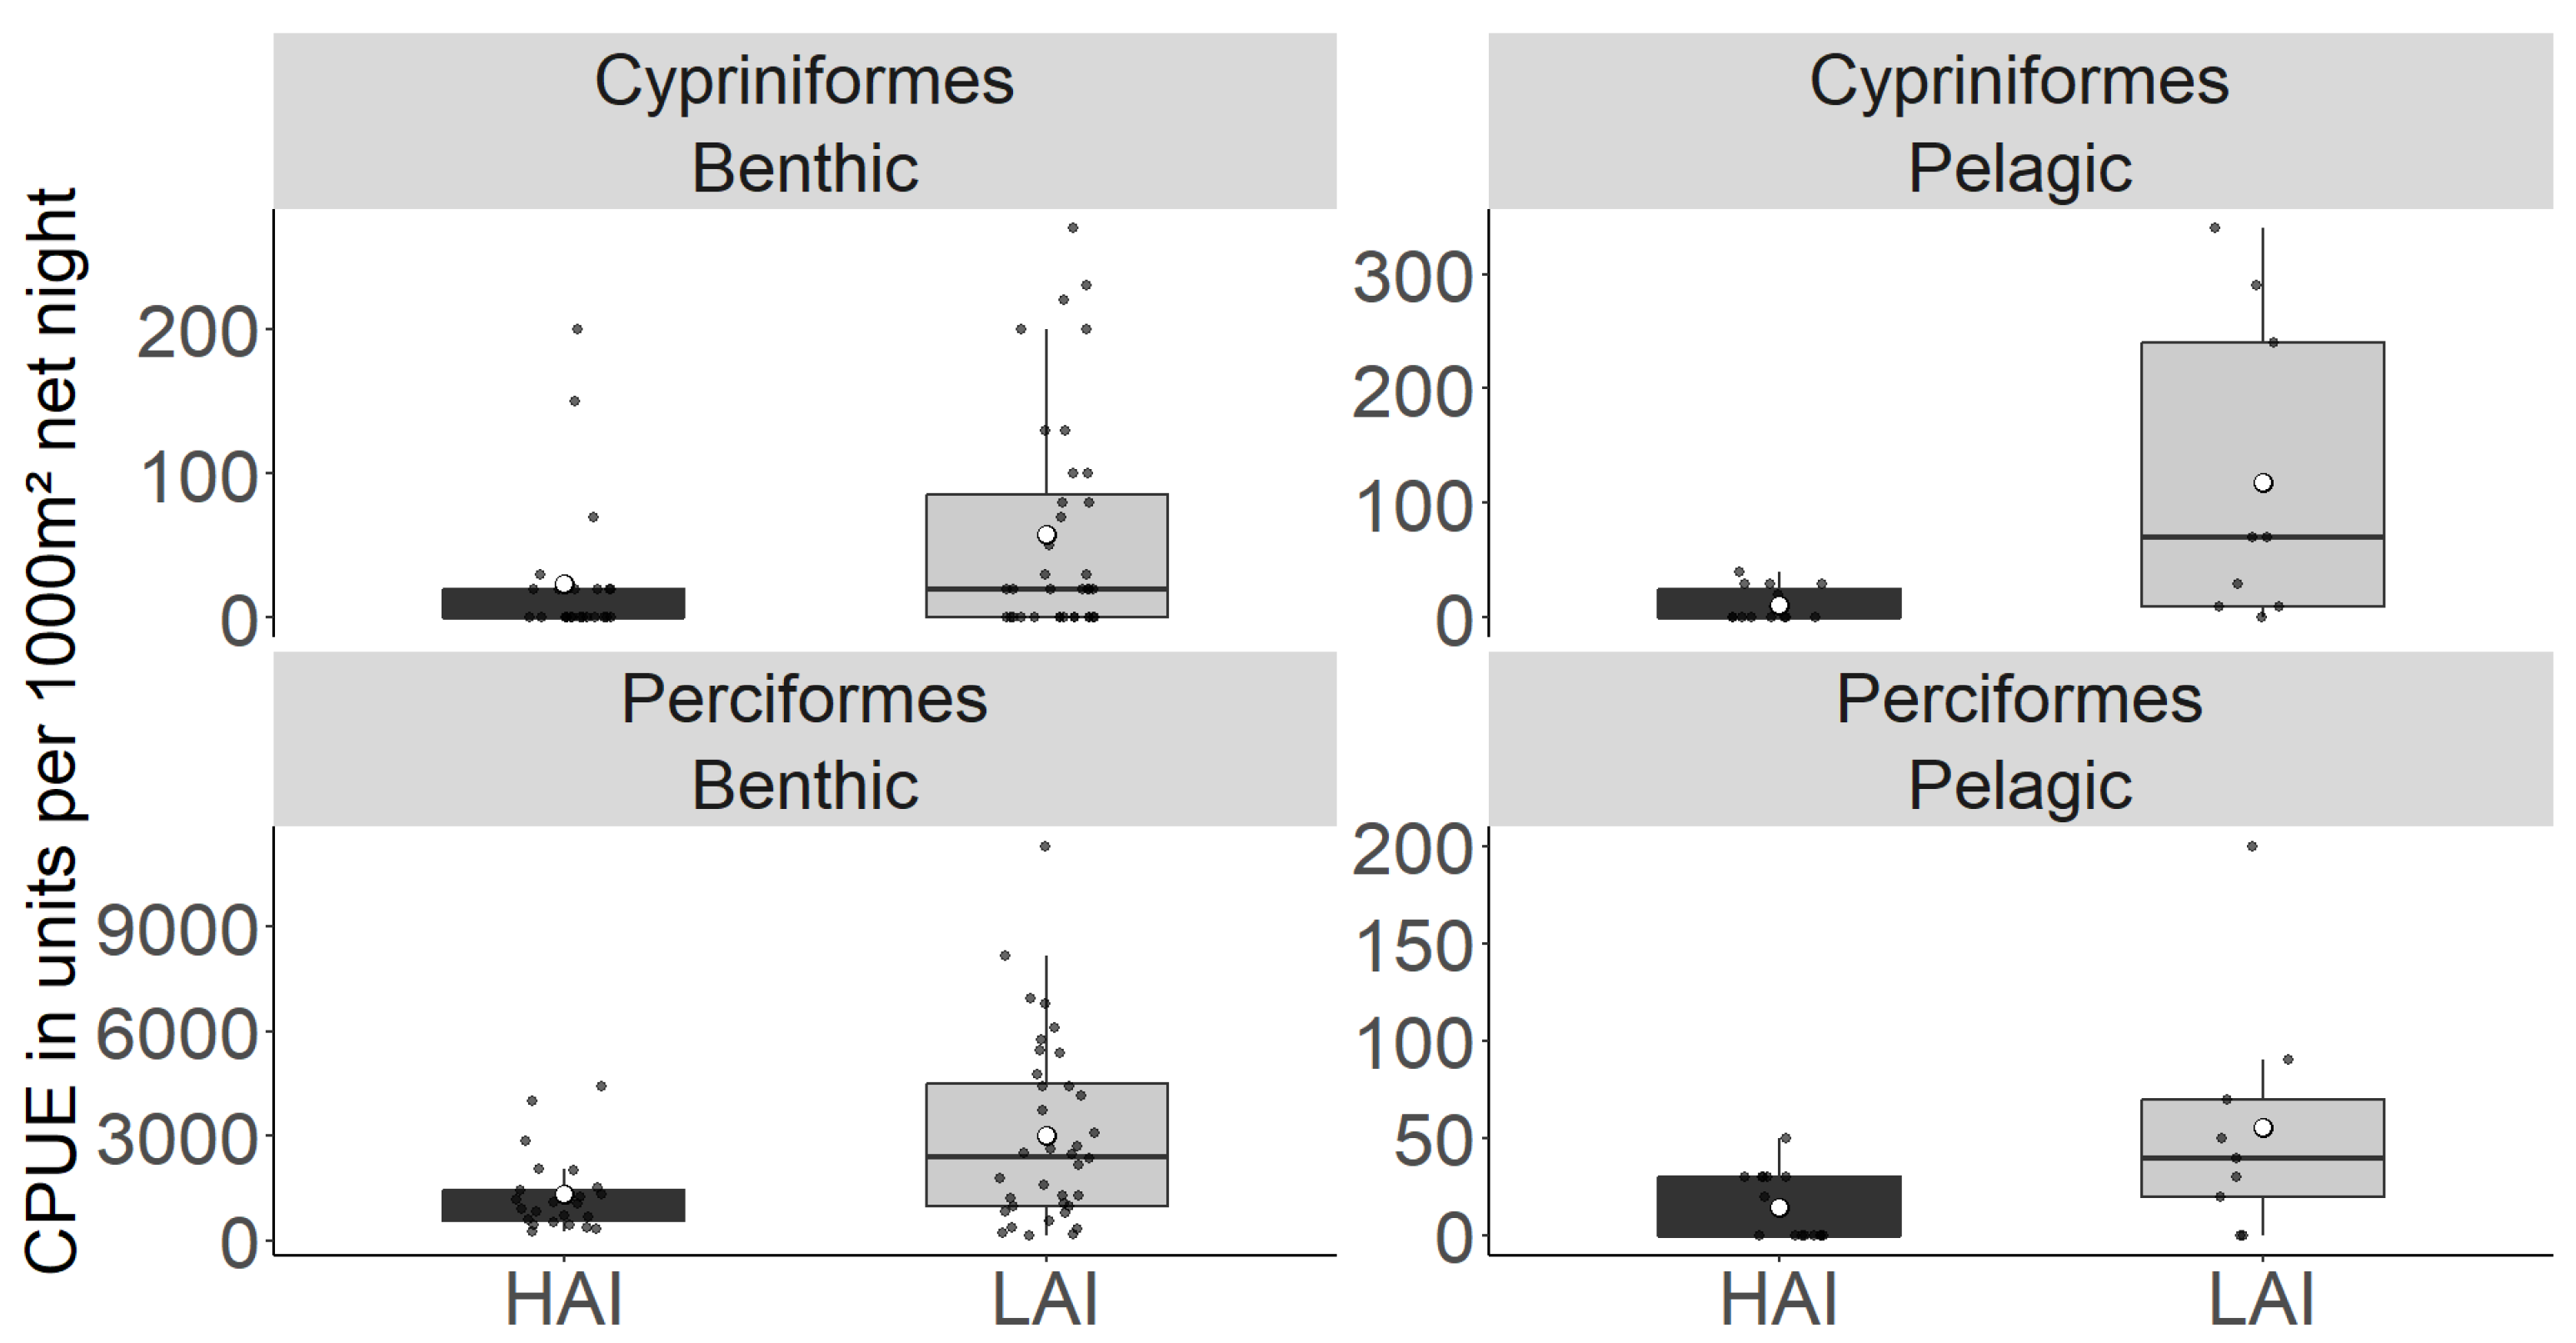
Figure 3.
A Total catch-per-unit effort (CPUE; individuals per point) of young-of-the-year fish from gillnetting at high-impact (HAI) sites and low-impact (LAI) areas of the Lipno reservoir. The boxplot represents the quartile value of CPUE, the black dots represent the means of individual nets, the thick middle line represents the median, the white dot represents the overall mean of all measurements, and the whiskers represent the lowest and highest actual value of the quartile.
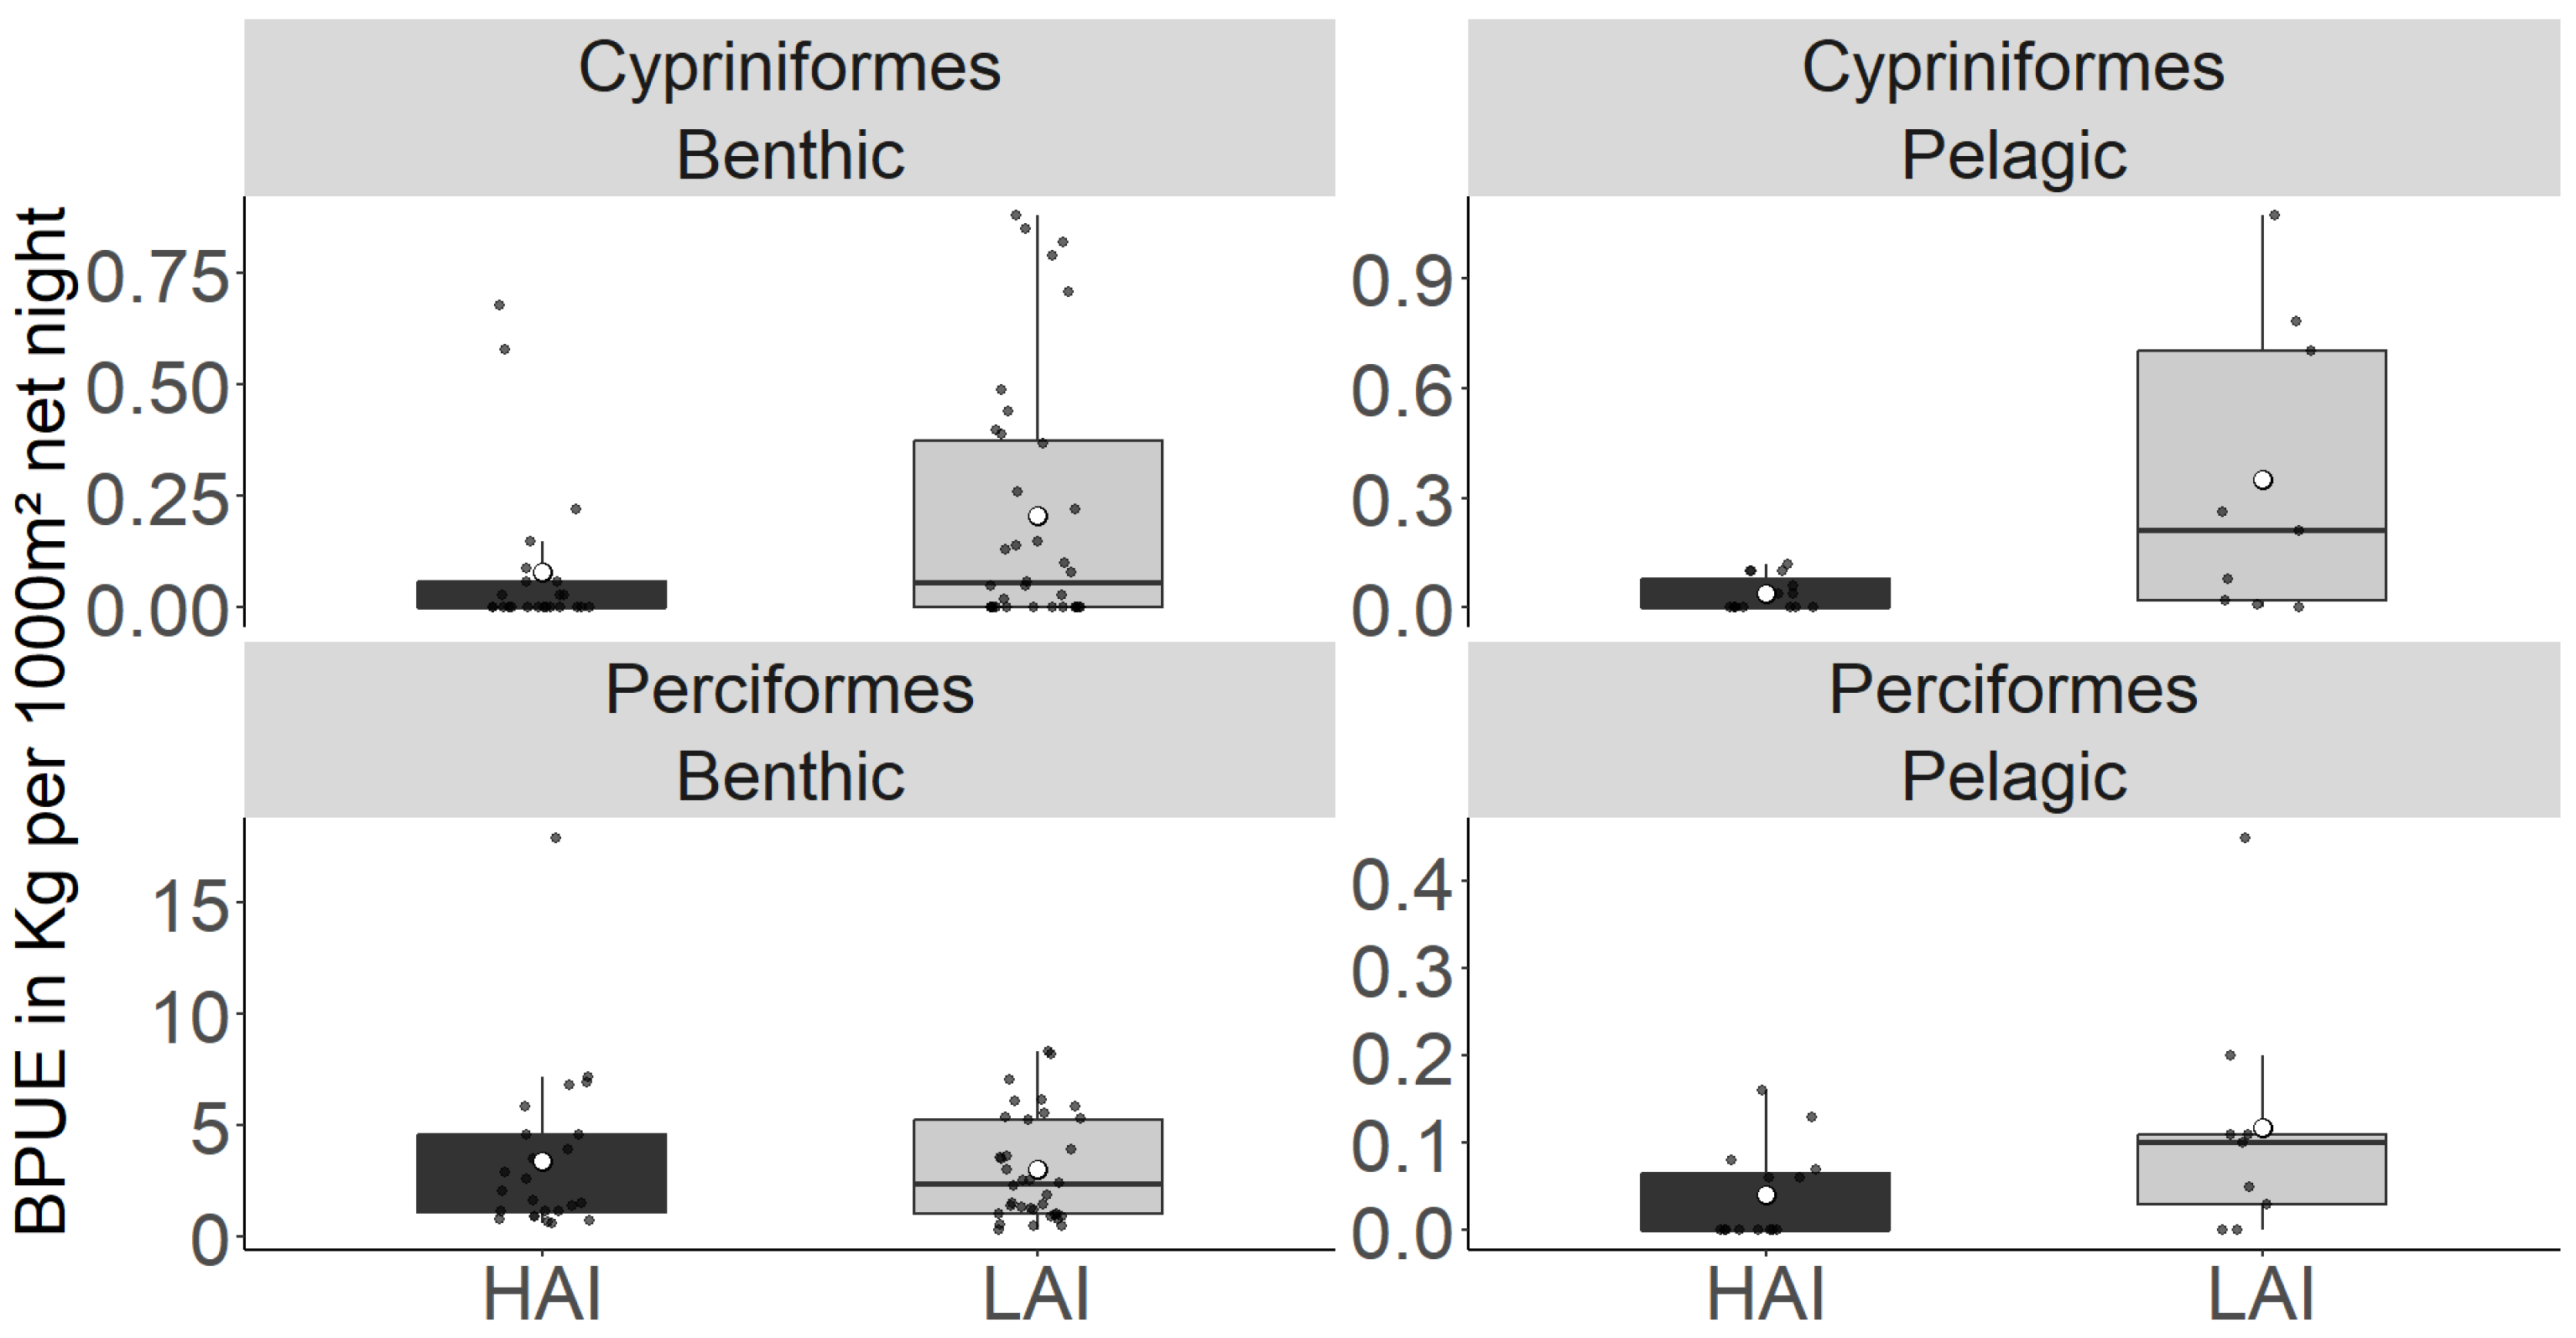
Figure 4.
A Total biomass-per-unit effort (BPUE; kg per point) of fish older than YOY from gillnetting at high-impact (HAI) sites and low-impact (LAI) areas of the Lipno reservoir. The boxplot represents the quartile value of BPUE, the black dots represent the means of individual nets, the thick middle line represents the median, the white dot represents the overall mean of all measurements, and the whiskers represent the lowest and highest actual value of the quartile.
Figure 5.
A Total biomass-per-unit effort (BPUE; kg per point) of YOY fish from gillnetting at high-impact (HAI) sites and low-impact (LAI) areas of the Lipno reservoir. The boxplot represents the quartile value of BPUE, the black dots represent the means of individual nets, the thick middle line represents the median, the white dot represents the overall mean of all measurements, and the whiskers represent the lowest and highest actual value of the quartile.
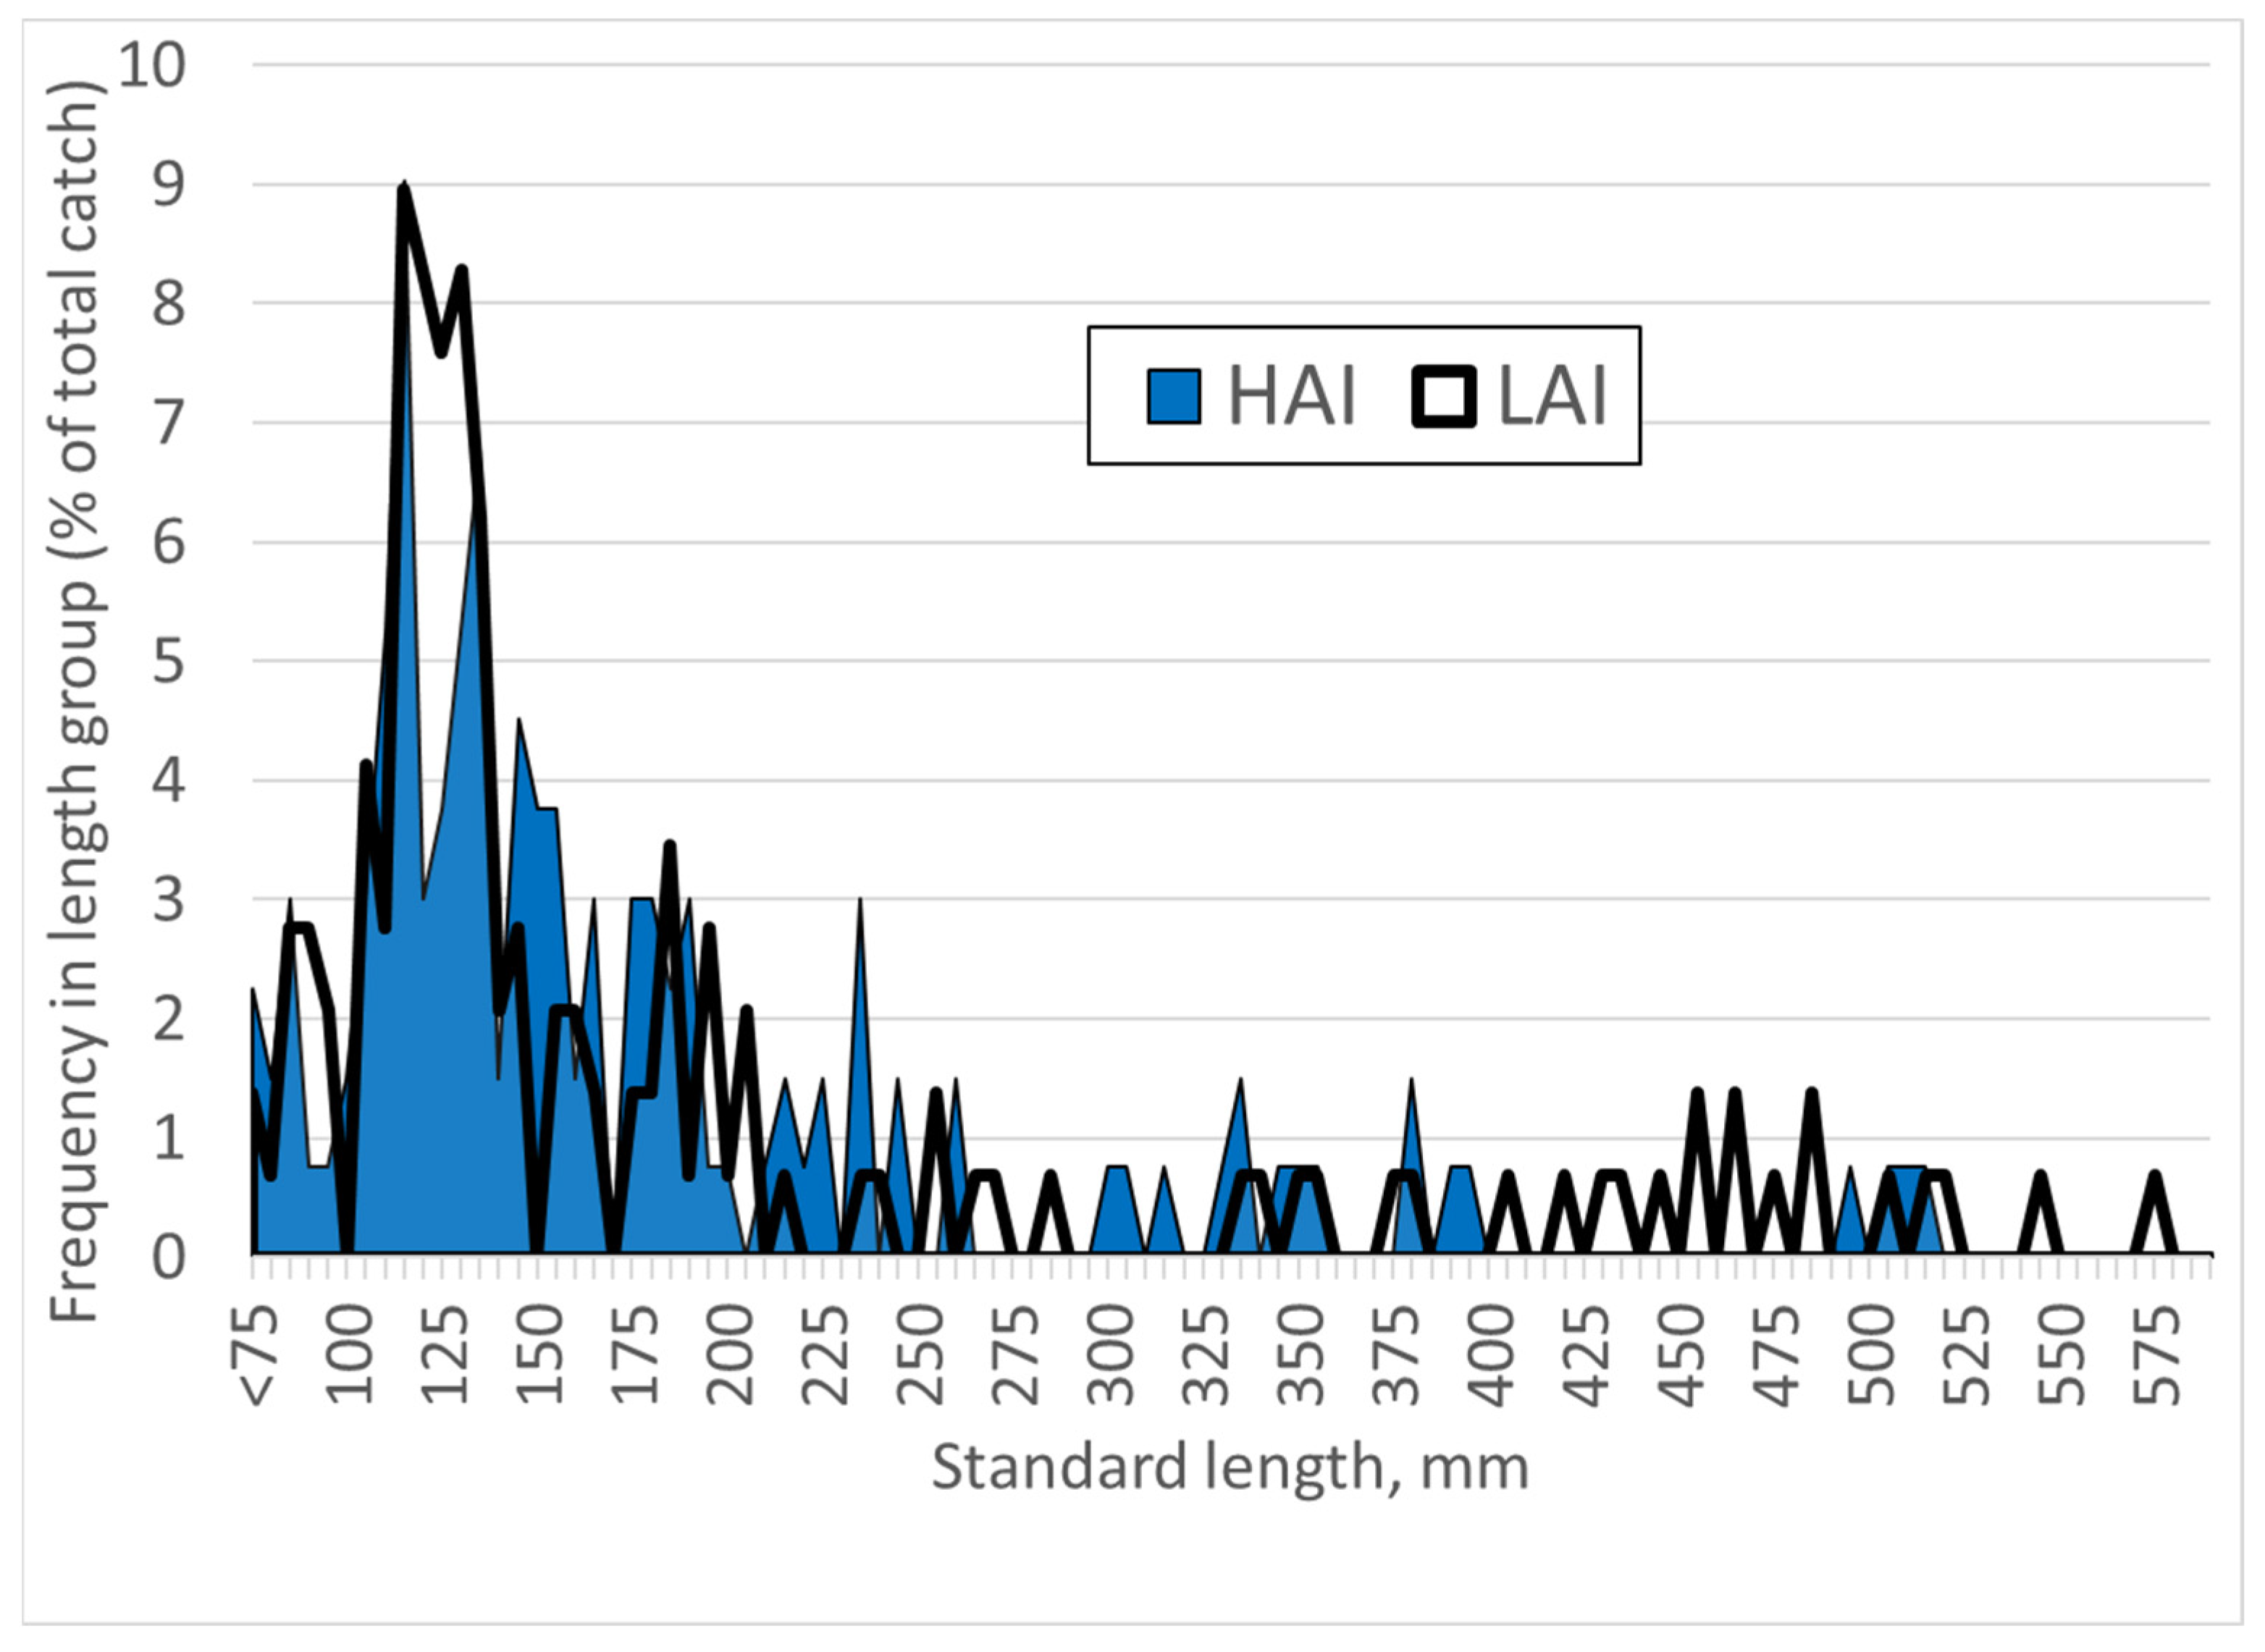
Figure 6.
Length frequency distribution of pikeperch at high impact (HAI) and low impact (LAI) areas of the Lipno reservoir.
Figure 6.
Length frequency distribution of pikeperch at high impact (HAI) and low impact (LAI) areas of the Lipno reservoir.
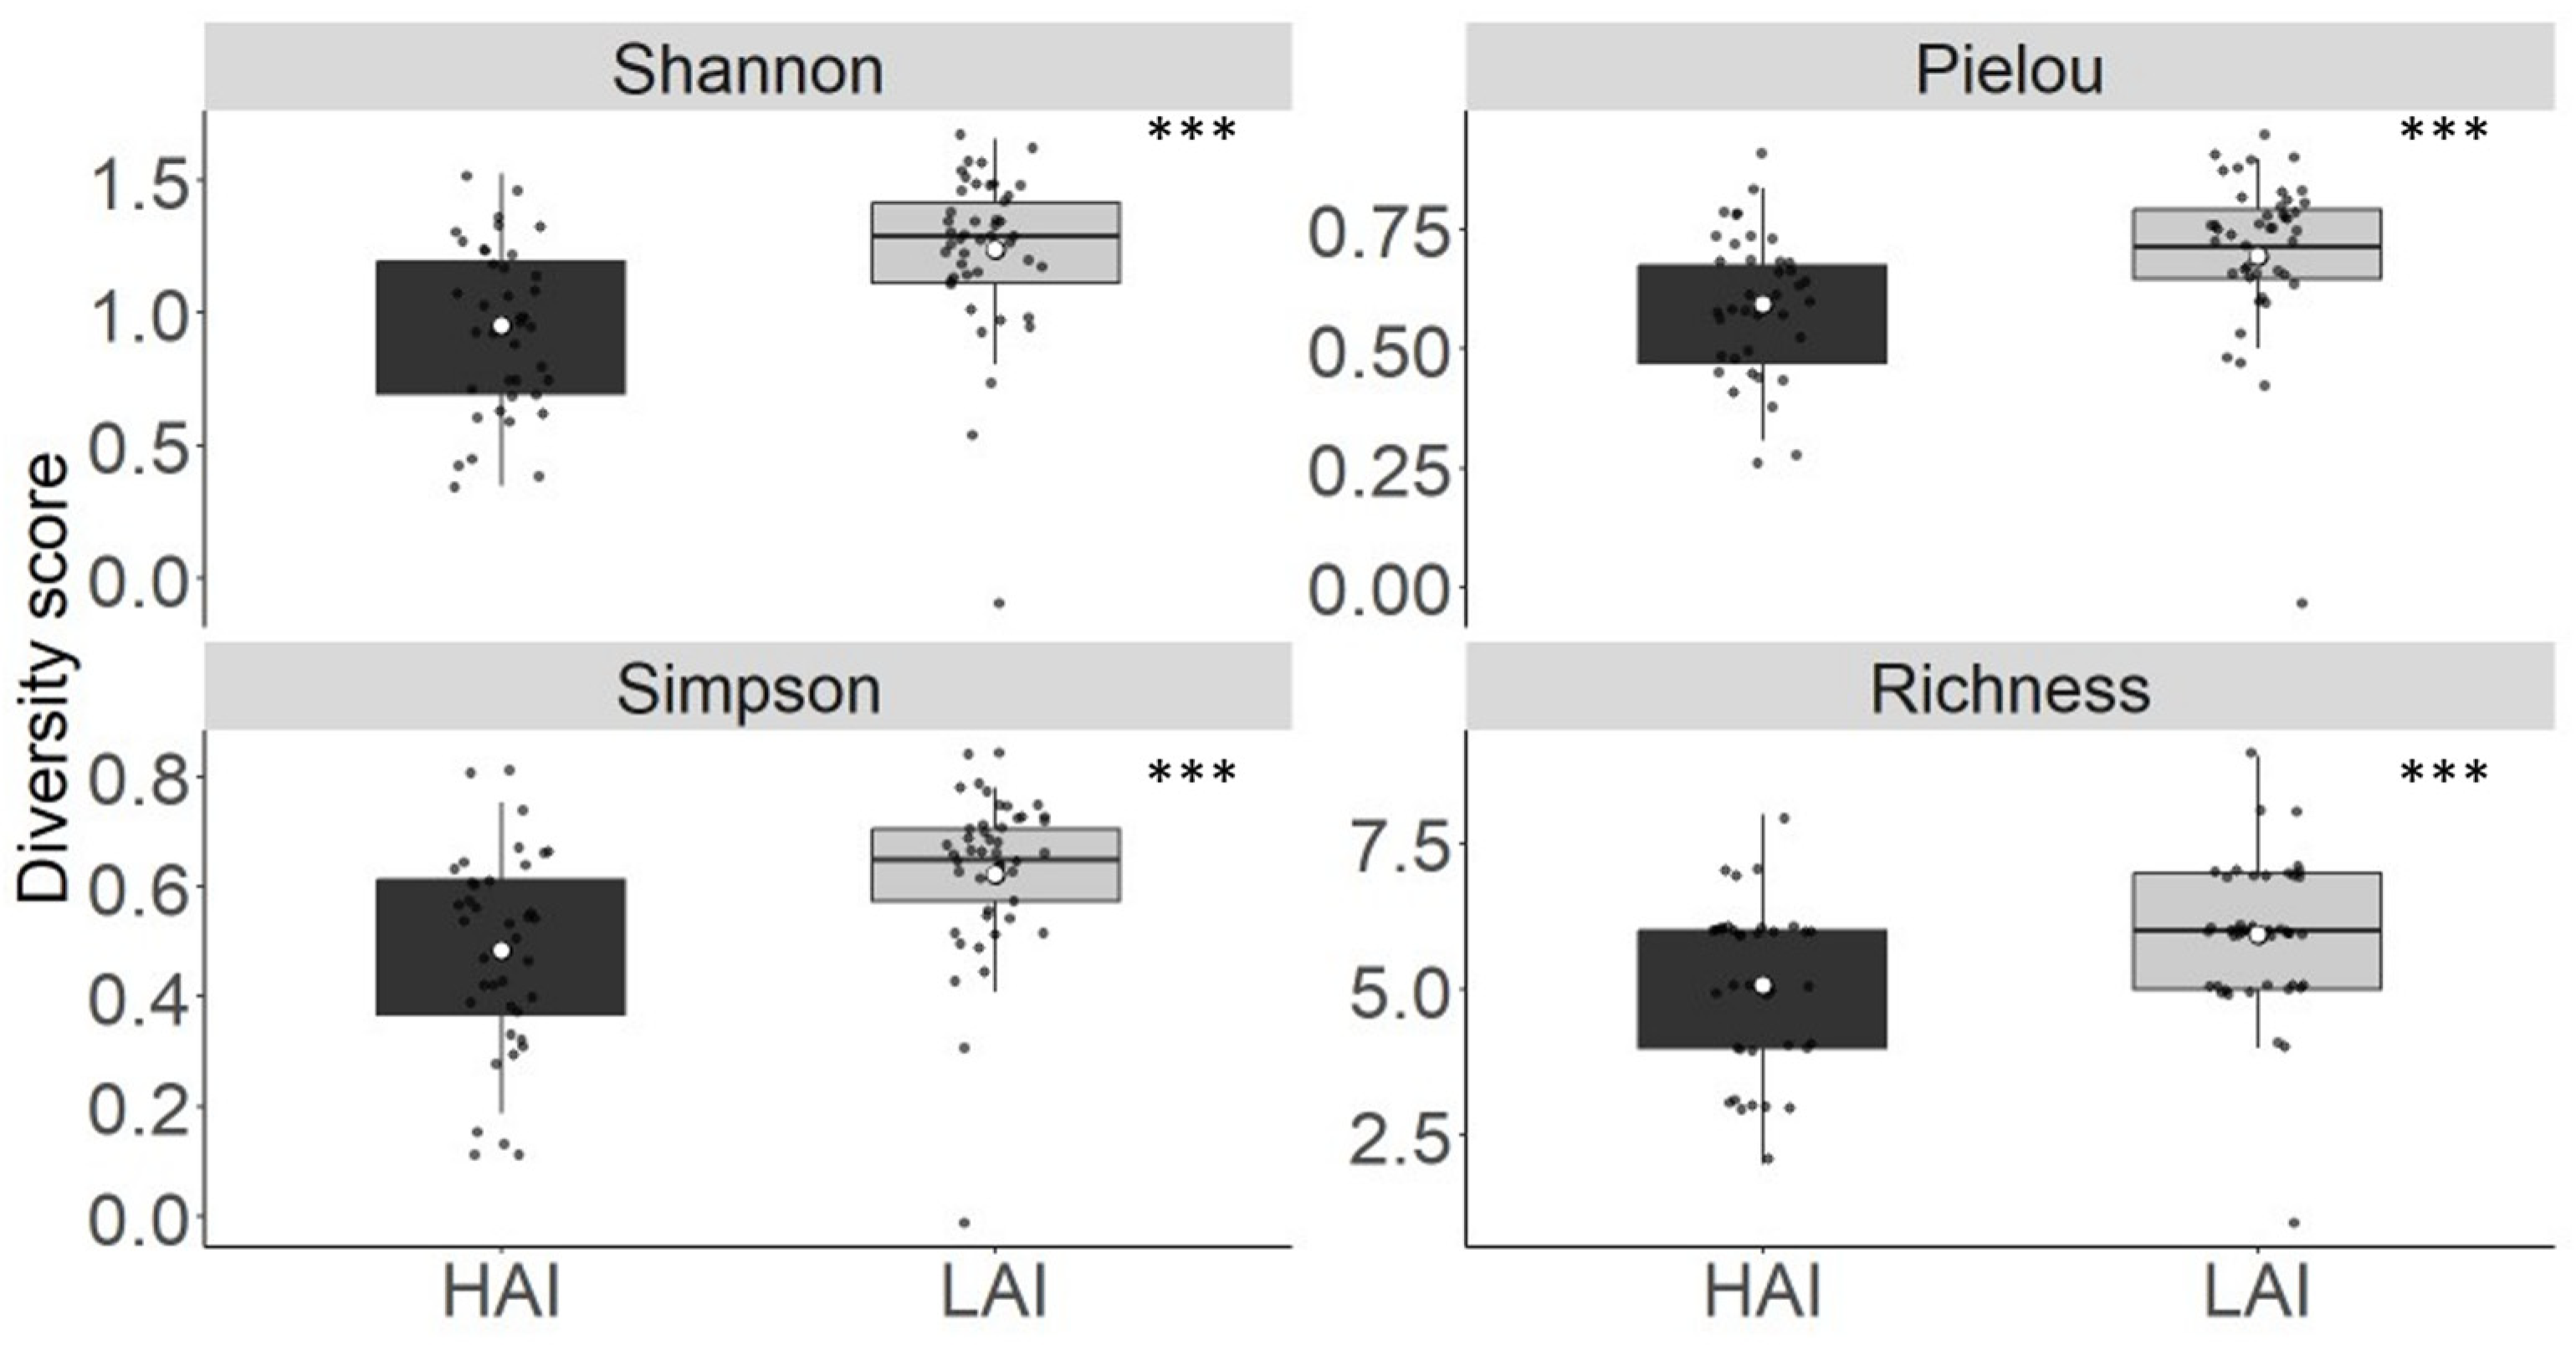
Figure 7.
Diversity score of the fish older than YOY in the Lipno experiment from Shannon, Pielou’s, Simpson and Richness indices. The boxplot represents the quartile value of the diversity score, the black dots represent the means of individual nets, the thick middle line represents the median, the white dot represents the overall mean of all measurements, and the whiskers represent the lowest and highest actual value of the quartile. *** = p < 0.001,.
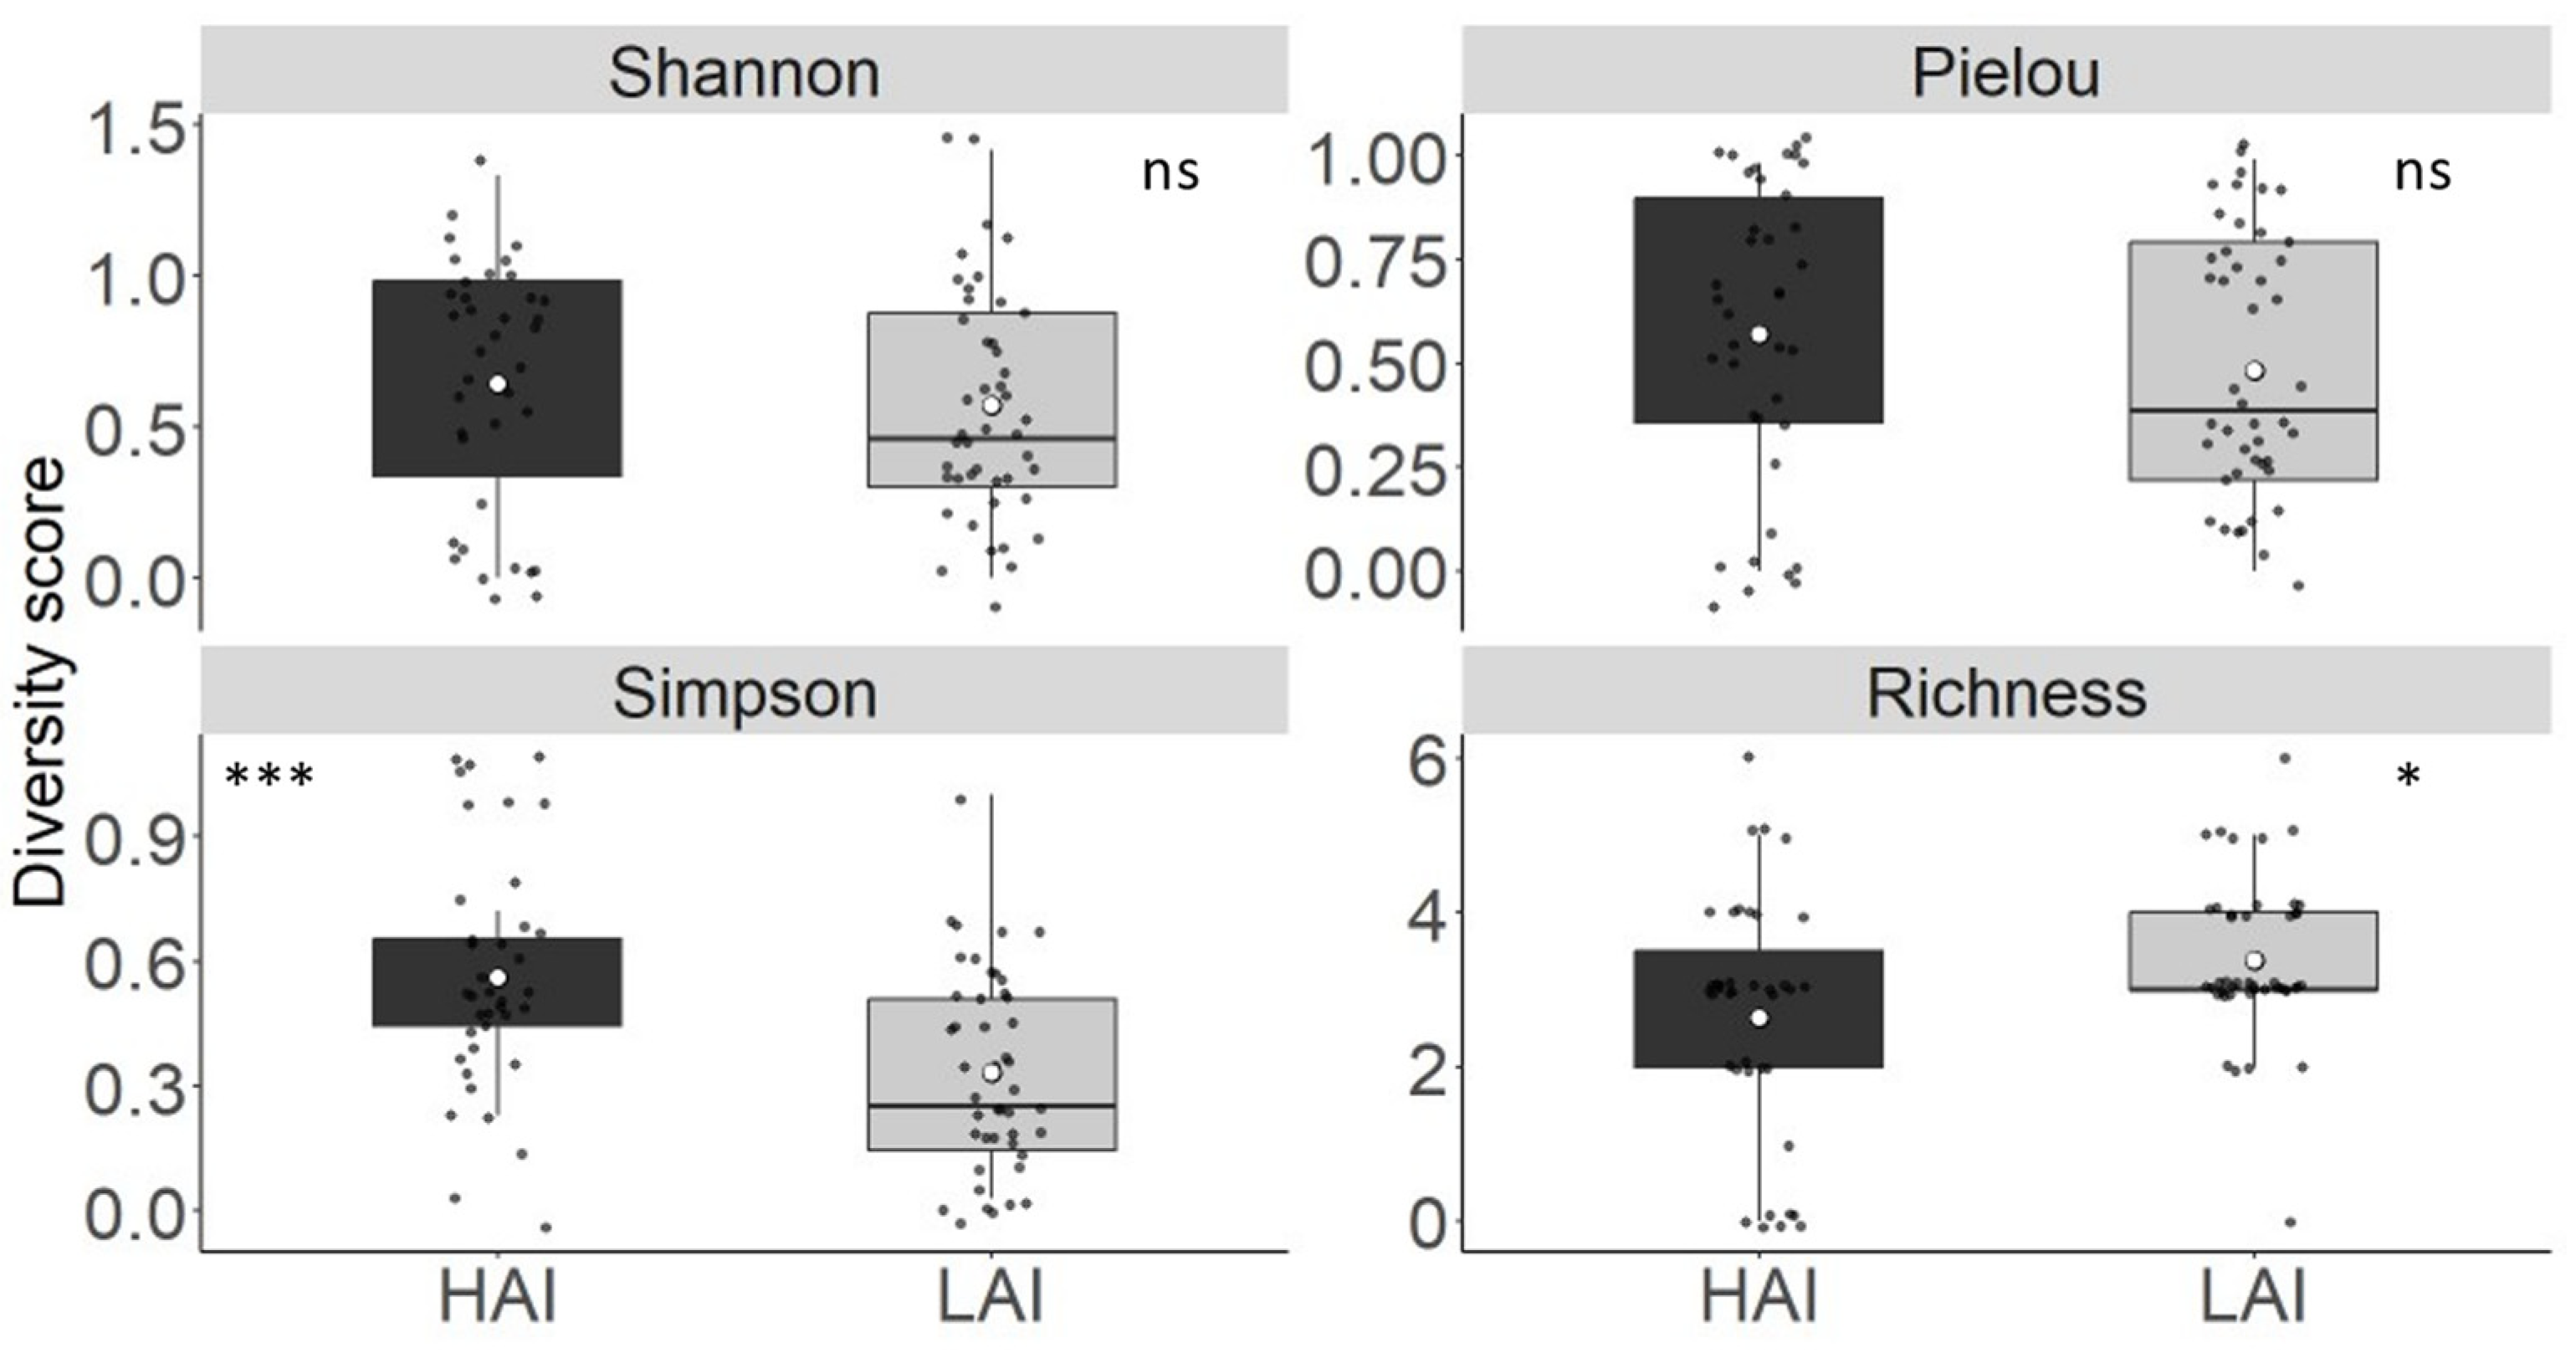
Figure 8.
Diversity score of the YOY fish in the Lipno experiment from Shannon, Pielou’s, Simpson and Richness indices. The boxplot represents the quartile value of the diversity score, the black dots represent the mean of the individual net, the thick middle line represents the median, the white dot represents the overall mean of all measurements, and the whiskers represent the lowest and highest actual value of the quartile. *** = p < 0.001, * = p < 0.05 and ns = p ≥ 0.05.
Table 1.
Species of fish older than young-of-the-year from gillnetting at high-impact sites (HAI) and low-impact (LAI) areas of the Lipno reservoir captured in the study, with their individual catch and proportion of the total catch.
Table 1.
Species of fish older than young-of-the-year from gillnetting at high-impact sites (HAI) and low-impact (LAI) areas of the Lipno reservoir captured in the study, with their individual catch and proportion of the total catch.
| | HAI | LAI |
|---|
| | Individuals | Proportion | Individuals | Proportion |
|---|
| Abramis brama | 128 | 3.41 | 60 | 1.72 |
| Alburnus alburnus | 1029 | 27.39 | 568 | 16.29 |
| Blicca bjoerkna | 274 | 7.29 | 317 | 9.09 |
| Cyprinus carpio | 21 | 0.56 | 33 | 0.95 |
| Esox lucius | 0 | 0.00 | 5 | 0.14 |
| Gymnocephalus cernua | 1436 | 38.22 | 1187 | 34.05 |
| Leuciscus aspius | 9 | 0.24 | 7 | 0.20 |
| Perca fluviatilis | 124 | 3.30 | 441 | 12.65 |
| Rutilus rutilus | 683 | 18.18 | 795 | 22.81 |
| Sander lucioperca | 53 | 1.41 | 56 | 1.61 |
| Scardinius erythrophthalmus | 0 | 0.00 | 13 | 0.37 |
| Silurus glanis | 0 | 0.00 | 4 | 0.11 |
| Total | 3757 | 100.00 | 3486 | 100.00 |
Table 2.
Species of fish young-of-the-year from gillnetting at high-impact sites (HAI) and low-impact (LAI) areas of the Lipno reservoir captured in the study with their individual catch and proportion of the total catch.
Table 2.
Species of fish young-of-the-year from gillnetting at high-impact sites (HAI) and low-impact (LAI) areas of the Lipno reservoir captured in the study with their individual catch and proportion of the total catch.
| | HAI | LAI |
|---|
| | Individuals | Proportion | Individuals | Proportion |
|---|
| Abramis brama | 10 | 0.51 | 20 | 0.29 |
| Alburnus alburnus | 1 | 0.05 | 54 | 0.79 |
| Blicca bjoerkna | 10 | 0.51 | 20 | 0.29 |
| Gymnocephalus cernua | 523 | 26.45 | 311 | 4.54 |
| Perca fluviatilis | 1256 | 63.53 | 6171 | 90.04 |
| Rutilus rutilus | 29 | 1.47 | 155 | 2.26 |
| Sander lucioperca | 148 | 7.49 | 123 | 1.79 |
| Total | 1977 | 100.00 | 6854 | 100.00 |
Table 3.
Mean and standard error (SE) of the fish older than young-of-the-year CPUE (catch per unit of effort) of gillnets from Lipno reservoir, in individual units per 1000 m2 of nets. *** = p < 0.001, ** = p < 0.01, * = p < 0.05 and ns = p ≥ 0.05. Families and total catch are given in bold.
Table 3.
Mean and standard error (SE) of the fish older than young-of-the-year CPUE (catch per unit of effort) of gillnets from Lipno reservoir, in individual units per 1000 m2 of nets. *** = p < 0.001, ** = p < 0.01, * = p < 0.05 and ns = p ≥ 0.05. Families and total catch are given in bold.
| | Benthic | Pelagic | | |
|---|
| Species | HAI | LAI | HAI | LAI | p_Treatment | p_Habitat |
|---|
| Abramis brama |
54.7 ± 16.4
|
21.2 ± 3.3
|
23.6 ± 8.1
|
11.1 ± 8.1
| * | ns |
| Alburnus alburnus |
37.5 ± 19.8
|
37.5 ± 13.0
|
541.7 ± 38.4
|
450.9 ± 86.1
| ns | *** |
| Blicca bjoerkna |
159.9 ± 33.1
|
106.1 ± 10.0
|
23.9 ± 6.8
|
80.6 ± 16.8
| ns | *** |
| Cyprinus carpio |
2.4 ± 0.7
|
2.8 ± 0.7
|
0.97 ± 0.5
|
2.1 ± 0.7
| *** | * |
| Leuciscus aspius |
0.35 ± 0.2
|
0.23 ± 0.16
|
2.2 ± 1.8
|
1.2 ± 0.5
| ns | ns |
| Rutilus rutilus |
354.9 ± 41.1
|
298.2 ± 25.0
|
95.6 ± 10.5
|
139.8 ± 33.2
| ns | *** |
| Scardinius erythrophthalmus |
0
|
1.4 ± 0.78
|
0
|
9.3 ± 2.9
| ns | *** |
| Cypriniformes | 609.7 ± 68.2 | 467.4 ± 27.7 | 687.9 ± 44.5 | 694.9 ± 129.2 | ns | * |
| Esox lucius |
0
|
1.39 ± 0.78
|
0
|
1.85 ± 1.22
| ns | ns |
| Esociformes | 0 | 1.39 ± 0.78 | 0 | 1.85 ± 1.22 | ns | ns |
| Gymnocephalus cernua |
997.2 ± 57.1
|
549.1 ± 56.0
|
0
|
0.93 ± 0.93
| ** | *** |
| Perca fluviatilis |
83.3 ± 19.6
|
198.7 ± 23.3
|
2.2 ± 1.3
|
11.1 ± 4.2
| *** | *** |
| Sander lucioperca |
30.6 ± 6.2
|
22.1 ± 4.2
|
5 ± 1.8
|
4.9 ± 2.8
| *** | *** |
| Perciformes | 1111.1 ± 50.7 | 769.9 ± 60.3 | 7.2 ± 2.1 | 16.9 ± 4.8 | ns | *** |
| Silurus glanis |
0
|
0.58 ± 0.47
|
0
|
0.46 ± 0.46
| ns | ns |
| Siluriformes | 0 | 0.58 ± 0.47 | 0 | 0.46 ± 0.46 | ns | ns |
| Total catch |
1720.8 ± 77.3
|
1239.2 ± 67.8
|
695.1 ± 45.3
|
714.1 ± 129.6
| ** | *** |
Table 4.
Mean and standard error (SE) of the young of the year class fish CPUE (catch per unit of effort) of gillnets from Lipno reservoir, in individual units per 1000 m2 of nets. *** = p < 0.001, * = p < 0.05 and ns = p ≥ 0.05.
Table 4.
Mean and standard error (SE) of the young of the year class fish CPUE (catch per unit of effort) of gillnets from Lipno reservoir, in individual units per 1000 m2 of nets. *** = p < 0.001, * = p < 0.05 and ns = p ≥ 0.05.
| | Benthic | Pelagic | | |
|---|
| Species | HAI | LAI | HAI | LAI | p_Treatment | p_Habitat |
|---|
| Abramis brama | 6.94 ± 3.74 | 2.78 ± 1.94 | 0 | 12.96 ± 4.19 | ns | ns |
| Alburnus alburnus | 0.69 ± 0.69 | 0.46 ± 0.46 | 0 | 49.07 ± 24.86 | ns | ns |
| Blicca bjoerkna | 2.08 ± 1.15 | 3.24 ± 1.11 | 3.89 ± 2.68 | 12.04 ± 5.03 | ns | ns |
| Rutilus rutilus | 13.19 ± 6.88 | 50.46 ± 12.69 | 5.56 ± 2.25 | 42.59 ± 16.4 | * | ns |
| Cypriniformes | 22.92 ± 10.17 | 56.94 ± 13.1 | 10 ± 3.47 | 116.67 ± 45.24 | * | ns |
| Gymnocephalus cernua | 361.81 ± 42.49 | 143.52 ± 17.82 | 1.11 ± 1.11 | 0.93 ± 0.93 | *** | *** |
| Perca fluviatilis | 862.5 ± 200.61 | 2829.98 ± 445.8 | 7.78 ± 3.4 | 53.7 ± 19.79 | *** | *** |
| Sander lucioperca | 96.53 ± 21.59 | 56.48 ± 10.14 | 5 ± 2.27 | 0.93 ± 0.93 | ns | *** |
| Perciformes | 1320.83 ± 222.11 | 3029.98 ± 438.72 | 13.89 ± 4.35 | 55.56 ± 20.65 | *** | *** |
| Total catch | 1343.75 ± 228.79 | 3086.92 ± 447.58 | 23.888 ± 6.99 | 172.22 ± 59.56 | *** | *** |
Table 5.
Mean and standard error (SE) of the fish older than YOY BPUE (biomass per unit of effort) of gillnets from Lipno reservoir, in kilograms per 1000 m2 of nets. *** = p < 0.001, ** = p < 0.01, * = p < 0.05 and ns = p ≥ 0.05.
Table 5.
Mean and standard error (SE) of the fish older than YOY BPUE (biomass per unit of effort) of gillnets from Lipno reservoir, in kilograms per 1000 m2 of nets. *** = p < 0.001, ** = p < 0.01, * = p < 0.05 and ns = p ≥ 0.05.
| | Benthic | Pelagic | | |
|---|
| Species | HAI | LAI | HAI | LAI | p_Treatment | p_Habitat |
|---|
| Abramis brama |
8.51 ± 2.15
|
6.28 ± 1.07
|
8.3 ± 3.08
|
3.86 ± 2.98
| ns | ns |
| Alburnus alburnus |
1.02 ± 0.45
|
0.91 ± 0.3
|
13.49 ± 1.57
|
10.47 ± 2.25
| ns | *** |
| Blicca bjoerkna |
26.28 ± 4.07
|
20.35 ± 2.06
|
6.22 ± 1.9
|
17.75 ± 3.94
| ns | *** |
| Cyprinus carpio |
4.79 ± 1.31
|
5.7 ± 1.73
|
1.86 ± 0.9
|
4.67 ± 1.37
| ns | ns |
| Leuciscus aspius |
0.98 ± 0.69
|
0.58 ± 0.4
|
3.28 ± 2.15
|
2.61 ± 1.09
| ns | ns |
| Rutilus rutilus |
37.14 ± 4.4
|
26.43 ± 2.68
|
24.02 ± 2.28
|
36.27 ± 9.31
| ns | ns |
| Scardinius erythrophthalmus |
0
|
0.48 ± 0.3
|
0
|
3.7 ± 1.28
| ns | ns |
| Cypriniformes | 78.72 ± 6.88 | 60.13 ± 4.2 | 57.17 ± 7.25 | 79.33 ± 14.36 | ns | ns |
| Esox lucius |
0
|
1.24 ± 0.71
|
0
|
3.6 ± 2.39
| ns | ns |
| Esociformes | 0 | 1.24 ± 0.71 | 0 | 3.6 ± 2.39 | ns | ns |
| Gymnocephalus cernua |
8.3 ± 0.51
|
4.91 ± 0.54
|
0
|
0.01 ± 0.01
| * | * |
| Perca fluviatilis |
9.27 ± 2.12
|
29.09 ± 3.4
|
0.39 ± 0.22
|
1.82 ± 0.62
| *** | *** |
| Sander lucioperca |
9.12 ± 2.32
|
11.52 ± 1.93
|
2.53 ± 0.88
|
3.44 ± 2.37
| ns | ** |
| Perciformes | 26.69 ± 2.88 | 45.51 ± 4.25 | 2.92 ± 0.88 | 5.27 ± 2.4 | *** | *** |
| Silurus glanis |
0
|
0.45 ± 0.33
|
0
|
1.16 ± 1.16
| ns | ns |
| Siluriformes | 0 | 0.45 ± 0.33 | 0 | 1.16 ± 1.16 | ns | ns |
| Total catch | 105.41 ± 6.619 | 107.94 ± 7.05 | 60.087 ± 7.726 | 89.367 ± 14.96 | ns | ** |
Table 6.
Mean and standard error (SE) of the young of the year class fish BPUE (biomass per unit of effort) of gillnets from Lipno reservoir, in kilograms per 1000 m2 of nets. *** = p < 0.001, ** = p < 0.01, * = p < 0.05 and ns = p ≥ 0.05.
Table 6.
Mean and standard error (SE) of the young of the year class fish BPUE (biomass per unit of effort) of gillnets from Lipno reservoir, in kilograms per 1000 m2 of nets. *** = p < 0.001, ** = p < 0.01, * = p < 0.05 and ns = p ≥ 0.05.
| | Benthic | Pelagic | | |
|---|
| Species | HAI | LAI | HAI | LAI | p_Treatment | p_Habitat |
|---|
| Abramis brama | 0.03 ± 0.02 | 0.01 ± 0.01 | 0 | 0.04 ± 0.02 | ns | ns |
| Alburnus alburnus | 0 | 0 | 0 | 0.11 ± 0.06 | ns | ns |
| Blicca bjoerkna | 0.01 ± 0.001 | 0.01 ± 0.001 | 0.01 ± 0.01 | 0.04 ± 0.02 | ns | ns |
| Rutilus rutilus | 0.05 ± 0.02 | 0.18 ± 0.05 | 0.02 ± 0.01 | 0.15 ± 0.06 | ns | ns |
| Cypriniformes | 0.08 ± 0.04 | 0.21 ± 0.05 | 0.04 ± 0.01 | 0.35 ± 0.13 | ns | ns |
| Gymnocephalus cernua | 0.85 ± 0.12 | 0.3 ± 0.04 | 0 | 0 | ** | ns |
| Perca fluviatilis | 1.17 ± 0.48 | 1.75 ± 0.3 | 0.02 ± 0.01 | 0.11 ± 0.04 | ns | *** |
| Sander lucioperca | 1.39 ± 0.34 | 0.96 ± 0.23 | 0.02 ± 0.01 | 0 | ns | * |
| Perciformes | 3.4 ± 0.77 | 3.01 ± 0.39 | 0.04 ± 0.01 | 0.11 ± 0.05 | ns | *** |
| Total catch | 3.48 ± 0.786 | 3.219 ± 0.4 | 0.077 ± 0.02 | 0.46 ± 0.16 | ns | ns |
Table 7.
Mean, standard error (SE), maximum (Max) and minimum (Min) standard length of fish older than YOY, in millimeters, from gillnets of Lipno reservoir. *** =
p < 0.001, ** =
p < 0.01, and ns =
p ≥ 0.05. For complete species names, check
Table 1 or
Table 3.
Table 7.
Mean, standard error (SE), maximum (Max) and minimum (Min) standard length of fish older than YOY, in millimeters, from gillnets of Lipno reservoir. *** =
p < 0.001, ** =
p < 0.01, and ns =
p ≥ 0.05. For complete species names, check
Table 1 or
Table 3.
| |
Benthic
|
Pelagic
| | |
|---|
| | HAI |
LAI
|
HAI
|
LAI
| | |
|---|
|
Species
|
Mean ± SE
|
Max-Min
|
Mean ± SE
|
Max-Min
|
Mean ± SE
|
Max-Min
|
Mean ± SE
|
Max-Min
|
p_Treatment
|
p_Habitat
|
|---|
| A. brama | 172.48 ± 8.09 |
320-69
|
222.46 ± 11.14
|
320-85
|
255.11 ± 6.24
|
400-170
|
240.83 ± 16.37
|
310-105
|
**
|
ns
|
| A. alburnus |
121.94 ± 2.36
|
150-75
|
116.35 ± 2.01
|
145-75
|
124.13 ± 0.6
|
180-70
|
125.47 ± 0.84
|
155-70
|
***
|
***
|
| B. bjoerkna |
160.61 ± 4.37
|
305-66
|
173.93 ± 4.31
|
295-66
|
204.98 ± 6.83
|
275-85
|
194.26 ± 5
|
320-86
|
ns
|
***
|
| C. carpio |
399.29 ± 13.3
|
455-280
|
413.96 ± 9.39
|
490-310
|
403.57 ± 13.39
|
445-350
|
423.33 ± 20.16
|
580-390
|
***
|
***
|
| E. lucius |
-
|
-
|
466.67 ± 24.55
|
510-425
|
-
|
-
|
585 ± 15
|
600-570
|
ns
|
***
|
| G. cernua |
73.62 ± 0.24
|
113-55
|
75.17 ± 0.32
|
130-55
|
-
|
-
|
85
|
85
|
**
|
***
|
| L. aspius |
525 ± 30
|
555-495
|
505 ± 5
|
510-500
|
457.86 ± 38.51
|
560-315
|
512 ± 4.06
|
520-500
|
***
|
***
|
| P. fluviatilis |
157.82 ± 4.96
|
310-83
|
172.53 ± 3.02
|
320-70
|
202.5 ± 13.15
|
240-180
|
193.33 ± 9.5
|
255-150
|
***
|
***
|
| R. rutilus |
155.06 ± 2.08
|
290-75
|
145.09 ± 1.91
|
280-75
|
221.87 ± 2.45
|
310-75
|
221.79 ± 2.78
|
285-80
|
**
|
***
|
| S. lucioperca |
241.84 ± 15.53
|
520-156
|
305.54 ± 18.52
|
580-158
|
326.11 ± 20.98
|
395-230
|
380 ± 46.94
|
525-235
|
***
|
***
|
| S. erythrophthalmus |
-
|
-
|
228.33 ± 18.78
|
260-195
|
-
|
-
|
243 ± 4.84
|
275-220
|
ns
|
***
|
| S. glanis |
-
|
-
|
502.5 ± 162.5
|
665-340
|
-
|
-
|
672.5 ± 47.5
|
720-625
|
ns
|
***
|
Table 8.
Mean, standard error (SE), maximum (Max) and minimum (Min) standard length of the young of the year class fish, in millimeters, from gillnets of Lipno reservoir. *** =
p < 0.001, * =
p < 0.05 and ns =
p ≥ 0.05. For complete species names, check
Table 2 or
Table 4.
Table 8.
Mean, standard error (SE), maximum (Max) and minimum (Min) standard length of the young of the year class fish, in millimeters, from gillnets of Lipno reservoir. *** =
p < 0.001, * =
p < 0.05 and ns =
p ≥ 0.05. For complete species names, check
Table 2 or
Table 4.
| |
Benthic
|
Pelagic
| | |
|---|
| | HAI |
LAI
|
HAI
|
LAI
| | |
|---|
|
Species
|
Mean ± SE
|
Max-Min
|
Mean ± SE
|
Max-Min
|
Mean ± SE
|
Max-Min
|
Mean ± SE
|
Max-Min
|
p_Treatment
|
p_Habitat
|
|---|
| A. brama |
55.8 ± 2.32
|
62-40
|
54.17 ± 2.34
|
65 ± 49
|
-
|
-
|
54.07 ± 1.61
|
63-40
|
***
|
***
|
| A. alburnus |
56
|
56
|
65
|
65
|
-
|
-
|
56.74 ± 0.56
|
65-49
|
ns
|
ns
|
| B. bjoerkna |
55.67 ± 5.9
|
63-44
|
58.14 ± 2.01
|
65-53
|
53.86 ± 1.39
|
59-51
|
54.46 ± 1.57
|
65-46
|
***
|
***
|
| G. cernua |
47.64 ± 0.18
|
55-33
|
45.88 ± 0.26
|
55-30
|
48 ± 2
|
50-46
|
43
|
43
|
ns
|
***
|
| P. fluviatilis |
52.55 ± 0.22
|
72-37
|
48.23 ± 0.12
|
73-33
|
52 ± 1.57
|
60-42
|
48.52 ± 0.52
|
56-39
|
ns
|
*
|
| R. rutilus |
55.53 ± 1.02
|
65-43
|
56.38 ± 0.42
|
66-42
|
58.4 ± 1.16
|
64-51
|
55.76 ± 0.56
|
65-49
|
***
|
***
|
| S. lucioperca |
90.88 ± 2.96
|
155-41
|
100.58 ± 2.8
|
155-42
|
55.78 ± 7.28
|
95-29
|
43
|
43
|
***
|
***
|

 ,
, 


