
Evaluation of Minimum and Suitable Ecological Flows of an Inland Basin in China Considering Hydrological Variation

1
College of Hydraulic Science and Engineering, Yangzhou University, Yangzhou 225008, China
2
Modern Rural Water Resources Research Institute, Yangzhou University, Yangzhou 225008, China
3
Nanjing Hydraulic Research Institute, Nanjing 210017, China
*
Author to whom correspondence should be addressed.
Water 2023, 15(4), 649; https://doi.org/10.3390/w15040649
Submission received: 14 January 2023
/
Revised: 3 February 2023
/
Accepted: 6 February 2023
/
Published: 7 February 2023
(This article belongs to the Section Hydrology)
Abstract
:Ecological flows in rivers are critical to the health and stability of river ecosystems, especially for inland drylands where ecological conditions are rapidly deteriorating. Climate change and human activities lead to hydrological variation, which in turn alters the hydrological and ecological balance of local ecosystems. Therefore, it is important to study the ecological flow under hydrological variation. In this study, the second-largest inland river basin in China, the Hei River Basin, was selected as the case study. The heuristic segmentation method, monthly minimum average flow method, the Lyon method, the average flow in the driest month method, and the monthly frequency method were employed to calculate the minimum and suitable ecological flow considering hydrological variation. Then, the results of the minimum and suitable ecological flow were evaluated and compared by the Tennant method. Finally, the ecological flows were recommended for the Hei River Basin after comparison and evaluation. Results show that: (1) It is necessary and feasible to calculate ecological flow demand considering hydrological variation in the Hei River Basin. (2) The evaluation results of the minimum ecological flow are mostly at a good level or above, and those of the suitable ecological flows are mostly at the optimum range. (3) Three scenarios with different periods and frequencies were set up to obtain suitable ecological flow; and it shows that the suitable ecological flow of scenario 3 (50% frequency in all months) has the best ecological benefits, and scenario 2 (frequency is taken as 75% in spring and autumn, 50% in summer, and 80% in winter) has the best comprehensive benefits. This study can provide important reference for water resources development and utilization and ecological protection in the Hei River Basin.
1. Introduction
1.1. Background and Problem Statement
River ecosystem is a complex, open, dynamic, non-equilibrium, and nonlinear system, which refers to the unity of interaction between river biological community and river environment. A healthy river ecosystem plays a major role in species flow, energy flow, material circulation, and information flow [1,2]. Furthermore, it is also one of the most important conditions for sustainable utilization of water resources and maintaining species diversity. However, climate change and increasingly intensified human activities (e.g., urbanization, construction of water conservancy projects, water and soil conservations, agricultural practices, etc.) have altered the natural hydrological situation of rivers [3], leading to the reduction of river flow and destruction of water quality, thus affecting the health of river ecosystems. The main problem lies in the irrational water resources utilization and the neglect of ecological flow [4], making the river flow unable to meet the requirements of ecological sustainable development. Therefore, reasonable determination of river ecological flow is the basic measure in biodiversity conservation and ecosystem services and in controlling the intensity of water resource development [5]. Ecological flow is a concept that is constantly developing, during which many concepts have been proposed, such as ecological base flow [6], ecological water demand [7], sensitive ecological water demand, ecological environmental water demand [8], minimum ecological water demand, suitable ecological flow [9], environmental flow, environmental water flow, etc. [10]. For example, Yang et al. (2005) claimed that the ecological water requirement should include an ecological water requirement and environmental water requirement [10]. The former refers to the amount of water used by the ecosystem for maintaining the water balance of organisms; the latter is the water used for preserving and improving the aquatic environment and the environment where humans live [2]. At present, ecological flow is generally divided into two parts [5]: the basic ecological flow and the suitable ecological flow. The basic ecological flow refers to the minimum flow process under the condition that the stability and health conditions of the river ecosystem are satisfied. The suitable ecological flow is the most suitable flow process that is conducive for maintaining the stability of the ecosystem inside and outside the river and ensuring species diversity [11,12].
Due to lack of conceptual uniformity, there are numerous methods for determining ecological flow. According to the statistics, there are more than 200 methods [13] for calculating ecological flow internationally that can be roughly classified into four types: hydrological methods, hydraulic methods, habitat simulation methods, and overall analysis methods [14,15]. However, the hydraulic methods, habitat simulation methods, and holistic analysis methods require a large amount of river data [16]. Specifically, the hydraulic methods assume that the ecological flow is related to the physical morphological characteristics of the river and requires abundant morphological data of the river cross-section for calculation [17]. The habitat simulation methods need to investigate and study the target species of the river habitats and their needs for hydrological conditions in different life stages. The holistic analysis methods require comprehensive consideration of various factors such as pollution prevention and control, habitat protection, and morphological stability of the river, and its calculation results need long-term investigation and systematic research. In practical research, the application of these three methods has certain limitations owing to the limited human and material resources [4]. In contrast, hydrological methods are based on flow observation data and mathematical and statistical analysis to compute river ecological flow without complicated and tedious field data, and most rivers have a long series of hydrological data, so it has the advantages of being fast and efficient, being easy to use, and having low data requirements [18].
There are many widely used hydrological methods for ecological flow calculation. In the 1970s, Tennant [19] established a quantitative relationship between the minimum river flow and habitat quality by investigating several rivers in the Midwest of the United States, namely the Tennant method. In 1991, Matthews et al. [20] proposed the method of taking the monthly average flow under a certain guaranteed rate as the ecological base flow by analyzing the hydrological and biological characteristics of different regions, namely the Texas method. Later, the flow duration curve method [21], the minimum average 7-day (consecutive) flow expected to occur once every 10 years (7Q10) method [22], monthly minimum average flow method [23], the Lyon method [24], monthly frequency calculation method [16], range of variability approach (RVA) [25], and average flow in the driest month method [16] and many other new methods have been gradually developed and widely used.
Nowadays, runoff in many areas have changed with variation points due to climate change and increasing human activities [26], which destroy the consistency assumption of hydrological series. Hence, it is scientific and reasonable to calculate ecological flow by taking hydrological variation into account. Generally, it is thought that natural or near-natural water flow is an ideal state to maintain the health of river ecosystem, which means ecological flow calculated on the basis of the data before the hydrological change point is more reasonable for ecological water demand. Huang et al. (2014) adopted the modified Tennant method to calculate the maximum instream ecological flow of the Wei River Basin based on the runoff series before variation point [3]. Liu et al. (2015) used probability distribution function to fit the daily flow sequence before the variation of Poyang Lake Basin and determined that the flow at the place with the highest probability density was the ecological flow in the river channel [27].
1.2. Research Motivation and Objectives
The Hei River Basin, the second-largest inland river in China, is an important part of the Hexi Corridor. The city of Zhangye in the middle reaches of the basin is located in the ancient Silk Road and the present-day Eurasian Continental Bridge and is known as “Golden Zhangye”. There are the Jiuquan Satellite Launch Base, National Defense Research Base, Ejina Oasis, and other important water users in the region. As a result of human activities and climate change [28,29], the amount and distribution of water resources in the basin are not compatible with local population, economic and social development, and ecological environment. With the continuous population growth and rapid economic and social development since the 1960s, human beings have overexploited water resources and ecological water in the lower reaches has been occupied, resulting in the decline of vegetation and the rapid expansion of desertification in the lower reaches of the river. Therefore, determining the ecological flow in the Hei River Basin is of important significance for rational allocation of water resources, which will be helpful for protecting and improving the local river ecosystem. Some attempts have been made to estimate the ecological flow of the Hei River. For example, Shi et al. (2015) calculated the ecological flow of Juyan Lake in the lower reach of the Hei River [30]. Song et al. (2020) analyzed the ecological flow demand of the Hei River Basin in Gansu Province with the 7Q10 method and the Tennant method [31]. However, none of them considered the hydrological variation before calculating the ecological flow. Moreover, these studies only focused on part of the basin without comprehensively considering the ecological flow in the upper and middle reaches of the basin.
Therefore, the main objectives of this study are (1) to detect the annual runoff change points in the upstream and midstream of the Hei River Basin and (2) to reasonably estimate the minimum and suitable ecological monthly flow based on the hydrological methods for the basin.
2. Study Area and Data
2.1. Study Area
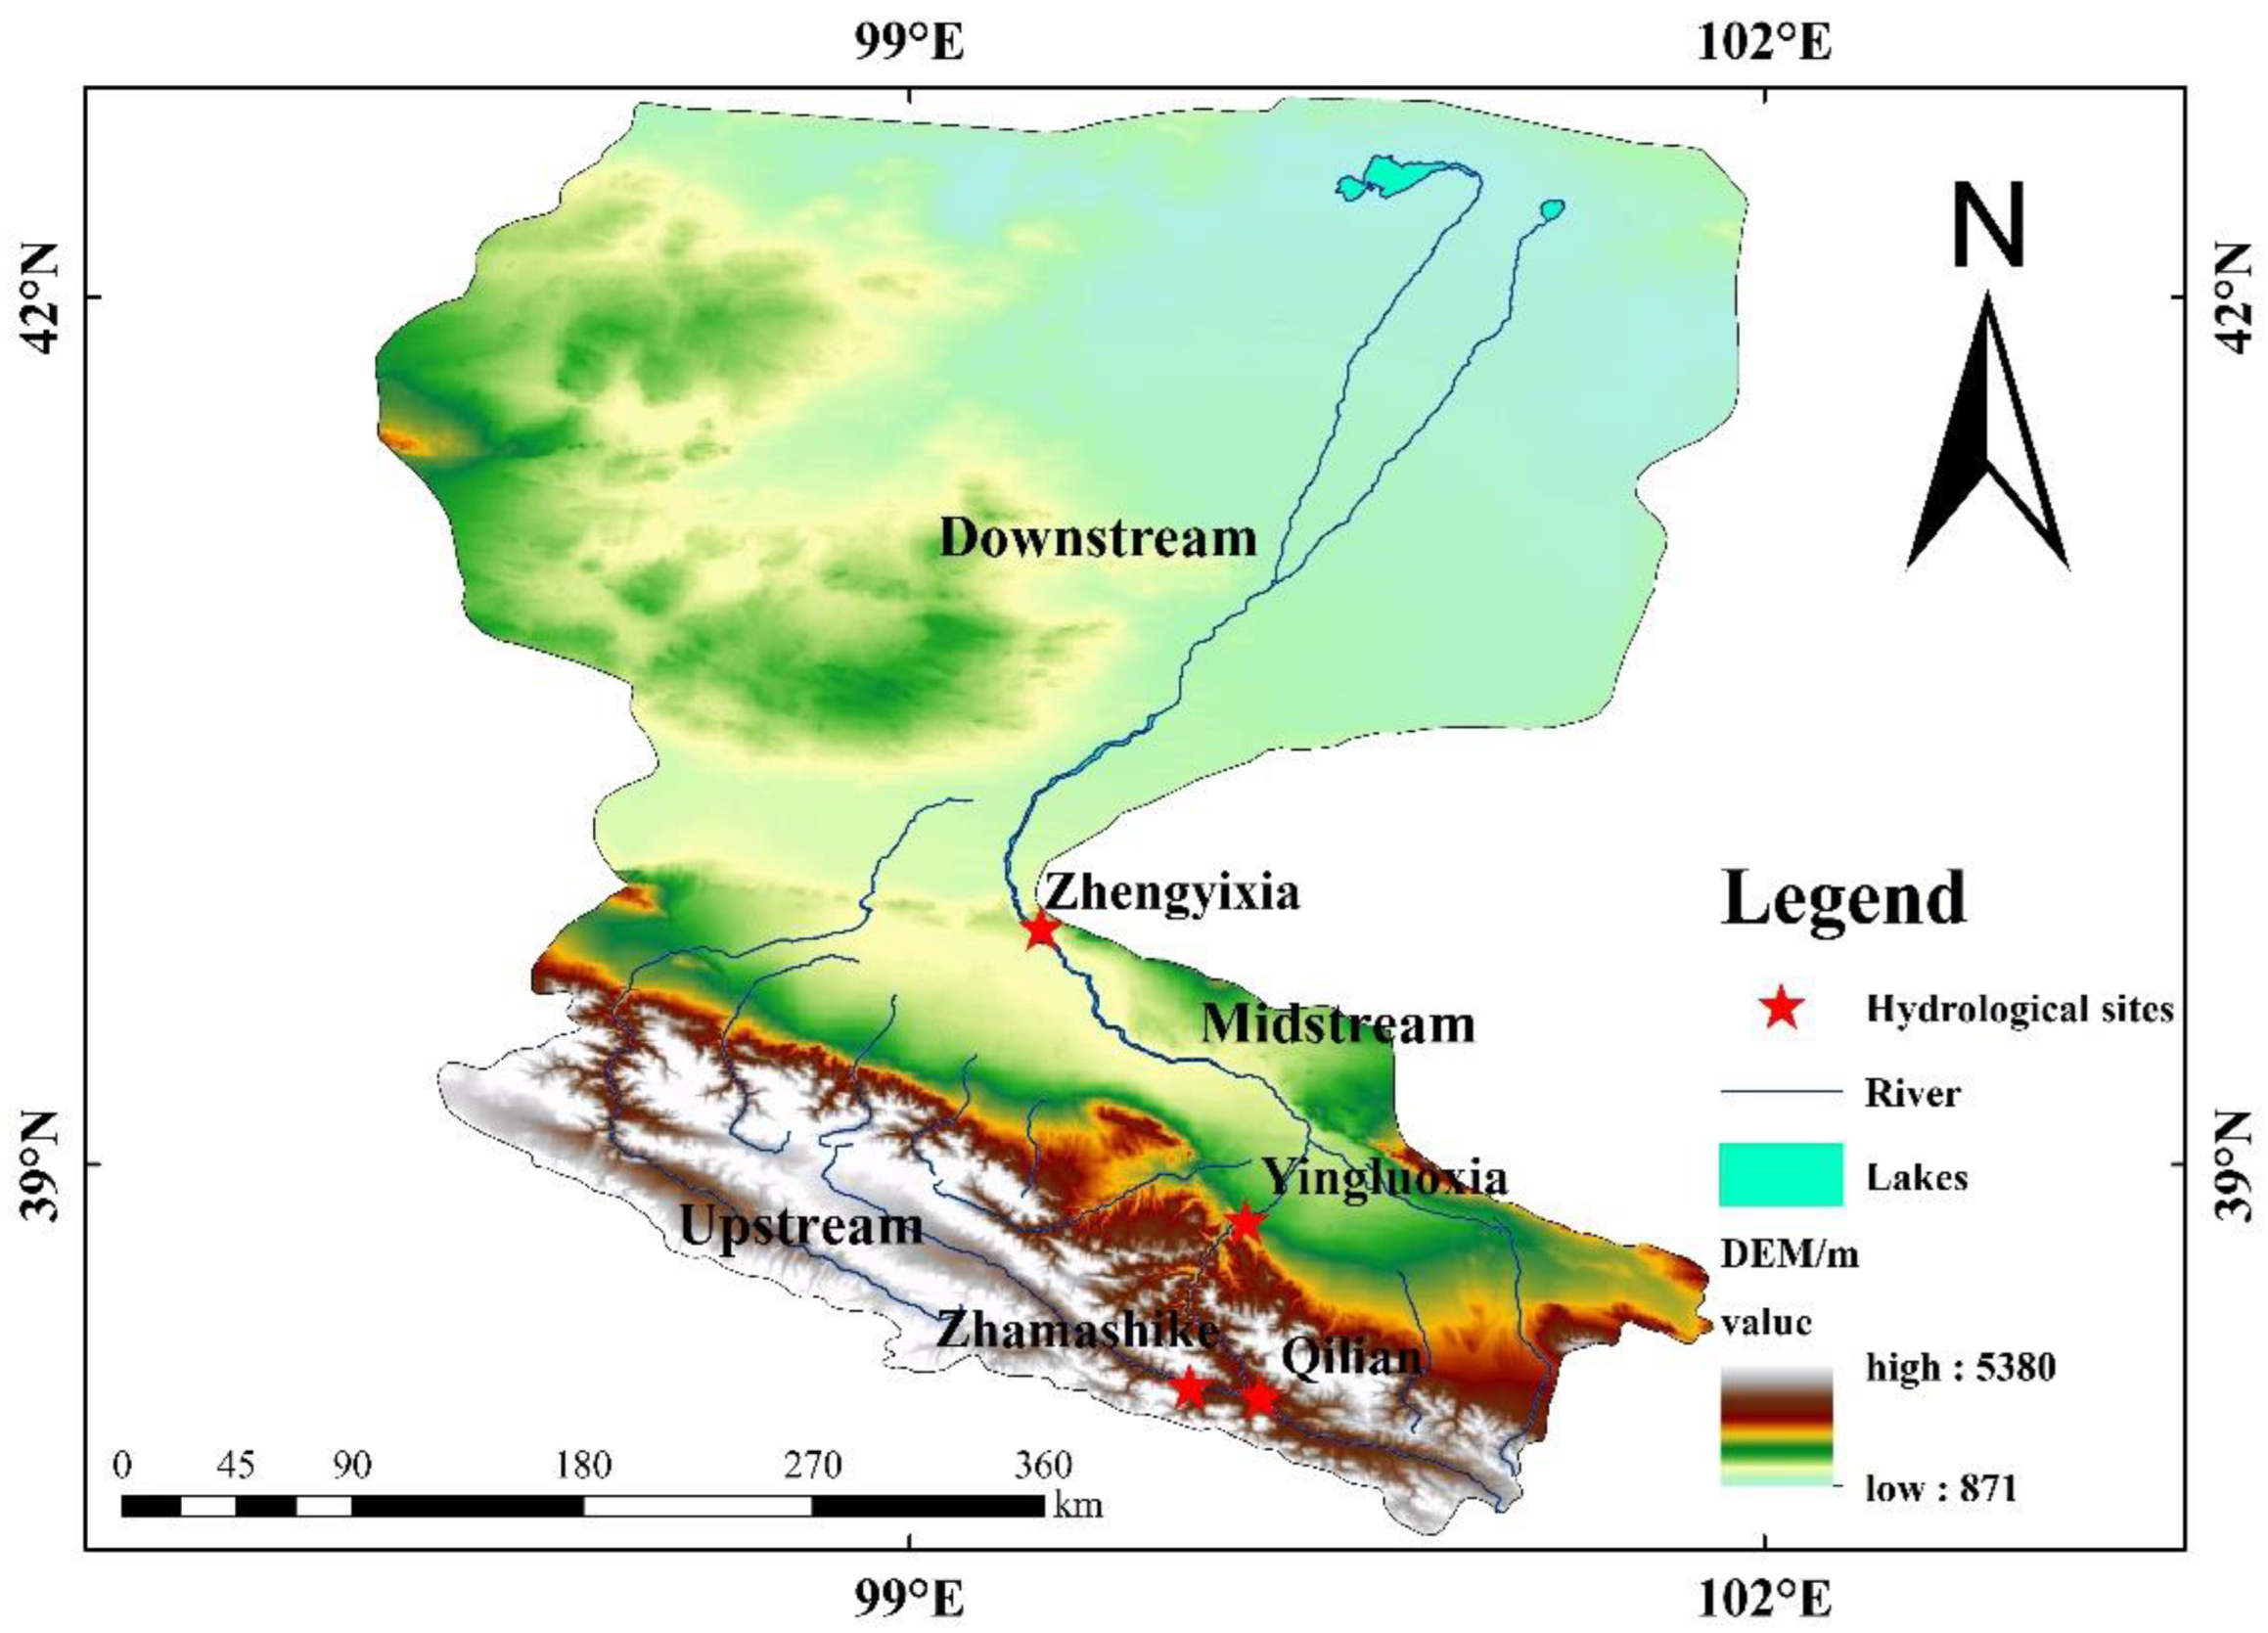
The Hei River Basin, as shown in Figure 1, is the second-largest inland river basin in China. It is located in the middle of Hexi Corridor, roughly between 98°–101°30′ E and 38°–42° N, and is the largest inland river basin in western Gansu and Inner Mongolia. The Hei River originates from the southern Qilian Mountains and is 821 km long with a drainage area of about 142,900 km2. It lies in the middle of Eurasia, far away from the sea and surrounded by mountains. The climate of the Hei River Basin has obvious differences from east to west and from south to north. In the southern Qilian Mountains, the precipitation in the plain area of the central corridor decreases from 250 mm in the east to less than 50 mm in the west, and the evaporation increases from east to west from less than 2000 mm to more than 4000 mm. The average annual temperature in the southern Qilian Mountains is 2.0~1.5 °C, and the relative humidity is about 60%. The central corridor plain is rich in light and heat resources, with an annual average temperature of 2.8~7.6 °C and sunshine duration of 3000~4000 h. The precipitation in the southern mountain area increases by 15.5~16.4 mm for every 100 m above sea level. The Ejina Plain in the lower reaches is deeply located in the inland hinterland, which is a typical continental climate characterized by less precipitation, strong evaporation, large temperature difference, strong wind and sand, and long sunshine times.
The Hei River can be divided into the upper, middle, and lower reaches by the Yingluoxia and Zhengyixia stations (Figure 1). The upper reaches of the Qilian Mountains above Yingluoxia are the main stream producing areas; Yingluoxia to Zhengyixia comprises the middle reaches, which is the main utilization area of water resources; the lower reaches of Zhengyixia are the vanishing areas at the end of the rivers and lakes. Additionally, the upstream is divided into east and west branches, each of which has a hydrologic station: Zhamashike station and Qilian station, respectively (Figure 1). Since the 1960s, the population and economy in the middle reaches of the basin have been growing rapidly, and the water consumption has been rising, which has led to less water flowing into the lower reaches of the basin. This aggravated the ecological environment problems in the lower reaches, such as the drying up of rivers and lakes, the decline of groundwater level, the withering of trees, the degradation of grasslands, and the raging of sandstorms. There is a saying that “the wind rises in Siberia, and the sand rises in Ejin”. Ecological construction and environmental protection in the Hei River Basin are not only related to the survival and social development of the people in the basin but also related to the environmental quality of the northwest and north China. Hence, it is necessary to accurately calculate the ecological flow in the upper and middle stream of the Hei River.
2.2. Data
In this study, the observed daily flow series from 1957 to 2014 were obtained from the Hei River Basin Authority (http://www.hhglj.org/, accessed on 5 December 2020). These data are measured in Zhamashike, Qilian, Yingluoxia, and Zhengyixia hydrological stations in the upper and middle reaches of the Hei River (Figure 1), respectively. Based on the daily flow series, monthly and annual runoff data were obtained.
3. Methodology
The hydrological process of the river is cyclic, so the ecological flow is a process line with time as the variable. In this paper, the heuristic segmentation algorithm is firstly employed to identify change points in the annual runoff series. Then, the minimum ecological flow is calculated by three methods, namely monthly minimum average flow method, Lyon method, and average flow in the driest month method on the basis of the series before change points. Suitable ecological flow is estimated with the monthly frequency method by setting different stages and different frequency scenarios.
3.1. Heuristic Segmentation Method
The heuristic segmentation method is a commonly used method to detect change points in non-liner and non-stationary time series based on sliding t-test [3,32]. The principle of this method is to divide a time series into two subsequences with a moving segmentation point. Assuming the averages of the sub-series to the left of the pointe is μ1 and to the right is μ2, then the difference between μ1 and μ2 under the statistical significance is estimated by Student’s t-test statistic as follows:
where
where SD is the pooled variance, s1 and s2 are the standard deviations of the two subseries, and n1 and n2 are the length of the two subseries.
Moving the segmentation point step by step, we compare the significance of their averages’ difference as follows:
where η = 4.19 ln N − 11.54 and δ = 0.40 are obtained from Monte Carlo simulations, N is the length of the time series to be cut, V = N − 2, and Ix (a, b) represents the incomplete beta function.
If P(tmax) is larger than the threshold P0 (=0.95) at the 95% confidence level, then the change point is identified. When the obtained significance value is less than the P0 at the 95% confidence level, or the obtained subsequence length is shorter than the minimum length l (=25), the change-point recognition process ends. More details about the method can be found in Liu et al. (2017) [32].
3.2. Minimum Ecological Flow Calculation
3.2.1. Monthly Minimum Average Flow Method
According to the monthly minimum ecological flow method, the minimum ecological flow process is similar to the natural runoff process and changes continuously, so it should be calculated monthly regardless of high flow, normal flow, low flow, and seasonality [23]. In this method, the minimum value of monthly flow series in the natural monthly average flow series is taken as the minimum ecological flow of the month, and the minimum ecological flow value of each month constitutes the minimum ecological flow process of the year.
3.2.2. The Lyon Method
The Lyon method considers that the runoff varies greatly between years and within years, and the average annual flow of rivers is greatly affected by extreme values [23]. Using the median instead of the average annual flow of the river can reduce the impact of extreme values on the calculation results.
The median value of monthly average flow of different proportions is adopted in different months of the year:
(1) October to February, 40% × median value of monthly average flow;
(2) March to September, 60% × median value of monthly average flow;
(3) All months, lower than 7Q2 (minimum flow threshold for water quality protection).
3.2.3. Average flow in the Driest Month Method
The mean value of the measured flow in the driest month of the long series is taken as the minimum ecological flow of the river within the year [28], and the calculation formula is as follows:
where Q is the minimum ecological flow of the river, m3/s; Qij is the measured average flow in the jth month of the ith year, m3/s; n is the number of statistical years.
3.3. Suitable Ecological Flow Calculation
The minimum ecological flow process is the lowest condition to ensure the survival of all species in the river ecosystem. On this condition, once the river ecosystem is damaged, it will not be able to adjust to a healthy level through its own recovery. In other words, it is the limit of the living conditions under which the river ecosystem will not degenerate or the aquatic organisms can endure under the natural state. If the river is at the minimum ecological flow for a long time, it is not good for the health of river life and the stability of the ecosystem. Hence, it is necessary to determine suitable ecological flow to maintain the stability of the ecosystem inside and outside the river and ensure species diversity.
In this study, the monthly frequency method was used to calculate the suitable ecological flow process of the Hei River. Based on the long sequence of natural runoff, this method divides the annual runoff process into different periods and then calculates the ecological flow process at different frequencies. Combined with the previous research results [22,33], in order to select the best solution for the Hei River, this paper has calculated the appropriate ecological flow processes of the Hei River under three different scenarios with different stages and frequencies:
(1) The frequency is 90% in wet season, 70% in normal season, and 50% in dry season;
(2) The frequency is 75% in spring and autumn, 50% in summer, and 80% in winter (four seasons: March to May is spring; June to August is summer; September to November is autumn; December to February of the next year is winter);
(3) The frequency is 50% for each month.
The reasonableness of the above three scenarios has been tested and has a wide application in China [34,35]. Based on the multi-year average runoff process of the Hei River Basin and the definition of dry season, the dry season is the period when the monthly average flow is less than 5% of the annual average flow. Therefore, the wet, normal, and dry seasons of the Hei River in the year are divided as follows: June to September is the wet season; November to April of next year is the normal season; May and October belong to the dry season [36].
4. Results and Discussion
4.1. Change Points of Annual Runoff at Each Station
Change points of annual runoff series at the four hydrological stations are detected by the heuristic segmentation method, and the threshold P0 is set to 0.95 and minimum length l to 25. The segmentations and change points of annual runoff at Zhamashike station are exhibited in Figure 2. It can be seen from Figure 2a that the blue and green line refer to the first and second segmentation process, respectively. During the first iteration and segmentation process, a change point of year 2006 is identified due to its P (tmax) = 1.0 > P0 = 0.95. During the second iteration and segmentation, no change points are detected due to its P (tmax) = 0.89 < P0 = 0.95. When the second iteration finishes, the segmentation process ends.
The segmentations and change points of annual runoff at the Qilian station are presented in Figure 2b. During the first iteration and segmentation process, a change point of year 1980 is found with its P (tmax) = 0.99 > P0 = 0.95. Then, the long series is divided into two subseries: 1957–1979 and 1980–2014. Hence, the second iteration and segmentation continued for the subseries 1980–2014. However, no change points are detected due to its P (tmax) = 0.35 < P0 = 0.95. Finally, the segmentation process ends.
Figure 2c shows the segmentations and change points of annual runoff at the Yingluoxia station. For the first iteration and segmentation process, the maximum T is found in 2004 with corresponding P (tmax) = 1.0 > P0 = 0.95, suggesting the year 2004 is a change point in the annual runoff time series. Since the length of the sub-series 1957–2004 is longer than 25, the identification process continues. Similarly, the second maximum T is found in 1979 with corresponding P (tmax) = 0.88 < P0 = 0.95, which means it is not a change point. Eventually, the segmentation process ends.
Figure 2d shows the segmentations and change points of the annual runoff of the Zhengyixia station. For the first iteration and segmentation process, the maximum T is found in 1980 with corresponding P (tmax) = 0.77 < P0 = 0.95. Hence, there is no change point in the annual runoff at the Zhengyixia station, which means the assumption of stationary annual runoff in this station is still maintained. Then, the segmentation process ends.
Therefore, for the Zhamashike station, Qilian station, and Yingluoxia station located in the upstream of the Hei River, only one change point of annual runoff is identified, and no change point is found in the annual runoff of the Zhengyixia station in the midstream of the basin.
4.2. Calculation of Minimum Ecological Flow
4.2.1. Results of Monthly Minimum Average Flow Method
In the view that natural or near-natural flows are ideal for maintaining healthy river ecosystems, the runoff series of 1957–2006 at the Zhamashike station, 1957–1980 at the Qilian station, 1957–2004 at the Yingluoxia station, and 1957–2014 at the Zhengyixia station are used to determine ecological flow in the upstream and midstream of the Hei River.
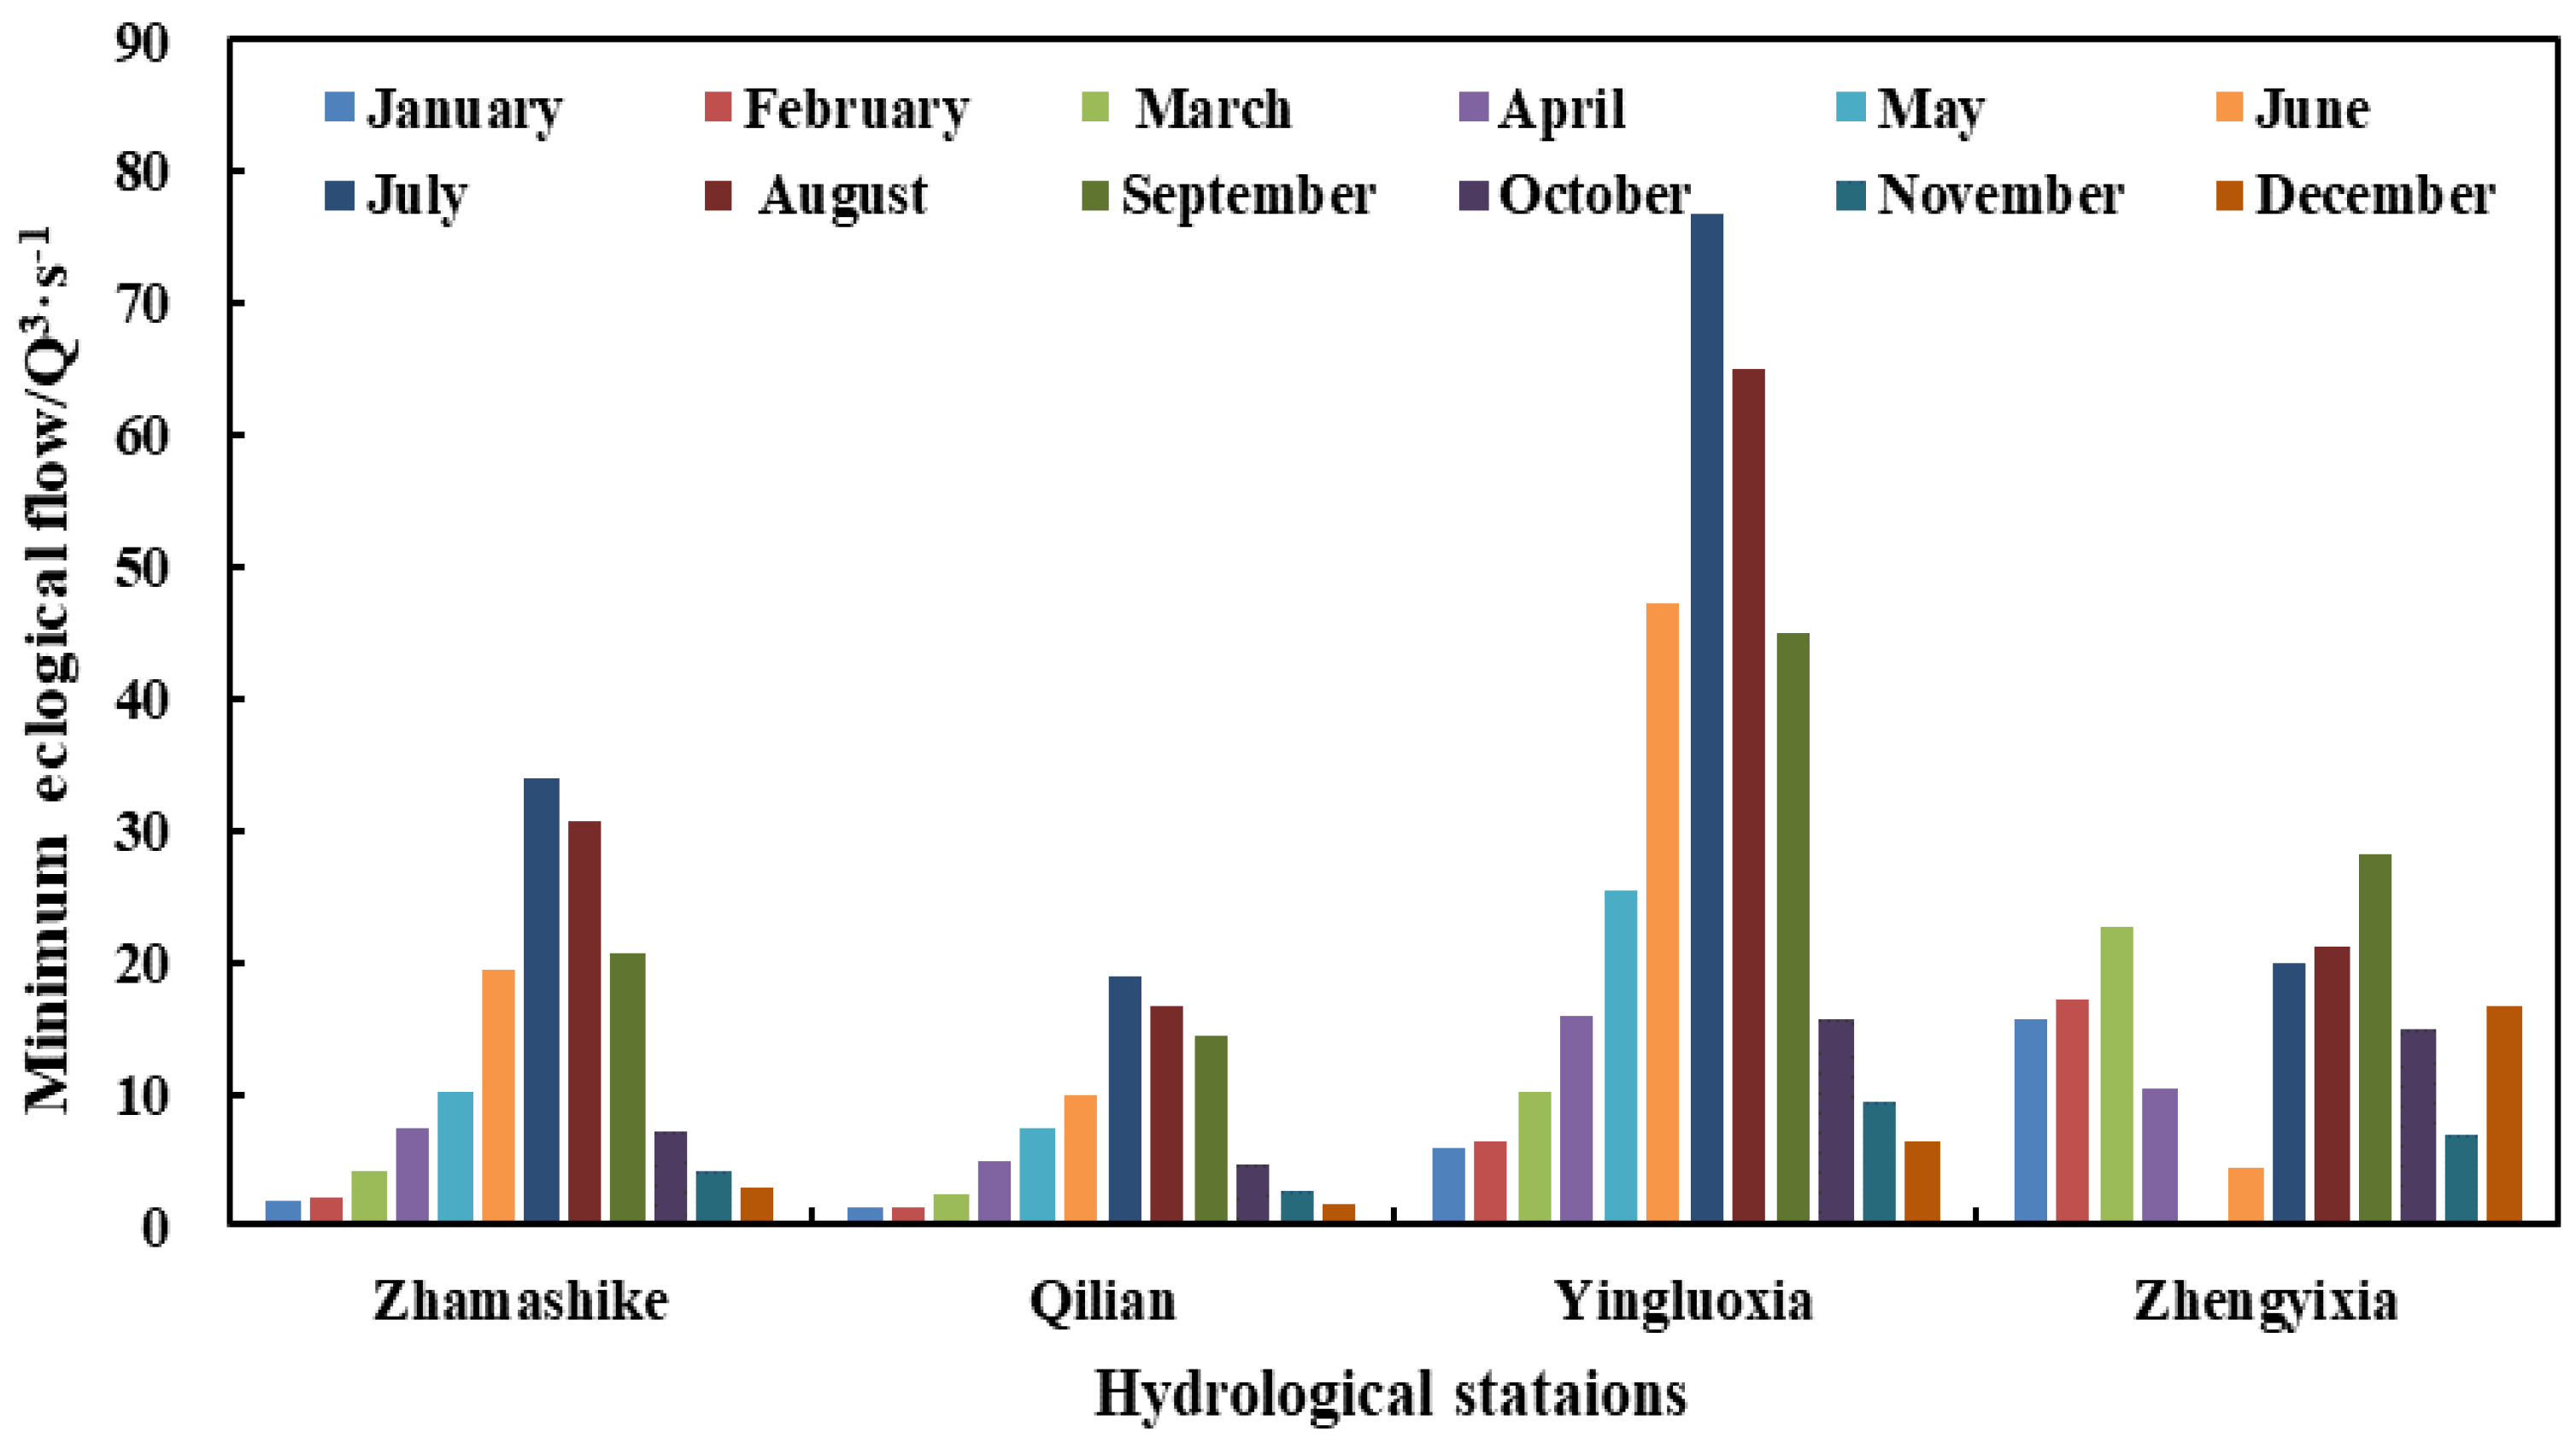
Figure 3 demonstrates the estimated minimum ecological flow process of four hydrological stations in the Hei River Basin based on the monthly minimum average flow method. It can be easily observed from Figure 3 that the minimum ecological flow of the upstream has an obvious changing process of first increasing and then decreasing. For the Zhamashike and Yingluoxia stations, the minimum ecological flow increases from January to July and decreases from August to December. Similarly, the minimum ecological flow at Qilian station increases from January to August and decreases from September to December. On the whole, the minimum ecological flow at Yingluoxia station is largest, ranging from 9.37 m3/s to 70.27 m3/s; next is Zhamashike station, ranging from 1.77 m3/s to 35.13 m3/s; the smallest is Qilian station, ranging from 2.43 m3/s to 17.27 m3/s.
However, for the midstream of the Hei River, the minimum ecological flow at the Zhengyixia station is totally different from that of the upstream. The maximum value of the minimum ecological flow at this station appears in January to March, while the minimum value appears in May and June, varying from 0.03 m3/s to 33.60 m3/s. This is because the midstream enters the spring irrigation peak from March to May, which coincides with the dry season of the Hei River Basin [35]. Since the runoff is very small, the flow cutoff occurs frequently. Therefore, the measured runoff of Zhengyixia is also small, resulting in a relatively small estimated minimum ecological flow.
4.2.2. Results of the Lyon Method
Figure 4 shows the calculated minimum ecological flow processes of the Hei River based on the Lyon method. It can be found in Figure 4 that the minimum ecological flow change process of the three hydrological stations in the upstream of the Hei River is consistent with the result calculated by the monthly minimum flow method, which increases first and then decreases. The minimum ecological flow increases from January to July and then decreases from August to December. The minimum ecological flows at these three hydrological stations in descending order of magnitude are: Yingluoxia station (ranging from 5.89 m3/s to 76.83 m3/s) > Zhamashike station (ranging from 1.91 m3/s to 33.93 m3/s) > Qilian station (ranging from 1.26 m3/s to 18.96 m3/s).
In contrast, changing of the minimum ecological flow at the Zhengyixia station in the midstream of the Hei River is still irregular. The lowest value of the minimum ecological flow at this station still appears in May, the peak of spring irrigation, and its value is 0.37 m3/s, which is consistent with the results of the monthly minimum average flow method. Moreover, the calculated minimum ecological flow in the remaining months is relatively large, varying from 4.38 m3/s to 28.15 m3/s.
4.2.3. Results of Average Flow in the Driest Month Method
According to the calculation formula of the average flow in the driest month method, the minimum ecological flow processes of the Hei River is computed and presented in Figure 5. It can be easily found in Figure 5 that the minimum ecological flow of the four hydrological stations estimated by this method is comprised of four different fixed values. Obviously, the minimum monthly ecological flow value of Zhengyixia station is the smallest with the value of 2.26 m3/s, followed by Qilian Station with the value of 3.04 m3/s. Next is the Zhamashike station with the value of 4.49 m3/s, and the largest is Yingluoxia station with the value of 13.06 m3/s.
4.3. Calculation of Suitable Ecological Flow
Suitable ecological flow refers to the most appropriate flow process that is favorable for maintaining the stability of the aquatic ecological environment. This paper employs the monthly frequency method to determine the suitable ecological flow of the upstream and midstream of the Hei River Basin and sets up three different scenarios with different stages and frequencies.
4.3.1. Results of Scenario 1
For scenario 1, June to September is the wet season, and its frequency is 90%; November to April of next year is the normal season, and its frequency is 70%; May and October belong to the dry season, and its frequency is 50%. Figure 6 presents the results of suitable ecological flow at the four stations of scenario 1. It is shown in Figure 6 that, similar to the minimum ecological flow, the suitable ecological flow is a dynamic process. Suitable ecological flow at the Zhamashike, Qilian, and Yingluoxia stations of the upstream increases from January to July, then decreases from August to December. Overall, the suitable ecological flow at Yingluoxia station is the largest, and the variation range is 13.72 m3/s to 82.78 m3/s. Next is that at Zhamashike station, ranging from 4.66 m3/s to 40.57 m3/s. The smallest suitable ecological flow is found at the Qilian station, varying from 3.09 m3/s to19.60 m3/s.
Similarly, the change process of the suitable ecological flow of the Zhengyixia station is different from those of the three upstream hydrological stations. The value is relatively larger in normal season; then it decreases and reaches the minimum in May in dry season, and then, it increases again with relatively larger flow in wet season. Overall, the suitable ecological flow of Zhengyixia station is the largest in the normal season, varying from 16.48 m3/s to 42.00 m3/s, followed by wet season, varying from 5.61 m3/s to 27.56 m3/s. For the dry season, the suitable ecological flow in May is only 0.07 m3/s, and it can reach 27.56 m3/s in October.
4.3.2. Results of Scenario 2
In scenario 2, the frequency of calculating the appropriate ecological flow is set according to different seasons, during which the frequency is 75% in spring and autumn, 50% in summer, and 80% in winter. The corresponding calculation results are shown in Figure 7.
It is found that for the three hydrological stations in the upstream, the calculated suitable ecological flow exhibits notable seasonal variation characteristics. The suitable ecological flow in four seasons in ascending order is: winter < spring < autumn < summer, which is consistent with the actual hydrological change process. Specifically, suitable ecological flow in the Zhamashike station varies from 3.23 m3/s to 57.56 m3/s. In the Qilian station, suitable ecological flow ranges from 2.71 m3/s to 30.76 m3/s. As before, the suitable ecological flow of the Yingluoxia station is still the largest, and the variation range is 11.95 m3/s to 121.27 m3/s.
As for the suitable ecological flow of Zhengyixia station in the middle reaches of the Hei River Basin, it decreases first, then increases, and then decreases and increases again, showing fluctuating, changing characteristics. In spring, the suitable ecological flow of Zhengyixia station varies from 0.07 m3/s to 37.45 m3/s. For the suitable ecological flow in summer, it changes from 6.61 m3/s to 43.35 m3/s, followed by autumn, in which it ranges from 10.22 m3/s to 25.33 m3/s. In winter, the suitable ecological flow of Zhengyixia station is the largest, varying from 34.36 m3/s to 37.84 m3/s.
4.3.3. Results of Scenario 3
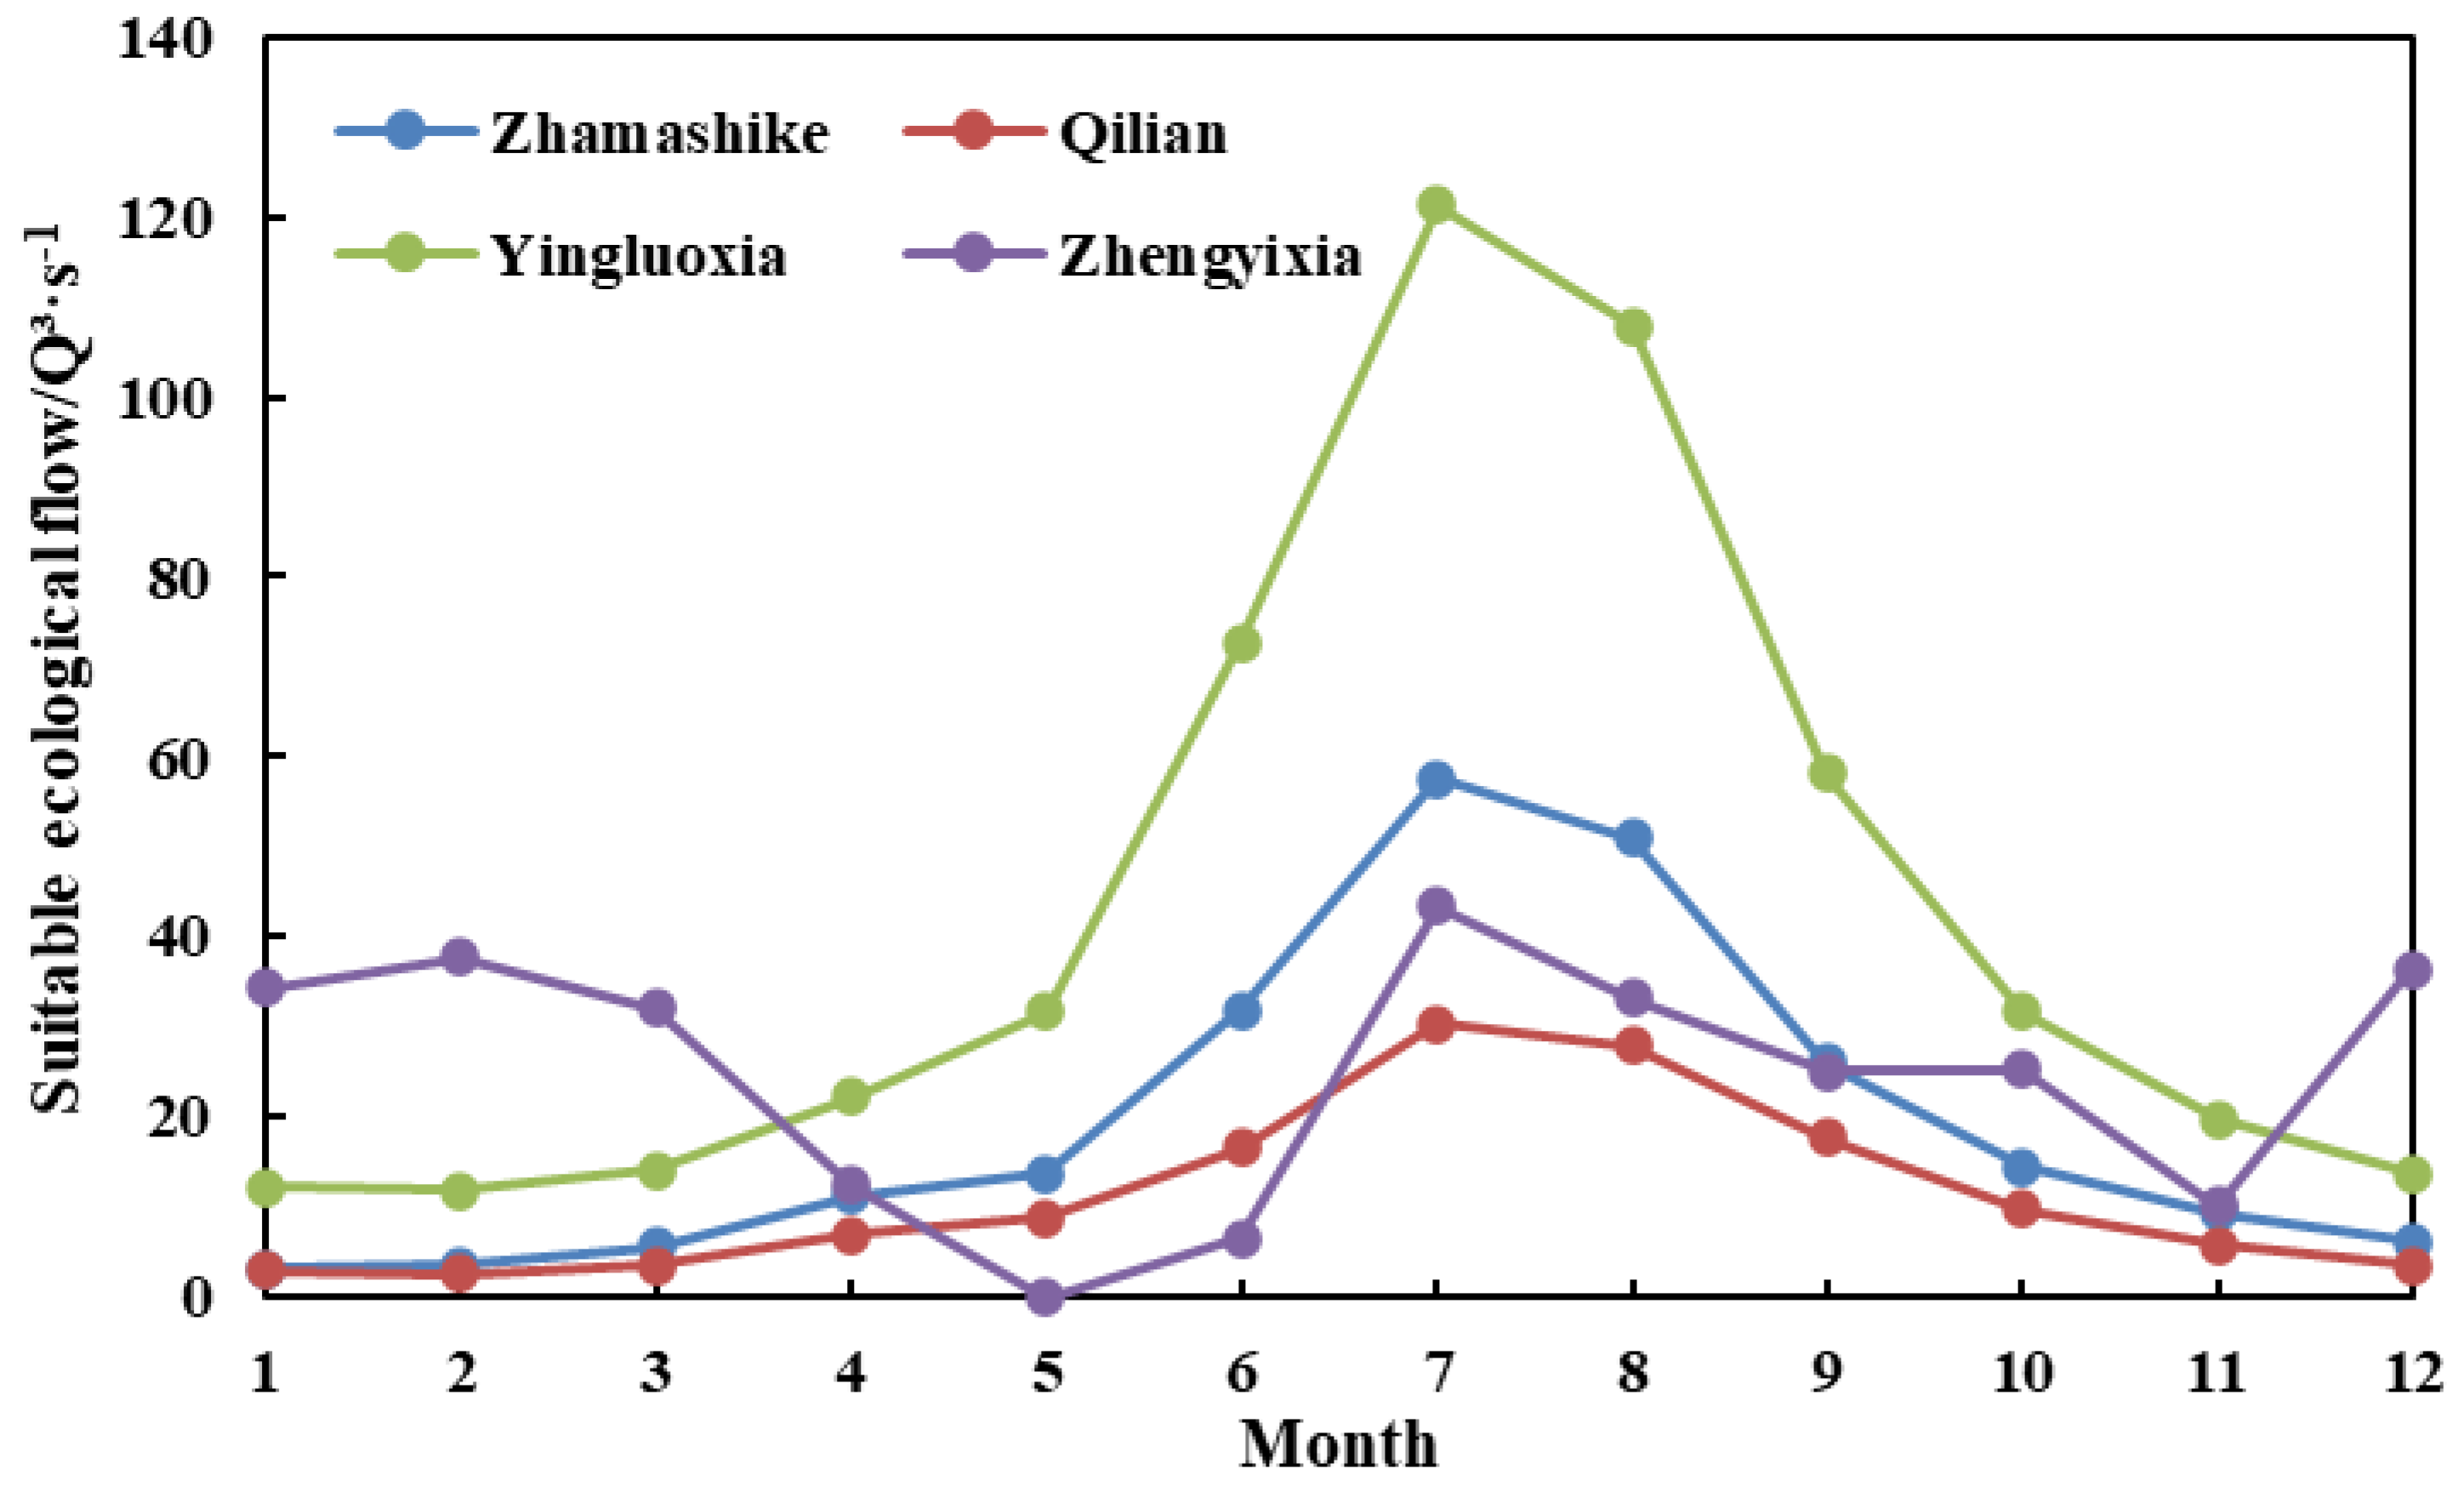
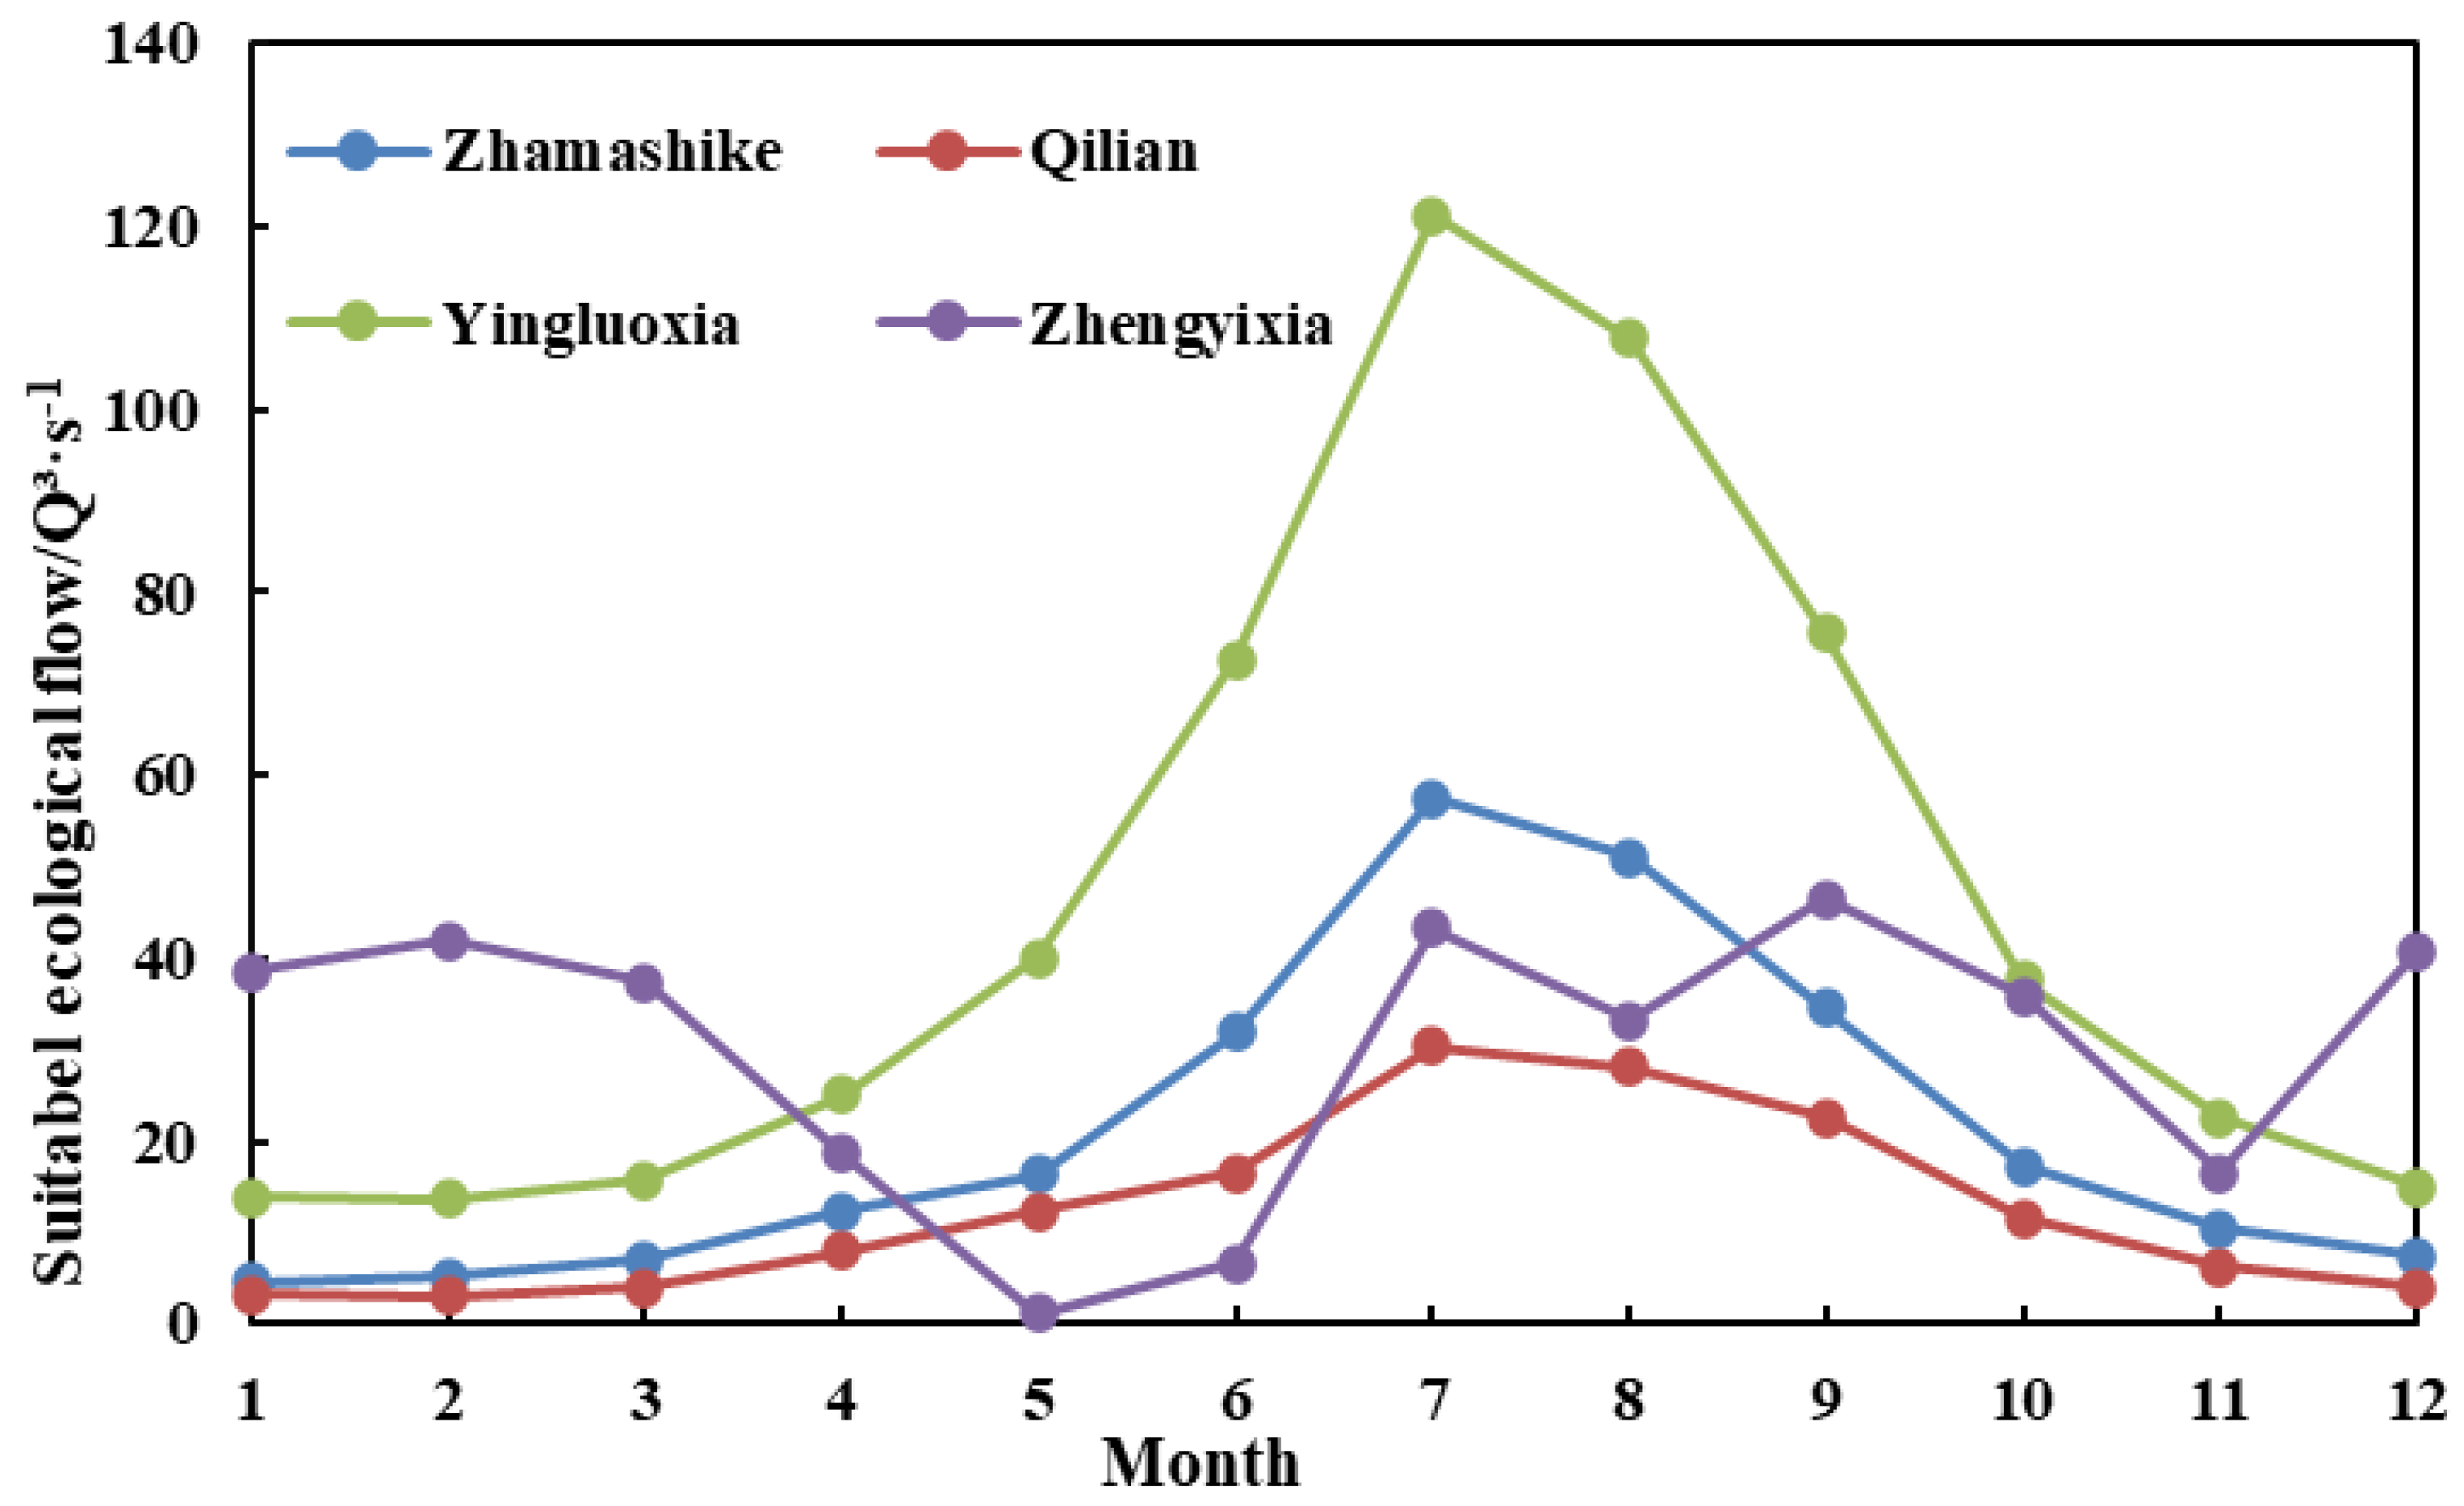
For scenario 3, the frequency is set to 50% for every month. Similarly, the suitable ecological flow of the three hydrological stations in the upper reaches of the Hei River shows an obvious intra-annual change process, increasing first and then decreasing. The largest suitable ecological flow occurs in July in the upstream. As before, the suitable ecological flow of Yingluoxia station is still the maximum among the three stations, changing from 11.95 m3/s to 121.27 m3/s. Next is the suitable ecological flow of the Zhamashike station, with a variation range from 3.23 m3/s to 57.56 m3/s. The suitable ecological flow of Qilian station remains the smallest at the upstream stations, ranging from 2.71 m3/s to 30.36 m3/s.
For the suitable ecological flow in the midstream of the basin, it still shows notable intra-year fluctuation, with smallest value occurring in May and the largest value in September. However, in this scenario, its minimum value is relatively large, and the overall changing range is 1.18 m3/s to 46.57 m3/s (Figure 8).
4.4. Discussion
4.4.1. Causes for Hydrological Variation
Generally speaking, climate change has influence on watershed runoff through obvious interannual variability characteristics under natural conditions. For example, it has been shown that global changes, sunspot activity, ENSO cycle, and subsurface changes all have influence on the variations of runoff in the Hei River [35]. However, with global warming and increasing human activities, especially the exploitation of water resources, the basin subsurface environment has been changed, leading to multi-timescale variability in the hydrological series. As a result, the runoff series of the basin shows nonstationary variation.
For inland river basins in arid areas, the climate factors affecting runoff are mainly precipitation, temperature, and evaporation. Hence, long-term trends of runoff, precipitation, temperature, and evaporation in the upstream are tested by the Mann–Kendall trend test method [32]. It shows that the runoff in the upstream has a significant increasing trend at the 95% significance level, and trend test values are 2.48, 2.80, and 3.65 at the Zhamashike station, Qilian station, and Yingluoxia station, respectively. The trend test values of precipitation, temperature, and evaporation in the upstream are 1.42, 2.65, and 2.39, respectively, which means climatic factors all show an upward trend, and the trend of temperature and evaporation is significant at the 95% significance level. The upstream precipitation mainly comes from glacial meltwater, snow meltwater, and mountain rainfall. Therefore, it can be inferred that climate warming has caused the continuous shrinkage of the Qilian Mountains glaciers in the upstream mountains and the continuous rise of the snow line, making the ice and snow melt and increasing the summer precipitation in the Qilian Mountains area. The effect of evaporation on the flow is actually an increase in the basin evapotranspiration exacerbated by the rise in temperature [36], which in turn leads to increasing runoff [37]. On the other hand, there is no large-scale water conservancy project in the upstream of the Hei River. Although the forest grassland in the Qilian Mountains has been seriously degraded owing to human activities in recent years, the impact of natural runoff is not significant. Thus, the runoff variation in the upper reaches of the Hei River is more affected by the climate change and less affected by human activities.
4.4.2. Evaluation and Comparison of Minimum Ecological Flow
The minimum ecological flow at four hydrological stations in the upstream and midstream of the Hei River Basin was obtained by using the monthly minimum ecological flow method, Lyon method, and the average flow in the driest month method. Affected by human spring irrigation activities, although the minimum ecological flow of Zhengyixia station in the middle reaches is low in May, the minimum ecological flow calculated by the three methods is basically consistent in magnitude and less than the average annual flow of each station, so the calculation results are basically reasonable and reliable. Furthermore, the results of monthly minimum ecological flow method and the Lyon method are closer and can better reflect the intra-annual changing characteristics of runoff.
In order to further evaluate and compare the results, the Tennant method [18,38,39] was adopted to analyze the calculation results. The Tennant method divides a year into two calculation periods, with April to September as the high-flow period and October to March as the low-flow period. The ecological flow for maintaining certain functions of the river is directly calculated based on the correspondence between the multi-year average flow percentage and the ecological condition in the river. This method is applicable to the Hei River since the division of water-use periods is basically the same as that of the Hei River. Table 1 shows the percentage of different flows in the river and the corresponding ecological environment state of the Tennant method. It can be found that the Tennant method classifies the recommended river flow into one high limit criterion, one optimal range standard, and six low limit conditions.
The evaluation results of the minimum ecological flow based on the Tennant method are shown in Table 2, demonstrating that the evaluation results of the average flow in the driest month method are the worst in the high-flow period and the best in low-flow period among the three calculation methods of minimum ecological flow for the three hydrological stations located in the upstream of the Hei River Basin. Moreover, the evaluation result of the monthly minimum average flow method period is worse than that of the Lyon method in the high-flow period, while it is better than that of the Lyon method in the low-flow period. In addition, for the Zhengyixia station in the midstream, the evaluation result of the Lyon method is better than that of the monthly minimum average flow method and average flow in the driest month method.
Overall, it is recommended to use the Lyon method to calculate the minimum ecological flow in the upper and midstream reaches of the Hei River considering the importance of the spawning and fattening period of naked carp in the basin for the ecological protection objectives of the basin.
4.4.3. Evaluation and Comparison of Suitable Ecological Flow
Three different scenarios with different periods and frequencies were set up in order to obtain the appropriate suitable ecological flow of the Hei River basin. In general, the suitable ecological flow process of each hydrological station in the upper reaches under three scenarios conforms to the law of hydrological rhythm change, while the suitable ecological flow of the hydrological station in the middle reaches is greatly affected by spring irrigation and varies irregularly in different scenarios.
Similarly, the results of the suitable ecological flow under the three scenarios were evaluated and compared with the Tennant method, as shown in Table 3. It can be seen from Table 3 that the assessment results of the appropriate ecological flow in the middle and upper reaches of the Hei River under the three scenarios are all good or above, and most of the results fall within the optimal range, indicating that the monthly frequency method is applicable for the Hei River Basin.
As far as the evaluation results are concerned, scenario 3 should be selected as the most appropriate one for ecological flow calculation for the Hei River Basin. However, this scenario is not economical enough, and the actual problem requires consideration of the combined benefits of power generation, flood control, tourism, and agricultural irrigation in the Hei River, which may not guarantee the high ecological water use as shown in scenario 3. On the contrary, the ecological water consumption of scenario 2 is much lower than that of scenarios 2 and 3 in the low-flow period, but it can still be maintained at optimum range level throughout the high-flow period, which is the most effective choice.
During the selection process of specific methods, it is generally agreed that water use in a year of partial abundance should not make the ecological flow of the river less than the suitable ecological flow process [40], while water use in a year of partial dryness should not make the ecological flow of the river less than the minimum ecological flow process. Therefore, it is suggested to schedule the ecological flow according to the calculation results of scenario 3 in relatively abundant years and refer to scenario 2 in normal years.
4.4.4. Methods Comparison and Ecological Flow Recommendation
The intra-annual distribution of runoff in the basin has changed due to the changing environment, and hydrological variability needs to be taken into account when calculating ecological flow. In this paper, the minimum and suitable ecological flow in the upper and middle reaches of the Hei River Basin were calculated on the basis of considering hydrological variability and then evaluated by the Tennant method. The results show that the minimum ecological flows are mostly within the good level, while the suitable ecological flows are mostly at the optimum range. Hence, the results can meet the ecological water demand requirements in the basin and can objectively reflect the runoff change law.
Among the three methods for calculating the minimum ecological flow, the monthly minimum average flow method is simple in principle and easy in calculation. It can basically reflect the annual variation of river runoff, but it is vulnerable to the influence of interannual extreme values. The Lyon method uses the median instead of the average annual flow to reduce the impact of extreme values on the calculation results, and the median value of monthly average flow of different proportions is adopted in different months of the year. The method is simple, but the recognition of the method needs to be improved. The average flow in the driest month method comprehensively considers the long-term dry months of runoff and is not affected by extreme values. However, in terms of the whole ecological flow process, it cannot reflect the intra-annual variation pattern of river runoff and does not necessarily meet the ecological water demand of the water ecosystem in the wet season.
As for the monthly frequency method for calculating the appropriate ecological flow, the calculation results largely depend on the selection of frequency. The advantage of this method is that it can reflect the intra-annual variation of runoff processes and has good spatial portability, which has been widely used in different study areas. However, the frequency chosen is highly dependent on experience and requires discussion of multiple scenarios and repeated argumentation.
Thus, the recommended ecological flow results of the basin are shown in Table 4 according to the results of comparison and discussion, which can provide reference for the development and utilization of water resources and ecological protection in the basin. It is particularly noteworthy that due to perennial spring irrigation, runoff of the Zhengyixia station is low or even cut off in May, resulting in irregular intra-annual variation of calculated ecological flow, especially in May. In order to maintain the midstream water ecological environment, it is recommended that the minimum ecological flow in May be adopted from the results in scenario 3, i.e., 1.18 m3/s, while the suitable ecological flow can be adopted from the average flow results of the driest month method, i.e., 2.26 m3/s.
In order to further explain the rationality of the recommended ecological flow, Table 5 shows the daily flows for various exceedance probability values [15] of these four stations. As can be seen from Table 5, the minimum ecological flows of these stations are within the exceedance probability of 0.99 except for the Zhengyixia station, which uses the suggested value. Moreover, the suitable ecological flows are within exceedance probability rang of 0.25 -0.01. Hence, the recommended ecological flows are reasonable.
5. Conclusions
In this study, the heuristic segmentation method was firstly used to investigate the variation points in the runoff series of the hydrological stations at the middle and upper reaches of the Hei River Basin, the second-largest inland river in China. Then, the ecological flow of the basin was calculated by different methods on the basis of the hydrological series before the variation points. Moreover, the results of the minimum and suitable ecological flow were evaluated and compared by the Tennant method. In addition, methods for computing ecological flow were also compared, and ecological flows for maintaining aquatic ecosystem were finally recommended. The key findings of this study are summarized below:
(1) Runoff in the upper reaches of the basin shows nonstationary characteristics with change points identified, while no change point is found in the midstream. Hydrological variation is more affected by the climate change and less affected by human activities since there are significant changing trends of meteorological factors and no large-scale water conservancy project in the upstream of the basin;
(2) The monthly minimum average flow method, the Lyon method, and the average flow in the driest month method for calculating the minimum ecological flow all have advantages and disadvantages. For the upstream, the minimum ecological flow at Yingluoxia station is the largest, followed by the Zhamashike station, and the smallest is Qilian station. For the midstream, the minimum ecological flow varies irregularly due to spring irrigation peak from March to May, which coincides with the dry season in the Hei River Basin;
(3) The results of monthly minimum ecological flow method and the Lyon method are closer and can better reflect the intra-annual changing characteristics of runoff. Evaluation results of the minimum ecological flow are mostly within good level or above. In general, it is suggested to use the Lyon method to calculate the minimum ecological flow considering the importance of the spawning and fattening period of naked carp in the basin for the ecological protection objectives of the Hei River;
(4) Three scenarios with different periods and frequencies were set up to obtain suitable ecological flow. Similarly, the suitable ecological flow process of the upstream conforms to the law of hydrological rhythm, while that of the midstream changes irregularly under different scenarios owing to spring irrigation. Evaluation results indicate the suitable ecological flows are mostly at the optimum range. Among them, scenario 3 (with 50% frequency for each month) has the best ecological benefits, and scenario 2 (75% frequency in spring and autumn, 50% frequency in summer, and 80% frequency in winter) has the best comprehensive benefits;
(5) After comparison and argumentation, the ecological flows are recommended for the Hei River Basin. The corresponding minimum ecological flow variation ranges within the year for Zhamashike, Qilian, Yingluoxia, and Zhengyixia are 1.91–33.93 m3/s, 1.26–18.96 m3/s, 5.89–76.83 m3/s, and 1.18–28.15 m3/s, respectively; and their suitable ecological flow variation ranges are 3.23–57.56 m3/s, 2.71–30.36 m3/s, 11.95–121.27 m3/s, and 2.26–43.35 m3/s, respectively. This study can provide scientific reference for local water resources management.
Author Contributions
Conceptualization, S.L. and Y.X.; methodology, S.L.; software, Q.Z.; validation, S.L., Y.X. and H.D.; formal analysis, H.D.; investigation, Y.X.; resources, S.L.; data curation, H.D. and P.X.; writing—original draft preparation, S.L.; writing—review and editing, Y.X.; visualization, Q.Z.; supervision, Y.X.; project administration, Y.X.; funding acquisition, S.L. and Y.X. All authors have read and agreed to the published version of the manuscript.
Funding
This research was funded by the National Natural Science Foundation of China (Grant No. 52009116), Natural Science Foundation of Jiangsu Province (Grant No. BK20200958; and Grant No. BK20200959), and China Postdoctoral Science Foundation (Grant No. 2018 M642338).
Data Availability Statement
The data presented in this study are available on request from the corresponding author. The processed data are not publicly available. as the data also form part of an ongoing study.
Conflicts of Interest
The authors declare no conflict of interest.
References
- Xu, Z.; Wu, W.; Yu, S. Ecological baseflow: Progress and challenge. J. Hydroelectr. Eng. 2016, 35, 1–11. [Google Scholar]
- Gao, J.; Gao, Y.; Zhao, G.; Hörmann, G. Minimum ecological water depth of a typical stream in Taihu Lake Basin, China. Quat. Int. 2010, 226, 136–142. [Google Scholar] [CrossRef]
- Huang, S.; Chang, J.; Huang, Q.; Wang, Y.; Chen, Y. Calculation of the instream ecological flow of the Wei River based on hydrological variation. J. Appl. Math. 2014, 2014, 127067. [Google Scholar] [CrossRef]
- Wei, N.; Xie, J.; Lu, K.; He, S.; Gao, Y.; Yang, F. Dynamic simulation of ecological flow based on the variable interval analysis method. Sustainability 2022, 14, 7988. [Google Scholar] [CrossRef]
- Guan, X.; Zhang, Y.; Meng, Y.; Liu, Y.; Yan, D. Study on the theories and methods of ecological flow guarantee rate index under different time scales. Sci. Total Environ. 2021, 771, 145378. [Google Scholar] [CrossRef]
- Zhang, J.Y.; Wang, X.H.; Yang, Q.; Zhu, D.S.; Liao, W.G.; Shi, X.X. Study on safeguard measures of ecological water demand for major rivers and lakes in China. China Water Resour. 2017, 15, 8–11. [Google Scholar]
- Su, X.; Kang, S. Concept of ecological water requirement and its estimation method. Adv. Water Sci. 2003, 1, 740–744. [Google Scholar]
- Xia, J.; Zheng, D.; Liu, Q. Discussion on some problems of estimating eco-environmental water demand in northwest China. J. China Hydrol. 2002, 22, 12–16. [Google Scholar]
- Chen, M.; Feng, H.; Wang, L.; Chen, Q. Calculation method for appropriate ecological flow. Adv. Water Sci. 2007, 18, 745–750. [Google Scholar]
- Yang, Z.; Cui, B.; Liu, J. Estimation methods of eco-environmental water requirements: Case study. Sci. China Ser. Earth Sci. 2005, 48, 1280–1292. [Google Scholar] [CrossRef]
- Akter, A.; Tanim, A.H. A modeling approach to establish environmental flow threshold in ungauged semidiurnal tidal river. J. Hydrol. 2018, 558, 442–459. [Google Scholar] [CrossRef]
- Jia, W.; Dong, Z.; Duan, C.; Ni, X.; Zhu, Z. Ecological reservoir operation based on DFM and improved PA-DDS algorithm: A case study in Jinsha river, China. Hum. Ecol. Risk Assess. 2020, 26, 1723–1741. [Google Scholar] [CrossRef]
- Tharme, R.E. A global perspective on environmental flow assessment: Emerging trends in the development and application of environmental flow methodologies for rivers. River Res. Appl. 2003, 19, 397–441. [Google Scholar] [CrossRef]
- Karakoyun, Y.; Donmez, A.H.; Yumurtaci, Z. Comparison of environmental flow assessment methods with a case study on a runoff river–type hydropower plant using hydrological methods. Environ. Monit. Assess. 2018, 190, 722. [Google Scholar] [CrossRef] [PubMed]
- Efstratiadis, A.; Tegos, A.; Varveris, A.; Koutsoyiannis, D. Assessment of environmental flows under limited data availability: Case study of the Acheloos River, Greece. Hydrol. Sci. J. 2014, 59, 731–750. [Google Scholar] [CrossRef]
- Tharme, R. Review of International Methodologies for the Quantification of the Instream Flow Requirements of Rivers; Water Law Review Final Report for Policy Development; Department of Water Affairs and Forestry, Freshwater Research Unit, University of Cape Town: Cape Town, South Africa, 1996. [Google Scholar]
- Su, H.; Xu, Z.X.; Li, P.; Ye, C.L.; Wang, J.J. Estimation of ecological baseflow with several hydrological methods at the Dahuangjiangkou reach of the Xijiang River. J. Beijing Norm. Univ. 2022, 58, 269–276. [Google Scholar]
- Dunbar, M.J.; Gustard, A.; Acreman, M.C.; Elliott, C.R.N. Review of Overseas Approaches to Setting River Flow Objectives; Environment Agency R&D Technical Report W6B (96)4; Institute of Hydrology: Wallingford, UK, 1998. [Google Scholar]
- Tennant, D.L. Instream Flow Regimens for Fish, Wildlife, Recreation and Related Environmental Resources. Fisheries 1976, 1, 6–10. [Google Scholar] [CrossRef]
- Matthews, R.C.; Bao, Y.X. The Texas method of preliminary instream flow assessment. Rivers 1991, 2, 295–310. [Google Scholar]
- Stalnaker, C.B.; Arnette, S.C. Methodologies for the Determination of Stream Resource Flow Requirements: An Assessment; US Fish and Wildlife Services, Office of Biological Services Western Water Association: Washington, DC, USA, 1976. [Google Scholar]
- Bovee, K.D. A Guide to Stream Habitat Analysis Using the Instream Flow Incremental Methodology; Instream Flow Information Paper 12. FWS/OBS-82/26; USDI Fish and Wildlife Services, Office of Biology Services: Washington, DC, USA, 1982; 248p. [Google Scholar]
- Yu, L.; Xia, Z.; Du, X. Connotation of minimum ecological runoff and its calculation method. J. Hohai Univ. 2004, 32, 18–22. [Google Scholar]
- Opdyke, D.R.; Oborny, E.L.; Vaugh, S.K.; Mayes, K.B. Texas environmental flow standards and the hydrology- based environmental flow regime methodology. Hydrol. Sci. J. 2014, 59, 820–830. [Google Scholar] [CrossRef]
- Richter, B.D.; Baumgartner, J.V.; Powell, J.; Braun, D.P. A Method for Assessing Hydrologic Alteration within Ecosystems. Conserv. Biol. 1996, 10, 1163–1174. [Google Scholar] [CrossRef]
- Milly, P.C.; Betancourt, J.; Falkenmark, M.; Hirsch, R.M.; Kundzewicz, Z.W.; Lettenmaier, D.P.; Stouffer, R.J. Climate change-Stationarity is dead: Whither water management? Science 2008, 319, 573–574. [Google Scholar] [CrossRef] [PubMed]
- Liu, J.; Zhang, Q.; Gu, X. Evaluation of ecological flow with considerations of hydrological alterations in the Poyang Lake basin. Acta Ecol. Sin. 2015, 35, 5477–5485. [Google Scholar]
- Cheng, G.; Li, X.; Zhao, W.; Xu, Z.; Feng, Q.; Xiao, S.; Xiao, H. Integrated study of the water-ecosystem-economy in the Heihe River Basin. Natl. Sci. Rev. 2014, 1, 413–428. [Google Scholar] [CrossRef]
- Li, X.; Cheng, G.; Ge, Y.; Li, H.; Han, F.; Hu, X.; Tian, W.; Tian, Y.; Pan, X.; Nian, Y.; et al. Hydrological cycle in the Heihe River Basin and its implication for water resource management in endorheic basins. J. Geophys. Res. Atmos. 2018, 123, 890–914. [Google Scholar] [CrossRef]
- Si, J.; Feng, Q.; Yu, T.; Zhao, C. Inland River terminal lake preservation: Determining basin scale and the ecological water requirement. Environ. Earth Sci. 2015, 73, 3327–3334. [Google Scholar] [CrossRef]
- Song, Z.; Wu, Y.; Zhang, C. Accounting and Analysis of Ecological Water Demand in the Black River Basin of Gansu Province. Ground Water 2020, 42, 201–203. [Google Scholar] [CrossRef]
- Liu, S.; Huang, S.; Huang, Q.; Xie, Y.; Leng, G.; Luan, J.; Song, X.; Wei, X.; Li, X. Identification of the non-stationarity of extreme precipitation events and correlations with large-scale ocean-atmospheric circulation patterns: A case study in the Wei River Basin, China. J. Hydrol. 2017, 548, 184–195. [Google Scholar] [CrossRef]
- Zhang, Q.; Cui, Y.; Chen, Y. Evaluation of ecological instream flow of the Pearl River basin, south China. Ecol. Environ. Sci. 2010, 19, 1828–1837. [Google Scholar]
- Zhang, Z.; Jin, Y.; Li, K.; Li, Y.; He, F. RVA method-based study on river ecological baseflow hydrograph. Water Resour. Hydropower Eng. 2017, 48, 155–160. [Google Scholar]
- Liu, S.; Xie, Y.; Huang, Q.; Jiang, X.; Li, X. Method of partitioning water year, wet season and dry season of river basin. J. China Hydrol. 2017, 37, 49–53. [Google Scholar]
- Ma, N.; Zhang, Y. Increasing Tibetan Plateau terrestrial evapotranspiration primarily driven by precipitation. Agric. For. Meteorol. 2022, 317, 108887. [Google Scholar] [CrossRef]
- Yang, M.; Zhang, B. The study on affecting factors of runoff changes at Yingluoxia Station of Heihe River. Prog. Geogr. 2010, 29, 166–172. [Google Scholar]
- Li, Q.X.; Guo, S.L.; Deng, L.L. Calculation and Evaluation of Minimum and Suitable Ecological Flows of Qingjiang River. J. China Hydrol. 2021, 41, 14–19. [Google Scholar]
- Wu, L.; Bai, T.; Huang, Q. Calculation and Application of Ecological Water Demand in Rivers based on RVA Threshold Interval Integration. Water Resour. Prot. 2022, 38, 1–13. [Google Scholar]
- Tegos, A.; Schlüter, W.; Gibbons, N.; Katselis, Y.; Efstratiadis, A. Assessment of Environmental Flows from Complexity to Parsimony—Lessons from Lesotho. Water 2018, 10, 1293. [Google Scholar] [CrossRef]
Figure 1.
Location of the Hei River and hydrological station in Hei River Basin.

Figure 2.
Segmentations and change points of annual runoff from the upper reaches to the middle reaches: (a) Zhamashike station; (b) Qilian station; (c) Yingluoxia station; and (d) Zhengyixia station.
Figure 2.
Segmentations and change points of annual runoff from the upper reaches to the middle reaches: (a) Zhamashike station; (b) Qilian station; (c) Yingluoxia station; and (d) Zhengyixia station.


Figure 3.
The calculated minimum ecological flow processes of the Hei River by the monthly minimum average flow method.
Figure 3.
The calculated minimum ecological flow processes of the Hei River by the monthly minimum average flow method.

Figure 4.
The calculated minimum ecological flow processes of the Hei River by the Lyon method.

Figure 5.
The calculated minimum ecological flow processes of Hei River by the average flow in the driest month method.
Figure 5.
The calculated minimum ecological flow processes of Hei River by the average flow in the driest month method.

Figure 6.
The suitable ecological flow at four stations of scenario 1.

Figure 7.
The suitable ecological flow at four stations of scenario 2.

Figure 8.
The suitable ecological flow at four stations of scenario 3.


Table 1.
Ecological flow standard of Tennant method.
| Description of Flows | High-Flow Period (%) | Low-Flow Period (%) |
|---|---|---|
| Flushing or maximum | 200 | 200 |
| Optimum range | 60–100 | 60–100 |
| Outstanding | 40 | 40 |
| Excellent | 30 | 30 |
| Good | 20 | 20 |
| Fair or degrading | 10 | 10 |
| Poor or minimum | 10 | 10 |
| Severe degradation | 0–10 | 0–10 |
Table 2.
Evaluation of minimum ecological flow based on the Tennant method.
| Hydrological Station | Computing Methods | High-Flow Period | Low-Flow Period | ||
|---|---|---|---|---|---|
| Percentage of Multi-Year Average Flow (%) | Evaluation Results | Percentage of Multi-Year Average Flow (%) | Evaluation Results | ||
| Zhamashike | Monthly minimum average flow method | 53.31 | Outstanding | 49.34 | Outstanding |
| Lyon method | 56.35 | Outstanding | 42.51 | Outstanding | |
| Average flow in the driest month method | 16.86 | Fair or degrading | 60.85 | Optimum range | |
| Qilian | Monthly minimum average flow method | 53.37 | Outstanding | 72.45 | Optimum range |
| Lyon method | 57.03 | Outstanding | 42.96 | Outstanding | |
| Average flow in the driest month method | 18.04 | Fair or degrading | 68.31 | Optimum range | |
| Yingluoxia | Monthly minimum average flow method | 50.53 | Outstanding | 65.88 | Optimum range |
| Lyon method | 58.93 | Outstanding | 45.44 | Outstanding | |
| Average flow in the driest month method | 22.59 | Good | 73.73 | Optimum range | |
| Zhengyixia | Monthly minimum average flow method | 5.49 | Severe degradation | 49.18 | Outstanding |
| Lyon method | 39.99 | Excellent | 44.00 | Outstanding | |
| Average flow in the driest month method | 14.69 | Fair or degrading | 7.06 | Severe degradation | |
Table 3.
Evaluation of suitable ecological flow based on the Tennant method.
| Hydrological Station | Scenarios | High-Flow Period | Low-Flow Period | ||
|---|---|---|---|---|---|
| Percentage of Multi-Year Average Flow (%) | Evaluation Results | Percentage of Multi-Year Average Flow (%) | Evaluation Results | ||
| Zhamashike | Scenario 1 | 73.53 | Optimum range | 94.79 | Optimum range |
| Scenario 2 | 86.24 | Optimum range | 77.06 | Optimum range | |
| Scenario 3 | 93.88 | Optimum range | 96.82 | Optimum range | |
| Qilian | Scenario 1 | 71.26 | Optimum range | 95.84 | Optimum range |
| Scenario 2 | 84.78 | Optimum range | 86.87 | Optimum range | |
| Scenario 3 | 94.35 | Optimum range | 97.77 | Optimum range | |
| Yingluoxia | Scenario 1 | 69.83 | Optimum range | 95.70 | Optimum range |
| Scenario 2 | 85.69 | Optimum range | 86.08 | Optimum range | |
| Scenario 3 | 94.26 | Optimum range | 97.71 | Optimum range | |
| Zhengyixia | Scenario 1 | 28.05 | Good | 95.84 | Optimum range |
| Scenario 2 | 56.10 | Outstanding | 81.07 | Optimum range | |
| Scenario 3 | 71.96 | Optimum range | 99.54 | Optimum range | |
Table 4.
Recommended ecological flow for the Hei River Basin. Unit: m3/s.
| Month | Minimum Ecological Flow | Suitable Ecological Flow | ||||||
|---|---|---|---|---|---|---|---|---|
| Zhamashike | Qilian | Yingluoxia | Zhengyixia | Zhamashike | Qilian | Yingluoxia | Zhengyixia | |
| January | 1.91 | 1.32 | 5.89 | 15.67 | 3.23 | 2.91 | 12.22 | 34.36 |
| February | 2.12 | 1.26 | 6.28 | 17.11 | 3.66 | 2.71 | 11.95 | 37.84 |
| March | 4.22 | 2.42 | 10.15 | 22.64 | 5.62 | 3.53 | 14.11 | 32.11 |
| April | 7.43 | 4.78 | 15.78 | 10.26 | 11.25 | 7.02 | 22.26 | 12.52 |
| May | 10.07 | 7.26 | 25.51 | 1.18 | 13.75 | 8.88 | 31.65 | 2.26 |
| June | 19.34 | 9.77 | 47.20 | 4.38 | 31.97 | 16.57 | 72.64 | 6.61 |
| July | 33.93 | 18.96 | 76.83 | 19.96 | 57.56 | 30.36 | 121.27 | 43.35 |
| August | 30.59 | 16.56 | 65.15 | 21.11 | 51.02 | 28.00 | 107.83 | 33.16 |
| September | 20.57 | 14.40 | 45.04 | 28.15 | 26.12 | 17.79 | 58.25 | 25.1 |
| October | 7.09 | 4.67 | 15.64 | 14.83 | 14.51 | 9.79 | 31.73 | 25.33 |
| November | 4.23 | 2.54 | 9.46 | 6.82 | 9.5 | 5.78 | 19.86 | 10.22 |
| December | 2.97 | 1.64 | 6.39 | 16.69 | 6.21 | 3.65 | 13.74 | 36.53 |
Table 5.
Daily flows for various exceedance probability values. Unit: m3/s.
| Exceedance Probability | Zhamashike | Qilian | Yingluoxia | Zhengyixia |
|---|---|---|---|---|
| 0.99 | 2.38 | 2.46 | 10.87 | 0.10 |
| 0.95 | 3.84 | 2.94 | 12.30 | 0.93 |
| 0.75 | 7.56 | 4.07 | 16.16 | 16.02 |
| 0.50 | 13.63 | 8.82 | 29.00 | 33.20 |
| 0.25 | 32.45 | 19.00 | 73.88 | 43.27 |
| 0.01 | 83.97 | 47.47 | 185.90 | 128.40 |
Disclaimer/Publisher’s Note: The statements, opinions and data contained in all publications are solely those of the individual author(s) and contributor(s) and not of MDPI and/or the editor(s). MDPI and/or the editor(s) disclaim responsibility for any injury to people or property resulting from any ideas, methods, instructions or products referred to in the content. |
© 2023 by the authors. Licensee MDPI, Basel, Switzerland. This article is an open access article distributed under the terms and conditions of the Creative Commons Attribution (CC BY) license (https://creativecommons.org/licenses/by/4.0/).
Share and Cite
MDPI and ACS Style
Liu, S.; Zhang, Q.; Xie, Y.; Xu, P.; Du, H. Evaluation of Minimum and Suitable Ecological Flows of an Inland Basin in China Considering Hydrological Variation. Water 2023, 15, 649. https://doi.org/10.3390/w15040649
AMA Style
Liu S, Zhang Q, Xie Y, Xu P, Du H. Evaluation of Minimum and Suitable Ecological Flows of an Inland Basin in China Considering Hydrological Variation. Water. 2023; 15(4):649. https://doi.org/10.3390/w15040649
Chicago/Turabian StyleLiu, Saiyan, Qin Zhang, Yangyang Xie, Pengcheng Xu, and Huihua Du. 2023. "Evaluation of Minimum and Suitable Ecological Flows of an Inland Basin in China Considering Hydrological Variation" Water 15, no. 4: 649. https://doi.org/10.3390/w15040649
Note that from the first issue of 2016, this journal uses article numbers instead of page numbers. See further details here.