
Spatial Distribution and Sources of Rare Earth Elements in Urban River Water: The Indicators of Anthropogenic Inputs

Institute of Earth Sciences, China University of Geosciences, Beijing 100083, China
*
Author to whom correspondence should be addressed.
Water 2023, 15(4), 654; https://doi.org/10.3390/w15040654
Submission received: 3 January 2023
/
Revised: 28 January 2023
/
Accepted: 6 February 2023
/
Published: 8 February 2023
(This article belongs to the Special Issue Environmental Effects of Natural Processes and Human Activities on the Water Environment in Watershed)
Abstract
:Rare earth element (REE) concentrations in river water reflect both local geological background and the intensity of anthropogenic activities. The increasing demand for high-tech applications is accompanied by an increase in REEs in water environments, especially in urban regions. Therefore, the dissolved REEs in a typical urban river (Yongding River) were analyzed to reveal the influence of anthropogenic inputs. It was found that the sum of dissolved REE (ΣREE) concentrations in river water were 6.27~86.26 ng L−1 (mean 31.05 ng L−1). The spatial distribution of REEs is significantly affected by both natural processes and human activities. To eliminate the effect of upstream land use on downstream measurements, this study established a 500 m buffer zone alongside the river and identified the anthropogenic origin of REEs through correlations among land use proportions within the buffer zone, the population density, and REEs. The Post-Archean Australian Shale (PAAS)-normalized REEs revealed pronouncedly positive Gd anomalies in the range 0.30~20.16 in all river samples. Spearman correlation analysis indicated that the proportion of cultivated land was positively correlated with most of the REEs. A three-dimensional tracer system was established via Gdanth, NO3−/Na+ and Cl−/Na+ to characterize the impact of sewage treatment plants, hospitals and agricultural activities on river water. The results indicate that with the acceleration of urbanization, abnormal REEs can be considered as a sensitive indicator to assess the influence of anthropogenic activities on water ecosystems.
1. Introduction
Rare earth elements (REEs) generally comprise fifteen Lanthanide elements from Lanthanum (La) to Lutetium (Lu) [1] and Scandium (Sc) and Yttrium (Y) [2,3,4]. This group of elements exhibit similar chemical properties and geochemical behaviors [3,5,6]; however, Cerium (Ce) and Europium (Eu) are two particular elements which can stably exist under certain environmental conditions at the valence of +4 and +2, respectively [2,7,8,9]. REEs enter the water, soil and sediments mostly via denudation (a geological process eroding the land’s surface via moving water, wind, ice, and waves), transportation, weathering, and deposition of hydrocarbon-source rocks [10,11,12]. In addition, REEs are also regarded as key technology elements that are widely applied in electric vehicle engines, catalytic converters, agriculture, biomedicine, and other modern industrial fields [13,14,15]. Therefore, the worldwide demand for REEs has grown rapidly in the past decade [16,17], resulting in increasing amounts of REEs being released to the environment [18,19].
The REEs released into the environment are ecologically toxic. They can further accumulate in the food chain and be absorbed by the human body through food intake. Therefore, long-term exposure/ingestion of low-dose REEs may have adverse effects on the metabolic processes of the human body [20]. For example, excessive REEs consumption could cause abnormal biochemical indications in the blood and lead to the elevation of cholesterol [21]. In addition, recent works have revealed that some Gd chelates decomposed in vivo are enriched in tissues, bones and the human brain [22,23]. Song et al. (2017) reported positive anomalies of Gd associated with anthropogenic origins and slightly positive anomalies of La and Sm from point source pollution in the Han River, South Korea [24]. It is likely that excessive human-derived REEs alter the original REEs distribution pattern in aquatic ecosystems, leading to harmful consequences [25,26]. For instance, Gd can bioaccumulate in freshwater bivalve tissues and trigger a brief biochemical reaction [27]. In addition, Gadoteric acid is a medical MRI contrast agent. Although it does not cause lethal effects at an exposure level of around 200 mg/L, Gd may inhibit the growth zebrafish cell lines at levels as low as 20 ng/L [28]. Bispo et al. (2021) observed the REE concentrations of topsoils in Brazil and found that the divergence of REEs content in cultivated soil resulted from the variation of land use and agricultural inputs such as phosphate fertilizer [29]. The variability in soil REE concentration is influenced by parent material, land use, pedogenic processes and biomes [29]. In addition, cultivated soils could potentially be polluted by REE via the input of phosphate fertilizers. Phosphate rock is the raw material for the manufacture of phosphate fertilizers and are widely applied as a source of phosphorus [30]. Phosphates naturally contain REEs, and thus may be of great concern for environmental contamination [31]. Liu et al. (2022) also reported the degree of REE anomalies in 13 artificial lakes and the relationships between artificial REE concentrations in lakes and the surrounding environment. They accurately characterized the impact of sewage treatment plants, hospitals, factories and agriculture on lakes [32]. Therefore, a detailed investigation on anthropogenic-derived REEs is rather urgent to protect the human health of local residents.
Tianjin and Beijing are two famous mega cities in north China with a total of more than 30 million residents [33]. By 2020, the permanent population had reached 18.33 million, including an urban population of 14.81 million (accounting for 80.80%) and a rural population of 3.65 million (19.91%). However, the study area is a typical low-flow urban river with poor capacity for self-purification [34]. Although recently restoration measures have been undertaken in river ecosystems by the Chinese government [35], the water quality of the study region is still far from satisfactory due to inadequate investigation of urban water pollution and a tremendous quantity of point/non-point pollution sources [36]. Therefore, the mixed toxicity of various REEs and the water quality in this typical urban river are still unclear at present and require more attention. This study collected 17 water samples in the Yongding River and analyzed the geochemical characteristics of dissolved REEs. The main aims of the study are to (1) determine the variation in and spatial distribution of REE content in the Yongding River, (2) identify the influence of population, land use, hospitals and other factors on the abnormal concentration of REEs, and (3) track the pollution sources in this typical urban river via REEs and hydro-chemical indicators.
2. Materials and Methods
2.1. Study Area
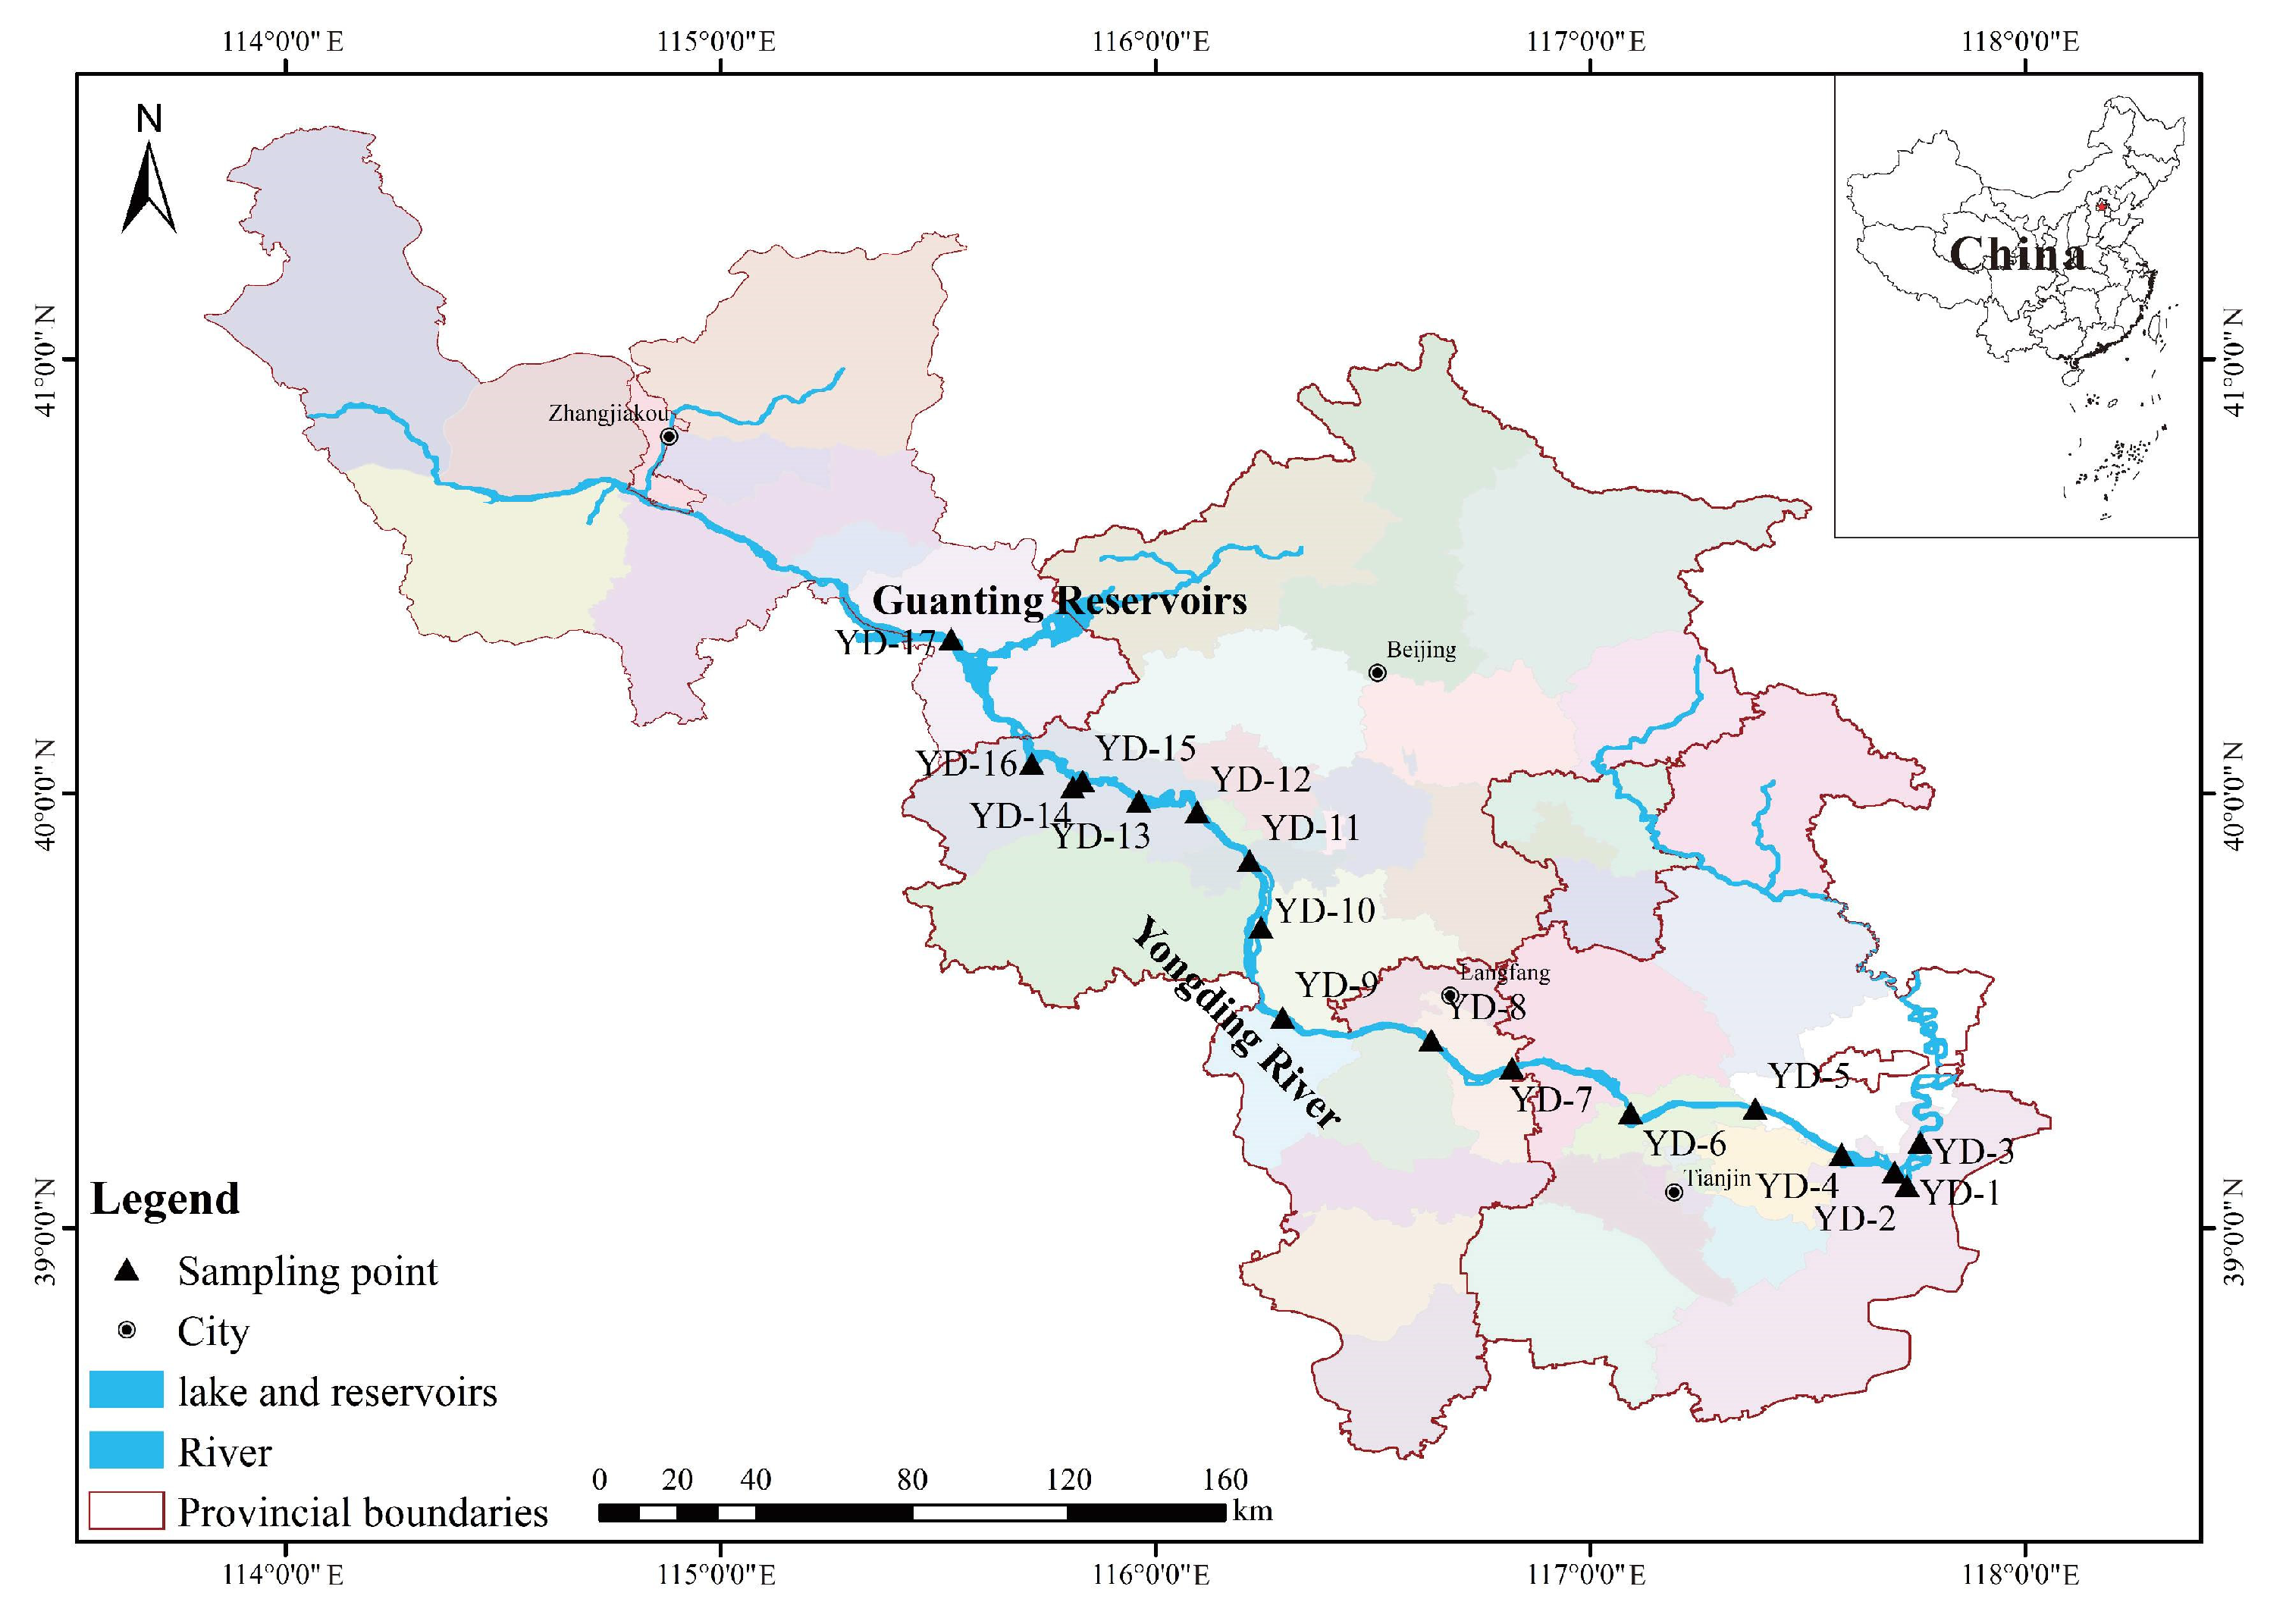
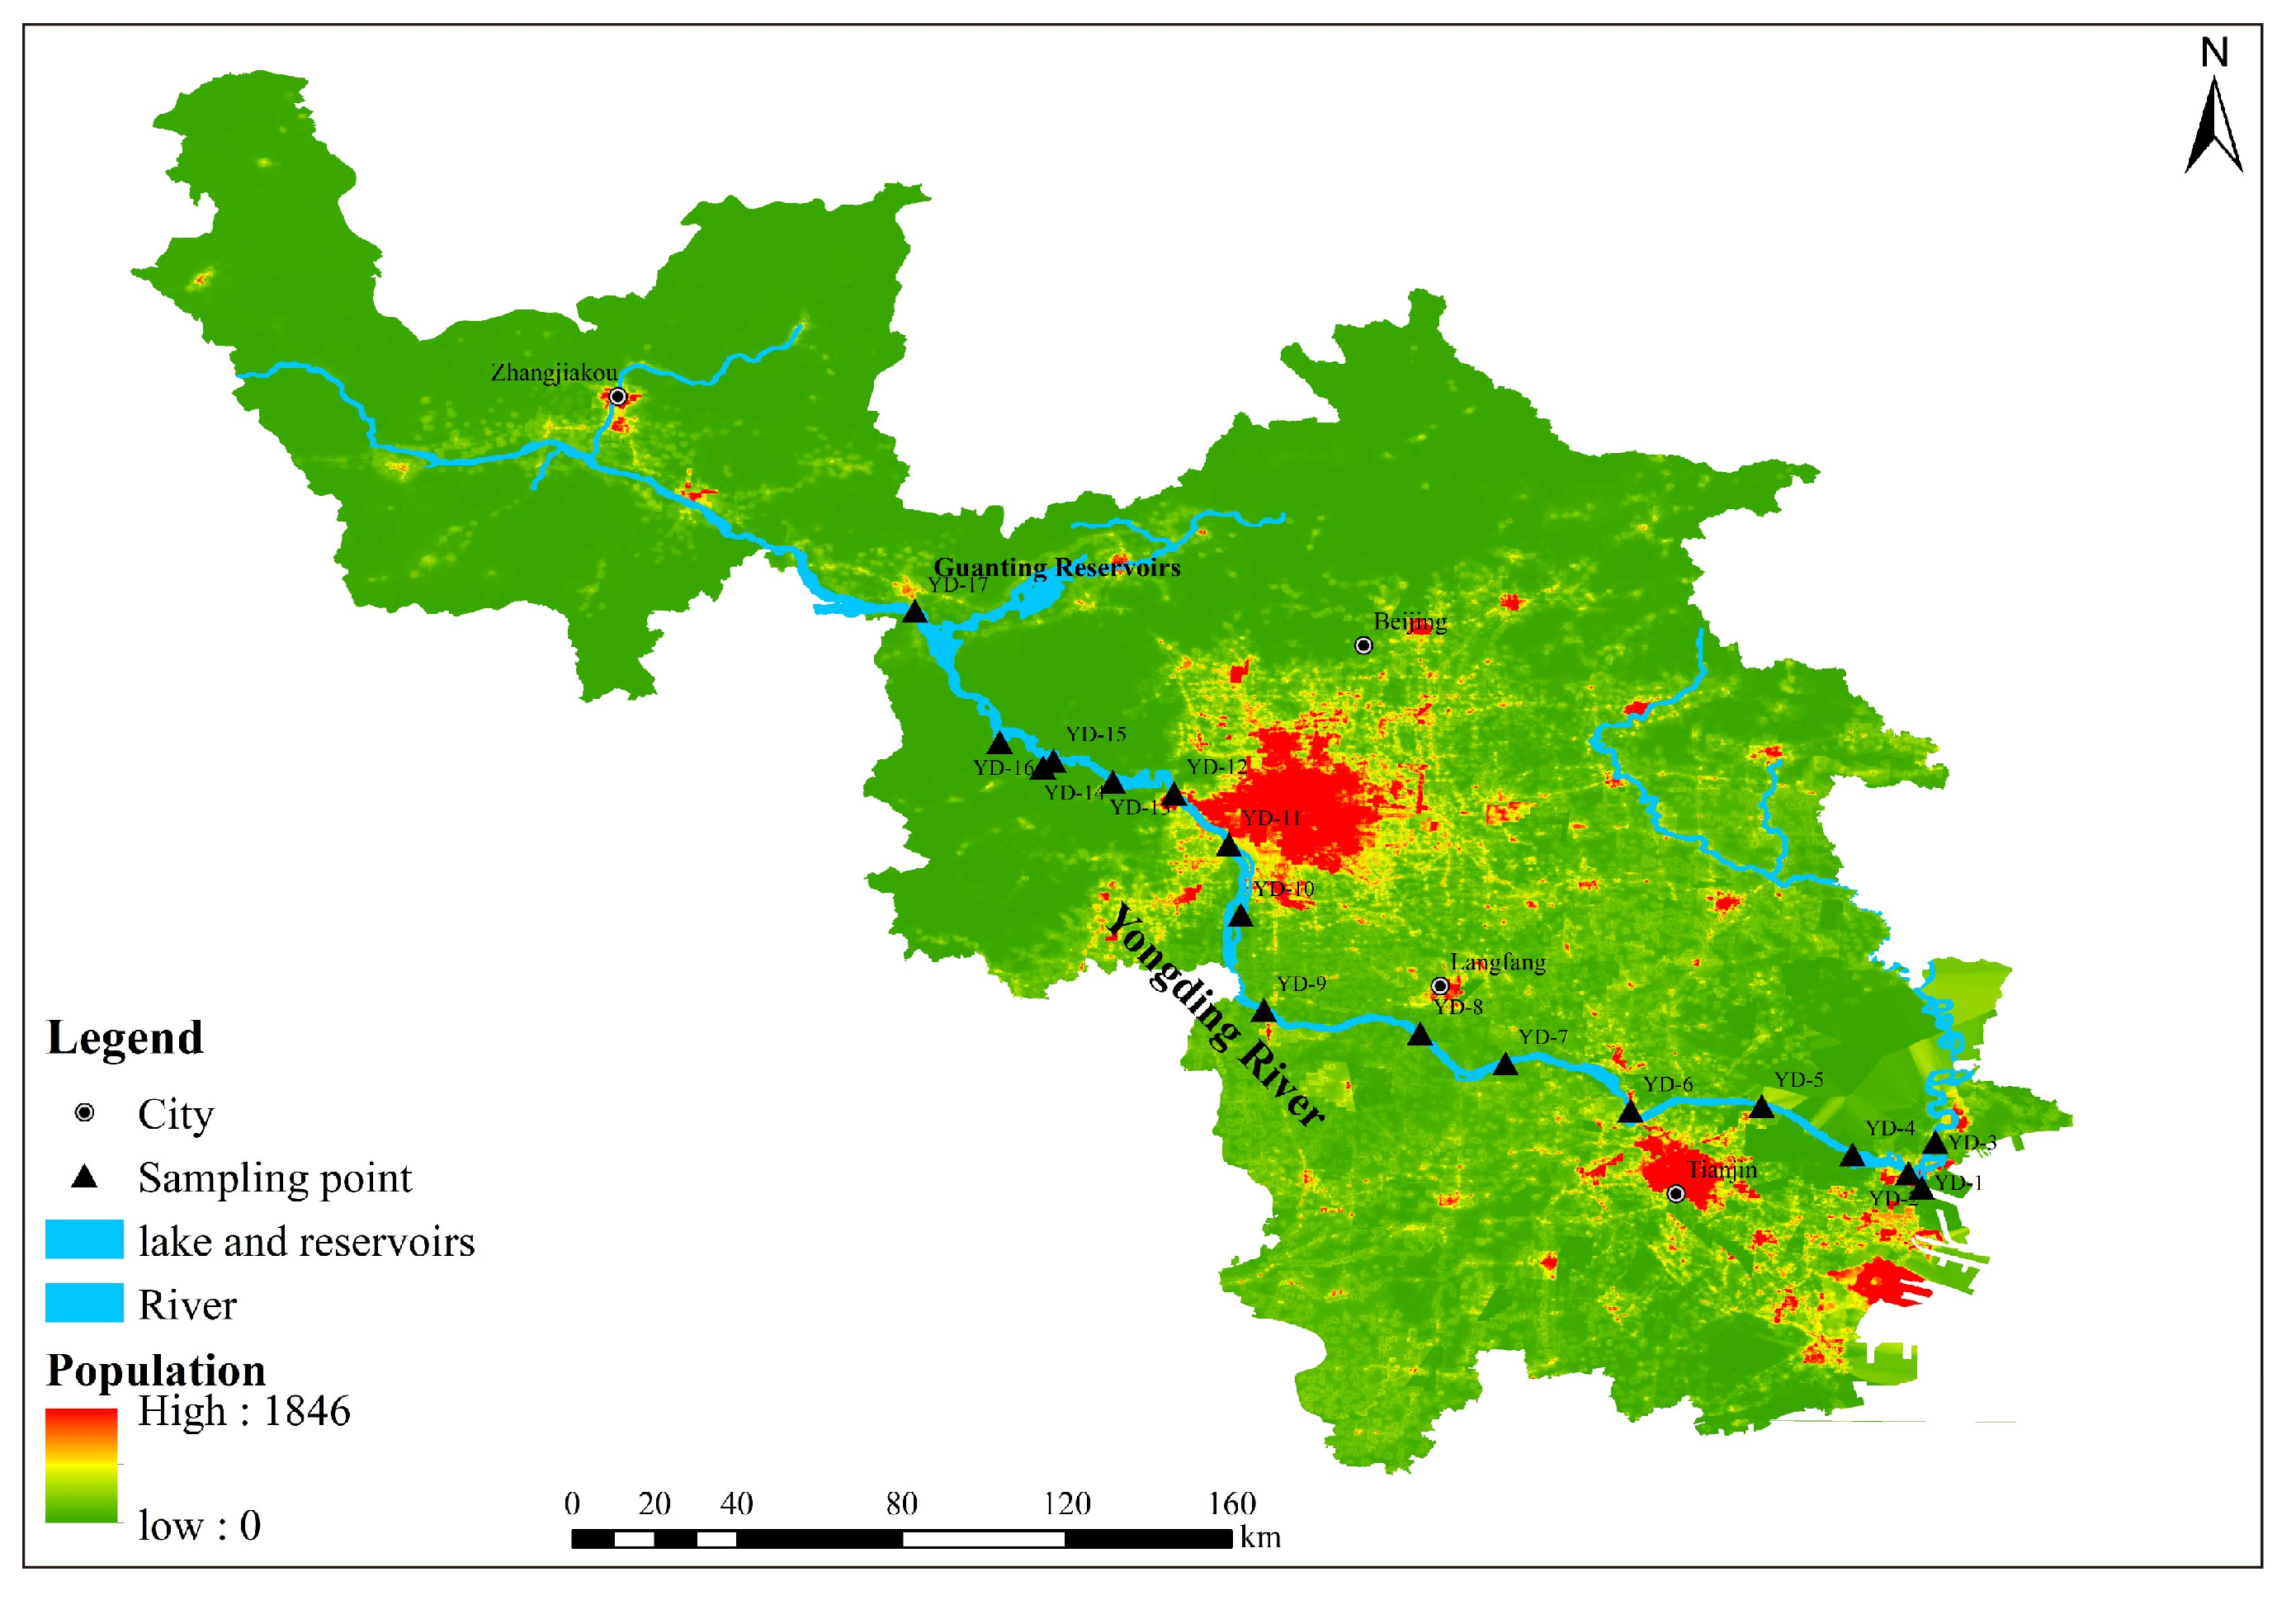
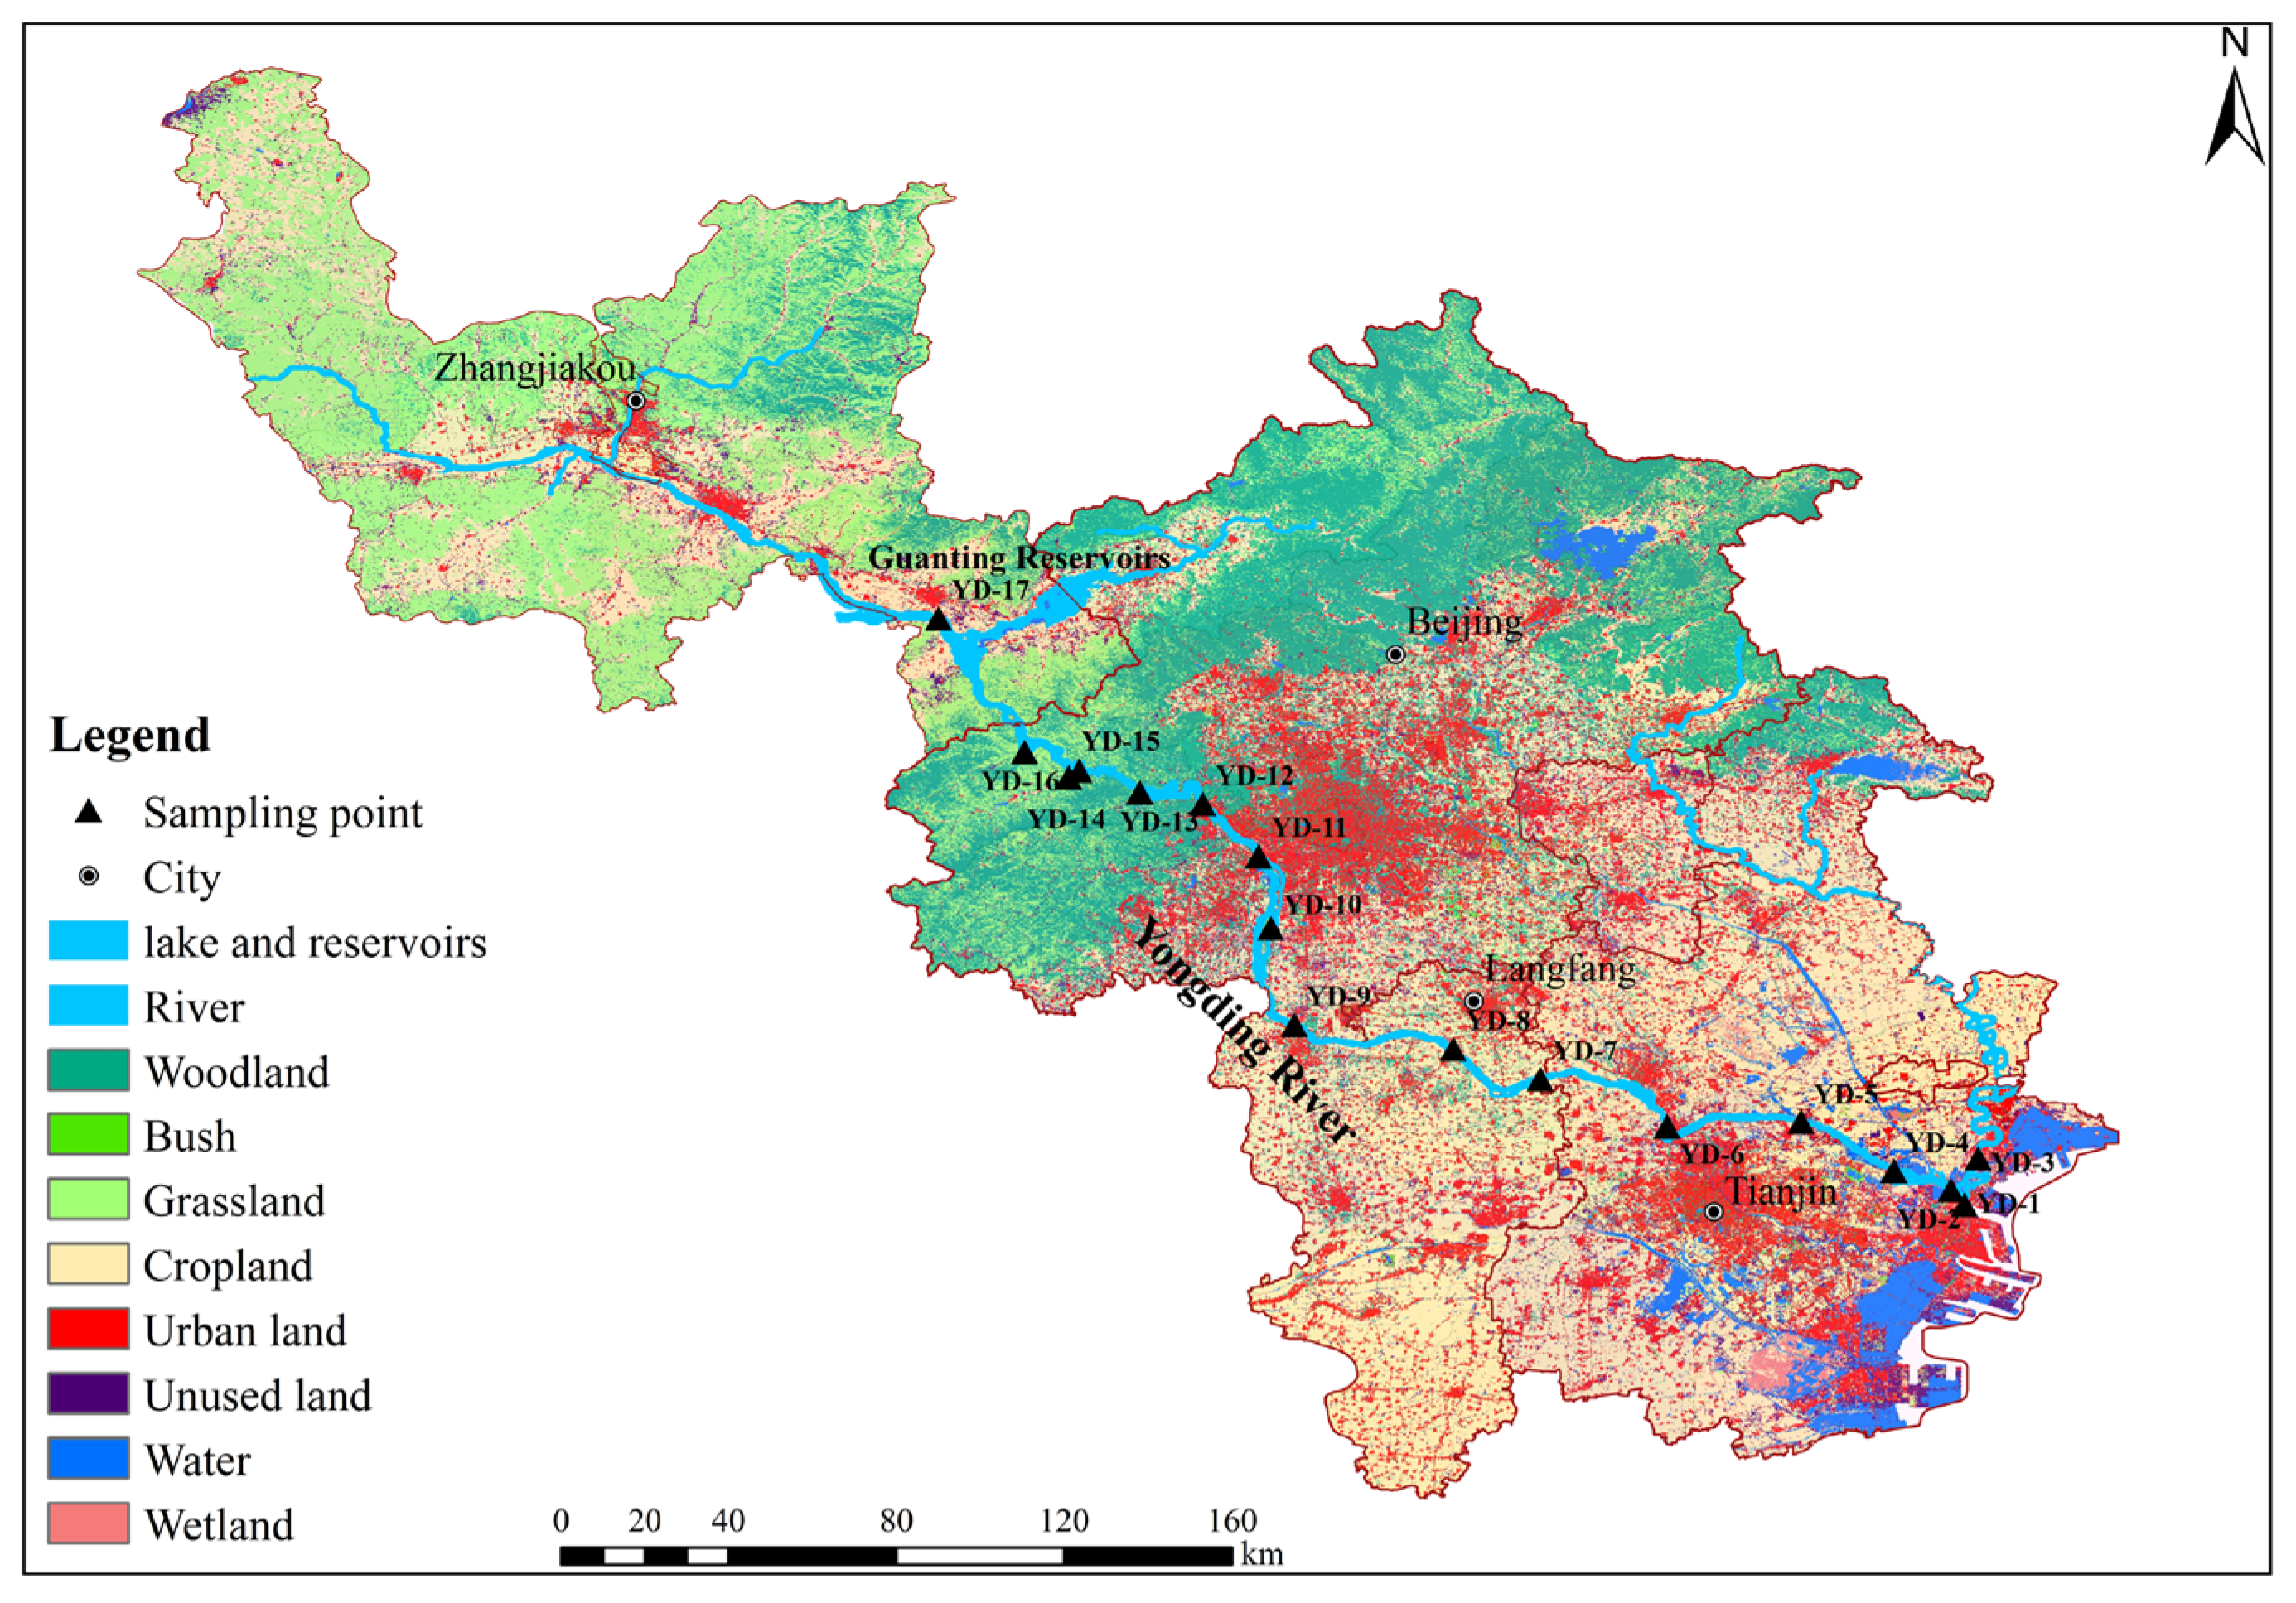
The Yongding River is 747 km in length with an area of 47,016 km2 and drains through Inner Mongolia and Hebei Province before finally entering Bohai Bay (Figure 1) [37]. The Sanggan River and the Yang River are referred to as the headwaters [38]. The basin is in a semi-humid/semi-arid transition zone and has a temperate continental monsoon climate with an average temperature of 12.4 °C and precipitation of 513 mm annually [39]. The main land use types include woodland, cropland, grassland, urban land, wetland and unused land, of which grassland and farmland occupy 34.33% and 42.86% of the basin area, respectively [37]. The mountainous upstream areas are rich in mineral resources and are also an important energy base, renewable energy demonstration area in China as well as an important area for production of food and vegetables. The central part of the basin has the densest population and highest urbanization rate. This area will become a cluster of high-quality service industries, technology and modern manufacturing in the future. Furthermore, the New Coastal District of Tianjin city is also regarded as a development base of manufacturing, modern service industries and scientific and technological innovation, which will become the northern shipping logistics center and an important economic development zone in the future.
2.2. Sampling and Analysis
A systematic sample collection process was conducted at the depth of 0~50 cm in the Yongding River in August 2021, among which 16 sampling points were located in the mainstream with one from the tributary. In total, 17 river sites were sampled and filtered via a 0.22 µm cellulose membrane. The samples were then acidified via ultra-purified HNO3 to pH < 2 and sealed in pre-cleaned polyethylene bottle in a refrigerator for later measurement. The samples were then prepared for analysis at the Surficial Environment and Hydrological Geochemistry Laboratory (SEHGL, class 1000). First they were concentrated through evaporation at 60 °C for 10–30 min and then re-dissolved in distilled 2% HNO3), together with 2 blank samples and 1 reference sample (SLRS-6, certified natural water) [40]. The REE concentrations of the Yongding River samples were analyzed using Agilent 7850 ICP-MS at the Key Lab of the Groundwater Circulation and Environmental Evolution (GCEE). The 5-point calibration of standards including the blank was conducted using the multi-element solution GSB 04-1789-2004 (100 mg/L) through a gravimetrically quantitative dissolution process. The concentration ranges of calibrations were prepared in distilled 2% HNO3 as follows: 10 μg/L, 1 μg/L, 100 ng L−1, and 10 ng L−1. The instrumental drift was corrected by the automatic addition of internal standard solution (ISTD), and the quality control was performed via the calibration standard of 1 ug/L (medium concentration). The diluent 2% distilled HNO3 was regarded as the sample of the continuing calibration blank (CCB), which periodically repeated during the whole sequence. The accuracy of repeated analysis (10 times) ranged from 0.2% (Ce) to 15.1% (Lu) of the standard materials, with an average of 5.3%, and the relative standard deviation of the REE concentrations was <6% on average for the individual analyses.
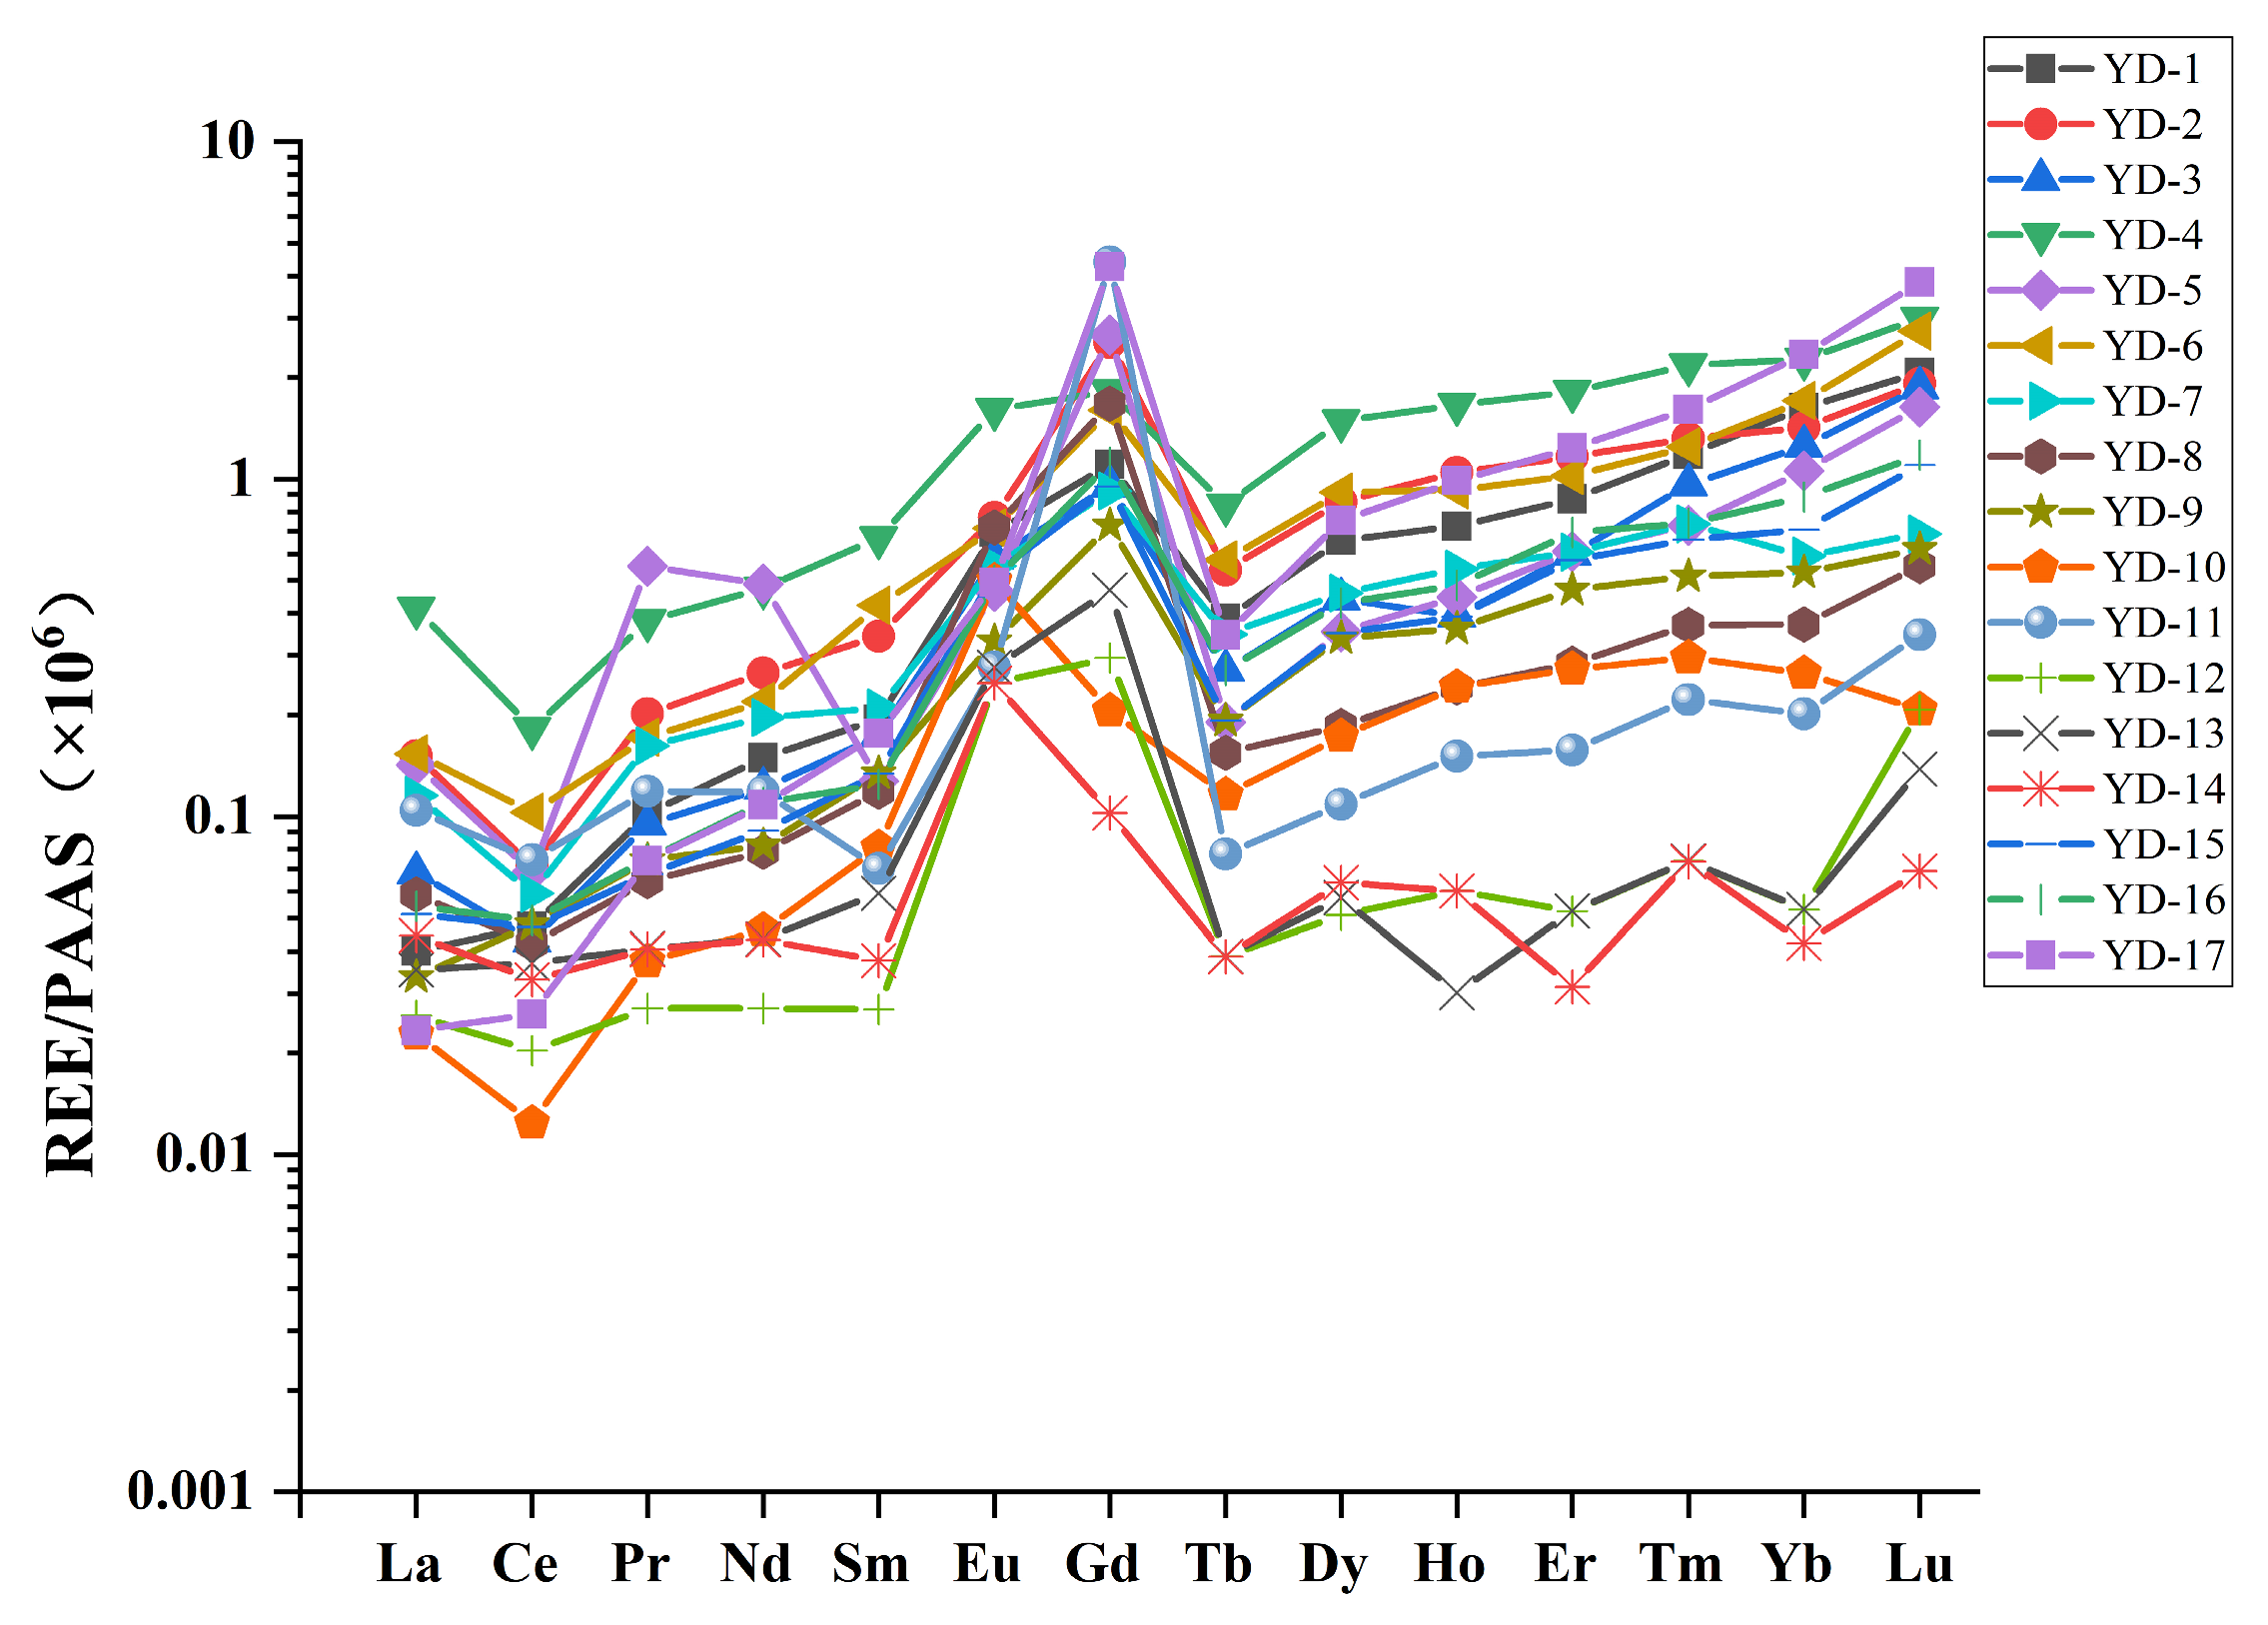
The REE contents were normalized to the Post-Archean Australian Shale (PAAS) standard in order to remove the influence of the Oddo–Harkins rule that results in a typical zigzag shape of the lanthanides’ abundance in logarithmic plots of content versus atomic number [41]. δCe, δEu, δGd are the Ce, Eu, and Gd anomalies, respectively. δCe, δEu, δGd, and Gdanth can thus be calculated through the following formulas [42,43,44]:
δCe = CeN/Ce* = CeN/(LaN × NdN)1/2
δEu = EuN/Eu* = EuN/(SmN × GdN)1/2
δGd = GdN/Gd*N = GdN/(0.33SmN + 0.67TbN)
Gdanth = Gdmeasured − Gd*N × GdPAAS
Here, the subscript of N and * are the normalized value relative to PAAS and the geologic background value, respectively. Gdanth, Gdmeasured, and GdPAAS are sthe Gd concentrations originating from anthropogenic sources, the measured Gd value, and the Gd concentration in PAAS, respectively.
3. Results and Discussion
3.1. The Content of REEs
The contents of all rare earth elements and the total REE (∑REE) concentrations in the Yongding River samples are presented in Table 1 and Table 2. It is clear that the ∑REE content was generally low, with a range of 6.27~86.26 ng L−1 (average 31.05 ng L−1), which is far lower than the global average of 532 ng L−1 and other rivers such as the Yangtze River and the Connecticut River [1,37,45]. However, compared with other urban rivers, the ∑REE concentration in the Yongding River was higher than in the urban river in Guiyang city and lower than concentrations the Han River, the Pearl River and the Rhine River [24,46,47,48].
Previous studies have reported that ecological factors, such as microorganisms, aquatic plants, and the area of weathering surfaces, affect the overall mobility of REEs [49]. Therefore, lower REE concentrations in the Yongding River may result from the increase in vascular plants from spring to summer, leading to a dramatic ∑REE decrease [49] since aquatic plants can produce stable REE complexes via unsaturated groups from the surface of a large number of organic colloids [50]. Seasonal redox, hydrological process and suspended load may also affect ∑REE and the relationship among each element. During the sampling period in the summer of 2021, extreme rainfall occurred in Beijing. Therefore, the rainwater would have diluted the river water and reduced the REEs concentration [51,52,53,54]. Furthermore, it is reported that a multi-point ecological water replenishment was conducted in the Yongding River in the spring of 2021 to relieve the pressure on the water storage of the Guanting Reservoir and the whole Yongding River. Therefore, the runoff increased to levels 1.3~6.6 times the annual average monthly runoff [55], and this alteration of river runoff caused by supplementary ecological water releases may have been a reason for the lower REE contents [55,56].
3.2. Spatial Variation Patterns of REEs
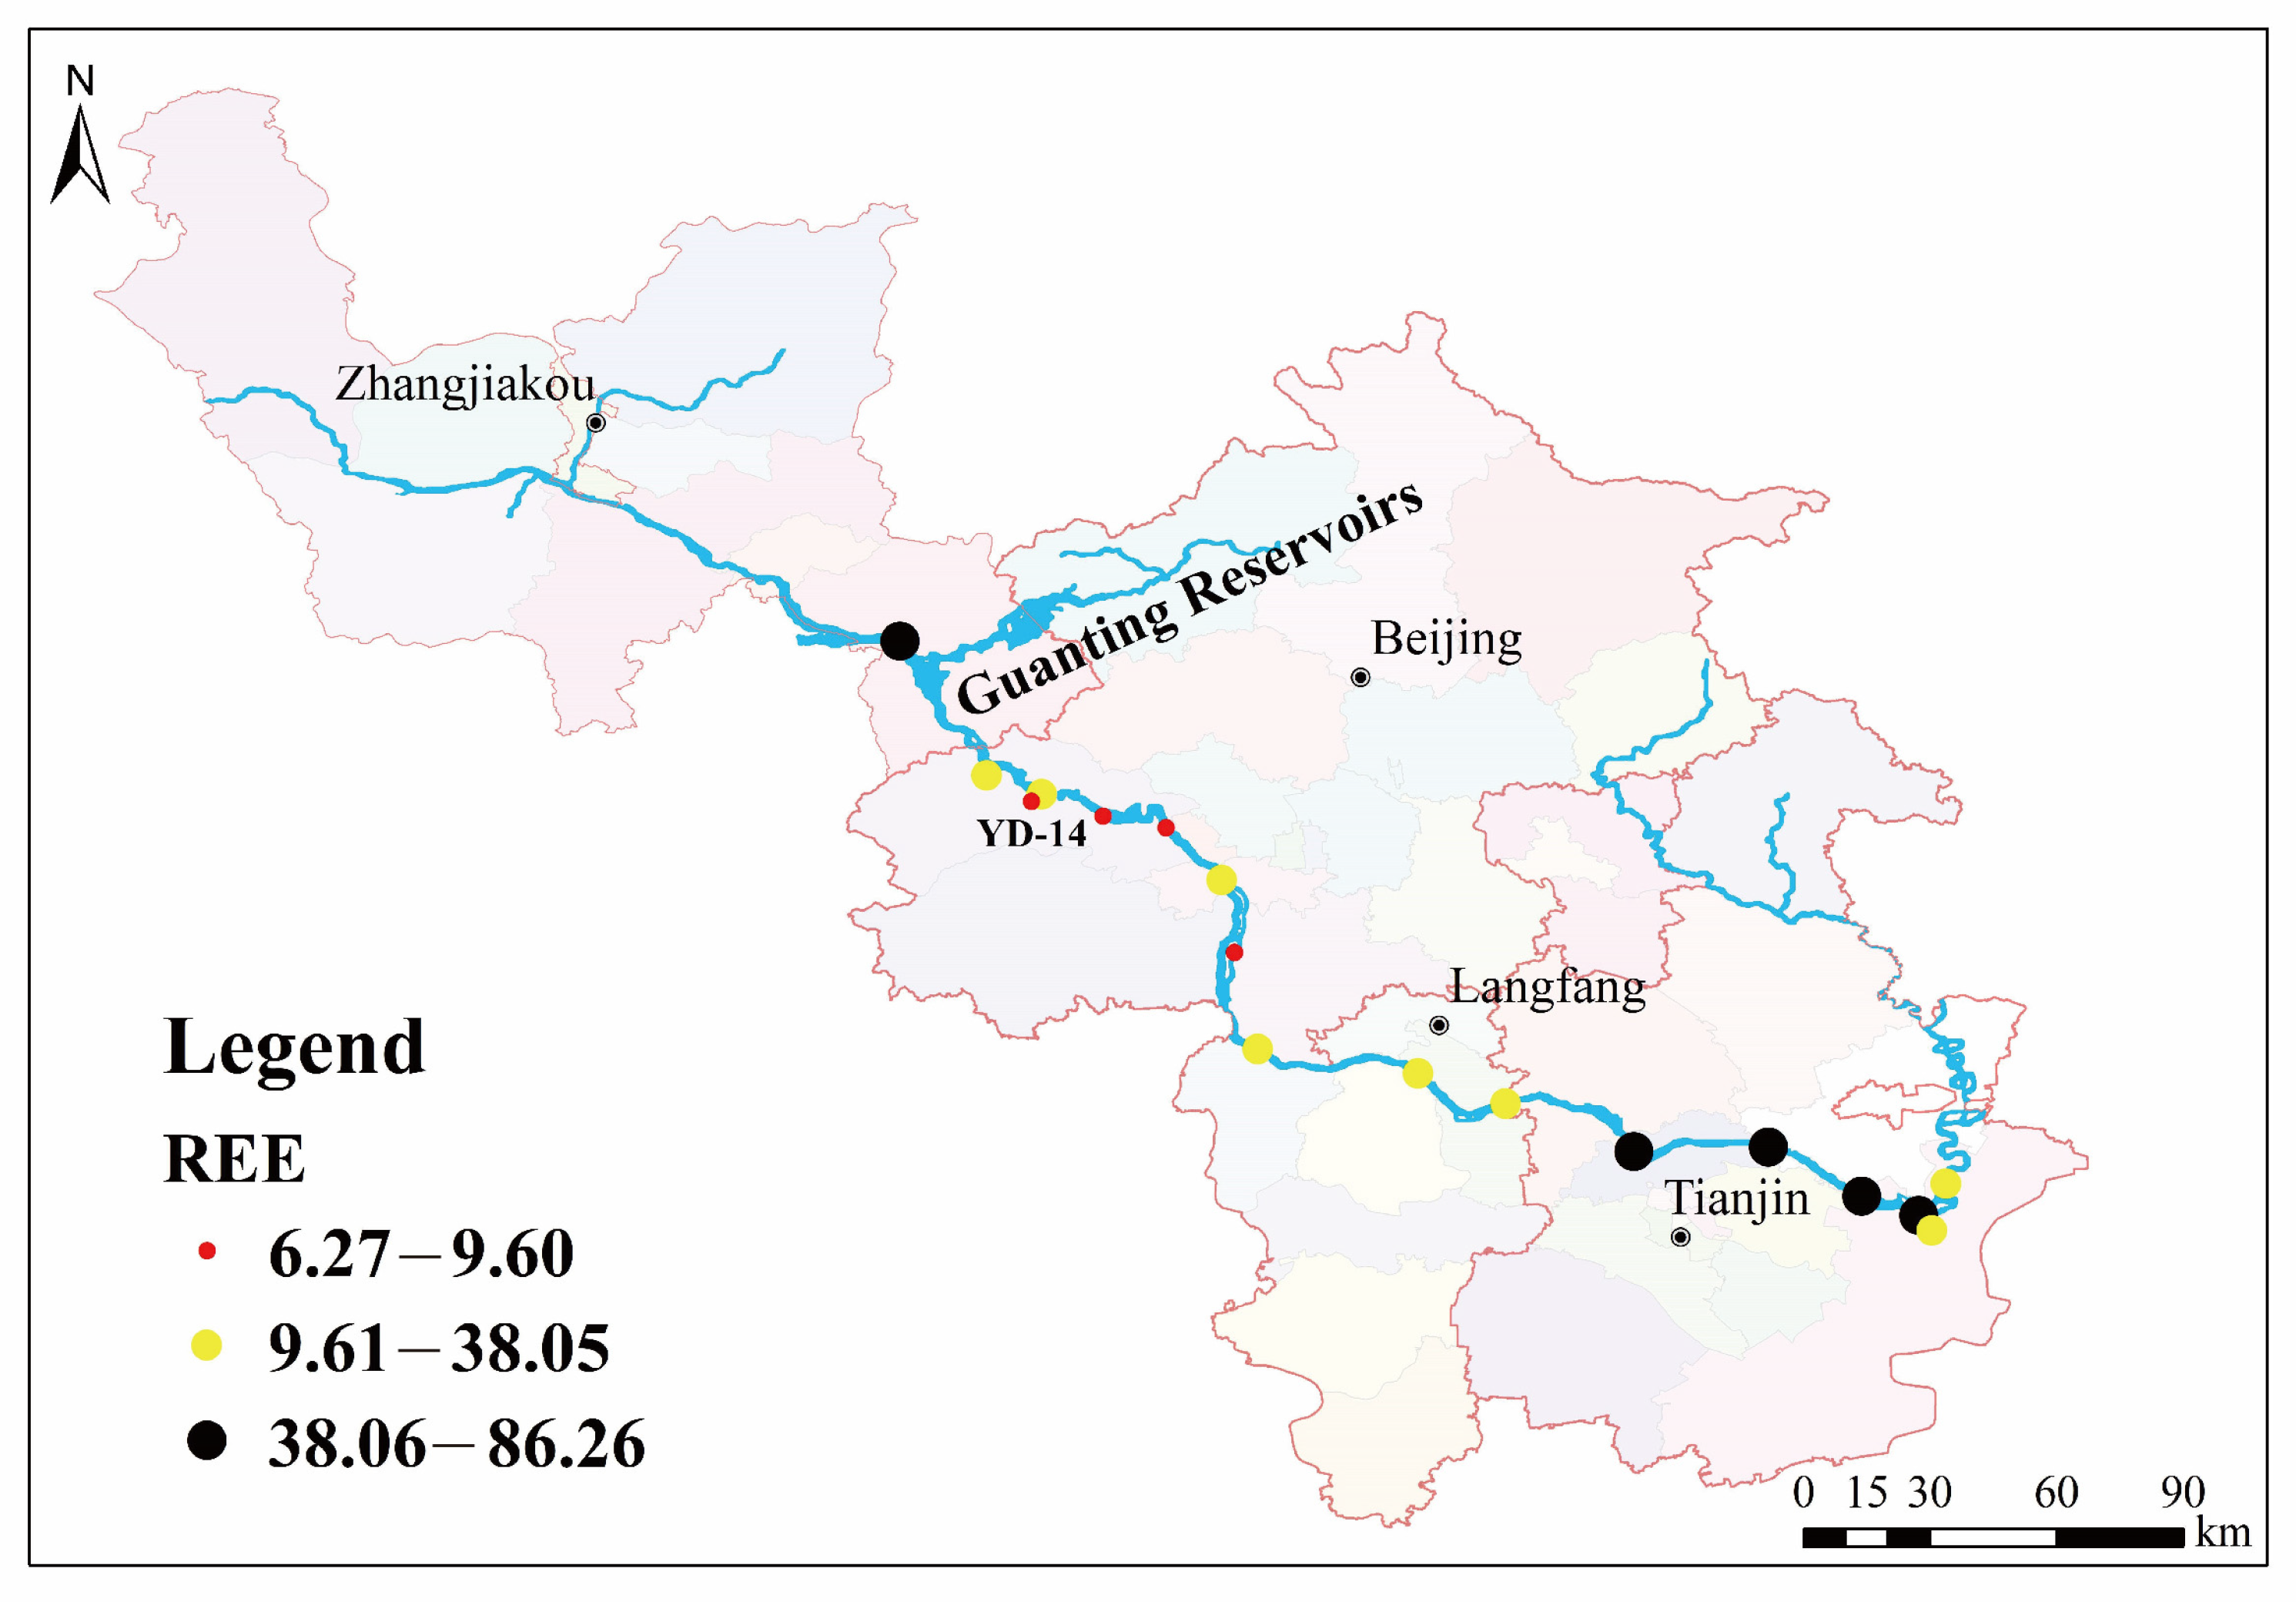
Figure 2 illustrates the spatial variation of ∑REE contents in the Yongding River. The distribution of ΣREE contents displayed a certain regularity and significant spatial variations. Compared with the upper stream, the concentration of ΣREE was higher in the middle/lower reaches and the estuary. The relatively lower concentrations at the estuary (YD-1) result from salt-induced flocculation which eliminate the colloidal-bond REEs when the river water mixes with seawater. In addition, the influence of estuarine salinity may also deplete the total concentration of dissolved REEs [57].
The ΣREE distribution in the Yongding River may also be linked to the input of sediment from upper tributaries and the supplementary water released in some reaches. Since the Yongding River flows through urban, industrial and agricultural areas, REEs in the river water may also be related to anthropogenic activities (industrial and medical wastewater, domestic sewage, fertilizer and pesticide usage) in addition to natural processes [24,58]. According to this study, the ΣREE content is relatively high in lower reaches, exactly where the river flows through densely populated urban areas. Therefore, we speculate that the REE concentrations in the downstream reaches of the Yongding River are closely related to urban development and may increase under further intense development of the city. In addition, sites YD-4, YD-5 and YD-6 are adjacent to a large number of coal-fired power plants and thermal-related industry plants. Studies have indicated that large amounts of artificial REEs are contained in the fly ash produced by coal-fired power plants [59], which may fall into the river water via wind and lead to high dissolved REE contents in adjacent river water.
3.3. REE Anomalies
3.3.1. Ce and Eu Anomalies
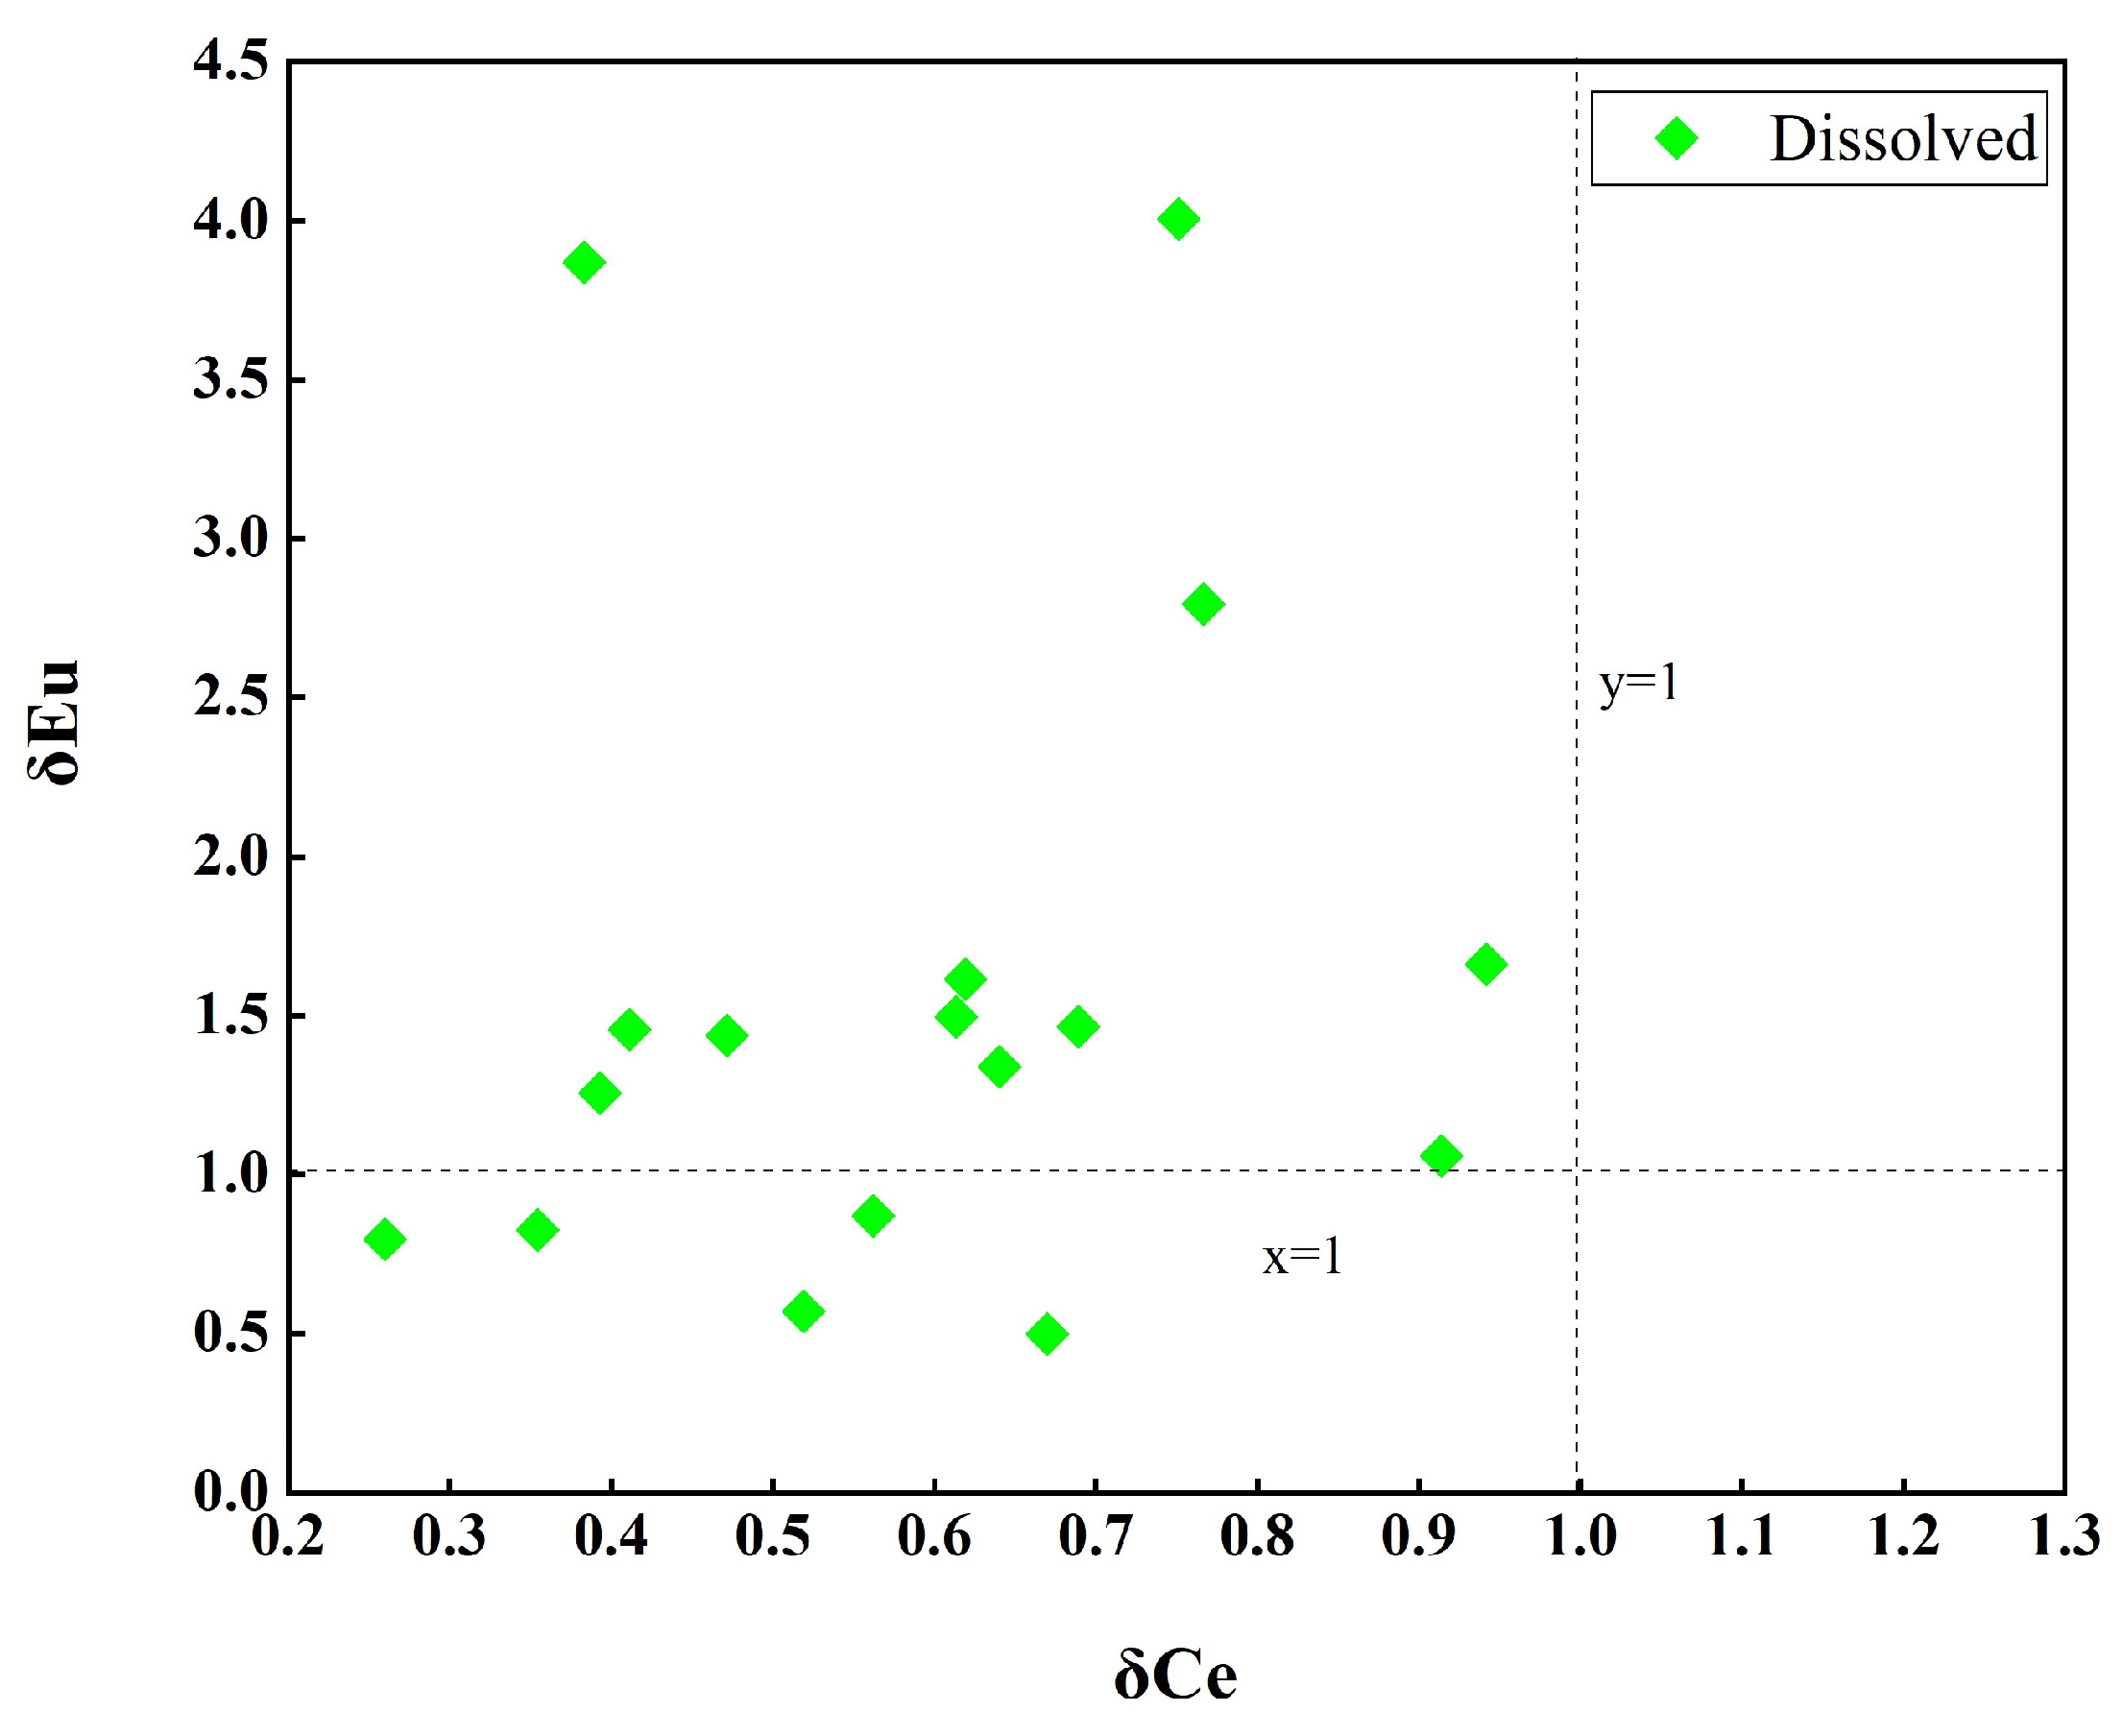
The δCe of the river water samples from the Yongding River was <1.0 with an average of 0.59, exhibiting a weak negative Ce anomaly (Figure 3 and Figure 4). As shown in Equation (5), Ce3+ can be readily oxidized to Ce4+ in alkaline environments:
Ce3+ + 4OH− − e− = CeO2 + 2H2O
Under oxidation conditions, Ce3+ forms more stable Ce4+ and CeO2, which is insoluble in water, leading to a negative abnormality of Ce in alkaline water where it absorbs to Fe-Mn oxides and other substances. In this study, δCe exhibited an obvious variation between sites YD-1~YD-2 and YD-9~YD-10 with values in the ranges 0.35~0.61 and 0.38~0.91, respectively. The mixing of river water and seawater near YD-1 and the inflow of tributaries may be the reason of the increasing variability of Ce/Ce* values. Xu and Han (2009) revealed a negative relationship between Ce anomalies (δCe) and pH in river water [60]. However, this phenomenon is not obvious in this work due to slight pH variations in the Yongding River. Meanwhile, more negative δCe was found together with low DO concentrations, indicating a redox potential and geochemical processes such as rock weathering.
As shown in Figure 4, river water in the Yongding River displayed positive Eu anomalies and a weak negative anomaly (δEu = 0.50~4.00), which are lower than those in the Nanming River (δEu = 5.85~16.18) [48] and the Zhujiang River (δEu = 1.23~6.53) [61], but higher than those in the Huainan coal mining area (δEu = 0.23~1.23) [1]. The main mineral assemblages in this area are potassium feldspar and plagioclase. Since Eu could be infiltrated into plagioclase preferentially in the reduced form Eu (II) to replace Ca in reduced magma [62], the Eu enrichment level in plagioclase is higher than that in other REE-bearing primary minerals [60]. In addition to natural sources, human activities may also make contributions to REE anomalies. Considering that Eu has been widely applied as an activator of barium fluoride in medical X-ray sensitization screens [63], the discharge of medical wastewater is a potential origin of the increase in Eu concentration observed in the Yongding River.
3.3.2. Gd Anomalies and Anthropogenic Gd Contribution
Small positive Gd anomalies (<1.4) are generally common in seawater because of the tetrad effect, which is attributed to the semi-filling of 4f electrons in its orbital shell and is unrelated to normalization [42]. All samples in the Yongding River exhibited pronounced positive Gd anomalies of 1.97~58.70. Therefore, it is unlikely that the abnormal Gd is of natural origin. Gd compounds are commonly applied as contrast agents in magnetic resonance imaging (MRI) in medical examination. Because of the toxicity of Gd2+, the Gd2+-based contrast agents are formed as hydrophilic compounds, which are not only highly stable but also quickly and completely released from the body without being metabolized [64]. However, the patients’ excreta are not regarded as medical waste generally, and thus, directly enter urban sewage treatment plants as domestic sewage (including both residents’ and hospital domestic sewage). Traditional sewage treatment plants cannot eliminate these compounds and discharge them into water environments, causing serious Gd pollution. In this study, the content of anthropogenic Gd ranged from 0.30 to 20.16 μg L−1 with an average value of 5.29 μg L−1. Compared with the anthropogenic Gd content in other urban rivers located in megacities, our results were lower than the average of 41.35 ng L−1 in the Rhine River and 110.67 ng L−1 in the Han River [24,46]. However, the potential pollution from nearby hospitals should still be taken into account.
3.4. Relationship between Land Use and Anthropogenic REE
The anthropogenic factors of land use and population density are presented in Table 3 and Figure 5 and Figure 6 and show obvious spatial variations. Factories and hospitals are mainly distributed in the middle reach (YD-9~YD-12) and lower reach (YD-5~YD-6) of the mainstream. It is worth noting that the proportion of urban land and cultivated land increases in the middle reach and reaches a highly stable proportion in the lower reach. The urban land use proportion is highly consistent with the distribution of population density. This finding indicates that the middle/lower reaches of the river are strongly disturbed by human activities.
River buffer zones have become a widely-accepted management tool in identifying diffused pollution. To eliminate the influence of land use in the upstream are on the downstream site, the first 500 m buffer zone was established along the river bank from headwater to the most upstream site, and the second buffer zone was established from headwater to the second upstream site. The remaining buffer zones were successively set up as above. Finally, fifteen buffer zones in total with a width of 500 m were set up along the mainstream via the buffer zone function of ArcGIS, except for YD-3 which is on a tributary of the Yongding River. Furthermore, we applied the land use datasets in 30 m resolution (2020) (http://landsat.datamirror.csdb.cn, accessed on 20 December 2022) and the population density of 2020 (https://www.satpalda.com/landscan, accessed on 20 December 2022) for the analysis of anthropogenic response factors. The land use datasets were summarized as six types: woodland, cropland, grassland, urban area, unused land, and wetland.
The degree of human-derived REEs could be identified and correlated with the proportions of land use. As human activity indicators are continuous numerical variables which do not follow a normal distribution, the Spearman correlation analysis is more suitable in this study. The correlations between land use proportion and artificial REE concentration are presented in Table 4. The results indicate that cultivated land is significantly correlated with Gdanth and REE concentrations, and urban land use is significantly related to the concentration of most REEs. With the extensive use of chemical fertilizer, the agriculture within the basin is relatively developed [65]. Other researchers have also reported that various REE contents in cultivated soil could originate from agricultural sources (i.e., phosphate fertilizers) and land use [29]. Therefore, intensive agricultural activities and phosphate input enriched in REEs may be regarded as the potential sources of anthropogenic REEs in the Yongding River basin.
However, agricultural activities are not the only anthropogenic source of Gd and other REEs. Previous studies have revealed that a potential reason for high anthropogenic Gd abnormalities in river water is the application of Gd-based compounds in magnetic resonance imaging (MRI) at hospitals, and the dense population is positively related to the number of MRI [24,43,66]. Samples with abnormally high Gd (YD-5, YD-8, YD-11, YD-13, YD-17) were also observed in the middle and lower reaches with high population density in this study. The sewage treatment plants in this area may receive sewage from hospitals, and the patients’ excretions defined as domestic water could also directly enter urban sewage treatment plants and eventually be discharged to the river, leading to high anthropogenic Gd in river water.
Studies have shown that the REE content of topsoil in different land use types varies [67]. For instance, the REE contents of urban soil and agricultural soil are significantly higher than those in forest soil [68]. The pollution sources for these land use types are also different. The main sources of metal pollution in urban areas are traffic emissions and urban sewage. For agricultural soil, the main source is the intensive use of manure and fertilizer, and atmospheric deposition [69]. This is similar to the source of REEs in river water, indicating that the concentrations of rare earth elements in river water are closely related to the land use type.
3.5. Identification of REE Contamination by Co-Indicators
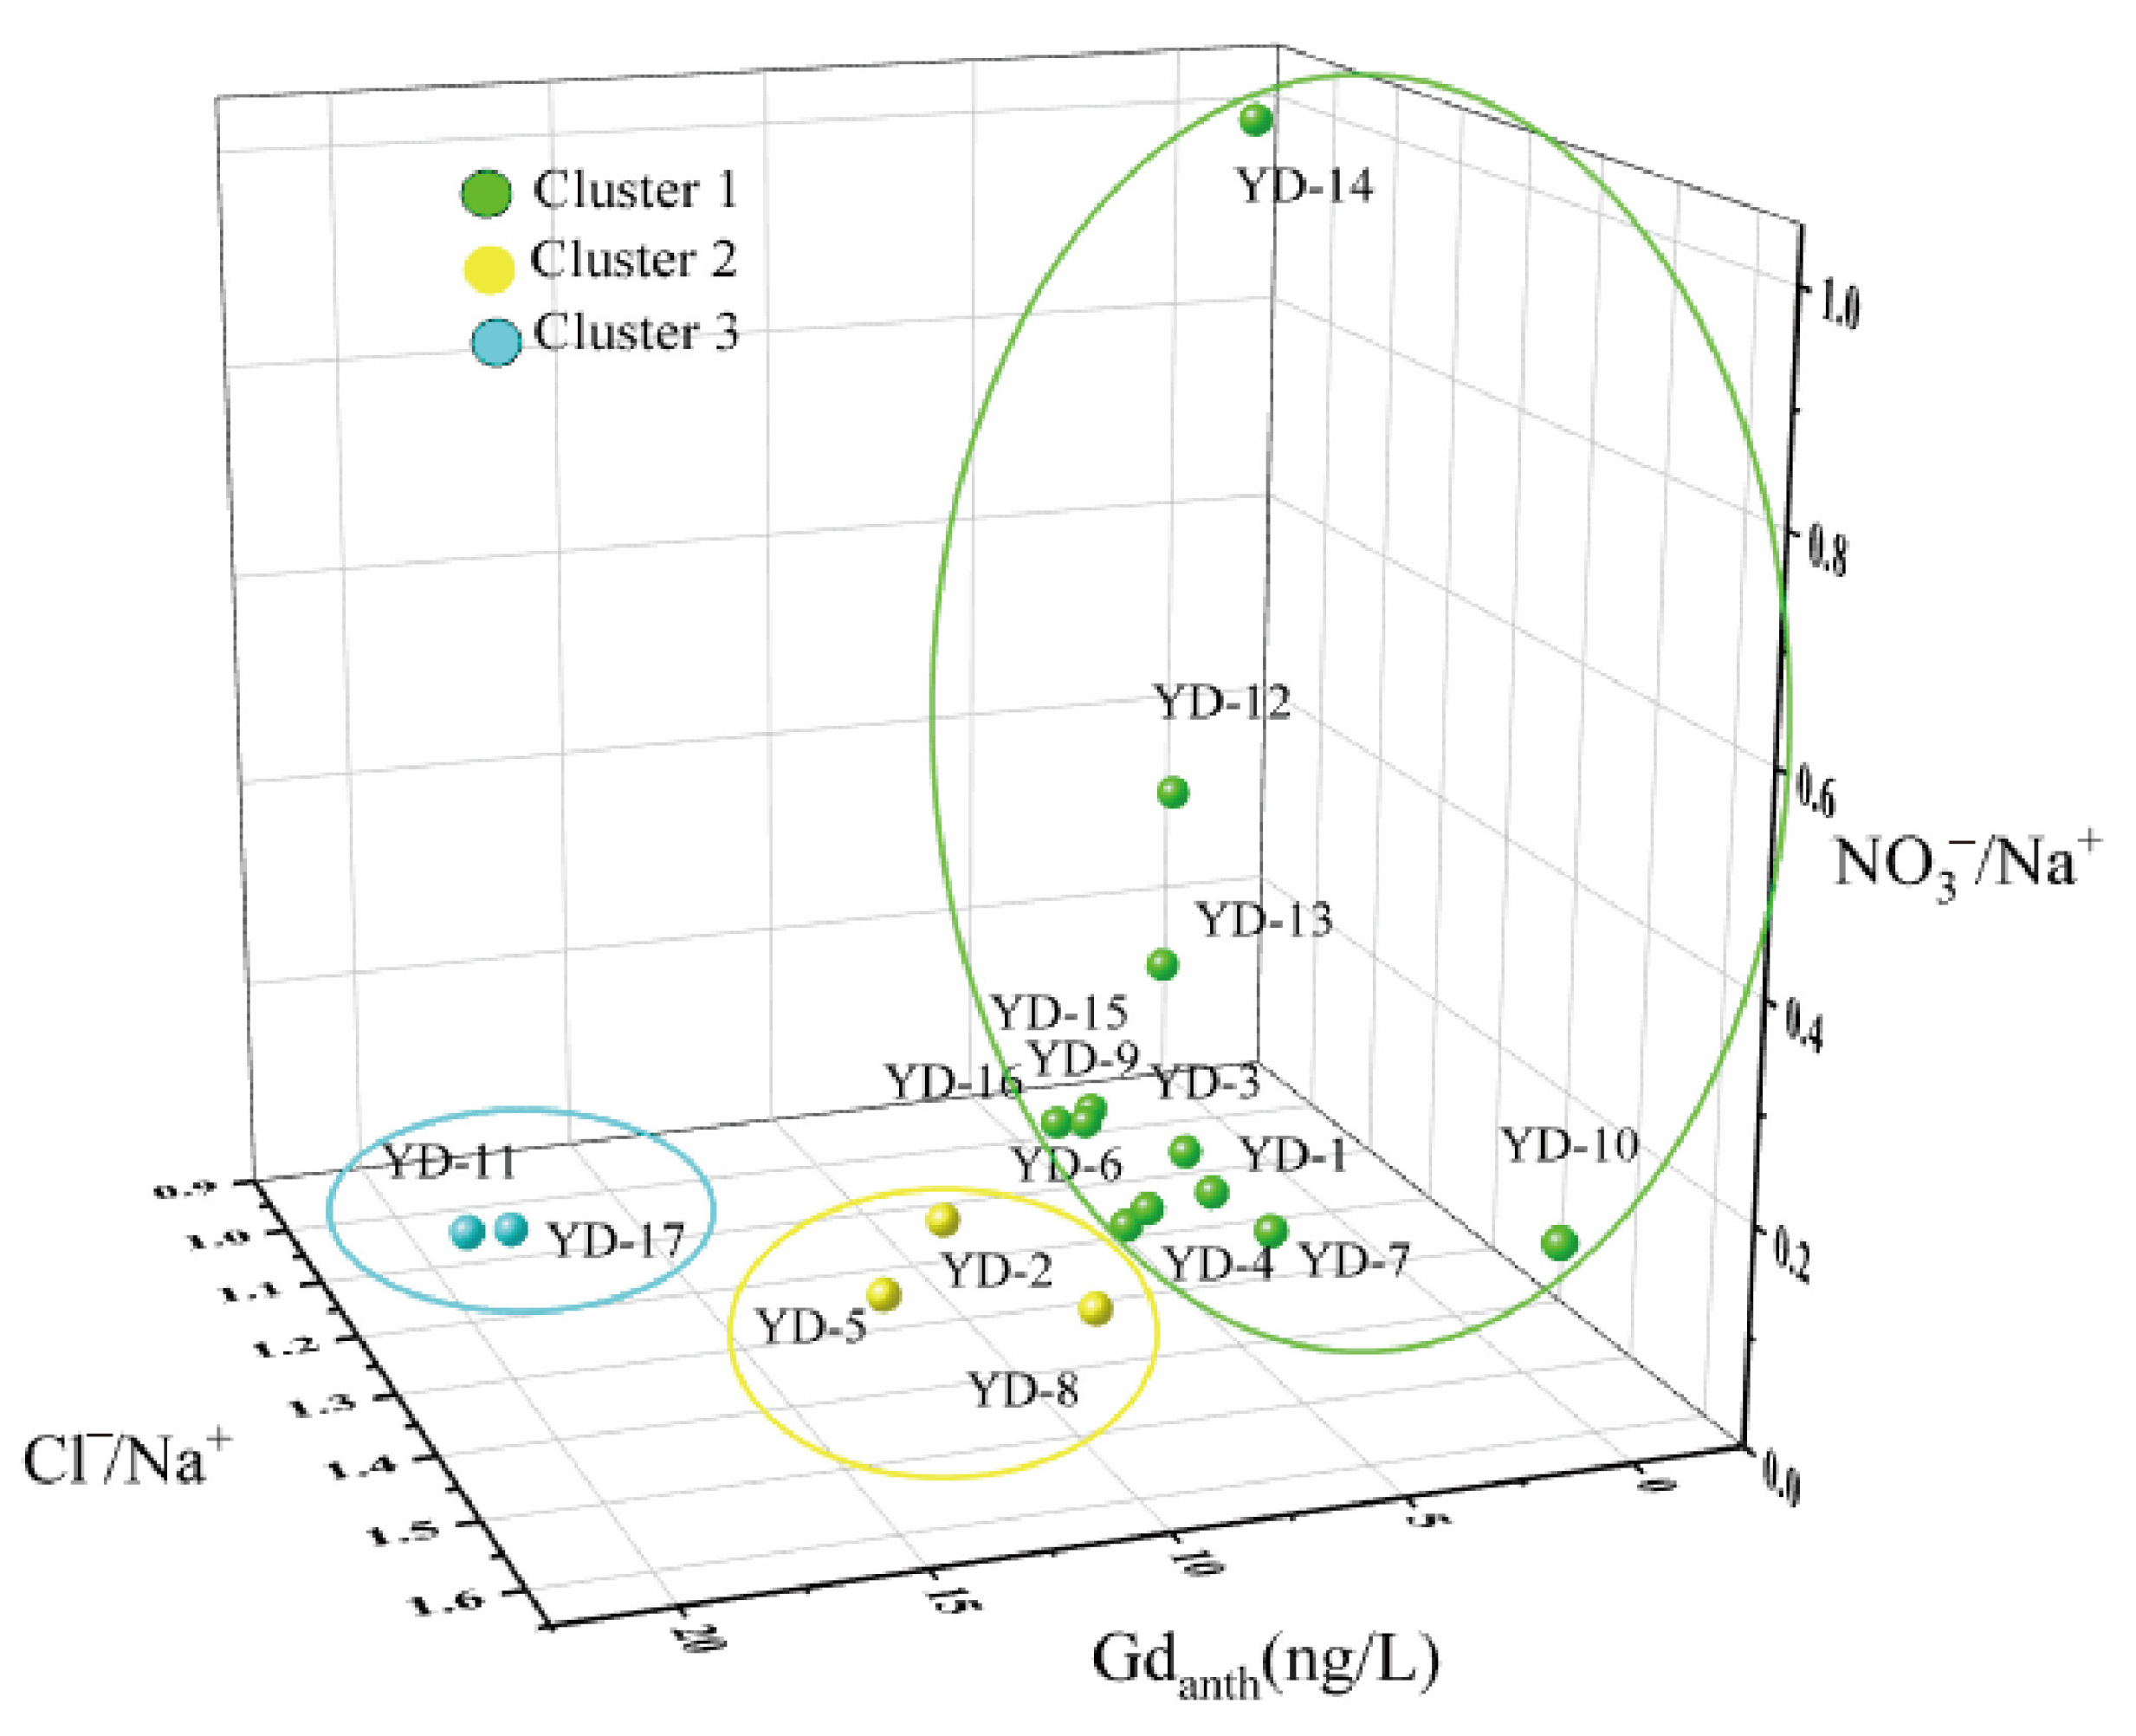
Gdanth and two traditional contamination tracers (NO3−/Na+, Cl−/Na+) were selected as co-indicators to investigate the potential traceability of anthropogenic REEs. Traditional sewage treatment plants are designed to treat traditional pollutants, but a series of new pollutants could pass the treatment process and enter the environment through sewage systems. Numerous studies have shown that artificial Gd generally comes from hospital wastewater, and Gdanth can thus be used as a highly sensitive tracer for medical sewage and sewage from treatment plants, since it cannot be effectively removed in conventional processes and would enter the aquatic ecosystem from treatment plants. Some forms of industrial activities and agricultural production discharge water with high NO3−/Na+ and Cl−/Na+. In addition, domestic wastewater also exhibits high Cl−/Na+ [70]. Therefore, we take the NO3−/Na+ and Cl−/Na+ ratios in river water as an indicator of the agricultural and industrial impacts [71].
Three distribution patterns of the river water samples were determined based on three co-indicators (Figure 7). Cluster 1 is located in the mainstream and has low concentrations of Gdanth with high NO3−/Na+ and Cl−/Na+ ratios. The mainstream area includes two megacities, Beijing and Tianjin, with developed agriculture and industry and a population of more than 37 million [72]. Previous work found that the water quality in downstream regions is significantly lower than upstream regions [34,73]. This may result from the increase in untreated industrial wastewater and urban sewage from the upper reaches where Beijing and Tianjin are located, two highly urbanized and industrialized areas. Besides, a large number of sewage treatment plants and industrial parks (using mechanical, chemical and metallurgical processes) are also located in the downstream region. Therefore, Cluster 1 refers to the sites impacted by domestic sewage and industrial wastewater in this typical urban area.
Cluster 2 includes sites in the middle to lower reaches of the mainstream which have high concentrations of Gdanth, high Cl−/Na+ and low NO3−/Na+. As discussed above, a significant positive relationship exists between the number of MRI instruments and Gdanth concentrations. In this study, the hospital density near YD-5 and YD-8 is high, and Gdanth may originate from medical wastewater discharged to nearby sewage treatment plants. However, no hospital was found near YD-2, so the high concentrations may be attributed to the leakage of urban underground pipes and the direct release of untreated sewage. High ratios of Cl−/Na+ may also originate from domestic sewage [74]. Therefore, Cluster 2 corresponds to the sites with surface water affected by urban sewage and medical wastewater.
Cluster 3 is located in the upper-middle reach and displayed high Gdanth, low Cl−/Na+ and high NO3−/Na+. Much higher Gdanth levels were found near YD-11 and YD-17, which may result from strong point source pollution such as the discharge of medical wastewater. Low ratios of Cl−/Na+ indicate that this area is rarely affected by urban sewage. Besides, high ratios of NO3−/Na+ may be associated with frequent agricultural activities within this area, since the proportion of cultivated land within this region has increased based on local land use statistics (Table 3). Research has reported that nitrogen fertilizer made up >50% of nitrate pollution in river water, and excessive application of nitrogen fertilizer in agricultural activities within the basin has resulted in a total of 96 kg hm−2 nitrogen loss, leading to the increases in the nitrate content of river water in this region [75]. Therefore, Cluster 3 was considered to be affected by agriculture rather than industrial and urban sewage.
3.6. REE Toxicological Risk for Humans and Aquatic Life
The toxicity and concentration of rare earth elements are positively correlated. In addition, the toxicity of rare earth elements is also closely related to the exposure time and leakage mode [20]. Studies have shown that when the concentration of rare earths reaches a constant value, it can harm aquatic organisms and humans. For example, sea urchin (embryos and sperms) were exposed to Ce (IV) and La (III) for 72 h and 1 h, respectively, at a concentrations from 10−8 to 10−5 M. The results showed full mortality following exposure to Ce (IV) at a concentration of 10−5 M and full developmental defects with no mortality when exposed to La (III) at 10−5 M. At the highest concentration (10−5 M), sperm exposed to Ce (IV) and La (III) had a decreased success rate in fertilization [76].
In this study, we mainly consider the impact of artificial Gd concentrations on aquatic organisms and humans. Concentrations of individual lanthanides measured in the Yongding River are much lower than the REEs reported in other eco-toxicological studies [77]. We also conclude that the total amount of all dissolved REEs with same patterns is also lower than the levels reported elsewhere [78]. Therefore, this study infers that the toxicological risk of dissolved REEs in the Yongding River to human and aquatic organisms is limited.
4. Conclusions
This work explored the spatial characteristics of REEs in a typical urban river (Yongding River) and the correlations between land use and human-derived REEs in river water. The ΣREE contents of river water were 6.27~86.26 ng L−1, with an average value of 31.05 ng L−1. The PAAS-normalized REE patterns exhibited Gd anomalies, varying from 1.73 to 14.97 and revealed pronounced Gdanth in all river samples from 0.30 to 20.16, confirming the occurrence of anthropogenic Gd and its origin in the MRI diagnostic systems of hospitals. Correlation analysis revealed that the proportion of cultivated land was positively related to most REE concentrations, which are derived from applications of fertilizers containing artificial REEs in agricultural activities. By applying Gdanth, NO3−/Na+ and Cl−/Na+ as co-indicators, the relative impacts of sewage treatment plants, hospitals and agriculture on river water were accurately identified. Combined with hydro-chemical indicators and artificial REEs, this study revealed the influence of urban human activities on the river system and accurately tracked the source of man-made pollutants throughout the urban river basin.
Author Contributions
Conceptualization, X.G. and G.H.; Data curation, X.G.; Formal analysis, X.G.; Funding acquisition, G.H.; Methodology, X.G.; Resources, G.H.; Software, X.G.; Validation, X.G., G.H. and J.L.; Visualization, X.G. and J.L.; Writing—original draft, X.G.; Writing—review and editing, X.G., G.H. and S.Z. All authors have read and agreed to the published version of the manuscript.
Funding
This research was funded jointly by the National Natural Science Foundation of China (No. 41661144029; 41325010).
Institutional Review Board Statement
Not applicable.
Informed Consent Statement
Not applicable.
Data Availability Statement
The data presented in this study are available on request from the corresponding author.
Acknowledgments
The authors gratefully acknowledge Jie Zeng for assistance with field sampling and analysis.
Conflicts of Interest
The authors declare no conflict of interest.
References
- Qian, Y.; Zheng, L.; Jiang, C.; Chen, X.; Chen, Y.; Xu, Y.; Chen, Y. Environmental geochemical characteristics of rare-earth elements in surface waters in the Huainan coal mining area, Anhui Province, China. Environ. Geochem. Health 2022, 44, 3527–3539. [Google Scholar] [CrossRef] [PubMed]
- De Carlo, E.H.; Green, W.J. Rare earth elements in the water column of Lake Vanda, McMurdo Dry Valleys, Antarctica. Geochim. Cosmochim. Acta 2002, 66, 1323–1333. [Google Scholar] [CrossRef]
- Han, G.; Liu, M.; Li, X.; Zhang, Q. Sources and geochemical behaviors of rare earth elements in suspended particulate matter in a wet-dry tropical river. Environ. Res. 2023, 218, 115044. [Google Scholar] [CrossRef] [PubMed]
- Han, G.; Liu, C.-Q. Dissolved rare earth elements in river waters draining karst terrains in Guizhou Province, China. Aquat. Geochem. 2007, 13, 95–107. [Google Scholar] [CrossRef]
- Polyakov, O. Chapter 18-Technology of Ferroalloys with Rare-Earth Metals. In Handbook of Ferroalloys; Gasik, M., Ed.; Butterworth-Heinemann: Oxford, UK, 2013; pp. 459–469. [Google Scholar]
- Ebrahimi, P.; Barbieri, M. Gadolinium as an emerging microcontaminant in water resources: Threats and opportunities. Geosciences 2019, 9, 93. [Google Scholar] [CrossRef]
- Novotny, E.; Sander, A.; Mohseni, O.; Stefan, H. Chloride ion transport and mass balance in a metropolitan area using road salt. Water Resour. Res. 2009, 45, W12410. [Google Scholar] [CrossRef]
- Sholkovitz, E.R. The geochemistry of rare earth elements in the Amazon River estuary. Geochim. Cosmochim. Acta 1993, 57, 2181–2190. [Google Scholar] [CrossRef]
- Zhou, J.; Wu, Q.; Gao, S.; Zhang, X.; Wang, Z.; Wu, P.; Zeng, J. Coupled controls of the infiltration of rivers, urban activities and carbonate on trace elements in a karst groundwater system from Guiyang, Southwest China. Ecotoxicol. Environ. Saf. 2023, 249, 114424. [Google Scholar] [CrossRef]
- Kalender, L.; Aytimur, G. REE Geochemistry of Euphrates River, Turkey. J. Chem. 2016, 2016, 1012021. [Google Scholar] [CrossRef]
- Kumar, M.; Goswami, R.; Awasthi, N.; Das, R. Provenance and fate of trace and rare earth elements in the sediment-aquifers systems of Majuli River Island, India. Chemosphere 2019, 237, 124477. [Google Scholar] [CrossRef]
- Négrel, P. Water–granite interaction: Clues from strontium, neodymium and rare earth elements in soil and waters. Appl. Geochem. 2006, 21, 1432–1454. [Google Scholar] [CrossRef]
- Hatje, V.; Bruland, K.W.; Flegal, A.R. Increases in Anthropogenic Gadolinium Anomalies and Rare Earth Element Concentrations in San Francisco Bay over a 20 Year Record. Environ. Sci. Technol. 2016, 50, 4159–4168. [Google Scholar] [CrossRef]
- Jones, N. Materials science: The pull of stronger magnets. Nature 2011, 472, 22–23. [Google Scholar] [CrossRef]
- Mondal, S.; Nguyen, V.T.; Park, S.; Choi, J.; Vo, T.M.T.; Shin, J.H.; Kang, Y.-H.; Oh, J. Rare earth element doped hydroxyapatite luminescent bioceramics contrast agent for enhanced biomedical imaging and therapeutic applications. Ceram. Int. 2020, 46, 29249–29260. [Google Scholar] [CrossRef]
- Goodenough, K.M.; Wall, F.; Merriman, D. The Rare Earth Elements: Demand, Global Resources, and Challenges for Resourcing Future Generations. Nat. Resour. Res. 2018, 27, 201–216. [Google Scholar] [CrossRef]
- Gao, S.; Wang, Z.; Wu, Q.; Wang, W.; Peng, C.; Zeng, J.; Yuqing, W. Urban geochemistry and human-impacted imprint of dissolved trace and rare earth elements in a high-tech industrial city, Suzhou. Elem. Sci. Anth. 2021, 9, 00151. [Google Scholar] [CrossRef]
- Qu, R.; Han, G. Potassium isotopes of fertilizers as potential markers of anthropogenic input in ecosystems. Environ. Chem. Lett. 2022. [Google Scholar] [CrossRef]
- Wang, J.; Deng, P.; Wei, X.; Zhang, X.; Liu, J.; Huang, Y.; She, J.; Liu, Y.; Wan, Y.; Hu, H.; et al. Hidden risks from potentially toxic metal(loid)s in paddy soils-rice and source apportionment using lead isotopes: A case study from China. Sci. Total Environ. 2023, 856, 158883. [Google Scholar] [CrossRef]
- Gwenzi, W.; Mangori, L.; Danha, C.; Chaukura, N.; Dunjana, N.; Sanganyado, E. Sources, behaviour, and environmental and human health risks of high-technology rare earth elements as emerging contaminants. Sci. Total Environ. 2018, 636, 299–313. [Google Scholar] [CrossRef]
- Zhang, H.; Feng, J.; Zhu, W.; Liu, C.; Xu, S.; Shao, P.; Wu, D.; Yang, W.; Gu, J. Chronic toxicity of rare-earth elements on human beings. Biol. Trace Elem. Res. 2000, 73, 1–17. [Google Scholar] [CrossRef] [PubMed]
- Prince, M.R.; Zhang, H.; Morris, M.; MacGregor, J.L.; Grossman, M.E.; Silberzweig, J.; DeLapaz, R.L.; Lee, H.J.; Magro, C.M.; Valeri, A.M. Incidence of nephrogenic systemic fibrosis at two large medical centers. Radiology 2008, 248, 807–816. [Google Scholar] [CrossRef] [PubMed]
- Thomsen, H.S. Are the increasing amounts of gadolinium in surface and tap water dangerous? Acta Radiol. 2017, 58, 259–263. [Google Scholar] [CrossRef]
- Song, H.; Shin, W.-J.; Ryu, J.-S.; Shin, H.S.; Chung, H.; Lee, K.-S. Anthropogenic rare earth elements and their spatial distributions in the Han River, South Korea. Chemosphere 2017, 172, 155–165. [Google Scholar] [CrossRef]
- Jiang, C.; Li, Y.; Li, C.; Zheng, L.; Zheng, L. Distribution, source and behavior of rare earth elements in surface water and sediments in a subtropical freshwater lake influenced by human activities. Environ. Pollut. 2022, 313, 120153. [Google Scholar] [CrossRef] [PubMed]
- Zeng, J.; Han, G.; Zhang, S.; Liang, B.; Qu, R.; Liu, M.; Liu, J. Potentially toxic elements in cascade dams-influenced river originated from Tibetan Plateau. Environ. Res. 2022, 208, 112716. [Google Scholar] [PubMed]
- Perrat, E.; Parant, M.; Py, J.-S.; Rosin, C.; Cossu-Leguille, C. Bioaccumulation of gadolinium in freshwater bivalves. Environ. Sci. Pollut. Res. 2017, 24, 12405–12415. [Google Scholar] [CrossRef]
- Parant, M.; Sohm, B.; Flayac, J.; Perrat, E.; Chuburu, F.; Cadiou, C.; Rosin, C.; Cossu-Leguille, C. Impact of gadolinium-based contrast agents on the growth of fish cells lines. Ecotoxicol. Environ. Saf. 2019, 182, 109385. [Google Scholar] [CrossRef]
- Bispo, F.H.A.; de Menezes, M.D.; Fontana, A.; Sarkis, J.E.d.S.; Gonçalves, C.M.; de Carvalho, T.S.; Curi, N.; Guilherme, L.R.G. Rare earth elements (REEs): Geochemical patterns and contamination aspects in Brazilian benchmark soils. Environ. Pollut. 2021, 289, 117972. [Google Scholar] [CrossRef]
- Carpenter, D.; Boutin, C.; Allison, J.E.; Parsons, J.L.; Ellis, D.M. Uptake and Effects of Six Rare Earth Elements (REEs) on Selected Native and Crop Species Growing in Contaminated Soils. PLoS ONE 2015, 10, e0129936. [Google Scholar] [CrossRef]
- Silva, L.F.O.; Oliveira, M.L.S.; Crissien, T.J.; Santosh, M.; Bolivar, J.; Shao, L.; Dotto, G.L.; Gasparotto, J.; Schindler, M. A review on the environmental impact of phosphogypsum and potential health impacts through the release of nanoparticles. Chemosphere 2022, 286, 131513. [Google Scholar] [CrossRef]
- Liu, Y.; Wu, Q.; Jia, H.; Wang, Z.; Gao, S.; Zeng, J. Anthropogenic rare earth elements in urban lakes: Their spatial distributions and tracing application. Chemosphere 2022, 300, 134534. [Google Scholar] [CrossRef] [PubMed]
- Zhang, H.H.; Brown, D.F. Understanding urban residential water use in Beijing and Tianjin, China. Habitat Int. 2005, 29, 469–491. [Google Scholar] [CrossRef]
- Jiang, J.; Zhao, G.; Xu, Y.; Zhao, J.; Liu, L.; Liu, C.; Wang, D.; Li, Y. Occurrence and distribution characteristics of heavy metals in the surface water of Yongding River Basin, China. Environ. Sci. Pollut. Res. 2022, 29, 17821–17831. [Google Scholar] [CrossRef]
- Zhao, J.; Liu, Q.; Lin, L.; Lv, H.; Wang, Y. Assessing the comprehensive restoration of an urban river: An integrated application of contingent valuation in Shanghai, China. Sci. Total Environ. 2013, 458-460, 517–526. [Google Scholar] [CrossRef]
- Wang, X.; Li, J.; Li, Y.; Shen, Z.; Wang, X.; Yang, Z.; Lou, I. Is urban development an urban river killer? A case study of Yongding Diversion Channel in Beijing, China. J. Environ. Sci. 2014, 26, 1232–1237. [Google Scholar] [CrossRef]
- Wang, H.; Li, X.; Long, H.; Xu, X.; Bao, Y. Monitoring the effects of land use and cover type changes on soil moisture using remote-sensing data: A case study in China’s Yongding River basin. CATENA 2010, 82, 135–145. [Google Scholar] [CrossRef]
- Jiang, B.; Wong, C.P.; Lu, F.; Ouyang, Z.; Wang, Y. Drivers of drying on the Yongding River in Beijing. J. Hydrol. 2014, 519, 69–79. [Google Scholar] [CrossRef]
- Sun, K.; Hu, L.; Guo, J.; Yang, Z.; Zhai, Y.; Zhang, S. Enhancing the understanding of hydrological responses induced by ecological water replenishment using improved machine learning models: A case study in Yongding River. Sci. Total Environ. 2021, 768, 145489. [Google Scholar] [CrossRef]
- Li, X.; Han, G.; Liu, M.; Liu, J.; Zhang, Q.; Qu, R. Potassium and its isotope behaviour during chemical weathering in a tropical catchment affected by evaporite dissolution. Geochim. Cosmochim. Acta 2022, 316, 105–121. [Google Scholar] [CrossRef]
- McLennan, S.M. Chapter 7. Rare Earth Elements in Sedimentary Rocks: Influence of Provenance and Sedimentary Processes. In Geochemistry and Mineralogy of Rare Earth Elements; Bruce, R.L., McKay, G.A., Eds.; De Gruyter: Berlin, Germany, 1989; pp. 169–200. [Google Scholar]
- Bolhar, R.; Van Kranendonk, M.J. A non-marine depositional setting for the northern Fortescue Group, Pilbara Craton, inferred from trace element geochemistry of stromatolitic carbonates. Precambrian Res. 2007, 155, 229–250. [Google Scholar] [CrossRef]
- Kulaksız, S.; Bau, M. Anthropogenic dissolved and colloid/nanoparticle-bound samarium, lanthanum and gadolinium in the Rhine River and the impending destruction of the natural rare earth element distribution in rivers. Earth Planet. Sci. Lett. 2013, 362, 43–50. [Google Scholar] [CrossRef]
- Wang, L.; Han, X.; Ding, S.; Liang, T.; Zhang, Y.; Xiao, J.; Dong, L.; Zhang, H. Combining multiple methods for provenance discrimination based on rare earth element geochemistry in lake sediment. Sci. Total Environ. 2019, 672, 264–274. [Google Scholar] [CrossRef] [PubMed]
- Smith, C.; Liu, X.-M. Spatial and temporal distribution of rare earth elements in the Neuse River, North Carolina. Chem. Geol. 2018, 488, 34–43. [Google Scholar] [CrossRef]
- Kulaksız, S.; Bau, M. Rare earth elements in the Rhine River, Germany: First case of anthropogenic lanthanum as a dissolved microcontaminant in the hydrosphere. Environ. Int. 2011, 37, 973–979. [Google Scholar] [CrossRef] [PubMed]
- Ma, L.; Wang, W.-X. Dissolved rare earth elements in the Pearl River Delta: Using Gd as a tracer of anthropogenic activity from river towards the sea. Sci. Total Environ. 2023, 856, 159241. [Google Scholar] [CrossRef]
- Han, R.; Wang, Z.; Shen, Y.; Wu, Q.; Liu, X.; Cao, C.; Gao, S.; Zhang, J. Anthropogenic Gd in urban river water: A case study in Guiyang, SW China. Elem. Sci. Anthr. 2021, 9, 147. [Google Scholar] [CrossRef]
- Zaharescu, D.G.; Burghelea, C.I.; Dontsova, K.; Presler, J.K.; Maier, R.M.; Huxman, T.; Domanik, K.J.; Hunt, E.A.; Amistadi, M.K.; Gaddis, E.E.; et al. Ecosystem Composition Controls the Fate of Rare Earth Elements during Incipient Soil Genesis. Sci. Rep. 2017, 7, 43208. [Google Scholar] [CrossRef]
- Shiller, A.M. Dissolved rare earth elements in a seasonally snow-covered, alpine/subalpine watershed, Loch Vale, Colorado. Geochim. Cosmochim. Acta 2010, 74, 2040–2052. [Google Scholar] [CrossRef]
- Lerat-Hardy, A.; Coynel, A.; Schafer, J.; Marache, A.; Pereto, C.; Bossy, C.; Capdeville, M.-J.; Granger, D. Impacts of Highway Runoff on Metal Contamination Including Rare Earth Elements in a Small Urban Watershed: Case Study of Bordeaux Metropole (SW France). Arch. Environ. Contam. Toxicol. 2022, 82, 206–226. [Google Scholar] [CrossRef]
- Zeng, J.; Han, G.; Zhang, S.; Xiao, X.; Li, Y.; Gao, X.; Wang, D.; Qu, R. Rainwater chemical evolution driven by extreme rainfall in megacity: Implication for the urban air pollution source identification. J. Clean. Prod. 2022, 372, 133732. [Google Scholar] [CrossRef]
- Zeng, J.; Han, G.; Zhang, S.; Xiao, X.; Li, Y.; Gao, X.; Wang, D.; Qu, R. Response of dissolved organic carbon in rainwater during extreme rainfall period in megacity: Status, potential source, and deposition flux. Sustain. Cities Soc. 2023, 88, 104299. [Google Scholar] [CrossRef]
- Zeng, J.; Han, G.; Zhang, S.; Qu, R. Nitrate dynamics and source identification of rainwater in Beijing during rainy season: Insight from dual isotopes and Bayesian model. Sci. Total Environ. 2023, 856, 159234. [Google Scholar] [CrossRef] [PubMed]
- Ji, Z.; Cui, Y.; Zhang, S.; Chao, W.; Shao, J. Evaluation of the Impact of Ecological Water Supplement on Groundwater Restoration Based on Numerical Simulation: A Case Study in the Section of Yongding River, Beijing Plain. Water 2021, 13, 3059. [Google Scholar] [CrossRef]
- Liu, M.; Han, G.; Zeng, J.; Liang, B.; Zhang, Q. Effect of cascade reservoirs on geochemical characteristics of rare earth elements in suspended particle matter in Lancangjiang River, Southwest China. Aquat. Sci. 2022, 84, 19. [Google Scholar] [CrossRef]
- Bayon, G.; Toucanne, S.; Skonieczny, C.; Andre, L.; Bermell, S.; Cheron, S.; Dennielou, B.; Etoubleau, J.; Freslon, N.; Gauchery, T.; et al. Rare earth elements and neodymium isotopes in world river sediments revisited. Geochim. Cosmochim. Acta 2015, 170, 17–38. [Google Scholar] [CrossRef]
- Pereto, C.; Coynel, A.; Lerat-Hardy, A.; Gourves, P.-Y.; Schäfer, J.; Baudrimont, M. Corbicula fluminea: A sentinel species for urban Rare Earth Element origin. Sci. Total Environ. 2020, 732, 138552. [Google Scholar] [CrossRef]
- Wei, J.; Zheng, X.; Liu, J.; Zhang, G.; Zhang, Y.; Wang, C.; Liu, Y. The Levels, Sources, and Spatial Distribution of Heavy Metals in Soils from the Drinking Water Sources of Beijing, China. Sustainability 2021, 13, 3719. [Google Scholar]
- Han, G.; Xu, Z.; Tang, Y.; Zhang, G. Rare Earth Element Patterns in the Karst Terrains of Guizhou Province, China: Implication for Water/Particle Interaction. Aquat. Geochem. 2009, 15, 457. [Google Scholar] [CrossRef]
- Han, G.; Yang, K.; Zeng, J. Spatio-Temporal Distribution and Environmental Behavior of Dissolved Rare Earth Elements (REE) in the Zhujiang River, Southwest China. Bull. Environ. Contam. Toxicol. 2022, 108, 555–562. [Google Scholar] [CrossRef]
- Möller, P.; Morteani, G.; Dulski, P. Anomalous Gadolinium, Cerium, and Yttrium Contents in the Adige and Isarco River Waters and in the Water of Their Tributaries (Provinces Trento and Bolzano/Bozen, NE Italy). Acta Hydrochim. Hydrobiol. 2003, 31, 225–239. [Google Scholar] [CrossRef]
- Kandarakis, I.; Cavouras, D.; Panayiotakis, G.S.; Triantis, D.; Nomicos, C.D. Europium-activated phosphors for use in X-ray detectors of medical imaging systems. Eur. Radiol. 1998, 8, 313–318. [Google Scholar] [CrossRef] [PubMed]
- Bau, M.; Dulski, P. Distribution of yttrium and rare-earth elements in the Penge and Kuruman iron-formations, Transvaal Supergroup, South Africa. Precambrian Res. 1996, 79, 37–55. [Google Scholar] [CrossRef]
- Guo, W.; Fu, Y.; Ruan, B.; Ge, H.; Zhao, N. Agricultural non-point source pollution in the Yongding River Basin. Ecol. Indic. 2014, 36, 254–261. [Google Scholar] [CrossRef]
- Birka, M.; Wehe, C.A.; Telgmann, L.; Sperling, M.; Karst, U. Sensitive quantification of gadolinium-based magnetic resonance imaging contrast agents in surface waters using hydrophilic interaction liquid chromatography and inductively coupled plasma sector field mass spectrometry. J. Chromatogr. A 2013, 1308, 125–131. [Google Scholar] [CrossRef] [PubMed]
- Wiche, O.; Zertani, V.; Hentschel, W.; Achtziger, R.; Midula, P. Germanium and rare earth elements in topsoil and soil-grown plants on different land use types in the mining area of Freiberg (Germany). J. Geochem. Explor. 2017, 175, 120–129. [Google Scholar] [CrossRef]
- Han, G.; Li, F.; Tang, Y. Organic Matter Impact on Distribution of Rare Earth Elements in Soil Under Different Land Uses. CLEAN Soil Air Water 2017, 45, 1600235. [Google Scholar] [CrossRef]
- Hoshyari, E.; Hassanzadeh, N.; Keshavarzi, B.; Jaafarzadeh, N.; Rezaei, M. Spatial distribution, source apportionment, and ecological risk assessment of elements (PTEs, REEs, and ENs) in the surface soil of shiraz city (Iran) under different land-use types. Chemosphere 2023, 311, 137045. [Google Scholar] [CrossRef]
- Ullah, Z.; Khan, H.; Waseem, A.; Mahmood, Q.; Farooq, U. Water quality assessment of the River Kabul at Peshawar, Pakistan: Industrial and urban wastewater impacts. J. Water Chem. Technol. 2013, 35, 170–176. [Google Scholar] [CrossRef]
- Keeney, D.R.; DeLuca, T.H. Des Moines River Nitrate in Relation to Watershed Agricultural Practices: 1945 Versus 1980s. J. Environ. Qual. 1993, 22, 267–272. [Google Scholar]
- Yang, Y.; Liu, Y.; Li, Y.; Li, J. Measure of urban-rural transformation in Beijing-Tianjin-Hebei region in the new millennium: Population-land-industry perspective. Land Use Policy 2018, 79, 595–608. [Google Scholar] [CrossRef]
- Liu, C.; Pan, C.; Chang, Y.; Luo, M. An integrated autoregressive model for predicting water quality dynamics and its application in Yongding River. Ecol. Indic. 2021, 133, 108354. [Google Scholar] [CrossRef]
- Hao, Q.; Shao, J.; Cui, Y.; Xie, Z. Applicability of artificial recharge of groundwater in the Yongding River alluvial fan in Beijing through numerical simulation. J. Earth Sci. 2014, 25, 575–586. [Google Scholar] [CrossRef]
- Fu, Y.; Gao, T.; Yan, L.; Zhang, A.; Ruan, B. Agro-ecological compensation standard based on emergy analysis in Yongding River basin. Nongye Gongcheng Xuebao Trans. Chin. Soc. Agric. Eng. 2013, 29, 209–217. [Google Scholar] [CrossRef]
- Malhotra, N.; Hsu, H.-S.; Liang, S.-T.; Roldan, M.J.M.; Lee, J.-S.; Ger, T.-R.; Hsiao, C.-D. An Updated Review of Toxicity Effect of the Rare Earth Elements (REEs) on Aquatic Organisms. Animals 2020, 10, 1663. [Google Scholar] [CrossRef] [PubMed]
- González, V.; Vignati, D.A.L.; Pons, M.-N.; Montarges-Pelletier, E.; Bojic, C.; Giamberini, L. Lanthanide ecotoxicity: First attempt to measure environmental risk for aquatic organisms. Environ. Pollut. 2015, 199, 139–147. [Google Scholar] [CrossRef]
- Romero-Freire, A.; Minguez, L.; Pelletier, M.; Cayer, A.; Caillet, C.; Devin, S.; Gross, E.M.; Guérold, F.; Pain-Devin, S.; Vignati, D.A.L.; et al. Assessment of baseline ecotoxicity of sediments from a prospective mining area enriched in light rare earth elements. Sci. Total Environ. 2018, 612, 831–839. [Google Scholar] [CrossRef]
Figure 1.
Sampling sites on the Yongding River.

Figure 2.
Spatial distribution of the total REEs content in the Yongding River.

Figure 3.
PAAS-normalized REE distribution pattern.

Figure 4.
δCe-δEu diagram of REEs in the Yongding River.

Figure 5.
Population density in the Yongding River basin.

Figure 6.
The distribution of land use in the Yongding River basin (data sourced from the website http://landsat.datamirror.csdb.cn, accessed on 20 December 2022).
Figure 6.
The distribution of land use in the Yongding River basin (data sourced from the website http://landsat.datamirror.csdb.cn, accessed on 20 December 2022).

Figure 7.
The cluster results of water samples using Gdanth, NO3−/Na+ and Cl−/Na+ as co-indicators in the Yongding River basin.
Figure 7.
The cluster results of water samples using Gdanth, NO3−/Na+ and Cl−/Na+ as co-indicators in the Yongding River basin.


Table 1.
Dissolved REE contents in the Yongding River (in ng/L).
| Site | La | Ce | Pr | Nd | Sm | Eu | Gd | Tb | Dy | Ho | Er | Tm | Yb | Lu |
|---|---|---|---|---|---|---|---|---|---|---|---|---|---|---|
| YD-1 | 1.53 | 3.77 | 0.90 | 4.94 | 1.08 | 0.75 | 5.15 | 0.30 | 3.08 | 0.72 | 2.49 | 0.48 | 4.58 | 0.90 |
| YD-2 | 5.79 | 5.67 | 1.78 | 8.81 | 1.90 | 0.83 | 11.84 | 0.42 | 4.01 | 1.04 | 3.32 | 0.53 | 4.01 | 0.83 |
| YD-3 | 2.61 | 3.42 | 0.84 | 4.02 | 0.96 | 0.63 | 4.44 | 0.21 | 2.07 | 0.39 | 1.71 | 0.39 | 3.54 | 0.81 |
| YD-4 | 15.79 | 14.50 | 3.35 | 15.71 | 3.71 | 1.74 | 8.50 | 0.65 | 6.94 | 1.65 | 5.18 | 0.88 | 6.38 | 1.29 |
| YD-5 | 5.43 | 5.46 | 4.87 | 16.19 | 0.71 | 0.50 | 12.45 | 0.15 | 1.65 | 0.44 | 1.74 | 0.29 | 2.98 | 0.71 |
| YD-6 | 5.85 | 8.20 | 1.51 | 7.25 | 2.35 | 0.77 | 7.46 | 0.45 | 4.28 | 0.92 | 2.91 | 0.50 | 4.81 | 1.19 |
| YD-7 | 4.41 | 4.71 | 1.43 | 6.50 | 1.16 | 0.60 | 4.29 | 0.27 | 2.15 | 0.54 | 1.73 | 0.30 | 1.67 | 0.30 |
| YD-8 | 2.24 | 3.35 | 0.57 | 2.60 | 0.66 | 0.78 | 7.81 | 0.12 | 0.87 | 0.24 | 0.81 | 0.15 | 1.05 | 0.24 |
| YD-9 | 1.28 | 3.81 | 0.66 | 2.71 | 0.74 | 0.36 | 3.40 | 0.15 | 1.58 | 0.36 | 1.34 | 0.21 | 1.49 | 0.27 |
| YD-10 | 0.87 | 0.99 | 0.33 | 1.53 | 0.45 | 0.54 | 0.96 | 0.09 | 0.81 | 0.24 | 0.78 | 0.12 | 0.75 | 0.09 |
| YD-11 | 3.98 | 5.93 | 1.05 | 3.92 | 0.39 | 0.30 | 20.51 | 0.06 | 0.51 | 0.15 | 0.45 | 0.09 | 0.57 | 0.15 |
| YD-12 | 0.99 | 1.61 | 0.24 | 0.90 | 0.15 | 0.27 | 1.37 | 0.03 | 0.24 | 0.06 | 0.15 | 0.03 | 0.15 | 0.09 |
| YD-13 | 1.35 | 2.93 | 0.36 | 1.44 | 0.33 | 0.30 | 2.18 | 0.03 | 0.27 | 0.03 | 0.15 | 0.03 | 0.15 | 0.06 |
| YD-14 | 1.70 | 2.62 | 0.36 | 1.43 | 0.21 | 0.27 | 0.48 | 0.03 | 0.30 | 0.06 | 0.09 | 0.03 | 0.12 | 0.03 |
| YD-15 | 1.96 | 3.75 | 0.60 | 3.01 | 0.74 | 0.57 | 4.43 | 0.15 | 1.64 | 0.39 | 1.64 | 0.27 | 1.99 | 0.48 |
| YD-16 | 2.07 | 3.93 | 0.66 | 3.63 | 0.69 | 0.54 | 5.22 | 0.21 | 2.01 | 0.48 | 1.98 | 0.30 | 2.49 | 0.51 |
| YD-17 | 0.89 | 2.08 | 0.65 | 3.59 | 0.98 | 0.53 | 19.83 | 0.27 | 3.53 | 0.98 | 3.53 | 0.65 | 6.61 | 1.66 |
Table 2.
Element anomalies of water samples from the Yongding River.
| Sample | ∑REE | LREE/HREE | LaSN/YbSN | δCe | δGd | δEu | Gdanth | Cl− | NO3− | Na+ | pH | DO |
|---|---|---|---|---|---|---|---|---|---|---|---|---|
| ng L−1 | ng L−1 | mg/L | mg/L | mg/L | mg/L | |||||||
| YD-1 | 30.66 | 0.29 | 0.02 | 0.61 | 3.42 | 1.50 | 4.83 | 223.90 | 11.59 | 178.60 | 7.72 | 2.65 |
| YD-2 | 50.77 | 0.41 | 0.11 | 0.35 | 5.38 | 0.83 | 11.37 | 226.81 | 10.50 | 184.60 | 7.73 | 2.95 |
| YD-3 | 26.01 | 0.45 | 0.05 | 0.47 | 3.99 | 1.44 | 4.20 | 176.10 | 10.31 | 148.80 | 7.64 | 2.75 |
| YD-4 | 86.26 | 0.63 | 0.18 | 0.41 | 2.34 | 1.46 | 7.72 | 261.42 | 9.34 | 212.30 | 7.75 | 3.18 |
| YD-5 | 53.57 | 0.90 | 0.13 | 0.26 | 15.73 | 0.80 | 12.28 | 211.04 | 3.96 | 164.30 | 7.59 | 1.83 |
| YD-6 | 48.45 | 0.57 | 0.09 | 0.56 | 3.05 | 0.87 | 6.93 | 270.95 | 3.33 | 224.90 | 7.58 | 2.85 |
| YD-7 | 30.06 | 0.62 | 0.20 | 0.39 | 3.06 | 1.26 | 3.99 | 125.22 | 4.44 | 96.33 | 7.79 | 4.90 |
| YD-8 | 21.48 | 0.57 | 0.16 | 0.62 | 11.74 | 1.62 | 7.66 | 46.00 | 0 | 35.05 | 8.67 | 6.76 |
| YD-9 | 18.35 | 0.39 | 0.06 | 0.91 | 4.21 | 1.06 | 3.22 | 169.41 | 0 | 177.40 | 9.04 | 8.00 |
| YD-10 | 8.53 | 0.46 | 0.09 | 0.38 | 1.97 | 3.87 | 0.85 | 79.97 | 8.14 | 50.88 | 8.45 | 8.10 |
| YD-11 | 38.05 | 0.60 | 0.52 | 0.67 | 58.70 | 0.50 | 20.43 | 75.31 | 5.78 | 62.16 | 8.77 | 9.41 |
| YD-12 | 6.27 | 0.94 | 0.49 | 0.77 | 8.49 | 2.79 | 1.34 | 55.50 | 19.04 | 55.53 | 8.24 | 8.24 |
| YD-13 | 9.60 | 1.28 | 0.66 | 0.94 | 10.31 | 1.66 | 2.14 | 80.23 | 14.38 | 77.11 | 8.56 | 8.69 |
| YD-14 | 7.72 | 1.84 | 1.05 | 0.75 | 2.68 | 4.00 | 0.44 | 25.18 | 24.15 | 23.77 | 8.32 | 11.07 |
| YD-15 | 21.61 | 0.37 | 0.07 | 0.69 | 5.50 | 1.47 | 4.26 | 123.62 | 2.88 | 120.80 | 8.63 | 8.78 |
| YD-16 | 24.72 | 0.33 | 0.06 | 0.64 | 5.03 | 1.34 | 5.00 | 142.11 | 2.80 | 140.70 | 8.60 | 6.79 |
| YD-17 | 45.77 | 0.13 | 0.01 | 0.52 | 14.72 | 0.57 | 19.54 | 141.75 | 5.74 | 125.40 | 8.20 | 7.00 |
Table 3.
Proportion of land use types in the Yongding River basin.
| Buffer Zone | Woodland | Grassland | Cropland | Urban Land | Unused Land | Wetland |
|---|---|---|---|---|---|---|
| 1 | 0.11 | 0.50 | 0.27 | 0.05 | 0.07 | 0.00 |
| 2 | 0.17 | 0.55 | 0.19 | 0.03 | 0.05 | 0.00 |
| 3 | 0.15 | 0.53 | 0.21 | 0.04 | 0.06 | 0.01 |
| 4 | 0.24 | 0.50 | 0.17 | 0.04 | 0.05 | 0.00 |
| 5 | 0.14 | 0.50 | 0.21 | 0.08 | 0.06 | 0.00 |
| 6 | 0.28 | 0.37 | 0.16 | 0.13 | 0.06 | 0.00 |
| 7 | 0.27 | 0.32 | 0.17 | 0.16 | 0.07 | 0.00 |
| 8 | 0.26 | 0.27 | 0.21 | 0.17 | 0.08 | 0.00 |
| 9 | 0.25 | 0.23 | 0.28 | 0.15 | 0.08 | 0.00 |
| 10 | 0.23 | 0.21 | 0.35 | 0.14 | 0.08 | 0.00 |
| 11 | 0.20 | 0.17 | 0.39 | 0.15 | 0.08 | 0.00 |
| 12 | 0.19 | 0.17 | 0.39 | 0.17 | 0.08 | 0.00 |
| 13 | 0.19 | 0.16 | 0.39 | 0.17 | 0.09 | 0.00 |
| 14 | 0.18 | 0.15 | 0.41 | 0.16 | 0.09 | 0.01 |
| 15 | 0.17 | 0.14 | 0.41 | 0.18 | 0.09 | 0.01 |
Table 4.
Spearman correlations of anthropogenic Gd and REE concentrations with land use in the Yongding River (** p < 0.01; * p < 0.05).
Table 4.
Spearman correlations of anthropogenic Gd and REE concentrations with land use in the Yongding River (** p < 0.01; * p < 0.05).
| Cropland | Urban Land | Grassland | Woodland | |
|---|---|---|---|---|
| La | 0.59 * | 0.24 | −0.55 * | −0.01 |
| Ce | 0.51 * | 0.38 | −0.60 ** | 0.12 |
| Pr | 0.69 ** | 0.51 * | −0.74 ** | 0.05 |
| Nd | 0.72 ** | 0.55 * | −0.78 ** | 0.03 |
| Sm | 0.73 ** | 0.58 * | −0.74 ** | 0.04 |
| Eu | 0.68 ** | 0.51 * | −0.71 ** | 0.04 |
| Gd | 0.45 * | 0.37 | −0.56 * | 0.15 |
| Tb | 0.74 ** | 0.56 * | −0.74 ** | −0.06 |
| Dy | 0.80 ** | 0.55 * | −0.76 ** | −0.13 |
| Ho | 0.80 ** | 0.59 * | −0.76 ** | −0.16 |
| Er | 0.80 ** | 0.58 * | −0.77 ** | −0.15 |
| Tm | 0.79 ** | 0.56 * | −0.76 ** | −0.14 |
| Yb | 0.78 ** | 0.59 * | −0.76 ** | −0.15 |
| Lu | 0.78 ** | 0.58 * | −0.75 ** | −0.18 |
| ∑REE | 0.65 ** | 0.51 * | −0.74 ** | 0.06 |
| Gdanth | 0.44 * | 0.33 | −0.54 * | 0.17 |
Disclaimer/Publisher’s Note: The statements, opinions and data contained in all publications are solely those of the individual author(s) and contributor(s) and not of MDPI and/or the editor(s). MDPI and/or the editor(s) disclaim responsibility for any injury to people or property resulting from any ideas, methods, instructions or products referred to in the content. |
© 2023 by the authors. Licensee MDPI, Basel, Switzerland. This article is an open access article distributed under the terms and conditions of the Creative Commons Attribution (CC BY) license (https://creativecommons.org/licenses/by/4.0/).
Share and Cite
MDPI and ACS Style
Gao, X.; Han, G.; Liu, J.; Zhang, S. Spatial Distribution and Sources of Rare Earth Elements in Urban River Water: The Indicators of Anthropogenic Inputs. Water 2023, 15, 654. https://doi.org/10.3390/w15040654
AMA Style
Gao X, Han G, Liu J, Zhang S. Spatial Distribution and Sources of Rare Earth Elements in Urban River Water: The Indicators of Anthropogenic Inputs. Water. 2023; 15(4):654. https://doi.org/10.3390/w15040654
Chicago/Turabian StyleGao, Xi, Guilin Han, Jinke Liu, and Shitong Zhang. 2023. "Spatial Distribution and Sources of Rare Earth Elements in Urban River Water: The Indicators of Anthropogenic Inputs" Water 15, no. 4: 654. https://doi.org/10.3390/w15040654
Note that from the first issue of 2016, this journal uses article numbers instead of page numbers. See further details here.