Article

Production, Application, and Efficacy of Biodefoamers from Bacillus, Aeromonas, Klebsiella, Comamonas spp. Consortium for the Defoamation of Poultry Slaughterhouse Wastewater

by
Cynthia Dlangamandla
1,
Seteno K. O. Ntwampe
2,
Moses Basitere
3,*,
Boredi S. Chidi
1,
Benjamin I. Okeleye
1 and
Melody R. Mukandi
1
1
Bioresource Engineering Research Group (BioERG), Department of Chemical Engineering, Cape Peninsula University of Technology, P.O. Box 652, Cape Town 8000, South Africa
2
Centre of Excellence for Carbon-Based Fuels, School of Chemical and Minerals Engineering, North West University, P.O. Box 1290, Potchefstroom 2520, South Africa
3
Academic Support Programme for Engineering in Cape Town (ASPECT) & Water Research Group, Department of Civil Engineering, University of Cape Town, Rondebosch, Cape Town 7700, South Africa
*
Author to whom correspondence should be addressed.
Water 2023, 15(4), 655; https://doi.org/10.3390/w15040655
Submission received: 5 December 2022 / Revised: 20 January 2023 / Accepted: 29 January 2023 / Published: 8 February 2023
(This article belongs to the Section Wastewater Treatment and Reuse)

Abstract

:
Activated sludge (AS) treatment systems’ major limitation is the nuisance foaming at the surface of the aeration basin in wastewater treatment plants (WWTPs). This foam can be stabilized by biofoamers and surfactants in the wastewater to be treated. In order to control foam, synthetic defoamers are used; however, these defoamers are toxic to the environment. This study aimed to optimize the production of biodefoamers by quantifying foam reduction efficiency and foam collapse by the isolate pervasive to poultry slaughterhouse wastewater (PSW). Before their identification and characterization, nine bacterial isolates were isolated and assessed for foam reduction efficiency. These organisms produced minute biodefoamers under various conditions generated on the response surface methodology (RSM). The isolates that produced biodefoamers with high foam reduction efficiency and at a lower foam collapse rate were Bacillus, Aeromonas, Klebsiella, and Commamonas spp. consortia. At 4% (v defoamer/v PSW), the crude defoamers produced by the consortium had 96% foam reduction efficiency at 1.7 mm/s foam collapse rate, which was comparable to 96% foam reduction efficiency and 2.5 mm/s foam collapse rate for active silicone polymer antifoam A/defoamer by Sigma-Aldrich, a synthetic defoamer. At 2.5 mm/s, all of which were achieved at pH 7 and in less than 50 s. The application of the biodefoamer resulted in sludge compacted flocs, with filament protruding flocs observed when a synthetic defoamer was used. The biodefoamer showed the presence of alkane, amine, carboxyl and hydroxyl groups, which indicated a polysaccharide core structure. The 1H NMR analysis further confirmed that the biodefoamers were carbohydrate polymers. This study reports for the first time on the efficiency and comparability of a biodefoamer to a synthetic defoamer.

1. Introduction

The activated sludge process (ASP) microbiome is a significant constituent that influences the performance of biological wastewater treatment plants (WWTPs). ASP converts or absorbs organics, ammonium nitrogen, and some phosphorous, including suspended or dissolved solids, among many other contaminants [1]. The efficiency of the AS system depends on organisms’ ability to form active conglomerates in an aerated environment. This process is influenced by many factors, such as environmental conditions (pH, temperature, dissolved oxygen (DO)) and climate change. Climate change results in increased rainfall and this increases the influent flow rate by 15–25% as compared to dry weather. It also reduces total suspended solids (TSS), chemical oxygen demand (COD) and ammonium nitrogen (N-NH4+) concentration due to its dilution effect in the sewer and WWTP. Although these systems are designed to carry over capacity during increased precipitation, sludge washout can be encountered, leading to the inefficiency of the system in the long term as well as high energy consumption and will require increased operational costs [2,3,4]. To curb this problem, storm overflow and combined sewer overflow tanks are used. However, during wet weather flow, the combined sewer may overflow into receiving water bodies and contaminate it; hence, these are short-term solutions. Therefore, an implementable research for long-term solutions is required [3].
When treating wastewater that contains high concentrations of proteins, fat oil and grease (FOG), the system efficiency becomes a challenge because proteins are surface active and they reduce foam drainage, whereas FOG solidifies at lower temperatures, which results in the clogging of pipes and membrane fouling. Furthermore, it enhances filamentous bacteria growth which results in foam formation [5], herein referred to as biofoam. The generation of biofoam at the surface of an AS aeration tank is a nuisance and is thus considered undesirable. Mycolic acid-containing filamentous bacteria are significant contributors to this biofoam [6]. Furthermore, surfactants present in wastewater from various sources, including biosurfactants produced by numerous microorganisms in the AS in combination with aeration, culminate in foam formation. In most instances, biofoam producers result in foam stabilization within WWTPs [7]. The excessive growth of these organisms leads to the production of biosurfactants and sludge deflocculants, which in turn lead to poor sludge settleability and excessive foaming. This increases WWTPs operational costs associated with defoaming operations, culminating in the deterioration of the effluent quality, requiring further treatment and the extension of sludge retention time, which is energy intensive [8]. Periodically, this results in the loss of essential microbiological cells in the AS. This necessitates efficient biological methods that are less energy intensive, which will shorten the sludge retention time and aeration time.
Numerous strategies have been employed to reduce biofoam formation. These strategies include those termed non-specific and specific strategies. Non-specific strategies include using chemical (synthetic) defoamers and physical techniques (water sprays and the adjustment of operational conditions) to remove or reduce foam. In contrast, specific strategies include the use of biological techniques that target the cause of biofoam formation [9].
Using chemical defoamers such as polyaluminum chloride results in sludge disintegration, which inhibits nitrification and increases soluble chemical oxygen demand (COD) concentration, while oil-based defoamers result in overgrowth of the biofoam-producing filamentous bacteria [10]. Furthermore, using chemical defoamers results in their bioaccumulation downstream, whereas applying physical methods requires adjustment or the design of new bioreactors. This necessitates the need to develop new environmentally benign, energy efficient and economic strategies that will use the water constituents to be treated to reduce the excessive growth of biofoamers rather than treating the symptoms, i.e., biofoam.
The literature reviewed reveals that several biological methods have been used successfully to reduce foam-forming filamentous bacteria such that foam formation is minute in AS systems. These methods include the use of biological reactors, such as up-flow packed bed bioreactors, to enhance nitrogen removal and biofilm granulation, as well as aerobic sludge granulation that produces granular sludge that results in nutrient removal and enhanced settling properties and reduces biofoam [9,11]. Bacteriophages that can be produced from various organisms isolated from various wastewaters have also been used, and these bacteriophages were previously determined to improve sludge settleability [10]. A study by Pajdak-Stós et al., [12] elsewhere highlighted that Lecane inermis rotifers were observed to “ingest” and decrease the number of branched filamentous bacteria in AS.
This study focused on producing a biodefoamer from poultry slaughterhouse (PSW) consortia isolates for use in PSW biofoam reduction compared to a commonly used synthetic defoamer. This was assessed using foam reduction efficiency and foam collapse rate. Furthermore, AS floc integrity and maintenance were also assessed microscopically to ascertain agglomeration, and thus settleability, when the produced biodefoamers were used.

2. Materials and Methods

2.1. Isolation and Identification

The isolates were collected using sterile swabs from a PSW discharge spout of a commercial poultry product producer (Cape Town, South Africa). Serial dilutions were performed, and the nutrient agar plates were inoculated using the swabs by a spread plating technique after incubation at 37 °C overnight. After that, they were cultivated into fresh nutrient agar plates, and the agar plates with pure colonies were stored at 4 °C and recultured daily for further experiments. The pure cultures (n = 9) were subjected to mixed liquor suspended solids (MLSS) before biofoam generation to determine their efficiency concerning foam reduction efficiency and foam collapse. Some (n = 4) of the identified isolates were highly efficient; they were gram stained and viewed under a microscope to determine their gram reaction. The pure culture plates were sent to Inqaba Biotechnical Industries (Pty) Ltd. (Muckleneuk, Pretoria, South Africa) for DNA analysis and identification. The DNA of the pure isolates was extracted using the Quick-DNA Fungal/Bacterial Miniprep Kit (Zymo Research, Irvine, CA, USA, Catalogue No. D6005). The 16S rRNA target region was amplified using OneTaq® Quick-Load® 2X Master-Mix (New England Biolabs, Ipswich, MA, USA, NEB Catalogue No. M0486) with primers 16S-27F and 16S-1492R with the sequence (5′–3′) AGAGTTTGATCMTGGCTCAT and CGGTTACCTTGTTACGACTT, respectively.
The extracted fragments were sequenced in both the forward and reverse directions using NimaGen BrilliantDye™ Terminator Cycle Sequencing kit v3.1 (NimaGen B.V., CG Nijmegen, The Netherlands, BRD3-100/1000) and were purified by Zymo Research ZR-96 DNA Sequencing Clean-up Kit™ (Zymo Research, Irvine, CA, USA, Catalogue No. D4050). The purified DNA fragments were analyzed for each sample on the Applied Biosystems™ 3500xL Genetic Analyzer (Applied Biosystems, Waltham, MA, USA). A Qiagen CLC Main Workbench (Hilden, Germany, v7.6) was used to analyze the ab1 files generated by the ABI 3500xL genetic analyzer, and the results were obtained using a Basic Local Alignment Search Tool (BLAST) search provided by the National Center for Biotechnology Information (NCBI, http://www.ncbi.nlm.nih.gov, accessed on 4 December 2022).

2.2. Metagenomics Analysis of the MLSS Microbial Community

From the MLSS samples collected using 4 L polypropylene bottles (n = 9) from an aeration tank of a WWTP near Cape Town, South Africa, 100 mL of the MLSS samples was filtered through a 0.22 µm millipore membrane filter (Merck Millipore, Burlington, MA, USA) and the cells were resuspended in 5 mL sterile millipore water for DNA extraction. DNA was extracted from the suspension solution using commercially available DNA extraction kits (Promega, Madison, WI, USA) following the manufacturer’s instructions. The 16S rRNA target regions were sequenced and amplified using a OneTaq® Quick-Load® 2X Master-Mix (New England Biolabs, Ipswich, MA, USA, Catalogue No. M0486) with the primers 16S-27 F and 16S-518 R with the sequence (5–3) AGAGTTTGATCMTGGCTCAG and ATTACCGCGGCTGCTGG, respectively. Moreover, the V1 and V3 targeted sequences were used for PCR amplification of the purified DNA sequence. The PCR amplicons were sent for sequencing at Inqaba Biotechnical Industries (Pty) Ltd. (Muckleneuk, Pretoria, South Africa).
The purified PCR amplicons were gel purified and repaired, and the amplicons were sequenced on the PacBio Sequel II system (Pacific Biosciences Inc., Menlo Park, CA, USA). Raw subreads were processed through the SMRT(R) Link (v9.0) Circular Consensus Sequences (CCS) algorithm, which estimates/computes consensus sequences to produce highly accurate reads (>QV40). These reads were processed through Vsearch (https://github.com/torognes/vsearch, accessed on 4 December 2022) (GitHub Inc., San Francisco, CA, USA), and taxonomic information was determined based on the QIIME 2™. The results were acquired through BLAST provided by the National Center for Biotechnology Information (NCBI, http://www.ncbi.nlm.nih.gov, accessed on 4 December 2022). The sequences were further deposited into the national NCBI, and the sequence read archive (SRA) databases before acquiring the accession numbers of single species.

2.3. Biodefoamer Production and Extraction

The pure culture isolates (n = 4) growing on nutrient agar plates were all inoculated as a consortium in nutrient broth (50 mL), where conical flasks (250 mL) were used and subsequently incubated at 37 °C for 24 h at 120 rpm (Labwit ZWYR-240 shaking incubator, Labwit Scientific, Burwood East, Vic., Australia) to produce a seed culture. A volume (1 mL) of the 24 h old seed culture in the form of a consortium was inoculated into 99 mL of nutrient broth to a final volume of 100 mL in 250 mL conical flasks and further incubated at a temperature of 37 °C at 120 rpm for 24 h. After that, 15 mL of each sample was centrifuged (Hermle-Z233M-2 centrifuge, Labortechnik GmbH, Wasserburg, Germany) at 15,000 rpm for 30 min to sediment the cells, and the supernatant was extracted and used as a crude biodefoamer. All experiments were conducted in triplicate.

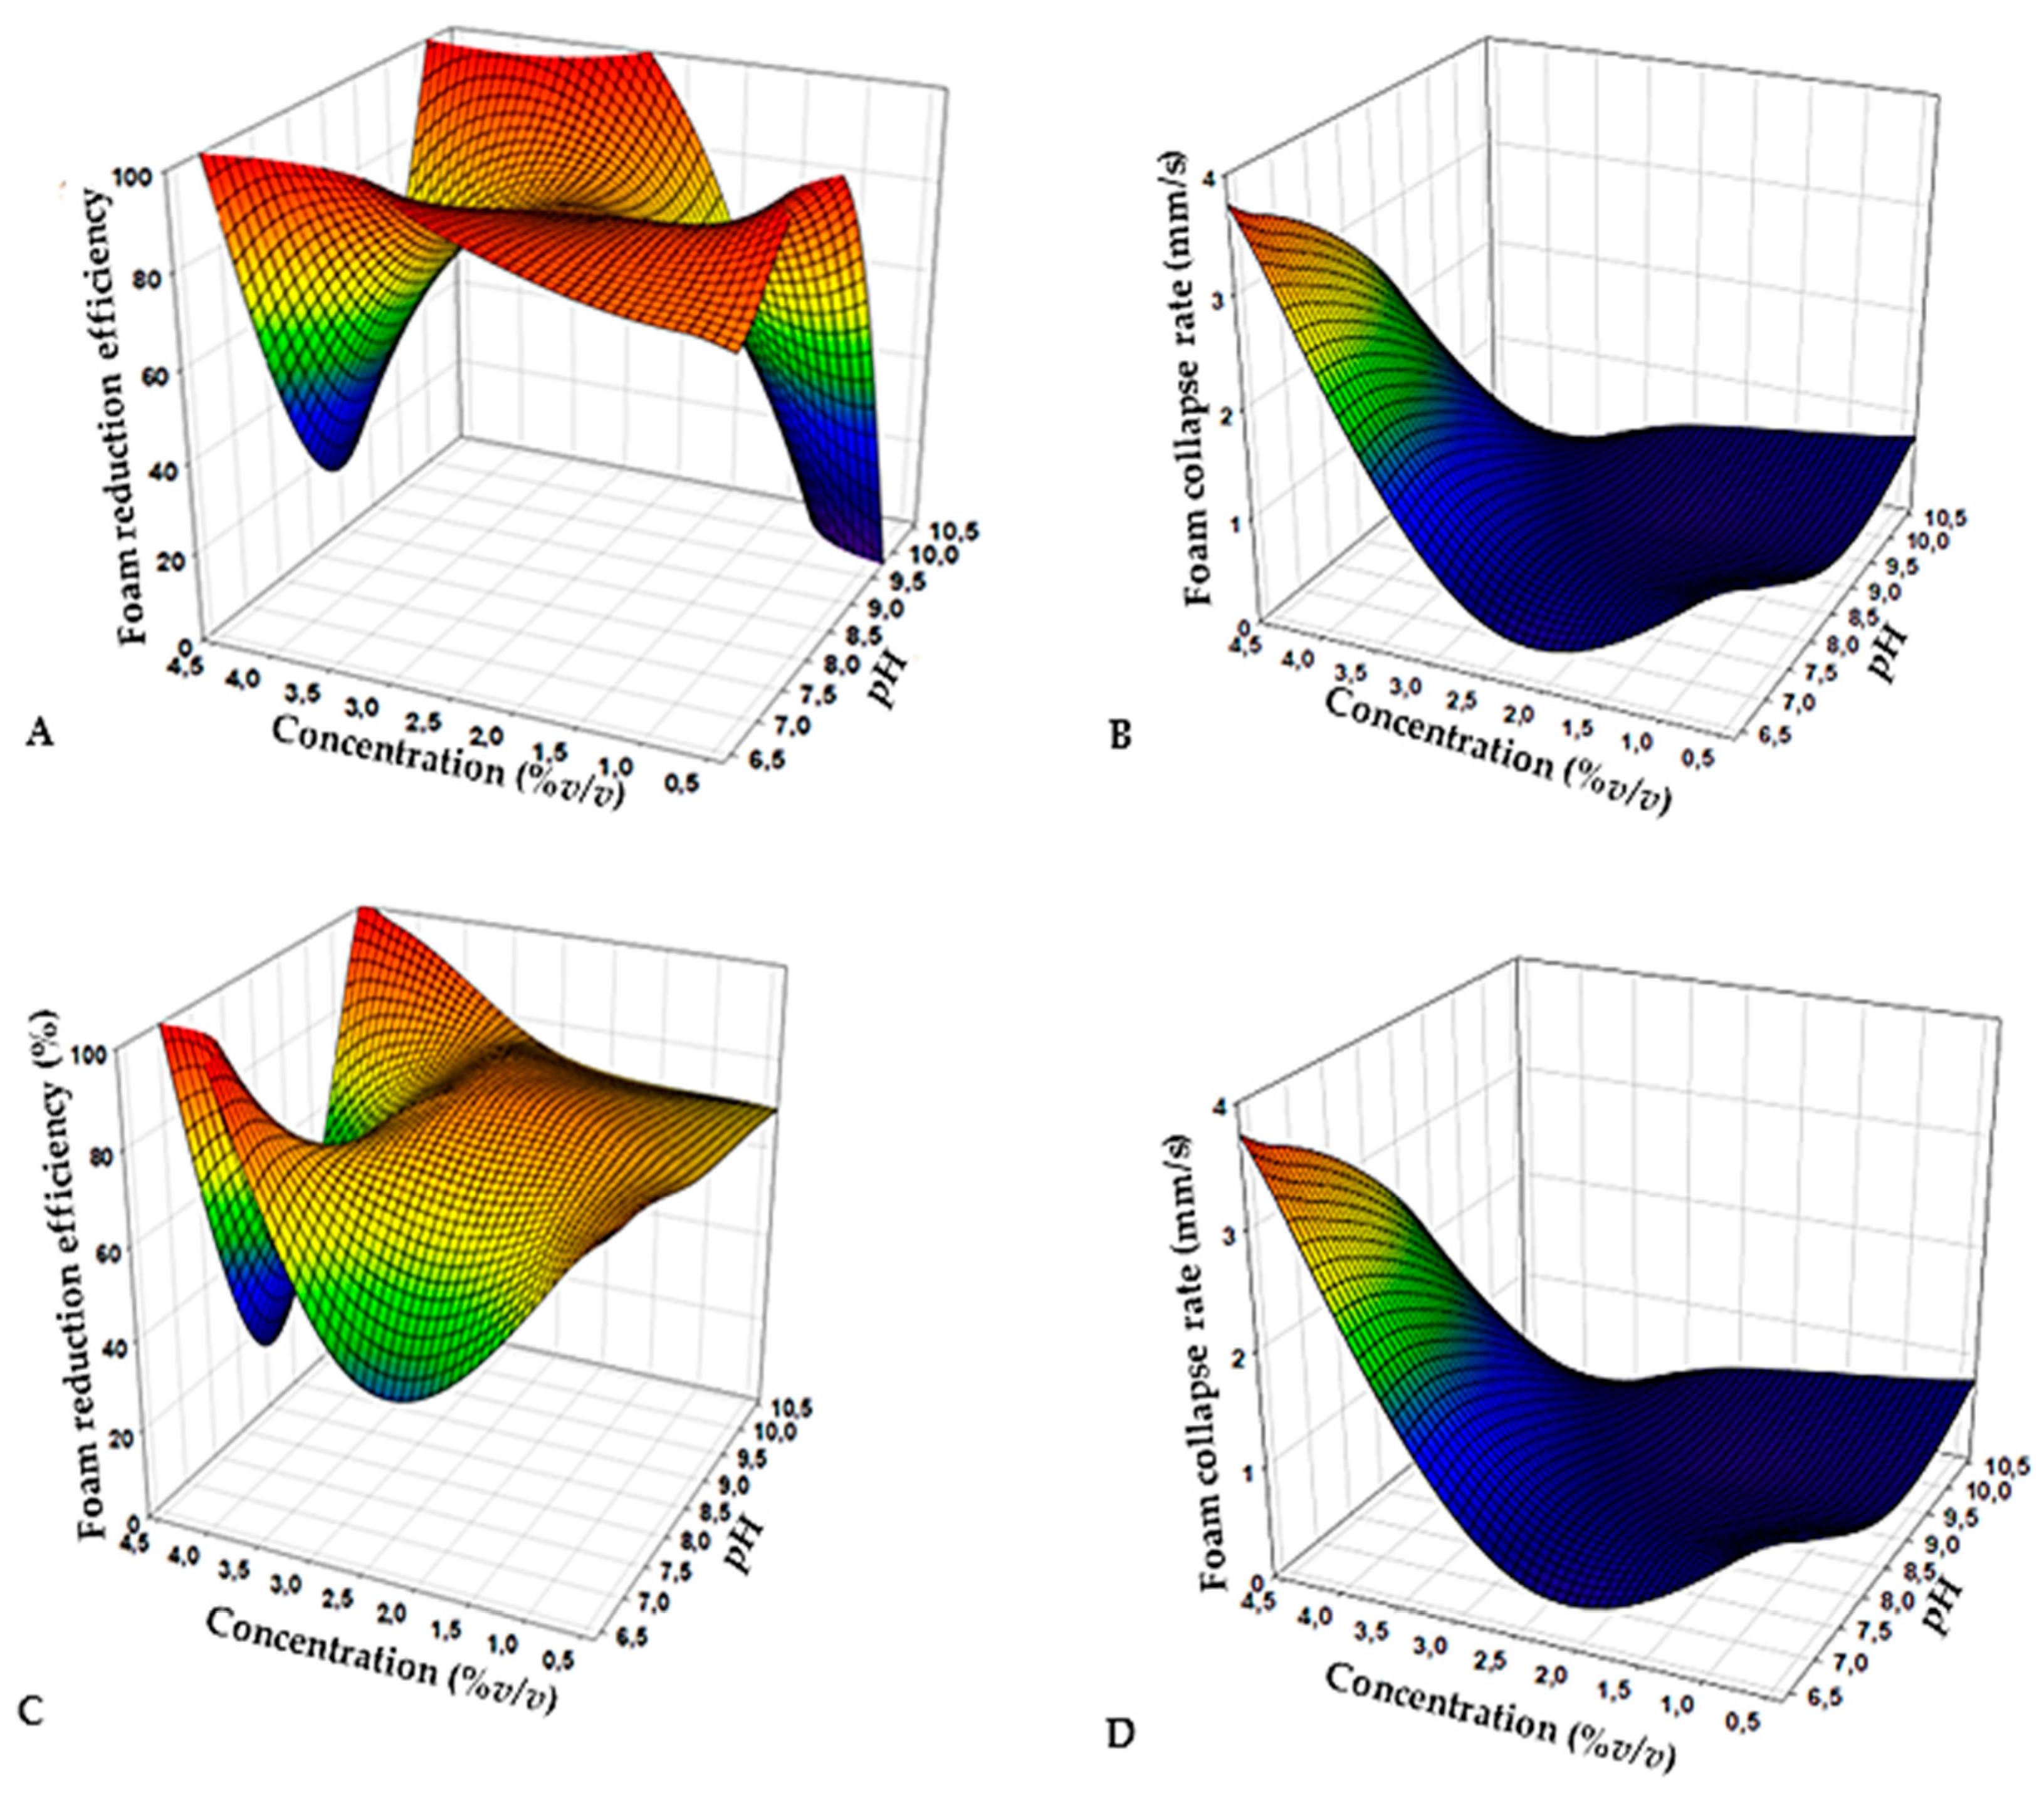
2.4. Response Surface Methodology

Response surface methodology (RSM) was used to determine optimum pH and concentration for the biodefoamer production, i.e., foam reduction efficiency and decay rate, for either the bio- or synthetic defoamers. Foam reduction efficiency and foam decay rate were the output variables. The design of experiments in RSM was used to generate various experimental conditions (pH 7–10) and concentrations (1–4% v defoamer/v MLSS and PSW mixture) [13,14]. A two-factor, five-level central composite design with 13 experimental runs was carried out. A T-test was conducted to evaluate the statistical importance of the regression coefficient to estimate biodefoamer production. A Fisher (F) test was employed to ensure the precision of the model obtained, i.e., to describe optimal conditions for biodefoamer production. The determination coefficient (R2) was determined to assess the appropriateness of the model which described optimal biodefoamer production. See Table 1 for coded levels and descriptions.

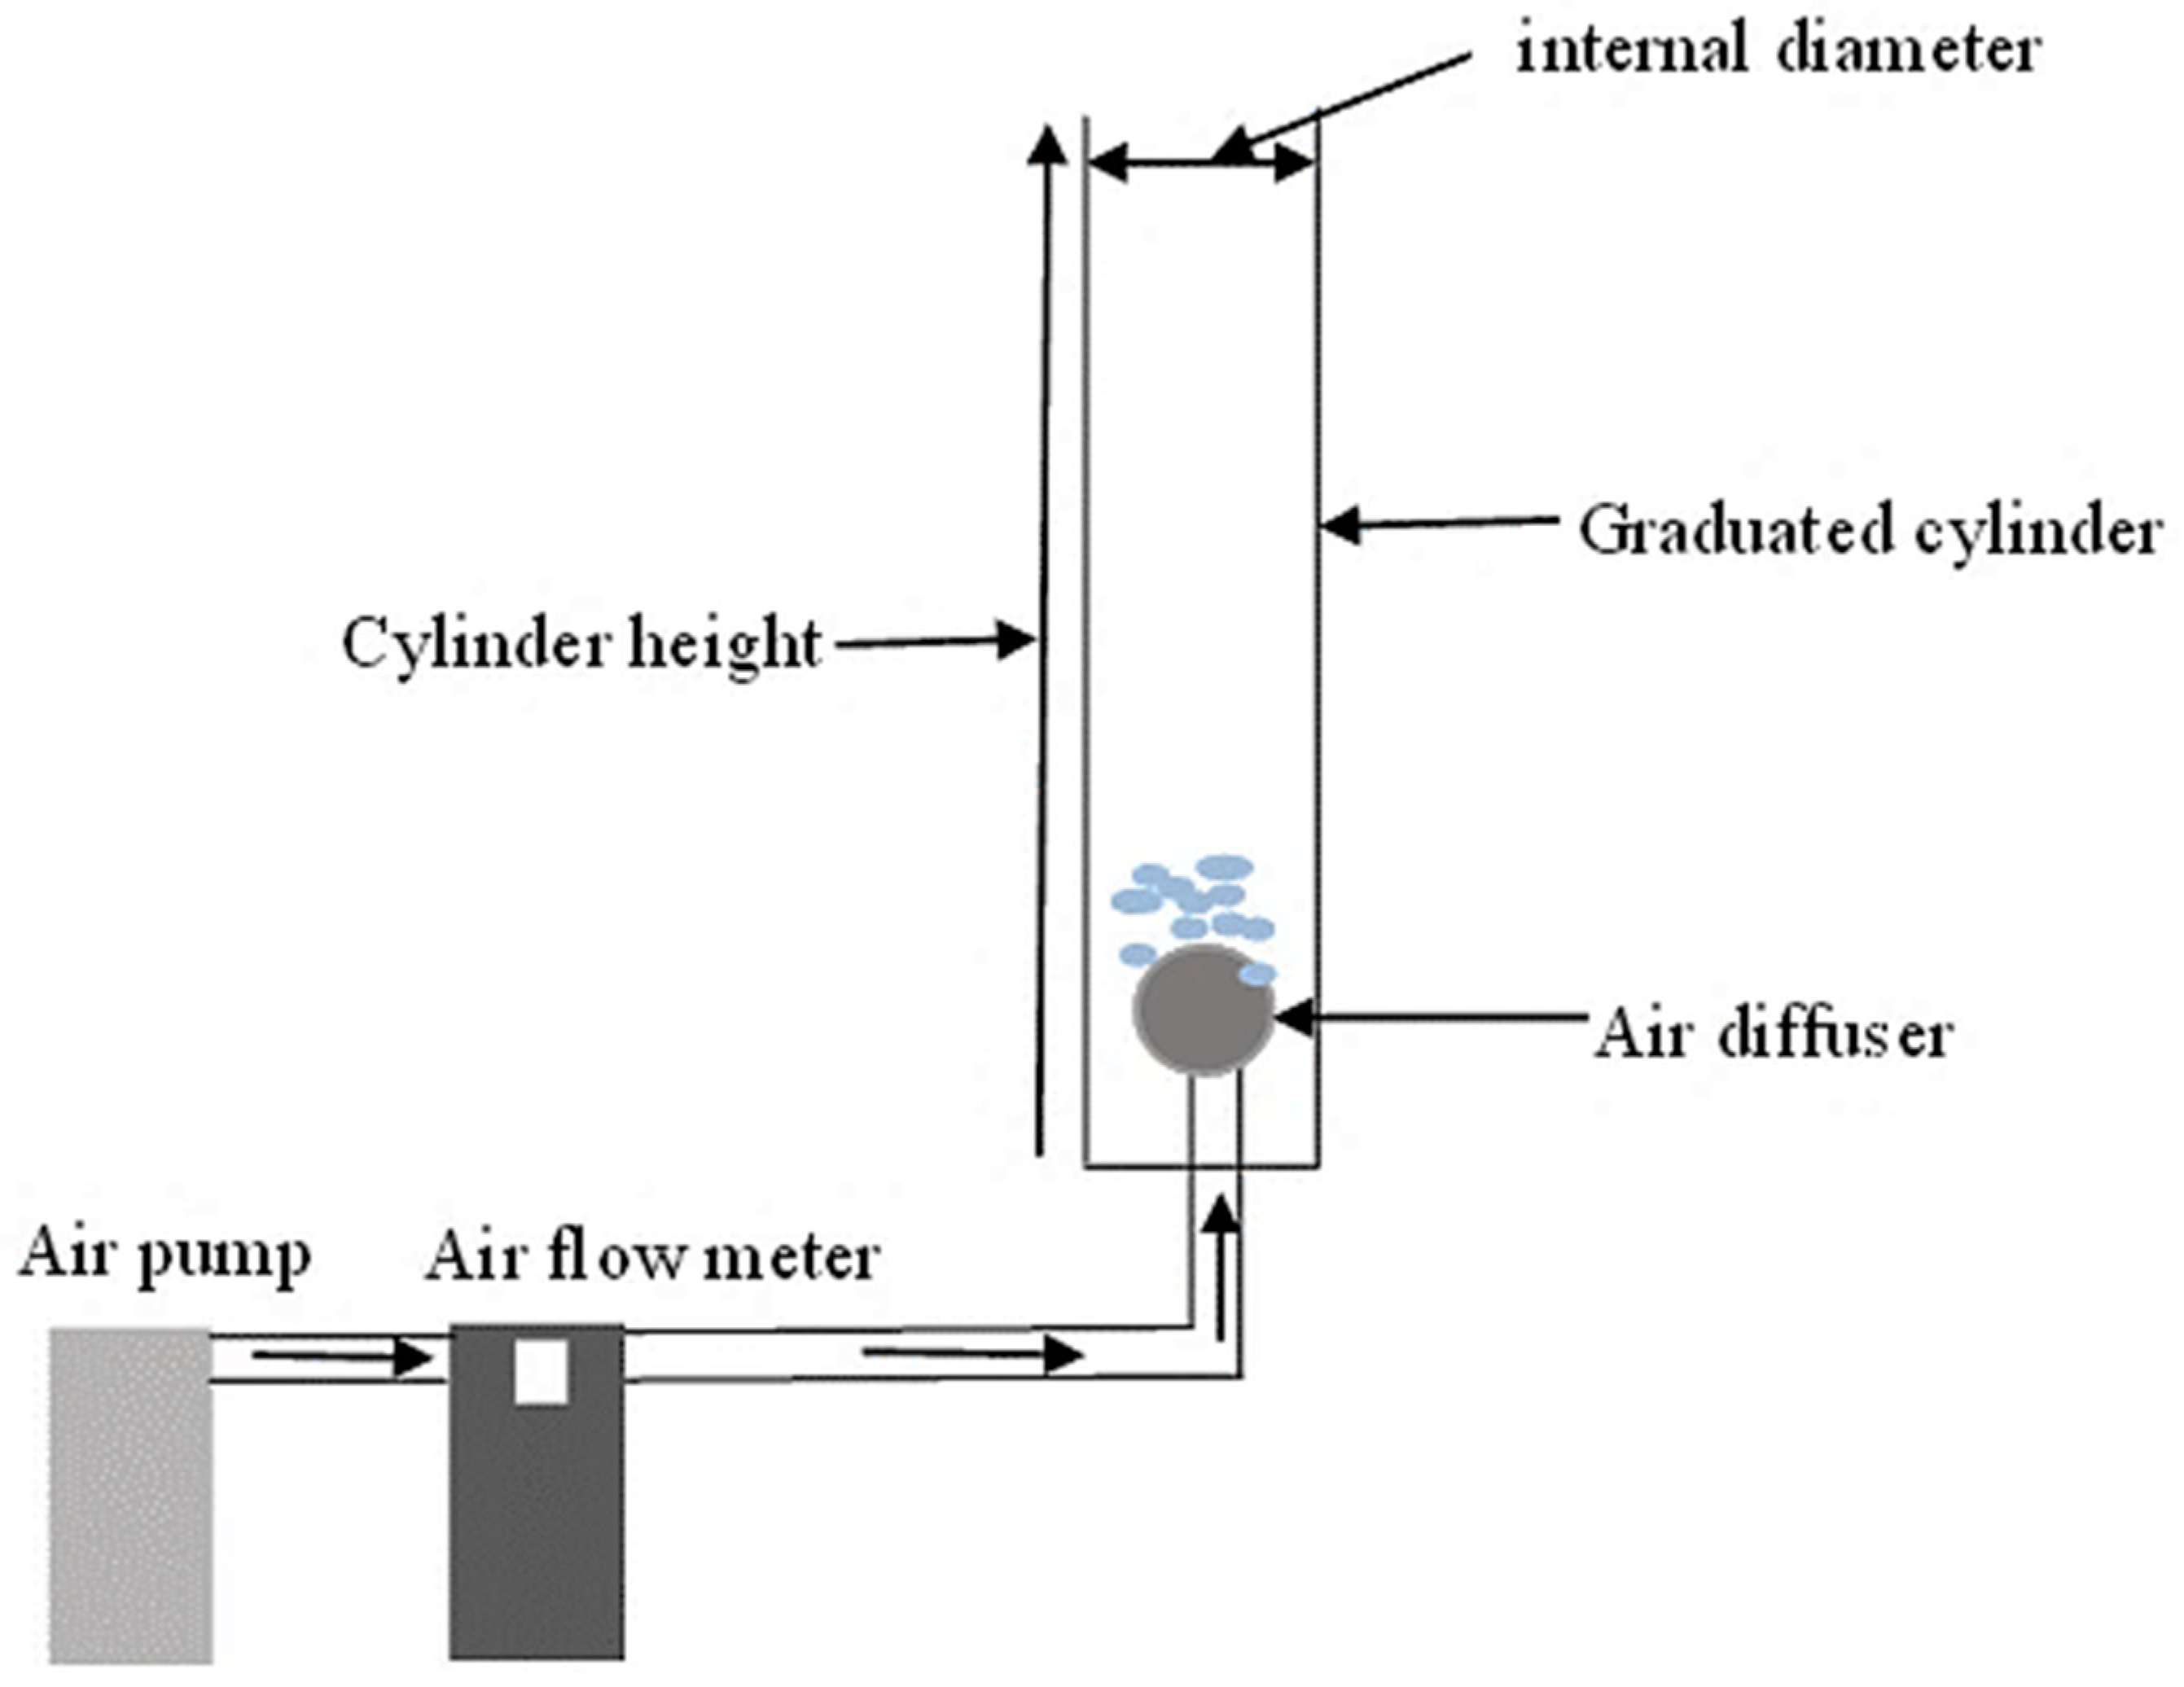
2.5. Foaming Behavior Tests

2.5.1. Foam Reduction Efficiency

The PSW used in this study was collected from a slaughterhouse near Cape Town, South Africa, using 25 L polypropylene bottles, transported to the laboratory at 4 °C, and used when received. The quality of this wastewater varied considerably based on the environmental conditions; however, the characteristics of the wastewater used in the current study were comparable to other studies (see Table 2). A volume (100 mL) of PSW and mixed liquor suspended solids (MLSS) at a ratio of 1:2 was added to 250 mL graduated cylinders (foaming reactor, see Figure 1; the specifications of this reactor are tabulated in Table 3) after pneumatic mixing through air sparging using Mott element 6500 diffusers (Mott element 6500, Mott Corporation, New York, NY, USA) at 40 mL/min. After that, the foam was generated by sparging air using a Resun air pump (Resun Ac 9906, Shenzhen Xing Risheng Industrial Co. Ltd., Baolong, China) attached to an airflow meter (Key instrument FR 2000 series, Rhomberg Instruments, Cape Town, South Africa) at 80 mL/min until 82 mL of foam was generated. The foam volume (measured using a graduated cylinder) was recorded against time using a stopwatch (foam volume generation was recorded at 40 s intervals). The foaming behavior was compared using foaming tendency (FT), the foam reduction efficiency (FRE) and foam collapse rate (FCR)—see Equations (1) and (2). This method was used without modification, as reported elsewhere [15].
FT = (Foam generated immediately after aeration (mL)) ÷ (Rate at which air is sparged into the sample (mL/min));
FRE (%) = (1-FT of a sample with defoamer) ÷ (FT sample without defoamer) × 100.

2.5.2. Foam Collapse (Decay) Rate

For the foam collapse rate (FCR) (Equation (3)), a method by Mangundu [20] was used with minor modifications. A volume (100 mL) of PSW and mixed liquor-suspended solids (MLSS) at a ratio of 1:2 was used. This mixture was placed in a foaming reactor (250 mL graduated cylinder, see Figure 1 and Table 2 for dimensions). The height of the mixture was measured before the generation of foam. To thoroughly mix the PSW and MLSS, 40 mL/min of air was sparged through a porous air diffuser. The foam was generated by sparging air at a flow rate of 80 mL/min until a foam height of 13 cm was generated. The foam height collapse rate in the graduated cylinder was measured as a function of time using a stopwatch. The air pump (Resun Ac 9906, Shenzhen Xing Risheng Industrial Co. Ltd., Baolong, China) was switched off for 40 s such that the foam and liquid layer were distinguishable. A 4% (v/v) of synthetic defoamer, i.e., active silicone polymer antifoam A (A6582, Sigma-Aldrich, Unit 16/17 Lake Site, Industrial Park, Jet Park, SA), determined to be an efficient defoamer for WWTPs, was used at different pH and defoamer concentrations that the RSM generated in combination with the PSW/MLSS mixture. After that, 40 mL/min of air was sparged through the samples again for mixing, and the foam collapse rate was measured every 10 s until the foam had decayed. If not, the foam height was regenerated in repeat tests. These tests were performed using triplicate samples, and an average of the samples was used to generate experimental data.
FCR (mm/s) = (foam in the column after sparging) ÷ (time taken to collapse the entire foam).

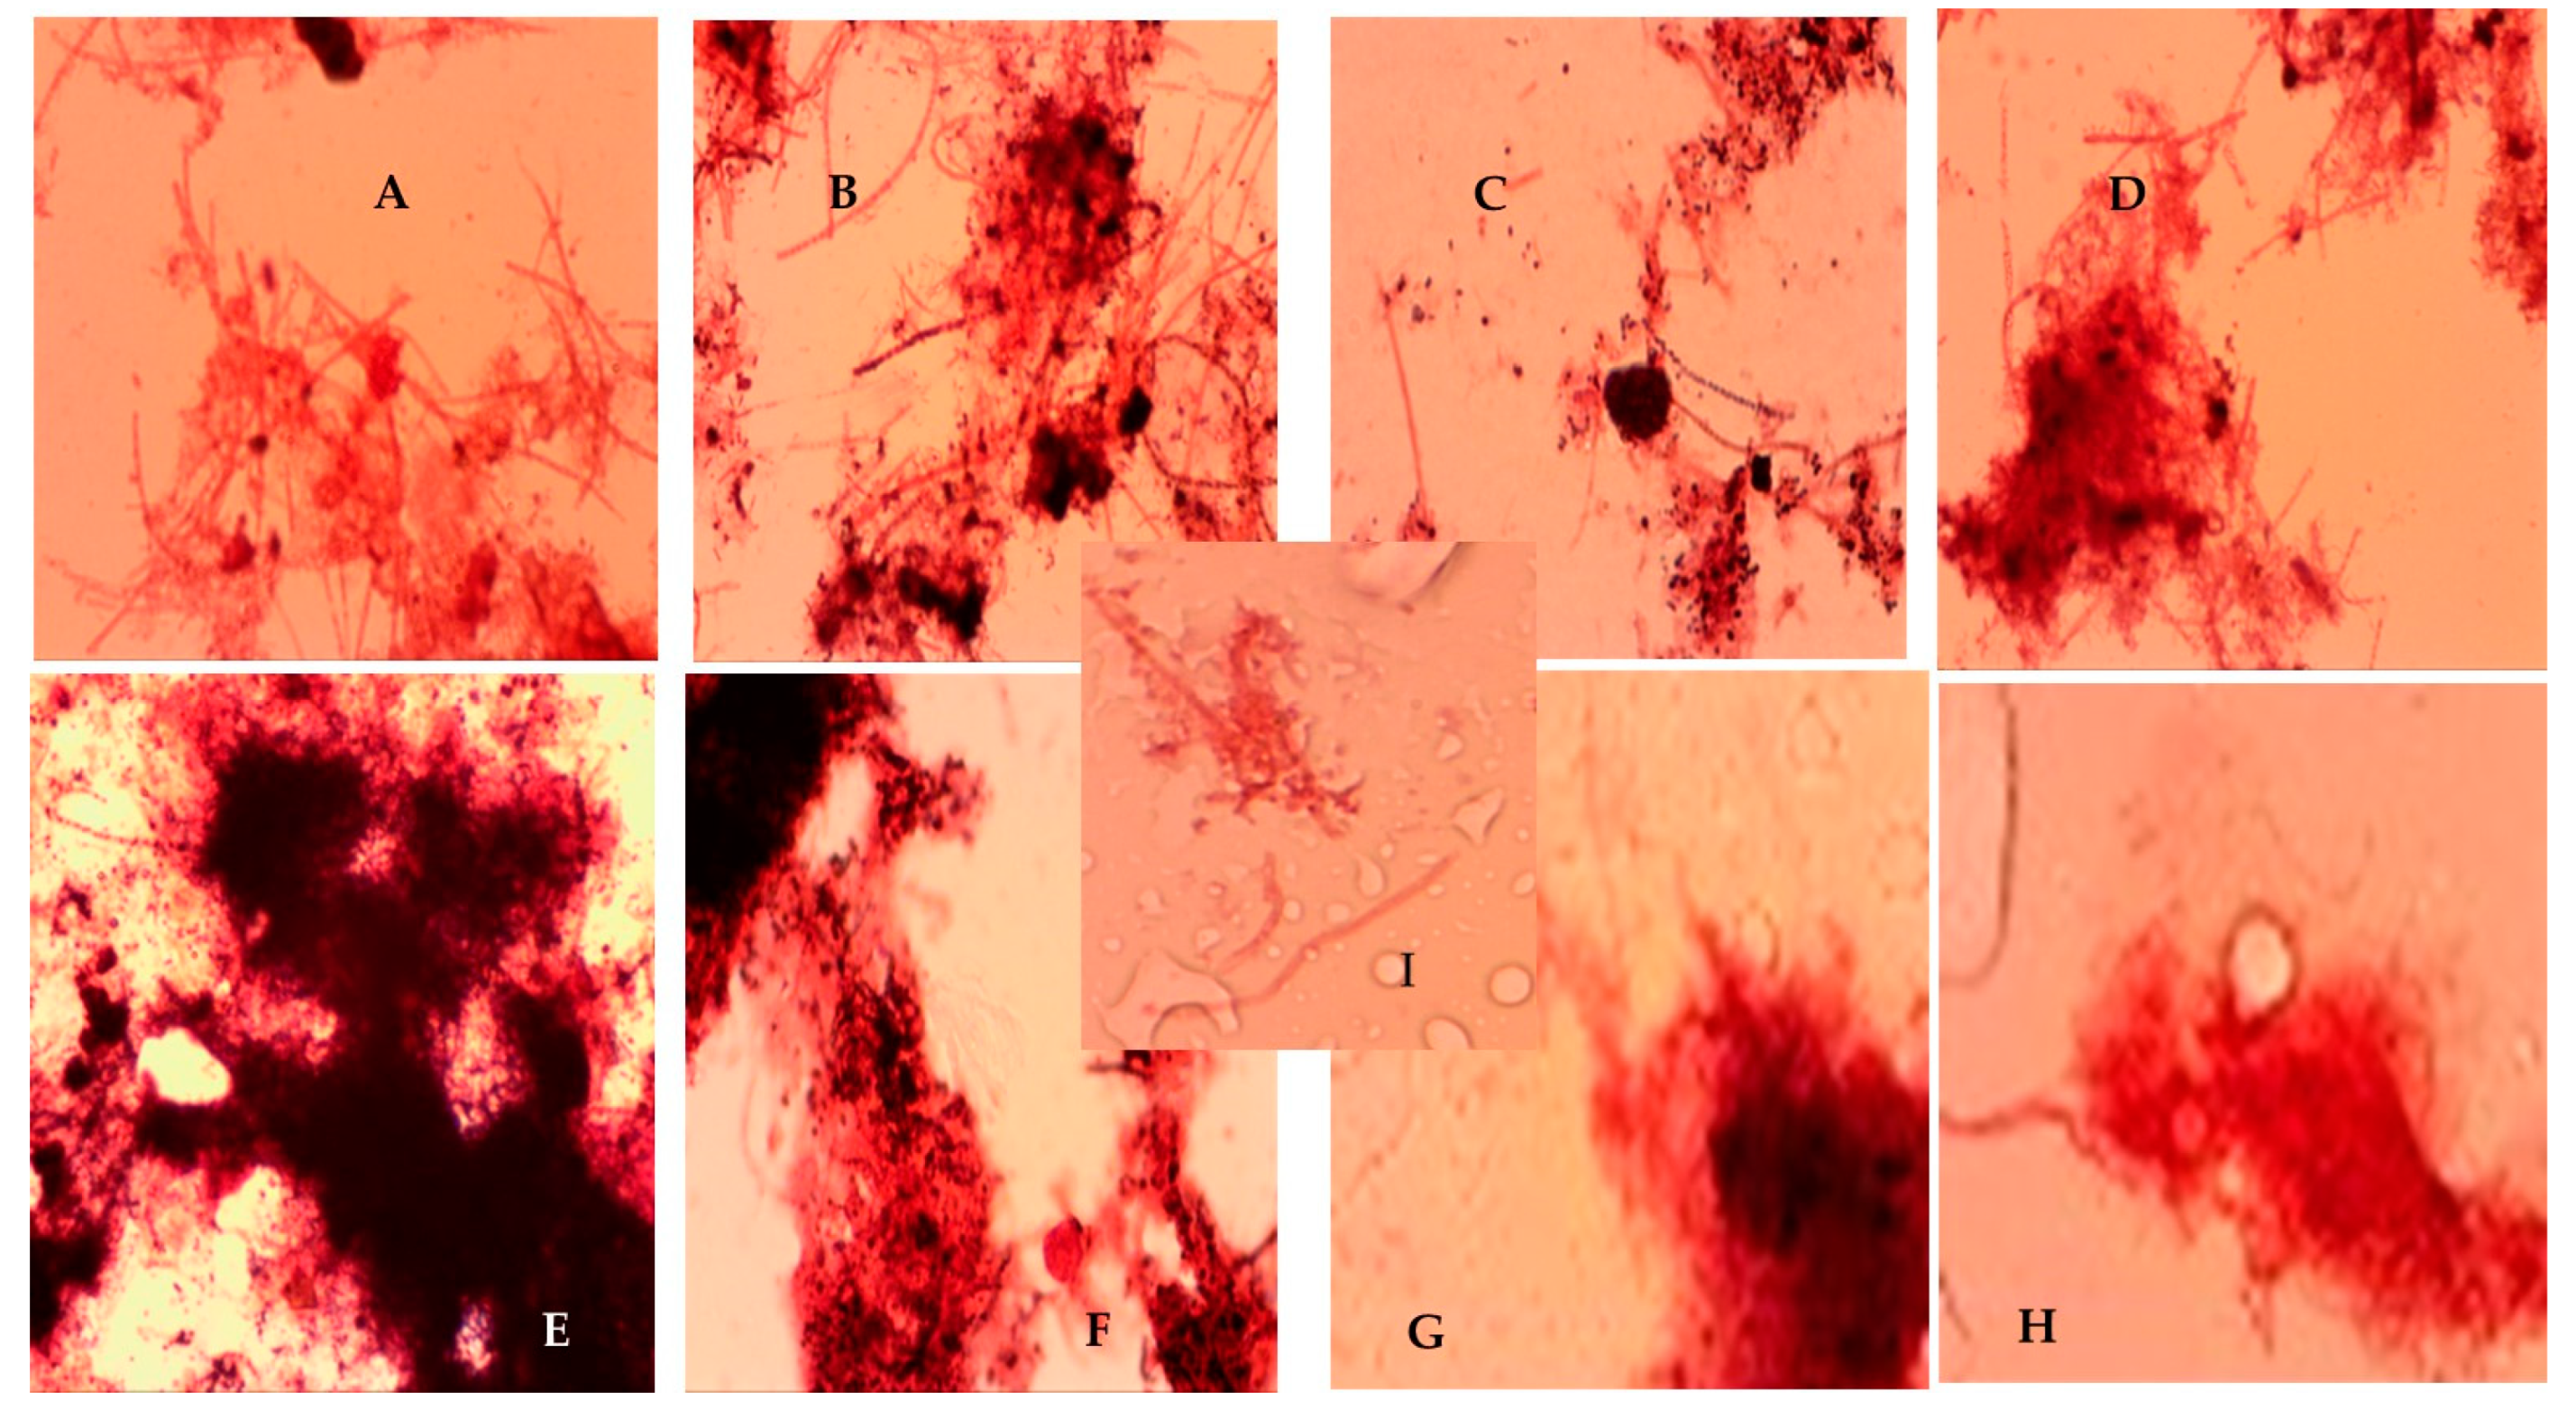
2.5.3. Microscopic Analysis of Sludge Agglomeration in the Presence and Absence of Bio- and Synthetic Defoamers

AS samples were collected from a WWTP (Cape Town, South Africa) using 4 L polypropylene bottles. The sludge samples were taken from the aeration tank and transported to the laboratory. To ensure aerobic conditions, the sampling polypropylene bottles were partly filled (one-third) and tightly closed after refrigeration at 4 °C. Before experimental tests, the bottles were swirled to mix the sludge, and the agglomerated biomass was analyzed according to Eikelboom et al. [21]. The filamentous microorganisms observed were compared with the images depicted in the method. A filamentous index (FI) (the size of filamentous bacteria population observed using a microscope, 0–5 non-numerous filaments) was quantified. An experiment was conducted to observe the effect of the biodefoamer and synthetic defoamer on the AS filamentous bacteria. To observe this effect, a 96-well tissue culture plate (Corning® 96-well clear polystyrene microplates, Merck, Rahway, NJ, USA) was used, with four wells serving as a control. The experiment was conducted to mix 200 µL of the MLSS with 160 µL of sterile PSW filtered through a 0.22 µm membrane filter and added to the four wells. After that, a volume (245.6 µL) of the MLSS was added to each well, after which 100 µL of the sterile PSW was added in the subsequent wells (n = 8). Out of the eight wells, four wells were supplemented with 14.4 µL of the biodefoamer, the other four were supplemented with a volume of 14.4 µL of the synthetic defoamer was used for comparative analysis. This was followed by incubation at 37 °C for ten days. Afterward, 25 µL of each sample was extracted from each well on days 0, 5 and 10. The samples were gram stained and viewed under a light microscope (Olympus CX21FS1 microscope, Olympus Corporation, Tokyo, Japan) at 1000×. The microscope was connected to a computer running Dino Capture 2.0 software (Dino-Lite digital microscope, London, England, UK), using a 4000 µm and 10 µm scale bar. This was to observe the effect of each defoamer on the MLSS microbial population.

2.6. Characterization of the Biodefoamers

The consortia were further cultured in the aforementioned biodefoamer production media and incubated for 48 h at 120 rpm at an optimum pH and temperature determined using RSM. After that, the consortia were put on ice and centrifuged at 10,000 rpm for 30 min, with the supernatant being collected for processing using ethanol (4 °C) at a ratio of 2:1 (v/v), that is, alcohol:supernatant, followed by shaking the mixture at 121 rpm at 4 °C overnight to produce a precipitate. The precipitate was then collected and re-centrifuged using a benchtop centrifuge at 15,000 rpm for 30 min. This procedure was repeated (n = 3 times) to collect a substantial quantity of the precipitate for each sample, after which the precipitate was washed using sterile distilled water and dialyzed against the water overnight, subsequent to vacuum drying in a desiccator for 24 h. The dried precipitate was analyzed using a Fourier transform infrared spectrophotometer (FTIR) (Spectrum two, PerkinElmer, Waltham, MA, USA).
Additionally, nuclear magnetic resonance spectroscopy analysis was conducted using the purified and dried precipitate by dissolving it in 1 mL of deuterium oxide (D2O). This was followed by swirling for 5 min and then left overnight at ambient temperature. The swirled solution was then transferred into a 5 mL tube which was then capped and analyzed using 1H NMR (Bruker 400, Bruker Nano GmbH, Berlin, Germany) at a frequency resonance of 400 MHz.

3. Results and Discussion

3.1. Microbial Isolation and Identification of Biodefoamer-Producing Isolates

Amongst the microorganisms that were isolated from the PSW discharge spout, four isolates, i.e., Bacillus subtilis (GCA_000009045.1), Aeromonas veronii (GCA_000204115.1), Klebsiella grimontii (UGJQ01000001.1) and Comamonas testosteroni (GCA_900461225.1) were selected for biodefoamer production based on their rapid efficiency in foam decay, moderate pH and lower concentration. The Bacillus sp. colonies were rod-shaped and off-white, and when they were viewed under a microscope, their gram staining depicted that they were gram-positive. Aeromonas veronii was also off-white, albeit gram-negative. Klebsiella grimontii’s gram reaction was negative, with rod-shaped, slimy and white colonies. Similarly, Comamonas testosteroni’s gram reaction was negative, exhibiting slightly curved rods with mucoid colonies, which were also white. The consortium produced biodefoamers under various environmental conditions as determined using response surface methodology. This was the first study to use a consortium isolated from poultry slaughterhouse wastewater discharge spout to produce biodefoamers.

3.2. Mixed Liquor Suspended Solids (MLSS) Metagenomics Analysis

The AS microorganism sequences were generated using metagenomics, indicating that the dominant foam formers in the AS samples were Nostocoida limicola, Gordonia kroppenstedtii, Candidatus Microthrix parvicella, Nocardioides insulae and Bacteroides nordii. These biofoamers are hydrophobic actinobacteria that contain mycolic acids and produce biosurfactants to break down FOG so that they uptake it as a carbon source. These characteristics enhance biofoamation in AS systems [22,23].

3.3. Biodefoamer Production, Reactor Conditions Optimization and Characterization

Two independent variables, pH (range 7–14) and concentration (range 1–4%v/v), were used to evaluate the defoamer (synthetic and biodefoamer) activity (foam reduction efficiency and foam decay rate). The efficiency of biodefoamers produced from a competitive consortium was compared to that of the synthetic defoamer. The results in Table 4 showed that pH 7 at a concentration of 4% (v/v) positively affected biodefoamer production, which inculcated rapid foam decay and suppression rate. The results depicted that the biodefoamer effect became less effective as the pH increased. This was because the microorganisms preferred a neutral pH to produce the biodefoamers with high activity. Overall, biodefoamers have a different electrical state at different pHs. A change in pH not only alters the defoamer’s charge, it also alters the charge of the suspended solids, which affects the settleability of the MLSS and the PSW SS, which in turn affects the foaming behavior of the wastewater [24]. The concentration of the biodefoamer is also crucial. Low concentration affects the bridging mechanism. Higher concentration leads to sludge deflocculation and high viscosity, which further results in foam formation; hence, lower and higher concentrations produce minimal biodefoamer activity [25]. According to the synthetic defoamer specification, it is effective at a concentration of 1–100 ppm and stable at pH 5–9. According to this study, it was more effective at pH 7 and 1% (v/v), and this falls in the specific ranges of the defoamer specification. This defoamer’s effectiveness also deteriorated at higher pH, albeit at a lower concentration, because silicone-based defoamers are sensitive to pH. They lose their activity at acidic pH and pH more significant than 10 [26]. These results highlight that the defoamers are not universal because their activity depends on the ever-changing environmental condition of the CAS. Table 2 lists the ANOVA quadratic model used to optimize biodefoamer production.
The RSM was used to optimize the environmental conditions of the bioreactor such that an optimum response was achieved. The effect of the two independent variables (pH and concentration) on the foam reduction efficiency as well as foam decay rate, which were used to determine biodefoamer production, are graphically illustrated in Figure 2A for the biodefoamer and in Figure 2B for the synthetic defoamer. It was observed that both pH and concentration significantly impacted the efficacy of both defoamers. Wongsamuth and Doran [27] also reported that pH and defoamer concentration significantly impact a defoamer’s effectiveness. The optimal biodefoamer production was observed at pH 7 and a concentration of 4% (v/v), where the highest foam reduction efficiency was 96% at a faster foam decay rate of 1.7 mm/s. The biodefoamer results are similar to the results Mamais [28] obtained when a polyaluminum chloride (PAX-14) concentration of 6.6 to 11.5 g Al3+/kg MLSS reduced foam by 75 to 100%, improving the sludge flocculation. However, PAX could only eliminate Gordonia amarae and Microthrix parvicella cells, and using chlorine-based chemicals can be detrimental to the microbial communities because it can break down the microbial cell walls.
The lowest biodefoamer production was observed at pH 8.5 and at a higher defoamer concentration of 4.6 (v/v), with a foam reduction efficiency of 15% at a decay rate of 0.42 mm/s. This showed that the defoamer production was more affected by the pH than the defoamer concentration. Similarly, the biodefoamer obtained a minute foam collapse rate of 0.42 mm/s at alkaline conditions pH 10, even with a higher defoamer concentration of 4% (v/v); however, the foam reduction efficiency of 78% was observed. This was due to the deprotonation of the biodefoamer amino charges under alkaline conditions. This increased electrostatic repulsion between the negatively charged defoamer and the activated sludge sample, leading to sludge disintegration and biofoam [29].
The highest foam reduction efficiency for the synthetic defoamer was 96%, which corresponded with the highest foam collapse rate of 2.5 mm/s at a pH of 7 and a higher concentration of 4% (v/v). The lowest foam reduction efficiency of the synthetic defoamer was 2.9% at pH ten and a concentration of 1% (v/v). In contrast, the lowest foam decay rate of 0.42 mm/s was observed at pH 10 and a concentration of 4% (v/v). This indicated that the synthetic defoamer was ineffective at very alkaline pH, regardless of the defoamer concentration [30]. Overall, the synthetic defoamer had a higher foam collapse rate than the biodefoamer, although foam reduction efficiency was similar.
The ANOVA quadratic equations were generated to estimate optimum biodefoamer production. The mean was 0.4, and the standard deviation for the model was 0.3. Essential parameters in the model had p < 0.05; however, the parameters with a p value that was greater than the latter were negligible, thus indicating that the terms A and A2 were of significance; hence, Equation (4) was simplified to Equation (5).
Y = 0.42 + 0.34A − 0.02B − 0.15AB − 0.22A2 − 0.19B2;
Y = 0.42 + 0.22A2.
Equation (6) was used to estimate the effectiveness of synthetic defoamers and foam collapse rate. This model was also deemed to be insignificant to adequately describe the foam reduction efficiency, with a mean of 71.7 as well as a standard deviation of 23.1, and an F-value that was more than 0.57; the p values for all the terms in the model were more significant than 0.05, showing this quadratic model to be insignificant in predicting the foam reduction efficacy of synthetic defoamers.
Y = 155 + 44A + 38B − 02AB − 2.2 A2 − 5B2.

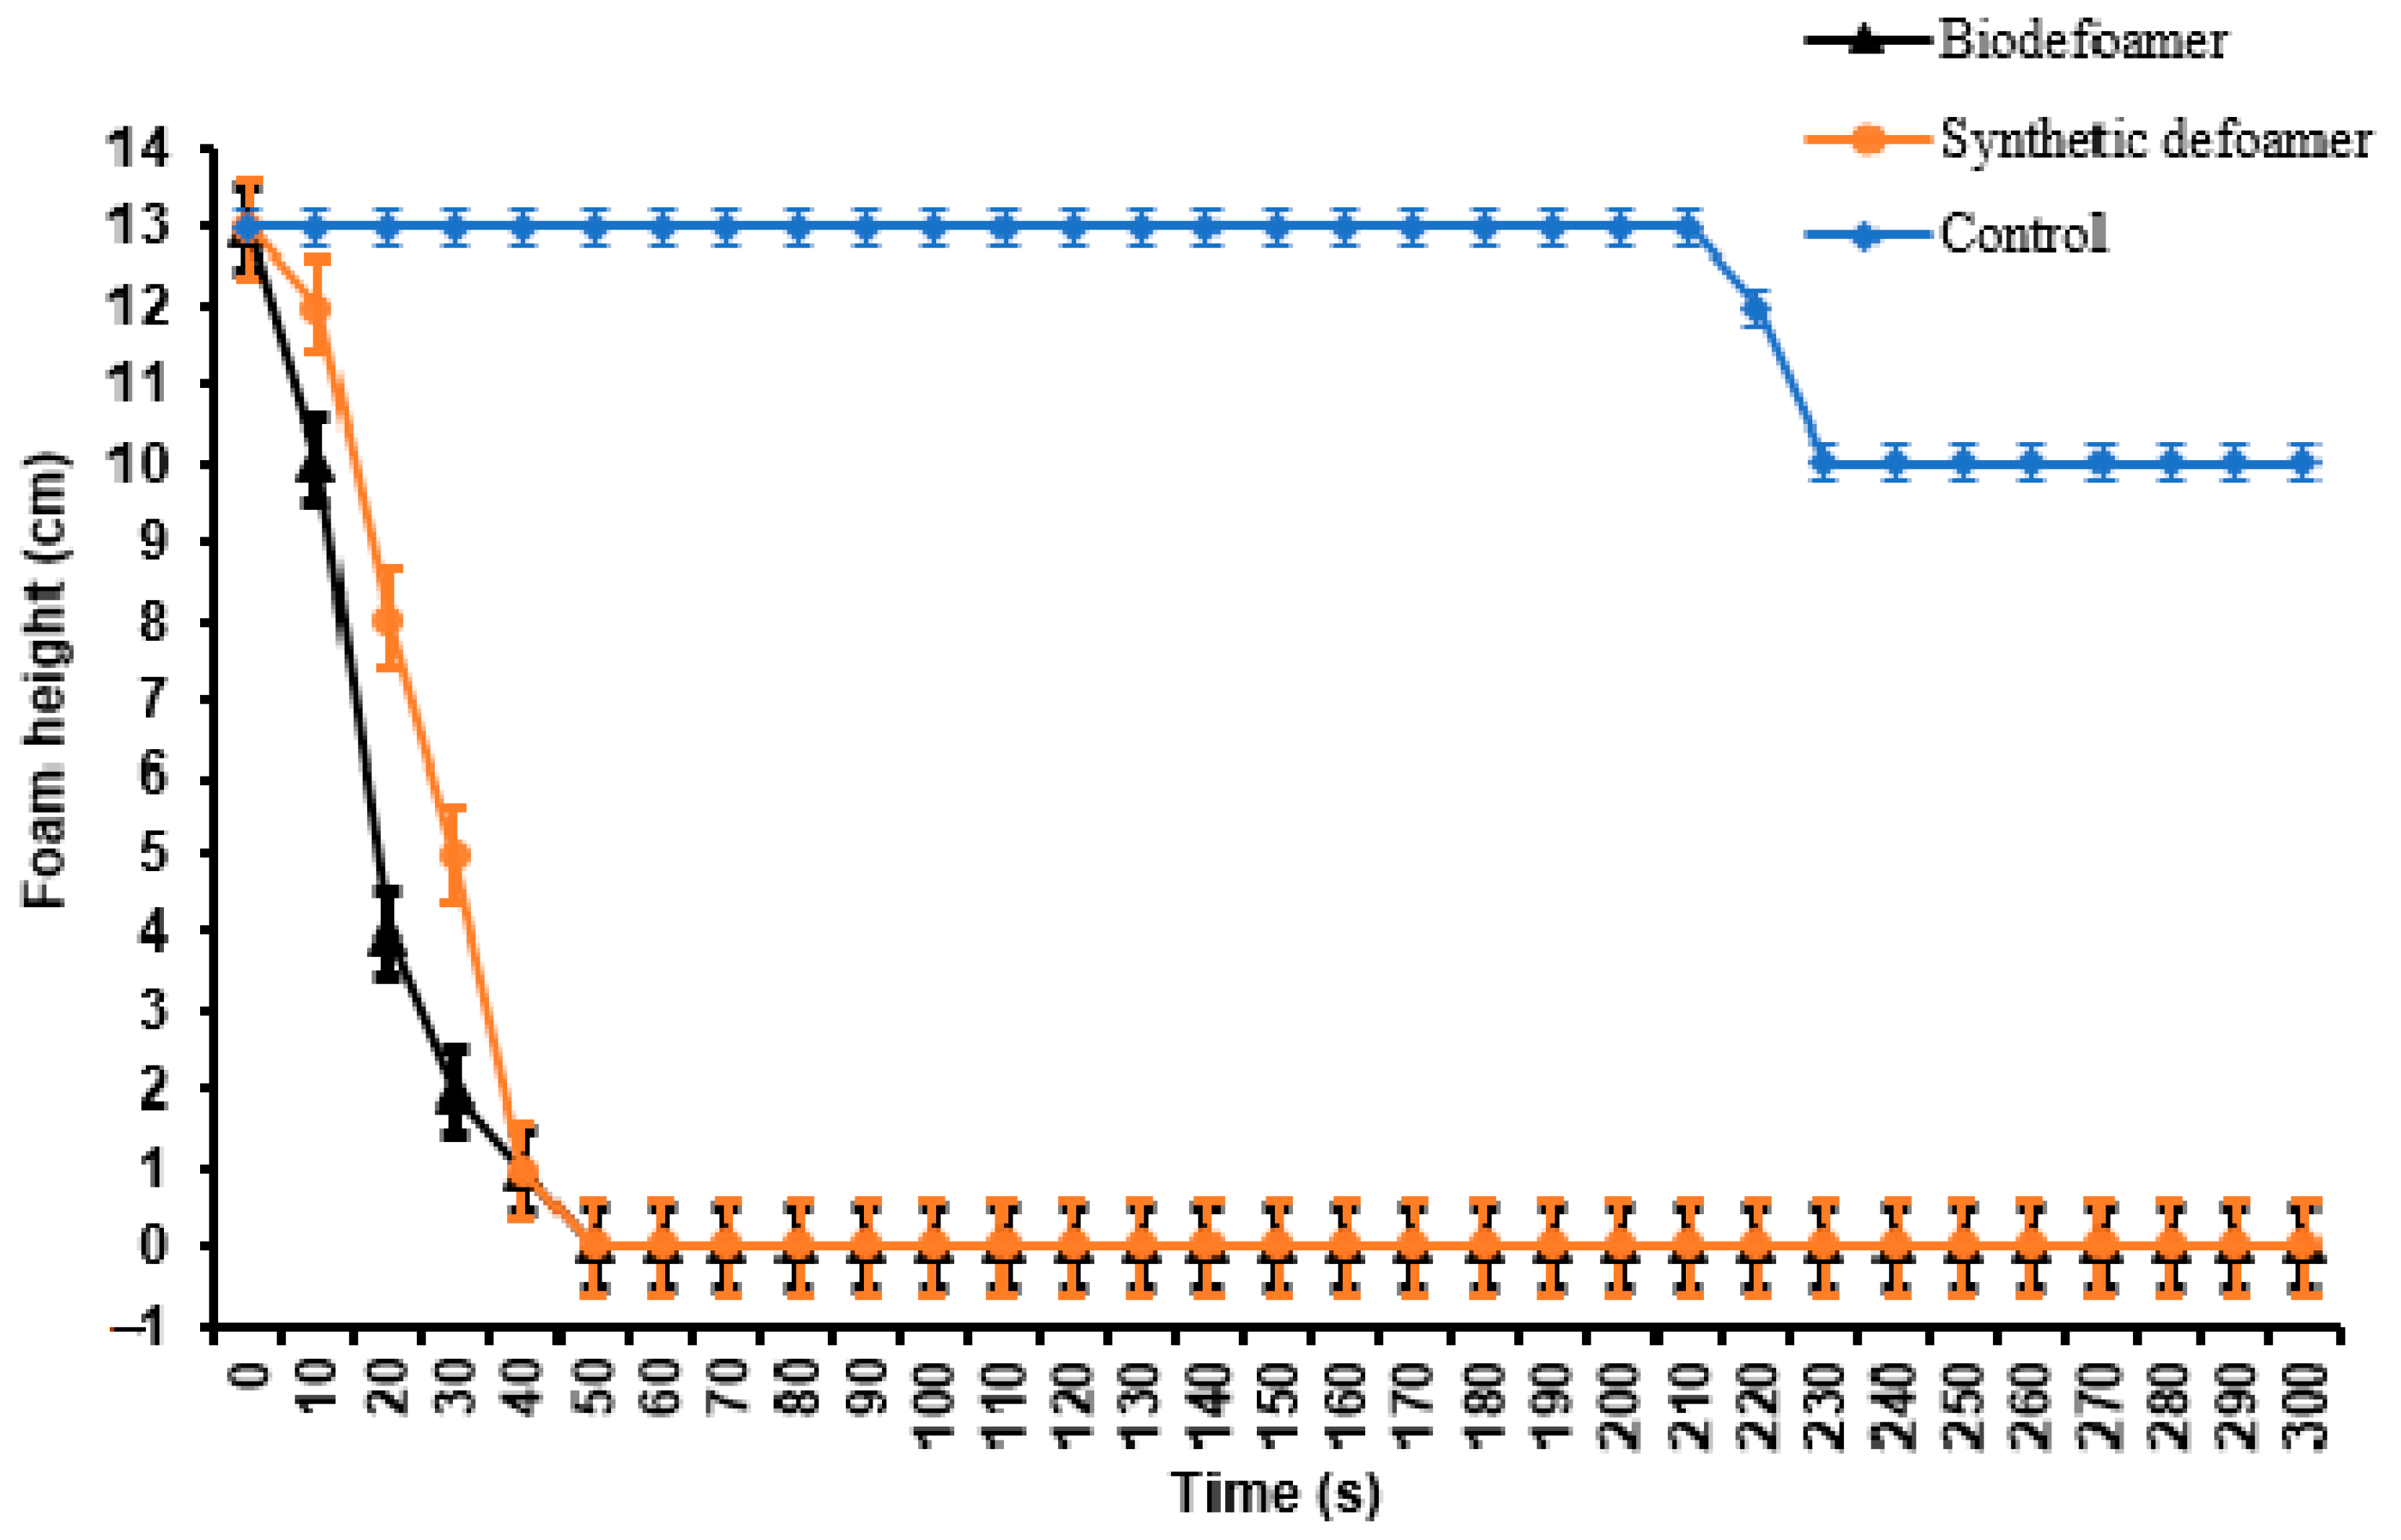
3.4. Dynamic Foam Decay Test

The foam generation rate is usually faster than the foam collapse rate [28]. The foam height reduction over time was recorded in this study. The color mash red (in this case dark orange) is the highest optimal color and the blue is the lowest. Figure 3 mash color is dark orang to red When pH is 7 and the concentration is 4 %v/v it indicates maximum foam reduction efficiency. It becomes blue at increased pH of up to 10. Figure 3 shows that the foam collapse rate is minimal at elevated pH, concentration as well as pH below 7. Figure 3 illustrates the foam behavior in the absence and presence of both a bio- and synthetic defoamer (4% v/v) at pH 7. For both the bio- and synthetic defoamer, the foam decay rate was observed to be under 40 s. After that, there was minimal foam regeneration even with subsequent sparging, meaning that both defoamers were efficient in foam reduction. However, the biodefoamer reduced the foam height by 85.4% within 40 s, whereas the synthetic defoamer only reduced the foam height by 61.5%. Mangundu [20] assumed that the minimum threshold required for foam decay was above 30%; however, in this study, a defoamer concentration of 4% (v/v) was able to collapse and suppress the foam height significantly. The efficiency of a defoamer is determined by its potential to form a destabilizing bridge that stretches across the lamellae such that it ruptures individual foam bubbles, thus causing liquid drainage from the foam, causing the foam to collapse. Moreover, it was previously demonstrated that bubble coalescence occurs in such instances; therefore, both defoamers had a potential to be used in large-scale applications [31]. Overall, when no defoamers were applied, the foam height was slightly reduced for 210 s. The foam height was reduced by 23%. The constituents of the wastewater, such as dissolved solids, including the presence of microorganisms such as Actinomycetes sp. in the MLSS, which produce biosurfactants and reduce the surface tension, can increase the viscosity that stabilizes the lamellae, increasing foam surface elasticity. This can further increase bubble deflocculation, causing excessive foaming as minimal pressure will be applied on the gas–liquid interface, resulting in minute liquid drainage [32]. When such a thing occurs in a WWTP, excessive foam generation will ensue, causing a nuisance for operators and facility managers.

3.5. Microscopic Analysis of Recovered Activated Sludge in the Presence and Absence of Bio- and Synthetic Defoamers

Microscopic images of the AS with a filamentous index of 3–5 were observed over ten days when it was exposed to the 4% (v/v) of the bio- and/or synthetic defoamers (see Figure 4). When the MLSS was exposed to a biodefoamer, minute floc formation was initially observed (day 0), with compacted (agglomerated) flocs forming on days 5 and 10. This showed that the biodefoamer could assist in floc formation, which can resolve challenges associated with sludge deflocculation, which results in the proliferation of filamentous bacteria. These filamentous bacteria prevalent within the flocs increase floc compaction strength, which is resistant to shearing and leads to good solid–liquid separation in AS [33]. Through bridging, floc- and foam-formers can be bound together by extracellular polymeric substances (EPS). For this study, the biodefoamer was hypothesized to have a balanced protein and/or polysaccharide ratio with the MLSS to overcome deflocculation. This led to a balanced foam- and floc-formers growth reduction, resulting in stabilized form floc formation [34].
The synthetic defoamer, however, had a negative effect on sludge compaction. The images showed oil droplets assumed to be from FOG, which significantly contributes to filamentous foam-forming bacterial growth. Observations indicated that on day 0, there was excessive filamentous bacterial growth. On day 5, although there was minute floc formation and visible oil droplets, the filaments protruded outside of individual flocs, leading to bridging and recalcitrant deflocculation on day 10, as observed elsewhere [34]. These results showed that the number of filamentous bacteria must not be excessive, as this will lead to weaker floc agglomeration. The synthetic defoamer favored the proliferation of some, if not most, filamentous bacteria associated with WWTP [35]. It was demonstrated that the non-application of a defoamer in the control experiments resulted in the MLSS showing a significant proliferation of filamentous bacteria throughout the experiment until day 10, with minute floc formation or agglomeration being observed. This was attributed to the changes in the quality characteristics of wastewater whereby aged sludge (>27 days) can be easily disintegrated with a weakened compaction attribute due to pH, organic and inorganic nutrients present therein [12]. Previously, it was observed that excessive filamentous growth leads to poor sludge sedimentation, the washout of microbial cells from the aeration tank/stage in the WWTP, and excessive biofoam formation [36,37].

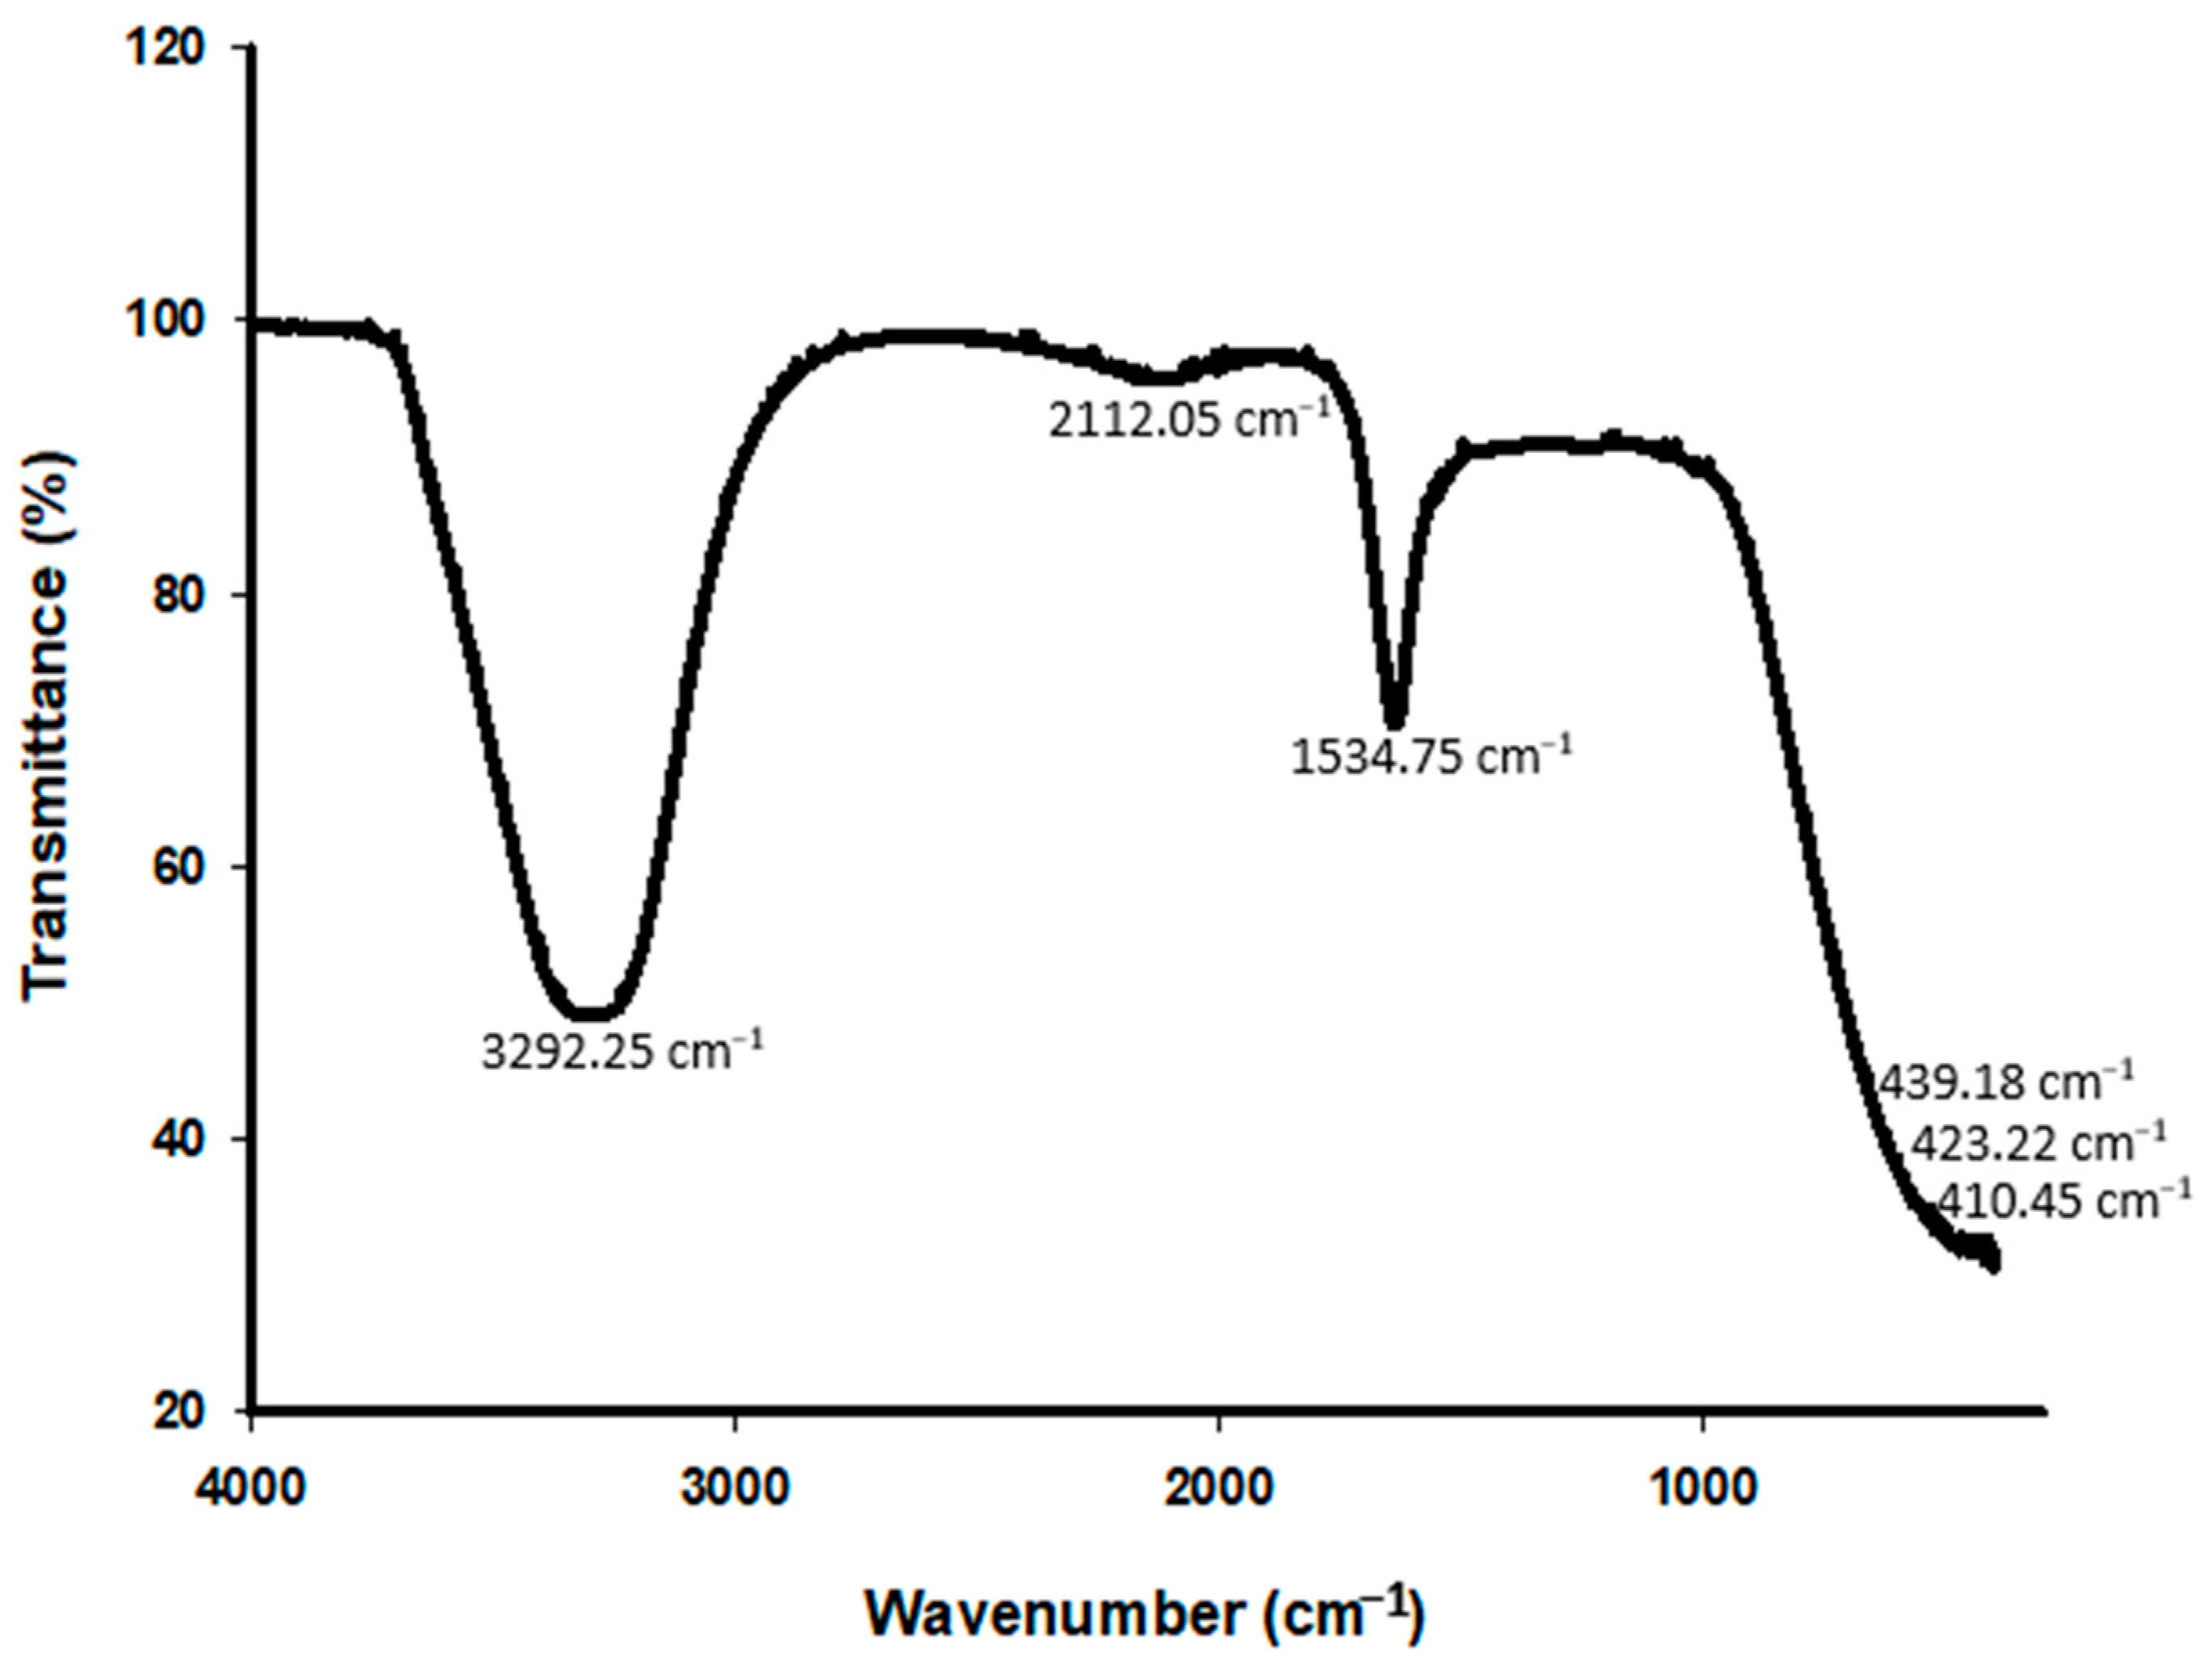
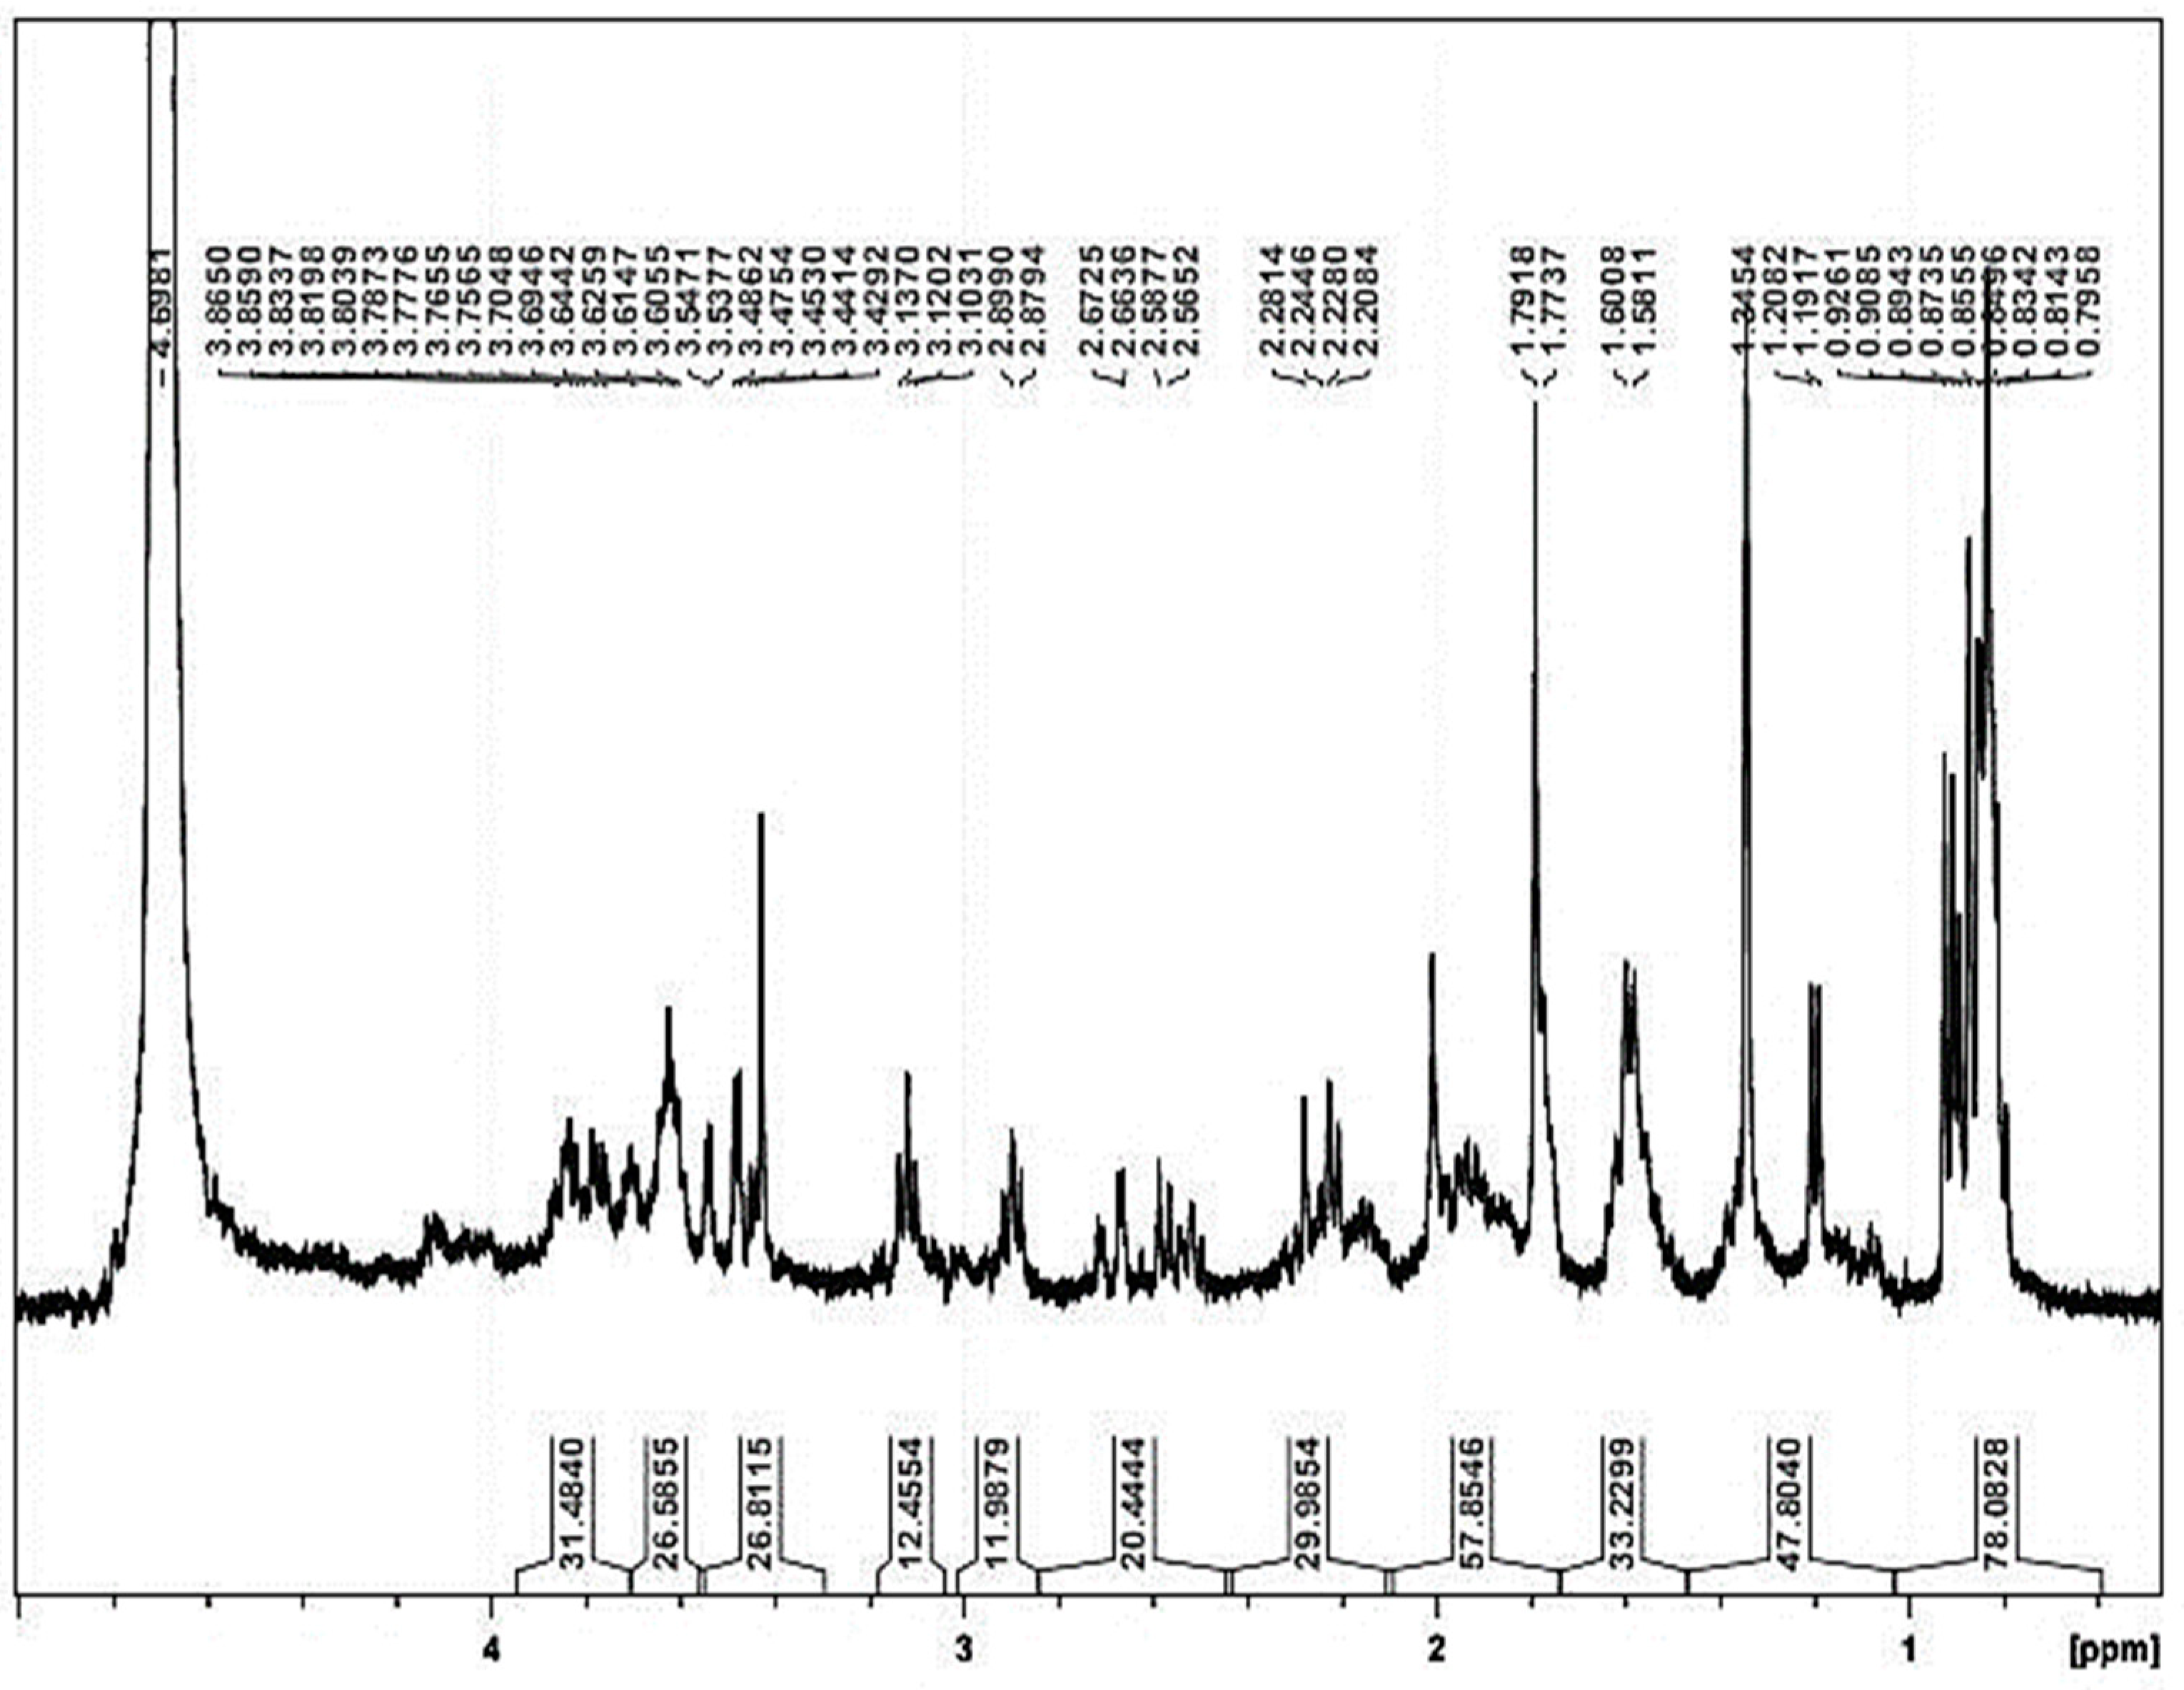
3.6. Biodefoamer FTIR and 1H NMR Characterization

The Fourier infrared spectroscopy ((FTIR) of the biodefoamer that was produced by a PSW consortium in Figure 5 was conducted to examine the correlation of the functional groups to biodefoamer activity. The peak at 3292 (49. 20%; 3292 cm−1) indicated an OH- functional group [38,39], while the peak at 2112.25 (95.62%; 212.25 cm−1) [38], [39] indicated an aliphatic C-H stretching group [39]; the peak at 1634. Seventy-five (70.27%; 1634 cm−1) indicated N-H- bending primary amines or carboxylic groups [40,41]. These groups, i.e., carboxyl, alkane, amine and hydroxyl groups, confirmed that the biodefoamer was predominantly a polysaccharide. Although it was concluded that the biodefoamer was pH-sensitive, minute concentrations were required for its efficacy, imparting electrical neutrality to MLSS; however, the crude biodefoamer contained impurities, all of which resulted in foam decay.
The weak peaks at 410–439 (30.48–31.19%; 410.46–439.18 cm−1) were associated with azomethine groups CH=N/C=N [42]. These groups, i.e., carboxyl, alkane, amine and hydroxyl groups, confirmed that the biodefoamer was predominantly a polysaccharide. The carboxyl functional groups contain multiple binding sites, ensuring compact attachment through charge neutralization and/or bridging [11]. In charge neutralization, the negatively charge MLSS particulates will bind to the opposite charge in the defoamer, and this will reduce the repulsive electrostatic forces and increase attraction forces, meaning that the defoamer will adsorb and neutralize the charge of the MLSS particulate. Although it was concluded that the biodefoamer was pH-sensitive, minute concentrations were required for its efficacy, imparting MLSS foam electrical neutrality; however, the crude biodefoamer contained impurities, all of which resulted in foam decay.
The 1H NMR spectrum in Figure 6 revealed signals between δ 0.8–1.9 ppm, confirming the aliphatic stretches’ presence and the signal at 1.9 ppm depicted a CH2 proton. The chemical shifts from δ 2.0–2.92 ppm showed the presence of amines, whereas the signal at δ 2.0 ppm showed CH- protons that were bounded to a vinyl carbon the solvent peak appeared at δ 4.7 ppm, and the signal at δ 3.1 ppm showed the presence of a hydroxyl group [13]. The concentrated conspicuous peaks revealed the presence of aromatic rings in the structure. The multiple signals between δ 3.5 and 4.0 ppm were carbohydrate attributes, whereas the signals from δ 0.8 to 3.5 ppm were similar to a polysaccharide structure. The chemical shifts between δ 3.5 to δ 4.0 revealed that the polysaccharide structure had an electro-negative oxygen that originated from an ester functional group attached to it, resulting in functional groups such as alkoxy and hydroxyl [24]. The carbohydrate signals usually resonated between δ 3.5 and 4.5 ppm; some carbohydrate peaks were observed from δ 4.4 to 5.5 ppm, and others appeared from δ 0 to 5 ppm. These are unique from the existing literature, and these peaks are affected by various factors, such as the type of solvent used to dissolve the sample [29]. The 1H NMR spectra can be used to estimate the configuration of the glycosidic bonds of the polysaccharide structure. When the chemical signals of a proton are more significant than 5 ppm, the structure is predominantly α glycosidic linkage. However, if it is less than 5 ppm, the glycosidic bonds are mostly β. The biodefoamer used in this study is a carbohydrate with predominantly β glycosidic linkages. The carbohydrate structure of the biodefoamer will enhance MLSS flocculation due to its surface charges.

4. Conclusions

The isolated microbial consortium of Bacillus, Aeromonas, Klebsiella and Comamonas spp. produced biodefoamers with high biodefoamer efficacy and a foam decay rate suitable for WWTP application when RSM optimized the application conditions. The highest synthetic and biodefoamer efficiency was 96% under these conditions, i.e., pH 7 and a concentration of 4% (v/v). When further foam collapse studies were carried out, i.e., using the RSM optimum conditions, the maximum foam decay rate for the synthetic and biodefoamer was determined to be 99% at 50 min, with total foam suppression at 190 min. The microscopic pictures indicated that the AS was impacted by the presence and absence of defoamers (synthetic and biodefoamers), with the absence of both defoamers resulting in excessive filamentous bacterial growth. The FTIR spectra indicated that the biodefoamer used in this study was a polysaccharide, and 1H NMR confirmed that the defoamer was a carbohydrate constituent. These characteristics of the biodefoamers produced by Bacillus, Aeromonas, Klebsiella and Commamonas spp. consortia show that it is competent for activated sludge that contains biofoamers. The results that are portrayed in this paper show that the consortium was isolated from poultry slaughterhouse wastewater and it produced biodefoamers that were used for PSW and activated sludge defoamation. These biodefoamers’ foam reduction efficiency and foam decay rate were comparable to that of a synthetic defoamer, and it did not just reduce foam but also flocculated the sludge to prevent continuous foam regeneration and dosing. The microscopic analysis that was carried out in this study revealed that the synthetic silicone defoamer left oil residues in the sludge that harnesses filamentous growth and foam regeneration, which will require continuous dosing. This was the first study to compare a biodefoamer that is produced by a microbial consortium with a synthetic defoamer.

Author Contributions

Conceptualization, C.D., S.K.O.N. and M.B.; Data curation, C.D.; Funding acquisition, C.D., S.K.O.N. and M.B.; Investigation, C.D.; Project administration, S.K.O.N.; Resources, S.K.O.N., M.B., B.S.C. and B.I.O.; Supervision, S.K.O.N., M.B., B.S.C. and B.I.O.; Validation (Method), S.K.O.N., M.B., B.S.C., B.I.O., C.D. and M.R.M.; Writing—original draft, C.D.; Writing—review and editing, S.K.O.N., M.B., B.S.C. and B.I.O. All authors have read and agreed to the published version of the manuscript.

Funding

This research was funded by the Cape Peninsula University of Technology university research fund (URF RK16). The National Research Foundation of South Africa (NRF) cost center R017.

Data Availability Statement

Not applicable.

Acknowledgments

The author’s would like to thank the Bioresource engineering group (BioErg) student and my supervisors for their unwavering support, the Chemical Engineering lab Technician Hannelene Jo-Anne Small, Faculty of Applied Sciences, CPUT for their technical support.

Conflicts of Interest

The authors declare no conflict of interest.

References

  1. Burger, W.; Krysiak-Baltyn, K.; Scales, P.J.; Martin, G.J.O.; Stickland, A.D.; Gras, S.L. The influence of protruding filamentous bacteria on floc stability and solid-liquid separation in the activated sludge process. Water Res. 2017, 123, 578–585. [Google Scholar] [CrossRef]
  2. Zhou, S.; Liu, M.; Chen, B.; Sun, L.; Lu, H. Microbubble- and nanobubble-aeration for upgrading conventional activated sludge process: A review. Bioresour. Technol. 2022, 362, 127826. [Google Scholar] [CrossRef]
  3. Gemza, N.; Janiak, K.; Zięba, B.; Przyszlak, J.; Kuśnierz, M. Long-term effects of hydrocyclone operation on activated sludge morphology and full-scale secondary settling tank wet-weather operation in long sludge age WWTP. Sci. Total. Environ. 2022, 845, 157224. [Google Scholar] [CrossRef]
  4. Borzooei, S.; Miranda, G.H.B.; Abolfathi, S.; Scibilia, G.; Meucci, L.; Zanetti, M.C. Application of unsupervised learning and process simulation for energy optimization of a WWTP under various weather conditions. Water Sci. Technol. 2020, 81, 1541–1551. [Google Scholar] [CrossRef]
  5. Deepnarain, N.; Nasr, M.; Kumari, S.; Stenström, T.A.; Reddy, P.; Pillay, K.; Bux, F. Decision tree for identification and prediction of filamentous bulking at full-scale activated sludge wastewater treatment plant. Process. Saf. Environ. Prot. 2019, 126, 25–34. [Google Scholar] [CrossRef]
  6. Dlamini, N.G.; Basson, A.K.; Pullabhotla, R.V.S.R. Wastewater treatment by a polymeric bioflocculant and iron nanoparticles synthesized from a bioflocculant. Polymers 2020, 12, 1618. [Google Scholar] [CrossRef]
  7. Dlangamandla, C.; Basitere, M.; Okeleye, B.I.; Chidi, B.S.; Ntwampe, S.K.O. Biofoam formation and defoamation in global wastewater treatment systems. Water Pract. Technol. 2021, 16, 1–18. [Google Scholar] [CrossRef]
  8. Borzooei, S.; Amerlinck, Y.; Panepinto, D.; Abolfathi, S.; Nopens, I.; Scibilia, G.; Meucci, L.; Zanetti, M.C. Energy optimization of a wastewater treatment plant based on energy audit data: Small investment with high return. Environ. Sci. Pollut. Res. 2020, 27, 17972–17985. [Google Scholar] [CrossRef]
  9. Dehestaniathar, S.; Nesari, S.; Borzooei, S.; Abolfathi, S. Application of natural biodegradable fiber as biofilm medium and carbon source in DEnitrifying AMmonium OXidation (DEAMOX) process for nitrogen removal from wastewater. J. Taiwan Inst. Chem. Eng. 2021, 119, 108–114. [Google Scholar] [CrossRef]
  10. Guo, F.; Wang, Z.P.; Yu, K.; Zhang, T. Detailed investigation of the microbial community in foaming activated sludge reveals novel foam formers. Sci. Rep. 2015, 5, 7637. [Google Scholar] [CrossRef] [Green Version]
  11. Shi, Y.; Liu, Y. Evolution of extracellular polymeric substances (EPS) in aerobic sludge granulation: Composition, adherence and viscoelastic properties. Chemosphere 2021, 262, 128033. [Google Scholar] [CrossRef]
  12. Pajdak-Stós, A.; Kocerba-Soroka, W.; Fyda, J.; Sobczyk, M.; Fiałkowska, E. Foam-forming bacteria in activated sludge effectively reduced by rotifers in laboratory- and real-scale wastewater treatment plant experiments. Environ. Sci. Pollut. Res. 2017, 24, 13004–13011. [Google Scholar] [CrossRef] [PubMed]
  13. Deval, A.S.; Parikh, H.A.; Kadier, A.; Chandrasekhar, K.; Bhagwat, A.M.; Dikshit, A.K. Sequential microbial activities mediated bioelectricity production from distillery wastewater using bio-electrochemical system with simultaneous waste remediation. Int. J. Hydrogen Energy 2017, 42, 1130–1141. [Google Scholar] [CrossRef]
  14. Bukhari, N.A.; Loh, S.K.; Nasrin, A.B.; Jahim, J.M. Enzymatic Hydrolysate of Palm Oil Mill Effluent as Potential Substrate for Bioflocculant BM-8 Production. Waste Biomass Valorization 2020, 11, 17–29. [Google Scholar] [CrossRef]
  15. Kougias, P.G.; Boe, K.; Tsapekos, P.; Angelidaki, I. Foam suppression in overloaded manure-based biogas reactors using antifoaming agents. Bioresour. Technol. 2014, 153, 198–205. [Google Scholar] [CrossRef] [PubMed]
  16. Basitere, M.; Njoya, M.; Ntwampe, S.K.O.; Sheldon, M.S. Up-flow vs downflow anaerobic digester reactor configurations for treatment of fats-oil-grease laden poultry slaughterhouse wastewater: A review. Water Pract. Technol. 2020, 15, 248–260. [Google Scholar] [CrossRef]
  17. Dlangamandla, C.; Dyantyi, S.A.; Mpentshu, Y.P.; Ntwampe, S.K.O.; Basitere, M. Optimisation of bioflocculant production by a biofilm forming microorganism from poultry slaughterhouse wastewater for use in poultry wastewater treatment. Water Sci. Technol. 2016, 73, 1963–1968. [Google Scholar] [CrossRef]
  18. Bingo, M.N.; Njoya, M.; Basitere, M.; Ntwampe, S.K.O.; Kaskote, E. Performance evaluation of an integrated multi-stage poultry slaughterhouse wastewater treatment system. J. Water Process. Eng. 2021, 43, 102309. [Google Scholar] [CrossRef]
  19. Rinquest, Z.; Basitere, M.; Ntwampe, S.K.O.; Njoya, M. Poultry slaughterhouse wastewater treatment using a static granular bed reactor coupled with single stage nitrification-denitrification and ultrafiltration systems. J. Water Process. Eng. 2019, 29, 100778. [Google Scholar] [CrossRef]
  20. Mangundu, J. Optimisation of Defoamer in A Bio-Reactor. Master’s Thesis, University of the Witwatersrand, Johannesburg, South Africa, 2017. not published. [Google Scholar]
  21. Martins, A.M.P.; Pagilla, K.; Heijnen, J.J.; Van Loosdrecht, M.C.M. Filamentous bulking sludge-A critical review. Water Res. 2004, 38, 793–817. [Google Scholar] [CrossRef]
  22. Diao, H.; Li, L.; Liang, J.; Lu, C.; Ding, X.; Guo, W. Optimized extraction process and compositional analysis of bioflocculant produced by Klebsiella M1. BioResources 2019, 14, 3146–3167. [Google Scholar] [CrossRef]
  23. Garg, A.; Stensel, H.D.; Bucher, B.; Sukapanpotharam, P.; Winkler, M.K.H. Effect of waste activated sludge pretreatment methods to mitigate Gordonia foaming potential in anaerobic digestion. Water Environ. J. 2021, 35, 381–389. [Google Scholar] [CrossRef]
  24. Tsilo, P.H.; Basson, A.K.; Ntombela, Z.G.; Maliehe, T.S.; Pullabhotla, R.V.S.R. Isolation and Optimization of Culture Conditions of a Bioflocculant-Producing Fungi from Kombucha Tea SCOBY. Microbiol. Res. 2021, 12, 950–966. [Google Scholar] [CrossRef]
  25. Biswas, J.K.; Banerjee, A.; Sarkar, B.; Sarkar, D.; Sarkar, S.K.; Rai, M.; Vithanage, M. Exploration of an extracellular polymeric substance from earthworm gut bacterium (Bacillus licheniformis) for bioflocculation and heavy metal removal potential. Appl. Sci. 2020, 10, 349. [Google Scholar] [CrossRef]
  26. Lee, S.; Lee, J.; Hwang, N. Effect of the dispersion state in Y5O4F7 suspension on YOF coating deposited by suspension plasma spray. Coatings 2021, 11, 831. [Google Scholar] [CrossRef]
  27. Pauzi, S.M.; Halbert, D.A.; Azizi, S.; Ahmad, N.A.A.; Marpani, F. Effect of organic antifoam’s concentrations on filtration performance. J. Phys. Conf. Ser. 2019, 1349, 012141. [Google Scholar] [CrossRef]
  28. Mamais, D.; Kalaitzi, E.; Andreadakis, A. Foaming control in activated sludge treatment plants by coagulants addition. Glob. Nest J. 2011, 13, 237–245. [Google Scholar] [CrossRef]
  29. Hatta, N.S.M.; Lau, S.W.; Takeo, M.; Chua, H.B.; Baranwal, P.; Mubarak, N.M.; Khalid, M. Novel cationic chitosan-like bioflocculant from Citrobacter youngae GTC 01314 for the treatment of kaolin suspension and activated sludge. J. Environ. Chem. Eng. 2021, 9, 105297. [Google Scholar] [CrossRef]
  30. Routledge, S.J. Beyond de-foaming: The effects of antifoams on bioprocess productivity. Comput. Struct. Biotechnol. J. 2012, 3, e201210001. [Google Scholar] [CrossRef]
  31. Manyele, S. Foaming Characteristics of the Food-Industry Biological Wastewater Treatment Plant. Tanzan. J. Eng. Technol. 2007, 30, 17–28. [Google Scholar]
  32. Gao, N.; Xia, M.; Dai, J.; Yu, D.; An, W.; Li, S.; Liu, S.; He, P.; Zhang, L.; Wu, Z.; et al. Both widespread PEP-CTERM proteins and exopolysaccharides are required for floc formation of Zoogloea resiniphila and other activated sludge bacteria. Environ. Microbiol. 2018, 20, 1677–1692. [Google Scholar] [CrossRef]
  33. Wang, J.; Nguyen, A.V.; Farrokhpay, S. Foamability of sodium dodecyl sulfate solutions: Anomalous effect of dodecanol unexplained by conventional theories. Colloids Surf. A Physicochem. Eng. Asp. 2016, 495, 110–117. [Google Scholar] [CrossRef]
  34. Nilsson, F.; Davidsson, Å.; Falås, P.; Bengtsson, S.; Bester, K.; Jönsson, K. Impact of activated sludge ozonation on filamentous bacteria viability and possible added benefits. Environ. Technol. 2019, 40, 2601–2607. [Google Scholar] [CrossRef]
  35. Omar, M.M.; Mohamed, G.G.; Ibrahim, A.A. Spectroscopic characterization of metal complexes of novel Schiff base. Synthesis, thermal and biological activity studies. Spectrochim. Acta Part A Mol. Biomol. Spectrosc. 2009, 73, 358–369. [Google Scholar] [CrossRef]
  36. Pal, P.; Khairnar, K.; Paunikar, W.N. Causes and remedies for filamentous foaming in activated sludge treatment plant. Glob. NEST J. 2014, 16, 762–772. [Google Scholar]
  37. Pedrazzani, R.; Menoni, L.; Nembrini, S.; Manili, L.; Bertanza, G. Suitability of Sludge Biotic Index (SBI), Sludge Index (SI) and filamentous bacteria analysis for assessing activated sludge process performance: The case of piggery slaughterhouse wastewater. J. Ind. Microbiol. Biotechnol. 2016, 43, 953–964. [Google Scholar] [CrossRef]
  38. Petrovski, S.; Dyson, Z.A.; Quill, E.S.; McIlroy, S.J.; Tillett, D.; Seviour, R.J. An examination of the mechanisms for stable foam formation in activated sludge systems. Water Res. 2011, 45, 2146–2154. [Google Scholar] [CrossRef] [PubMed]
  39. Simjoo, M.; Rezaei, T.; Andrianov, A.; Zitha, P.L.J. Foam stability in the presence of oil: Effect of surfactant concentration and oil type. Colloids Surf. A Physicochem. Eng. Asp. 2013, 438, 148–158. [Google Scholar] [CrossRef]
  40. Vanaja, M.; Paulkumar, K.; Baburaja, M.; Rajeshkumar, S.; Gnanajobitha, G.; Malarkodi, C.; Sivakavinesan, M.; Annadurai, G. Degradation of methylene blue using biologically synthesized silver nanoparticles. Bioinorg. Chem. Appl. 2014, 2014, 742346. [Google Scholar] [CrossRef] [PubMed]
  41. Subudhi, S.; Bisht, V.; Batta, N.; Pathak, M.; Devi, A.; Lal, B. Purification and characterization of exopolysaccharide bioflocculant produced by heavy metal resistant Achromobacter xylosoxidans. Carbohydr. Polym. 2016, 137, 441–451. [Google Scholar] [CrossRef]
  42. Katritzky, A.R.; Akhmedov, N.G.; Denisenko, S.N.; Denisko, O.V. 1H NMR spectroscopic characterization of solutions of Sepia melanin, Sepia melanin free acid and human hair melanin. Pigment Cell Res. 2002, 15, 93–97. [Google Scholar] [CrossRef] [PubMed]
Figure 1. Aeration column setup.
Water 15 00655 g001
Figure 2. A graphical illustration showing the effect of pH and concentration on (A,C) foam reduction efficiency of the biodefoamer; synthetic defoamer (B,D) foam collapse rate in the presence of a biodefoamer and a synthetic defoamer, respectively.
Water 15 00655 g002
Figure 3. Graphical profile of foam behavior in the presence of bio- and synthetic defoamer as well as in the presence of a defoamer.
Water 15 00655 g003
Figure 4. A micrograph representation of sludge: in the absence of a defoamer (AC), in the presence of a biodefoamer (DF) and when it was exposed to a synthetic defoamer (images GI).
Water 15 00655 g004
Figure 5. Fourier transform infrared spectroscopy (FTIR) spectrogram of the biodefoamers produced by a PSW consortium.
Water 15 00655 g005
Figure 6. 1H NMR spectra of a biodefoamer.
Water 15 00655 g006
Table 1. Media constituents included in the central composite design (CCD) experiments and their corresponding high, medium and low pH and concentration.
VariablesCodeUnitsHigh Level (+)Medium (0)Low Levels (−)
pHA-10.608.506.30
ConcentrationB% (v/v)4.602.501.00
Table 2. Characteristics of poultry slaughterhouse wastewater from the literature reviewed and the current study.
ParametersMinimum
(mg/L)
Maximum
(mg/L)
Average
(mg/L)
ReferencesCurrent Study (mg/L)
FOG131684406[16]710–1178
Proteins0368184[17]29–96
TSS19831001207[18]2000–10,000
COD251712,4905216 ± 2534[19]4510–8355
Table 3. Foaming assessment specifications of the reactor.
DimensionsSpecifications
Cylinder
MaterialPolypropylene
Height24.5 cm
Diameter3 cm
Air flow rate80 mL/min
Diffusers
Porous length2.32 cm
Porous diameter1.2 cm
Media grade40
Porous material316LSS
Table 4. Experimental design table for the independent variables pH (A) and defoamer concentration (B); and for the dependent variables (foam reduction efficiency and foam collapse rate of the biodefoamer and synthetic defoamer (AB)).
RunpHConcentration (%v/v)Foam Reduction Efficiency (%v/v)Foam Collapse Rate (mm/s)
Synthetic DefoamerBiodefoamerSynthetic DefoamerBiodefoamer
18.50.3893730.830.5
21012.9730.550.55
38.52.583820.420.5
48.52.583820.420.5
58.54.615150.50.5
66.382.5964210.5
78.52.583820.420.5
88.52.583820.420.5
910.62.587730.450.45
108.52.583820.420.5
117190731.250.83
127496961.72.5
1310495780.420.42
Disclaimer/Publisher’s Note: The statements, opinions and data contained in all publications are solely those of the individual author(s) and contributor(s) and not of MDPI and/or the editor(s). MDPI and/or the editor(s) disclaim responsibility for any injury to people or property resulting from any ideas, methods, instructions or products referred to in the content.

