
The Perturbation of Mangla Watershed Ecosystem in Pakistan Due to Hydrological Alteration
by
 , ,
, ,
Akif Rahim
1, 
Xander Wang
2,*,
Neelam Javed
3,
Farhan Aziz
2,
Amina Jahangir
4 and
Tahira Khurshid
4 1
Faculty of Environmental Sciences, Czech University of Life Sciences Prague, Kamýcá 129, Praha-Suchdol, 16500 Prague, Czech Republic
2
School of Climate Change and Adaptation, University of Prince Edward Island, 550 University Ave., Charlottetown, PE C1A 4P3, Canada
3
Pakistan Meteorological Department, Lahore 54000, Pakistan
4
College of Earth and Environmental Science, University of the Punjab, Lahore 54000, Pakistan
*
Author to whom correspondence should be addressed.
Water 2023, 15(4), 656; https://doi.org/10.3390/w15040656
Submission received: 15 December 2022
/
Revised: 1 February 2023
/
Accepted: 2 February 2023
/
Published: 8 February 2023
(This article belongs to the Special Issue Climate Change Impact on Hydrological Cycle and Water Resources Management)
Abstract
:Hydrological regimes influence an aquatic ecosystem’s biotic composition, structure, and functioning. But construction of dams or anthropogenic activities substantially alter the hydrologic regimes. In this study, we used a method named as the “Indicators of Hydrologic Alteration” to examine the degree of hydrologic alteration at seven flow gauge stations in the Mangla watershed. The assessment of alteration is carried out according to the Range of Variability (RVA). This method relies on analyzing hydrologic data obtained from existing measurement points (e.g., stream gauges) within an ecosystem or model-generated data. We used 33 parameters categorized into 5 groups based on magnitude, duration, frequency, timing, and rate of change to characterize hydrologic variation within a year statistically. We then examine the hydrologic perturbations by comparing the measure of central tendency and dispersion for each parameter between the “pre-impact (1967–1994)” and “post-impact (1995–2014)” periods. The results show that within the Mangla watershed, the high alteration was noted in the magnitude of monthly flows and extreme flows at Azad Pattan, Gari Habibullah, Palote and at Muzafarabad stations. The flow at Domel and Kohala stations are found in low hydrological alteration among all groups of indicators. The study indicates that Neelum Basin at Muzaffarabad has significantly high alteration with maximum negative values. On the other hand, a high frequency of alteration observed in the monthly flows and extreme water conditions. Overall, a moderate alteration is observed in the whole watershed, which may produce adverse effects on the aquatic ecosystem of the Mangla watershed.
1. Introduction
Rivers fulfill more than fifty percent global water demands [1]. These play a significant role in maintaining the ecological health, economic prosperity and human wellbeing [2]. The river ecosystem is an essential element for the local and worldwide environment [3,4]. But, river flows fluctuate based on the variations in temperature and precipitation [5,6]. Climate change cause the spatio-temporal variability in river flows [7,8,9,10], which ultimately influence the ecosystem of a watershed. Climate change affects the land cover which in turn alters the streamflow pattern [11]. These alteration, in addition to reducing ecosystem services [12] also produce negative impacts on geomorphic processes [13]. Along with the climate change, the human freshwater needs [4] and development [14] has caused the dramatic variations in river ecosystems worldwide [15]. The natural flow of a river is important for maintaining the ecological integrity which in turn depends upon the dynamic characteristics of streamflow (e.g., frequency, duration, timing, magnitude, and rate of change) [16,17]. Therefore, river is known as a “Master variable” that regulates the physical and ecological processes of a river system. The ecological processes involve nutrient cycling and movement of water and sediment. Within a system, interaction of these processes give rise to some unique ecological characteristics which may include stream temperature, morphology, sedimentation, and composition of biotic communities. Therefore, it is important to protect these ecological functions because biotic communities depend upon the flow characteristics at different stages of their life cycle [16].
The increased water consumption for agriculture, industries and power generation has reduced the availability of fresh water resources globally [18,19]. Human activities have changed the flow regimes. Numerous studies have reported that anthropogenic activities have significantly impacted the ecosystem, with extensive changes occurring in river systems and biodiversity [20,21,22,23,24,25]. Recent pressure on the freshwater ecosystem has caused the extinction of about 20% of freshwater species worldwide. The construction of dams and barrages along the rivers is the primary reason for biodiversity exploitation. Globally, more than 40,000 dams are influencing 60% of natural river flows. This posed a consistent warning to the river’s ecologically stability [26,27,28]. Therefore, the assessment of hydrological alteration is essential for describing measures for river protection and restoration [29,30,31]. Researchers recognized the flow variability a primary driver which describe the function and structure of a river ecosystem [4]. In 2008, Tao Yang used mapping technique and Range of Variability Analysis (RVA) for assessing the spatial variations in hydrologic alterations (HA) occurred in response to the dam construction along the lower Yellow River, China, during the past 50 years [32]. Similarly, Gabriel Minea and his fellows investigated the impacts of Siriu Dam on the mean daily discharge of the Buzău River [33]. In 2012, W. Wu and his coworkers found Baojixia water diversion works have direct effects on river hydrology, which first produced changes in the magnitude and frequency of low/high flows, and ultimately results in a new hydrologic regime that differs remarkably from the natural flow regime [34]. Chen Y.D in 2010 used range of variability approach to provide an improved assessment about the dam-induced hydrologic modification in the center as well as top East River, south China during 1952–2002 [35]. The effect of human activities on water bodies’ have grown over the last decades [36]. Many previous researchers have investigated flow variability by using more than 170 hydrologic metrics which describe ecological attributes of flow regimes [37]. There require effective methods to assess the hydrologic alteration.
Usually, the river flow data is used to produce the ecological relevant hydrological indicators for characterizing the flow regime. Several methods have been designed to assess the variations in river hydrology. The earliest river flow indicators were established in the mid-1970s [38]. While, other indicators were developed on the basis of flow rate characteristics including daily magnitude of flow [39,40], monthly and annual flow magnitude [41,42], low flow conditions [40,42], base flow [4,43], maximum flow [4,39,40,43] duration of flow [43], timing and rate of change of flow [40]. According to the number of hydrological indicators involved, hydrological alteration assessment methods can be classified as either univariate or multivariate. In univariate approaches, there is only one indicator (e.g., annual flows, flow duration curves or flood frequency) demonstrates one aspect of flow regime. The ratio of observed to historical value of indicator describes the degree of alteration [44]. Since this approach is simple to formulate, therefore has been commonly used in riverine studies [38,45,46]. The major disadvantage of this approach is that it does not describe the numerous ecologically important characteristics of the flow regime. For resolving this issue, the scientists have used multivariate approaches [47,48,49]. In this regard, the commonly used multivariate approach for examining the hydrological alteration is range of variability approach (RVA) [31,43,50,51,52,53]. In 1997, Chen Richter produced this approach [52], and since then many revised versions have been proposed to enhance its performance [53,54,55,56,57,58]. In 2007, Shiau and Wu employed three methods (such as three-class, fuzzy-based, and overall-mean) for estimating the magnitude of hydrological alteration in the range of variability approach (RVA) [54]. Similarly, in 2015, Yin et al. coupled the traditional RVA with the alteration of type of hydrological year (wet, dry or normal years) [58]. Among different methods to show seasonal effects and to describe each particular hydrological year, the Indicator of Hydrological Alteration (IHA; [43]) has been widely applied to examine the alterations in the river regime that occurred in response to dam construction, e.g., the River Roanoke in North Carolina [43], La Nga river in Vietnam [59], Tana river in Kenya [60], Huaihe river in China [29] and River Karkheh in Iran [61]. But, in most cases, these approaches are time–consuming, and these are based on daily flow data, which all the regions do not have.
The recently proposed hydropower projects i.e., Neelum Jhelum project and Kohala Project have altered the flow regime of Jhelum River. Neelum Jhelum project, situated in Muzaffarabad, will divert water from Neelum River to Jehlum River where power station is situated [62]. Which disrupt the aquatic ecosystem and cause the extinction of weak species that are small in number [62]. Kohala Hydropower Project is near saran village 40 km upstream from Muzaffarabad. The major impacts of these projects are expected in downstream due to the less availability of water. That results in the decline in fish population up to 50% [62,63]. Though man-induced changes in river flows offer several societal benefits, but these lower the valuable ecosystem services. Moreover, the alteration of natural flow regimes also threatens the freshwater biodiversity [44,64]. Evaluation of the perturbation of river ecology due to reservoir operation, river regulation and reservoir operation rules requires a detailed investigation of suitable hydrological indicators. The evaluation of ecological indicators based on the hydrological flow (which is affected by climate change and anthropogenic activities) will assist environmentalists and hydrologists to study the effects of hydrological flow alteration on aquatic ecosystems.
To fulfill the human water demands, the freshwater requirements for maintaining the ecosystem are mostly ignored. Therefore, it is crucial to analyze the variations in flow regimes so that the freshwater ecosystems can be protected and managed effectively. The current research aims to examine the possible impacts of the hydrological perturbation on Mangla watershed ecosystem. The main objectives are (i) to evaluate the hydrological alteration (HA), (ii) to select the representative indicators based on hydrological alteration, (iii) to evaluate the impacts of representative indicators on the ecology of the Mangla watershed. This study will also help the policy makers for decision making and planning and development of any hydraulic structure on the river of study area and to find the associated impacts on the sustainability of ecosystem.
2. Study Area
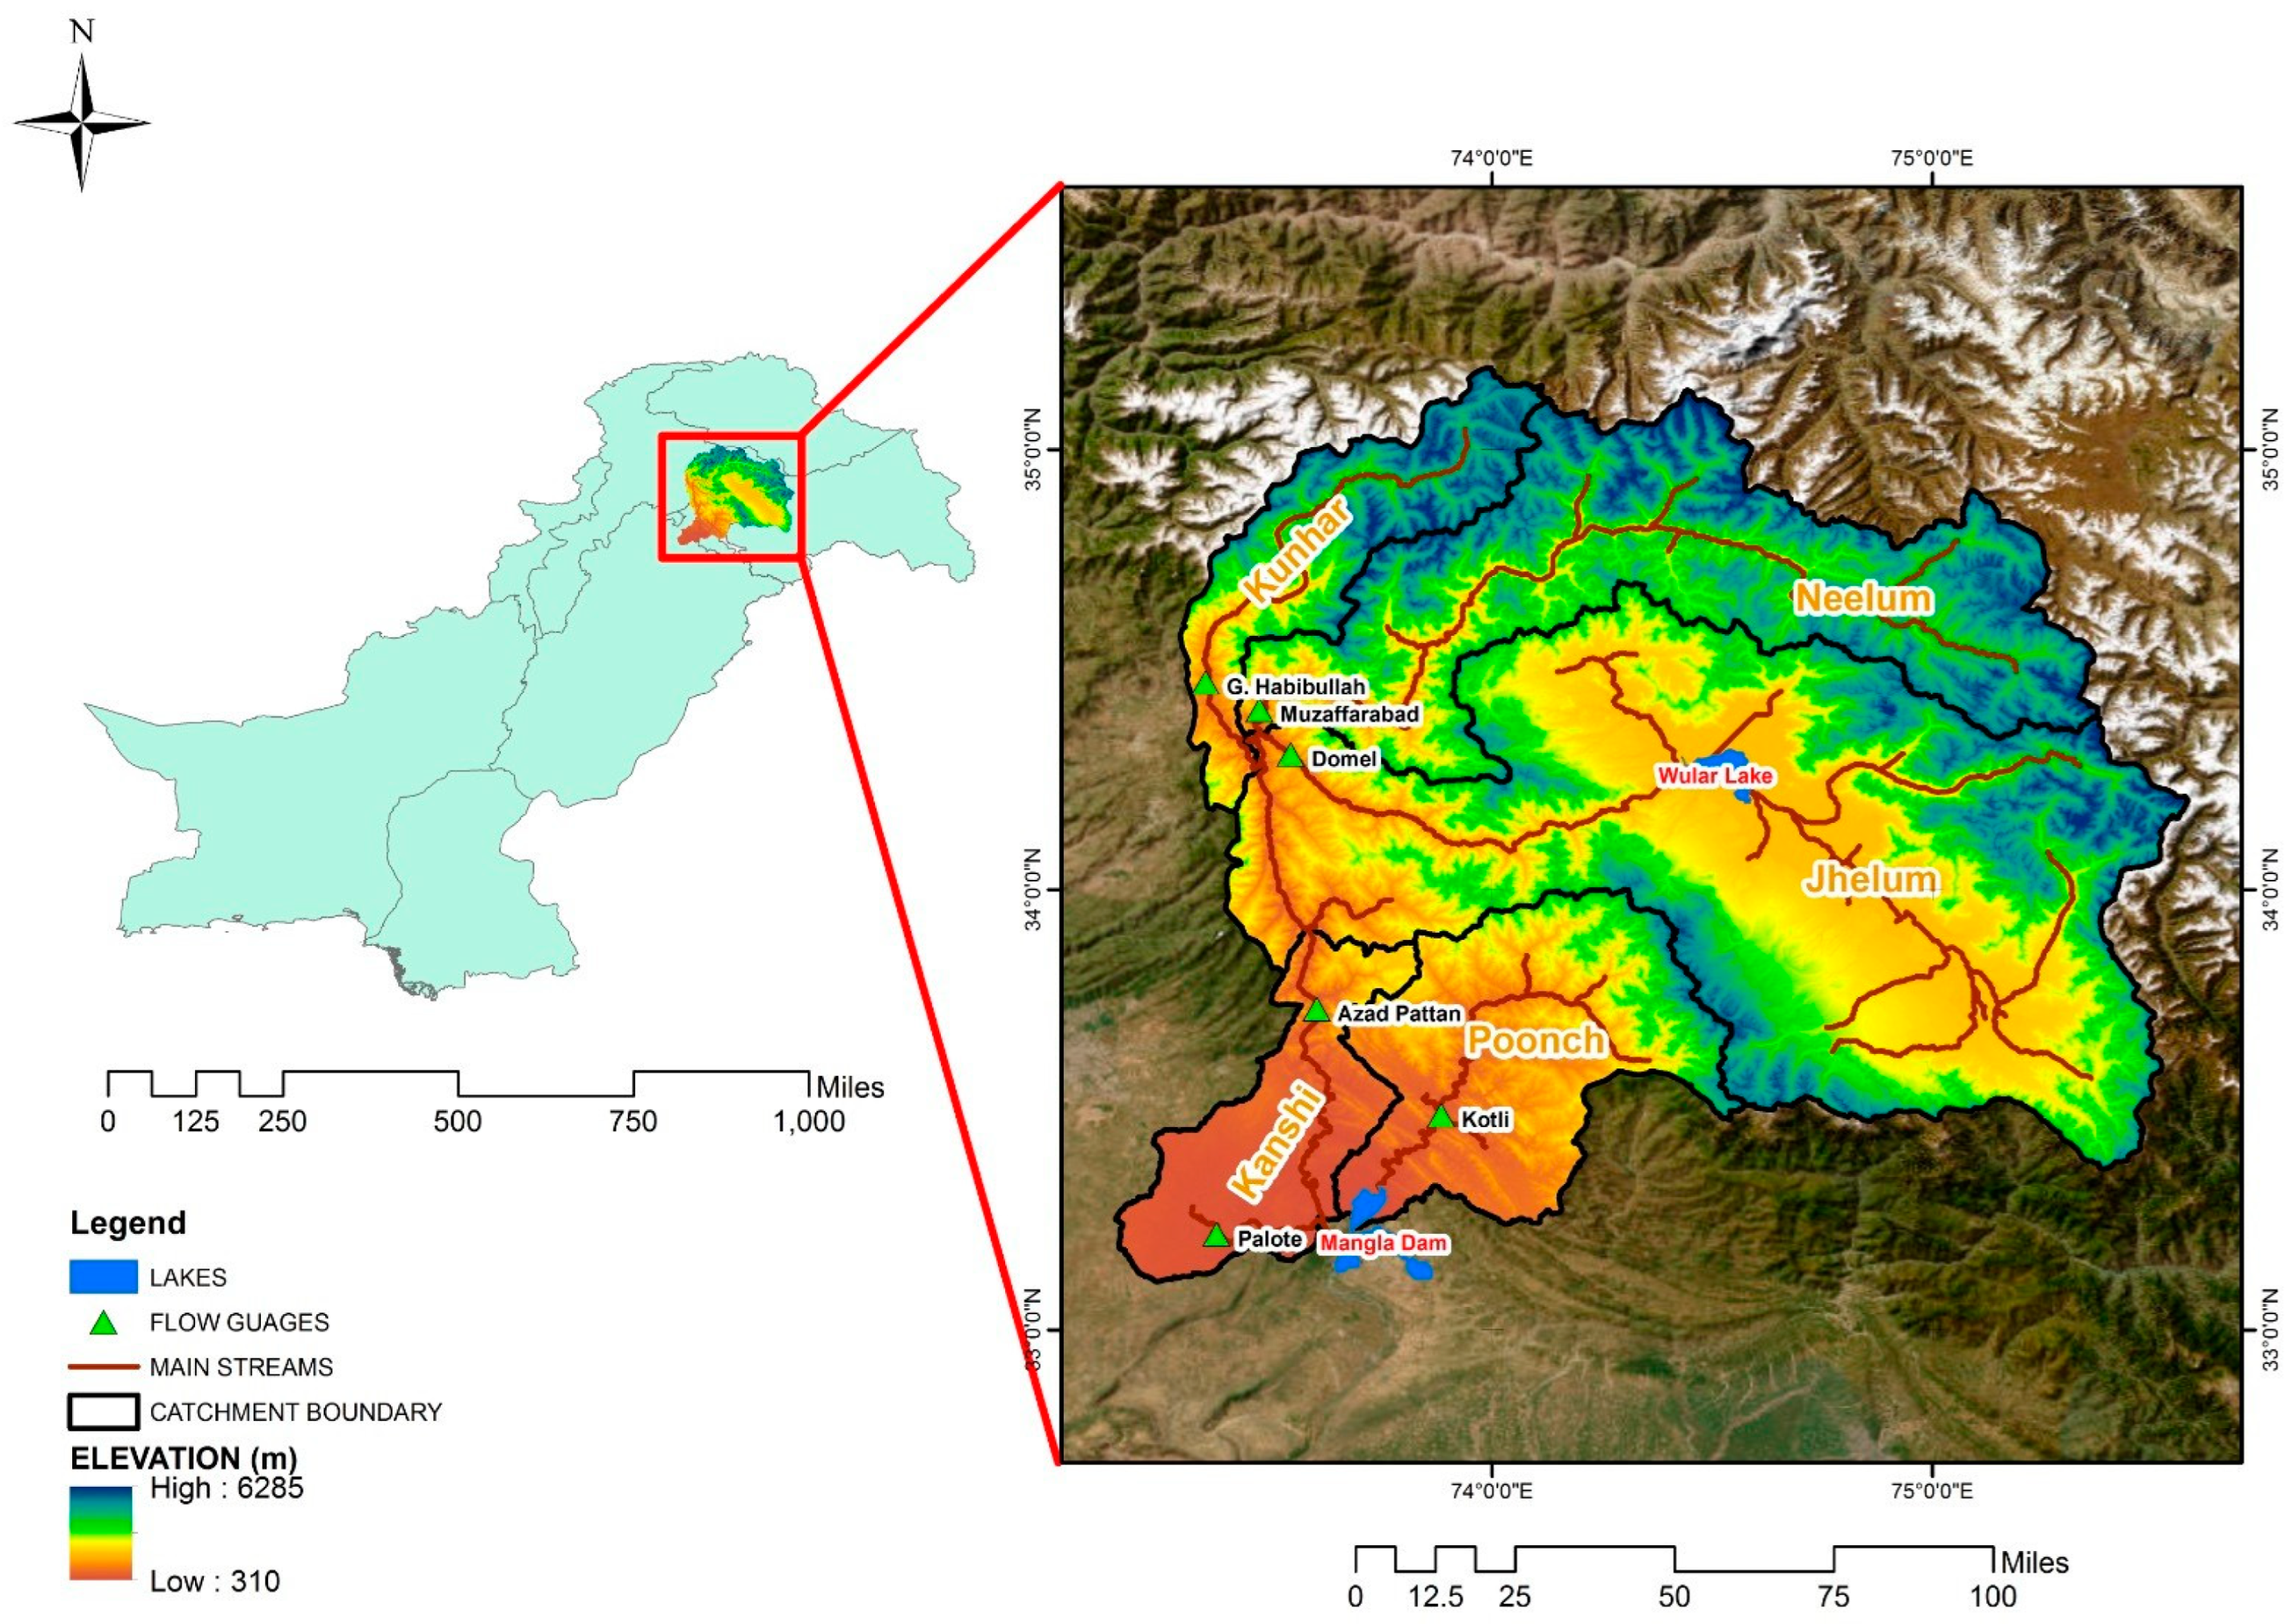
The present study is carried out in Mangla watershed that extends between latitudes of 33°00′ N to 35°12′ N and longitude of 73°07′ E to 75°40′ E, see Figure 1. Its total area is 33,455 km2. The elevation range in the Mangla watershed extends from 253 m to 6173 masl. The five major basins of the Mangla watershed are named as Neelum, Kunhar, Poonch, Kanshi and Jehlum. India covers 55% of the Mangla watershed, while Pakistan occupies 45%. The seven flow gauge stations: namely Azad Patten (AZP), Domel, Kohala (installed on Jehlum river), Ghari Habibullah (GHU), Muzaffrabad (MZP), Palote and Kotli flow gauges (installed on Kunhar, Neelum, Kanshi and Pooch River) are selected to assess the hydrological alteration, see Table 1.
The Mangla watershed located in the monsoon belt, thus, rivers are fed by rainfall and snowmelt in summer, while in the winter, the light shower of rain contributes to the total runoff. Due to the monsoon rain and snowmelt, there exist high flows in the Mangla watershed from August to September. The river flows decrease in February, therefore, it is considered as a dry month [65]. Among all the rivers, the Jhelum River exhibit the highest contribution (i.e., 41%) to the total watershed flow, followed by the Neelum, Kunhar, Kanshi, and Poonch rivers; and their flow contribution are 34%, 10%, 13%, and 1% respectively. The Kunhar basin experiences snow avalanches during mid-December to May while at the high altitude of the basin, this process continues till June. The river flows become effected by the snow avalanches and the rising air temperature in the Kunhar basin trigger lake burst which in turn alter the hydrological flows [66].
3. Material and Method
In this study, 47 years daily discharge data of seven gauges have used to assess the hydrological alteration in the Mangla watershed. The daily discharge time series further divided into periods (a) pre period (1967–1994) (b) post period (1995–2014) reported by [66]. To quantify the hydrological alteration (HA), we employed the Range of Variability Analysis (RVA), which consists of 33 hydrological parameters. These parameters were categorized into five groups based on magnitude, duration, frequency, timing, and rate of change [52]. The present study does not include ‘number of zero days’ in the analysis as we didn’t identify the days having zero flows during the study period in the Mangla watershed. For the post-impact period, the nonparametric approach was used to define the median and 25th and 75th percentile as a variability range. Hydrological alteration is measured by the degree to which the RVA is not achieved [4]. The hydrological alteration (HA) can be expressed in terms of percentage as follows:
where,
- fo = The no. of years in post-period (1995–2014).
- fe = The no. of years in pre-period (1967–1994).
The zero value of HA indicates that there is no alteration in the selected parameter of hydrology, whereas the positive values show that the hydrological parameter values are greater than the expected values and the negative values demonstrate that hydrological parameter values are less than the expected values. The degree of HA was divided into three classes (0–33%) no alteration, (34% to 67%) moderate alteration and (>67%) high alteration (Richter et al., 1998).
The details of each indicator group are given below:
3.1. Group 1: Magnitude of Monthly Water Conditions
The indicators of this group indicate monthly averages of water conditions which can be explained by using following equation:
here,
- HA1,m = indicator from group 1, for month m (m3/s)
- m = ordinal no. of months in a year, 1 ≤ m ≤ 12
- n = no. of days of a month
- Qi = daily mean discharge (m3/s), ith day of mth month
3.2. Group 2: Magnitude and Duration of Annual Extreme Water Conditions
The indicators here demonstrate the maxima and minima of a year, which have a duration of 1, 3, 7, 30, and 90 days. For minima:
here:
- HA2,m = indicator of group 2 for minima (m3/s), m ∈ {1, 3, 5, 7, 9}
- n = duration (days), n ∈ {1, 3, 7, 30, 90}
- Qi = daily mean discharge (m3/s), ith day of year
For maxima:
here:
- HA2,m = indicator of group 2 for maxima (m3/s), m ∈ {2, 4, 6, 8, 10}
- n = duration (days), n ∈ {1, 3, 7, 30, 90}
- Qi = daily mean discharge (m3/s), ith day of year
3.3. Group 3: Timing of Annual Extreme Water Conditions
The two indicators of this group are described using the following expression:
here,
- HA3,1 and IHA3,2 = indicators of HA from group 3
- i = ordinal no. of days in a year (1 ≤/≤ 365)
- Qi = daily mean discharge (m3/s), ith day of year
- Qmax = maximal recorded daily mean discharge (m3/s) during the year
- Qmin = minimal recorded daily mean discharge (m3/s) during the year
3.4. Group 4: Frequency and Duration of High/Low Pulses
Following mathematical expressions are used to explain the indicators of this group:
here,
- HA4,1 and IHA4,2 = no. of high and low pulses
- IHA4,3 and IHA4,4 = average time period of high and low pulses (days)
- i = ordinal number of days in a year (1 ≤/≤ 365)
- Qi = daily mean discharge (m3/s), ith day of year
- Q25% = discharge of 25% duration (m3/s)
- Q75% = discharge of 75% duration (m3/s)
3.5. Group 5: Rate/frequency of Water Condition Changes
Here, all three indicators are described using following equations:
here,
- HA5,1, IHA5,2 and IHA5,3 = indicators of group (m3/s)
- i = ordinal no. of day in a year (1 ≤/≤ 365)
- Qi = daily mean discharge (m3/s), ith day of year.
3.6. Selection of Indicators for Spatial Assessment
For this purpose, the RVA values were calculated using the hydrological variables at single point (one station), while the HA was measured on a temporal scale. However, the point-based evaluation describes that the hydrological condition is extended from that point to upstream and downstream of the Mangla watershed. The indicators less than the 67th percentile do not describe the complete degree of HA [52]. Suitable hydrological indicators were selected by taking the median of absolute HA of each indicator calculated for each station, then ranking all median values and determining the 67th percentile of all ranked medians. The indicator having median value greater than the 67th percentile were selected as a spatial suitable indicator to represent the hydrological alteration. The relation of hydrological indicator and ecological influence are given in the Table 2.
4. Results and Discussion
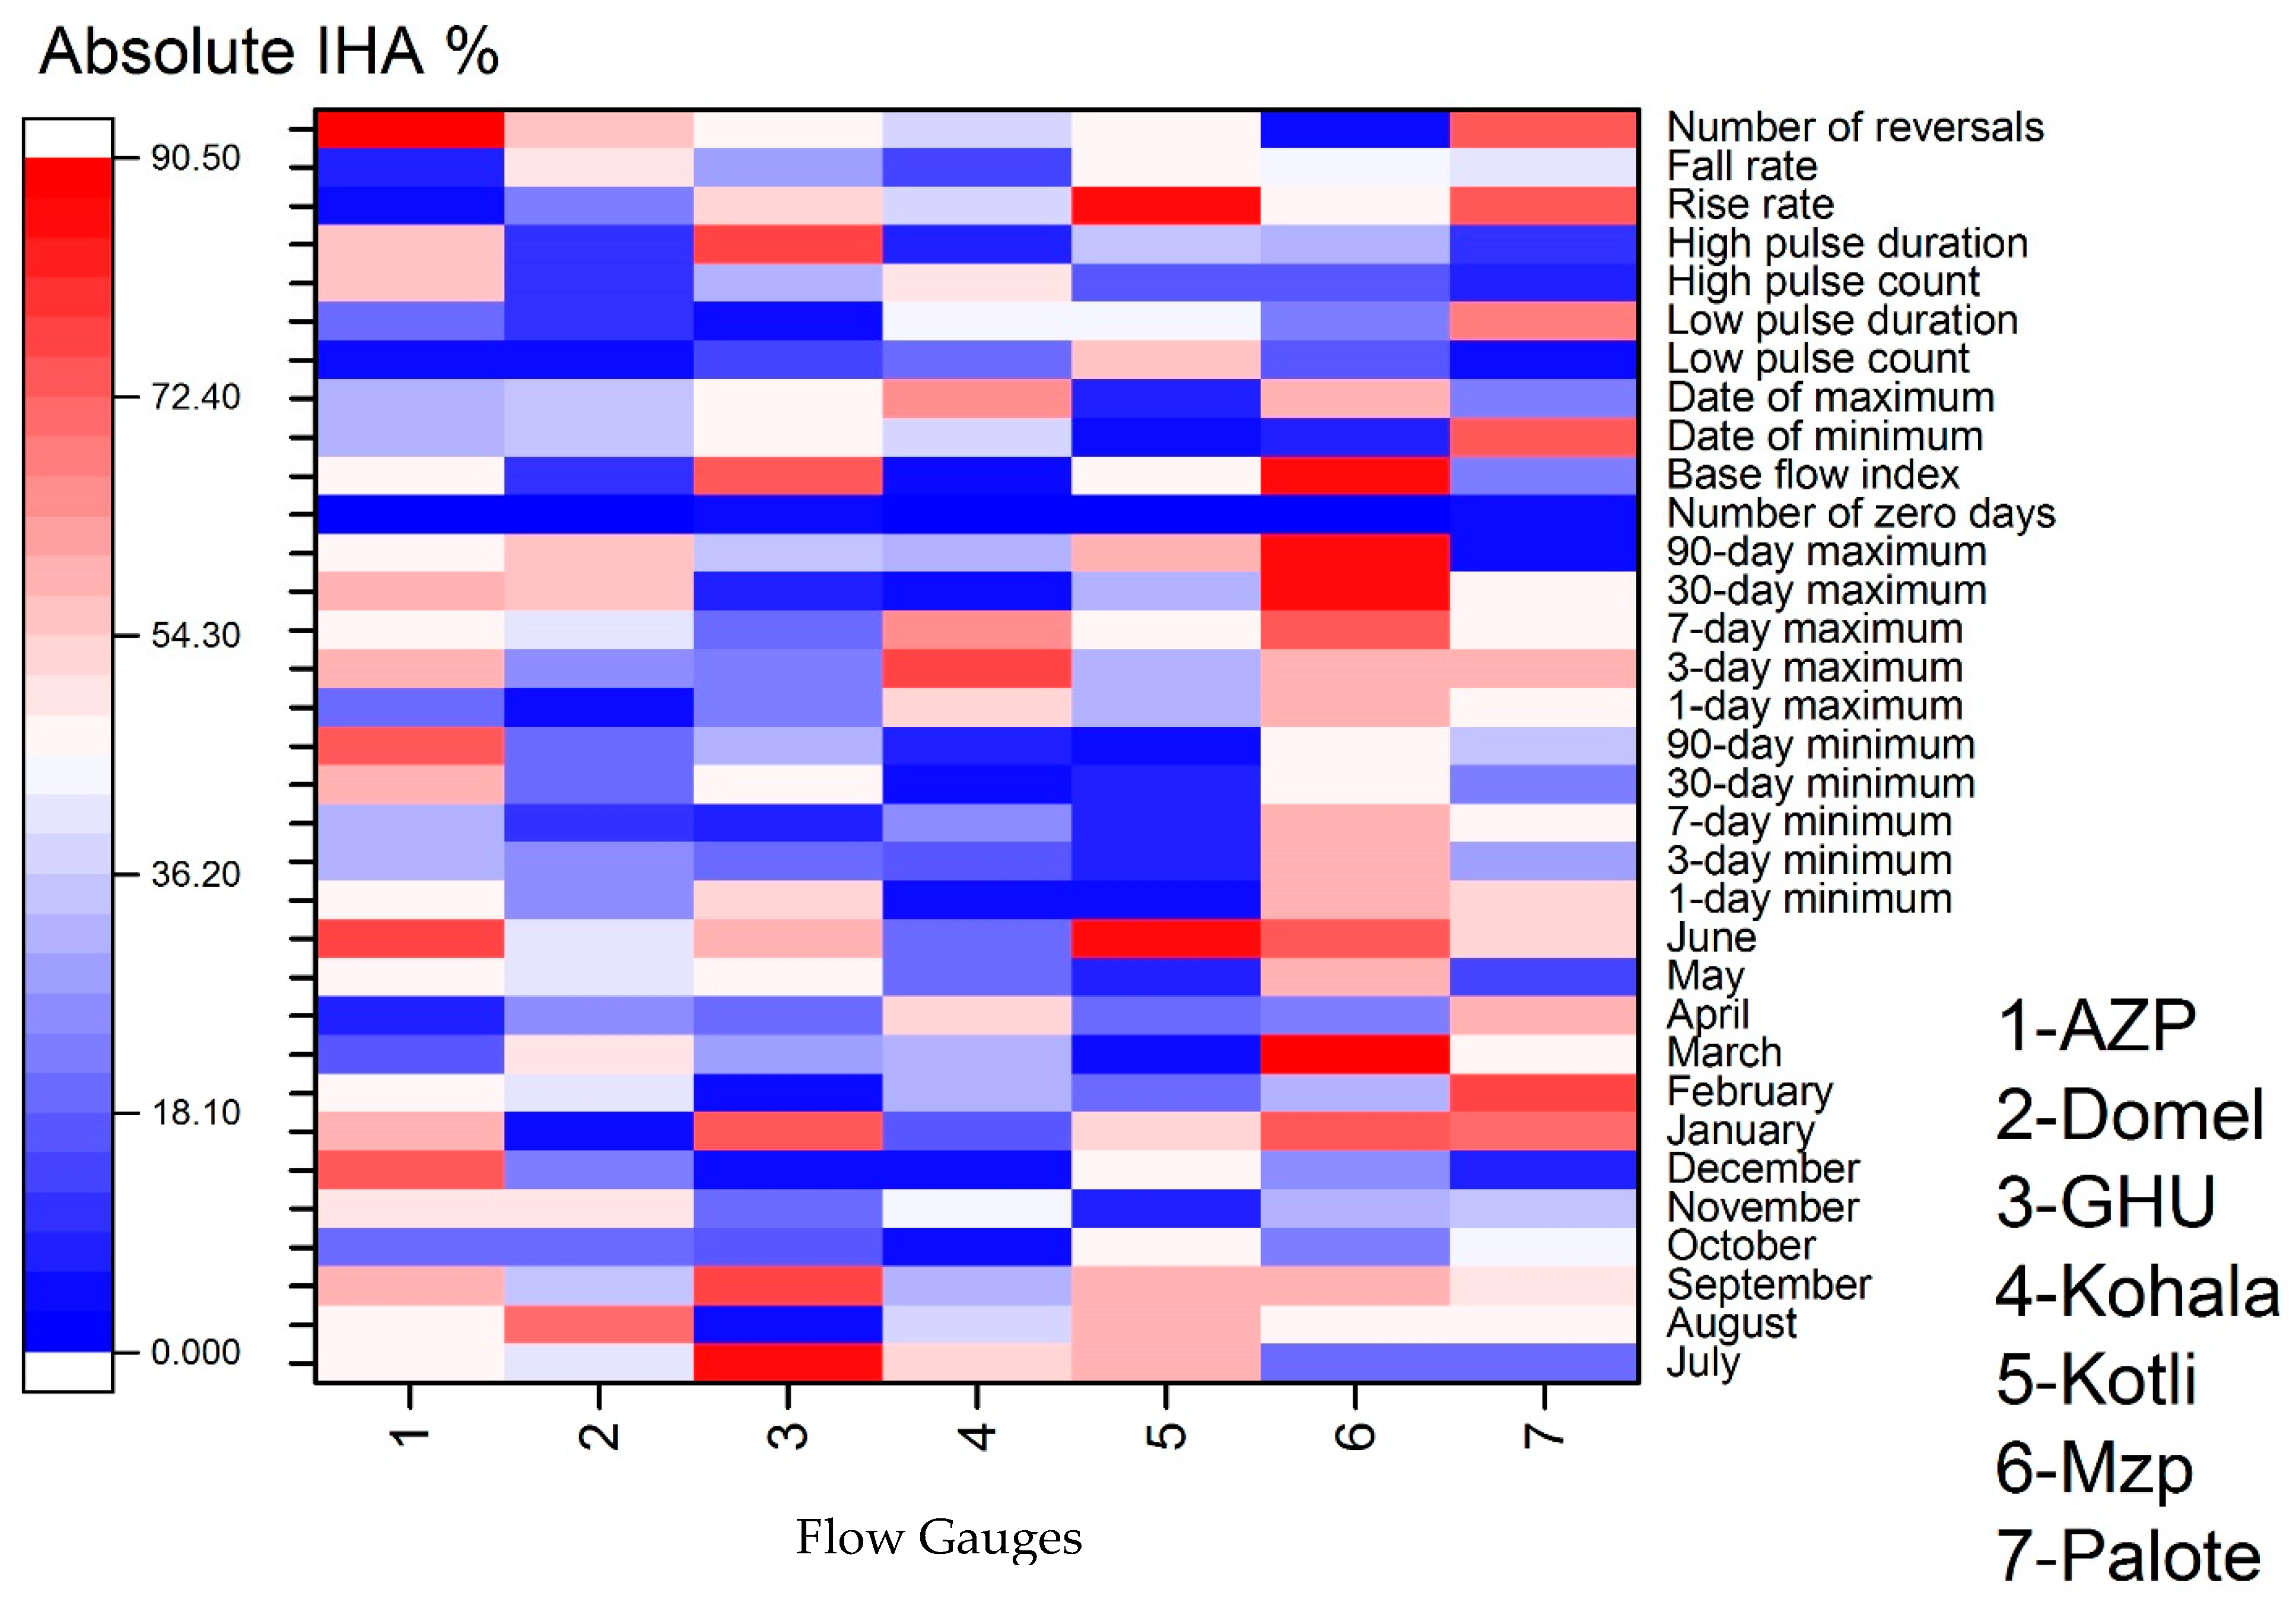
The degree of hydrological alteration for all 33 parameters at all the selected hydrological stations was calculated using the IHA (v 7.1) software. For variability analysis, the percentile values of 25th and 75th were taken as a lower and upper target range. Figure 2 reveals absolute hydrological alteration. Overall, the hydrological alteration was maximum in 4 indicators at Azad Pattan, 1 indicator at Domel and Kohala, 5 indicators at Gari Habibullah, 2 indicators at Kotli, 7 indicators at Muzafarabad and 4 indicators at Palote. No significant alteration was observed in the indicator associated with the number of zeros’ days over the study region.
4.1. Group 1: Magnitude of Monthly Water Conditions
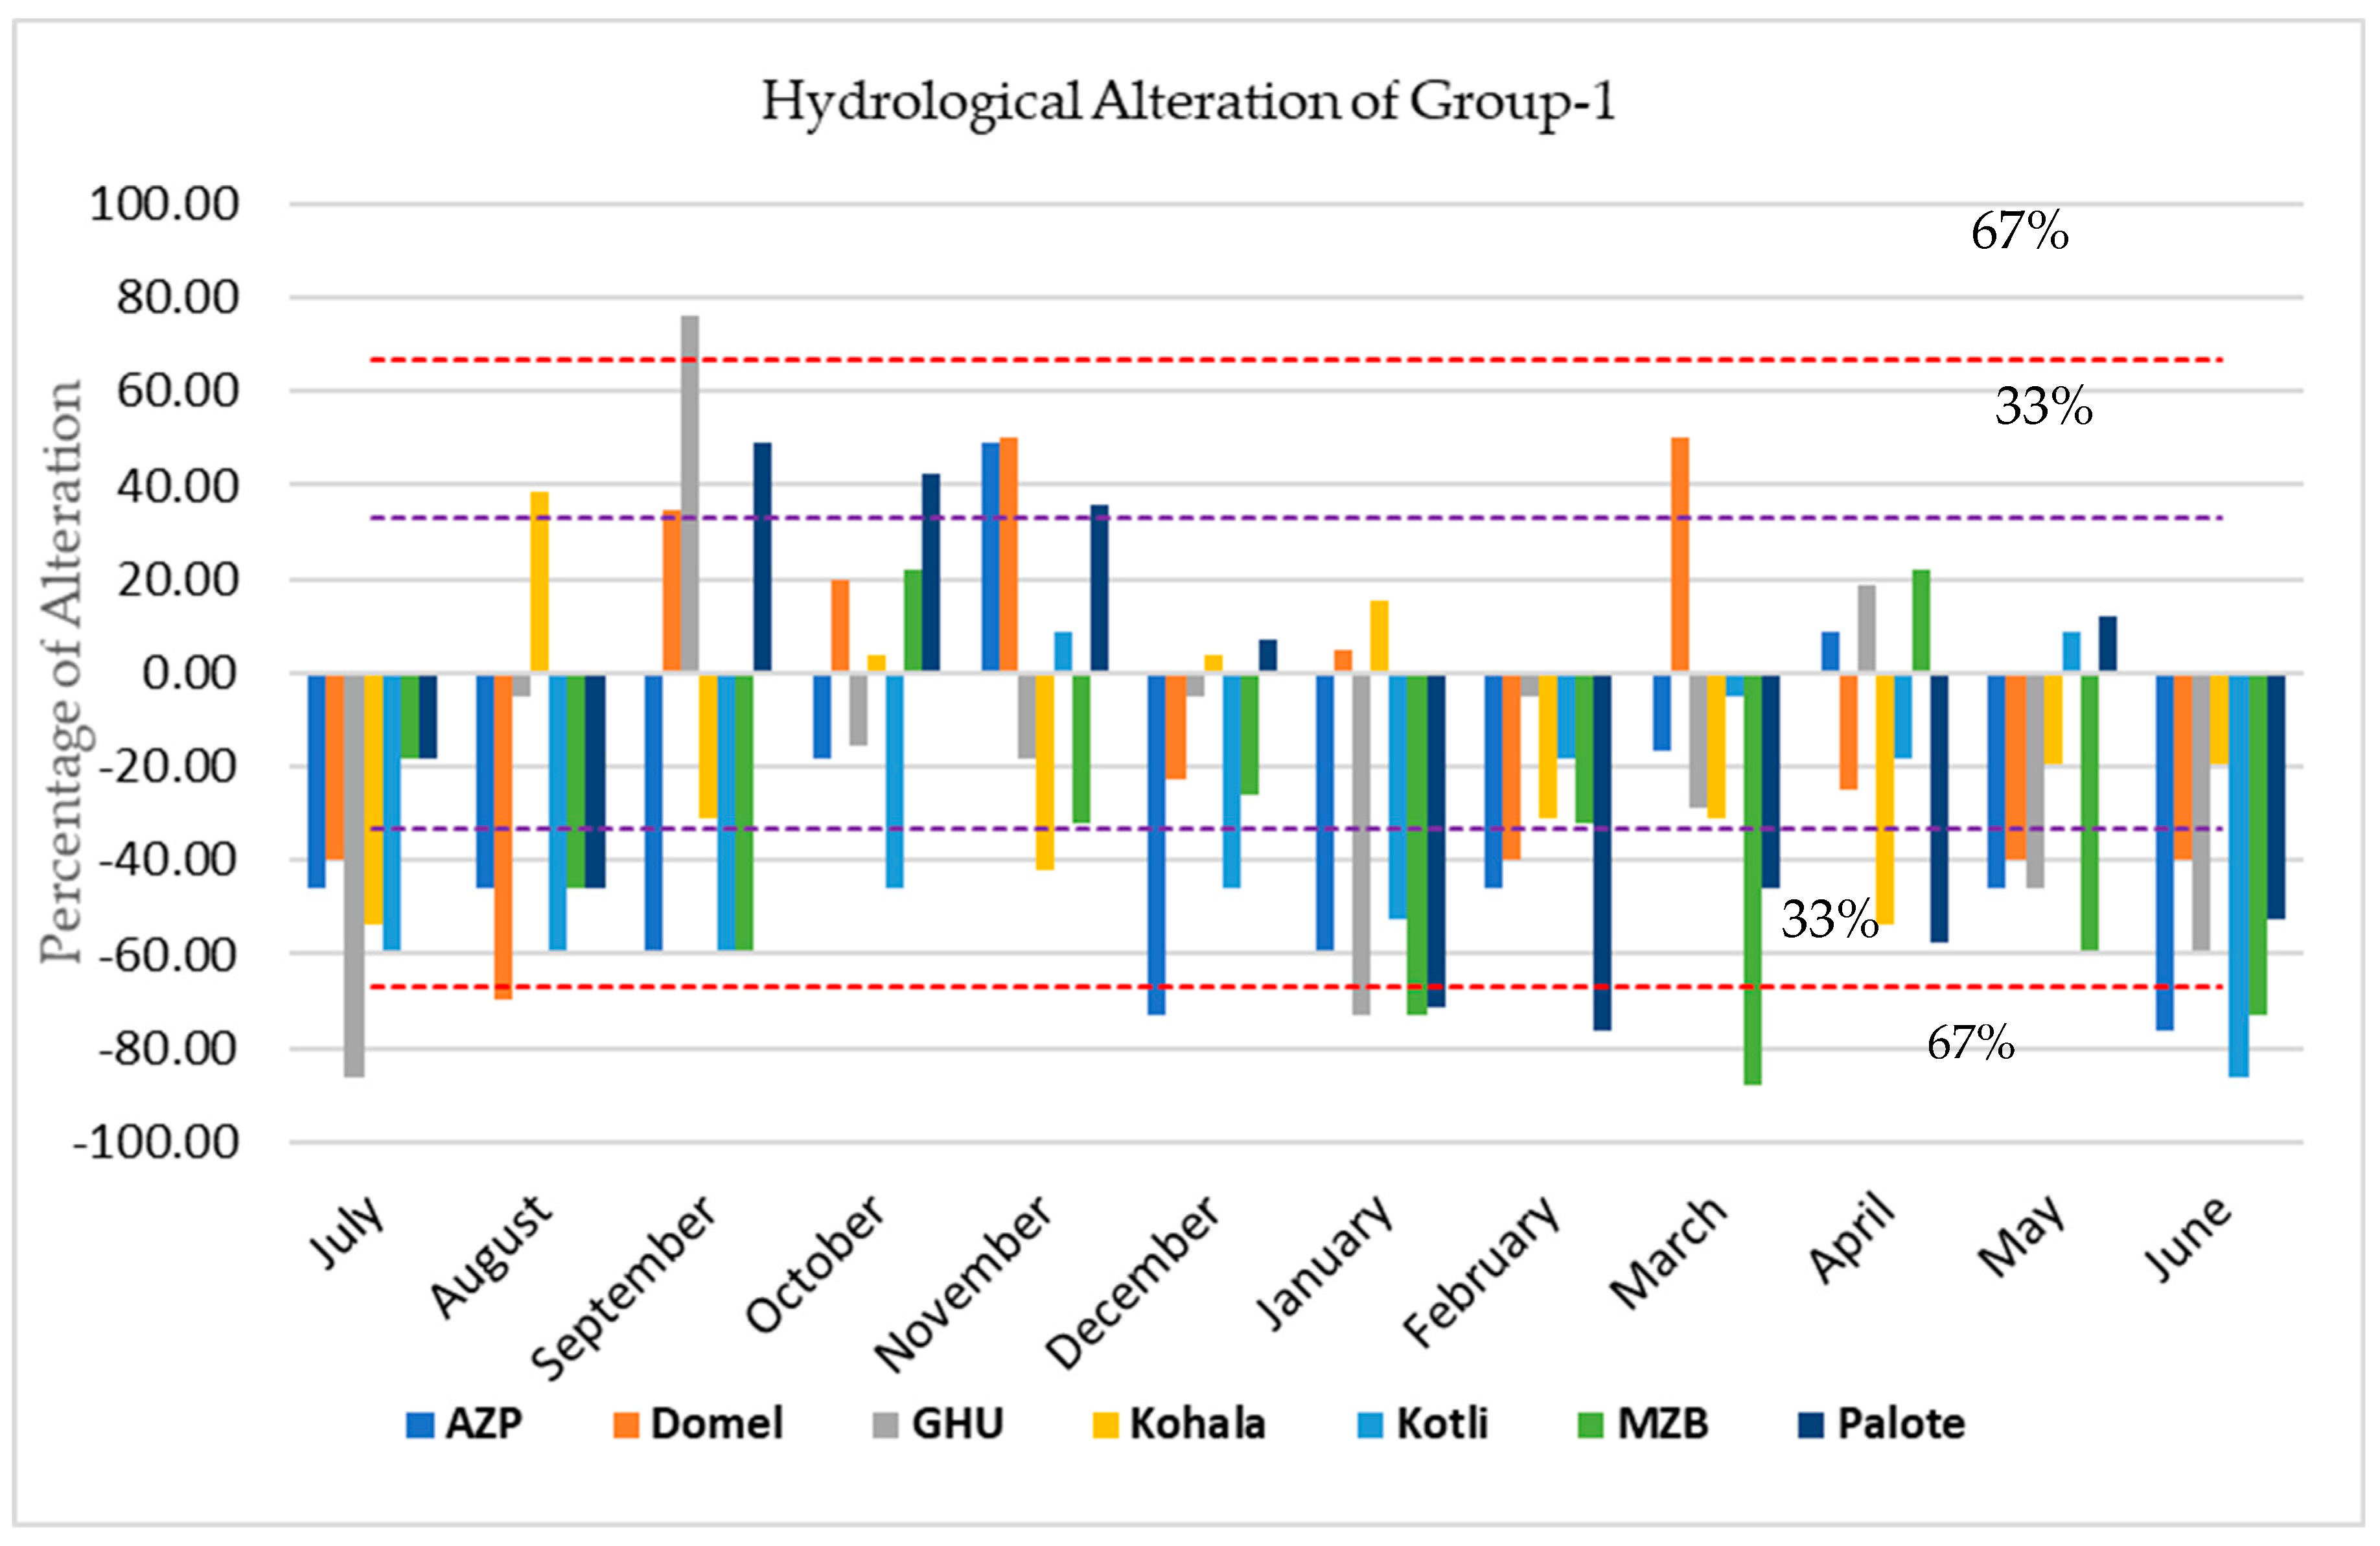
In this group, mostly gauging stations of the Mangla watershed revealed negative hydrological alteration. During dry (October to February) and wet (June to September) periods, there were negative values for hydrological alteration at most of the hydrological stations in the Mangla watershed. August (the wettest month of the year) exhibits a moderate alteration of −45%, 39%, −60%, −45%, and −45% at Azad pattan, Kohala, Kotli, Muzaffarabad, and Palote, which is also reported by Amina et al. (2016) [68]. Whereas, a highest alteration (i.e., −72%) was noted at the Domel gauging station, and the lowest (i.e., −5%) at Gari Habibullah, see Figure 2. In case of the Februay (a driest month of the year), the negative alteration was observed at all the gauging stations of the watershed. The moderate alteration of −42%, −40% was noted at Azad Pattan and Domel stations, respectively. The highest alteration (i.e., −79%) was found at Palote as shown in Figure 3.
In August, there is a decrease in the monthly median flow at all selected stations except Kohala of the Mangla watershed, see Figure 3. Moreover, during the winter season (JFM), the monthly median flows are decreased and appear to increase during the autumn season (SON), as shown in Figure 3. Over all, the watershed experience the negative alteration which is concide with the finding of Yaseen et al. [69]. Their study investigated that the variability in the hydrological flows in the Mangla Watershed is caused by the climate shifting. Which may lead to decrease in the availability of water to sustain the ecosystem depends upon the hydrological flows.
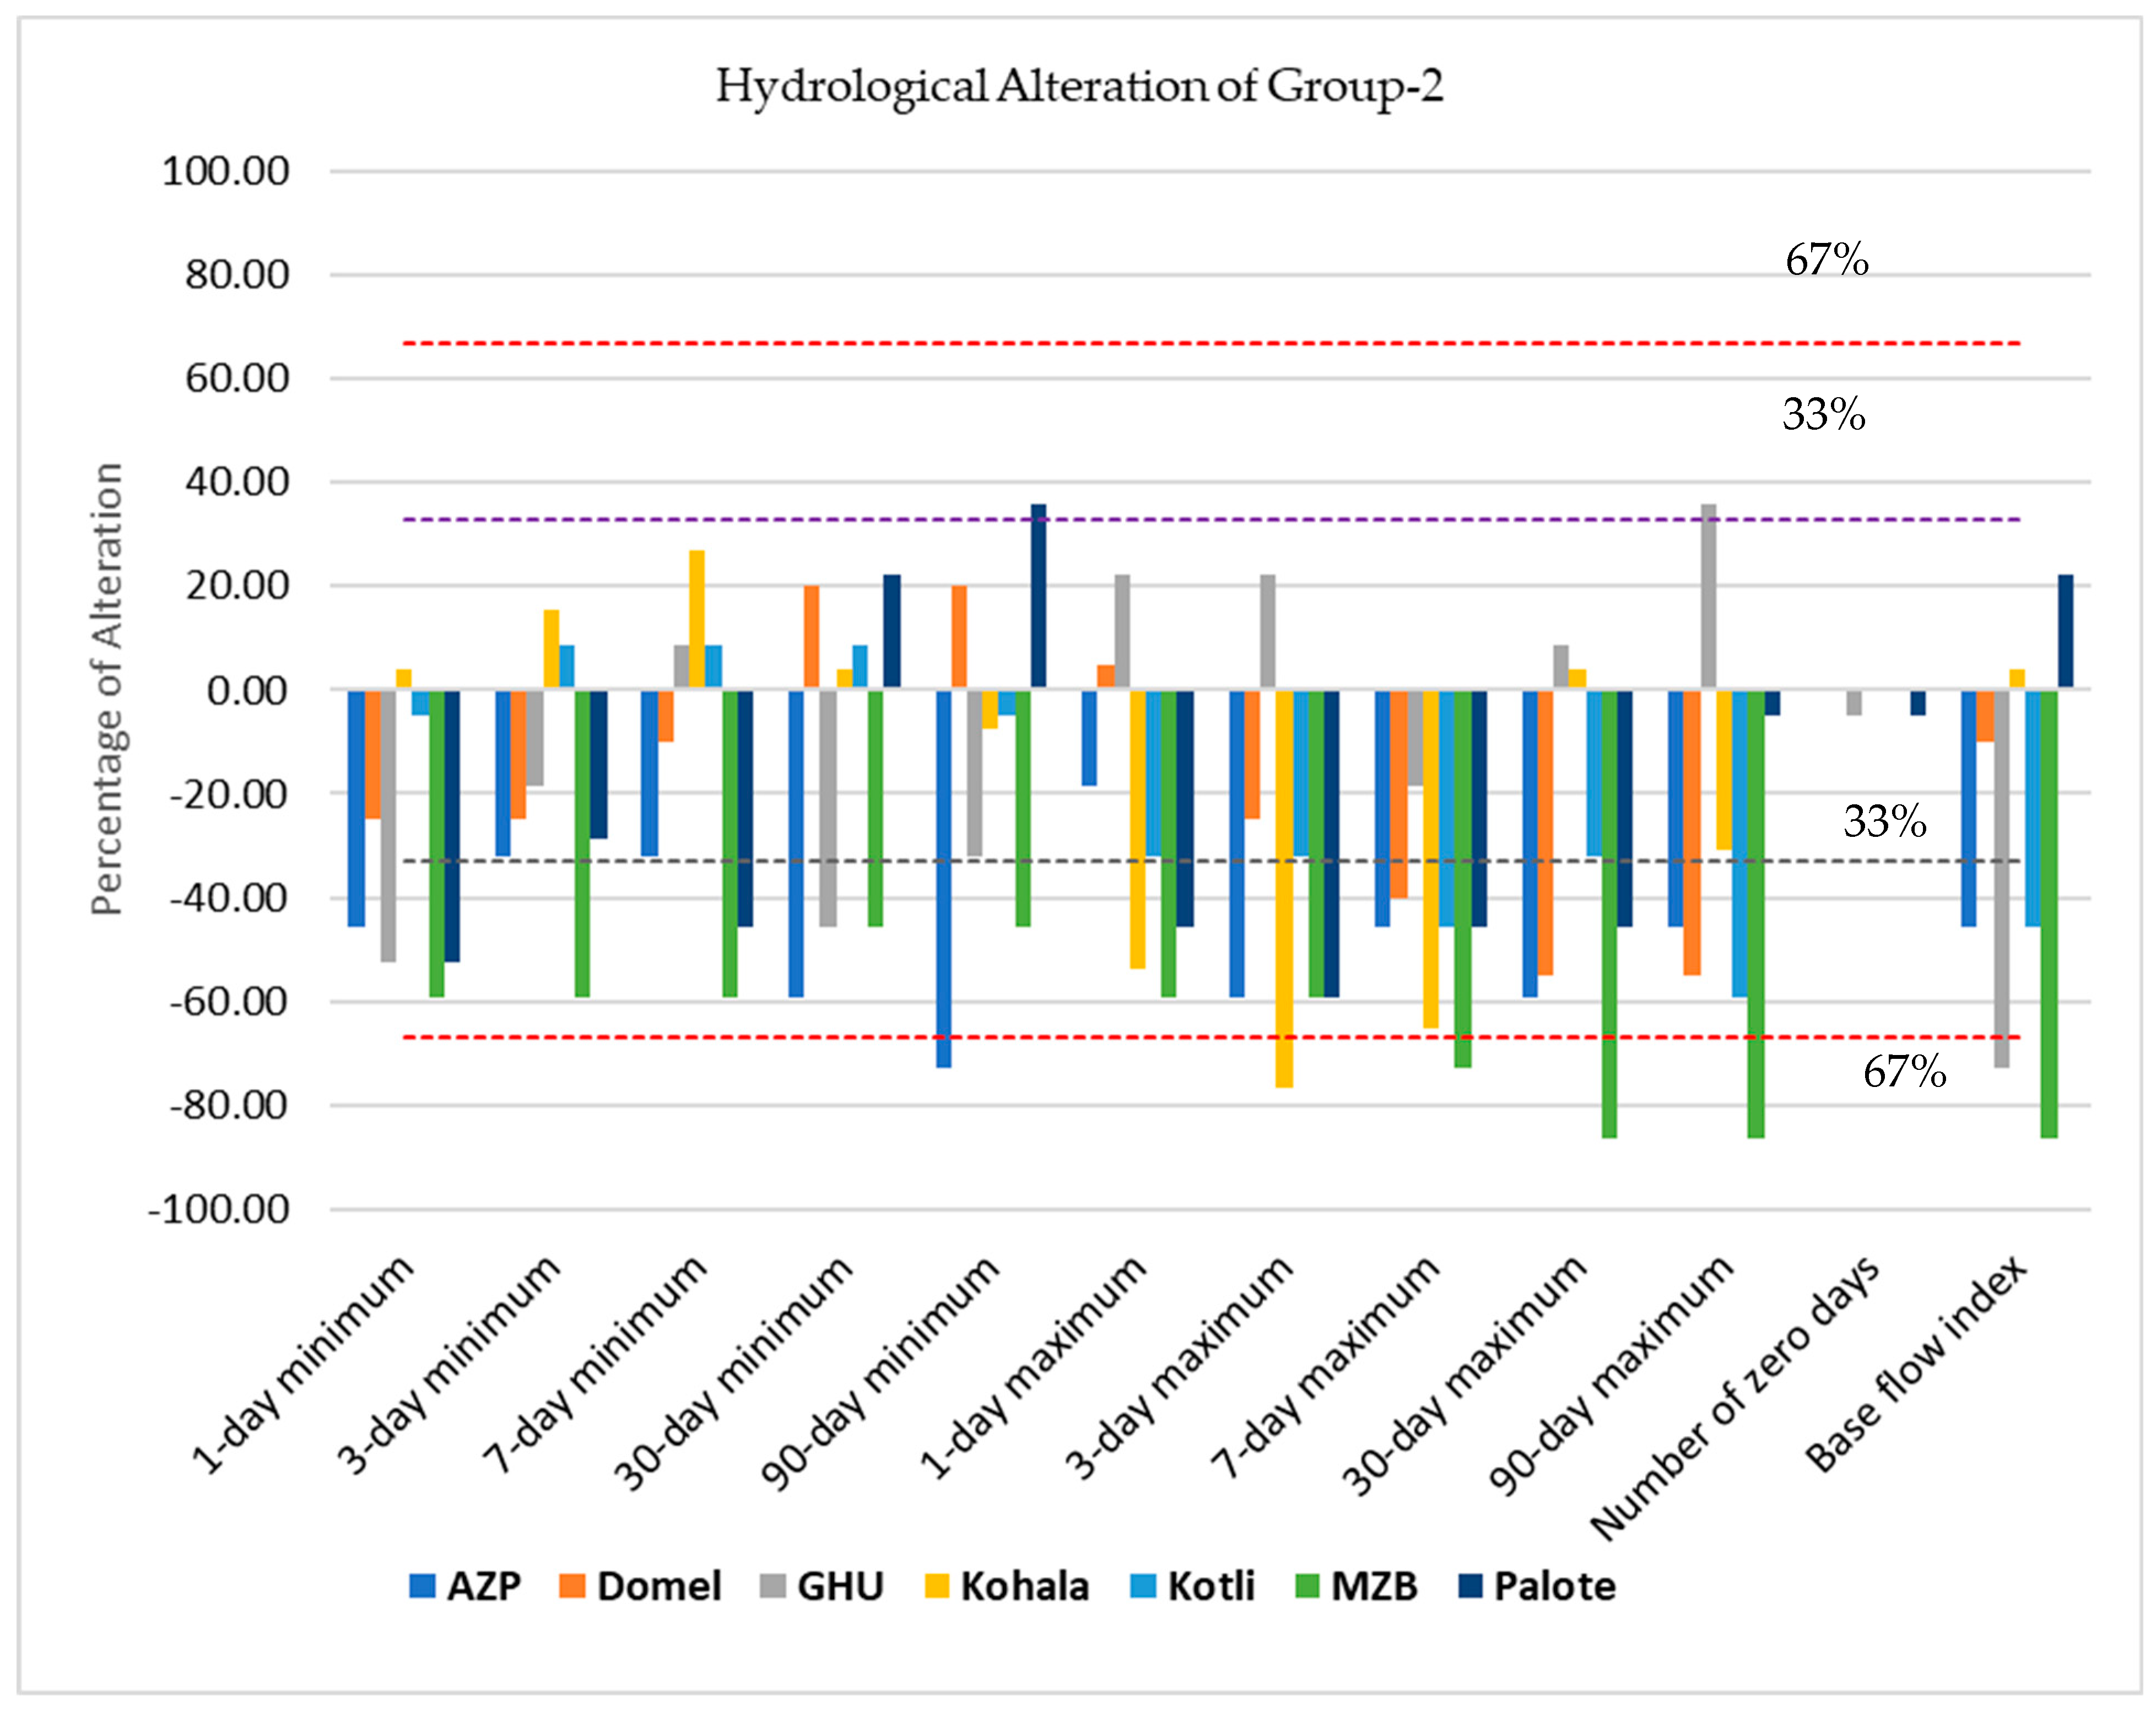
4.2. Group 2: Duration and Magnitude of Annual Extreme Water Conditions
Many indicators of this group revealed negative alteration at all selected flow gauging station in the Mangla watershed. The high alteration was noted in the indicators of 90-day minimum, 3-day maximum, 7-day maximum, 30-day maximum, 90-day maximum, and base flow index, see Figure 4. The Muzaffarabad station in the Neelum basin revealed moderate alteration for most of the indicators except 30-days maximum, 90-days maximum, and base flow index. Moreover, the 7-day maximum flows have moderate to high alteration at all gauging stations of the watershed except at Gari Habibullah. Which is most likely as the result of increased frequencies of climate extremes over the watershed [69]. Overall, in terms of indicators, most changes were observed in the magnitude of 3-day, 7 day and 30 days maximum flows, particularly for all stations. Nevertheless, it should be noted that little deviation of the low flows from the natural regime has caused more implication in the ecosystem than the deviation of the maximum flows [52]. Moreover, it was observed that the indicator (number of zeros days) didn’t alter in the whole watershed; hence it had no impact on the river ecosystem.
4.3. Group 3: Timing of Annual Extreme Water Conditions
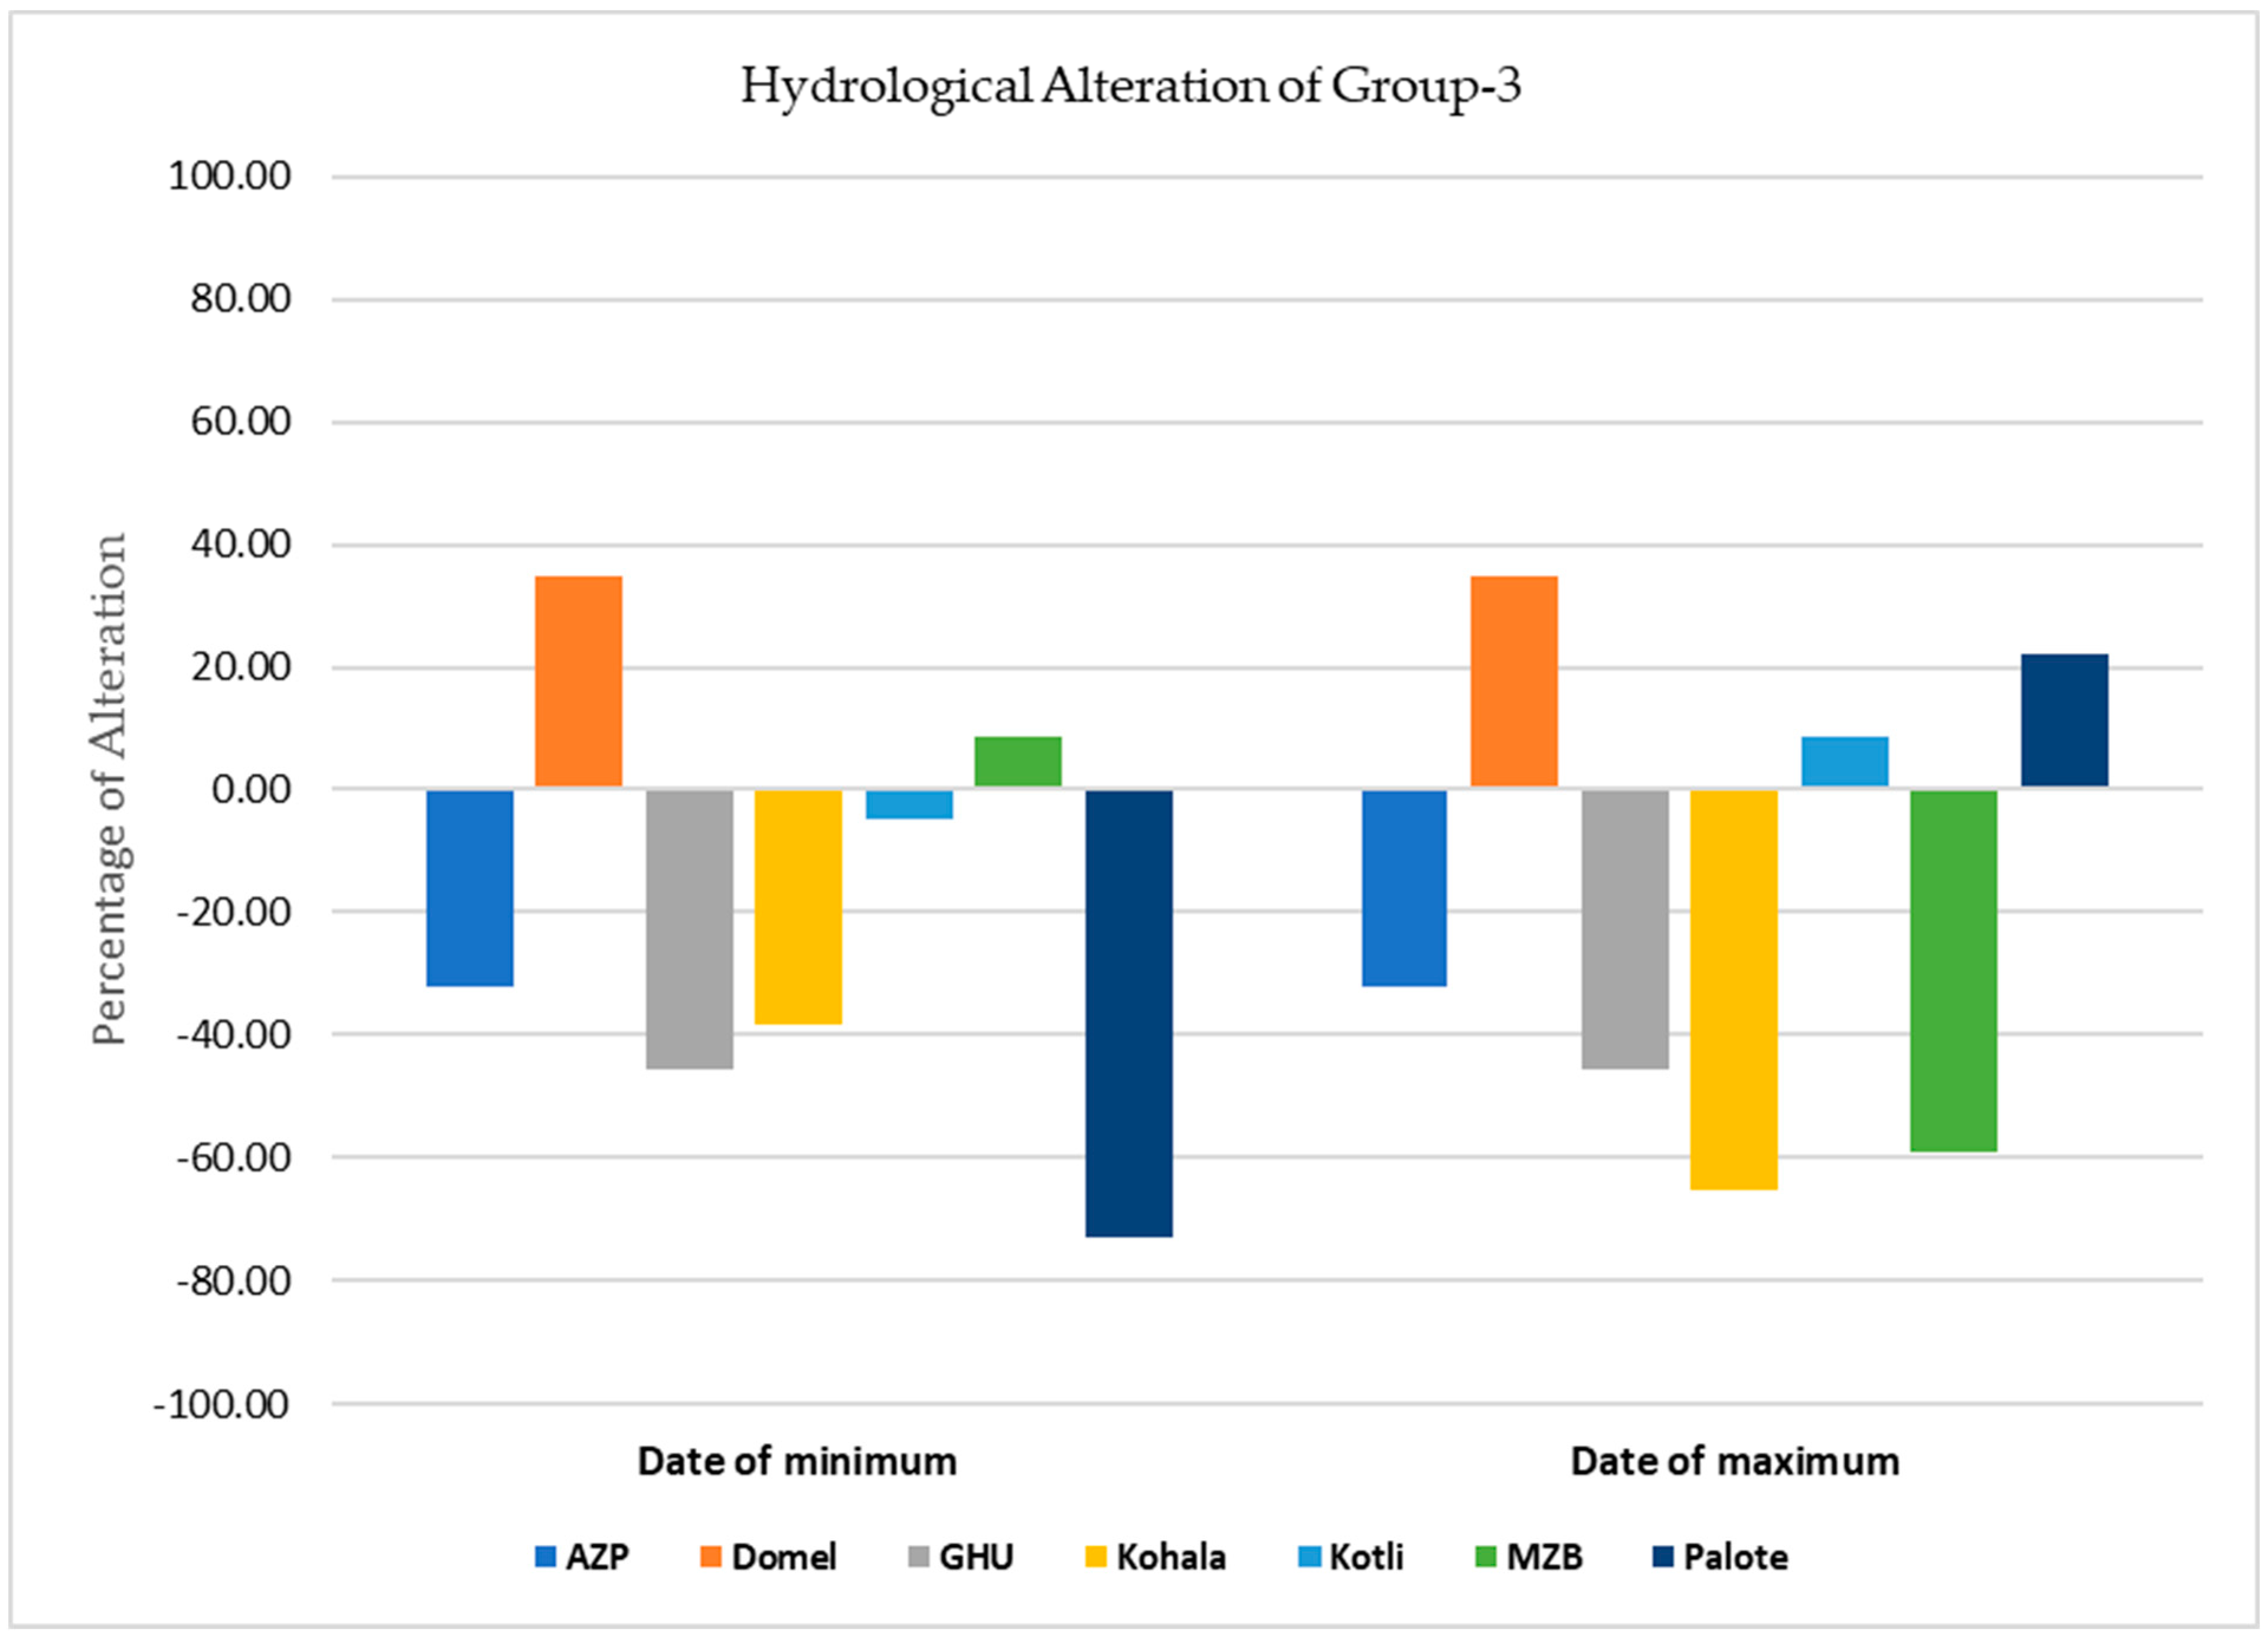
The indicator of this group, the timing of the Julian date of 1-day annual minimum flow has negative alteration at all stations except Domel and Muzaffarabad. There is a moderate hydrological alteration of 34.99%, −45.71, and −38.76 at Domel, Gari Habibullah, and Kohala gauge stations, respectively, whereas high alteration of −72.86% was noted at the Palote station. The Julian date of 1-day minimum flow was earlier at stations of Azad Patten, Domel, Kohala, and Muzafarabad compared to the pre-period (1967 to 1994), while on the other stations, the 1-day minimum flow was later than the pre-period. Similarly, the timing of the Julian date of 1-day annual maximum flow reveals negative alteration at most of the selected stations except Kotli, Domel, and Palote. The moderate alteration of −48%, −62%, −59%, and 38% was noted at Gari Habibullah, Kohala, Domel, and Muzaffarabad respectively, whereas other flow gauge stations observed low hydrological alteration in Figure 5. Overall, both parameters are regarded as very important, and they provide crucial information on environmental disturbances or water stress in the aquatic ecosystem [52]. The alteration of these two parameters were also obtained by Sojka et al. [70] over studying the hydrologic alteration over Powa River, Poland.
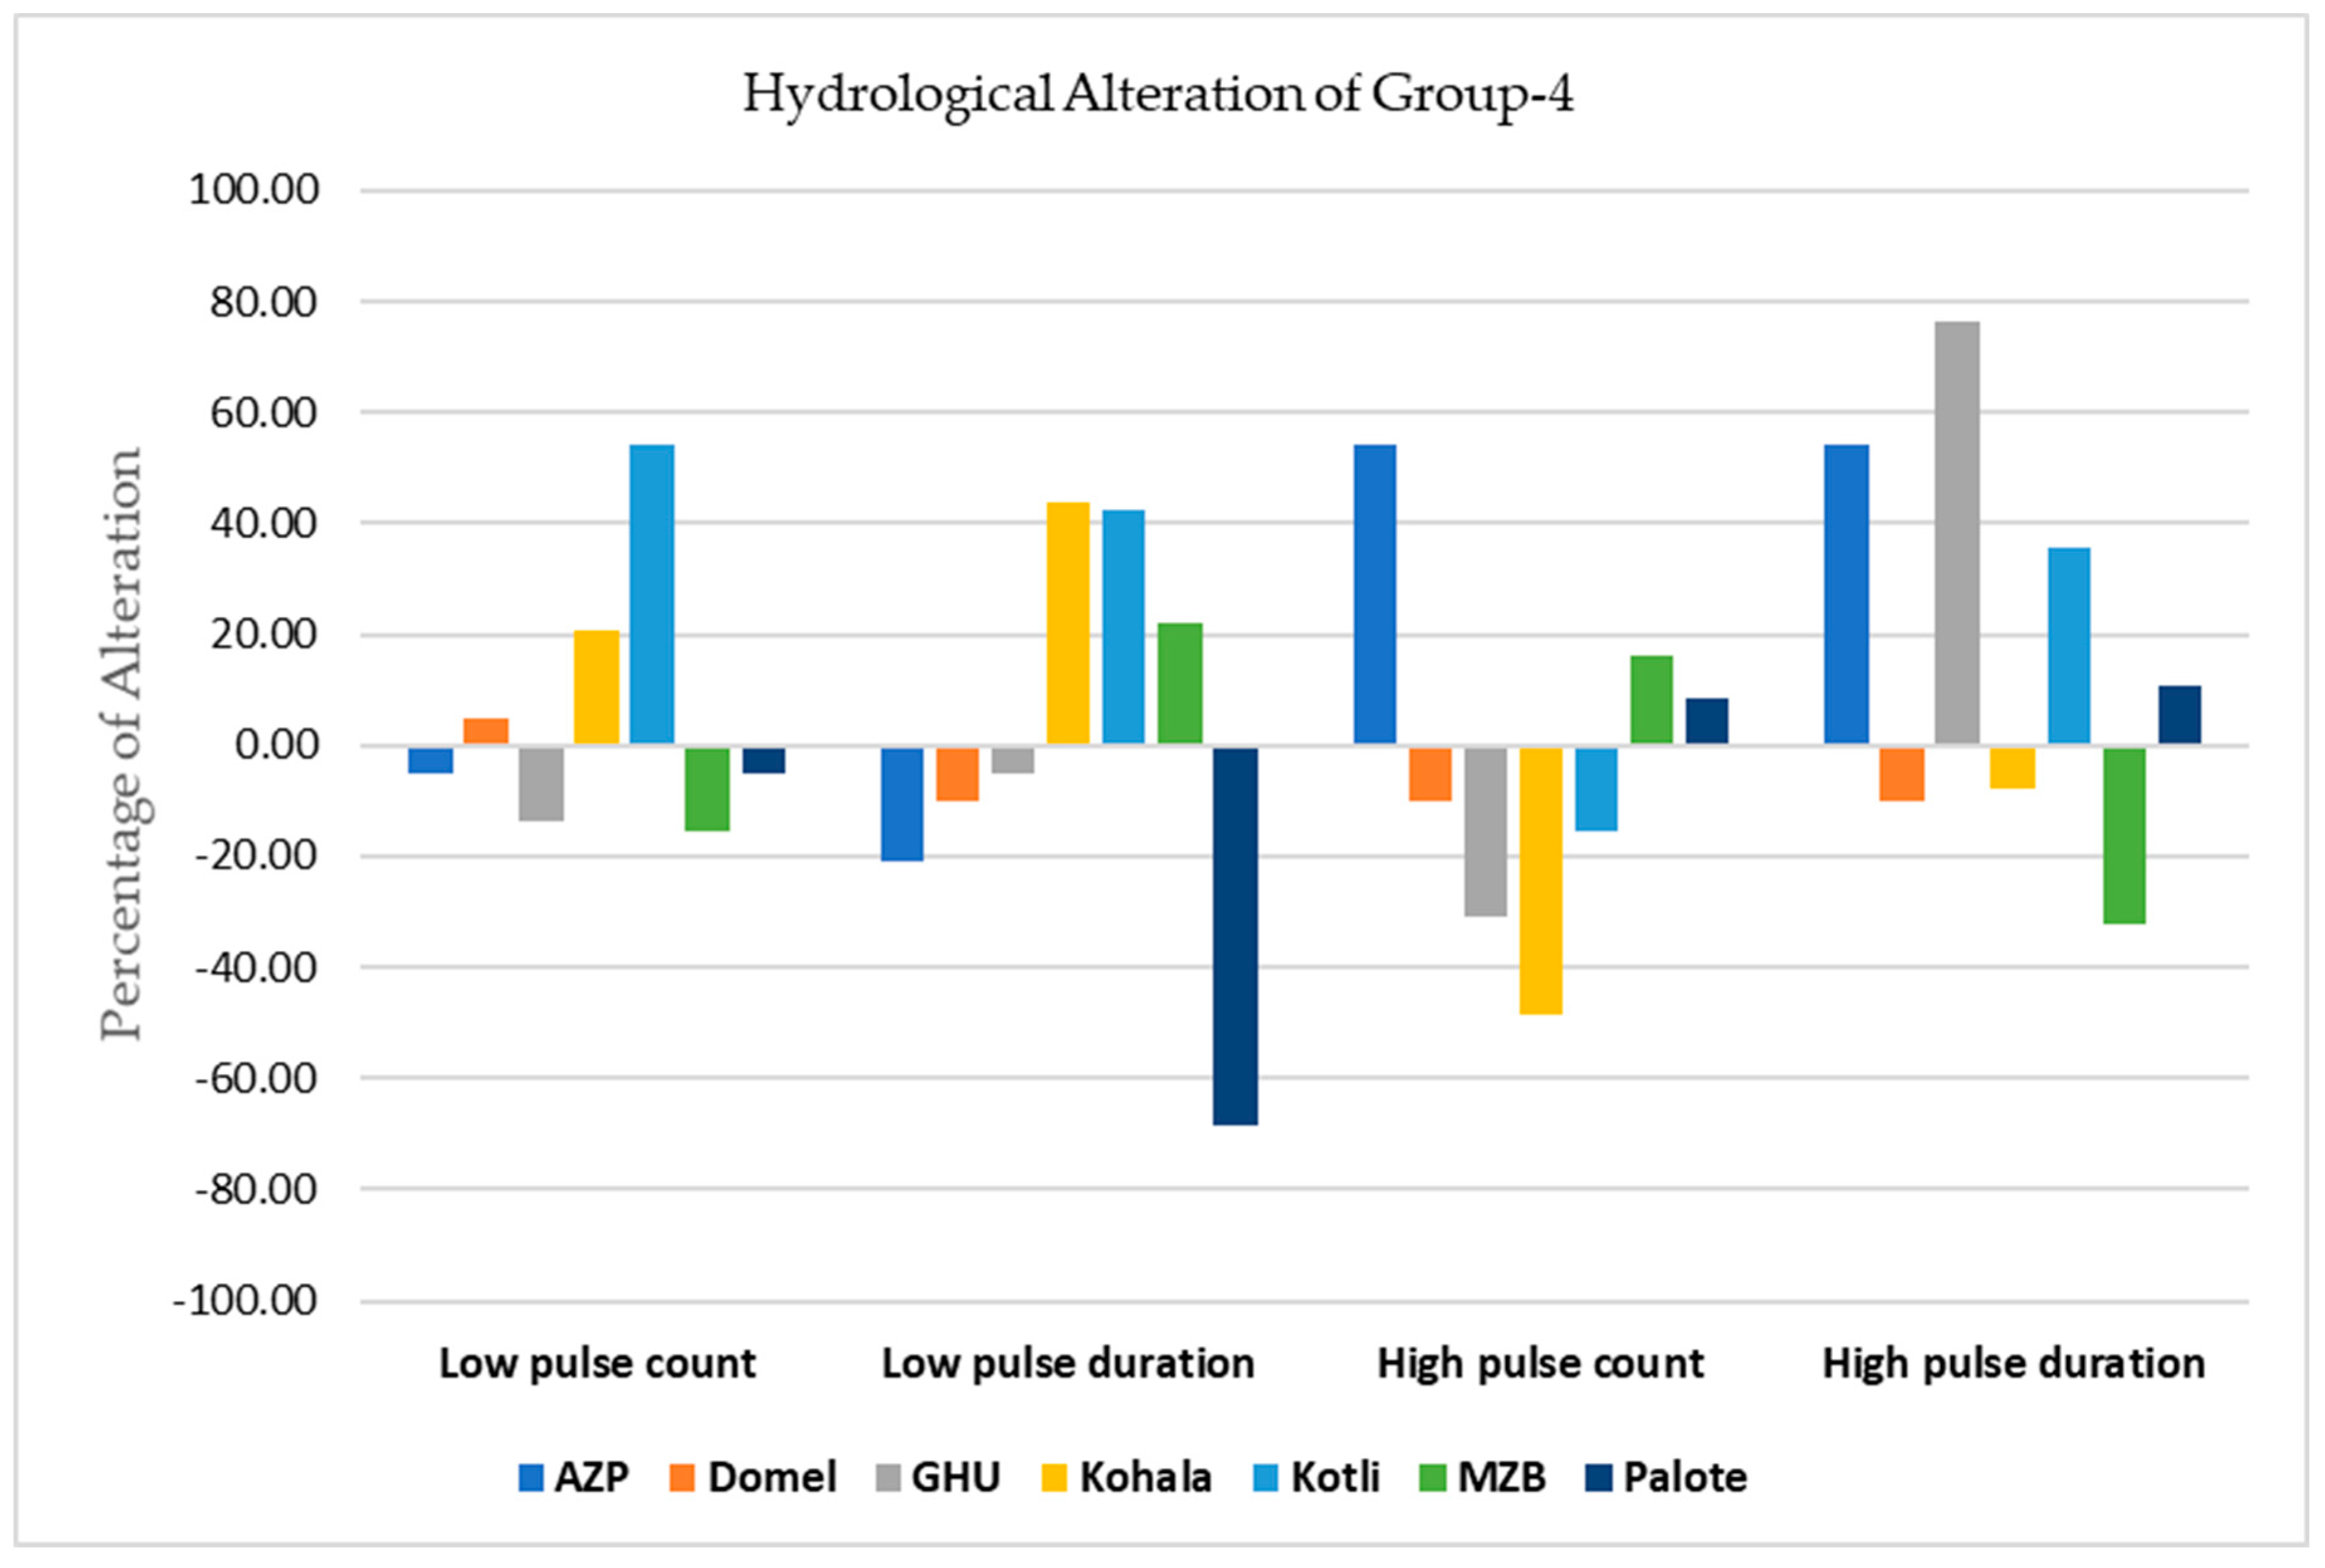
4.4. Group 4: Frequency and Duration of High/Low Pulses
There is significant alteration in high pulse count compared to the low pulse count at most of the stations except Palote, Domel, and Muzafarbad stations. The indicator, namely, the frequency of low pulse had moderate hydrological alteration (i.e., 54.38%) at Kotli station, while the frequency of high pulse revealed moderate alteration at Azad Patten and Kohala (54.38% and −48.72%, respectively). The low pulse duration had a high alteration (−68.33%) at Palote station, whereas moderate alteration of 43.59% and 42.50% was found at Kohala and Kotli stations, respectively, see Figure 5. There is moderate alteration in the high pulse duration at Azad Patten, Gari Habibullah, and Muzafarbad, while the other stations have low alteration (Figure 6).
4.5. Group 5: Rate of Water Condition Changes
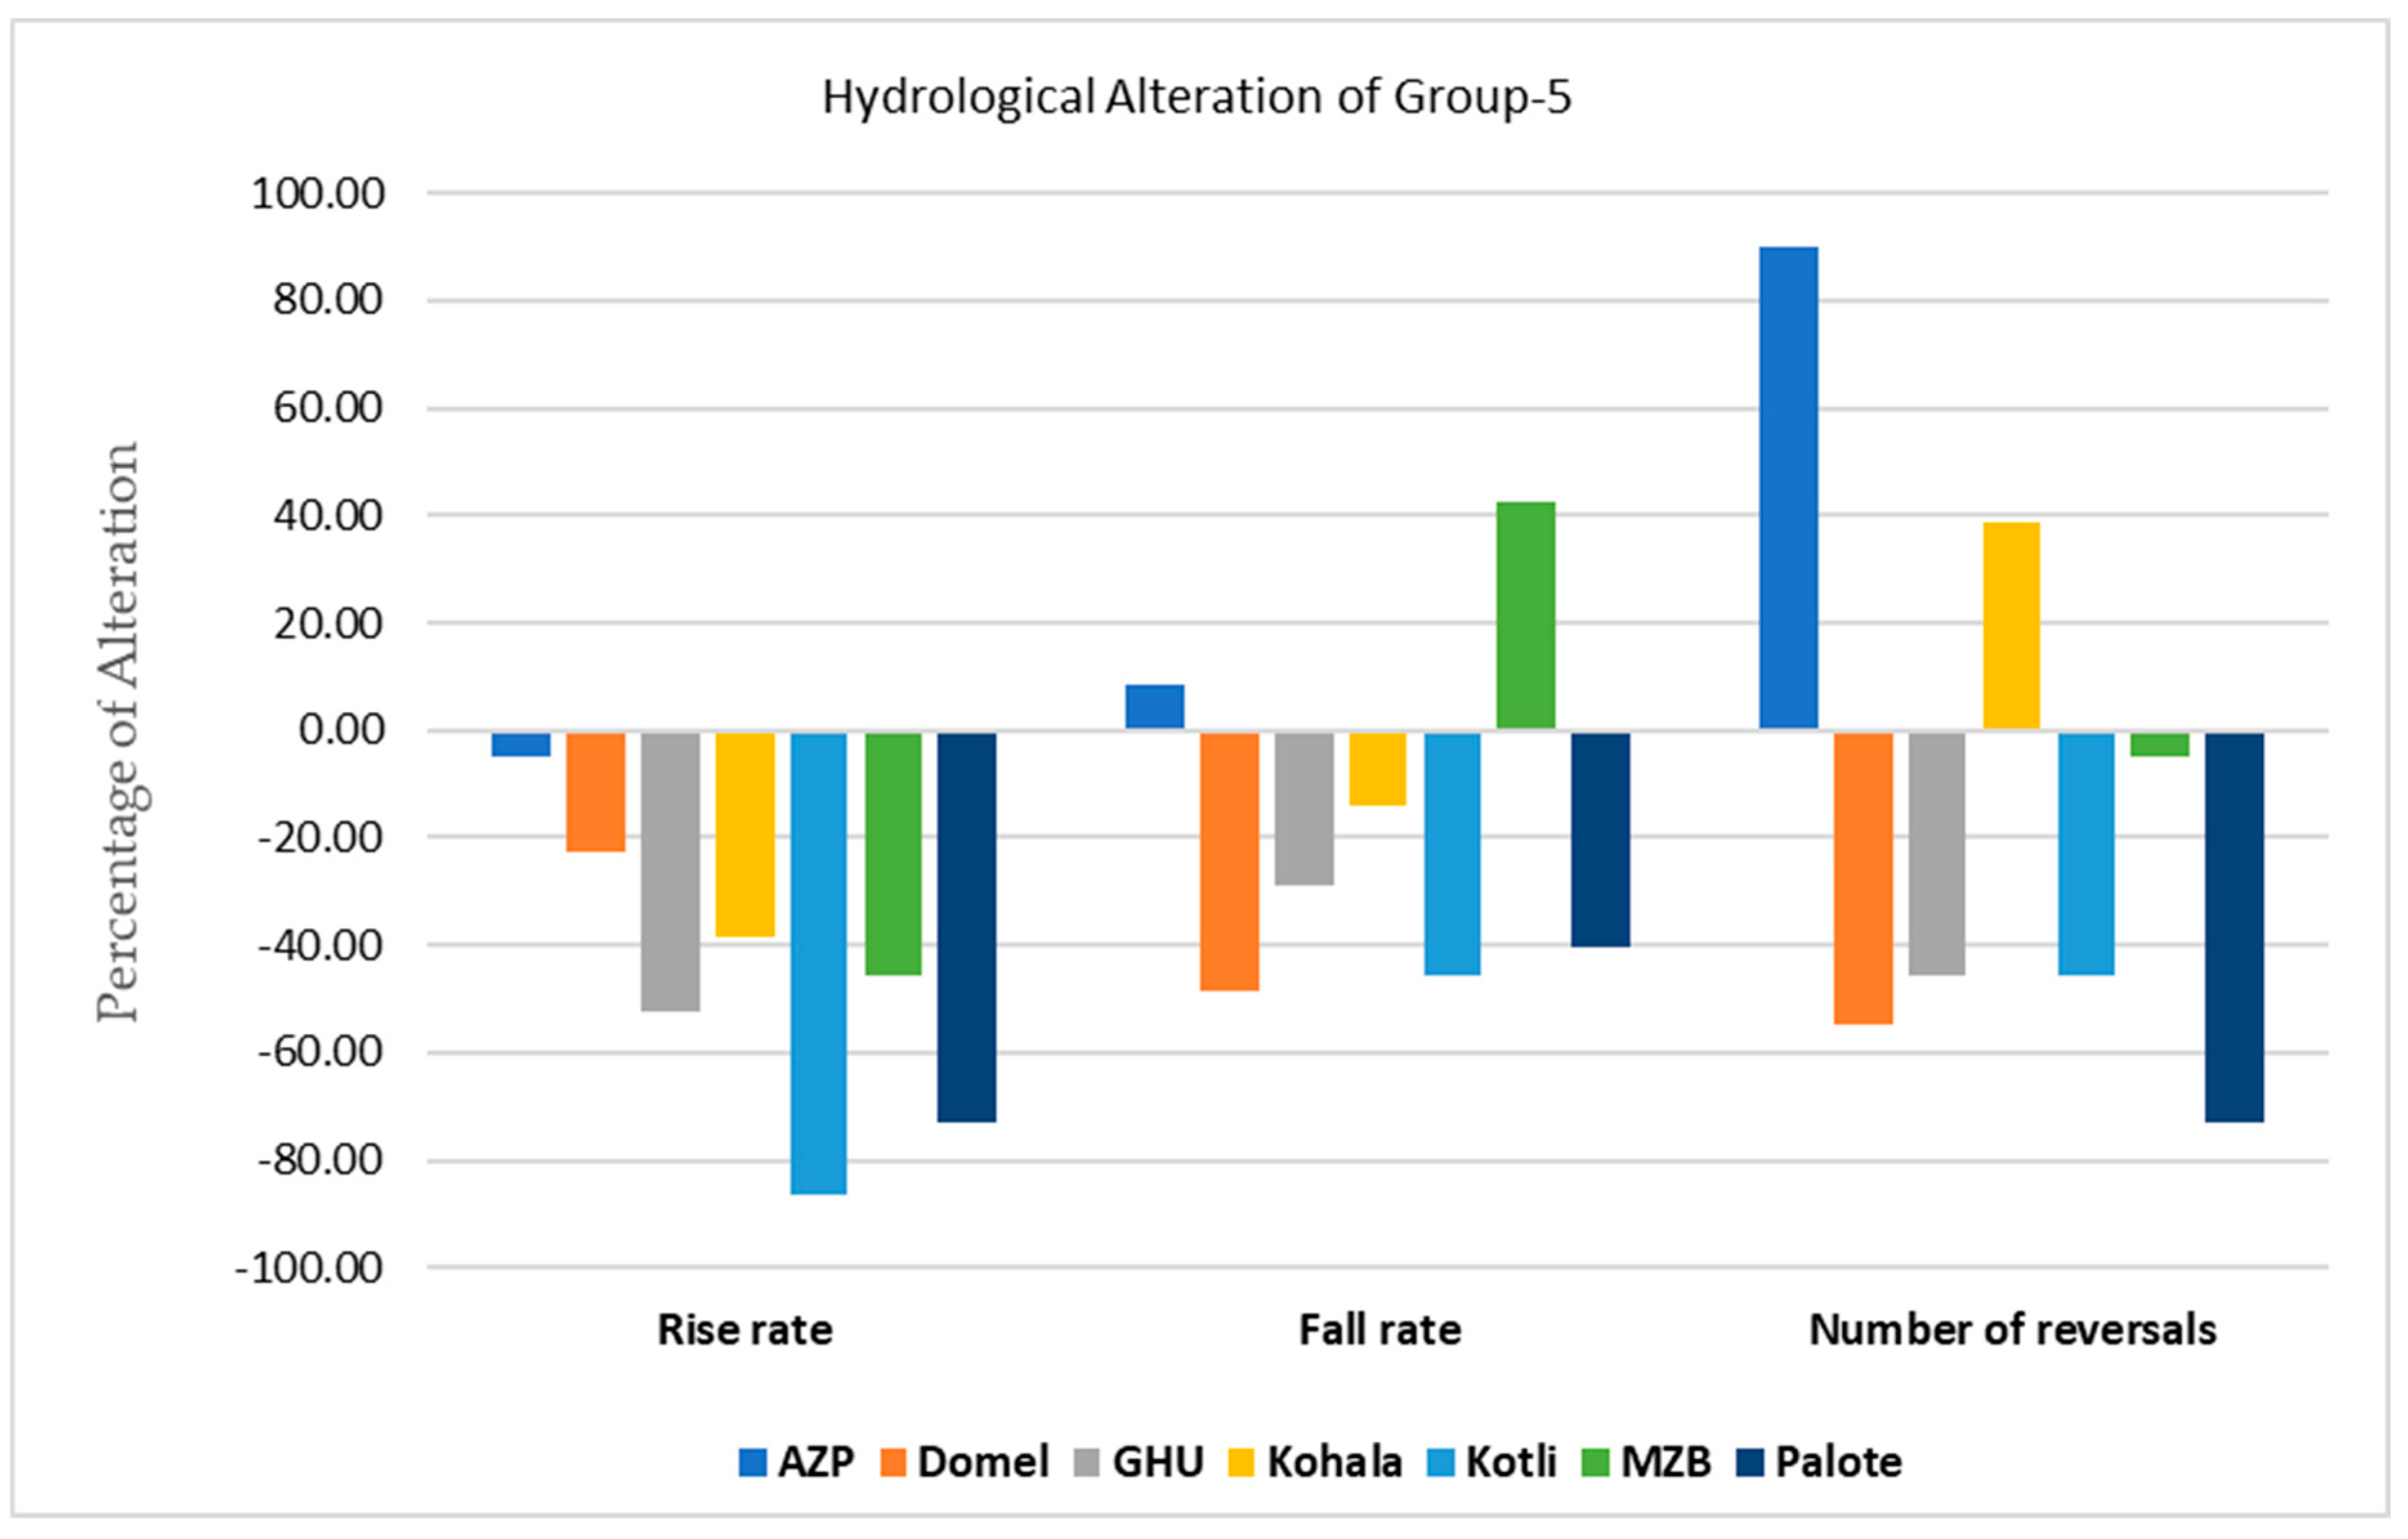
The results showed negative hydrological alteration in the ‘rise rate’ at all the flow stations of the watershed, see Figure 6. It is found maximum at Kotli and Palote stations with the values −84% and −70%, respectively. The moderate alteration of −55%, −39%, and 45% was noted at Ghari Habibullah, Kohala, and Muzaffarabad, respectively. In case of the ‘fall rate’, the moderate alteration was note in most of the stations except Azad Pattan and Kohala stations. The number of reversals were moderately altered in many stations except Muzaffarabad and Palote (Figure 7).
4.6. Spatial Patterns of Hydrological Alteration
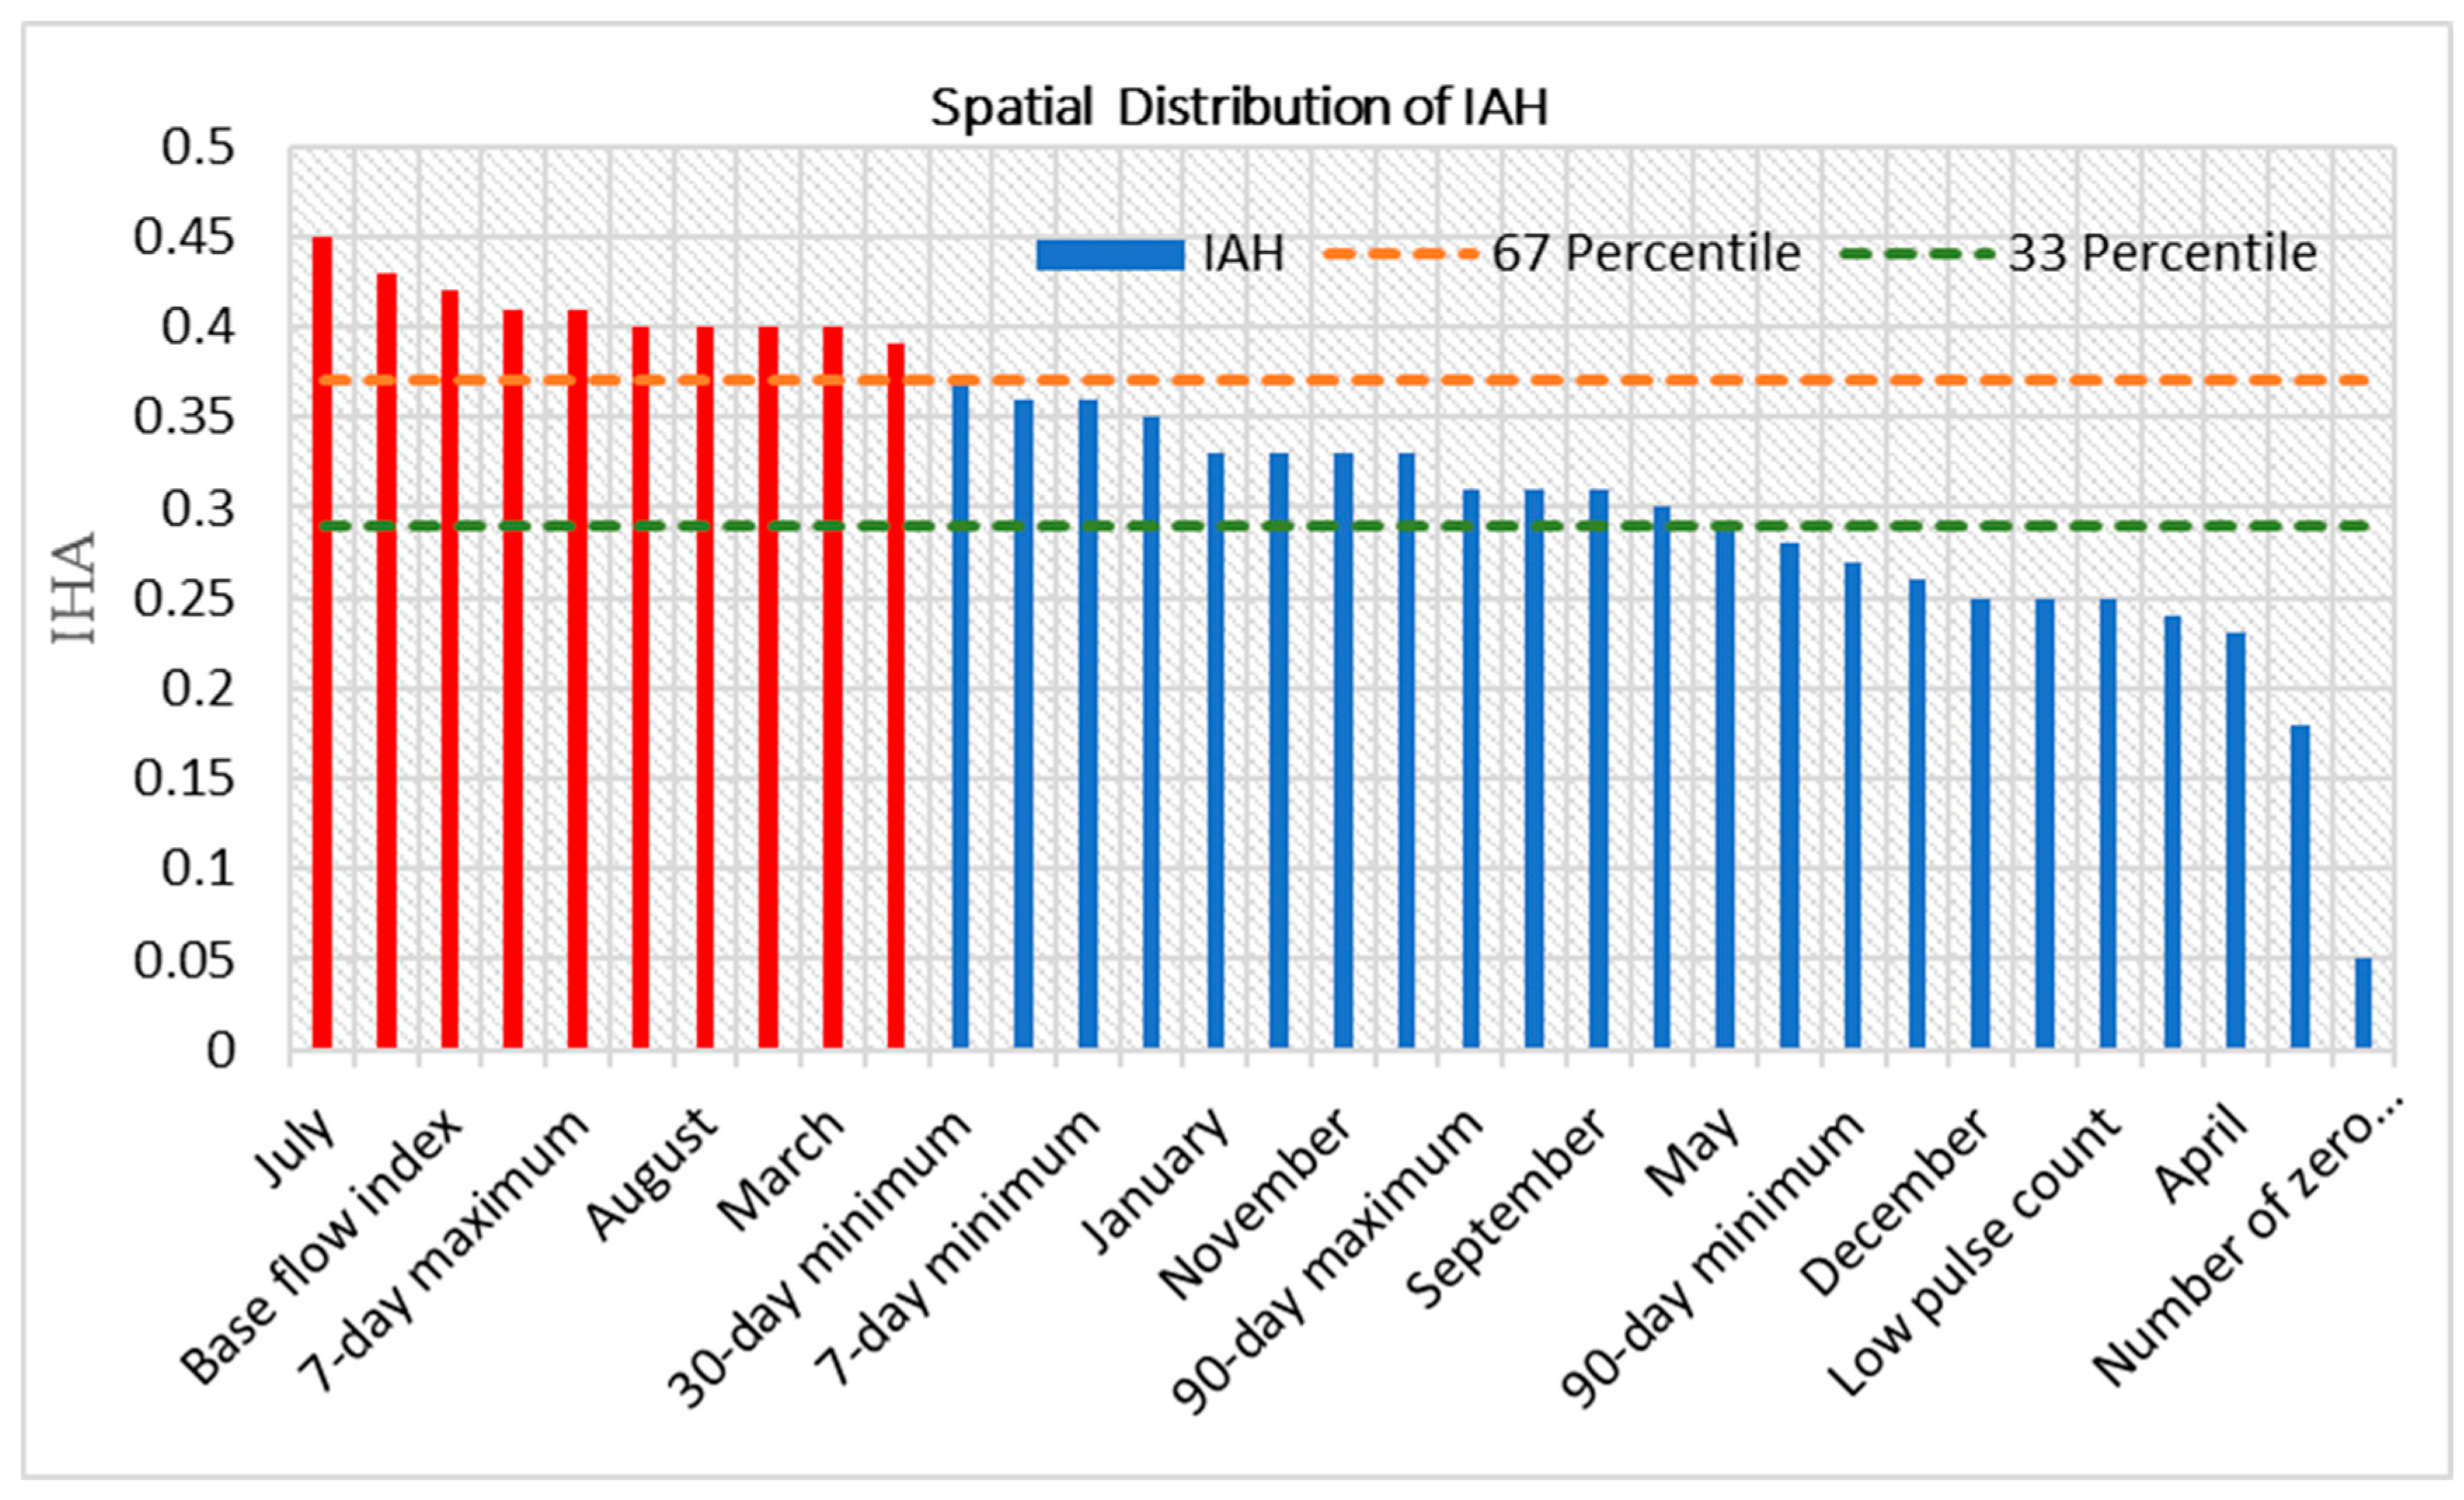
The present study used 33rd and 67th percentile values of the medians of the 32 IHAs to assess the spatial distribution of the hydrological alteration in indicators for all selected flow gauge stations. Then, indicators having medians values greater than the 67th percentile, (such as Base Flow Index, rise rate, 3-day maximum, 3-day minimum, 7-day maximum, February, March, July, August, and Date of Maximum) were sorted out for having spatial assessment of hydrological alteration within the Mangla Watershed, as shown in Figure 8. The findings show that the monthly water flow and extreme flow conditions were found to be influenced in the study area.
For each gauging station in the watershed, the 10 indicators were selected as a degree of HA, given in the Table 3. The average degree of hydrological alteration for all flow gauge stations varies between 37–57%. It means moderate alteration exist at all stations. From the results, it is revealed that the hydrologic regime in the Mangla watershed was moderately affected.
4.7. Impact of Selected Indicator on Ecosystem
The qualitative impact of selected indicators on the ecosystem reviled those four indicators of group-1 can affect the soil moisture content for riparian plants and habitat of aquatic organisms during low flow period [18,24,26]. The 30-Day minimum and maximum flow can affect the distribution of plants at floodplains and structure of aquatic ecosystems (including both biotic and abiotic factors). On other hand, the alteration in base flow can influence the breeding of aquatic organisms and time of stressful conditions (for example, less oxygen concentration, and higher chemical contents) in river [19,20,21,22,23]. Similarly, the alteration in the Julian maximum date influences the life cycles, evolutionary strategies, and behavioral mechanisms of aquatic organisms [43,44,45,46,47,48,49,50,51]. The ‘Rise rate’ influence the organisms found on the floodplains and ‘Fall rate’ cause the low mobility of organisms at riverbank. Overall, the selected indicators may have the significant impacts on the riverine ecosystem of the Mangla watershed.
5. Conclusions
The results demonstrate a moderate level of hydrological alteration at all gauging stations within the Mangla watershed. These alterations are associated with the climate and land use variabilities. The absolute value of the hydrological alterations in the parameters of Group-1 and 2 is moderate at all selected flow gauge stations of the Mangle watershed. The selected parameters significantly affect the hydrological regime of the study area, which produces adverse effects on the river ecosystem. Among all stations, Neelam Basin at Muzaffarabad (MZB) experienced moderate to high negative alteration for selected indicators. Overall, the Neelam Basin experienced an absolute mean alteration of 56.73. The Azad Patten (AZP) station is moderately negative alter for maximum parameters. The Kanshi basin at Palote have high negative alteration for rise rate and median flow of February. The Kunhar basin at Ghari Habibullah (GHU) shows low alteration among all gauging stations. On final note, it is observed that the Mangla Watershed undergoing through the negative alteration of hydrological flows. The ecosystem of the Mangla watershed in the sub-basin of Muzaffarabad, GHU, and Palote is affected during low flow months. Human development and the climate change trend may influence the whole watershed base flow, which indirectly produces adverse impacts on the ecosystem of the Mangla watershed. Overall, there can be an expected alteration in existing biota due to alteration of hydrological flows, which must be monitored and maintained within a suitable range.
Author Contributions
Conceptualization A.R., F.A. and X.W.; methodology A.R. and N.J.; software A.R. and F.A.; validation A.R., A.J. and N.J.; formal analysis A.R., N.J. and T.K.; investigation A.R. and T.K.; resources X.W.; data curation A.J., N.J. and T.K.; writing—original draft preparation A.R.; writing—review and editing X.W. and F.A.; visualization A.J. and T.K.; supervision X.W.; project administration X.W.; funding acquisition (APC) X.W. All authors have read and agreed to the published version of the manuscript.
Funding
This research received no external funding.
Data Availability Statement
Authors does not share any supplement data and results files.
Conflicts of Interest
The authors declare no conflict of interest.
References
- Bolch, T. Asian glaciers are a reliable water source. Nature 2017, 545, 161–162. [Google Scholar] [CrossRef] [PubMed]
- Palmer, M.; Ruhi, A. Linkages between flow regime, biota, and ecosystem processes: Implications for river restoration. Science 2019, 365, eaaw2087. [Google Scholar] [PubMed]
- Assani, A.A.; Stichelbout, E.; Roy, A.G.; Petit, F. Comparison of impacts of dams on the annual maximum flow characteristics in three regulated hydrologic regimes in Québec (Canada). Hydrol. Process. Int. J. 2006, 20, 3485–3501. [Google Scholar]
- Poff, N.L.; Allan, J.D.; Bain, M.B.; Karr, J.R.; Prestegaard, K.L.; Richter, B.D.; Sparks, R.E.; Stromberg, J.C. The natural flow regime. BioScience 1997, 47, 769–784. [Google Scholar]
- Deng, H.; Chen, Y.; Wang, H.; Zhang, S. Climate change with elevation and its potential impact on water resources in the Tianshan Mountains, Central Asia. Glob. Planet. Chang. 2015, 135, 28–37. [Google Scholar]
- Lutz, A.; Immerzeel, W.; Shrestha, A.; Bierkens, M.F.P. Consistent increase in High Asia’s runoff due to increasing glacier melt and precipitation. Nat. Clim. Chang. 2014, 4, 587–592. [Google Scholar]
- Ahmad, I.; Zhang, F.; Tayyab, M.; Anjum, M.N.; Zaman, M.; Liu, J.; Farid, H.U.; Saddique, Q. Spatiotemporal analysis of precipitation variability in annual, seasonal and extreme values over upper Indus River basin. Atmos. Res. 2018, 213, 346–360. [Google Scholar]
- Arfan, M.; Lund, J.; Hassan, D.; Saleem, M.; Ahmad, A. Assessment of spatial and temporal flow variability of the Indus River. Resources 2019, 8, 103. [Google Scholar] [CrossRef]
- Azam, M.I.; Guo, J.; Shi, X.; Yaseen, M.; Tayyab, M.; Hussain, Z.; Dai, L.; Bashir, H.; Tam, N.T.M. Spatial climatic variability and impact of El Niño–southern oscillation on extreme precipitation of river catchment. Environ. Eng. Sci. 2020, 37, 346–364. [Google Scholar]
- Tayyab, M.; Dong, X.; Ahmad, I.; Zahra, A.; Zhou, J.; Zeng, X.; Shakoor, A. Identifying Half-Century Precipitation Trends in a Chinese Lake Basin. Pol. J. Environ. Stud. 2019, 28, 1397–1412. [Google Scholar] [CrossRef]
- Stocker, T. Climate Change 2013: The Physical Science Basis: Working Group I Contribution to the Fifth Assessment Report of the Intergovernmental Panel on Climate Change; Cambridge University Press: Cambridge, UK, 2014. [Google Scholar]
- Cardinale, B.J.; Duffy, J.E.; Gonzalez, A.; Hooper, D.U.; Perrings, C.; Venail, P.; Narwani, A.; Mace, G.M.; Tilman, D.; Wardle, D.A. Biodiversity loss and its impact on humanity. Nature 2012, 486, 59–67. [Google Scholar] [CrossRef] [PubMed]
- Sinnatamby, R.N.; Mayer, B.; Kruk, M.K.; Rood, S.B.; Farineau, A.; Post, J.R. Considering multiple anthropogenic threats in the context of natural variability: Ecological processes in a regulated riverine ecosystem. Ecohydrology 2020, 13, e2217. [Google Scholar] [CrossRef]
- Blythe, T.L.; Schmidt, J.C. Estimating the natural flow regime of rivers with long-standing development: The northern branch of the Rio Grande. Water Resour. Res. 2018, 54, 1212–1236. [Google Scholar]
- Sofi, M.S.; Bhat, S.U.; Rashid, I.; Kuniyal, J.C. The natural flow regime: A master variable for maintaining river ecosystem health. Ecohydrology 2020, 13, e2247. [Google Scholar] [CrossRef]
- Kumar, A.U.; Jayakumar, K. Hydrological alterations due to anthropogenic activities in Krishna River Basin, India. Ecol. Indic. 2020, 108, 105663. [Google Scholar] [CrossRef]
- Walker, K.F.; Sheldon, F.; Puckridge, J.T. A perspective on dryland river ecosystems. Regul. Rivers Res. Manag. 1995, 11, 85–104. [Google Scholar]
- Peñas, F.; Barquín, J.; Álvarez, C. Assessing hydrologic alteration: Evaluation of different alternatives according to data availability. Ecol. Indic. 2016, 60, 470–482. [Google Scholar] [CrossRef]
- Wurbs, R.A.; Hoffpauir, R.J. Environmental flow requirements in a water availability modeling system. Sustain. Water Qual. Ecol. 2017, 9, 9–21. [Google Scholar]
- Abe, G.; Erinjery Joseph, J. Changes in streamflow regime due to anthropogenic regulations in the humid tropical Western Ghats, Kerala State, India. J. Mt. Sci. 2015, 12, 456–470. [Google Scholar] [CrossRef]
- Butchart-Kuhlmann, D.; Kralisch, S.; Fleischer, M.; Meinhardt, M.; Brenning, A. Multicriteria decision analysis framework for hydrological decision support using environmental flow components. Ecol. Indic. 2018, 93, 470–480. [Google Scholar]
- Dudgeon, D. Prospects for sustaining freshwater biodiversity in the 21st century: Linking ecosystem structure and function. Curr. Opin. Environ. Sustain. 2010, 2, 422–430. [Google Scholar]
- Uday Kumar, A.; Jayakumar, K. Assessment of hydrological alteration and environmental flow requirements for Srisailam dam on Krishna River, India. Water Policy 2018, 20, 1176–1190. [Google Scholar] [CrossRef]
- Yang, N.; Zhang, Y.; Duan, K. Effect of hydrologic alteration on the community succession of macrophytes at Xiangyang Site, Hanjiang River, China. Scientifica 2017, 2017, 4083696. [Google Scholar] [PubMed]
- Zhang, Y.; Arthington, A.; Bunn, S.; Mackay, S.; Xia, J.; Kennard, M. Classification of flow regimes for environmental flow assessment in regulated rivers: The Huai River Basin, China. River Res. Appl. 2012, 28, 989–1005. [Google Scholar] [CrossRef]
- Hua, Y.; Cui, B. Environmental flows and its satisfaction degree forecasting in the Yellow River. Ecol. Indic. 2018, 92, 207–220. [Google Scholar]
- Huang, W.; Liu, X.; Peng, W.; Wu, L.; Yano, S.; Zhang, J.; Zhao, F. Periphyton and ecosystem metabolism as indicators of river ecosystem response to environmental flow restoration in a flow-reduced river. Ecol. Indic. 2018, 92, 394–401. [Google Scholar]
- Nilsson, C.; Reidy, C.A.; Dynesius, M.; Revenga, C. Fragmentation and flow regulation of the world’s large river systems. Science 2005, 308, 405–408. [Google Scholar]
- Hu, W.-W.; Wang, G.-X.; Deng, W.; Li, S.-N. The influence of dams on ecohydrological conditions in the Huaihe River basin, China. Ecol. Eng. 2008, 33, 233–241. [Google Scholar] [CrossRef]
- Shiau, J.T.; Wu, F.C. Optimizing environmental flows for multiple reaches affected by a multipurpose reservoir system in Taiwan: Restoring natural flow regimes at multiple temporal scales. Water Resour. Res. 2013, 49, 565–584. [Google Scholar]
- Yin, X.A.; Yang, Z.F.; Petts, G.E. Reservoir operating rules to sustain environmental flows in regulated rivers. Water Resour. Res. 2011, 47, W08509. [Google Scholar]
- Yang, T.; Zhang, Q.; Chen, Y.D.; Tao, X.; Xu, C.Y.; Chen, X. A spatial assessment of hydrologic alteration caused by dam construction in the middle and lower Yellow River, China. Hydrol. Process. Int. J. 2008, 22, 3829–3843. [Google Scholar]
- Minea, G.; Barbulescu, A. Statistical assessing of hydrological alteration of Buzau River induced by Siriu Dam (Romania)/Evaluarea statistica a modificarilor hidrologice pe râul Buzau asociate barajului Siriu. Forum Geogr. 2014, XIII, 50. [Google Scholar] [CrossRef]
- Wu, W.; Xu, Z.; Liu, X. Impact of Baojixia water diversion works on the hydrologic regime in the Wei River basin. Procedia Environ. Sci. 2012, 13, 1653–1662. [Google Scholar] [CrossRef]
- Chen, Y.D.; Yang, T.; Xu, C.-Y.; Zhang, Q.; Chen, X.; Hao, Z.-C. Hydrologic alteration along the Middle and Upper East River (Dongjiang) basin, South China: A visually enhanced mining on the results of RVA method. Stoch. Environ. Res. Risk Assess. 2010, 24, 9–18. [Google Scholar]
- López-Blanco, C.; Andrews, J.; Dennis, P.; Miracle, M.R.; Vicente, E. Sedimentary response of lake El Tobar, Spain, to climate: Lake level changes after the Maunder Minimum. J. Quat. Sci. 2016, 31, 905–918. [Google Scholar]
- Xue, L.; Zhang, H.; Yang, C.; Zhang, L.; Sun, C. Quantitative assessment of hydrological alteration caused by irrigation projects in the Tarim River basin, China. Sci. Rep. 2017, 7, 4291. [Google Scholar] [CrossRef]
- Olden, J.D.; Poff, N. Redundancy and the choice of hydrologic indices for characterizing streamflow regimes. River Res. Appl. 2003, 19, 101–121. [Google Scholar] [CrossRef]
- Clausen, B.; Biggs, B. Relationships between benthic biota and hydrological indices in New Zealand streams. Freshw. Biol. 1997, 38, 327–342. [Google Scholar]
- Clausen, B.; Biggs, B. Flow variables for ecological studies in temperate streams: Groupings based on covariance. J. Hydrol. 2000, 237, 184–197. [Google Scholar]
- Puckridge, J.; Sheldon, F.; Walker, K.; Boulton, A. Flow variability and the ecology of large rivers. Mar. Freshw. Res. 1998, 49, 55–72. [Google Scholar]
- Wood, S.; Jones, D.; Moore, R. Accuracy of rainfall measurement for scales of hydrological interest. Hydrol. Earth Syst. Sci. 2000, 4, 531–543. [Google Scholar] [CrossRef]
- Richter, B.D.; Baumgartner, J.V.; Powell, J.; Braun, D.P. A method for assessing hydrologic alteration within ecosystems. Conserv. Biol. 1996, 10, 1163–1174. [Google Scholar] [CrossRef] [Green Version]
- Bunn, S.E.; Arthington, A.H. Basic principles and ecological consequences of altered flow regimes for aquatic biodiversity. Environ. Manag. 2002, 30, 492–507. [Google Scholar] [CrossRef] [PubMed]
- Bragg, O.; Black, A.; Duck, R.; Rowan, J. Approaching the physical-biological interface in rivers: A review of methods for ecological evaluation of flow regimes. Prog. Phys. Geogr. 2005, 29, 506–531. [Google Scholar] [CrossRef]
- Carlisle, D.M.; Wolock, D.M.; Meador, M.R. Alteration of streamflow magnitudes and potential ecological consequences: A multiregional assessment. Front. Ecol. Environ. 2011, 9, 264–270. [Google Scholar]
- Lake, P.S. Ecological effects of perturbation by drought in flowing waters. Freshw. Biol. 2003, 48, 1161–1172. [Google Scholar] [CrossRef]
- Monk, W.A.; Wood, P.J.; Hannah, D.M.; Wilson, D.A.; Extence, C.A.; Chadd, R.P. Flow variability and macroinvertebrate community response within riverine systems. River Res. Appl. 2006, 22, 595–615. [Google Scholar]
- Rheinheimer, D.; Viers, J. Combined effects of reservoir operations and climate warming on the flow regime of hydropower bypass reaches of California’s Sierra Nevada. River Res. Appl. 2015, 31, 269–279. [Google Scholar]
- Belmar, O.; Bruno, D.; Martinez-Capel, F.; Barquín, J.; Velasco, J. Effects of flow regime alteration on fluvial habitats and riparian quality in a semiarid Mediterranean basin. Ecol. Indic. 2013, 30, 52–64. [Google Scholar]
- Richter, B.D.; Baumgartner, J.V.; Braun, D.P.; Powell, J. A spatial assessment of hydrologic alteration within a river network. Regul. Rivers Res. Manag. 1998, 14, 329–340. [Google Scholar]
- Richter, B.D.; Braun, D.P.; Mendelson, M.A.; Master, L.L. Threats to imperiled freshwater fauna: Amenazas a la fauna dulceacuicola en riesgo. Conserv. Biol. 1997, 11, 1081–1093. [Google Scholar]
- Yin, X.; Yang, Z.; Petts, G.E. Optimizing environmental flows below dams. River Res. Appl. 2012, 28, 703–716. [Google Scholar]
- Shiau, J.T.; Wu, F.C. A dynamic corridor-searching algorithm to seek time-varying instream flow releases for optimal weir operation: Comparing three indices of overall hydrologic alteration. River Res. Appl. 2007, 23, 35–53. [Google Scholar]
- Shiau, J.T.; Wu, F.C. A histogram matching approach for assessment of flow regime alteration: Application to environmental flow optimization. River Res. Appl. 2008, 24, 914–928. [Google Scholar] [CrossRef]
- Suen, J.P.; Eheart, J.W. Reservoir management to balance ecosystem and human needs: Incorporating the paradigm of the ecological flow regime. Water Resour. Res. 2006, 42, W03417. [Google Scholar] [CrossRef]
- Yang, P.; Yin, X.A.; Yang, Z.F.; Tang, J. A revised range of variability approach considering the periodicity of hydrological indicators. Hydrol. Process. 2014, 28, 6222–6235. [Google Scholar]
- Yin, X.; Yang, Z.; Petts, G. A new method to assess the flow regime alterations in riverine ecosystems. River Res. Appl. 2015, 31, 497–504. [Google Scholar] [CrossRef]
- Babel, M.S.; Dinh, C.N.; Mullick, M.R.A.; Nanduri, U.V. Operation of a hydropower system considering environmental flow requirements: A case study in La Nga river basin, Vietnam. J. Hydro-Environ. Res. 2012, 6, 63–73. [Google Scholar] [CrossRef]
- Maingi, J.K.; Marsh, S.E. Quantifying hydrologic impacts following dam construction along the Tana River, Kenya. J. Arid. Environ. 2002, 50, 53–79. [Google Scholar] [CrossRef]
- Madadi, H. Assessment of karkheh dam impacts on eco-hydrological downstream conditions in southwest of Iran. World J. Sci. Technol. 2011, 1, 2231–2587. [Google Scholar]
- Khan, M. Environmental Impacts of Neelum Jhelum Hydropower Project. Grad. J. Pak. Rev. (GJPR) 2022, 2, 2. [Google Scholar]
- Siddiqi, A.; Wescoat, J.L., Jr.; Humair, S.; Afridi, K. An empirical analysis of the hydropower portfolio in Pakistan. Energy Policy 2012, 50, 228–241. [Google Scholar]
- Magilligan, F.J.; Nislow, K.H. Changes in hydrologic regime by dams. Geomorphology 2005, 71, 61–78. [Google Scholar]
- Yaseen, M.; Ahmad, I.; Guo, J.; Azam, M.I.; Latif, Y. Spatiotemporal variability in the hydrometeorological time-series over Upper Indus River Basin of Pakistan. Adv. Meteorol. 2020, 2020, 5852760. [Google Scholar]
- Khan, K.; Chaudhary, N.; Khan, S.; Ahmad, S. Assessment of diverse geo-environmental parameters for mitigation of an upper catchment of Jhelum River basin, north western Himalayas, Pakistan. Pak. J. Sci. 2014, 66, 291–300. [Google Scholar]
- Conservancy, Nature. Indicators of Hydrologic Alteration Version 7 User’s Manual; The Nature Conservancy: Arlington, VA, USA, 2007. [Google Scholar]
- Akif, A.; Khalida, K.; Akif, R. The Preliminary Assessment of Hydrological Alternation in the Mangla Watershed of Pakistan. Sci. Int. 2016, 28, 2621–2628. [Google Scholar]
- Yaseen, M.; Afzal, M.; Bhatti, H.A.; Khan, K.; Nabi, G. Hydrological trends and variability in the Mangla Watershed, Pakistan. Sci. Int. (Lahore) 2015, 27, 1327–1335. [Google Scholar]
- Sojka, M.; Jaskuła, J.; Wicher-Dysarz, J.; Dysarz, T. Assessment of dam construction impact on hydrological regime changes in lowland river—A case of study: The Stare Miasto reservoir located on the Powa River. J. Water Land Dev. 2016, 30, 119–125. [Google Scholar]
Figure 1.
Study Area of Mangla Watershed.

Figure 2.
Absolute Hydrological alteration in the Mangla watershed.

Figure 3.
Hydrological Alteration of Group −1 indicators.

Figure 4.
Hydrological Alteration of Group −2 indicators.

Figure 5.
Hydrological Alteration of Group −3 indicators.

Figure 6.
Hydrological Alteration of Group −4 indicators.

Figure 7.
Hydrological Alteration of Group −5 indicators.

Figure 8.
Spatial indicators of Hydrological Alteration.


Table 1.
Gauges’ location in Mangla Watershed.
| Sr. # | Gauge Stations | Latitude | Longitude | Install on River |
|---|---|---|---|---|
| 1 | Azad Patten (AZP) | 33.7 | 73.6 | Jehlum |
| 2 | Domel | 34.4 | 73.5 | Jehlum |
| 3 | Ghri Habibullah (GHU) | 34.4 | 73.4 | Kunhar |
| 4 | Kohala | 34.1 | 73.5 | Jehlum |
| 5 | Kotli | 33.5 | 73.9 | Poonch |
| 6 | Muzaffrabad (MZP) | 34.4 | 73.5 | Neelum |
| 7 | Palote | 33.2 | 73.4 | Kanshi |
Table 2.
The relationship between RVA parameters and ecosystems [67].
Table 2.
The relationship between RVA parameters and ecosystems [67].
| RVA Parameters | Relationship between RVA Parameters and Ecosystems |
|---|---|
| 1. Magnitude of monthly water conditions | It checks the health of a habitat. This parameter describes the characteristics of a habitat, for example, wetted area, position of a water table relative to wetland. |
| 2. Magnitude and duration of annual extreme water conditions | It have a significant role for controlling the function and structure of the rivers, estuaries, and floodplains etc. |
| 3. Timing of annual extreme water conditions | It helps in assessing whether particular life-cycle requirements are being met, or whether extreme water conditions such as floods and droughts can affect the degree of stress or mortality. |
| 4. Frequency and duration of high and low flow pulses | This parameter controls the reproduction or mortality events in many species, and therefore, it affects the population dynamics in an ecosystem. As a result, we can conclude whether a life-cycle phase of an organism can be completed, or if inundation or desiccation can have a detrimental effect on the organism. |
| 5. Rate and frequency of water condition changes | This refers to the ability of root systems to establish contact with phreatic water supplies. |
Table 3.
Hydrological Alteration (%).
| Indicators/Stations | AZP | Domel | GHU | KOHALA | KOTLI | MZB | Palote |
|---|---|---|---|---|---|---|---|
| July | −45.71 | −40 | −86.43 | −53.85 | −59.28 | −18.57 | −18.57 |
| Rise rate | −4.99 | −22.86 | −52.52 | −38.46 | −86.43 | −45.71 | −72.86 |
| Base Flow | −45.71 | −10 | −72.86 | 3.84 | −45.71 | −86.43 | 22.15 |
| 3-Day Max | −59.28 | −25 | 22.15 | −76.92 | −32.14 | −59.28 | −59.28 |
| 7-Day Max | −45.71 | −40 | −18.57 | −65.39 | −45.71 | −72.86 | −45.71 |
| 3-Day Min | −32.14 | −25 | −18.57 | 15.38 | 8.58 | −59.28 | −28.75 |
| August | −45.71 | −70 | −5 | 38.46 | −59.28 | −45.71 | −45.71 |
| February | −45.71 | −40 | −4.99 | −30.77 | −18.57 | −32.14 | −76.25 |
| March | −16.87 | 49.99 | −28.75 | −30.77 | −4.99 | −88.12 | −45.71 |
| Date of Maximum | −32.13 | 34.99 | −45.71 | −65.38 | 8.57 | −59.28 | 22.14 |
| Average | 37.39 | 35.78 | 35.55 | 41.92 | 36.92 | 56.73 | 43.71 |
Note(s): Hydrological Alteration ![Water 15 00656 i001]() Low
Low ![Water 15 00656 i002]() Moderate
Moderate ![Water 15 00656 i003]() High.
High.
 Low
Low  Moderate
  High.
High.Disclaimer/Publisher’s Note: The statements, opinions and data contained in all publications are solely those of the individual author(s) and contributor(s) and not of MDPI and/or the editor(s). MDPI and/or the editor(s) disclaim responsibility for any injury to people or property resulting from any ideas, methods, instructions or products referred to in the content. |
© 2023 by the authors. Licensee MDPI, Basel, Switzerland. This article is an open access article distributed under the terms and conditions of the Creative Commons Attribution (CC BY) license (https://creativecommons.org/licenses/by/4.0/).
Share and Cite
MDPI and ACS Style
Rahim, A.; Wang, X.; Javed, N.; Aziz, F.; Jahangir, A.; Khurshid, T. The Perturbation of Mangla Watershed Ecosystem in Pakistan Due to Hydrological Alteration. Water 2023, 15, 656. https://doi.org/10.3390/w15040656
AMA Style
Rahim A, Wang X, Javed N, Aziz F, Jahangir A, Khurshid T. The Perturbation of Mangla Watershed Ecosystem in Pakistan Due to Hydrological Alteration. Water. 2023; 15(4):656. https://doi.org/10.3390/w15040656
Chicago/Turabian StyleRahim, Akif, Xander Wang, Neelam Javed, Farhan Aziz, Amina Jahangir, and Tahira Khurshid. 2023. "The Perturbation of Mangla Watershed Ecosystem in Pakistan Due to Hydrological Alteration" Water 15, no. 4: 656. https://doi.org/10.3390/w15040656
Note that from the first issue of 2016, this journal uses article numbers instead of page numbers. See further details here.