
Effects of Anthropogenic Activities on Water Quality within Ngong River Sub-Catchment, Nairobi, Kenya


1
Department of Geography, University of Nairobi, Nairobi P.O. Box 30197-00100 GPO, Kenya
2
Geography Department, Dimitrie Cantemir University, 540545 Targu Mures, Romania
3
Department of Geography, Tourism and Territorial Planning, Faculty of Geography, Tourism and Sport, University of Oradea, 410087 Oradea, Romania
*
Author to whom correspondence should be addressed.
Water 2023, 15(4), 660; https://doi.org/10.3390/w15040660
Submission received: 31 December 2022
/
Revised: 24 January 2023
/
Accepted: 6 February 2023
/
Published: 8 February 2023
(This article belongs to the Section Water Quality and Contamination)
Abstract
:Anthropogenic activities often compromise the water quality of natural water systems, rendering it unfit for domestic and agricultural use. This paper evaluates the effects of anthropogenic activities on the water quality of Ngong River in Nairobi County, Kenya. It aimed to assess the river’s physico-chemical parameters, identify major anthropogenic activities that act as pollutant sources and establish the relationship between the anthropogenic activities and water quality along the Ngong River. Twelve water samples were systematically collected in each of the twelve study sites in April and August 2021 and analyzed in the laboratory for various water quality parameters. The accumulation factor (AF) indicated that E. coli, total coliforms, BOD and COD were found to significantly build up downstream of Ngong River. The ANOVA test results showed that all the physicochemical parameters studied (BOD, E. coli, pH, total suspended solids, total coliforms, turbidity, conductivity, nitrates, oil and grease and TDS), except COD, were not significantly different (p ≤ 0.05) for the different sites. Measured heavy metals, such as lead (Pb) levels at different sampled points, were all found to be below the detectable limit (0.001 ppm) for both seasons. Cadmium (Cd) was detectable during the dry season with the highest levels (0.113 ppm) being recorded at Ngong Forest Boundary. The findings of this study revealed that anthropogenic activities, such as raw sewage disposal, industrial activities, solid waste dumping and small-scale agriculture, had adverse effects on Ngong River’s water quality. The study recommends a need to closely monitor anthropogenic activities along Ngong River to reduce their probable pollution of the water in the River basin. This will ensure the sustainability of the water resources.
1. Introduction
Despite the abundance of water on Earth and given that its amount and circulation will unlikely diminish in shorter geological timescales, only a tiny fraction (2.5%) of this water is fresh water and easily accessible by humans, since most water is reserved as salty sea water, glaciers or even deep ground water, hence, rendering is inaccessible [1,2,3]. As such, freshwater is considered a finite resource despite its immense usage in domestic, industrial and agricultural activities. Despite current global withdrawals being well below the maximum limit, due to the unequal distribution of renewable freshwater resources (RFWR) in place and time, around a quarter of the current global population inhabits highly water-stressed environments [1,4]. Without the adequate quality and quantity of fresh water, sustainable development would not be possible [2,3,5,6].
Kenya is classified among the water-scarce countries, yet forecasts suggest that per capita available water was to fall to 350 m3/year by 2020, down from 650 m3/year in 2012, possibly due to population growth [7,8]. This statistic is far lower than the globally accepted norm of 1000 m3 per capita per year. As a result, immediate action is required to strengthen the water sector’s capability to improve the accessibility and supply of clean and safe drinking water [7]. The majority of Kenyans living in rural areas and informal settlements in Nairobi have limited access to quality water. In rural areas, people travel for long distances to find water and use it for various purposes while in an untreated state [7,8,9]. Meanwhile, in urban areas, untreated water from rivers in the city is used for urban farming; however the untreated water is mostly turbid and contains pathogens which pose a health risk to consumers [7,10,11,12].
Ngong River is an essential water body located in Nairobi County and forms part of the upper catchment of Athi River basin (the second largest river in Kenya). It is a major source of water for downstream communities living in the counties of Kitui, Makueni and Kilifi. Meanwhile, Ngong River drains an area characterized by high population growth coupled with the mushrooming of informal settlements, particularly the Kibera and Mukuru slums. The river traverses Kenya’s capital city and industrial hub, making it vulnerable to water pollution for being used as an urban waste conduit for all the areas it traverses [9,13].
Freshwater ecosystems form a crucial part of natural resources with provisioning, supporting and regulatory services [14,15]. These ecosystems, however, face diverse threats ranging from human population pressure to land use changes, which cause extensive degradation, reduction in water quality and quantity, and a loss of wetland and freshwater ecosystem goods and services [6,16]. On the other hand, the water quantity on Earth remains constant, spatio-temporal changes affect the water quality, and it is highly perturbed by human activities [7,8,9,14]. Although river water pollution is rampant in both developing and developed countries, most poor regions in the world are the worst affected by an insufficient supply of water that meets the accepted standards [11,12,17]. However, developed countries, including the United Kingdom and Japan, are also grappling with the challenges of river water pollution. Other regions of the world such as the East China Sea (ECS) have also been prone to environmental stresses owing to increased population growth and human activities along the coasts and Yangtze River drainage basin, which passes through various cities before draining into the ECS [18]. Human activities along the Yangtze River’s course, such as agriculture, sewage and industries, release around 40% of pollutants (waste water) to the river, with phosphates, inorganic nitrogen, organic matters, oil hydrocarbons and heavy metals being the major pollutants [18]. In Nepal, water contamination/pollution has also been identified as the main public health hazard, with most resulting from anthropogenic activities, particularly domestic sewage.
In Kenya, anthropogenic pollution has been reported in rivers such as the Nyangores and Amala, which are tributaries of the River Mara in Kenya [19]. In addition, an assessment of Nairobi River water established that the concentrations of Fe, Pb, Mn and Cr had exceeded the WHO’s tolerable limit for safe and consumable drinking water [20], which was attributed to industrial effluents discharge, solid wastes and agricultural activities, and sewerage discharge along the river. Meanwhile, the untreated Ngong River water has been found to have polycyclic aromatic hydrocarbons (PAHs) levels ranging between 2.69 ng/L and 14.22 ng/L, which are within the tolerable limits [11]. However, precaution should be taken over the use of untreated Ngong River water to avoid PAHs accumulation in the human body and other related dangers [11]. Industrial activities, agricultural activities and increased population growth have also been reported as contributors of large amounts of water pollutants, which compromise water quality in the Athi and Nairobi rivers basins [9]. In Ngong River, the water is mainly polluted as it passes through Nairobi city [1,7], as well as by the discharge of industrial effluents [9,20,21].
Given the growing population and high demand for safe/clean water in downstream towns, it was critical to collect current data on Ngong River water quality and create an inventory of various human activities along the basin, in order to assess the water’s appropriateness for public utilization.
This research paper evaluated the water quality of the Ngong River, which flows through Nairobi’s and Africa’s largest slum (Kibera) [13], Kenya’s major industrial hub and other informal settlements, making it vulnerable to pollution. There has been considerable expansion of human settlements and industries along Ngong River over the past decade, and scant recent documentation exists on the relationship between anthropogenic activities and water quality along the entire Ngong River basin. The reviewed literature further indicated increased human activities with significant impacts on the water quality, especially within the studied sub-basin. In addition, the study area lacks basic sewerage infrastructure systems and most pollutants are discharged directly into the river. This informs the choice of the sub-basin and provides hope of finding a solution to the water quality degradation crisis in the sub-basin.
This article could provide critical information to a variety of stakeholders in order to safe guard public health, as well as protect fresh water resources. Importantly, it outlines that water from urban waterways and food crops grown using this water may not be fit for human consumption if no mitigation actions are taken to abate the pollution of urban rivers, since the human consumption of these contaminated crops may lead to heavy metal bio-magnification in the body. The findings of this study will further serve to update the data on the Ngong River water quality status.
2. Study Area
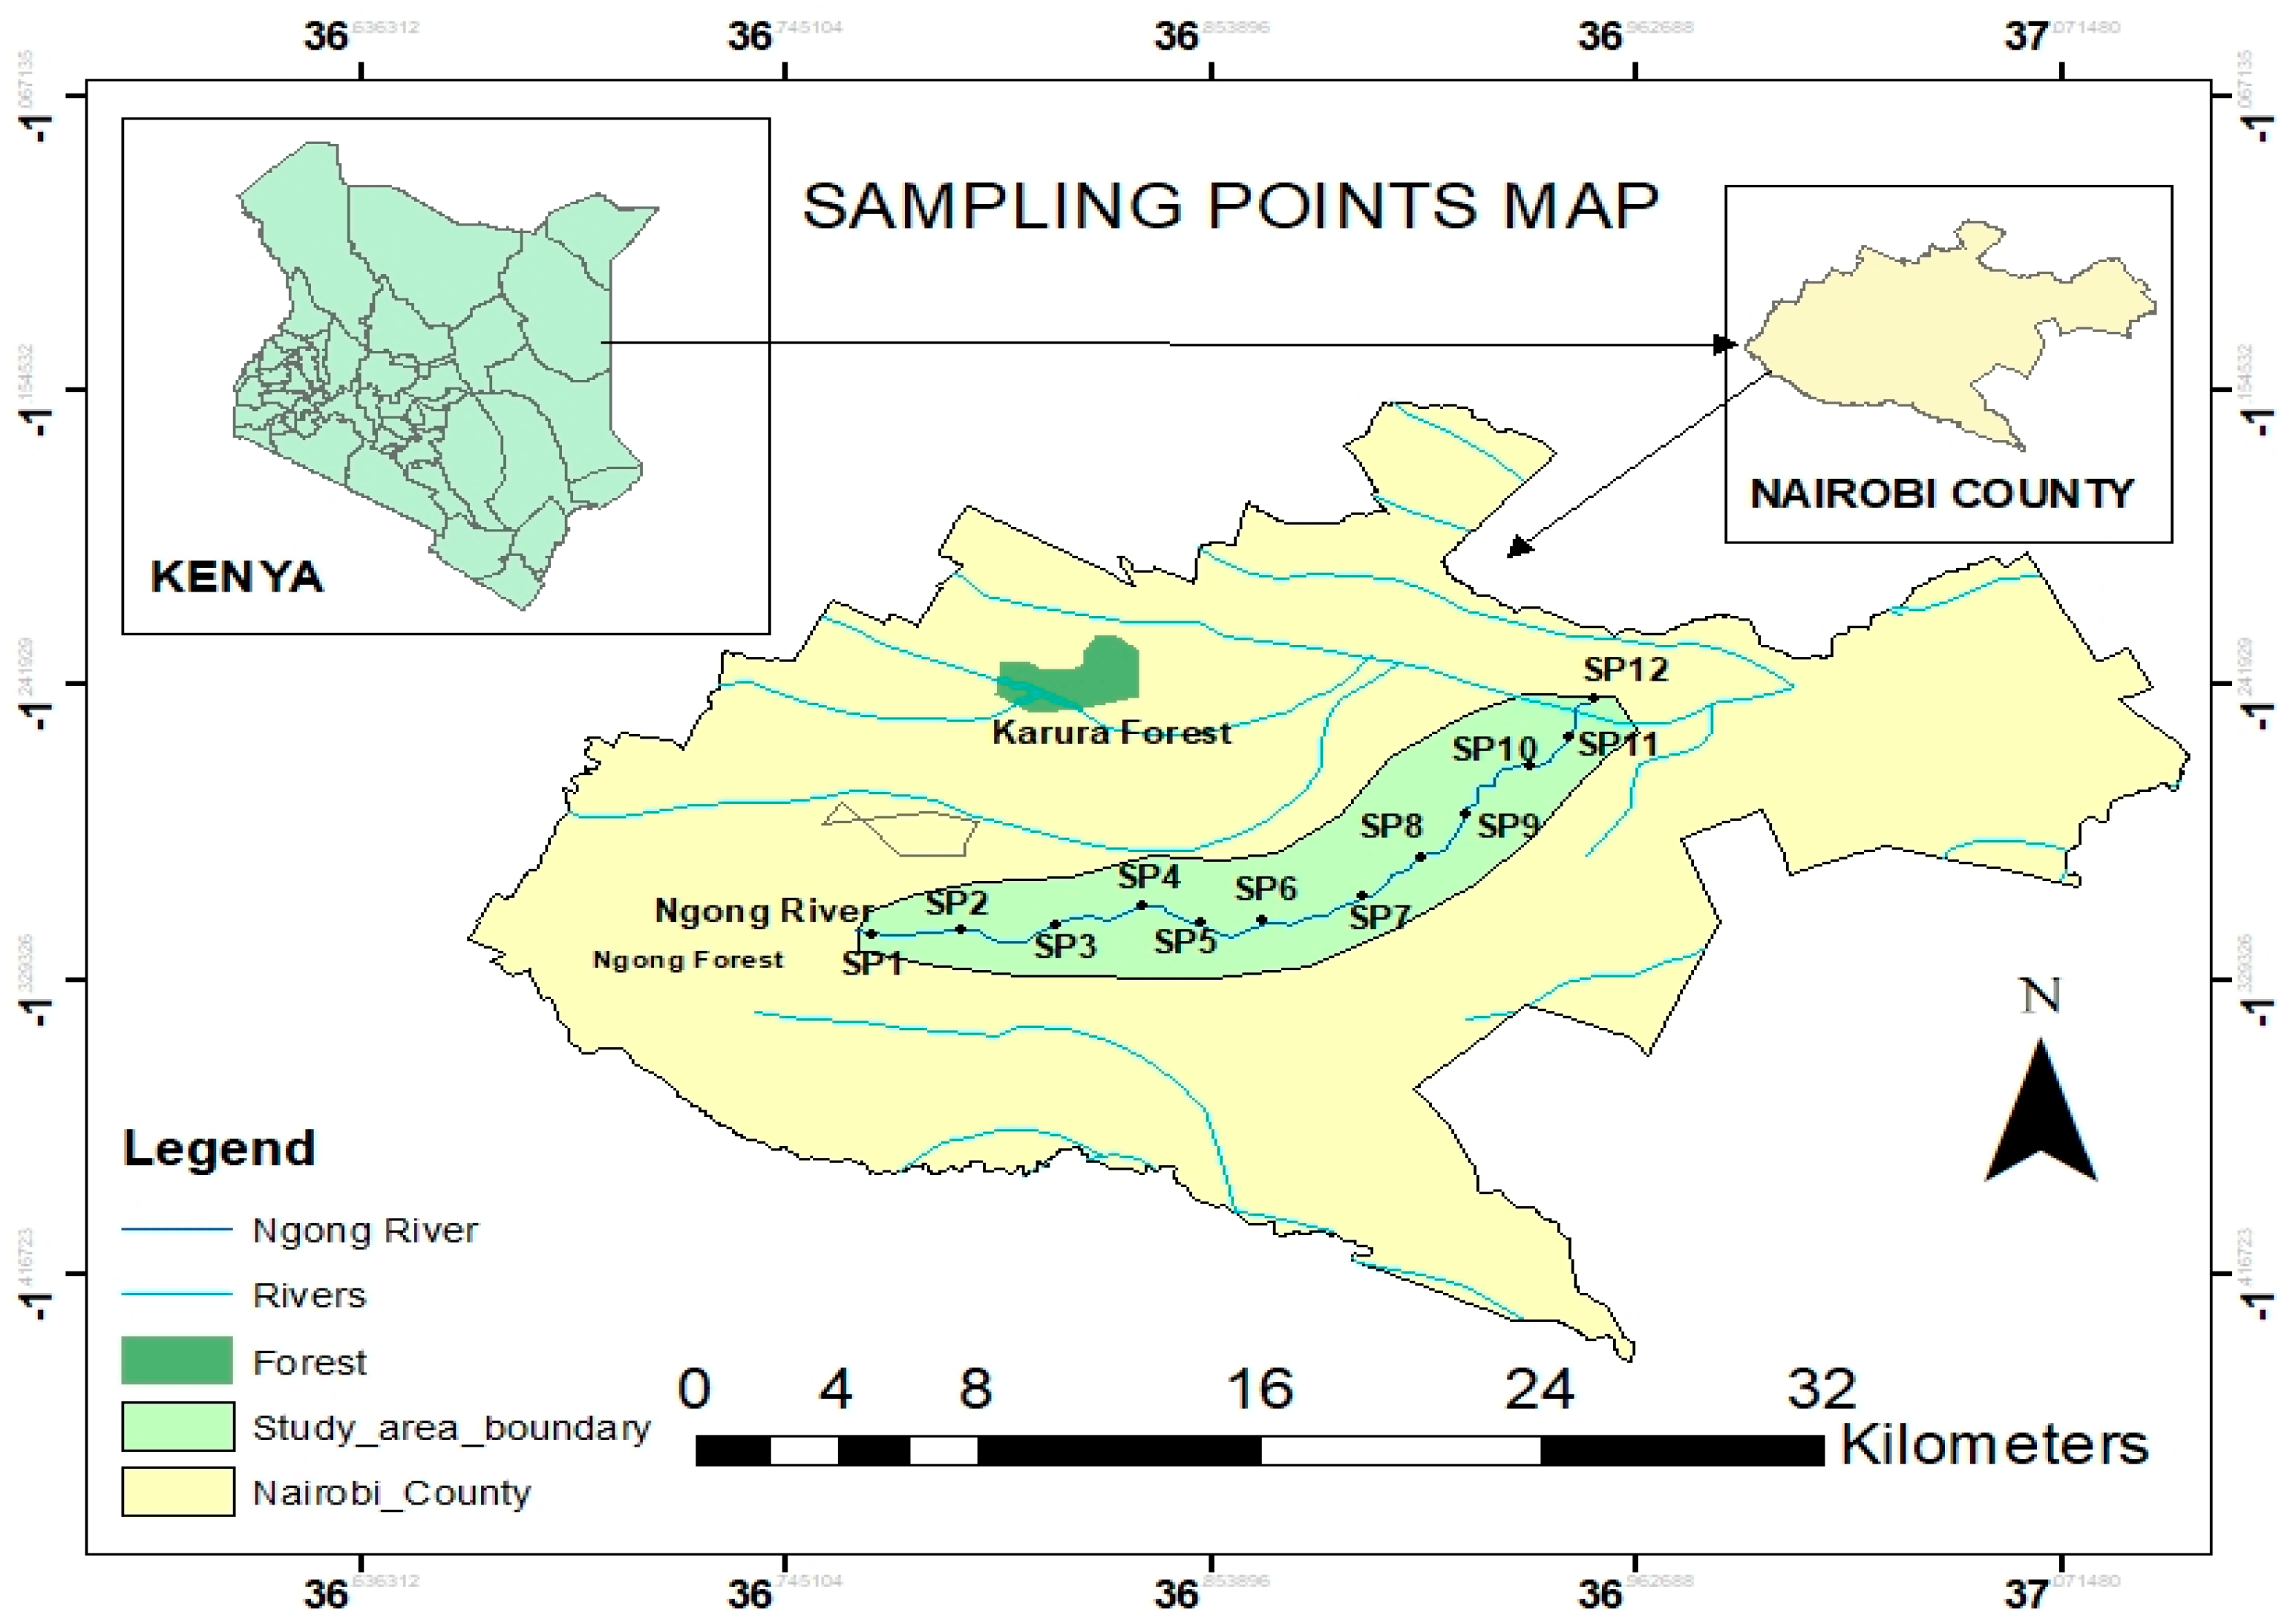
The study was carried out on Ngong River basin, which extends from a latitude of 1°17′ N to 1°18′ N and a longitude of 36°40′ E to 36°55′ E, as shown in Figure 1.
Ngong River originates from Motoine Swamp to Dagoretti Forest, and then flows through the Dagoretti area, Ngong Forest and ends at Njiru where it joins Nairobi River, which is a tributary of the Athi River.
The river basin’s length is about 42.3 km, while the total catchment area from the source to where it forms a confluence with the Nairobi River in Njiru is about 127 km2 [9,13]. The basin comprises four different sections; the upstream section of Nairobi Dam, Nairobi Dam itself, a dam outlet, as well as the section from the dam outlet to Njiru where it forms a confluence with the Nairobi River. Ngong River flows within the Nairobi City’s boundary at a distance of about 28 km, of which 10 km are within the industrial area. The river also passes through various informal settlements [21].
In order to assess the pollution levels of Ngong River, twelve water samples were collected from twelve sampling sites identified along Ngong River basin (Figure 1). The sites were selected based on the dominant human activities, such as settlements, industries, farming, and solid waste dumping and sewer discharges.
3. Data and Methodology
3.1. Samples Collection
Water samples from Ngong River were collected in April 2021 (wet season) and August 2021 (dry season). The samples were collected on four days in each of the seasons considered in the investigation. The sampling points were established as follows: one at the source (Ngong Forest boundary), and the rest distributed in the middle reaches and downstream before Njiru, where Ngong River joins Nairobi River (Figure 1). The downstream sampling sites were chosen based on specific anthropogenic activities along the river.
The characteristics of each sampling site and all notable anthropogenic activities occurring at the time of sampling were recorded. Prior information regarding the sites found to be major contributors in pollution of Ngong River was also considered during site selection.
The geographical coordinates of each sampling point were collected using a GPS receiver (Garmin Touch Oregon 550 model), and graphical presentations processed using Arc GIS 10.2. Temperature was measured in situ using a multi-parameter device (Eutech PC 700 model), while all other physico-chemical parameters were measured ex situ by collecting water samples in well-corked plastic bottles. The water samples were refrigerated prior to analysis at the Central Water Testing Laboratory of Water Resource Management Authority.
3.2. Measurement of Physicochemical Parameters
A total number of 12 physicochemical parameters were measured, namely pH, electrical conductivity, temperature, TDS, total suspended solids, oil and grease, BOD, COD, nitrate, lead and cadmium, and fecal coliforms (total coliforms and E. coli).
Temperature was measured in situ using portable multi-parameter equipment (Eutech PC 700 model). PH was determined using the electrometric method (4500 H + B); turbidity was determined using the nephelometric method; and electrical conductivity was tested using the laboratory method (APHA, 2510 B).
Once the samples were measured for conductivity and pH, 10% nitric acid (HNO3) was used to bring the sample to a pH of <2 for heavy metal analyses, biological and chemical tests. Water samples are likely to have alterations in chemical composition due to microbial activities and chemical reactions [22]; hence, maintaining the pH by adding nitric acid prevents metabolic processes and adsorption within the samples. The nitrate electrode method was used to determine the nitrates level (APHA 4500 NO3− D); total dissolved solids was measured using APHA 2510A procedures; and closed reflux, titrimetric method and APHA 5220 C were used in the determination of COD. The APHA 5210 D (respirometric method) 5-day BOD test procedure was used to determine BOD; the APHA 5520B-Partition-Gravimetric Method procedure was used to test oil and grease levels; and total suspended solids (TSS) were determined in the laboratory following APHA 2540 A procedures (dried at 103–105 °C). The analysis of E. coli and total coliforms was performed using the enzyme substrate coliform test—APHA 9223A [23]. Heavy metals were analyzed using APHA 3111B—flame atomic absorption spectrometry, whereby a given sample was aspirated into flame and then atomized.
3.3. Statistical Analysis
Data for the heavy metal concentrations and physicochemical parameters of Ngong River water were first analyzed using descriptive statistics and visualized through graphs. The level of contamination resulting from anthropogenic effects was estimated using the accumulation factor (AF). The AF is defined as the ratio of the mean level of a particular parameter downstream (i.e., after a source discharge) to a corresponding mean level upstream (i.e., before the source discharge) [24].
The accumulation factor (AF) was computed by dividing the mean parameters values downstream with the upstream values [24]. The level of river recovery capacity (RRC) for Ngong River was computed using the formula recommended by [25], as modified by [24] and given as:
where:
RRC = (S0 − S1)/S0 × 100 (Expressed in %)
- S0 is the level of a parameter downstream (i.e., immediately after the discharge point).
- S1 is the corresponding average level upstream where the water is relatively unpolluted.
The ANOVA test was used to determine the difference in significance of various parameters at different study sites and different seasons. The statistical analysis was performed using SPSS version 17.0.
4. Results
The ANOVA test results (at 0.05 significance level) showed that the majority of the measured parameters, such as BOD, E. coli, pH, total suspended solids, total coliforms, turbidity, conductivity, nitrates, oil and grease, and TDS, were not significantly different for the various sampling locations. Therefore, the non-significant difference observed in the majority of parameters indicates a contribution of anthropogenic sources in the Ngong River basin (Table 1).
It is important to note that all the water quality variables except COD showed similar characteristics throughout the Ngong River, hence, the null hypothesis (H0 there is no significant difference between the values of measured parameters at different sites) failed to be rejected. This indicates that the water quality of Ngong River is significantly related to anthropogenic activities along the basin, and as such, the null hypothesis (H0: changes in Ngong River’s water quality are not significantly related to the anthropogenic activities along the river basin) was rejected. However, there was a significant difference in COD at the 0.05 sig. level (Table 2).
The difference in significance in COD indicates a high level of oxidizable organic matter from effluents discharged into Ngong River. High COD levels cause a decline in dissolved oxygen in the river water, hence, the deterioration of water quality. COD levels were remarkably high at Lindi Mosque site, Likoni Bridge and Kangundo road sites.
A one way ANOVA test at the 0.05% significance level was also performed to determine whether there was a difference in significance in the water quality of Ngong River for the wet and dry season using the different water quality variables (Table 3).
The results showed that conductivity, nitrate, oil and grease, and total dissolved solids were found to be significantly different during the dry and wet season. However, BOD, COD, E. coli, pH, total coliforms, TSS and turbidity were found not to be significantly different during the wet and dry season. The non-significant difference in the BOD, COD, E. coli, pH, total coliforms, TSS and turbidity variables revealed that anthropogenic activities have an impact on the water quality of Ngong River in both the dry and wet season.
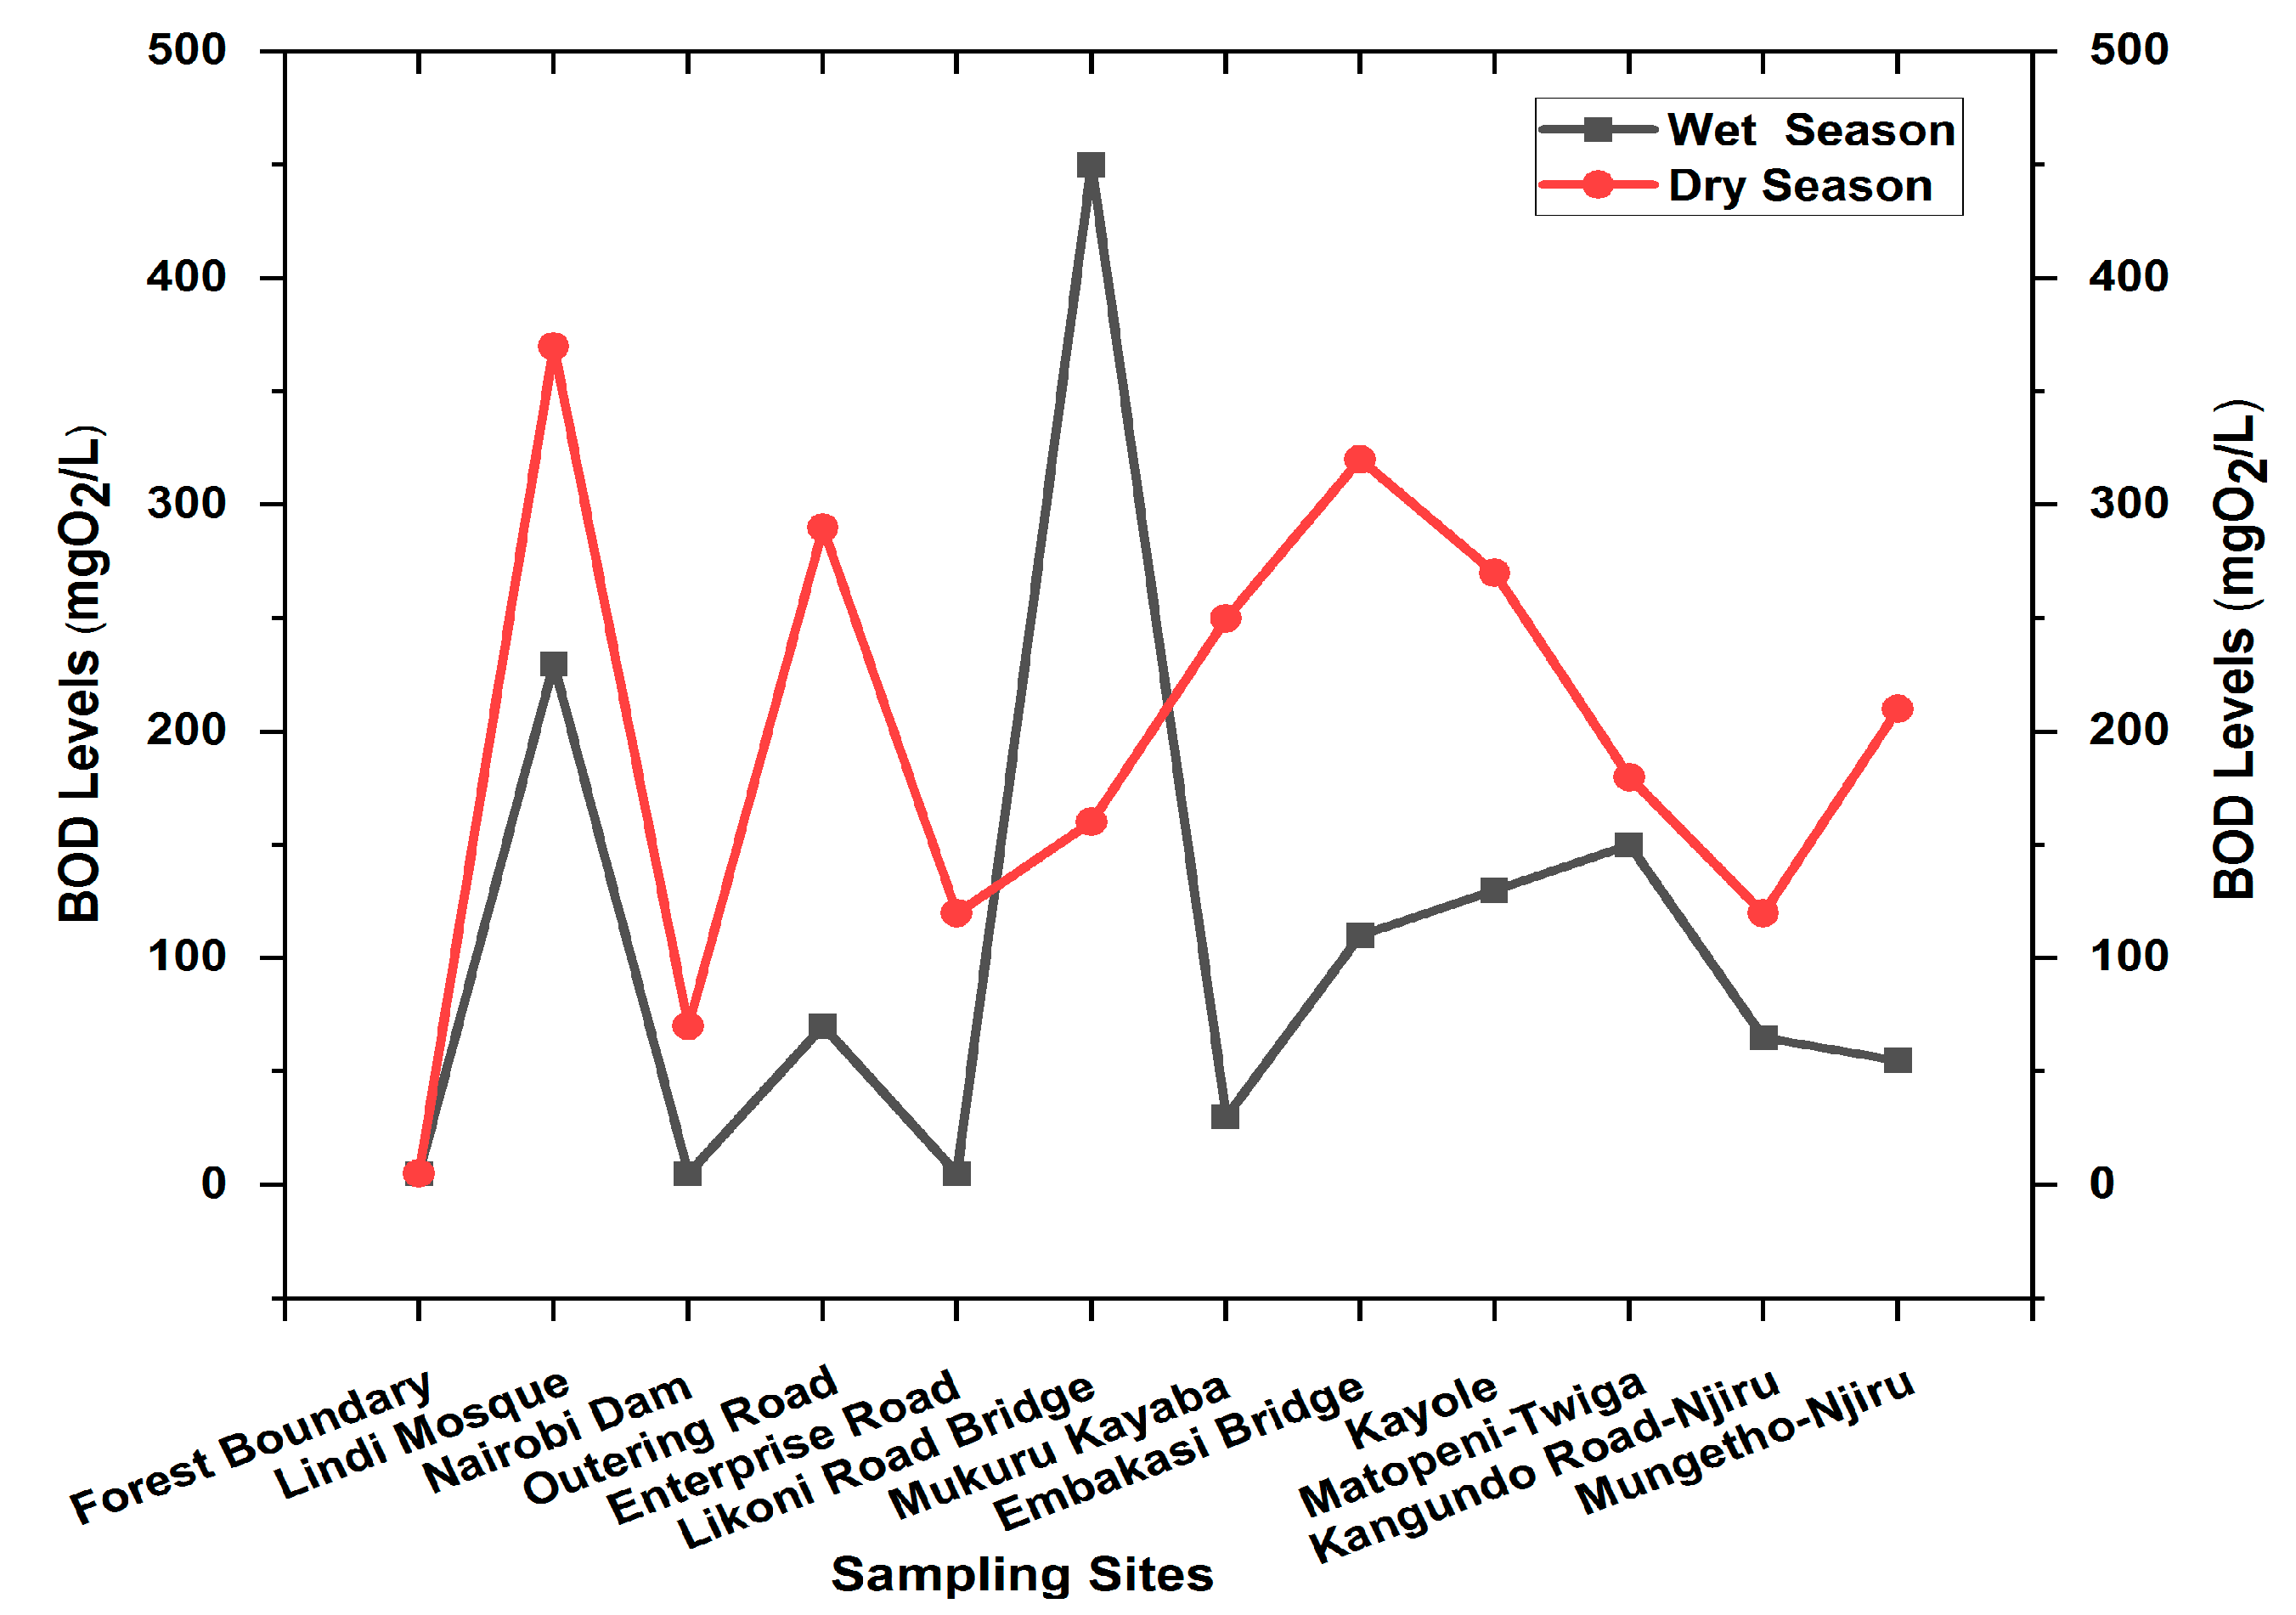
The analysis found that low BOD values were recorded at the source (Ngong Forest boundary) and Nairobi dam (encroached part of the dam) during both wet and dry seasons (Table 4).
However, the BOD value rapidly increased at Lindi Mosque site in Kibera informal settlements (the downstream sampling point closest to Ngong Forest boundary), (230 mg/L and 370 mg/L) during the wet and dry seasons, respectively, suggesting pollution from the slum. At Mukuru Kayaba, the BOD level was 30 mg/L. However, at Likoni bridge, a point located downstream of Mukuru Kayaba, the BOD level was the highest (at 450 mg/L), indicating the downstream transportation of pollutants from the Mukuru Kayaba slums during the rainy season (Table 5).
High BOD levels were also observed for all the sites sampled as compared to the source levels, indicating an increase in organic loads from the sewer discharged by informal settlements and leachates from dumpsites located along the middle reaches of the river basin. The BOD values for Ngong River were comparable to those of Oyake, 1998, where the values recorded were about twenty times in excess of the maximum permissible level for drinking water of 3.0 mg/L. Meanwhile, at Enterprise Road Bridge, the BOD levels were also low (5 mg/L), indicating that other pollutants from industrial effluents negatively influence the biological oxygen demand by microorganisms in natural waters.
Generally, low BOD values were observed during the wet season, while high BOD values were recorded during the dry season, indicating that surface runoff reduces organic pollution in Ngong River, hence, low BOD values during the rainy season. The BOD levels for all the sampled sites are shown in Figure 2.
The findings on the BOD values for Ngong River were in line with those of Ona River in Nigeria [25], which showed that BOD values remarkably increased at effluent discharge points throughout the period in which sampling was performed, suggesting the contribution of effluents to the increasing values. Ngong River’s BOD values increased tremendously on the onset of receiving domestic effluents discharge from Kibera informal settlements at Lindi Mosque up to Mung’etho Njiru (the last sampling point). This finding indicates the effect of anthropogenic activities on BOD levels and the subsequent degradation of water quality of Ngong River. Continued increase in BOD in the Ngong River could lead to the depletion of oxygen necessary for aquatic life, thus compromising the integrity of this ecosystem.
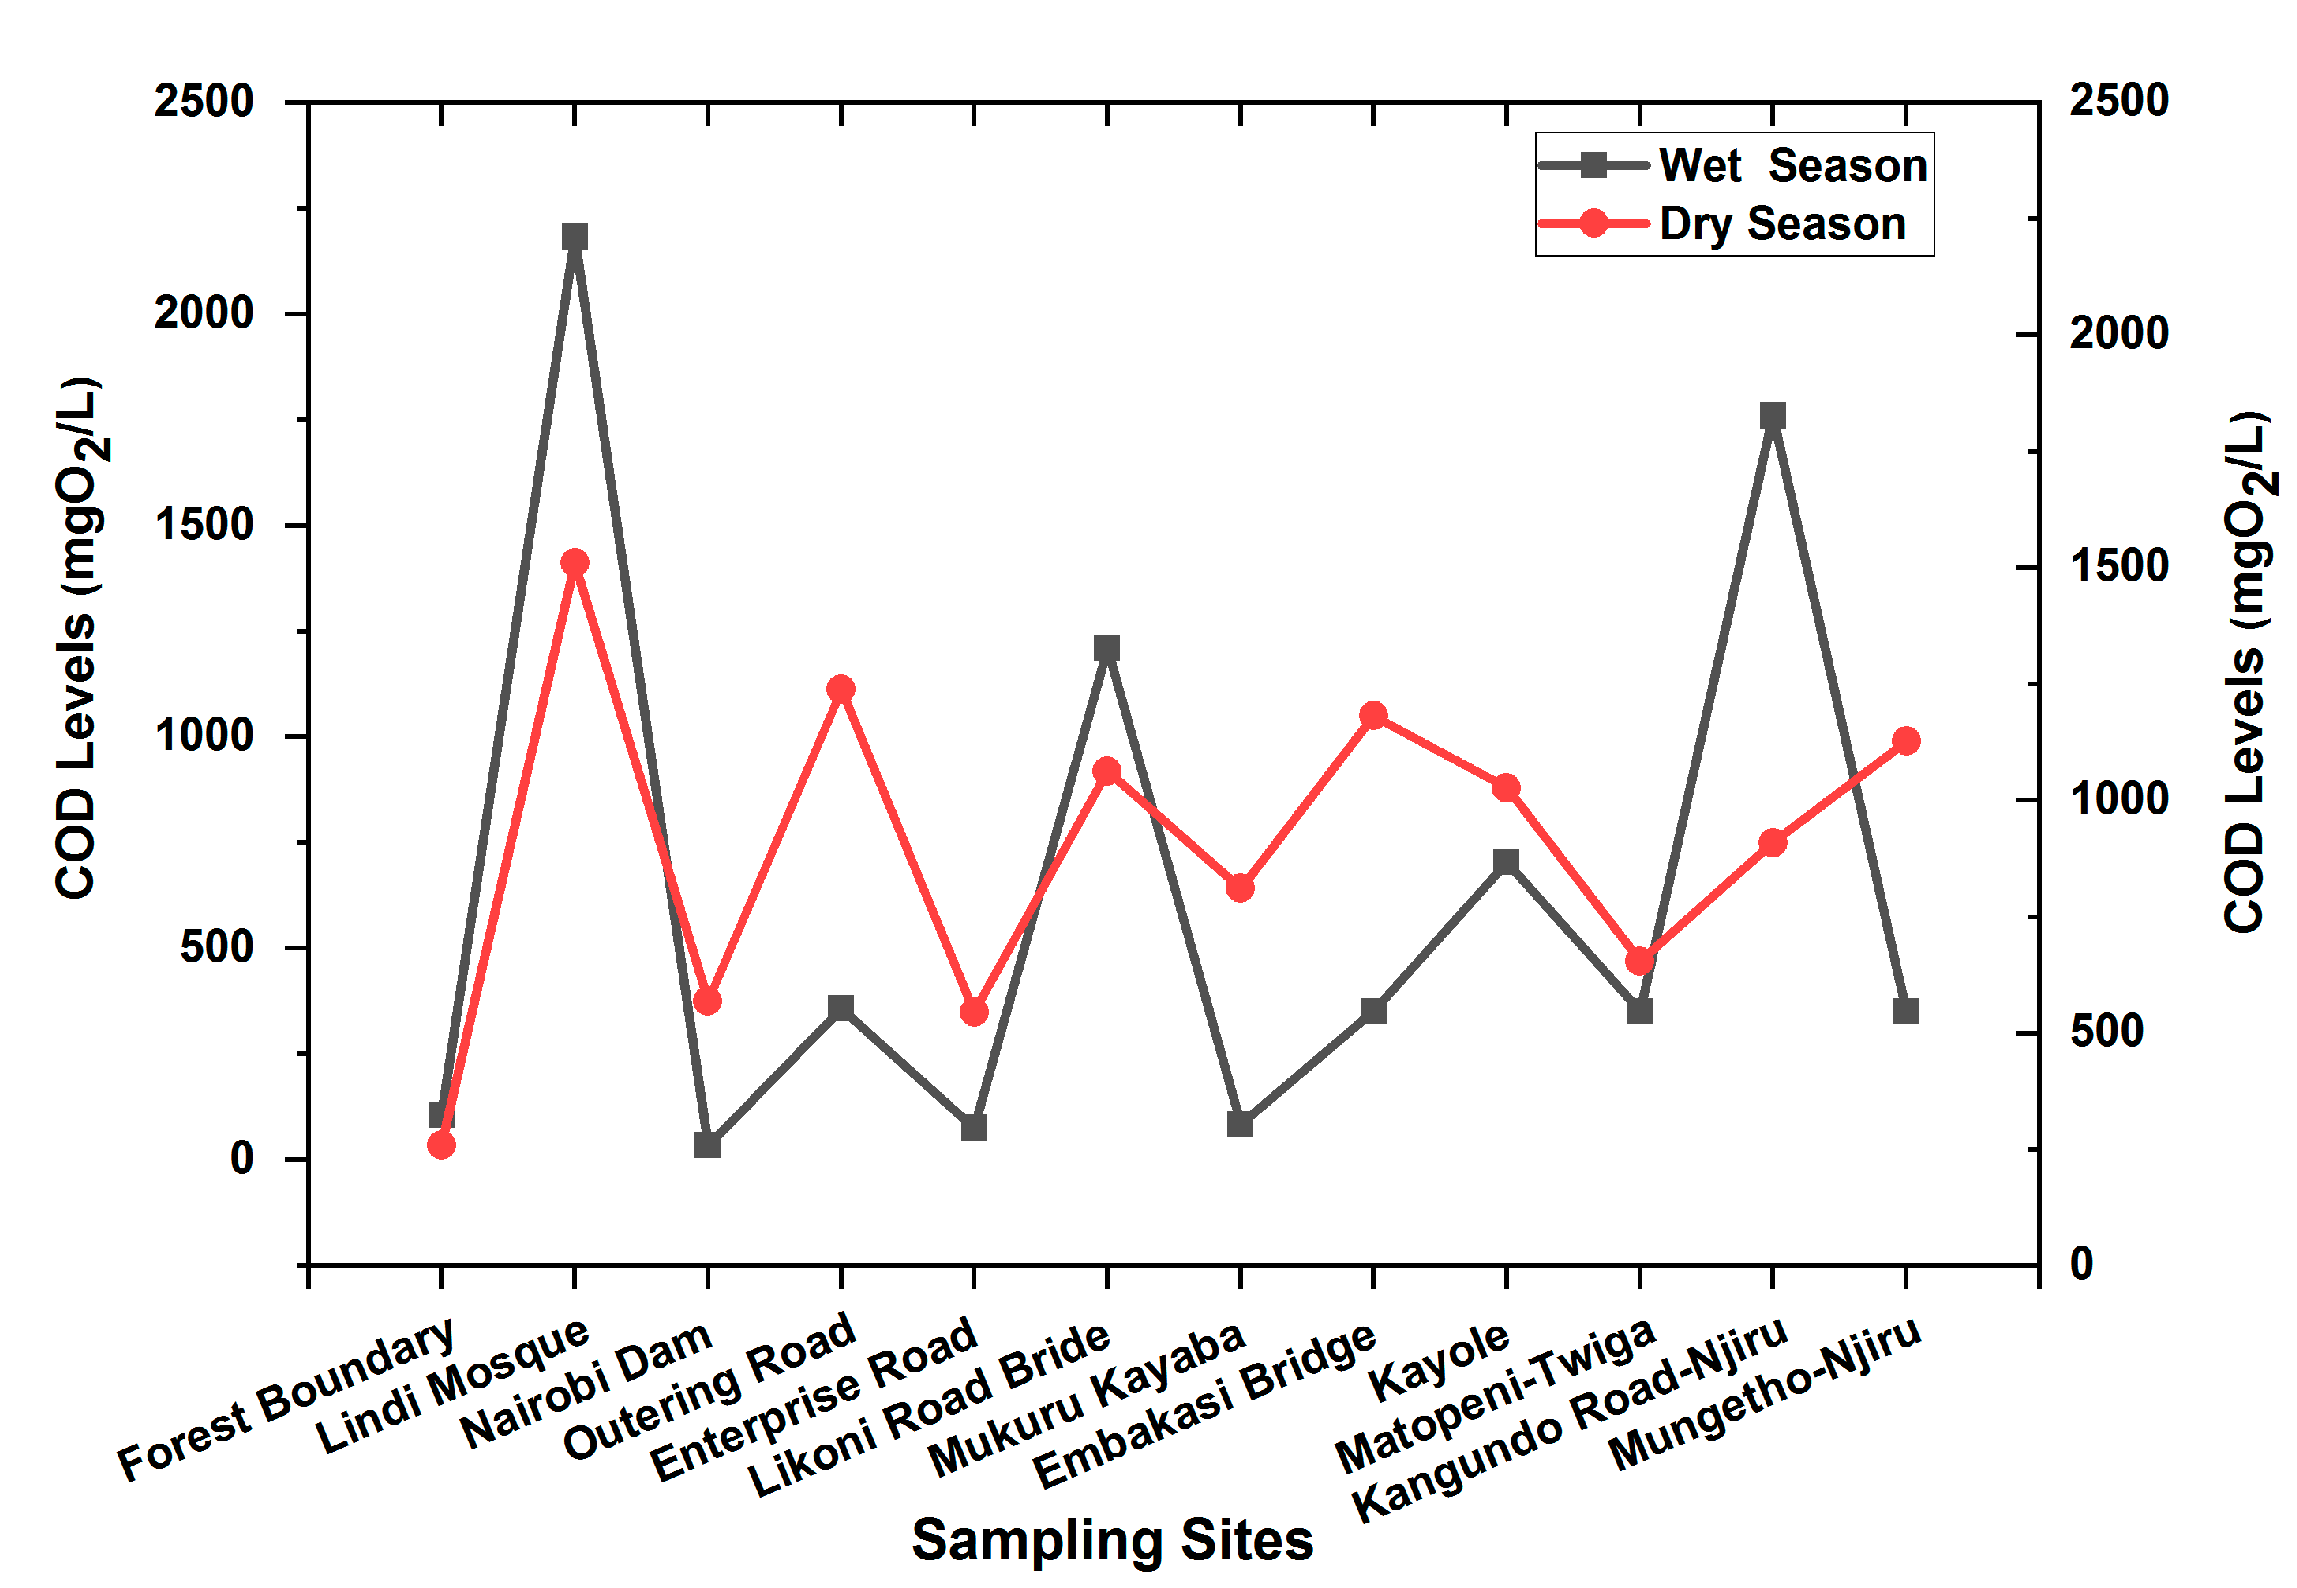
The COD levels for Ngong River ranged from 106 mg/L to 2182 mg/L during the wet season and 35 mg/L to 1411 mg/L during the dry season. Ngong forest boundary had the lowest COD values during both seasons, while Lindi mosque in Kibera recorded the highest COD values for both seasons due to a wide range of pollutants discharged from the Kibera informal settlements. A low COD value of 35 mg/L at Nairobi dam during the wet season could be attributed to the self-purification of the water. Ngong Forest Boundary had a relatively high COD value of 106 mg/L during the wet season, indicating upstream pollution, possibly from high levels of decaying plant matter from the forest, and informal settlements encroaching upon the forest. COD values generally increased downstream from Kibera to Njiru due to the effects of anthropogenic activities such as sewer discharge, industrial effluents discharge and garbage disposal along the river basin (see Table 4 and Table 5).
The seasonal variation in the COD values for Ngong River was evident, as the values obtained were low for the wet season and high during the dry season, as indicated in Figure 3. This could be attributed to the dilution effect due to long rains in the wet season. This was further supported by the river recovery capacity values for COD at 95% (Table 5), showing that Ngong River had a strong recovery for COD. The high COD value (2182 mg/L) observed for Ngong River was comparable to those of Oyake, 1998, [21] who recorded maximum values of 2500 mg/L and 2000 mg/L, respectively, for Ngong River. Elsewhere, Adeogun et al. [25] also observed an increase in COD values at the point of effluent discharges along Ona River, Nigeria. The high COD values indicate high organic pollution that could deplete the oxygen in water and subsequently affect aquatic life. The COD levels for all the sampled sites in the present study are illustrated in Figure 3.
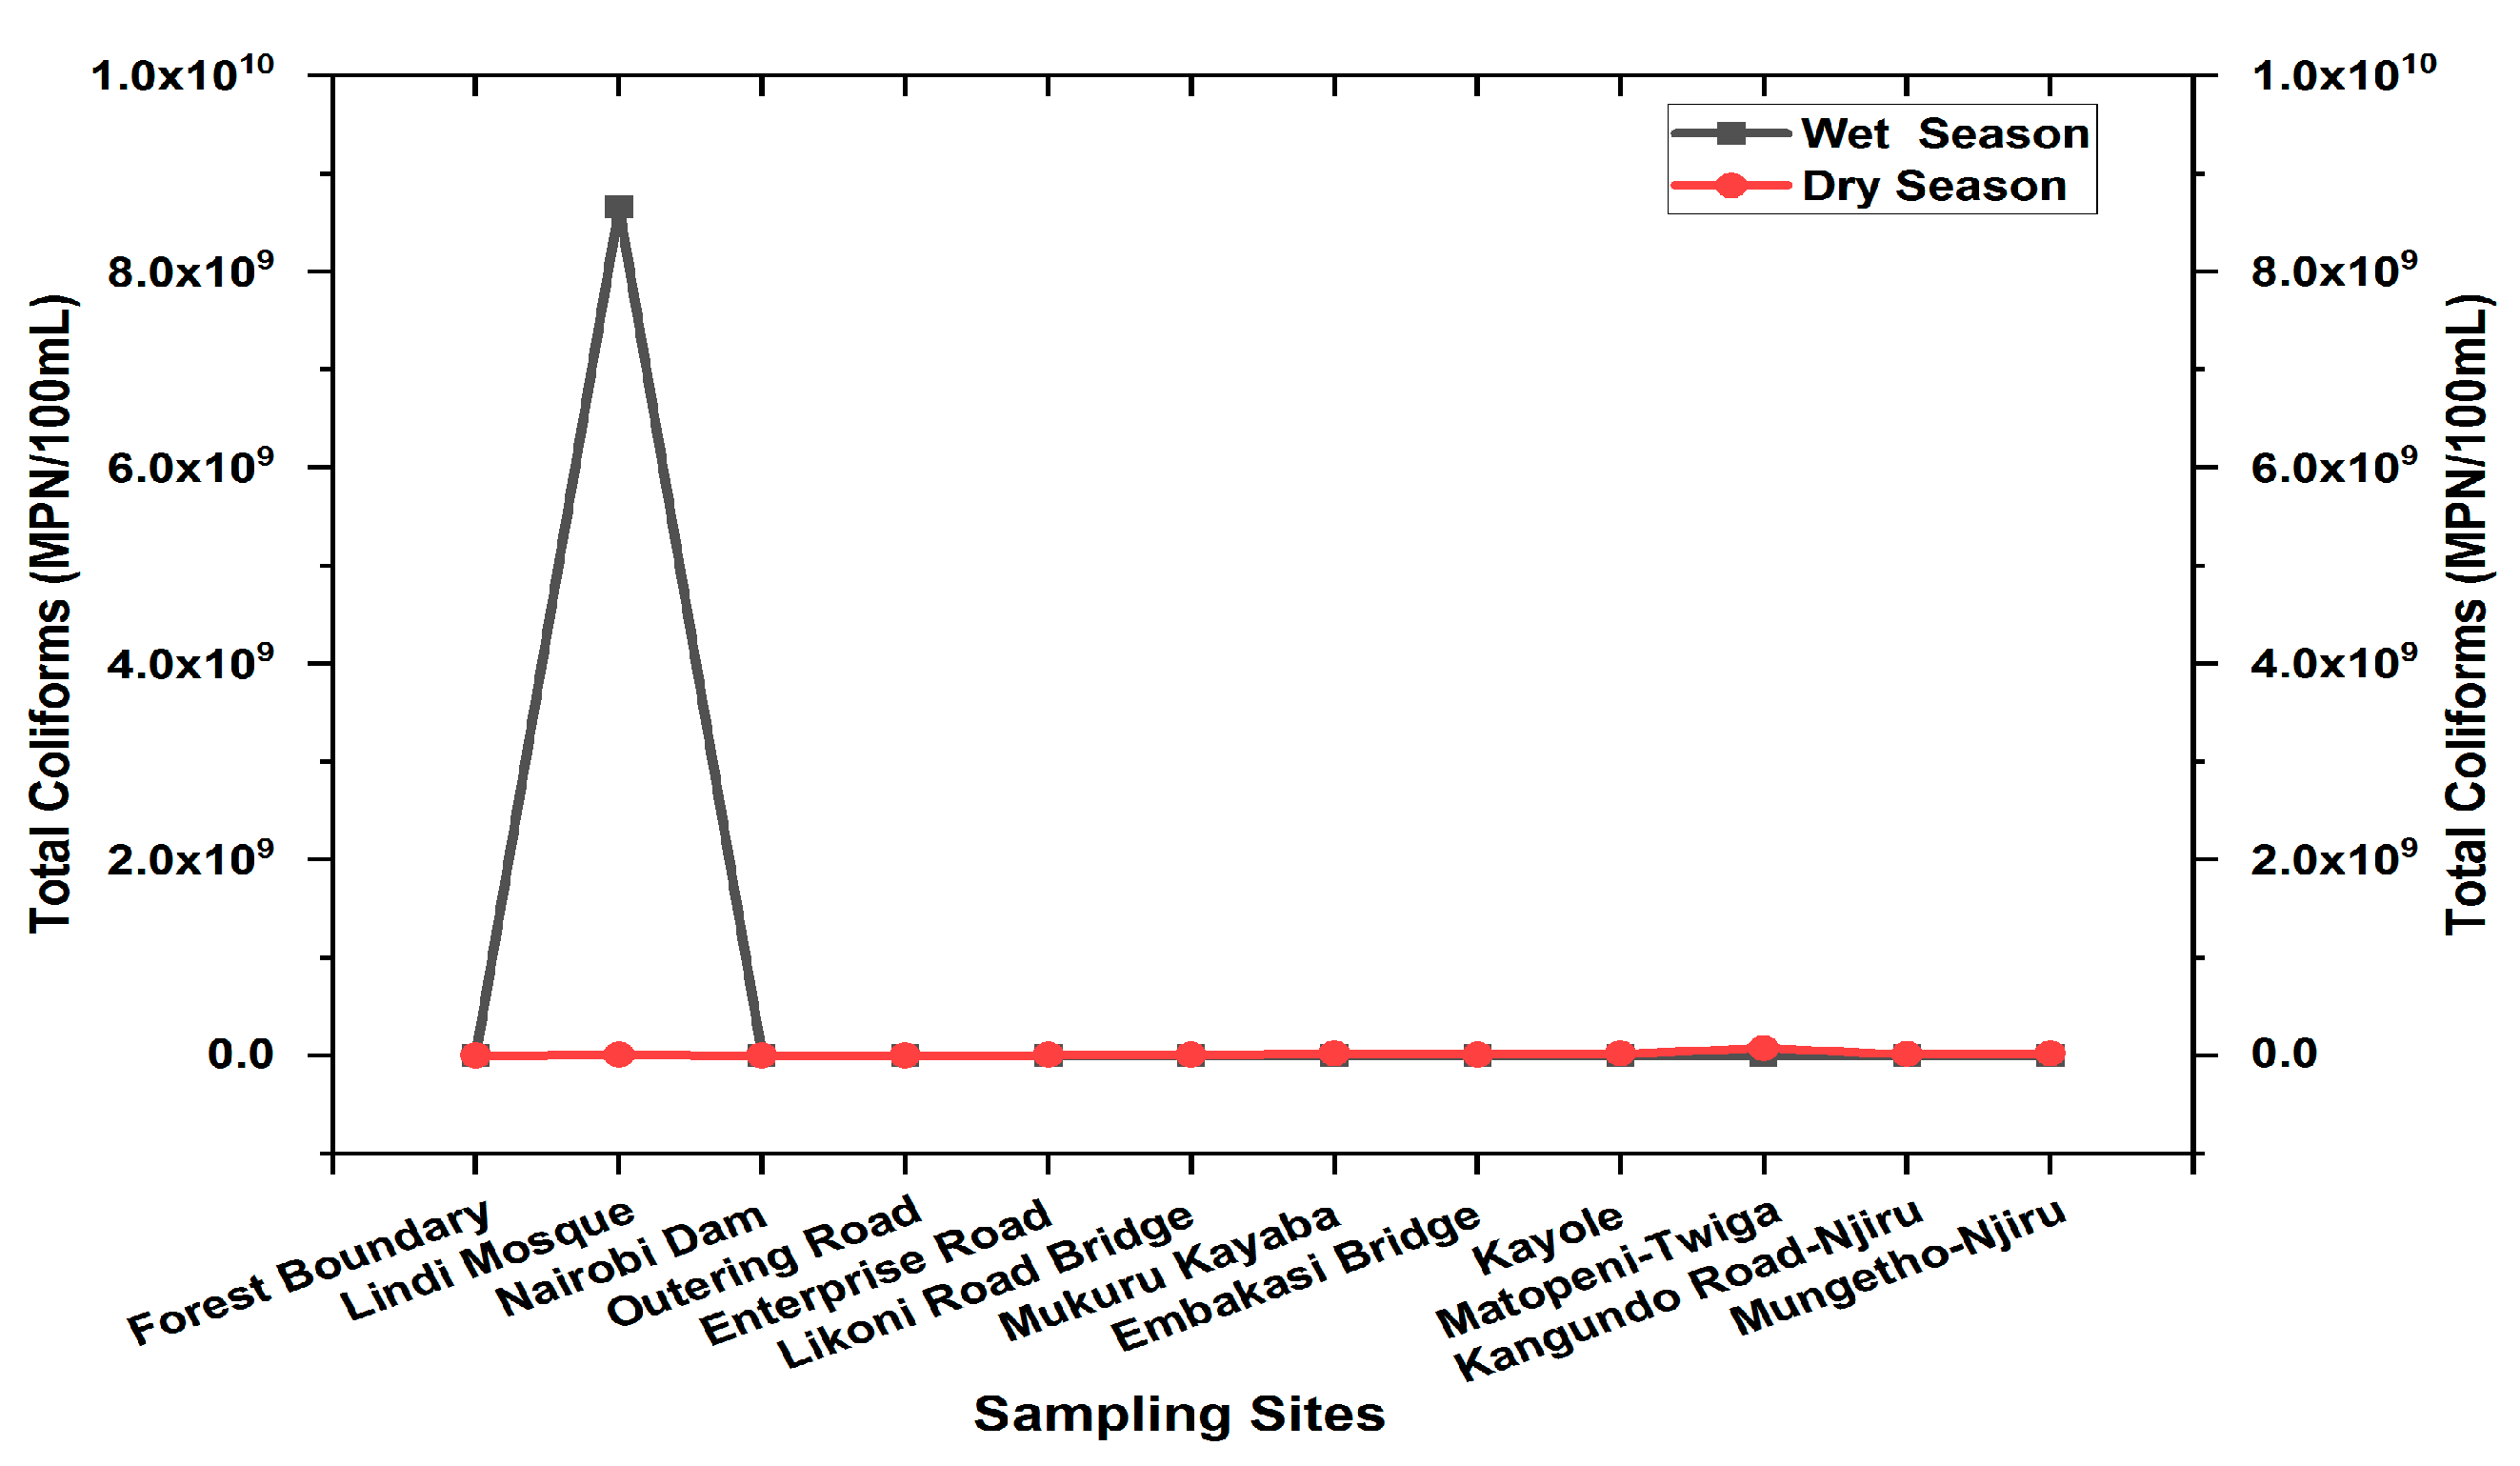
The total coliforms and E. coli levels for Ngong River for both wet and dry seasons are presented in Figure 4 and Figure 5, respectively. Total coliforms and E. coli were detected in all sites, suggesting fecal pollution even at the source of Ngong River. A downstream cumulative effect was observed in the contamination of the River water. The highest fecal contamination for Ngong River was recorded at Lindi Mosque, Kibera (observed as a single peak in Figure 4), with total coliforms levels of 866 × 107 MPN/100 mL for the wet season. This could be attributed to an increased direct discharge/release of raw sewer (human fecal matter) into the river during the wet season. Low levels of total coliforms 930 MPN/100 mL were recorded at Enterprise Road Bridge. The Ngong Forest boundary sampling site had a total coliform level of 81,000 MPN/100 mL and 143 MPN/100 mL during the wet season and dry season, respectively, indicating the fecal contamination of water at the source. The total coliforms recorded were alarming along the entire Ngong River basin, revealing that direct sewer discharge had an influence on the water quality. The informal settlements established along the river are not sewered, hence the direct discharge of human fecal matter into the river—an issue that the relevant authorities should address.
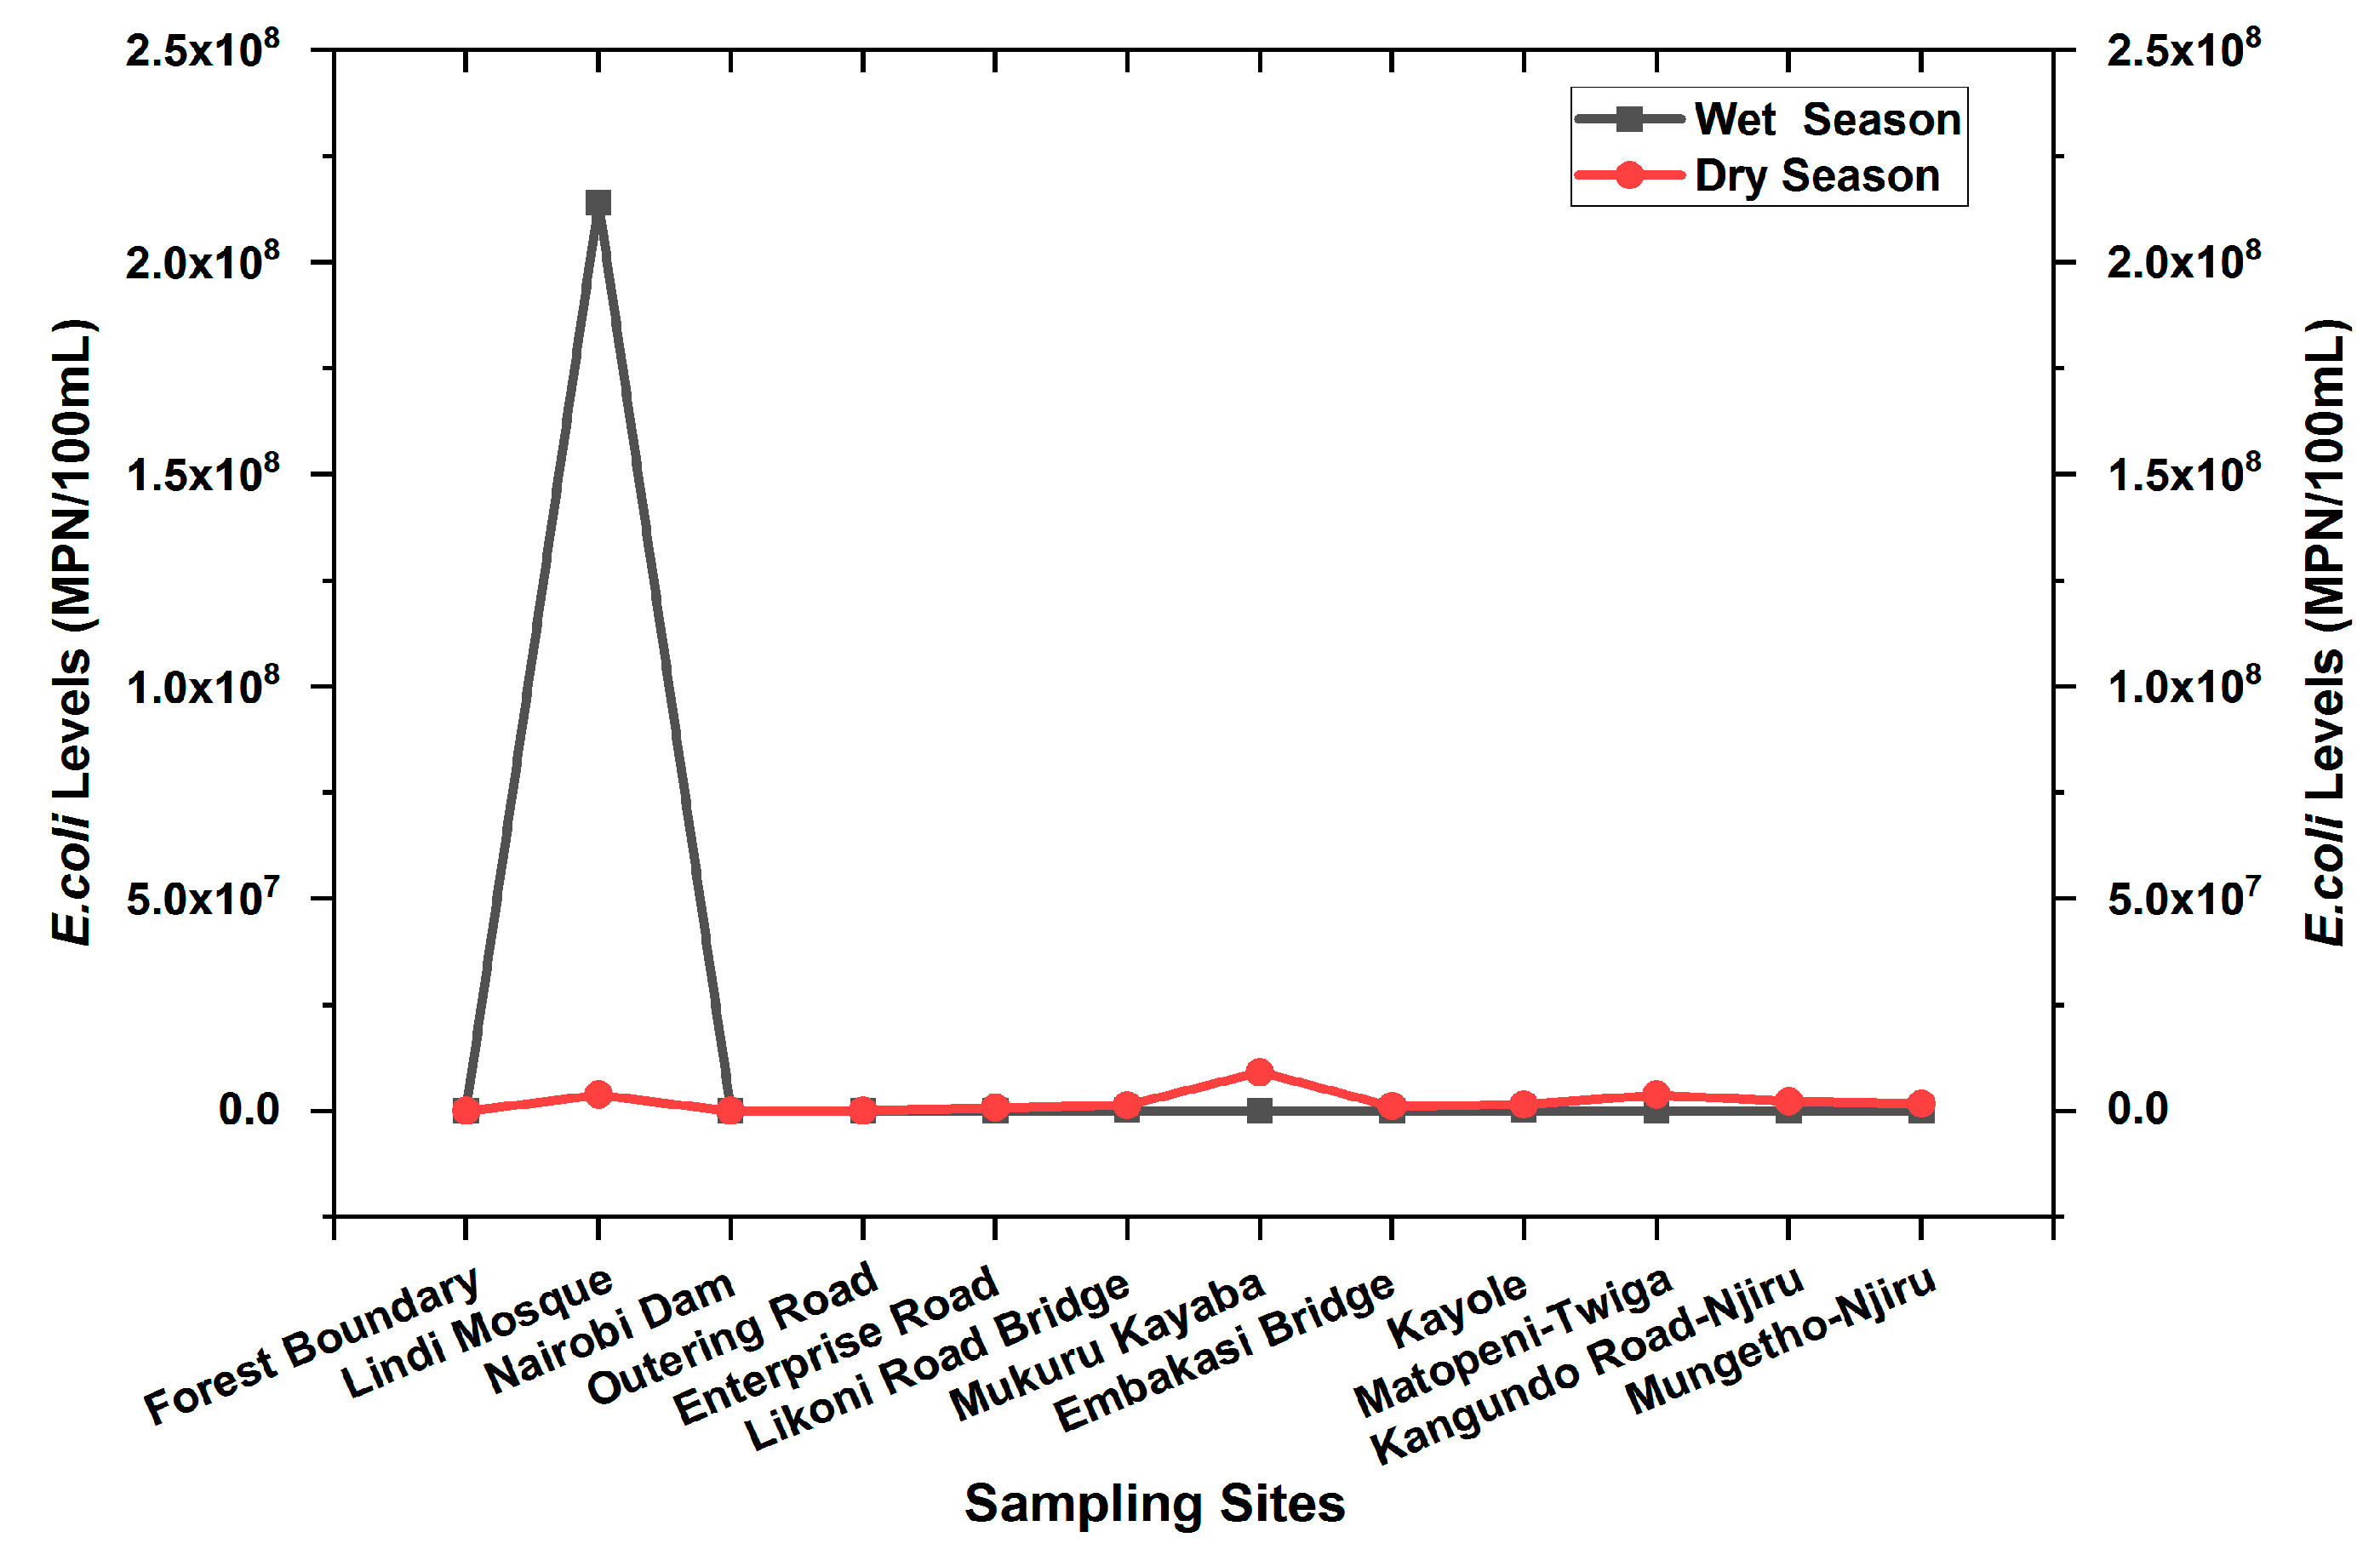
The E. coli values for Ngong River showed a downstream increasing trend, similar to that of total coliforms. E. coli was also detected at all sites sampled. The E. coli levels were low at the Ngong Forest boundary 2 MPN/100 mL during the dry season and at Enterprise Road Bridge 30 MPN/100 mL during the wet season. E. coli was highest at Lindi Mosque, Kibera 214 × 106 and at Mukuru Kayaba 92 × 105 during the wet season and dry season, respectively (Figure 5).
These high values are presented as high peaks in Figure 5. These high levels of fecal bacteria can be attributed to the rampant and direct discharge of human fecal waste into the river.
The field data collected revealed that sewer discharge is alarming, particularly during the rainy season; however, due to the dilution capacity of the river, the values recorded for the wet season (on average) were lower than those of the dry season, indicating the importance of surface runoff and the rain water in the self-purification of the river. Meanwhile, E. coli was not detected at Nairobi dam during the wet season. The NEMA standards for effluent discharge allow a maximum limit of NIL count/100 mL and 30 counts/100 mL of E. coli and total coliforms, respectively. The recorded E. coli and total coliform bacterial counts recorded at different sampling points of Ngong River were higher than the aforementioned NEMA standards, suggesting increased health risks, particularly in downstream regions of the Athi River where this water is utilized for domestic and for small irrigation purposes. These findings concurred with those of Bojarczuk et al. [26], which found fecal and E. coli contamination of River Bialka, Southern Poland, due to the establishment of a ski resort along the river. Musyoki & Mbaruk [12] reported bacterial contamination of the Nairobi and Athi river basins of Kenya; the levels were unacceptably higher than the national and WHO standards, hence being unsuitable for domestic and agricultural use.
The conductivity levels ranged from 314 to 950 µS/cm during the wet season and 509 to 1239 µS/cm during the dry season (Figure 6).
Upstream of the Ngong Forest boundary sampling point had the lowest conductivity of 509 µS/cm observed during the dry season. This value drastically increased to 1102 µS/cm at Lindi Mosque, Kibera, suggesting considerable levels of dissolved substances entering the river from the Kibera informal settlements. Conductivity showed an increasing trend downstream, with the highest values (1261 µS/cm) being observed at Kayole, indicating a high level of pollution. The Matopeni and Kangundo Road Bridge sampling points also recorded high conductivity values during the dry season (1239 µS/cm). The values remained high from the middle stretches to the downstream stretch, indicating considerable levels of dissolved substance through effluent discharges into the river stay in the waters between Kibera and Kangundo road, suggesting a high degree of anthropogenic activities along the river basin. The entire Ngong River from Kibera to Kangundo road was dominated by informal settlements, which lack proper sewage disposal mechanisms. As a result, chloride, phosphates and nitrate ions are potentially introduced into Ngong River, which could account for the high conductivity values observed. The conductivity level, however, reduced to 934 µS/cm at Mong’etho (the last sampling point), suggesting that the river was able to recover from conductivity at 53% (Table 6) during the dry season.
Electrical conductivity was higher during the dry season. The lower conductivity observed during the wet season could be due to dilution as a result of an increase in the river discharge. Lower levels of conductivity observed at Mukuru Kayaba and industrial area could be a result of pollutants discharged, such as oils and grease, which are poor conductors of electricity. Meanwhile, higher conductivity suggests the presence of high levels of dissolved substances, minerals or chemicals in river water. As such, biochemical processes (such as osmoregulation) and aquatic life in the Ngong River basin may be affected. The elevated conductivity of Ngong River’s water renders the water unfit for domestic use. Electrical conductivity was higher during the dry season (August), suggesting the presence of high levels of dissolved substances, minerals or chemicals in river water originating from anthropogenic sources such as sewer discharge. The lower conductivity observed during the wet season (April) could be due to dilution as a result of an increase in the volume of water. Lower levels of conductivity observed at Mukuru Kayaba and the industrial area could be a result of pollutants discharged, such as oils and grease, which are poor conductors of electricity. The measured high conductivity levels indicate an increasing concentration of dissolved metals and metal ions, which implies that industries along the river profile are discharging more raw effluents into the river. This further means that water quality in the river will remain low, since these dissolved ions cannot be removed from the water by normal conventional water treatment methods.
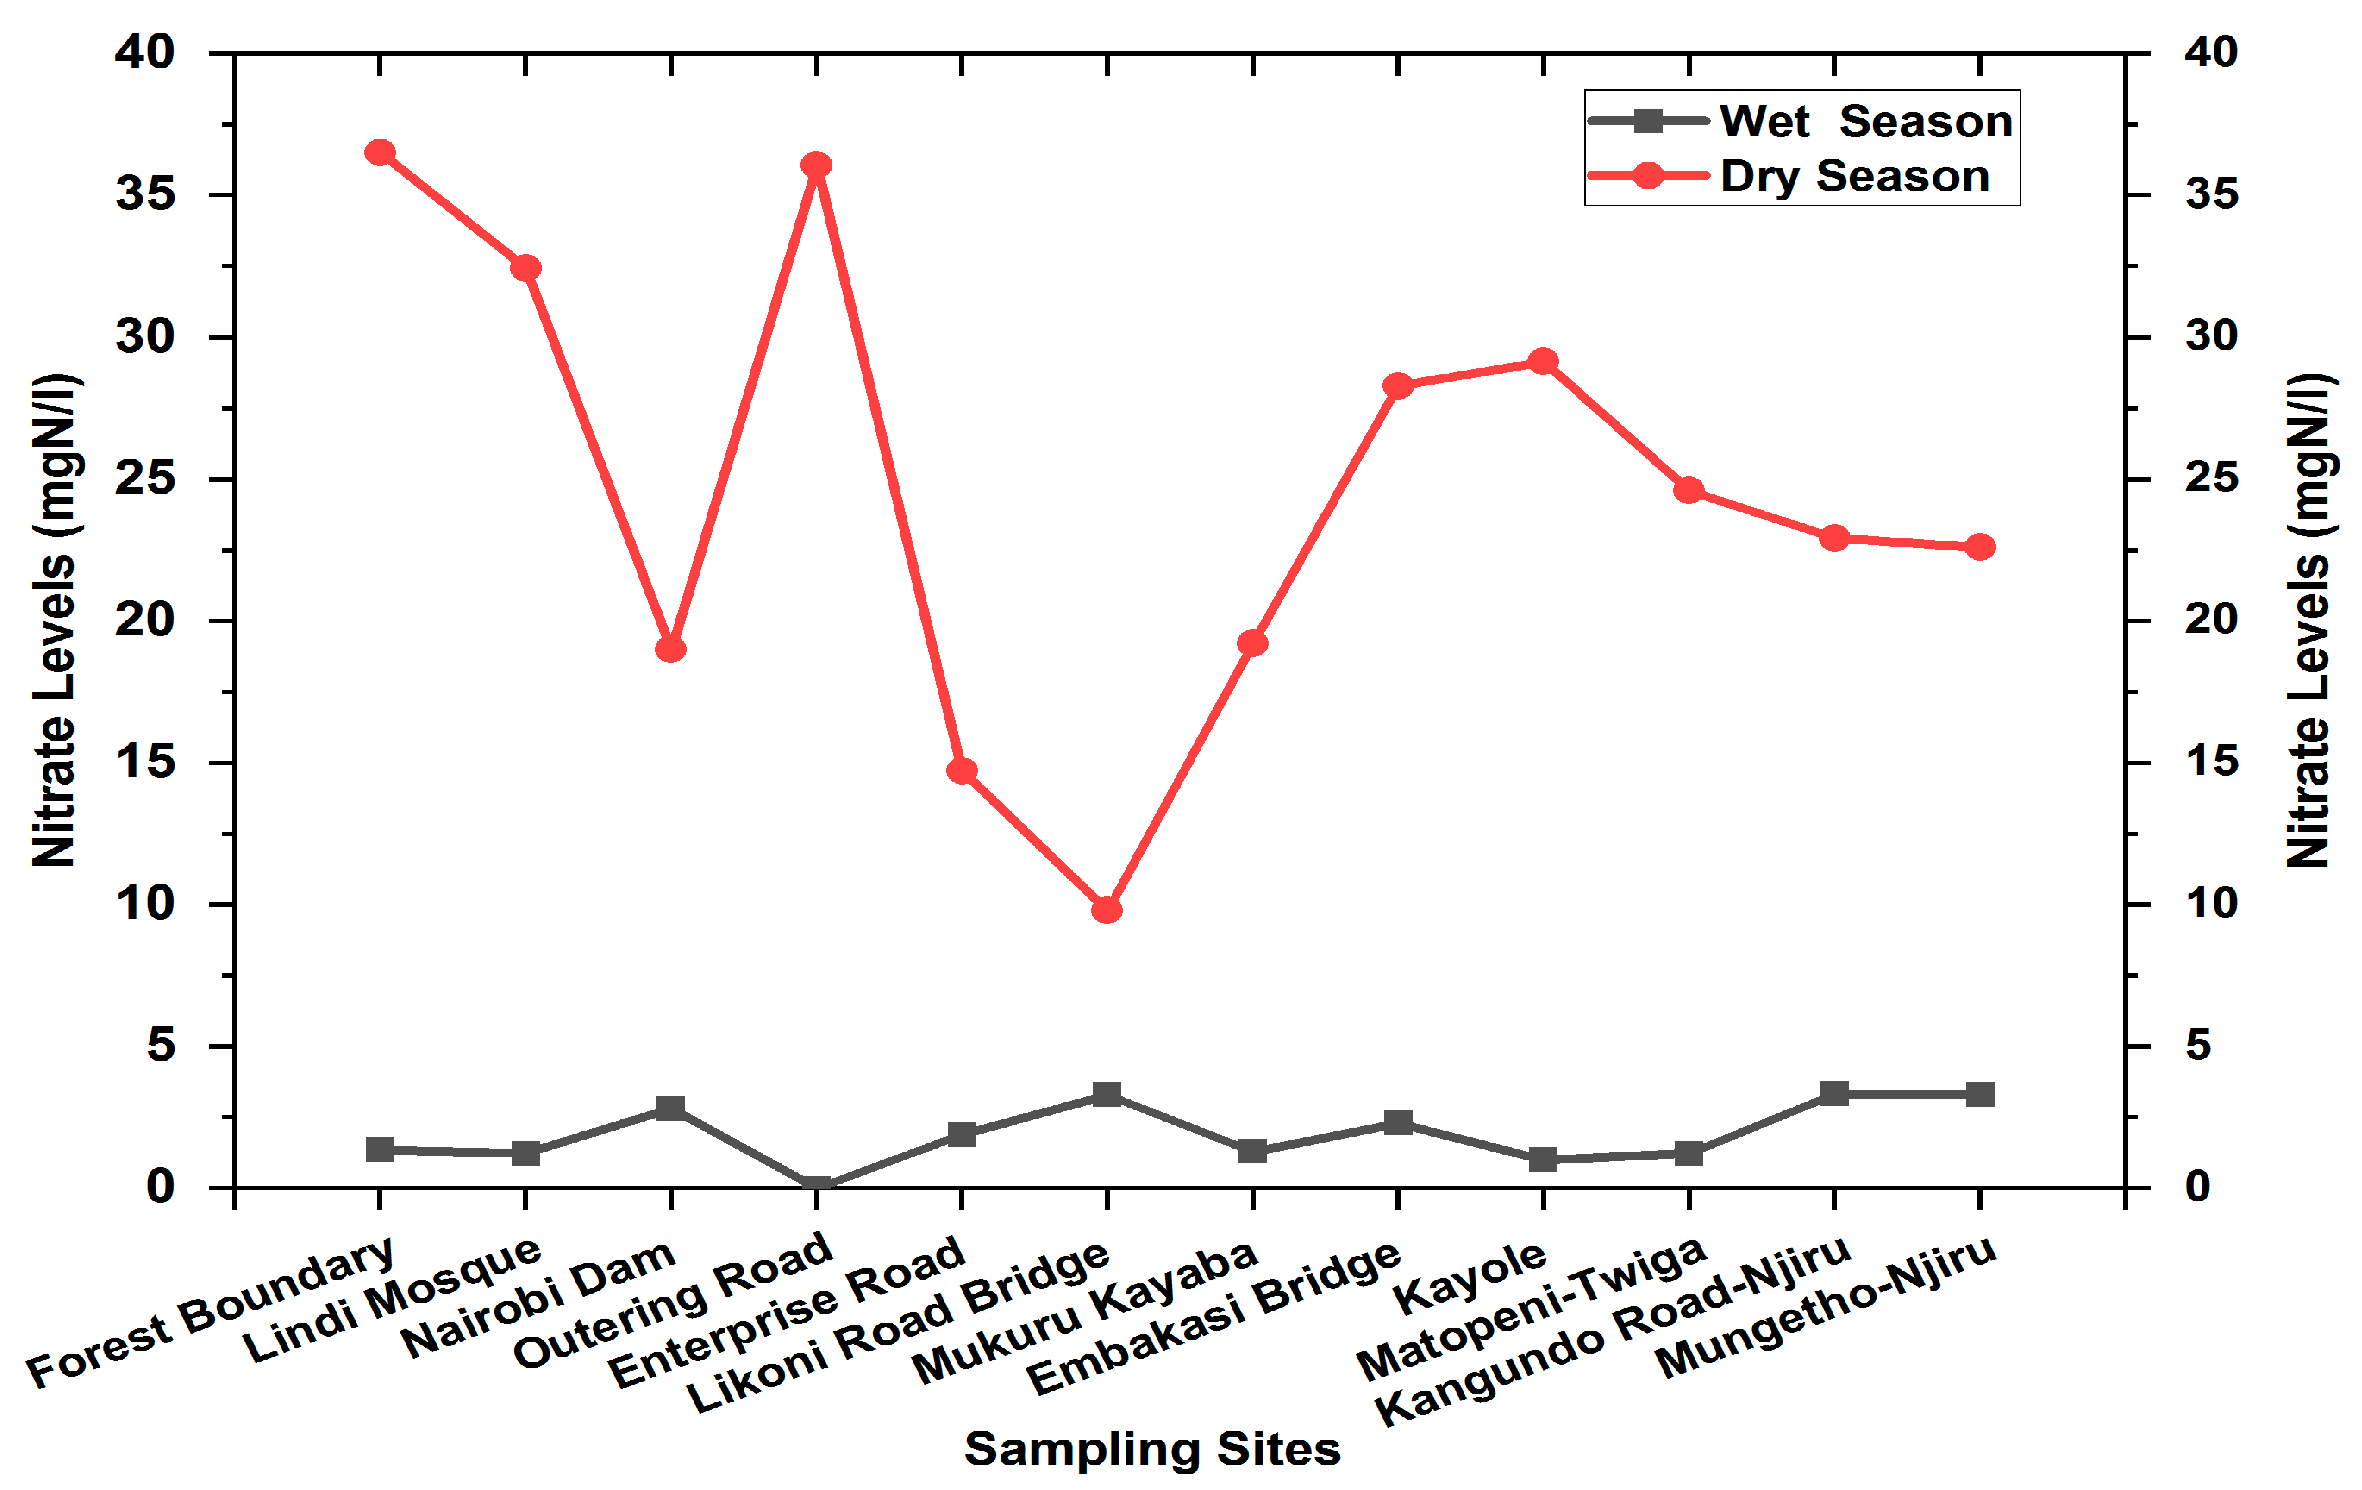
The nitrates levels in Ngong River are presented in Figure 7. Nitrate concentration for Ngong River water was low during the wet season in April. All sampled sites recorded levels below the NEMA and WHO standards for drinking water.
The levels ranged from ˂0.01 mgN/L at Outering Road to 3.33 mgN/L at Kangundo Road Bridge during the wet season. Nitrates in natural surface waters are normally below 5 mgN/L, since they are readily taken up by plants [21]. In 1998, Oyake [21] observed nitrates levels that ranged between 0.99 to 1.83 mgN/L for Ngong River, while Odipo in 1985/86 observed nitrates levels ranging between 0.1 to 1.61 mgN/L along Ngong River basin [27]. There does, however, seems to be an increase in nitrates levels in the two study periods by Oyake and Odipo [21,27]. This is because the nitrates concentration for the dry season ranged from 9.8 to 36.53 mgN/L along Ngong River. These levels were above the NEMA maximum permissible levels for drinking water of 10 mgN/L but below the WHO permissible levels of 50 mgN/L. The high levels recorded during the dry season could be because of the decreased volume of water in Ngong River as compared to the wet season when the dilution is high due to high volumes of water in the river. The river had a low recovery at 32% for nitrates downstream during the wet season (Table 4), indicating that less than 50% of nitrates were removed by self-purification of the river downstream. High nitrates levels also suggest river contamination due to sewage and waste water discharge, and industrial discharge. The high nitrate levels at the forest boundary could possibly be due to the decomposition of organic matter within the forest, as well as fecal waste from a large number of livestock that exist around the forest boundary.
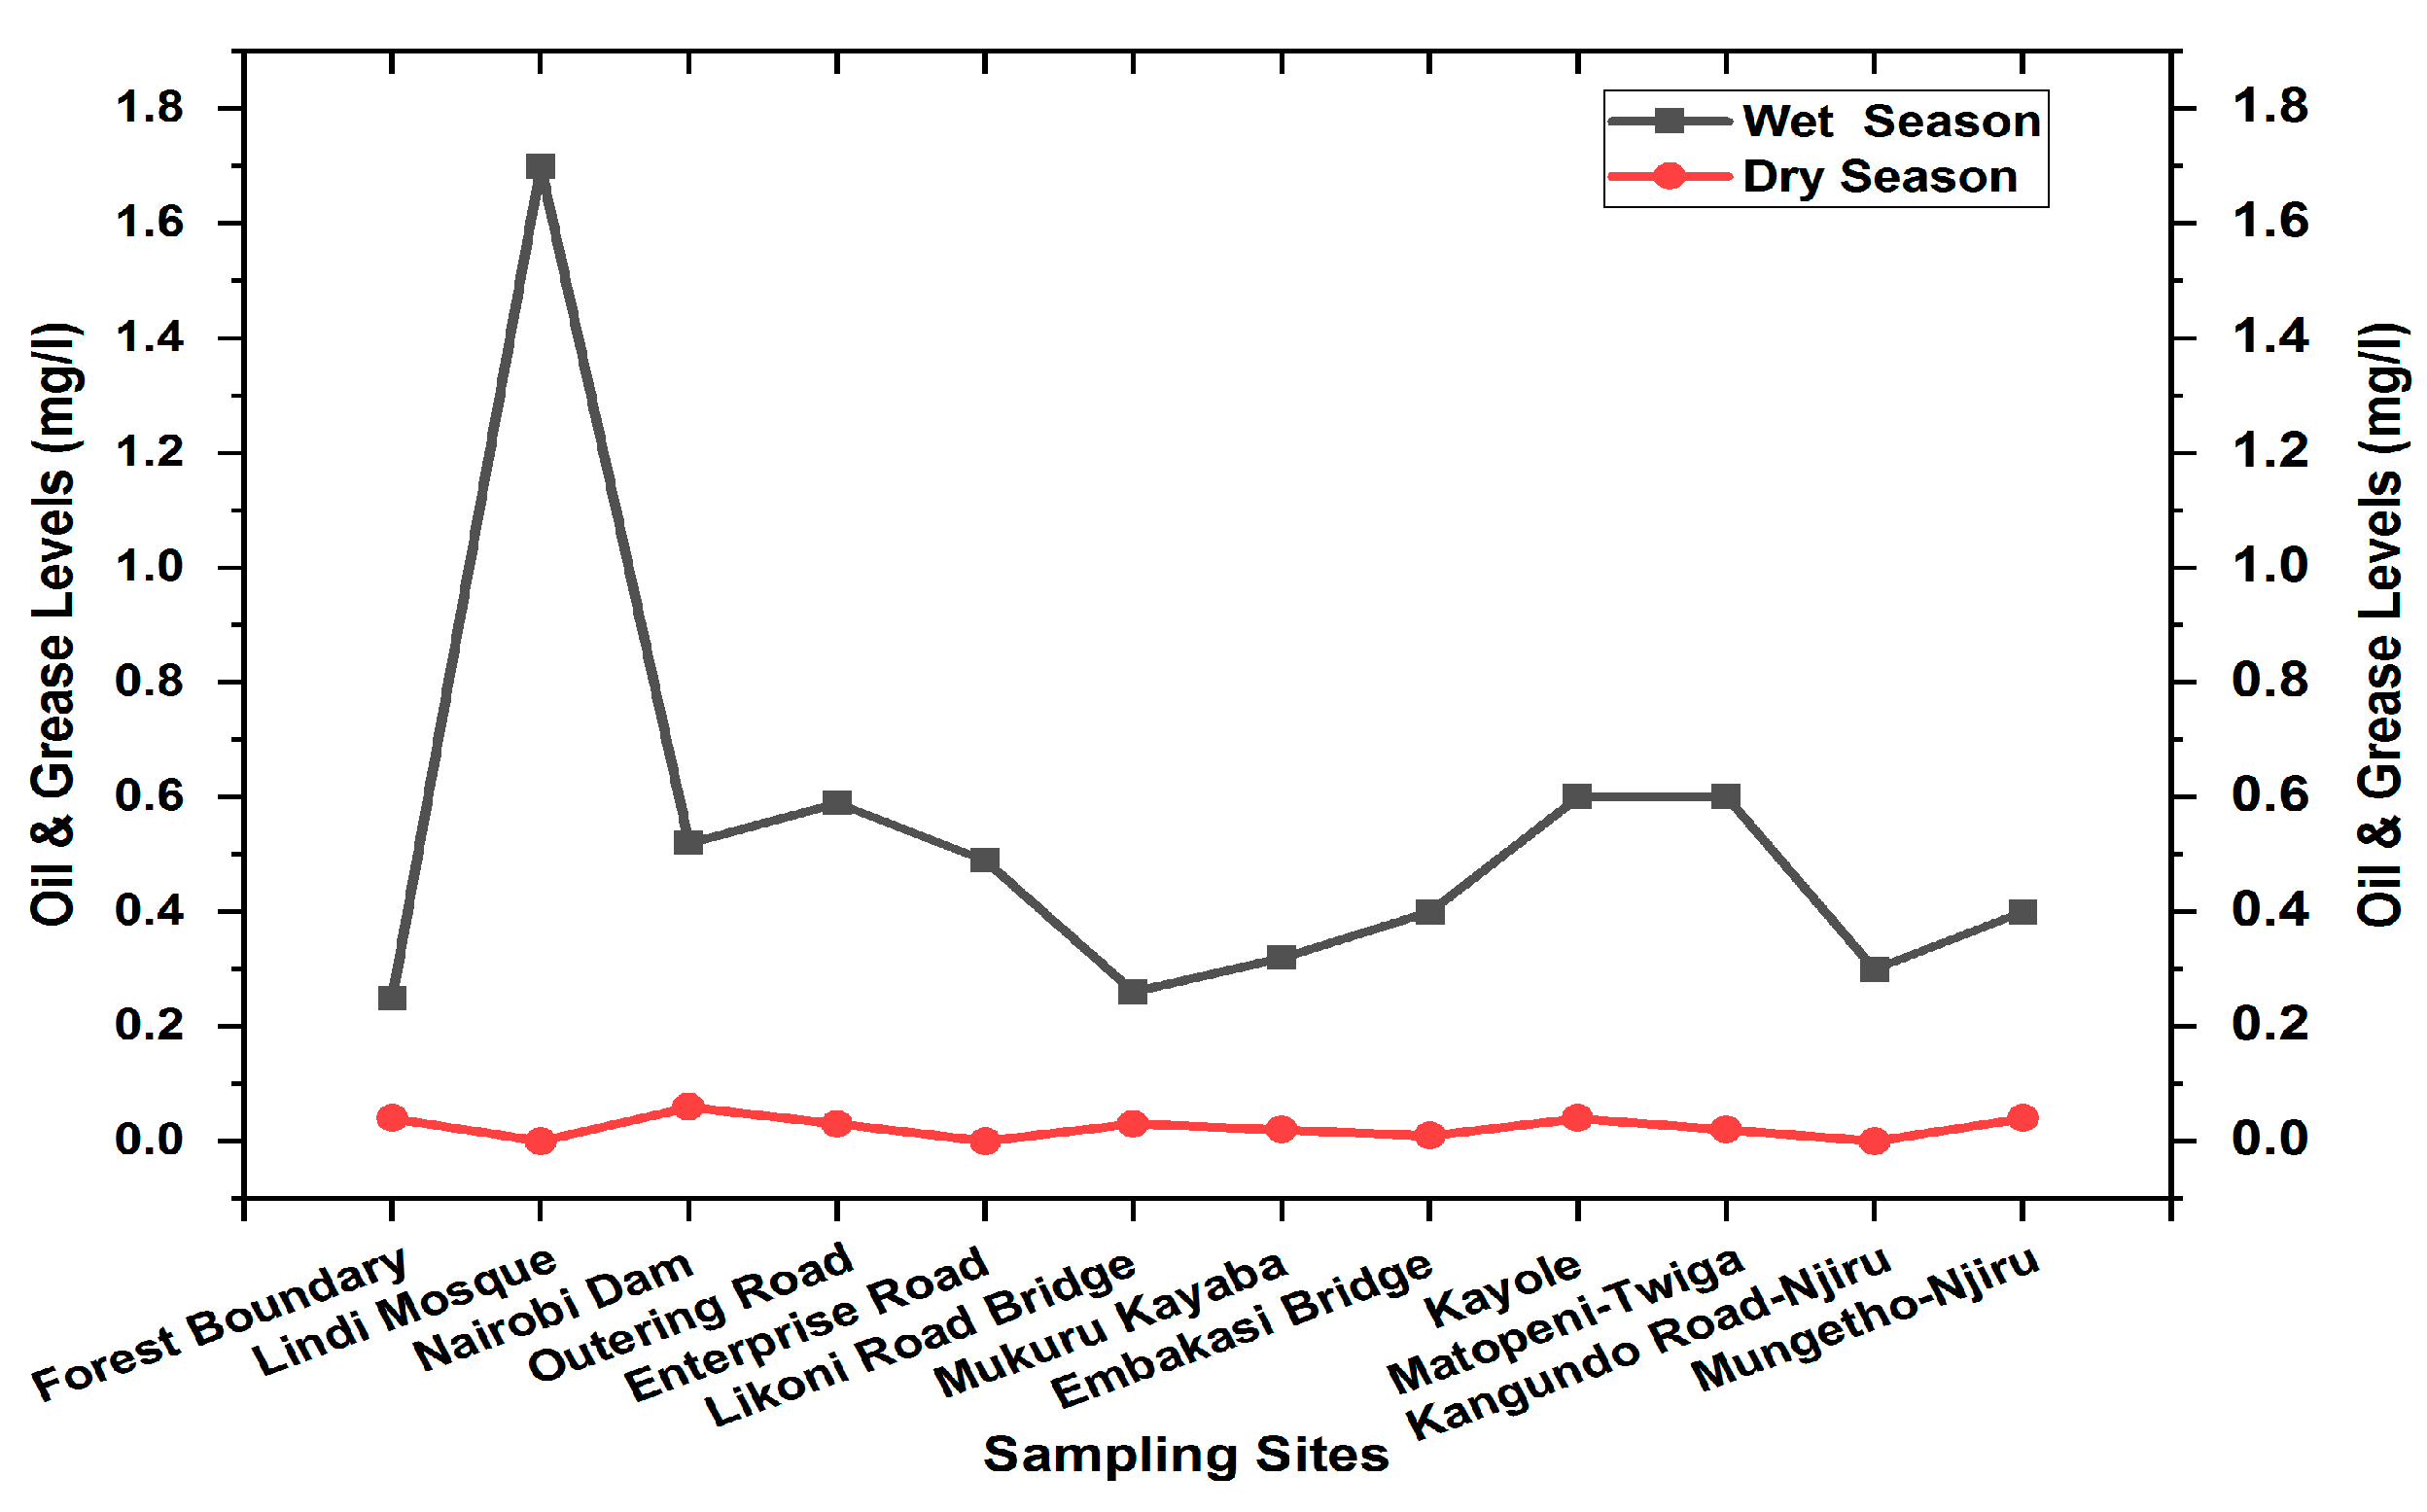
Oil and grease levels for Ngong River ranged from 0.25 mg/L to 1.7 mg/L during the wet season and from 0 to 0.06 mg/L during the dry season. The oil and grease levels were relatively high during the wet season as compared to the dry season. The highest value of 1.7 mg/L was recorded at Lindi Mosque in Kibera, indicating contamination of the river water. This could be from the ongoing road construction works near Ngong River at Lindi Mosque. The levels of oil and grease for Ngong River are presented in Figure 8.
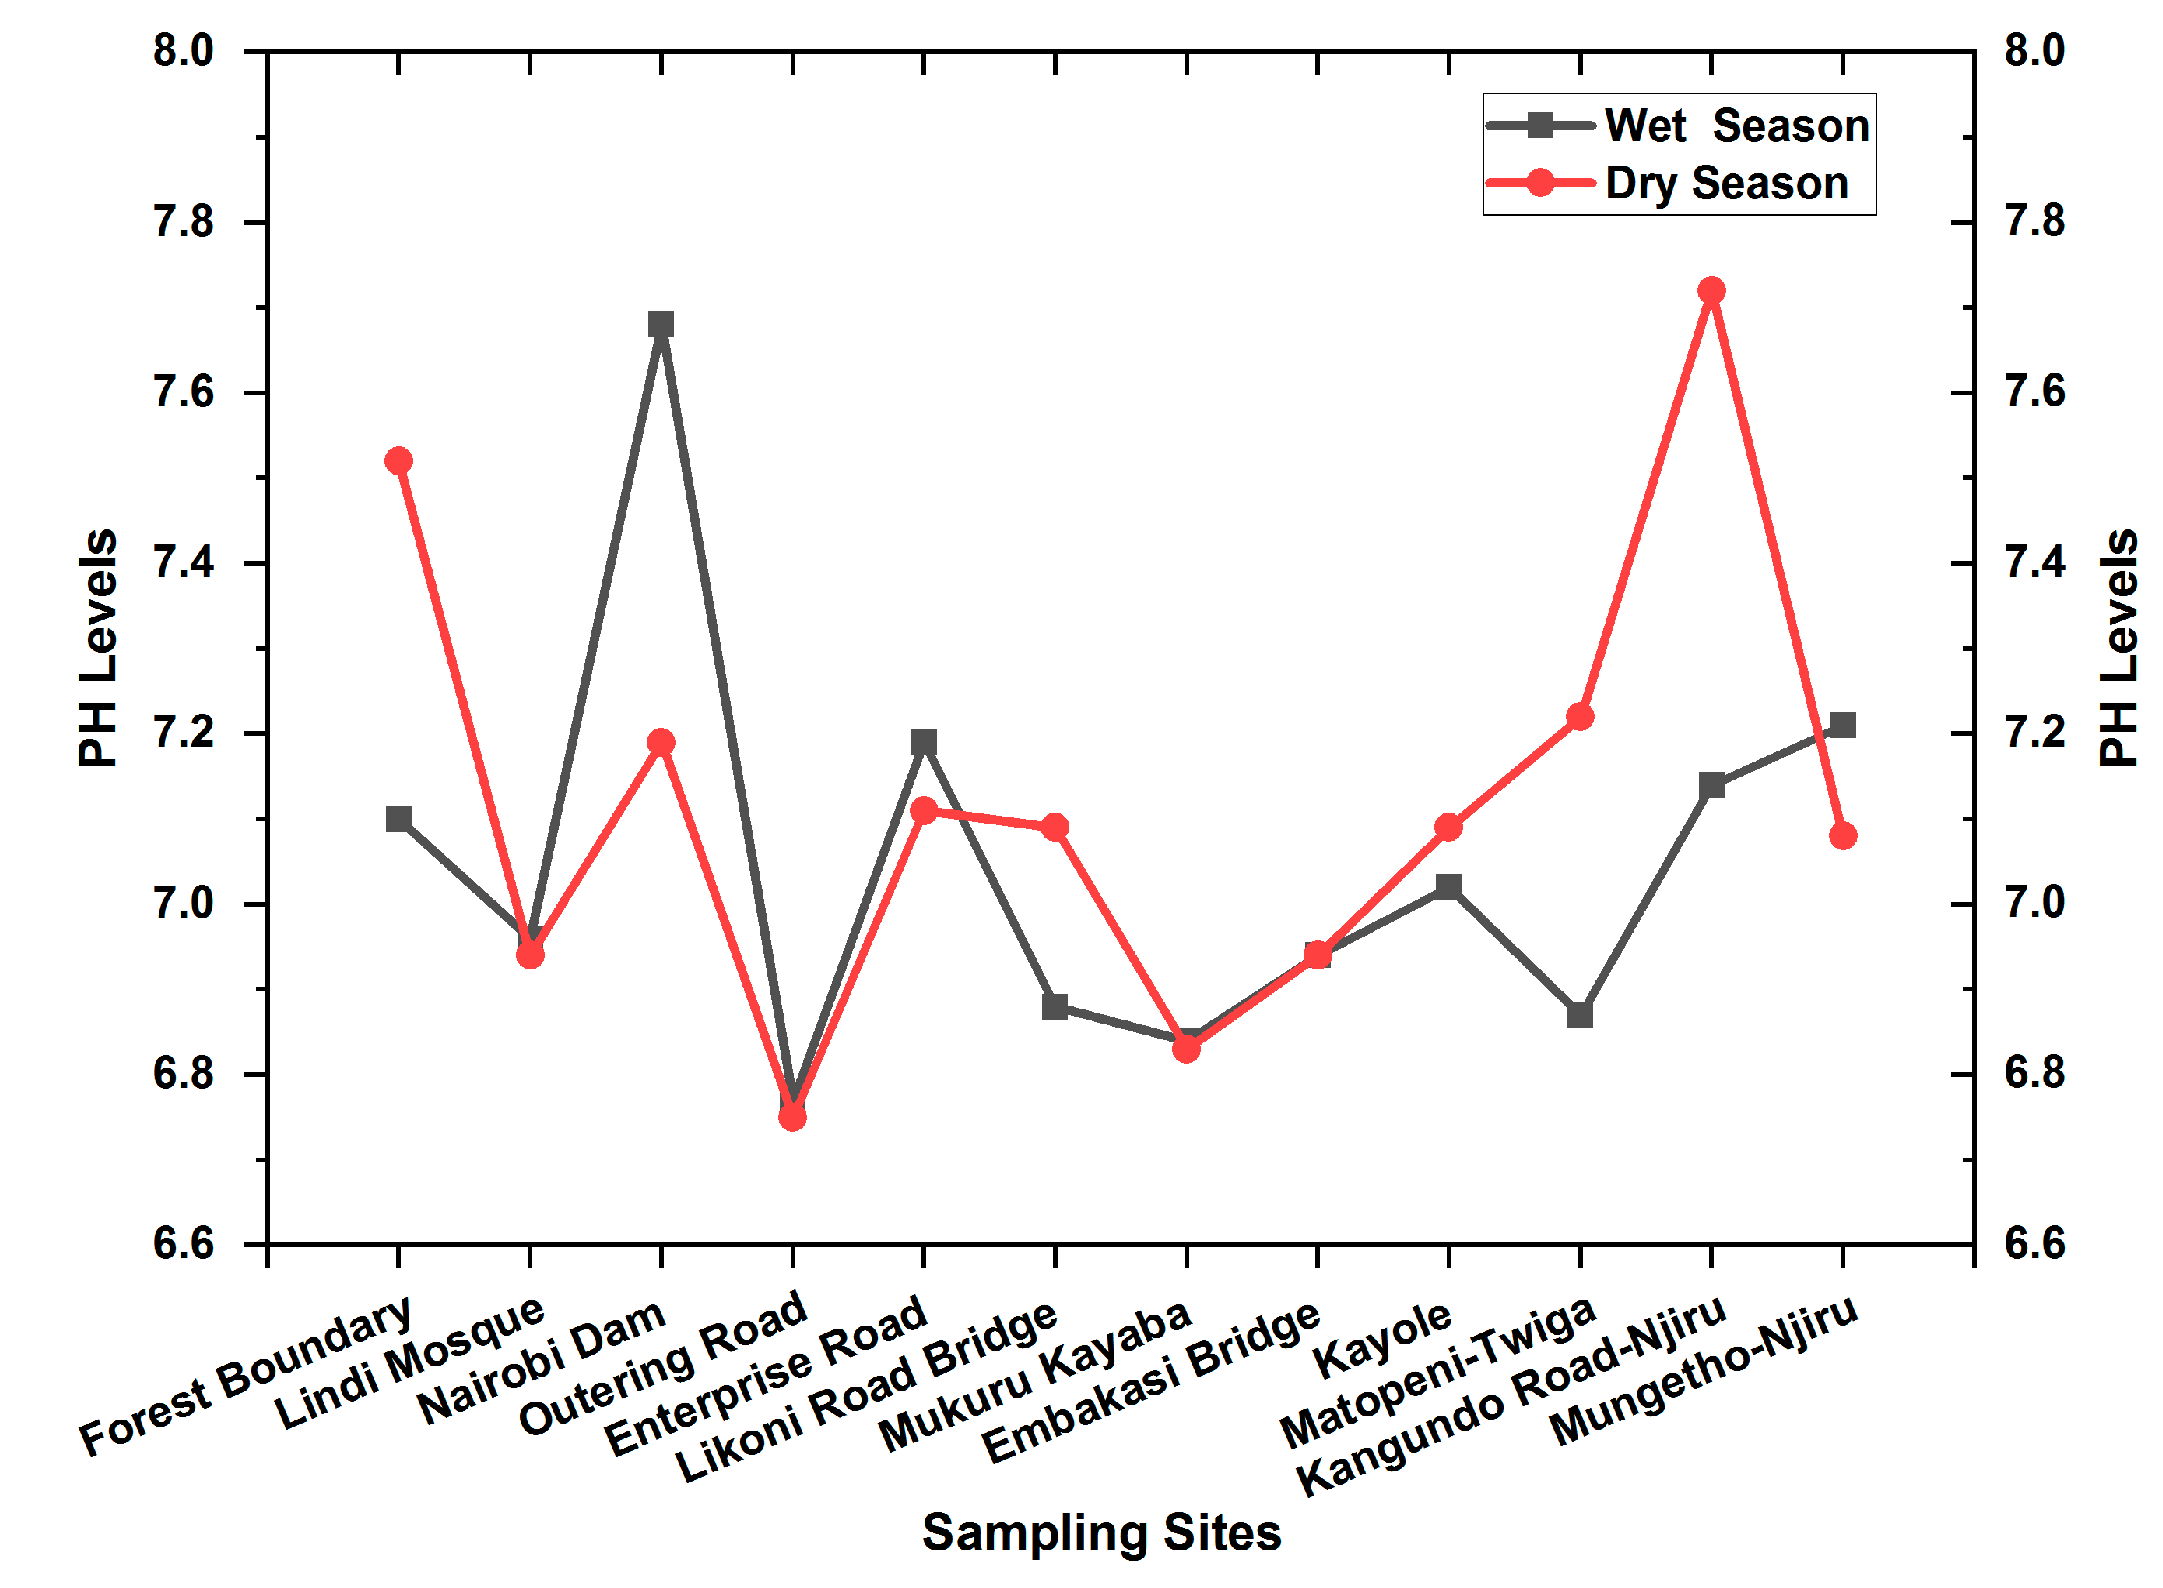
The pH levels for Ngong River ranged between 6.77 and 7.68, and between 6.75 and 7.72 (Figure 9), during the wet and dry seasons, respectively. The levels of pH were within the NEMA and WHO drinking water standards of 6.5 to 8.5 and ˂8, respectively. This also shows that domestic and industrial effluents discharged into Ngong River were within the standards for effluent discharge and had little or no effect on the river pH. The neutral pH in the water indicates that Ngong River’s water is not corrosive and is unlikely to affect biological and chemical processes in the water.
The pH values for Ngong River were consistent with those previously recorded, which ranged between 6.8 and 7.6 [27]. The temperature values for Ngong River ranged from 22.2 °C to 23.2 °C during the dry season and 20.1 °C to 20.5 °C during the wet season. This suggests that anthropogenic activities along Ngong River had little or no effect on the river’s water temperature, as it was relatively room temperature across the basin.
The total dissolved solids levels in Ngong River ranged from 195 mg/L to 589 mg/L during the wet month and 316 mg/L to 782 mg/L during the dry month. Generally high TDS values were observed during the dry month, while low TDS values were observed during the wet month, possibly due to a dilution effect resulting from the heavy rains, while the high TDS values recorded during the dry months were due to the evaporation effect, causing increased concentrations during dry weather. High TDS values during the wet season were recorded at Nairobi dam, Silanga, in Kibera, where farming took place at the encroached part of the dam. Such high TDS concentrations could be attributed to the probable use of fertilizers for farming at the dam, which may add a variety of ions into this part of the dam. An increasing trend was observed for TDS levels along Ngong River, especially during the dry season, which could be due to organic waste matter both from sewers and leachates rich in phosphates, and nitrogen compounds from dumpsites and informal settlements established at the various sampling stations along the entire river basin. There was an observed relationship between TDS levels and levels of nitrate ions, whereby when nitrates levels were high, TDS values were also high, as can be seen in Table 4 and Table 5. The TDS levels recorded during the dry and wet seasons in all the sampling sites are also presented in Figure 10.
The total dissolved solids levels for Ngong River observed at all sampling stations were below the NEMA and WHO maximum permissible levels in drinking water of 1200 mg/L and 1000 mg/L, respectively. The recorded TDS levels were also below NEMA’s maximum permissible level for effluent discharge into the environment, suggesting that TDS was less or hardly affected by the prevailing human activities, making it less risky (for agricultural or domestic use) as far as TDS is concerned.
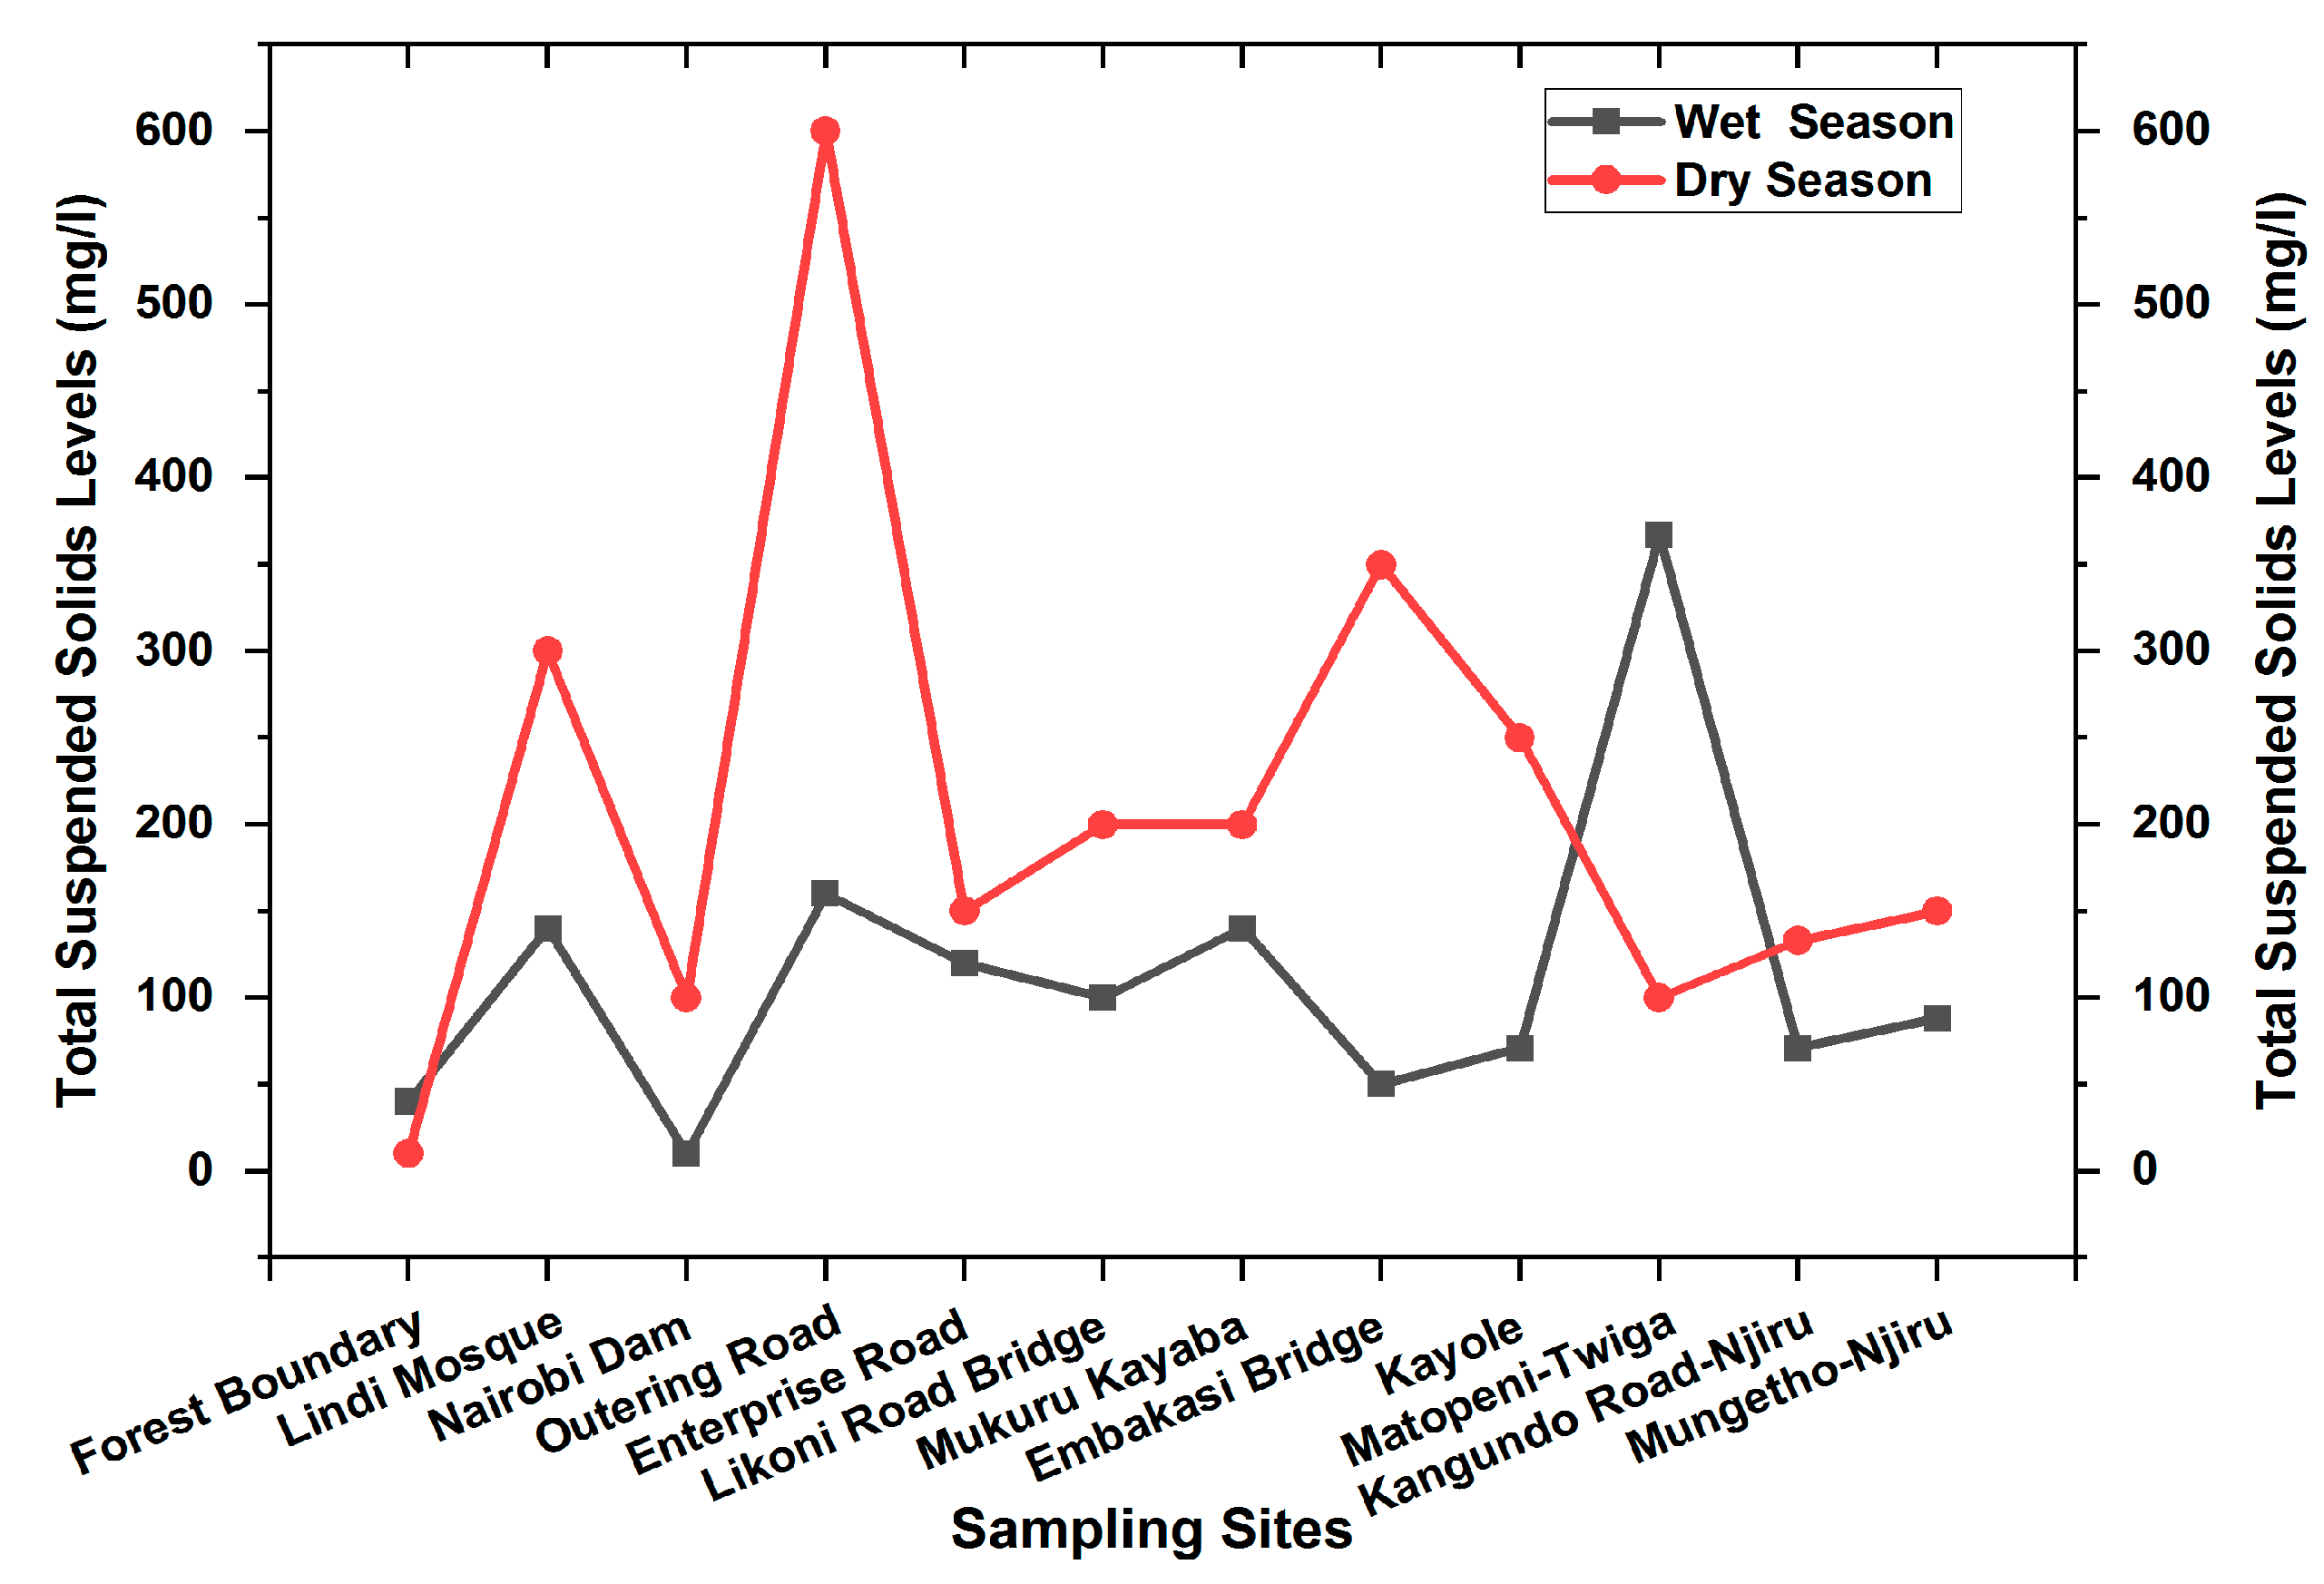
The total suspended solids levels for Ngong River ranged from 10 mg/L to 600 mg/L during the dry season and 10 mg/L to 367 mg/L during the wet season. The lowest TSS values of 10 mg/L were recorded at Nairobi dam during the wet season and at Ngong Forest boundary during the dry season. The comparatively lower TSS values observed in Nairobi dam could be attributed to possible purification by the settling effect of the substances onto the dam. The values differed significantly for various stations, with the highest value of 600 mg/L being observed at Outering Road bridge during the dry season. Matopeni downstream had a higher value recorded for the wet season at 367 mg/L, which could be attributed to the effects of domestic waste, erosion and runoff; however, this level reduced to 71 and 88 mg/L at Kangundo Road Bridge and Mong’etho, respectively, during the wet season, indicating river recovery due to dilution. The TSS levels for Ngong River were lower during the wet season as compared to the dry season. This indicates that most suspended solids in Ngong River were as a result of industrial effluent discharges as compared to the heaped garbage which is usually washed off into the river during the wet season. This is supported by the highest value observed at Outering Road of 600 mg/L during the dry season. The total suspended solids levels for Ngong River are presented in Figure 11.
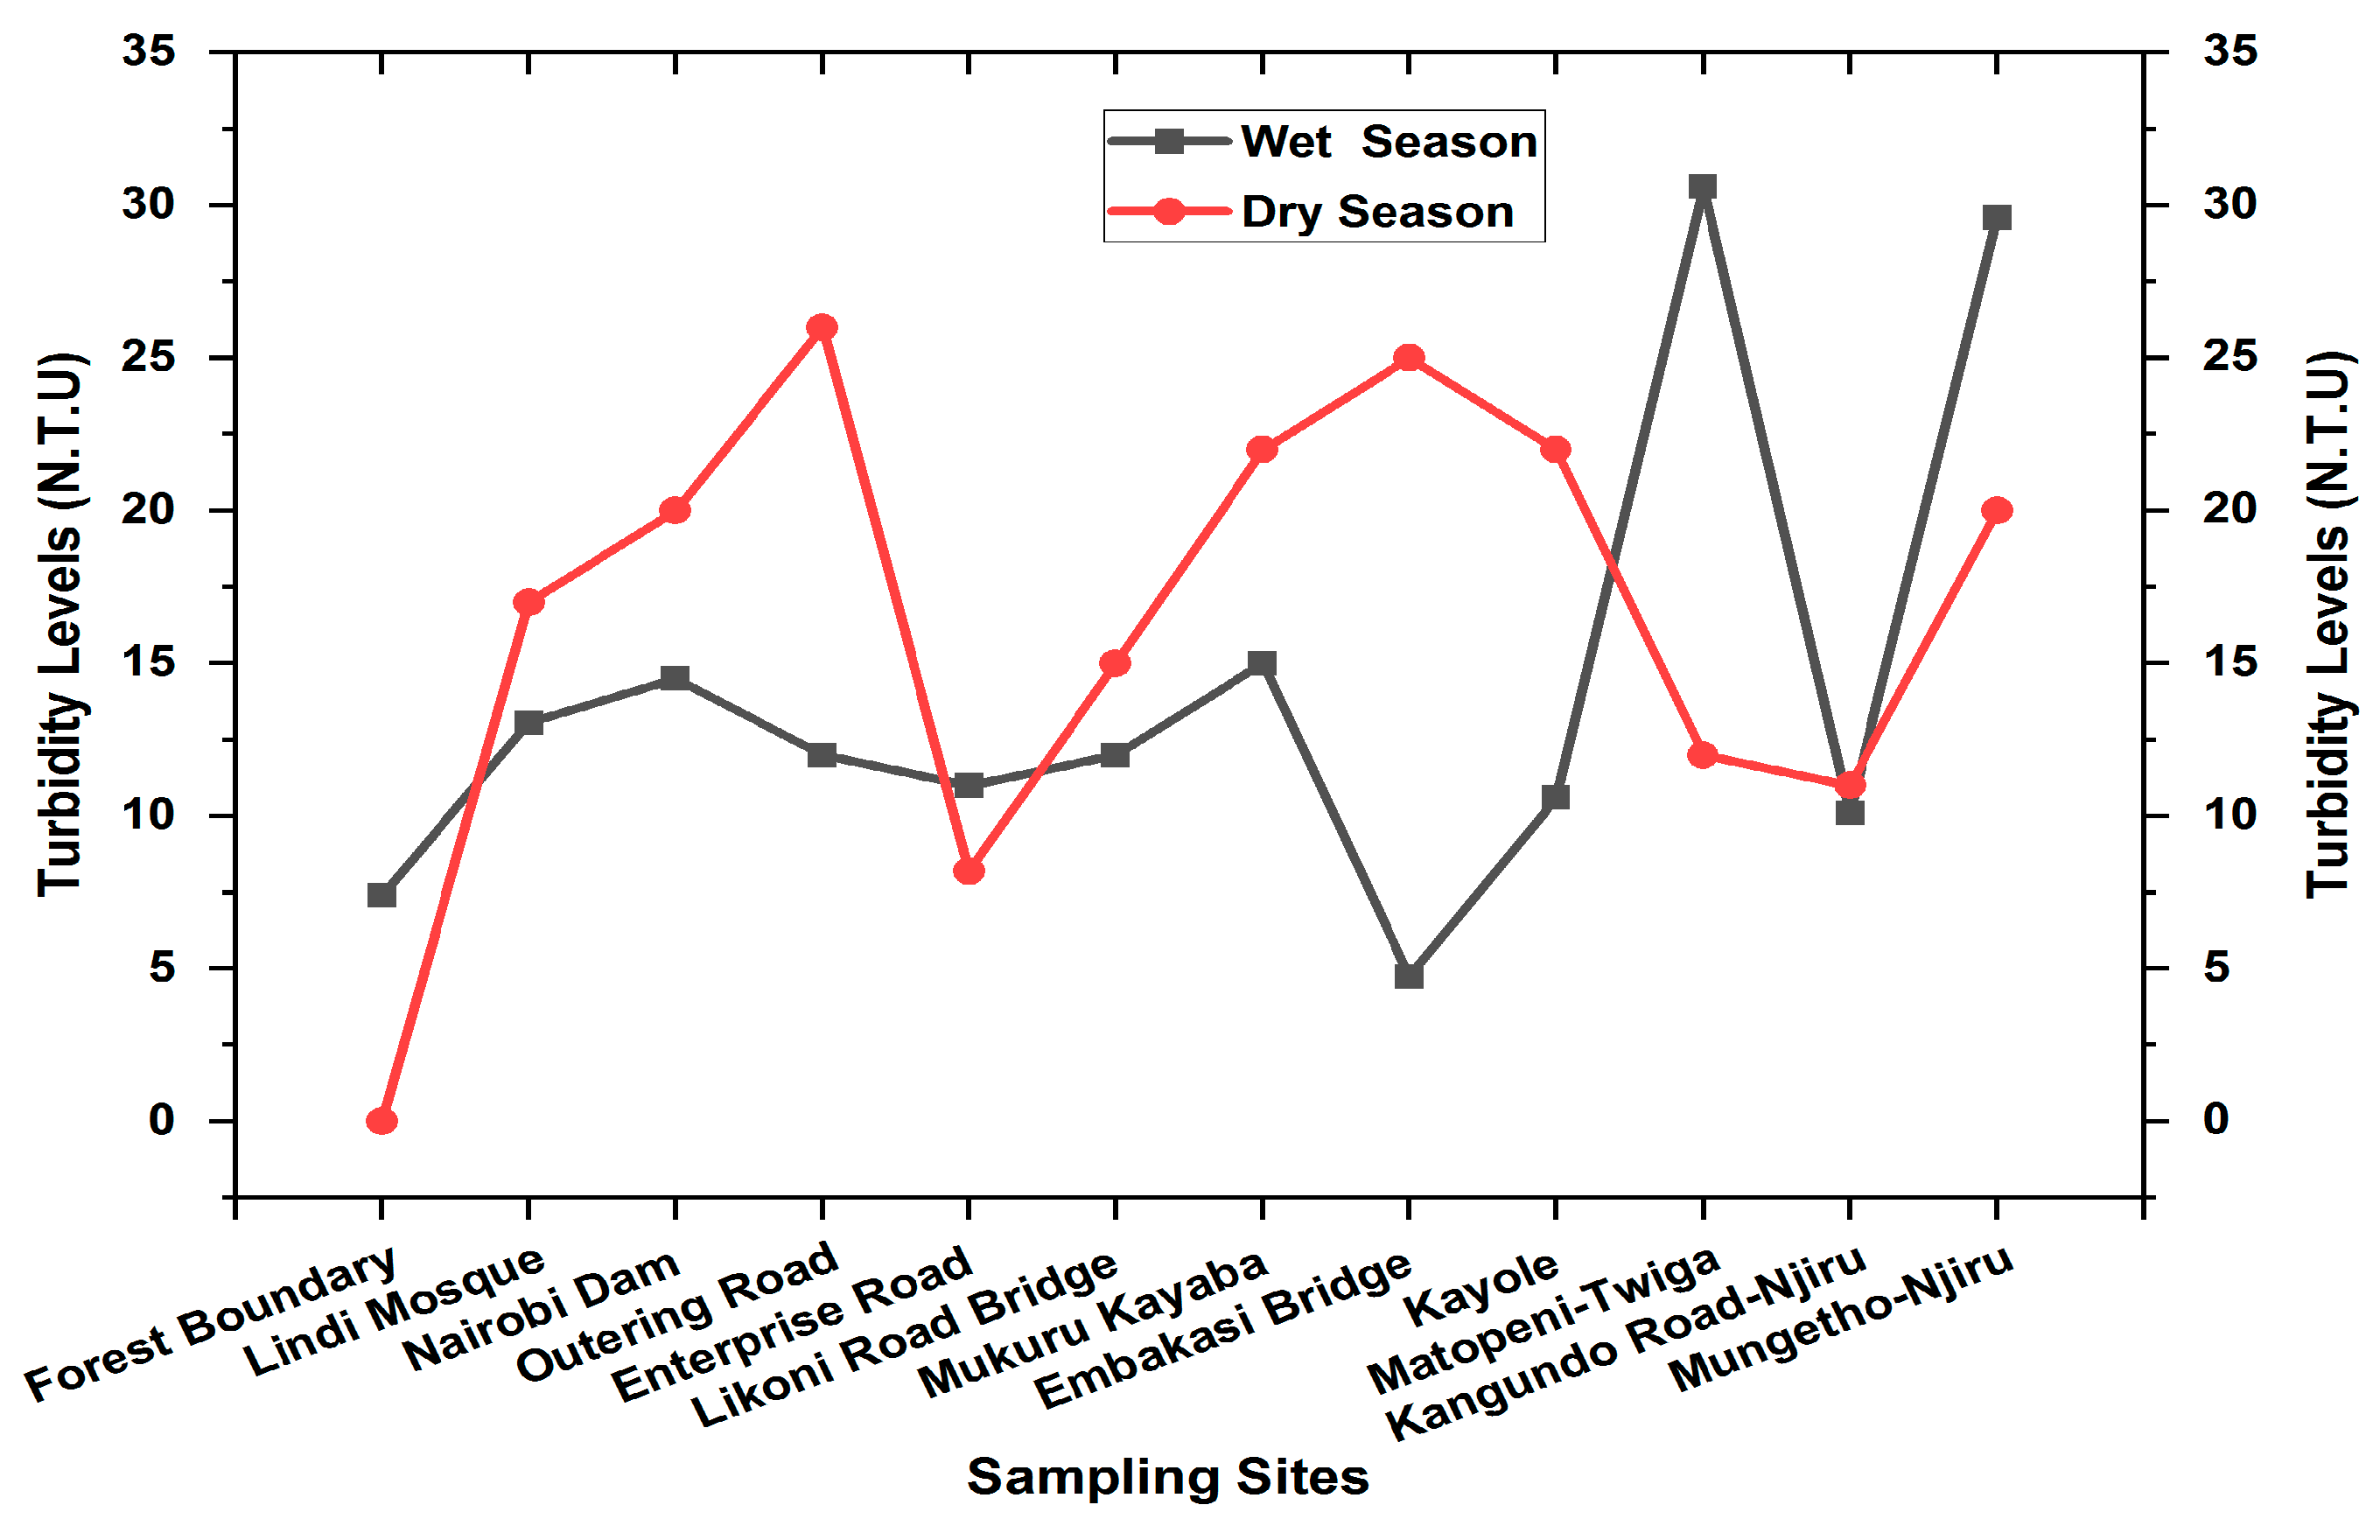
Except for Ngong Forest Boundary, all other sampling stations had total suspended solids levels above the NEMA maximum permissible level for drinking water of 30 mg/L. Turbidity levels for Ngong River ranged from 4.75 NTU to 30.6 NTU during the wet season and 0 to 26 NTU during the dry season. Turbidity levels at Ngong Forest boundary were below the detectable limit (ND) during the dry season, probably due to low levels of water and the settling of suspended solids. The water was more turbid at Outering Road 26 NTU during the dry season, while at Matopeni high turbidity levels were observed during the wet season due to the high level of total suspended solids (367 mg/L) recorded at the same station. At Ngong Forest boundary, the total suspended solids were 10 mg/L below the NEMA drinking water standards of 30 mg/L; hence, no turbidity was detected during the dry season. However, the turbidity levels observed downstream during the wet season could be attributed to the high level of suspended solids due to the erosion of particles into the river. The turbidity levels are presented in Figure 12.
The turbidity levels at all the sampling points exceeded the WHO maximum allowable limit of 5 NTU for drinking water for the wet season (Table 1). During the dry season, turbidity levels were high above 5 NTU except for Ngong Forest boundary (Table 2), which was below the detectable limit (0). It is worth noting that turbidity has been found to affect aquatic life.
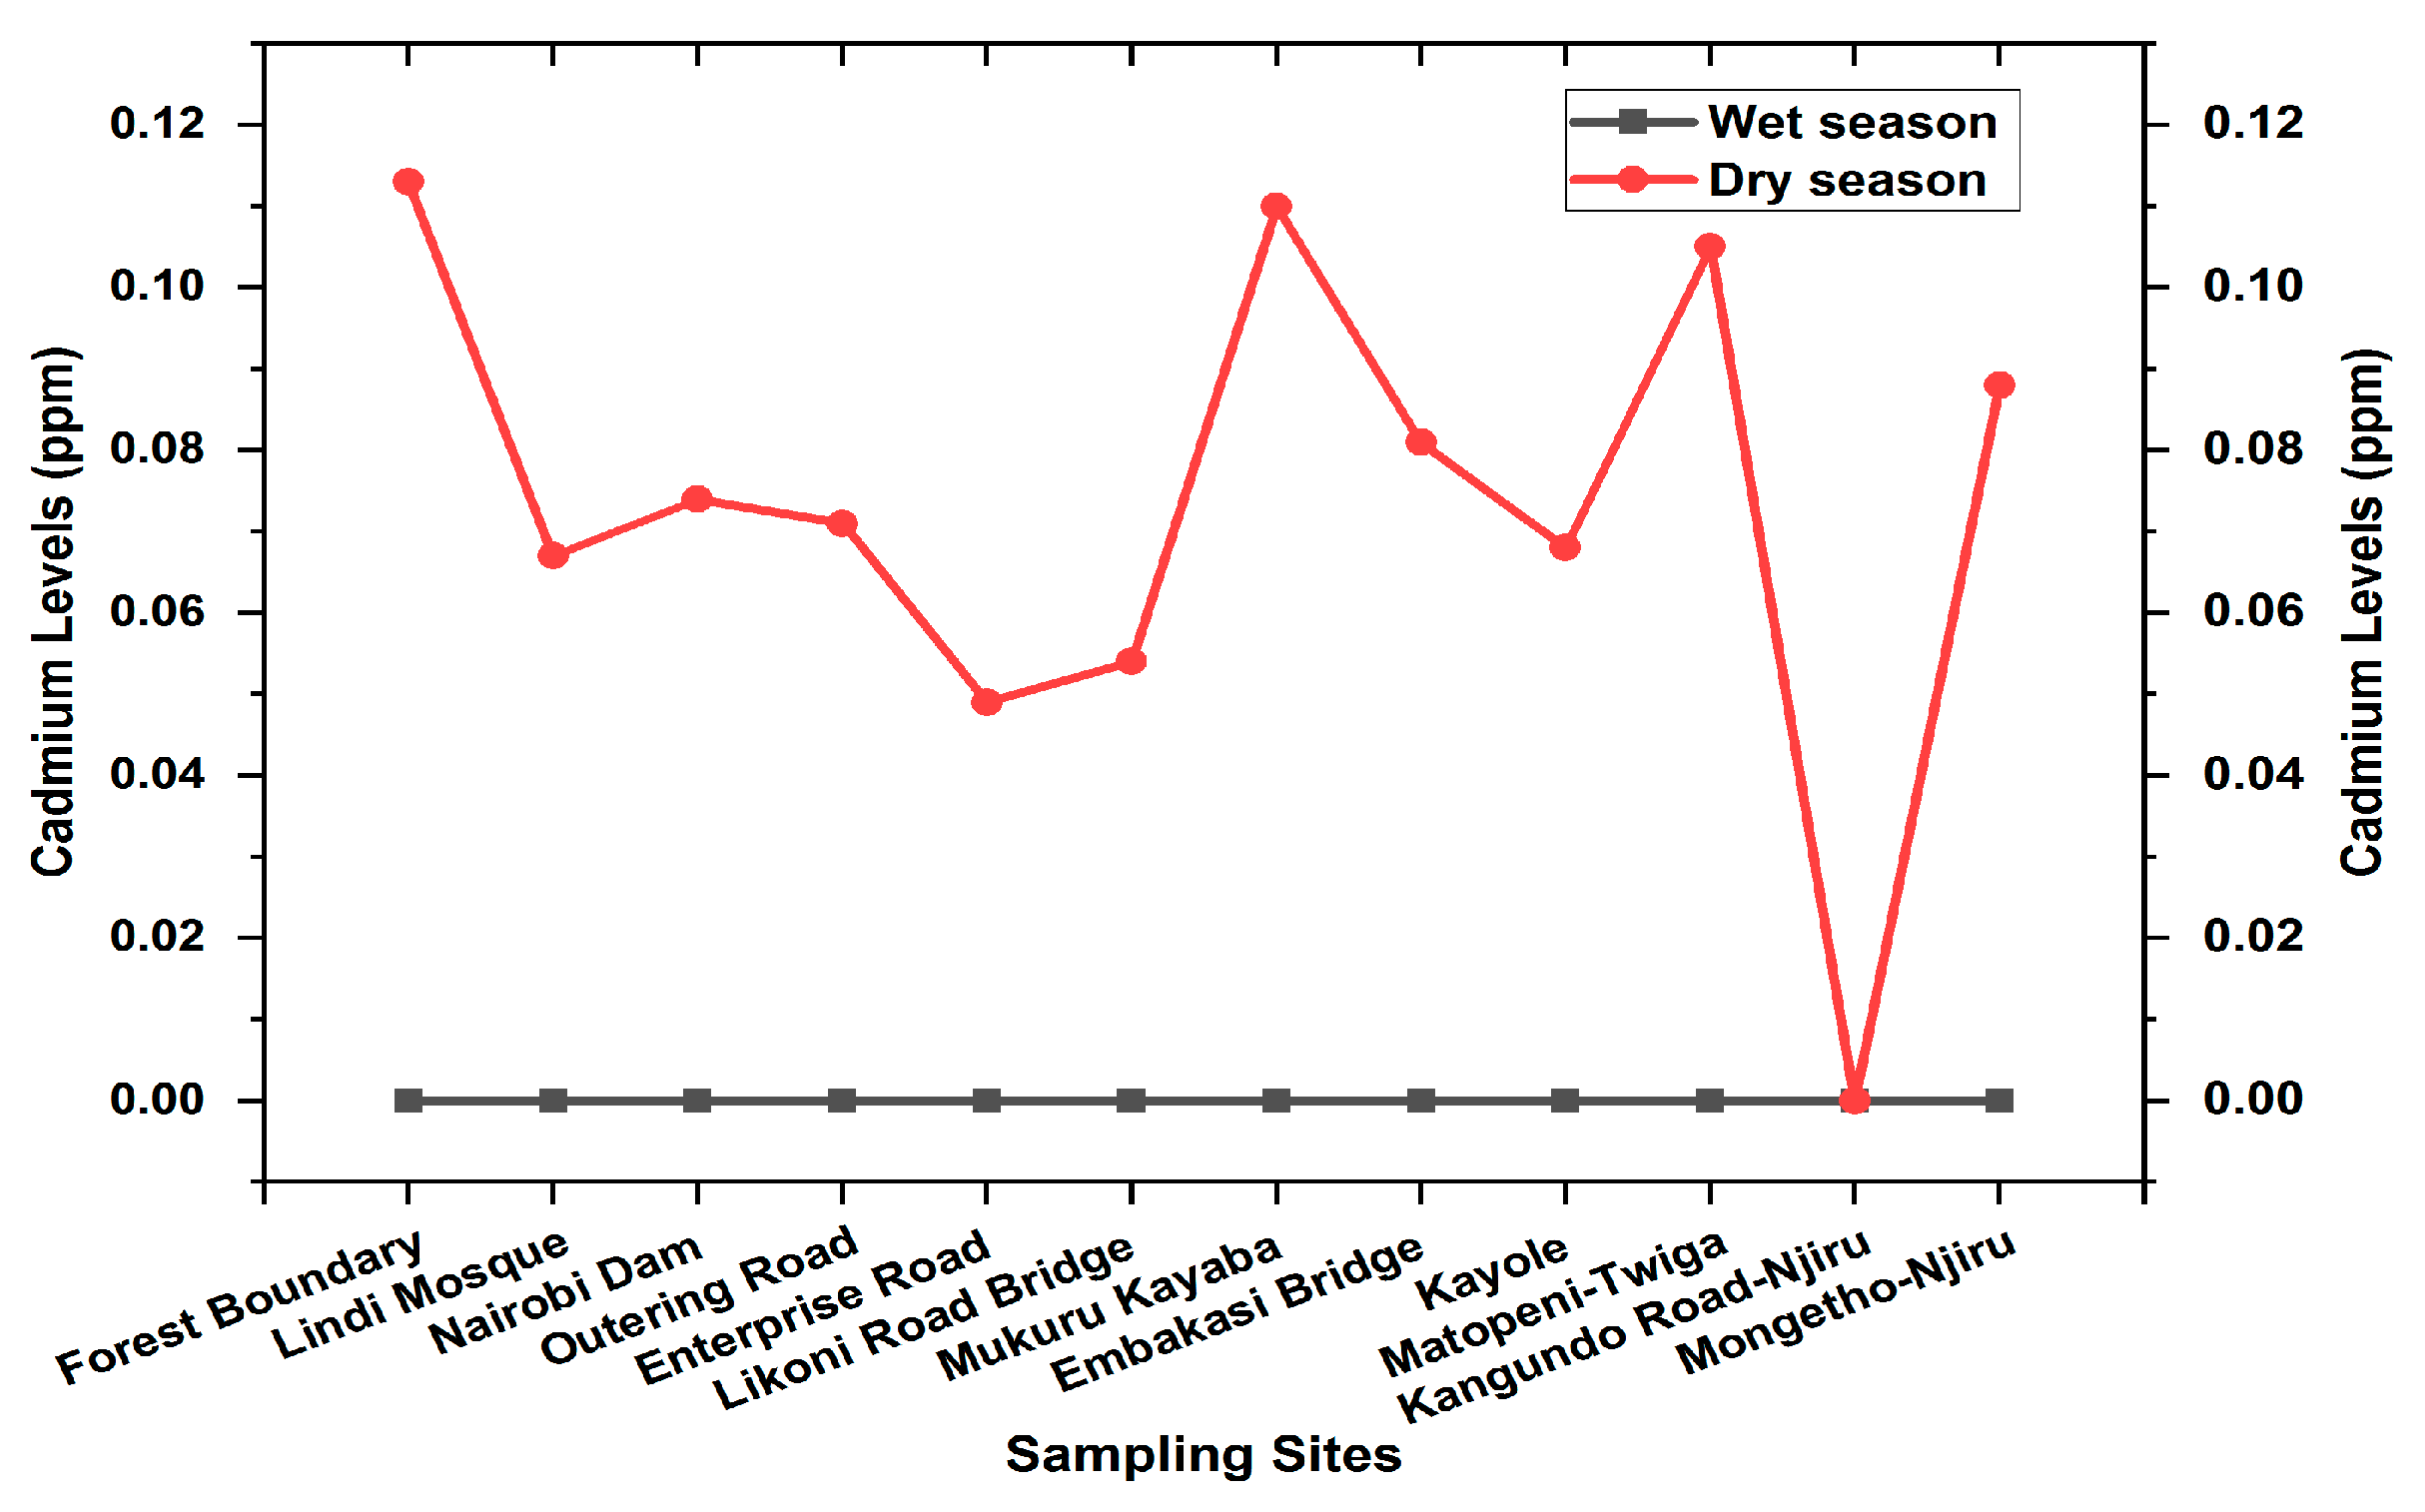
Lead and cadmium concentrations for Ngong River were below the detectable limit of 0.001 ppm during the rainy season. Lead was below the detectable limit in the dry season, while cadmium concentrations ranged from 0.049 ppm at Enterprise Road to 0.113 ppm at Ngong Forest boundary, indicating the upstream pollution of Ngong River with heavy metals. Meanwhile, there is a higher tendency of lead being retained in sediments than being released into the water column, which was illustrated by a negative correlation of Pb in water and Pb in sediment in a study in Ona River, Ibadan South west Nigeria [25]. Moreover, Netpae and Phalaraksh [28] reported that sediments hold a very large percentage (up to 99%) of the total quantity of a metal present in an aquatic system. This could explain why the Pb levels were below the detectable limits for Ngong River. There could also be a possibility of material substitutes of Pb containing raw materials with others which do not contain lead; this is an area that needs future research.
The presence of high cadmium concentration levels of 0.113 ppm at Ngong Forest Boundary, 0.11 ppm at Mukuru Kayaba and 0.105 ppm at Matopeni during the dry season could be attributed to the inputs of Cd from anthropogenic activities such as domestic waste discharge into the river. All three sites coincided with informal settlements. Nordberg et al. [29] reported sewage from industrial and municipal areas as major sources of Cd into the fresh water system. Additionally, mining, industry, agriculture and the application of fertilizers and sewage sludge have been found to be the main sources of Cd contaminants [30]. Based on these reports, direct sewer discharge into the river at Mukuru Kaiyaba, and the existence of an abandoned quarry site at Matopeni, may explain the high Cd levels observed in these sites.
All sites sampled for Ngong River except for Kangundo Road during the dry season had levels of Cd exceeding the WHO and NEMA maximum allowable limit of 0.003 ppm and 0.01 ppm, respectively, for drinking water (Figure 13). This indicates high levels of pollution rendering the water unfit for domestic and agricultural use. This is because Cd is a heavy metal, which is highly carcinogenic with adverse effects on human health. Heavy metals also bioaccumulate up the food chain; hence, in plants, concentrations may be relatively higher, which accumulate further due to human consumption. Ngong River water is used for urban farming in the Maili Saba area of the Kibera slums [31]. This implies high concentrations of heavy metals in the human body, thus affecting human health for those drinking the water or consuming the crops grown using the contaminated water [32,33].
The river recovery capacity (RRC) and the accumulation factor (AF) of the physicochemical parameters during the wet and dry sampling periods are presented in Table 6 and Table 7.
The trend in the accumulation factor of parameters indicated that the BOD of downstream water was 24 times more than the value observed upstream for the wet season and 42 times for the dry season. The COD of water downstream was six times more than the value observed upstream during the wet season and 23 times more for the dry season. The E. coli and total coliforms trend showed the highest accumulation factor of 6724 times and 9734 times, respectively, more than upstream values observed for the wet season. The trend in accumulation factor for E. coli and total coliforms depicted that these parameters accumulated significantly during the dry season, with E. coli of water downstream being approximately one million times more than the value observed upstream, and the total coliforms AF value approximately one hundred thousand times more than upstream values. The TSS trends revealed a significant build up with an AF of 3 and 23 times more downstream than upstream levels during the wet and dry season, respectively. The other parameters revealed an average AF of 2. The accumulation factor for most of the parameters indicated increased values downstream as compared to the reference point upstream and was clear evidence of anthropogenic influence on the water quality.
There was a significant recovery of Ngong River from several physicochemical parameters: BOD (95% and 97%), COD (84% and 95%), E. coli (99%), total coliforms (99%), TSS (67% and 95%) and turbidity (50% and 100%) for the wet and dry season, respectively. E. coli and total coliforms had the highest recovery value of 99% during both seasons. Turbidity had the highest recovery of 100% for the dry season. There were low recovery values for conductivity (32%), nitrate (32% and −55%), pH (−0.7% and −6%) and temperature (3% and 0%), suggesting little/no change in the values downstream compared to the values recorded upstream, particularly for nitrates and pH. Oil and grease had a high recovery value of 55% during the wet season and a low recovery value (−100%) for the dry season. There was no change in temperature downstream compared to upstream levels. The high recovery values observed for some parameters, particularly during the wet season, suggest that the corresponding or influencing substances were being released into the Ngong River in quantities lower than the removal carrying capacity of this river. The lower levels of these influencing substances do not surpass the river recovery capacity for the low recovery values recorded for some parameters, especially during the dry season; vice versa is true [25].
The water quality parameters varied at different study sites and during different seasons. The variations were mostly as a result of the anthropogenic activities at different sampling sites (spatial) and temporal variations during the different season. The pollution levels were low at the source (Ngong Forest boundary) due to fewer anthropogenic activities, while the levels increased due to discharges from the human settlements and industrial establishments along the river channel. Pollution levels were alarming during the dry season due to the concentration of pollutants due to evaporation. The effects of dilution were evident, as the water quality was better during the wet season due to the heavy rains. Forested areas have better water quality than areas dominated by other anthropogenic activities [34], indicating that these activities have a negative impact on the water quality of Ngong River.
5. Conclusions
This study has shown that the highest sources of water quality variations in Ngong River water are due to anthropogenic activities. The level of pollution was relatively high due to domestic effluents and sewer discharge, particularly from the informal settlements which lack proper mechanisms of sewer disposal (e.g., drainage, sanitary facilities and sewerage works).
Open dumpsites along the river banks resulting from the existing settlements also contributed to the degradation of Ngong River and the loss of aesthetic value. Additionally, the industrial discharge was also a major source of contaminants for Ngong River, as observed in various sites where the water quality parameters were also largely compromised.
The one way ANOVA results indicate that in the peak flow season, the concentration of most inorganic and organic parameters is raised by runoffs. The observed increase in the level of pollution and the non-significant difference observed in various parameters from upstream to downstream of Ngong River basin during the wet season indicated progressive anthropogenic pressure along the basin. Contrary to this observation, the levels of pollution of Ngong River were found to be extremely high during the dry season, indicating that the river is able to self-purify during the wet season.
Therefore, the accumulation of contaminants, particularly during the dry season, is a potential health hazard to communities that utilize Ngong River’s water for domestic use or a source of income. Indeed, most parameters showed levels above the WHO and NEMA recommended limits for discharging effluents into the environment, as well as drinking/domestic water, suggesting that Ngong River’s water in its present state (untreated state) is unfit for both agricultural and domestic use.
6. Recommendations
This paper recommends that further studies should more closely examine the remedial measures for the observed river water pollution and include enforcement of existing rules and regulations for catchment protection and riparian land, in order to curb the observed encroachment of the river bank, raw sewer discharge and illegal dumpsites. Water quality regulations and solid waste management regulations should be enforced to reduce the observed pollution due to direct sewer and industrial discharges and illegal dumpsites along Ngong River, so as to curb their probable enhancement on river pollution—especially heavy metals and fecal pollution. The treatment of industrial effluents should also be closely monitored to curb heavy metal pollution. The study further recommends that both the national and county government should invest in the provision of adequate sewerage facilities within the informal settlements to reduce the risk of direct sewer discharge into the river, as well as ensure safeguards on human health.
Author Contributions
Conceptualization, M.N. and S.M.K.; methodology, M.N.; validation, M.N., M.V. and S.M.K.; investigation, M.N.; resources, S.M.K.; writing—original draft preparation, M.N.; writing—review and editing, S.M.K. and M.V.; supervision, S.M.K. and M.V. All authors have read and agreed to the published version of the manuscript.
Funding
This article is funded entirely by Dimitrie Cantemir University IR-BE-078268 project.
Data Availability Statement
Not applicable.
Acknowledgments
The authors hereby acknowledge the Water Resources Authority for providing a waiver for water quality analysis for this study.
Conflicts of Interest
The authors declare no conflict of interest.
References
- Oki, T.; Kanae, S. Global Hydrological Cycles and World Water Resources. Science 2006, 313, 1068–1072. [Google Scholar] [CrossRef] [PubMed]
- Probst, E.; Mauser, W. Climate Change Impacts on Water Resources in the Danube River Basin: A Hydrological Modelling Study Using EURO-CORDEX Climate Scenarios. Water 2023, 15, 8. [Google Scholar] [CrossRef]
- Rodríguez, C.; García, B.; Pinto, C.; Sánchez, R.; Serrano, J.; Leiva, E. Water Context in Latin America and the Caribbean: Distribution, Regulations and Prospects for Water Reuse and Reclamation. Water 2022, 14, 3589. [Google Scholar] [CrossRef]
- Gudmundsson, L.; Seneviratne, S.; Zhang, X. Anthropogenic climate change detected in European renewable freshwater resources. Nat. Clim. Chang. 2017, 7, 813–816. [Google Scholar] [CrossRef]
- Bhaduri, A.; Bogardi, J.; Siddiqi, A.; Voigt, H.; Vörösmarty, C.; Pahl-Wostl, C.; Bunn, S.E.; Shrivastava, P.; Lawford, R.; Foster, S.; et al. Achieving Sustainable Development Goals from a Water Perspective. Front. Environ. Sci. 2016, 4, 64. [Google Scholar] [CrossRef]
- Bartram, J.; Balance, R. Water Quality Monitoring—A Practical Guide to the Design and Implementation of Freshwater Quality Studies and Monitoring Programmes, 1st ed.; TJ Press: Padstow, UK, 1996; pp. 12–38. [Google Scholar]
- Kithiia, S.M. Water Quality Degradation Trends in Kenya over the Last Decade, Water Quality Monitoring and Assessment; Voudouris, K., Voutsa, D., Eds.; InTech: London, UK, 2012; ISBN 978-953-51-0486-5. [Google Scholar] [CrossRef]
- Bagnis, S.; Boxall, A.; Gachanja, A.; Fitzsimons, M.; Murigi, M.; Snape, J.; Tappin, A.; Wilkinson, J.; Comber, S. Characterization of the Nairobi River catchment impact zone and occurrence of pharmaceuticals: Implications for an impact zone inclusive environmental risk assessment. Sci. Total Environ. 2020, 703, 134925. [Google Scholar] [CrossRef] [PubMed]
- Kithiia, S.M. An assessment of water quality changes within the Athi and Nairobi river basins during the last decade. Int. Assoc. Hydrol. Sci. 2007, 314, 205–212. [Google Scholar]
- Bisung, E.; Elliott, S.J.; Abudho, B.; Schuster-Wallace, C.J.; Karanja, D.M. Dreaming of toilets: Using photovoice to explore knowledge, attitudes and practices around water–health linkages in rural Kenya. Health Place 2015, 31, 208–215. [Google Scholar] [CrossRef] [PubMed]
- Erick, K.M.; Hudson, N.N. Physico-chemical Characteristics and Levels of Polycyclic Aromatic Hydrocarbons in Untreated Water from Ngong River, Kenya. J. Pollut. Eff. Control 2016, 4, 1000163. [Google Scholar] [CrossRef]
- Musyoki, A.; Mbaruk, S. An Investigation into the Bacteriological Quality of Dandora Sewage Treatment Plant and the Receiving Waters of Nairobi and Athi Rivers; LAP LAMBERT Academic Publishing: London, UK, 2015. [Google Scholar]
- Kihara, S. Characterizing Anthropogenic Sources of Pollution for Tropical Urban River Management: A Proposed Case Study of the Nairobi River Basin. In Proceedings of the First World Wide Work-shop for Junior Environmental Scientists, Vitry sur Seine, France, 21–24 May 2002. [Google Scholar]
- Environmental Management and Coordination, Water Quality Regulations. Available online: https://elaw.org/content/kenya-environmental-management-and-coordination-water-quality-regulations-2006 (accessed on 29 September 2021).
- MEWNR National Environment Policy. Available online: http://academia-ke.org/library/download/mewnr-national-environment-policy-2013/ (accessed on 19 September 2021).
- Chapman, D.V.; World Health Organization; UNESCO & United Nations Environment Programme. Water Quality Assessments: A Guide to the Use of Biota, Sediments and Water in Environmental Monitoring, 2nd ed.; Chapman, D., Ed.; E & FN Spon: London, UK, 1996; Available online: https://apps.who.int/iris/handle/10665/41850 (accessed on 3 September 2022).
- Agarwal, A.; Narain, S. Community and Household Water Management: The Key to Environmental Regeneration and Poverty Alleviation. Community and Household Water Management: The Key to Environmental Regeneration and Poverty Alleviation; UNDP: New York, NY, USA, 1999; Available online: https://www.cabdirect.org/cabdirect/abstract/20033006278 (accessed on 15 December 2021).
- Daoji, L.; Daler, D. Ocean Pollution from Land-based Sources: East China Sea, China. AMBIO J. Hum. Environ. 2014, 33, 107–113. [Google Scholar] [CrossRef]
- Nyairo, W.N.; Owuor, P.O.; Kengara, F.O. Effect of anthropogenic activities on the water quality of Amala and Nyangores tributaries of River Mara in Kenya. Environ. Monit. Assess. 2015, 187, 691. [Google Scholar] [CrossRef] [PubMed]
- Njuguna, S.M.; Yan, X.; Gituru, R.W.; Wang, Q.; Wang, J. Assessment of macrophyte, heavy metal, and nutrient concentrations in the water of the Nairobi River, Kenya. Environ. Monit. Assess. 2017, 189, 454. [Google Scholar] [CrossRef] [PubMed]
- Oyake, L. The Effects on Ngong River by Effluents from Nairobi’s Industrial Area. Master’s Thesis, University of Nairobi, Nairobi, Kenya, 1998. [Google Scholar]
- Allen, S.E.; Grimshaw, H.M.; Parkinson, J.A.; Quarmby, C. Chemical Analysis of Ecological Materials; Blackwell Scientific Publications: Hoboken, NJ, USA, 1974. [Google Scholar]
- Baird, R.B.; Eaton, A.D.; Rice, E.W. Standard Methods for the Examination of Water and Wastewater, 23rd ed.; American Water Works Association: Washington, DC, USA, 2017. [Google Scholar]
- Fakayode, S.O. Impact assessment of industrial effluent on water quality of the receiving Alaro River in Ibadan, Nigeria. Afr. J. Environ. Assess. Manag. 2005, 10, 1–13. [Google Scholar]
- Adeogun, A.O.; Babatunde, T.A.; Chukwuka, A.V. Spatial and temporal variations in water and sediment quality of Ona River, Ibadan, Southwest Nigeria. Eur. J. Sci. Res. 2012, 74, 186–204. [Google Scholar]
- Bojarczuk, A.; Jelonkiewicz, Ł.; Lenart-Boroń, A. The effect of anthropogenic and natural factors on the prevalence of physicochemical parameters of water and bacterial water quality indicators along the river Białka, southern Poland. Environ. Sci. Pol. Res. 2018, 25, 10102–10114. [Google Scholar] [CrossRef]
- Odipo, R.W. The Effects of Industrial and Domestic Effluents on the Quality of the Receiving Waters of Nairobi, Ngong’ and Ruiruaka Rivers. Master’s Thesis, University of Nairobi, Nairobi, Kenya, 1998. [Google Scholar]
- Netpae, T.; Phalaraksh, C. Bioaccumulation of copper and lead in Asian clam tissues from Bung Boraphet reservoir, Thailand. Int. J. Agric. Biol. 2009, 11, 783–786. [Google Scholar]
- Nordberg, G.F.; Fowler, B.A.; Nordberg, M. Handbook on the Toxicology of Metals; Elsevier Academic Press: Burlington, VT, USA, 2014. [Google Scholar]
- Adriano, D.C. Trace Elements in the Terrestrial Environment, 2nd ed.; Springer: New York, NY, USA, 2001. [Google Scholar]
- Karanja, N.N.; Njenga, M.; Prain, G.; Kangâ, E.; Kironchi, G.; Githuku, C.; Kinyari, P.; Mutua, G.K. Assessment of environmental and public health hazards in wastewater used for urban agriculture in Nairobi, Kenya. Trop. Subtrop. Agroecosyst. 2009, 12, 85–97. [Google Scholar]
- Voda, M.; Sarpe, C.A.; Voda, A.I. Romanian river basins lag time analysis. The SCS-CN versus RNS comparative approach developed for small watersheds. Water Resour. Manag. 2019, 32, 245–259. [Google Scholar]
- Gan, C.; Wang, K.; Voda, M. Decoupling relationship between carbon emission and economic development in the service sector: Case of 30 provinces in China. Envirom. Sci. Pol. Res. 2022, 29, 63846–63858. [Google Scholar] [CrossRef]
- Voda, M.; Kithiia, S.; Jackiewicz, E.; Du, Q.; Sarpe, C.A. Geosystems ‘pathways to the future of Sustainability. Sci. Rep. 2019, 9, 14446. [Google Scholar] [CrossRef] [PubMed] [Green Version]
Figure 1.
Map showing Ngong River locality in Nairobi County and sampling points.

Figure 2.
BOD levels for Ngong River for wet and dry season measured in April and August, 2021.

Figure 3.
COD levels for Ngong River measured between April and August 2021.

Figure 4.
Total coliforms levels in Ngong River measured between April and August 2021.

Figure 5.
E. coli levels in Ngong River measured between April and August 2021.

Figure 6.
Conductivity levels of Ngong River measured between April and August 2021.

Figure 7.
Nitrates levels of Ngong River measured between April and August 2021.

Figure 8.
Oil and grease levels in Ngong River measured between April and August 2021.

Figure 9.
The pH levels of Ngong River measured between April and August 2021.

Figure 10.
Total dissolved solids levels of Ngong River.

Figure 11.
Total suspended solids levels of Ngong River measured between April and August 2021.

Figure 12.
Turbidity levels for Ngong River measured between April and August 2021.

Figure 13.
Cadmium (Cd) concentrations in Ngong River measured between April and August 2021.


Table 1.
The anthropogenic activities affecting the water quality of Ngong River.
| Sampling Point | Observed Anthropogenic Activities |
|---|---|
| SP1 Ngong Forest boundary 36.773918, −1.316723 | Informal settlements near the forest boundary |
| Small scale farming | |
| SP2 Kibera Lindi Mosque 36.789409, −1.314737 | Kibera informal settlements |
| Ongoing road construction in close vicinity | |
| Raw sewer discharge into the river | |
| Solid waste dumping | |
| SP3 Nairobi dam 36.801664, −1.318324 | Kibera Silanga informal settlements |
| Informal reclamation and encroachment of the dam by residents | |
| Small scale farming of sugarcane, kale, spinach, arrow root, maize farming | |
| SP4 Outering Rd Bridge 36.891182, −1.306702 | Illegal dumpsite |
| Informal settlements | |
| SP5 Enterprise Rd Bridge 36.861962, −1.315906 | Industrial activities |
| Industrial discharge evident—black in color | |
| Paint and paper industries within the vicinity | |
| Informal settlements—Mukuru slums | |
| Direct sewer discharge | |
| Solid waste dumping—leachate noted | |
| SP6 Likoni Rd Bridge 36.854686, −1.315993 | Dumpsite |
| Use of river water to clean polythene papers for recycling | |
| Industrial discharge noted | |
| SP7 Mukuru Kayaba 36.849808, −1.313388 | Solid waste dumped into the river channel |
| Sewer pipes channeled to the river | |
| Informal settlements, Mukuru Kayaba | |
| SP8 Soweto Embakasi Bridge 36.909088, −1.292102 | Informal settlements |
| Dumpsite | |
| SP9 Kayole 36.918681, −1.281739 | Informal settlements |
| Sewage discharge | |
| Dumpsite | |
| SP10 Matopeni Twiga 36.934911, −1.265998 | Informal Settlements |
| Dumpsite—medical waste evident | |
| Quarry site | |
| Small scale farming | |
| SP11 Njiru-Kangundo Rd Bridge 36.945836, −1.248449 | Informal settlements |
| Factory | |
| Dumpsite, dumping of medical waste evident | |
| SP12 Mong’etho before confluence 36.9541, −1.244761 | Informal settlements |
| Small scale agriculture | |
| Pig farming | |
| Dumpsite | |
| Domestic runoff drains channeled to river |
Source: Field data, 2021.
Table 2.
Physicochemical parameters ANOVA for Ngong River for wet and dry season.
| Parameters | Df | F | Sig. |
|---|---|---|---|
| BOD | 11 | 1.400 | 0.286 |
| COD | 11 | 3.206 | 0.028 |
| Conductivity | 11 | 0.461 | 0.895 |
| Nitrate | 11 | 0.098 | 1.000 |
| Oil and grease | 11 | 0.363 | 0.948 |
| E. coli | 11 | 1.054 | 0.462 |
| pH | 11 | 2.391 | 0.075 |
| Temperature | 11 | 0.027 | 1.000 |
| Total dissolved solids | 11 | 0.464 | 0.893 |
| Total suspended solids | 11 | 0.925 | 0.548 |
| Total coliforms | 11 | 1.001 | 0.496 |
| Turbidity | 11 | 1.132 | 0.415 |
Source: Field data, 2021.
Table 3.
One way ANOVA test for Ngong River for wet and dry season.
| Parameters | Df | F | Sig. |
|---|---|---|---|
| BOD | 1 | 3.359 | 0.080 |
| COD | 1 | 0.254 | 0.620 |
| Conductivity | 1 | 39.287 | 0.000 |
| E. coli | 1 | 0.775 | 0.388 |
| Nitrate | 1 | 88.685 | 0.000 |
| Oil and grease | 1 | 20.696 | 0.000 |
| PH | 1 | 0.479 | 0.496 |
| Temperature | 1 | 558.835 | 0.000 |
| Total coliform | 1 | 0.955 | 0.339 |
| Total dissolved solids | 1 | 38.506 | 0.000 |
| Total suspended solids | 1 | 3.670 | 0.068 |
| Turbidity | 1 | 0.523 | 0.477 |
Source: Field data, 2021.
Table 4.
Ngong River water quality levels (Dry Season).
| Parameters | Units | SP 1 | SP 2 | SP3 | SP 7 | SP 6 | SP 5 | SP 4 | SP 8 | SP 9 | SP 10 | SP 11 | SP 12 | NEMA DW STDS | WHO DW STDS |
|---|---|---|---|---|---|---|---|---|---|---|---|---|---|---|---|
| pH | pH Scale | 7.52 | 6.94 | 7.19 | 6.83 | 7.09 | 7.11 | 6.75 | 6.94 | 7.09 | 7.22 | 7.72 | 7.08 | 6.5–8.5 | <8 |
| Turbidity | N.T.U | ND | 17 | 20 | 22 | 15 | 8.2 | 26 | 25 | 22 | 12 | 11 | 20 | NA | <1.5 |
| Conductivity (25 °C) | µS/cm | 509 | 1102 | 1244 | 934 | 885 | 882 | 1216 | 1186 | 1261 | 1239 | 1239 | 934 | NA | 250 |
| Nitrate (NO3−N) and Nitrate (NO3−) | mgN/L | 36.53 | 32.45 | 19 | 19.22 | 9.8 | 14.73 | 36.07 | 28.3 | 29.15 | 24.6 | 22.93 | 22.6 | 10 | 50 |
| Total dissolved solids | mg/L | 316 | 638 | 771 | 579 | 549 | 547 | 754 | 735 | 782 | 768 | 768 | 579 | 1200 | 1000 |
| Temperature | °C | 22.2 | 23.0 | 22.7 | 23.1 | 22.6 | 22.2 | 22.7 | 23.2 | 22.8 | 22.9 | 23.0 | 23.0 | - | - |
| COD | mgO₂/L | 35 | 1411 | 376 | 642 | 920 | 350 | 1112 | 1050 | 880 | 470 | 750 | 990 | - | - |
| BOD (20 °C) | mgO₂/L | 5 | 370 | 70 | 250 | 160 | 120 | 290 | 320 | 270 | 180 | 120 | 210 | - | - |
| Oil and grease | mg/L | 0.04 | ND | 0.06 | 0.02 | 0.03 | ND | 0.03 | 0.01 | 0.04 | 0.02 | ND | 0.04 | - | - |
| Total suspended solids | mg/L | 10 | 300 | 100 | 200 | 200 | 150 | 600 | 350 | 250 | 100 | 133 | 150 | 30 | - |
| Total coliforms | MPN/100 mL | 143 | 11,200,000 | 176,000 | 24,200,000 | 10,460,000 | 9,210,000 | 1,773,000 | 1,203,0000 | 24,200,000 | 24,200,000 | 17,330,000 | 24,200,000 | - | NIL |
| E. Coli | MPN/100 mL | 2 | 388,0000 | 12,000 | 9,200,000 | 1,414,000 | 730,000 | 148,000 | 1,120,000 | 1,590,000 | 3,800,000 | 2,310,000 | 1,720,000 | Nil/100 mL | NIL |
| Cadmium | mg/L Cd | 0.113 | 0.067 | 0.074 | 0.110 | 0.054 | 0.049 | 0.071 | 0.081 | 0.068 | 0.105 | NIL | 0.088 | 0.01 | 0.003 |
| Lead | mg/L Pb | NIL | NIL | NIL | NIL | NIL | NIL | NIL | NIL | NIL | NIL | NIL | NIL | 0.05 | 0.01 |
Table 5.
Ngong River water quality levels (wet season).
| Parameters | Units | SP 1 | SP 2 | SP 3 | SP 7 | SP 6 | SP 5 | SP 4 | SP 8 | SP 9 | SP 10 | SP 11 | SP 12 | NEMA DW STDS | WHO DW STDS |
|---|---|---|---|---|---|---|---|---|---|---|---|---|---|---|---|
| pH | pH Scale | 7.10 | 6.96 | 7.68 | 6.84 | 6.88 | 7.19 | 6.77 | 6.94 | 7.02 | 6.87 | 7.14 | 7.21 | 6.5–8.5 | <8 |
| Turbidity | N.T.U | 7.40 | 13.06 | 14.5 | 15 | 12 | 11 | 12 | 4.75 | 10.6 | 30.6 | 10.1 | 29.6 | NA | <1.5 |
| Conductivity (25 °C) | µS/cm | 370 | 630 | 950 | 314 | 480 | 337 | 638 | 540 | 550 | 560 | 610 | 370 | NA | 250 |
| Nitrate (NO3−N) and Nitrate (NO3−) | mgN/L | 1.35 | 1.24 | 2.82 | 1.3 | 3.3 | 1.9 | <0.01 | 2.30 | 1.01 | 1.24 | 3.33 | 3.3 | 10 | 50 |
| Total dissolved solids | mg/L | 229 | 391 | 589 | 195 | 298 | 209 | 396 | 335 | 341 | 347 | 378 | 229 | 1200 | 1000 |
| Temperature | °C | 20.3 | 20.1 | 20.3 | 20.1 | 20.3 | 20.1 | 20.3 | 20.5 | 20.2 | 20.3 | 20.6 | 20.5 | - | - |
| COD | mgO₂/L | 106 | 2182 | 35 | 85 | 1210 | 76 | 358 | 352 | 704 | 352 | 1760 | 352 | - | - |
| BOD (20 °C) | mgO₂/L | 5 | 230 | 5 | 30 | 450 | 5 | 70 | 110 | 130 | 150 | 65 | 55 | - | - |
| Oil and grease | mg/L | 0.25 | 1.7 | 0.52 | 0.32 | 0.26 | 0.49 | 0.59 | 0.4 | 0.6 | 0.6 | 0.3 | 0.4 | - | - |
| Total suspended solids | mg/L | 40 | 140 | 10 | 140 | 100 | 120 | 160 | 50 | 71 | 367 | 71 | 88 | 30 | - |
| Total coliforms | MPN/100 mL | 81,000 | 8,660,000,000 | 50,000 | 19,700 | 1,414,000 | 930 | 3,080,000 | 276,000 | 6,870,000 | 548,000 | 440,000 | 242,000 | - | NIL |
| E. Coli | MPN/100 mL | 2900 | 214,000,000 | ND | 1400 | 250,000 | 30 | 10,000 | 21,000 | 187,000 | 4300 | 1000 | 17,330 | Nil | NIL |
| Cadmium | mg/L Cd | NIL | NIL | NIL | NIL | NIL | NIL | NIL | NIL | NIL | NIL | NIL | NIL | 0.01 | 0.003 |
| Lead | mg/L Pb | NIL | NIL | NIL | NIL | NIL | NIL | NIL | NIL | NIL | NIL | NIL | NIL | 0.05 | 0.01 |
The sample sites were represented as follows: forest boundary (1), Lindi Mosque (2), Nairobi dam (3), Outering bridge (4), Enterprise Road (5), Likoni road (6), Mukuru Kaiyaba (7), Embakasi bridge (8), Kayole (9), Matopeni Twiga (10), Kagundo Road bridge (11), and Mungetho-Njiru (12).
Table 6.
River recovery capacity and accumulation factor for physicochemical parameters of Ngong River wet season.
Table 6.
River recovery capacity and accumulation factor for physicochemical parameters of Ngong River wet season.
| BOD | COD | Conductivity | E. Coli | Nitrate | Oil and Grease | pH | Temperature | Total Coliforms | TDS | TSS | Turbidity | |
|---|---|---|---|---|---|---|---|---|---|---|---|---|
| RRC | 95% | 84% | 32% | 99% | 32% | 55% | 0.7% | 3% | 99% | 32% | 67% | 50% |
| AF | 24 | 6 | 1.5 | 6724 | 1.5 | 2.2 | 0.99 | 1 | 9734 | 1.5 | 3 | 2 |
Table 7.
River recovery capacity and accumulation factor for physicochemical parameters of Ngong River dry season.
Table 7.
River recovery capacity and accumulation factor for physicochemical parameters of Ngong River dry season.
| BOD | COD | Conductivity | E. Coli | Nitrate | Oil and Grease | pH | Temperature | Total Coliforms | TDS | TSS | Turbidity | |
|---|---|---|---|---|---|---|---|---|---|---|---|---|
| RRC | 97% | 95% | 53% | 99% | −55% | −100% | 6% | 0% | 99% | 53% | 95% | 100% |
| AF | 42 | 23 | 2 | 1,178,363 | 0.6 | 0.5 | 0.9 | 1 | 134,633 | 2.1 | 23 | 0 |
Disclaimer/Publisher’s Note: The statements, opinions and data contained in all publications are solely those of the individual author(s) and contributor(s) and not of MDPI and/or the editor(s). MDPI and/or the editor(s) disclaim responsibility for any injury to people or property resulting from any ideas, methods, instructions or products referred to in the content. |
© 2023 by the authors. Licensee MDPI, Basel, Switzerland. This article is an open access article distributed under the terms and conditions of the Creative Commons Attribution (CC BY) license (https://creativecommons.org/licenses/by/4.0/).
Share and Cite
MDPI and ACS Style
Ngatia, M.; Kithiia, S.M.; Voda, M. Effects of Anthropogenic Activities on Water Quality within Ngong River Sub-Catchment, Nairobi, Kenya. Water 2023, 15, 660. https://doi.org/10.3390/w15040660
AMA Style
Ngatia M, Kithiia SM, Voda M. Effects of Anthropogenic Activities on Water Quality within Ngong River Sub-Catchment, Nairobi, Kenya. Water. 2023; 15(4):660. https://doi.org/10.3390/w15040660
Chicago/Turabian StyleNgatia, Mary, Shadrack M. Kithiia, and Mihai Voda. 2023. "Effects of Anthropogenic Activities on Water Quality within Ngong River Sub-Catchment, Nairobi, Kenya" Water 15, no. 4: 660. https://doi.org/10.3390/w15040660
Note that from the first issue of 2016, this journal uses article numbers instead of page numbers. See further details here.