
Quasi-Prototype Size Testing of Wedge-Shaped Block for Armoring Embankment Dams and Levees


1
Department of Civil Engineering, Hydraulics, Energy and Environment, E.T.S. de Ingenieros de Caminos, Canales y Puertos, Universidad Politécnica de Madrid, Profesor Aranguren s/n, 28040 Madrid, Spain
2
Acis Innovación más Ingeniería S.L. (ACIS2in), Lucio Muñoz 4, Parla, 28982 Madrid, Spain
3
Centre Internacional de Metodes Numerics en Enginyeria, Campus Norte Universidad Politécnica de Cataluña, Gran Capitán s/n, 08034 Barcelona, Spain
*
Author to whom correspondence should be addressed.
Water 2023, 15(4), 662; https://doi.org/10.3390/w15040662
Submission received: 29 December 2022
/
Revised: 1 February 2023
/
Accepted: 2 February 2023
/
Published: 8 February 2023
(This article belongs to the Special Issue Dam Safety. Protection against Overtopping and Prevention of Geo-Structural Failure)
Abstract
:A series of tests of wedge-shaped blocks intended for armoring embankment dams and levees was carried out in a new experimental facility (‘Hydraulic Experimentation Facility—Luis Ruano’) under quasi-prototype conditions. This unique facility is located in the canal leading to the Laverné reservoir (Zaragoza, Spain) with a maximum vertical drop of 7 m and discharge up to 9 m3 s−1. The aim was to conduct experimental research on technologies to protect embankment dams and dikes against overflowing erosion under quasi-prototype conditions. The results of the tests demonstrate the ability of the WSBs to withstand high unit discharges under extremely negative conditions at the upstream and downstream ends of the armoring. The tests also helped to identify potential failure modes for the armoring blocks.
1. Introduction and Background
Overtopping is a process for which most dams are not designed. For this reason, the risk of serious damage to them, or even dam failure, increases under these circumstances, especially in earth dams, where it is the main cause of dam failure [1]. An increased magnitude of design floods requires additional spillway capacity, protection against overtopping, or both. This situation led the Federal Emergency Management Agency (FEMA) of the United States of America to publish a technical manual on dam protections against overtopping [2]. The FEMA manual describes overtopping protection options, including wedge-shaped block (WSB) technology.
Performance of WSBs has previously been studied by Moscow Institute of Civil Engineering [3,4,5], the Construction Industry Research and Information Association (CIRIA) [3,6,7,8,9,10], Colorado State University, the Bureau of Reclamation [11,12,13,14,15,16], and the Instituto Superior Técnico [17,18,19,20,21], among others [22]. Recently, a new model of wedge-shaped block of precast concrete has been developed (ACUÑA, Spanish patent ES 2595852 B2). This model includes improvements in the aeration system from previous models based on numerical and experimental research performed under laboratory conditions [23,24].
A new research effort was planned to validate the effectiveness of the WSB armoring at quasi-prototype size. The research project was funded by the Spanish Government and involved the construction of a large-scale experimental called ‘Hydraulic Experimentation Facility—Luis Ruano’ (HEFLR) in memory of one of the research promoters. The HEFLR was designed to enable continued testing of new technologies for the protection of dams and levees against overtopping on a prototype scale in the future.
2. Materials and Methods
2.1. Experimental Facility
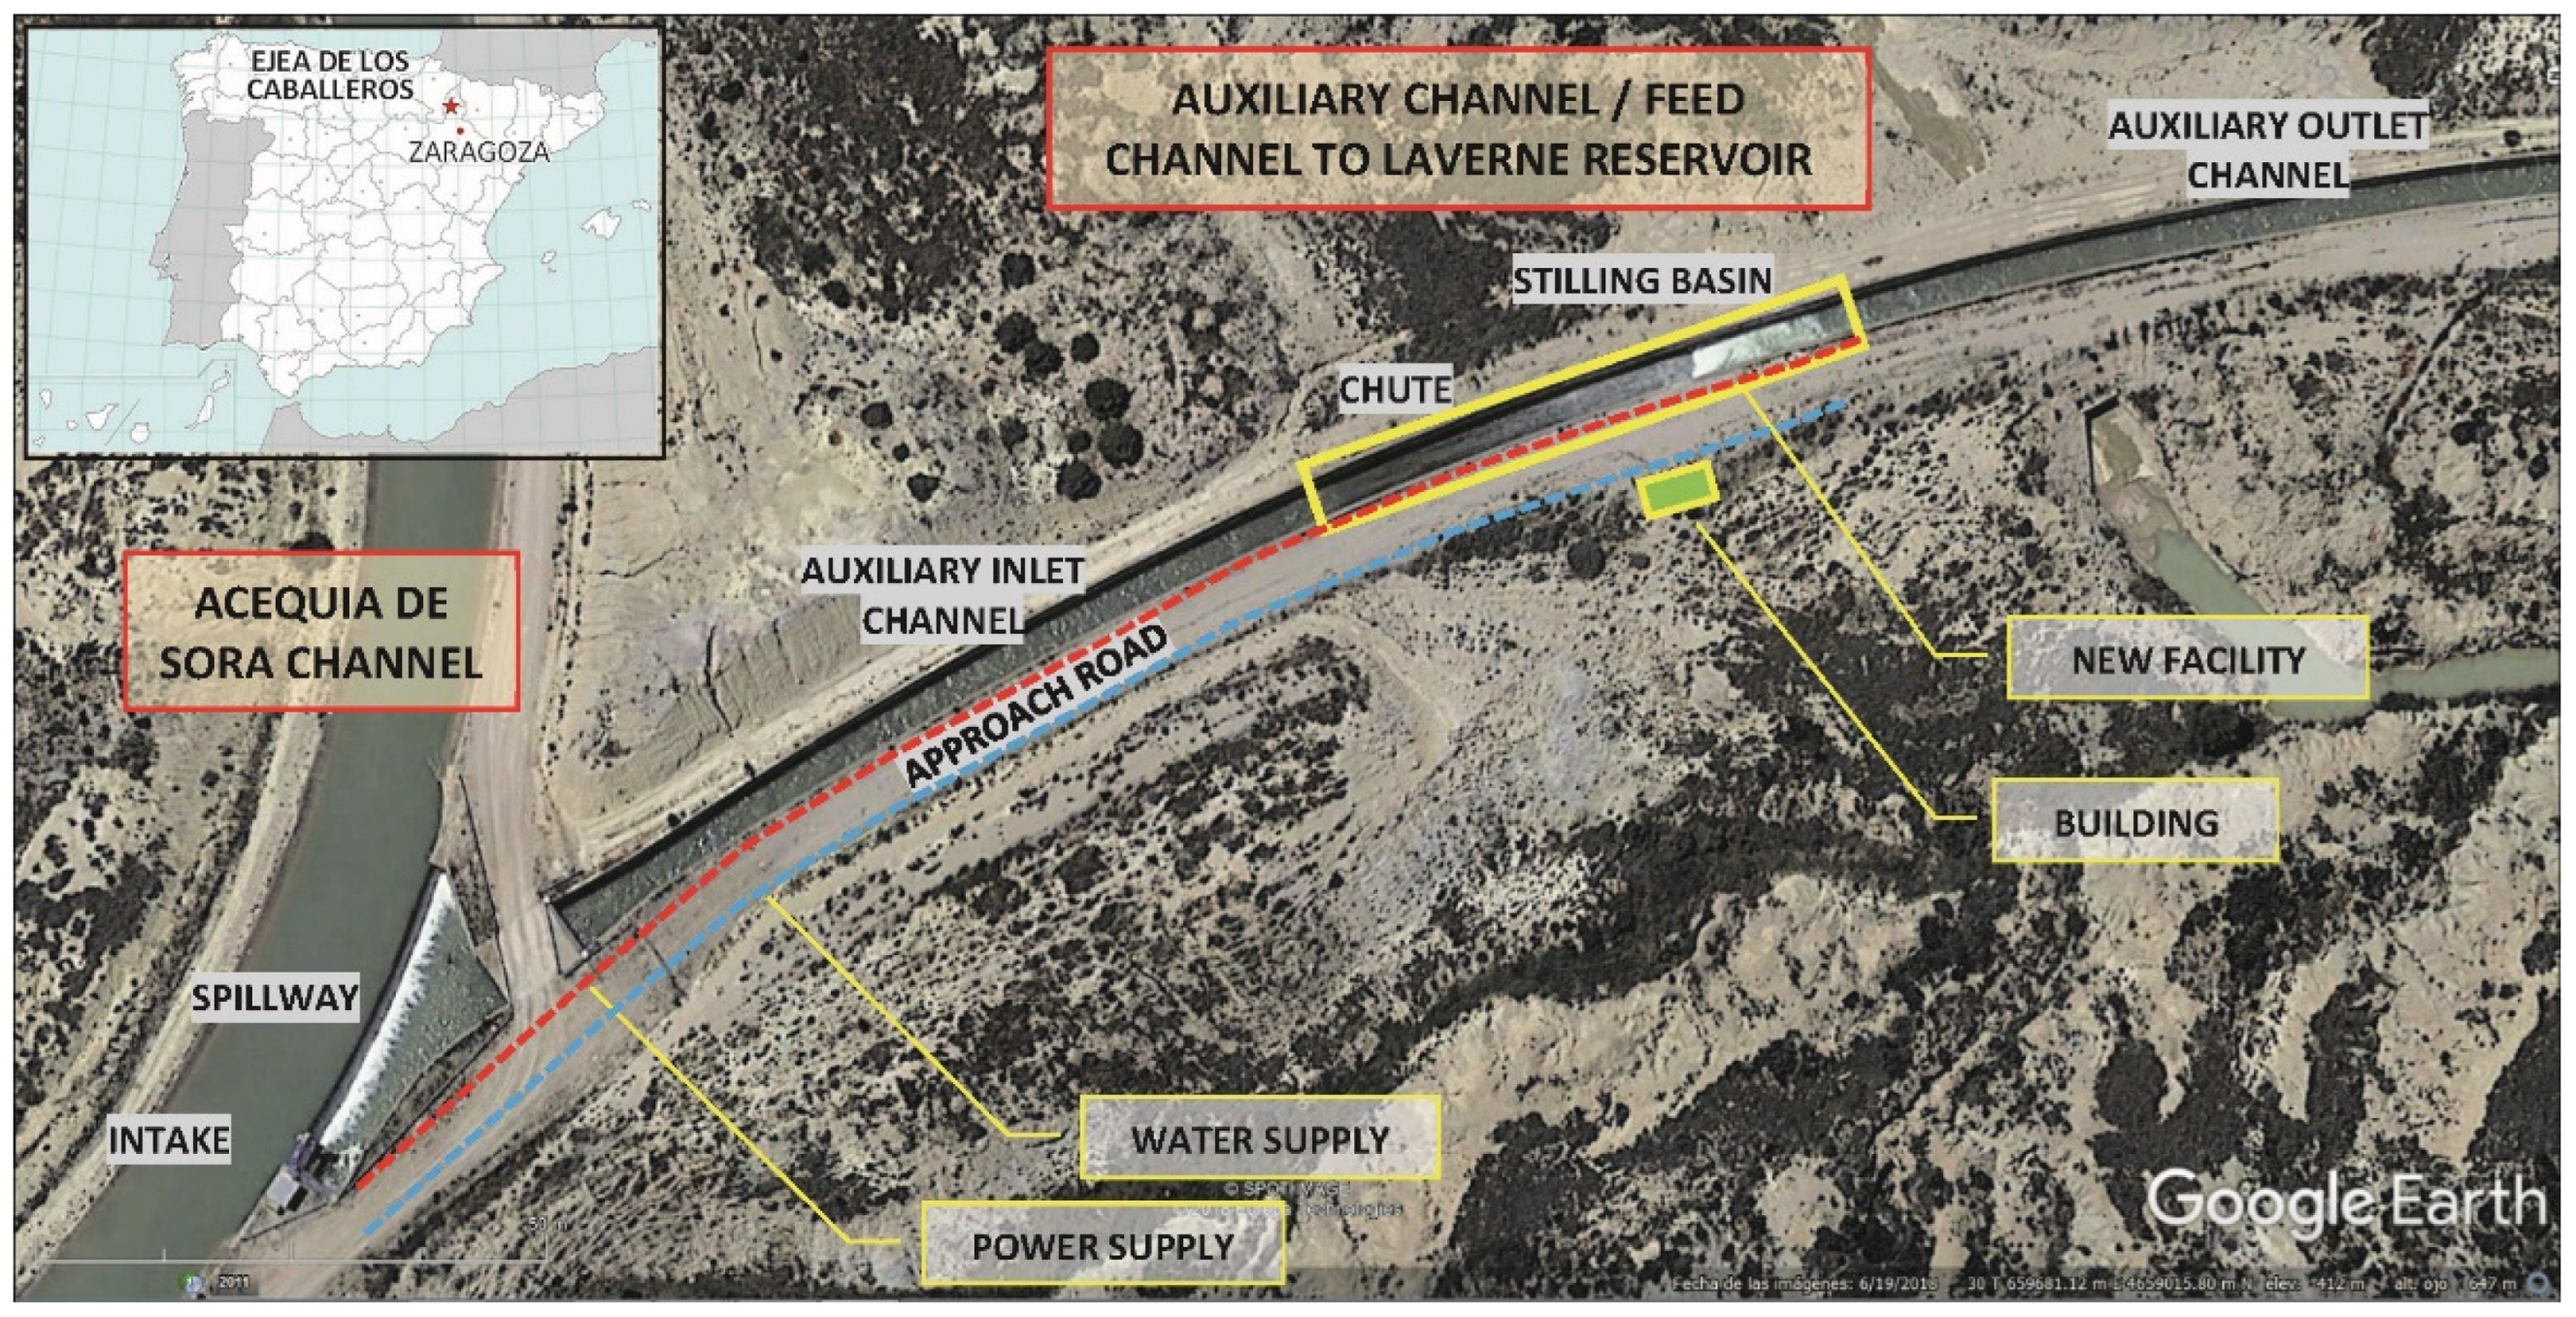
The new experimental facility has been developed in the auxiliary inlet channel of the Acequia de Sora channel (Figure 1), immediately upstream of the Laverné reservoir in Ejea de los Caballeros (Zaragoza, Spain). From the Acequia de Sora channel, a maximum discharge of 7 m3 s−1 can be supplied to this facility (eventually, up to 9 m3 s−1).
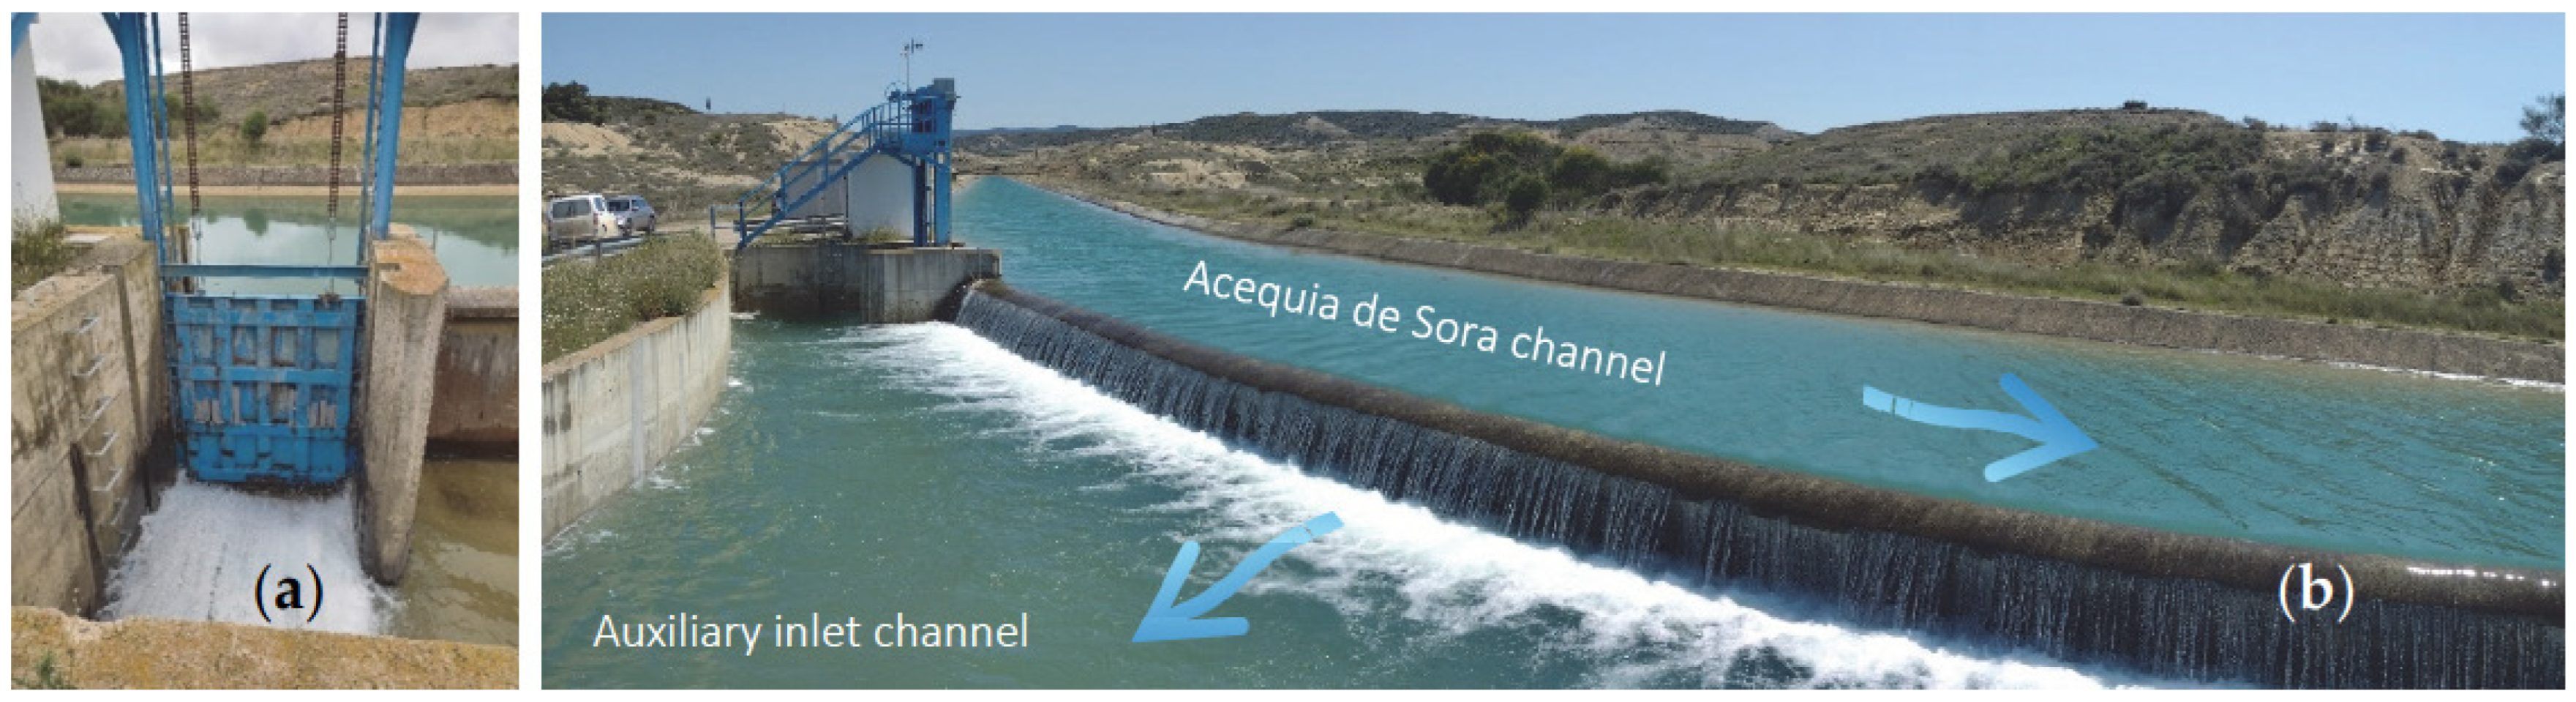
The auxiliary channel is 600 m long from the intake structure drawing water from the Acequia de Sora channel to the reservoir, at the downstream end. The inlet consists of a motorized rectangular flow control gate of 2.50 × 3.00 m (Figure 2a) and a 30 m long side-channel spillway weir, curved in plan, located immediately downstream of the gate (Figure 2b and Videos S1 and S2 in Supplementary Materials).
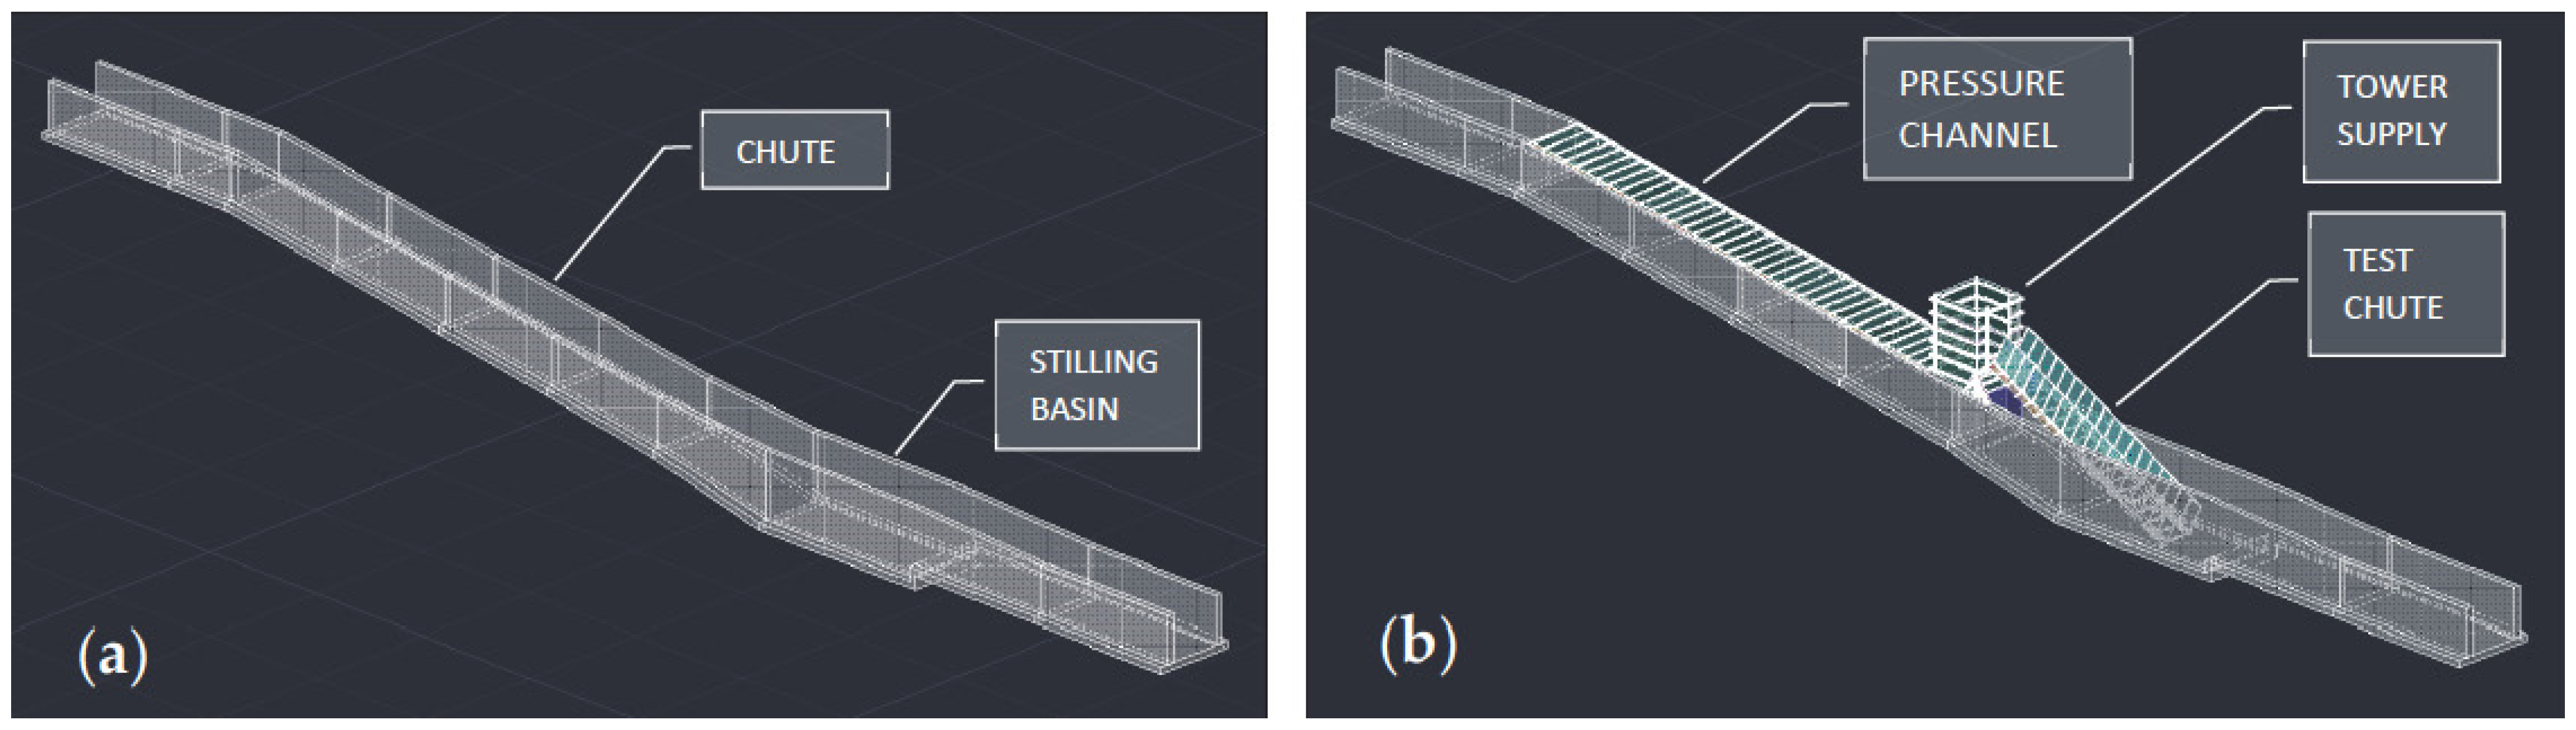
The experimental facility was built inside the existing auxiliary channel, approximately 90 m downstream from the headworks. The existing chute section (Figure 3a) has the following characteristics: 52.25 m long reinforced concrete channel with a rectangular cross section of 4.00 m wide, with variable height from 3.66 to 3.75 m in the first 41.80 m, and 3.75 to 5.27 m in the last 10.45 m. The longitudinal slope of the chute is 14.57% in the first 41.80 m and 22.88% in the last 10.45 m. The vertical drop between the crest of the inlet weir and the invert of the upstream section of the chute is 3.16 m. At the end of the chute there is a 14.63 m long stilling basin that is 4.00 m wide with 5.25 m high walls and a horizontal floor located 8.05 m bellow the invert of the upstream section of the chute. The basin ends at a 1.03 m high step, which is the upstream end of the last stretch of the auxiliary channel.
The HEFLR located inside the chute consists of an upstream pressure channel formed from the bulk of the existing chute, an intermediate steel supply tower, and the test chute (Figure 3a,b).
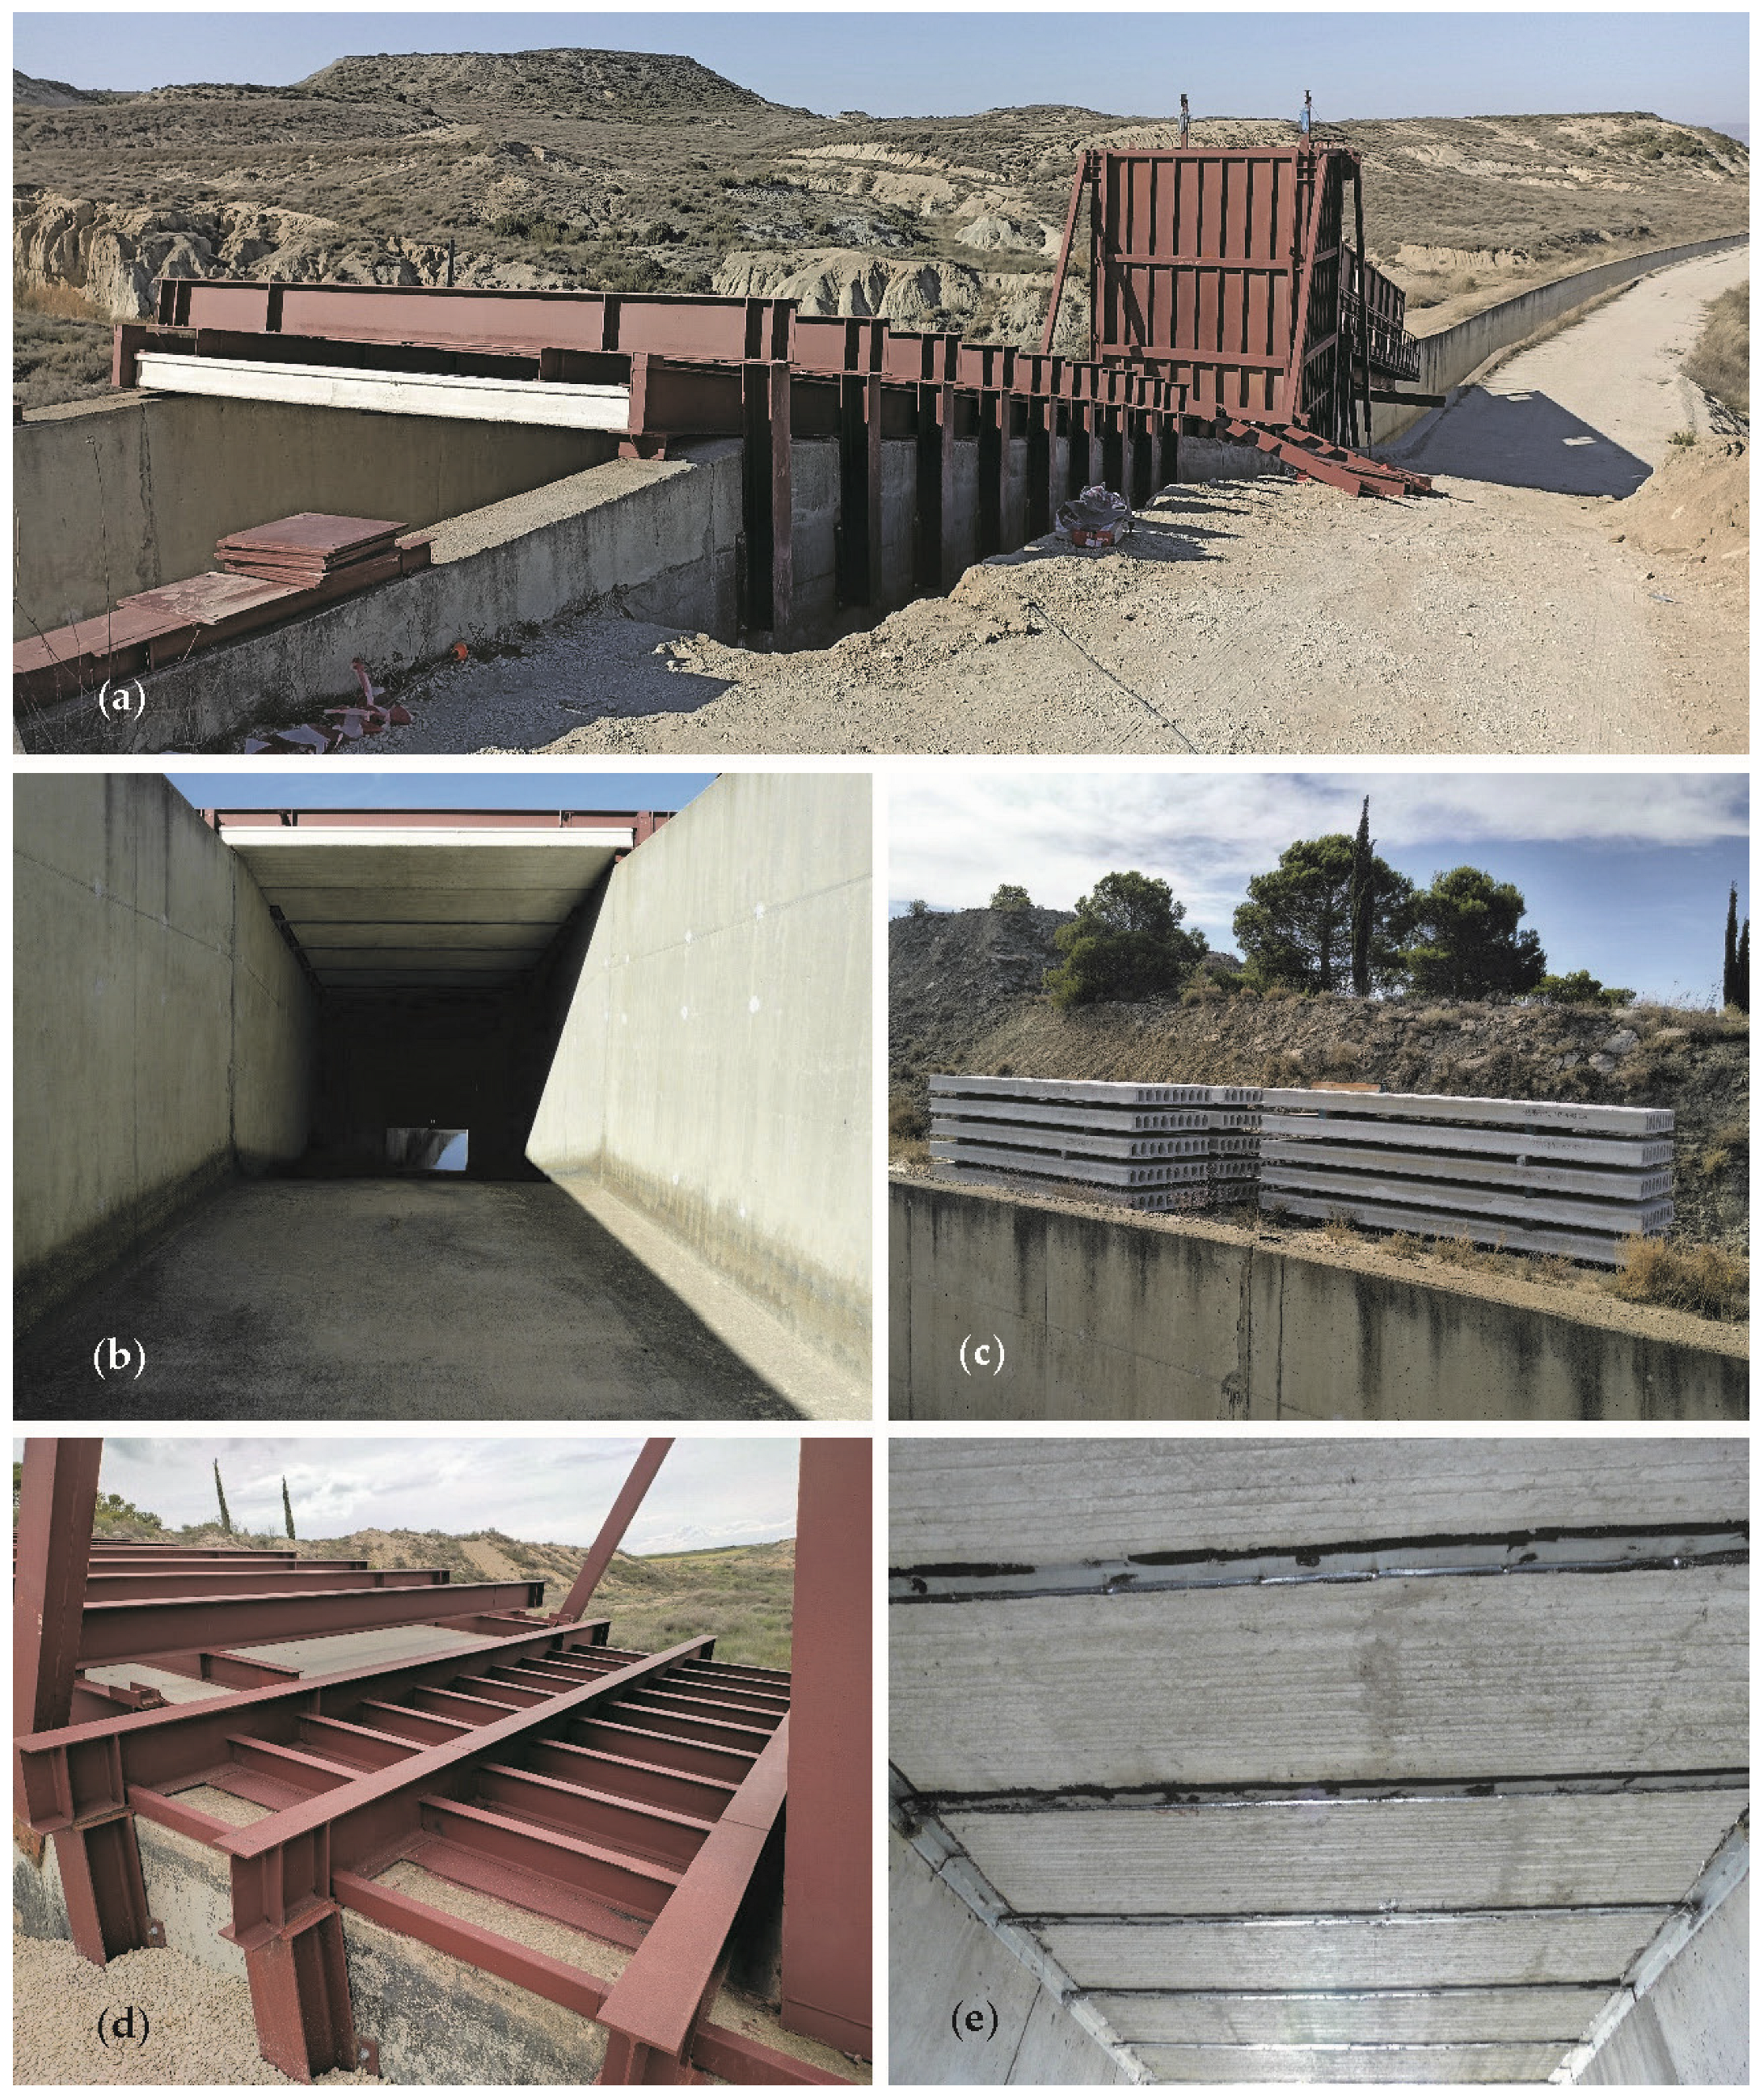
The pressure channel was designed to have the highest water elevation in the tower supply (Figure 3b), with negligible head loss for test flows and sectional capacity. The pressure channel is 38 m long and consists of a simple lining of the existing channel using lightweight precast concrete slabs (except at the end of the pressure channel close to the tower supply, in which the last two slabs are replaced by metallic plates) (Figure 4a–c). The concrete slabs are attached to the top of the side walls of the concrete chute and are supported by a rigid skeleton made up of metal beams anchored in the reinforced concrete of the existing walls (Figure 4d). A sealing treatment has been provided in the slab-slab and slab-pocket joints (Figure 4e).
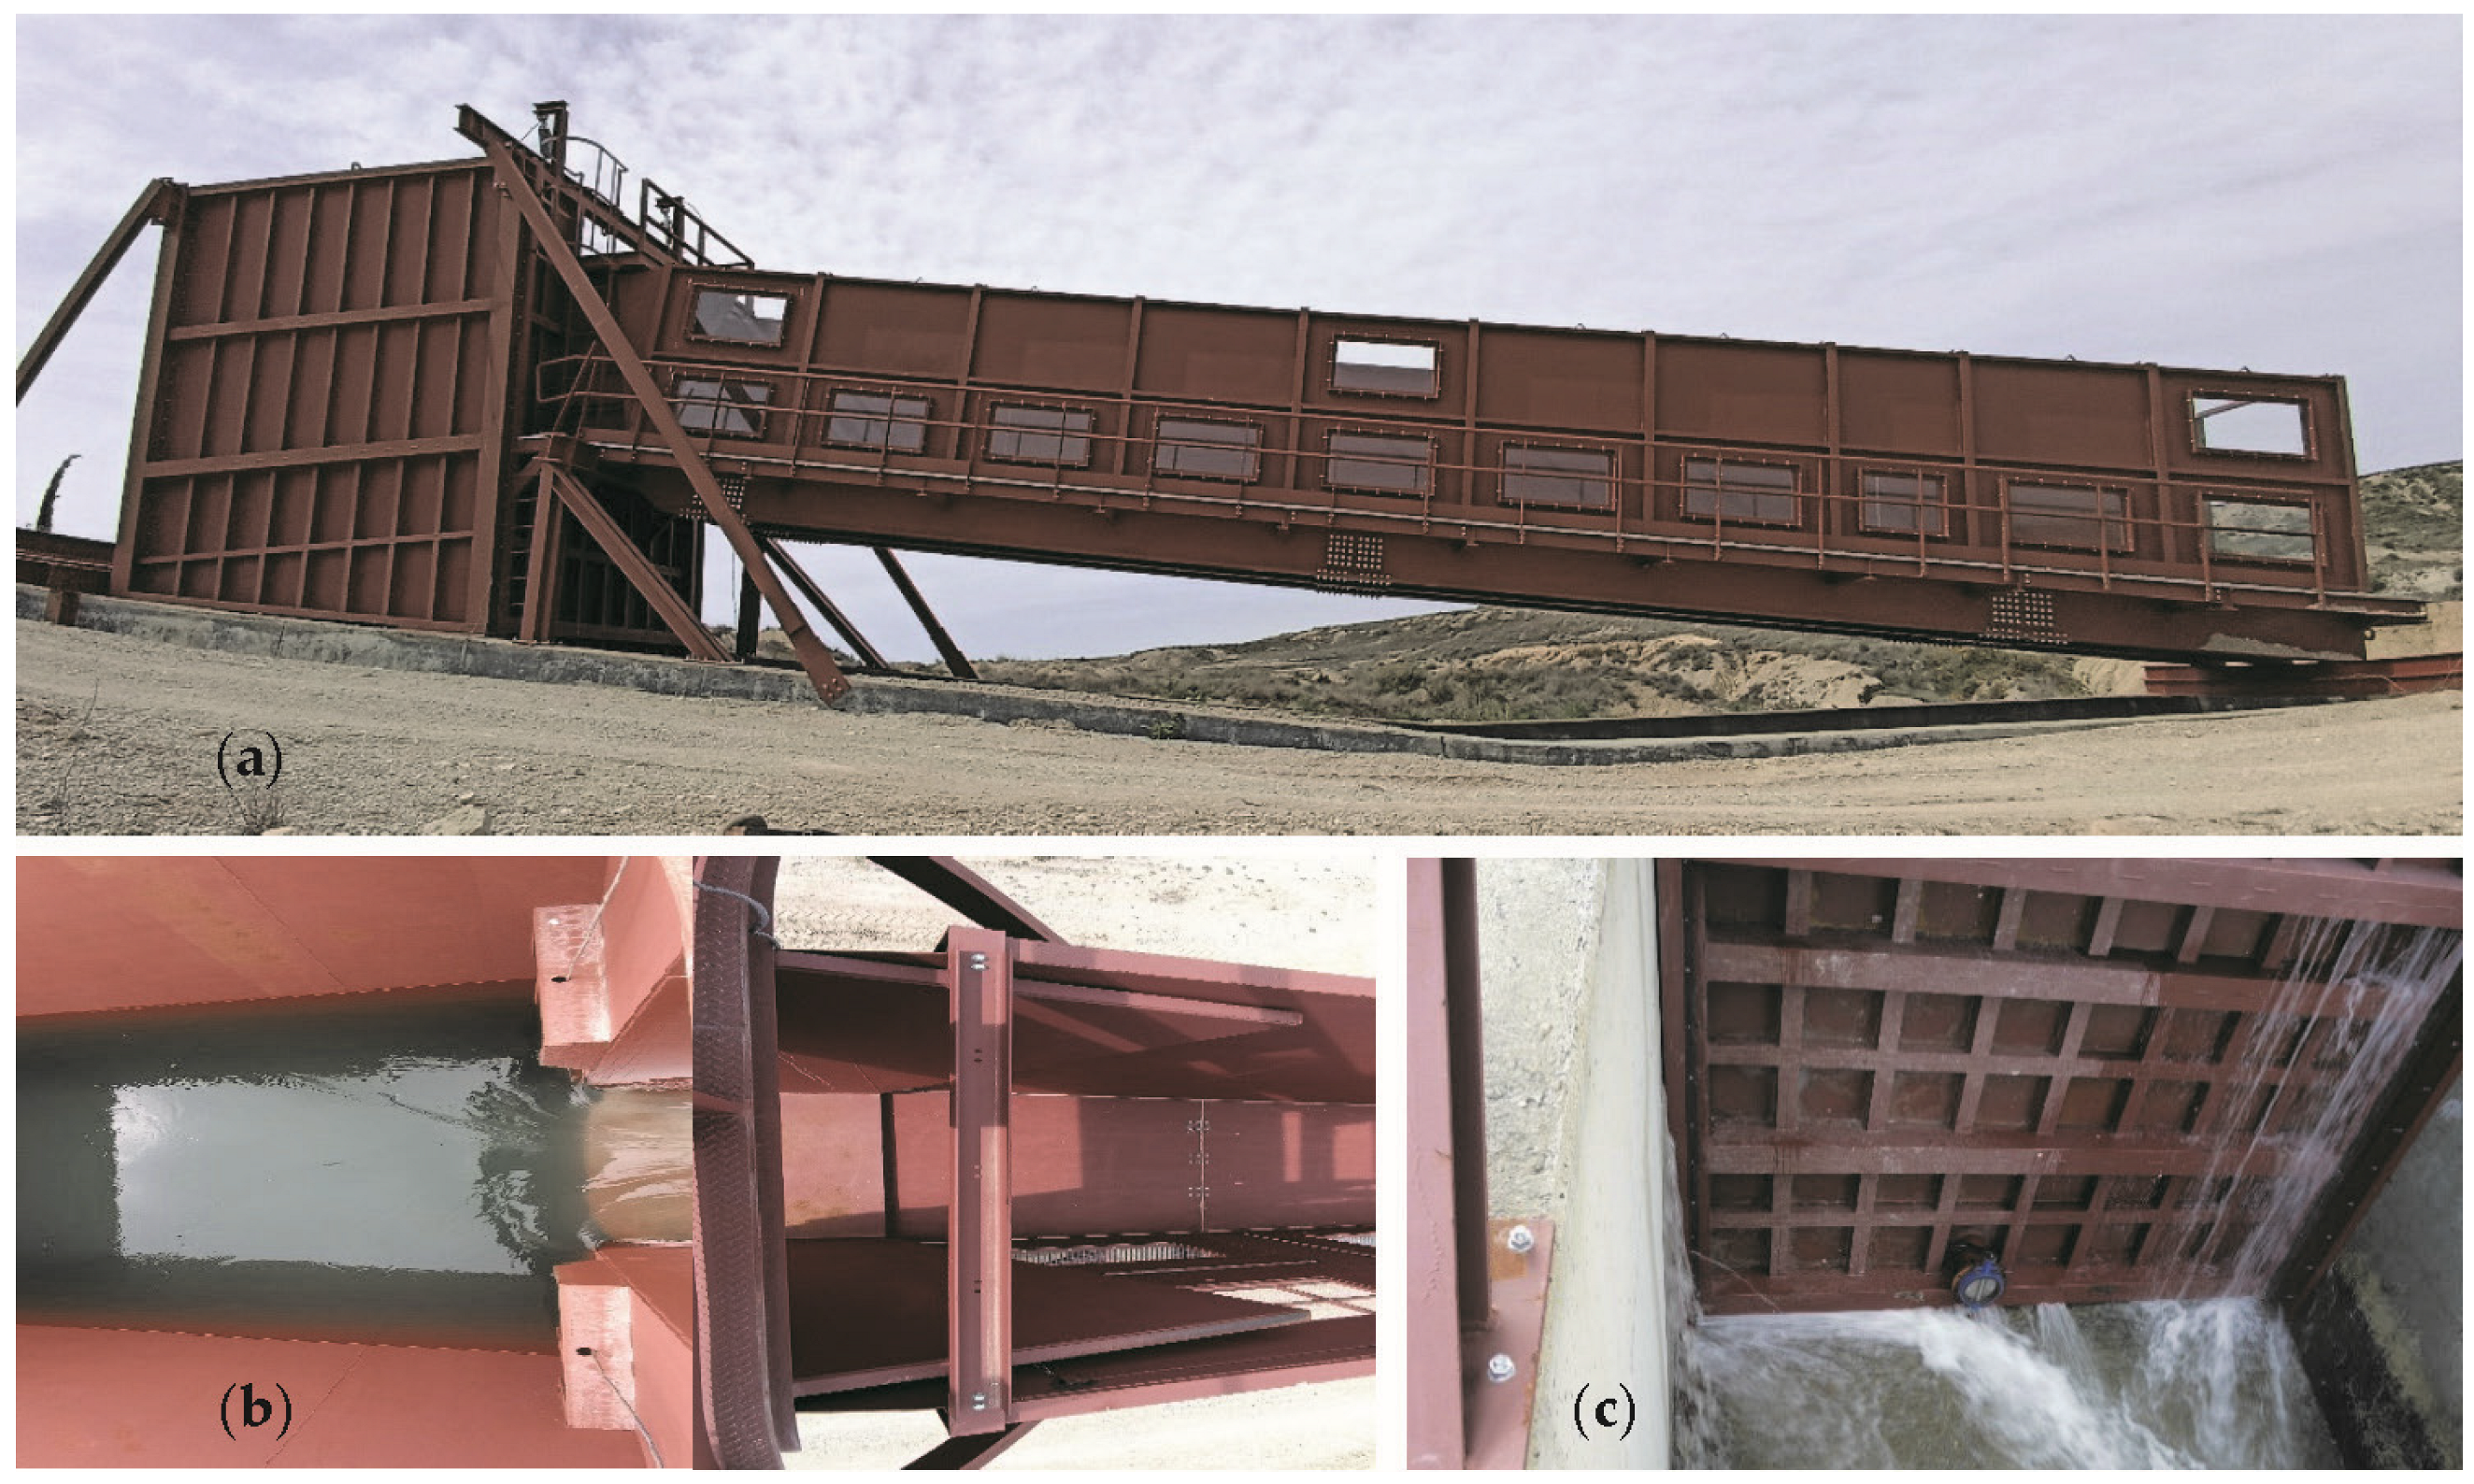
The horizontal section of the steel supply tower is square, with a side of 4.00 m. The maximum height is 9.23 m above its support on the channel supply slab and 5.71 m above the current walls of the auxiliary channel (Figure 5a). At the top of its downstream side, the tower has a 1.82 m wide and 3.49 m high opening that fits into the upstream end of the testing chute (Figure 5b). This opening is reinforced by a series of metal profiles that ensure its structural strength and functionality. The elevation of the lower edge of the opening coincides with the elevation of the base of the test chute. In the lower part of the tower, on the downstream side, there is a wall gate of 3.93 × 2.87 m (Figure 5c) that must be closed to use the facility. A 250-mm diameter butterfly valve (Figure 5c) was installed on the gate to empty the storage water and reduce the pressure on the wall gate to facilitate its opening.
The test chute is a modular steel structure supported on a metallic platform (Figure 5a) with a total width of 3.00 m and a maximum vertical drop of 7.05 m. The chute is equipped with a 0.50-m-wide platform beside the right wall. The width of the chute can be adjusted from 0.5 m to 2.0 m in 0.5-m intervals. The tests described in this article used a 2.0 m total width, subdivided by a 0.40 m high steel wall to form a pair of 1-m wide test sections. The longitudinal slope can be changed from 1 H:1 V to 3.5 H:1 V with increments of 0.5 H:1 V. The change is accomplished by pivoting the chute at the upstream end and adding or removing downstream of chute modules to adapt the corresponding length. The configuration selected for the tests was 2 H:1 V. The side walls of the chute are 2.50 m high, measured perpendicular to the bottom. The wall on the right side has clear methacrylate windows to allow observation during tests (Figure 5a).
When the testing chute is not used, it remains elevated above the auxiliary channel, supported by a metal beam at its downstream end (Figure 5a). The chute can be lowered (or lifted) at the lower end using a crane (Video S3 in the Supplementary Materials)
This crane also helps to operate the wall gate of the supply tower.
2.2. Description of the WSB Armoring
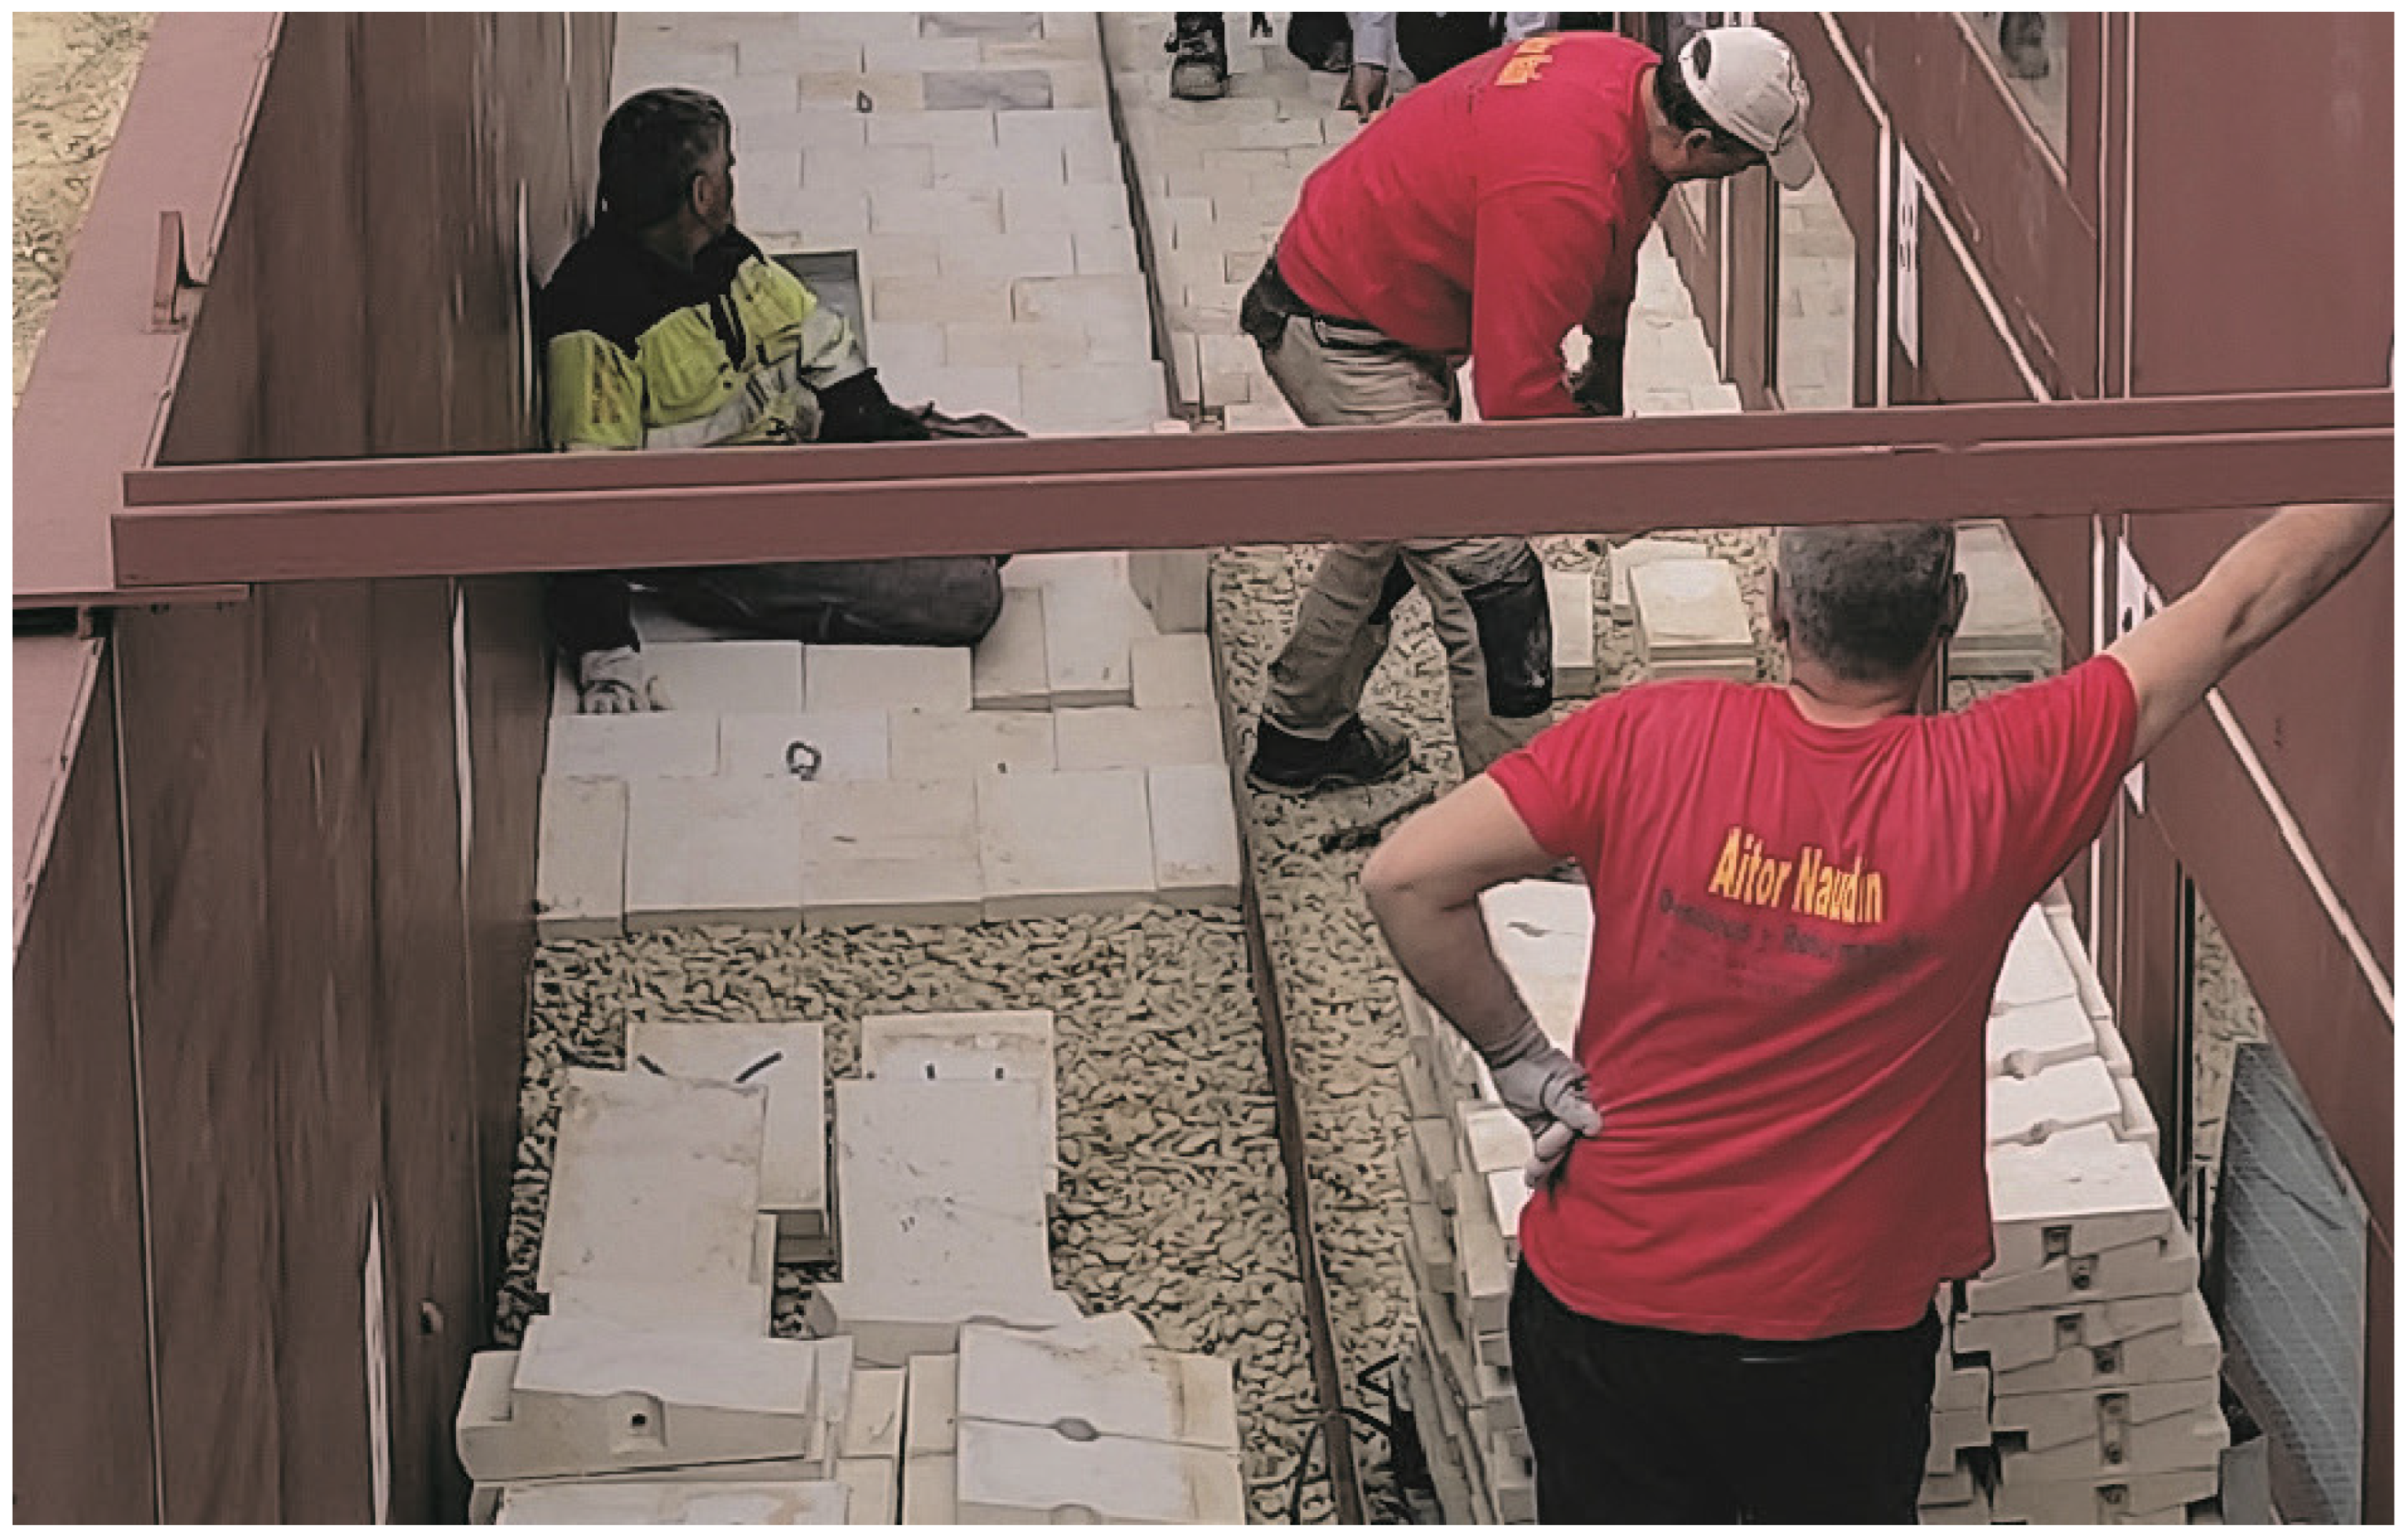
The different WSB models tested in each trial were placed on a 0.20 m thick bedding layer of homogeneous gravel in the particle size range of 12 to 20 mm. This granular layer was placed over wire mesh with 40-mm openings fixed to the bottom of the testing chute (Figure 6).
- Small block, weighing 5.0 kg, 167.0 mm wide (A) and 243.3 mm long (L).
- Medium block, weighing 15.0 kg, 250.0 mm wide and 364.3 mm long.
- Large block, weighing 35.0 kg, 330.0 mm wide and 401.8 mm long.
- Note that the dimensions are proportional for every size of the block. Thus, the scale ratio between the small and large WSB is 0.51, and 0.76 between the medium and large.
The WSBs were placed in horizontal rows, starting from the bottom row (row #1) and working upward. WSB placement used a staggered configuration of longitudinal joints among the blocks. To achieve the staggered pattern, half-pieces of WSB were placed at the end of alternate horizontal rows, as shown in Figure 8.
Two types of WSB were tested in each of the two sessions of tests. To do this, the flume was divided into two halves, 1 m wide each, symmetrical along the longitudinal axis of the chute. The division was made by a longitudinal intermediate wall formed by a 400 mm high metallic sheet welded to the bottom of the chute (Figure 9).
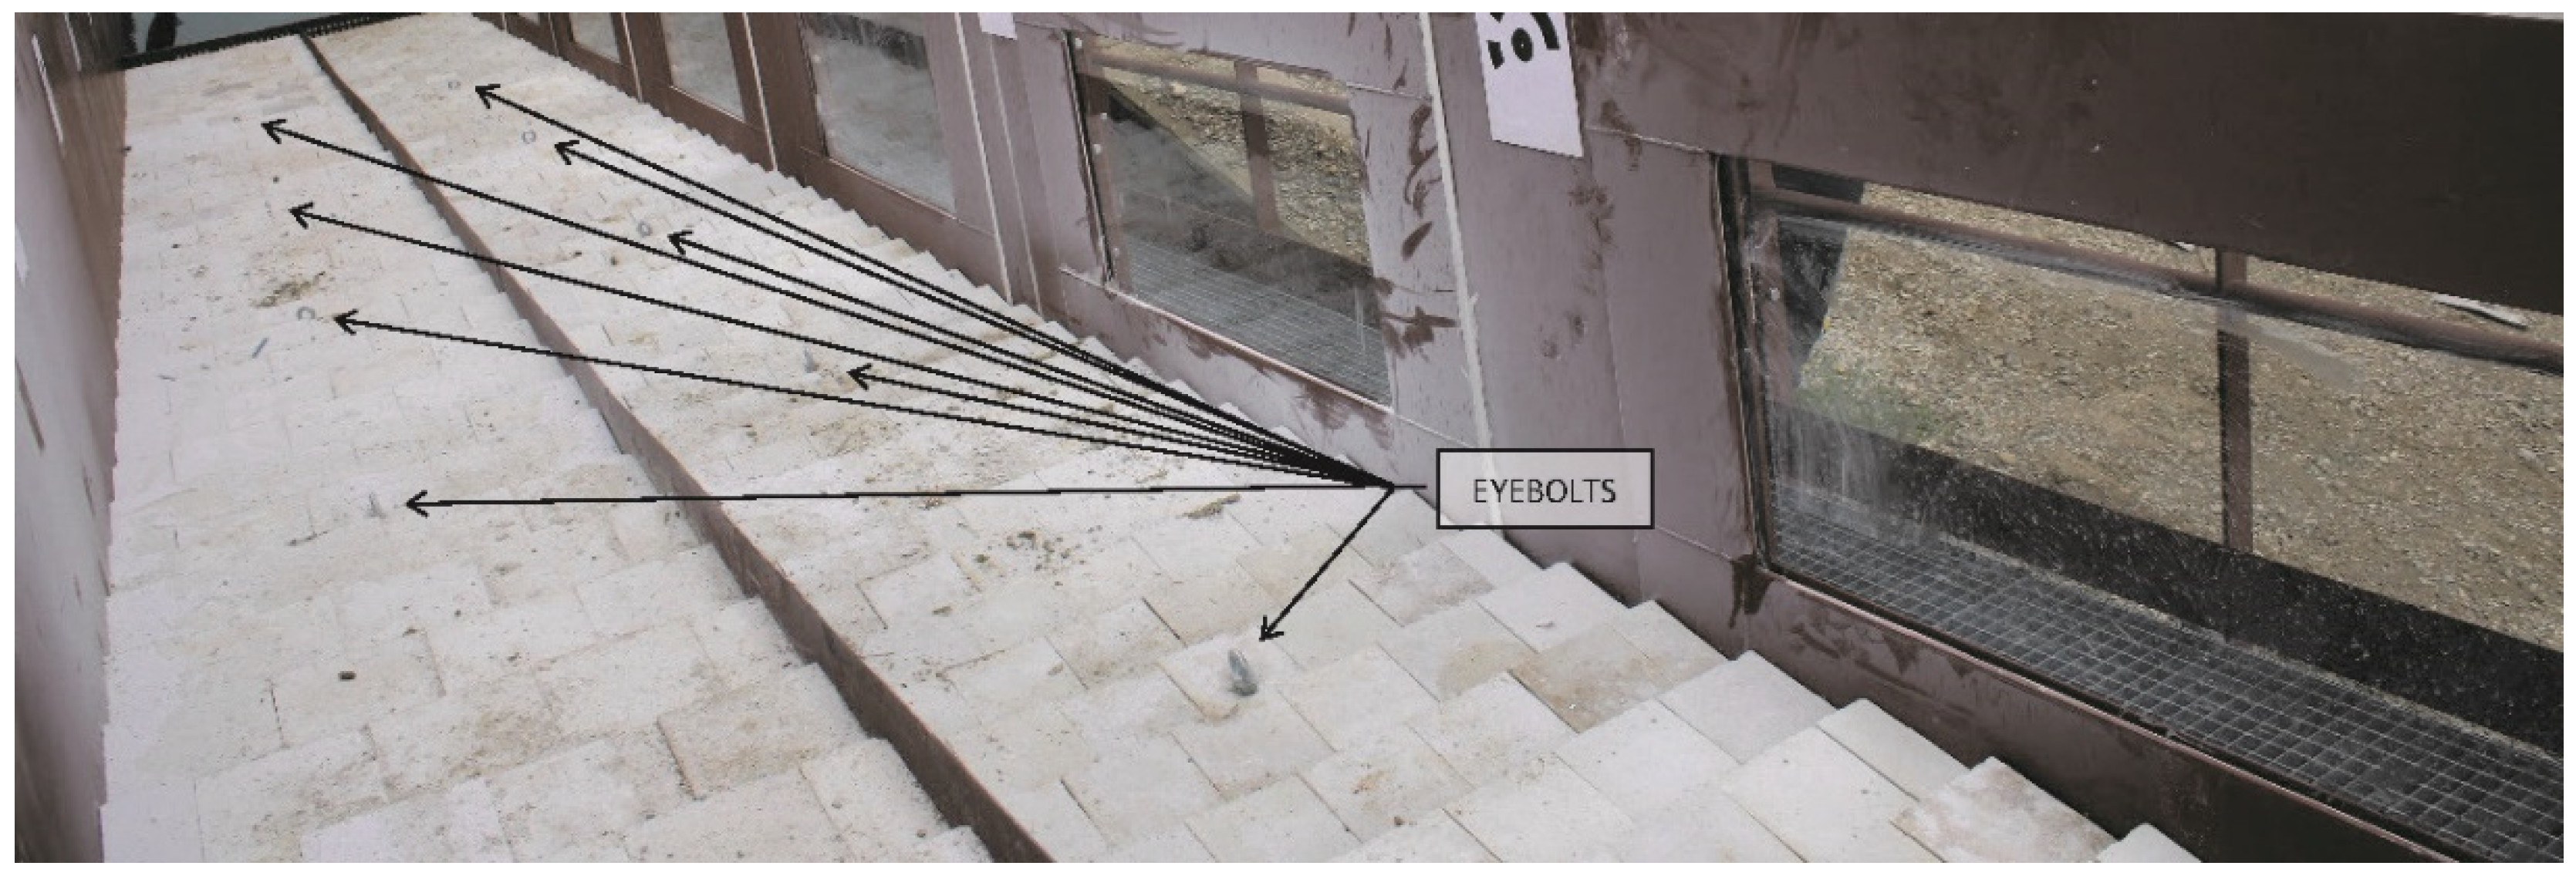
In the first test session, small and medium WSBs were used. The small WSBs were placed along the right half of the test channel in 80 rows, plus 1 end with trimmed blocks for the upstream row. In total, there were 440 WSBs, 80 half-blocks, plus 6 blocks for the upstream row (row# 81). Medium WSBs were placed in 53 rows, plus an additional row at the upstream end with trimmed blocks. In total, there were 186 WSBs, 52 half-blocks, and 3 blocks, plus 2 half-blocks, for the upstream row (row# 54). Additionally, an eyebolt was installed on some WSBs for block extraction tests (Figure 9). The pieces to be extracted were in the central block of six selected rows and distributed along the channel in rows #16, #26, #36, #44, #54 and #64 for the small blocks, and #10, #18, #24, #30, #36 and #42 for medium blocks.
In the second set of tests, the small and large blocks were installed. The small WSBs were the same ones used in the first session as they remained in place after the first session without apparent damage. The large WSBs were placed in the left half of the test channel in 40 rows, plus one at the upstream end with cut blocks for top finishing. In total, 100 WSBs, 40 half-blocks, and 3 blocks for the upstream row (row 41). Some of the large WSB were also prepared for extraction tests with eyebolts in rows #9, #13, #19, #23, #27 and #33.
2.3. Instrumentation
The variables measured during tests were the flow rates in the auxiliary channel, the force needed to extract a single block from its original position by lifting on the eyebolt at the end of the test and the movements of the WSB.
2.3.1. Flow Rates
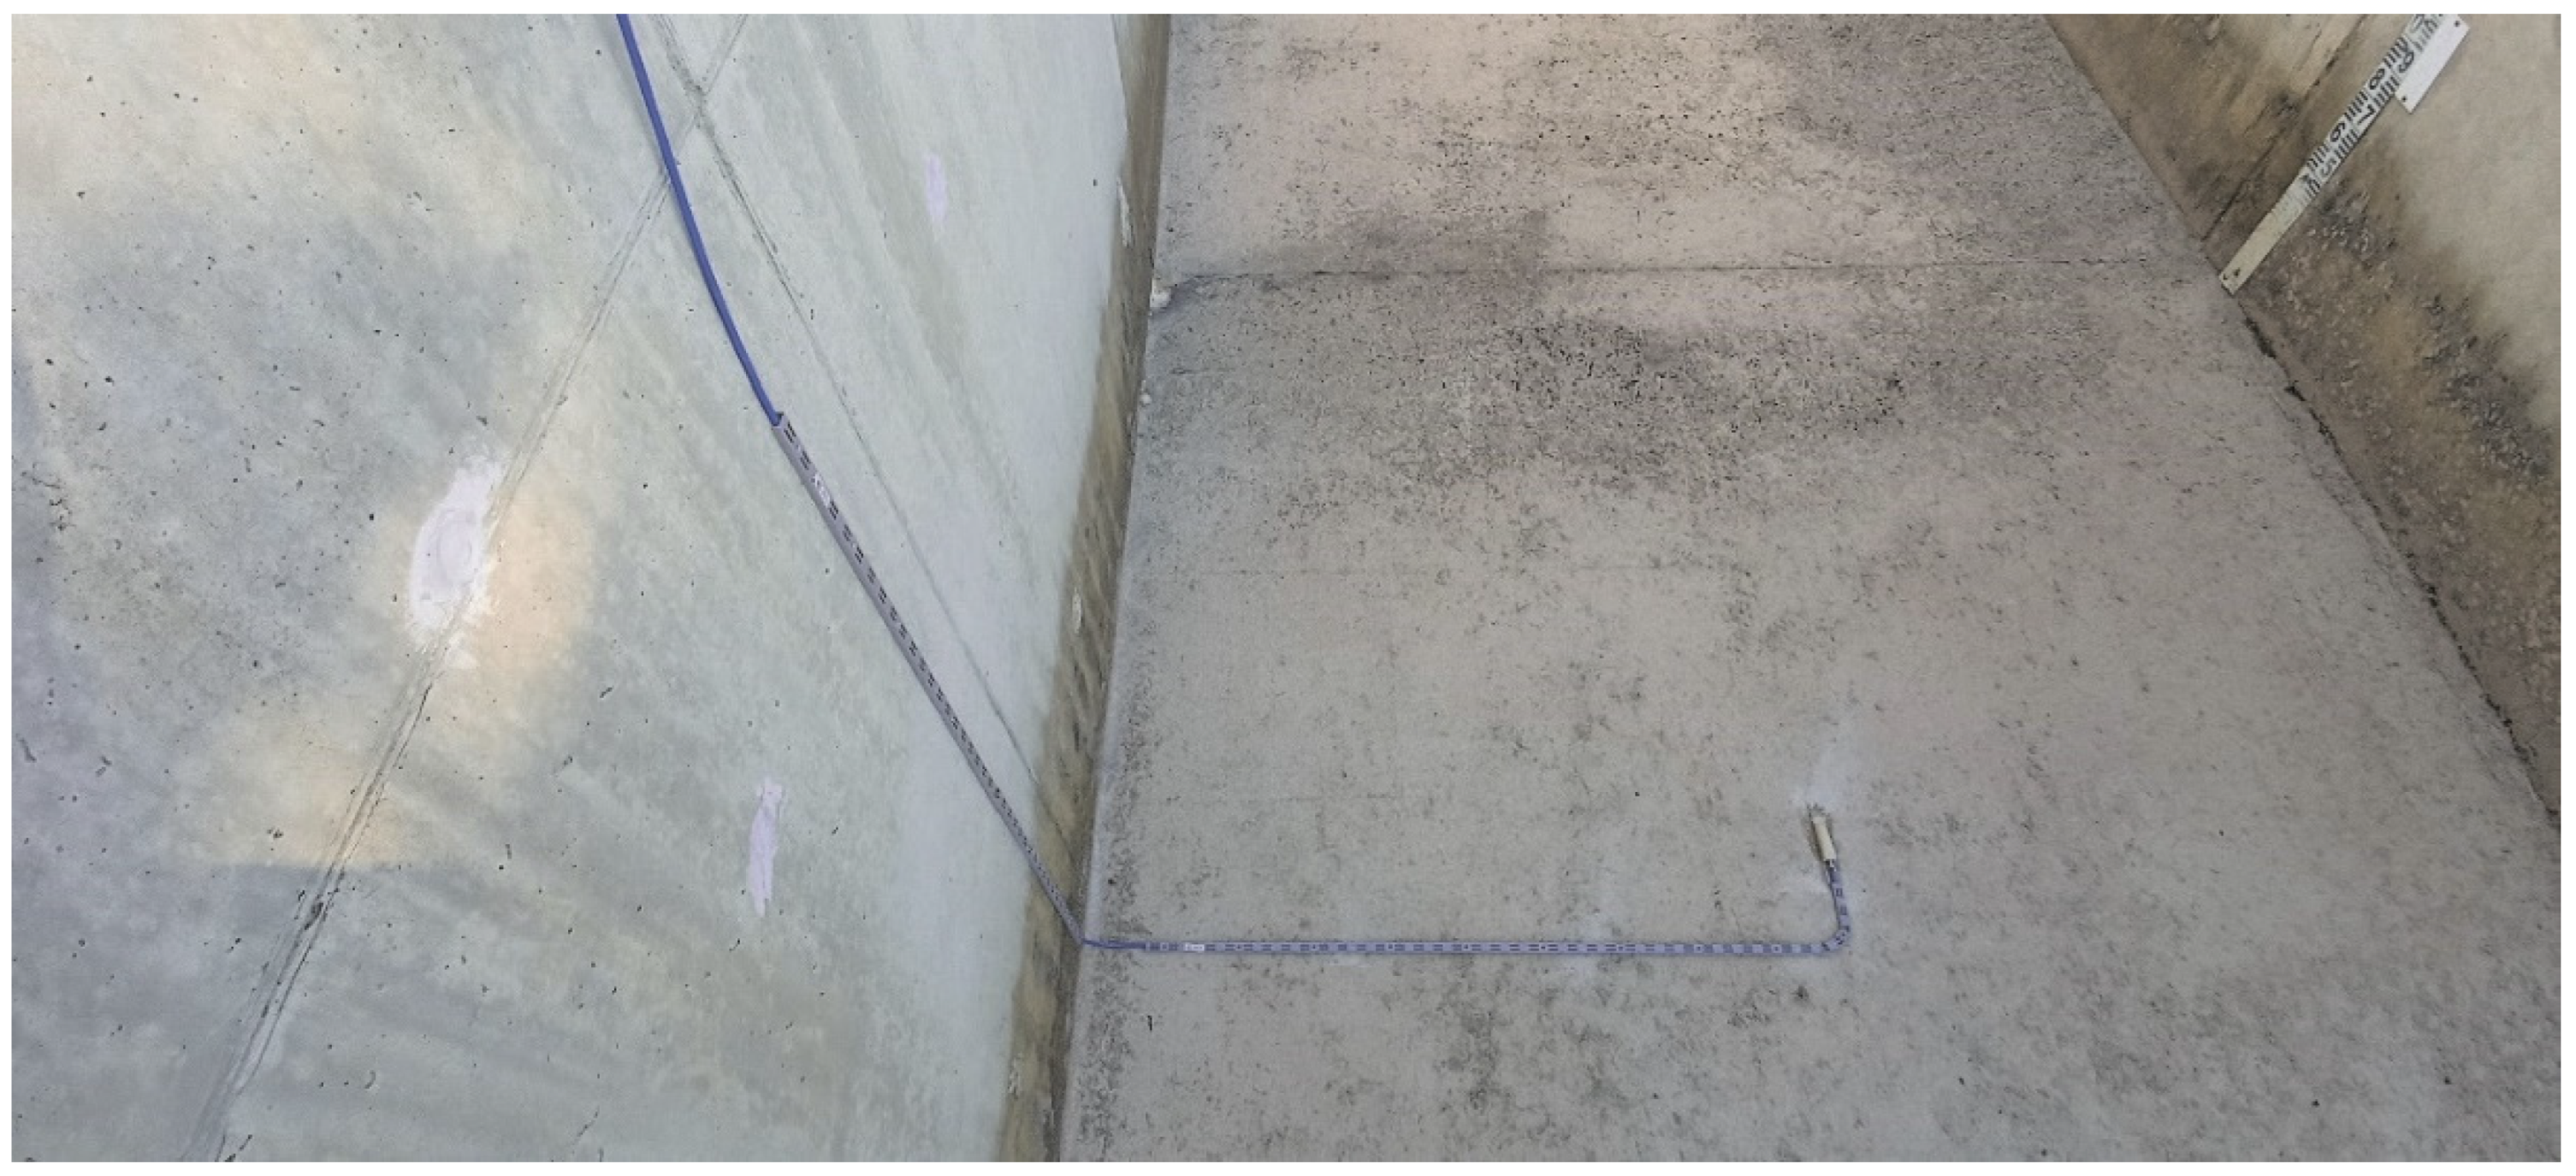
Flow rates were continuously recorded with a Nivus Portable Flowmeter, model NFM 750, connected to a combined sensor (CSM Flow Transducer model CSM-V1D0KN007P) for flow velocity and water depths (Figure 10).
The flowmeter uses the operating principle of ultrasonic correlation to determine the speed of water at different water depths, whereby the reflective particles contained in the medium (minerals, bubbles of air, dirt, etc.) are scanned using ultrasonic pulses transmitted at a certain angle.
2.3.2. Extraction Force of a Single Block from the WSB Armoring
The forces needed to extract a block installed in the test channel after each session were measured. The measurement system consisted of a load cell linked to a continuous display of the applied effort and a recording device that registered the maximum force applied during the entire extraction process. The load cell is the model Siwarex WL 230 SB-S SA (SIEMENS), for a nominal load of 1 tons and precision class C3. It is a shear load cell that is used for both tension and compression loading. The measurement element comes in a hermetic casing and has the output voltage calibrated and proportional to the load. For the recording and display of the forces, a Ditel brand multifunction digital indicator, the MICRA-M model of the Kosmos series, has been used, whose basic functions allow for display of the input variable as well as other programmable functions.
2.3.3. Movements of the WSB
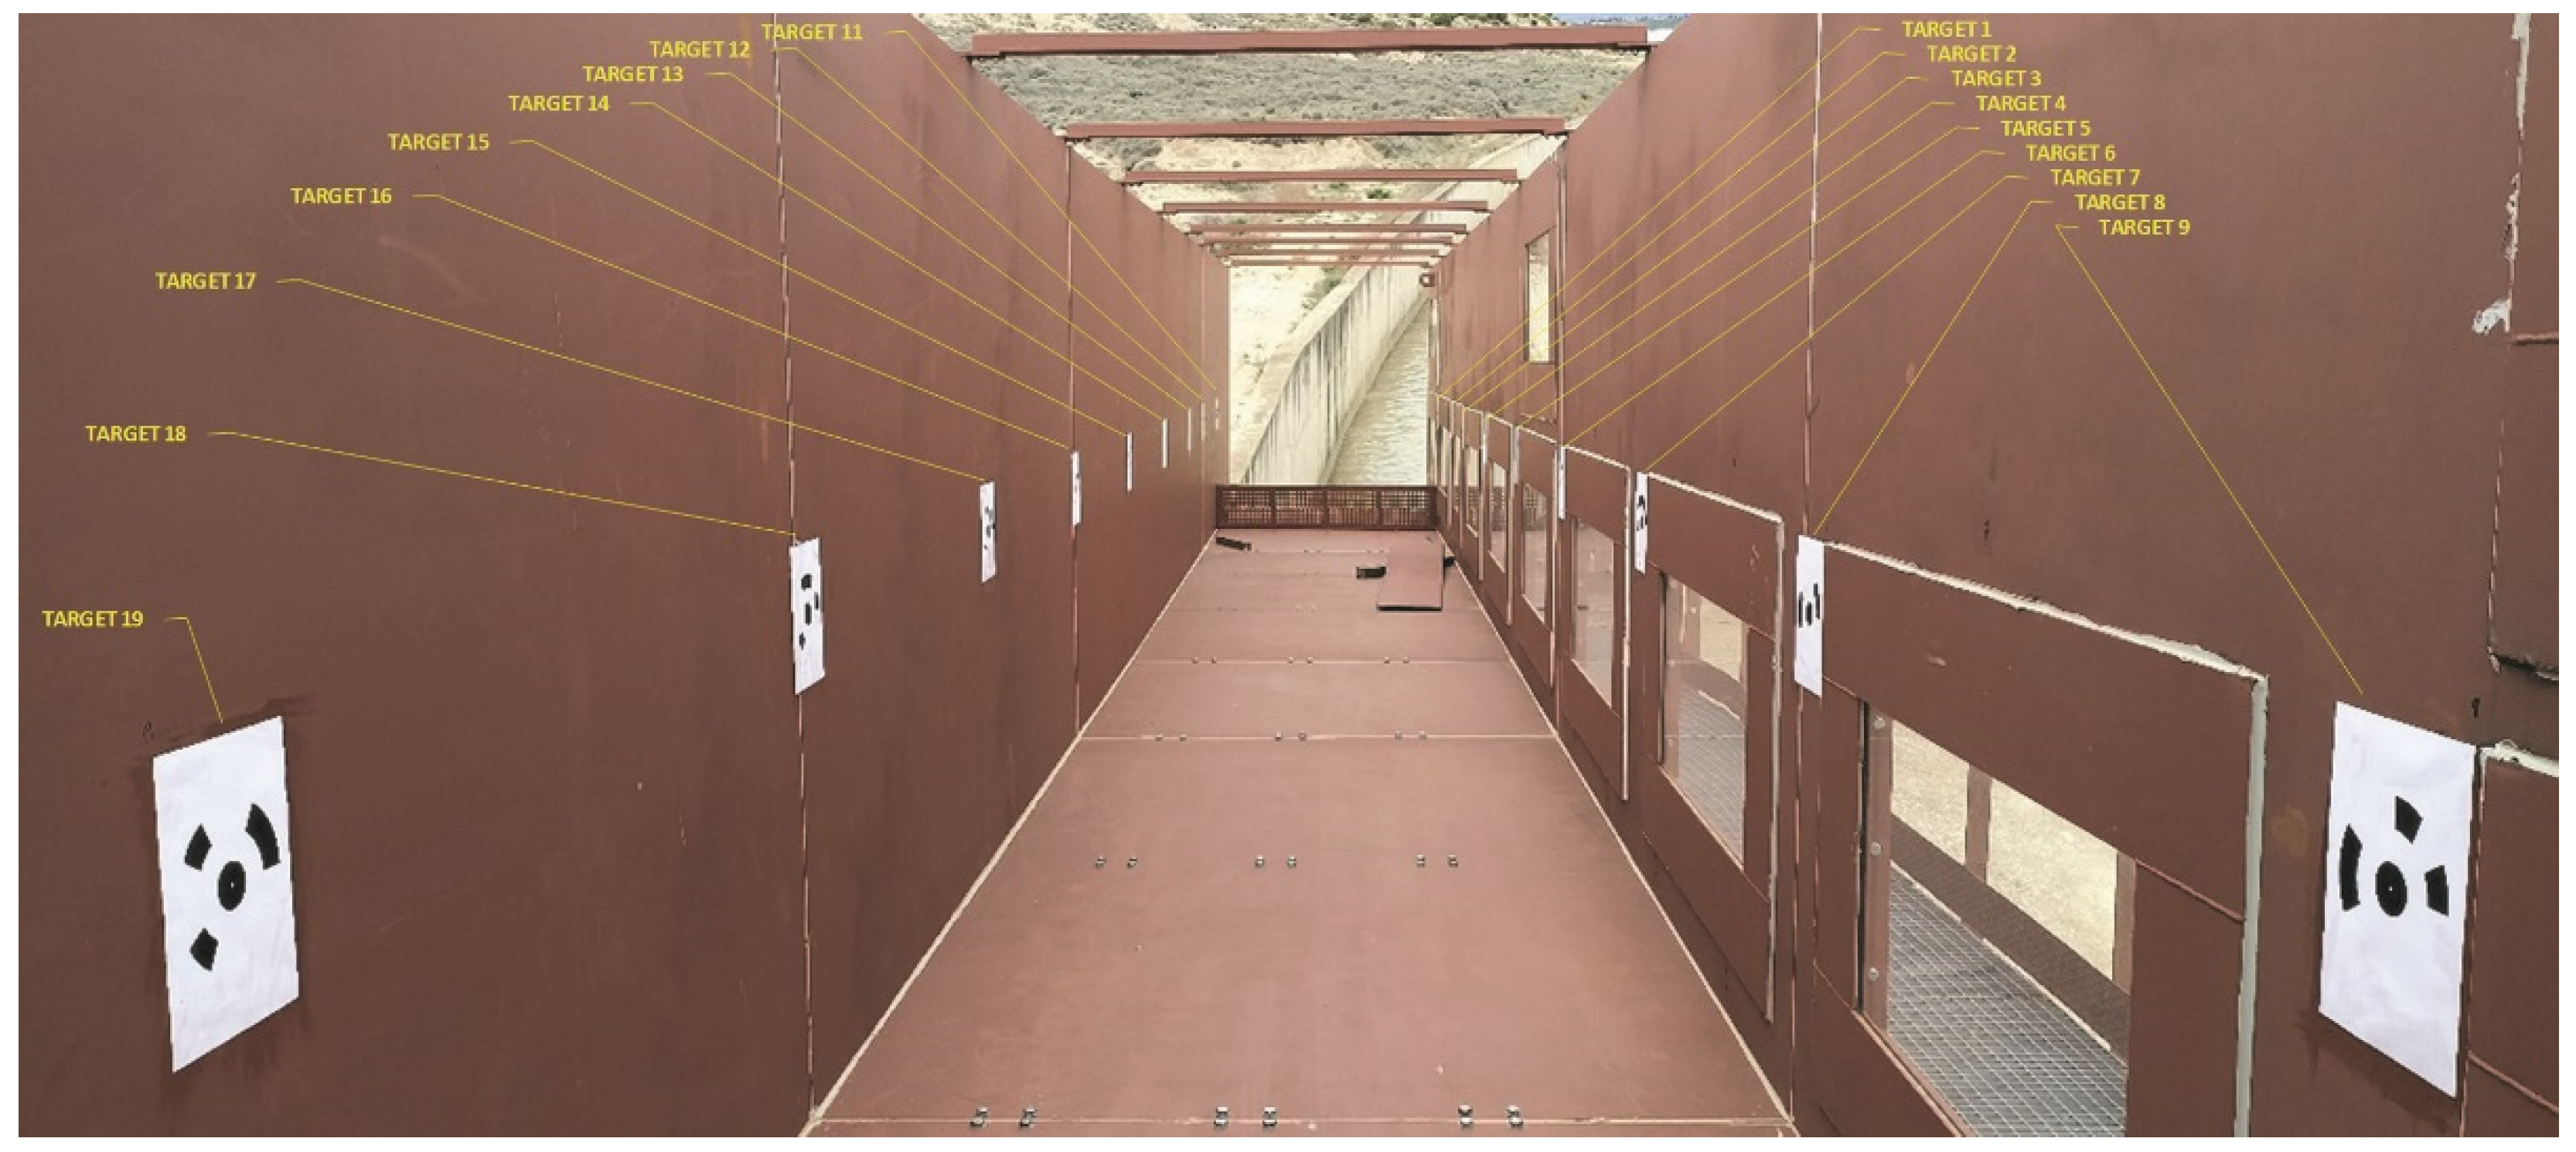
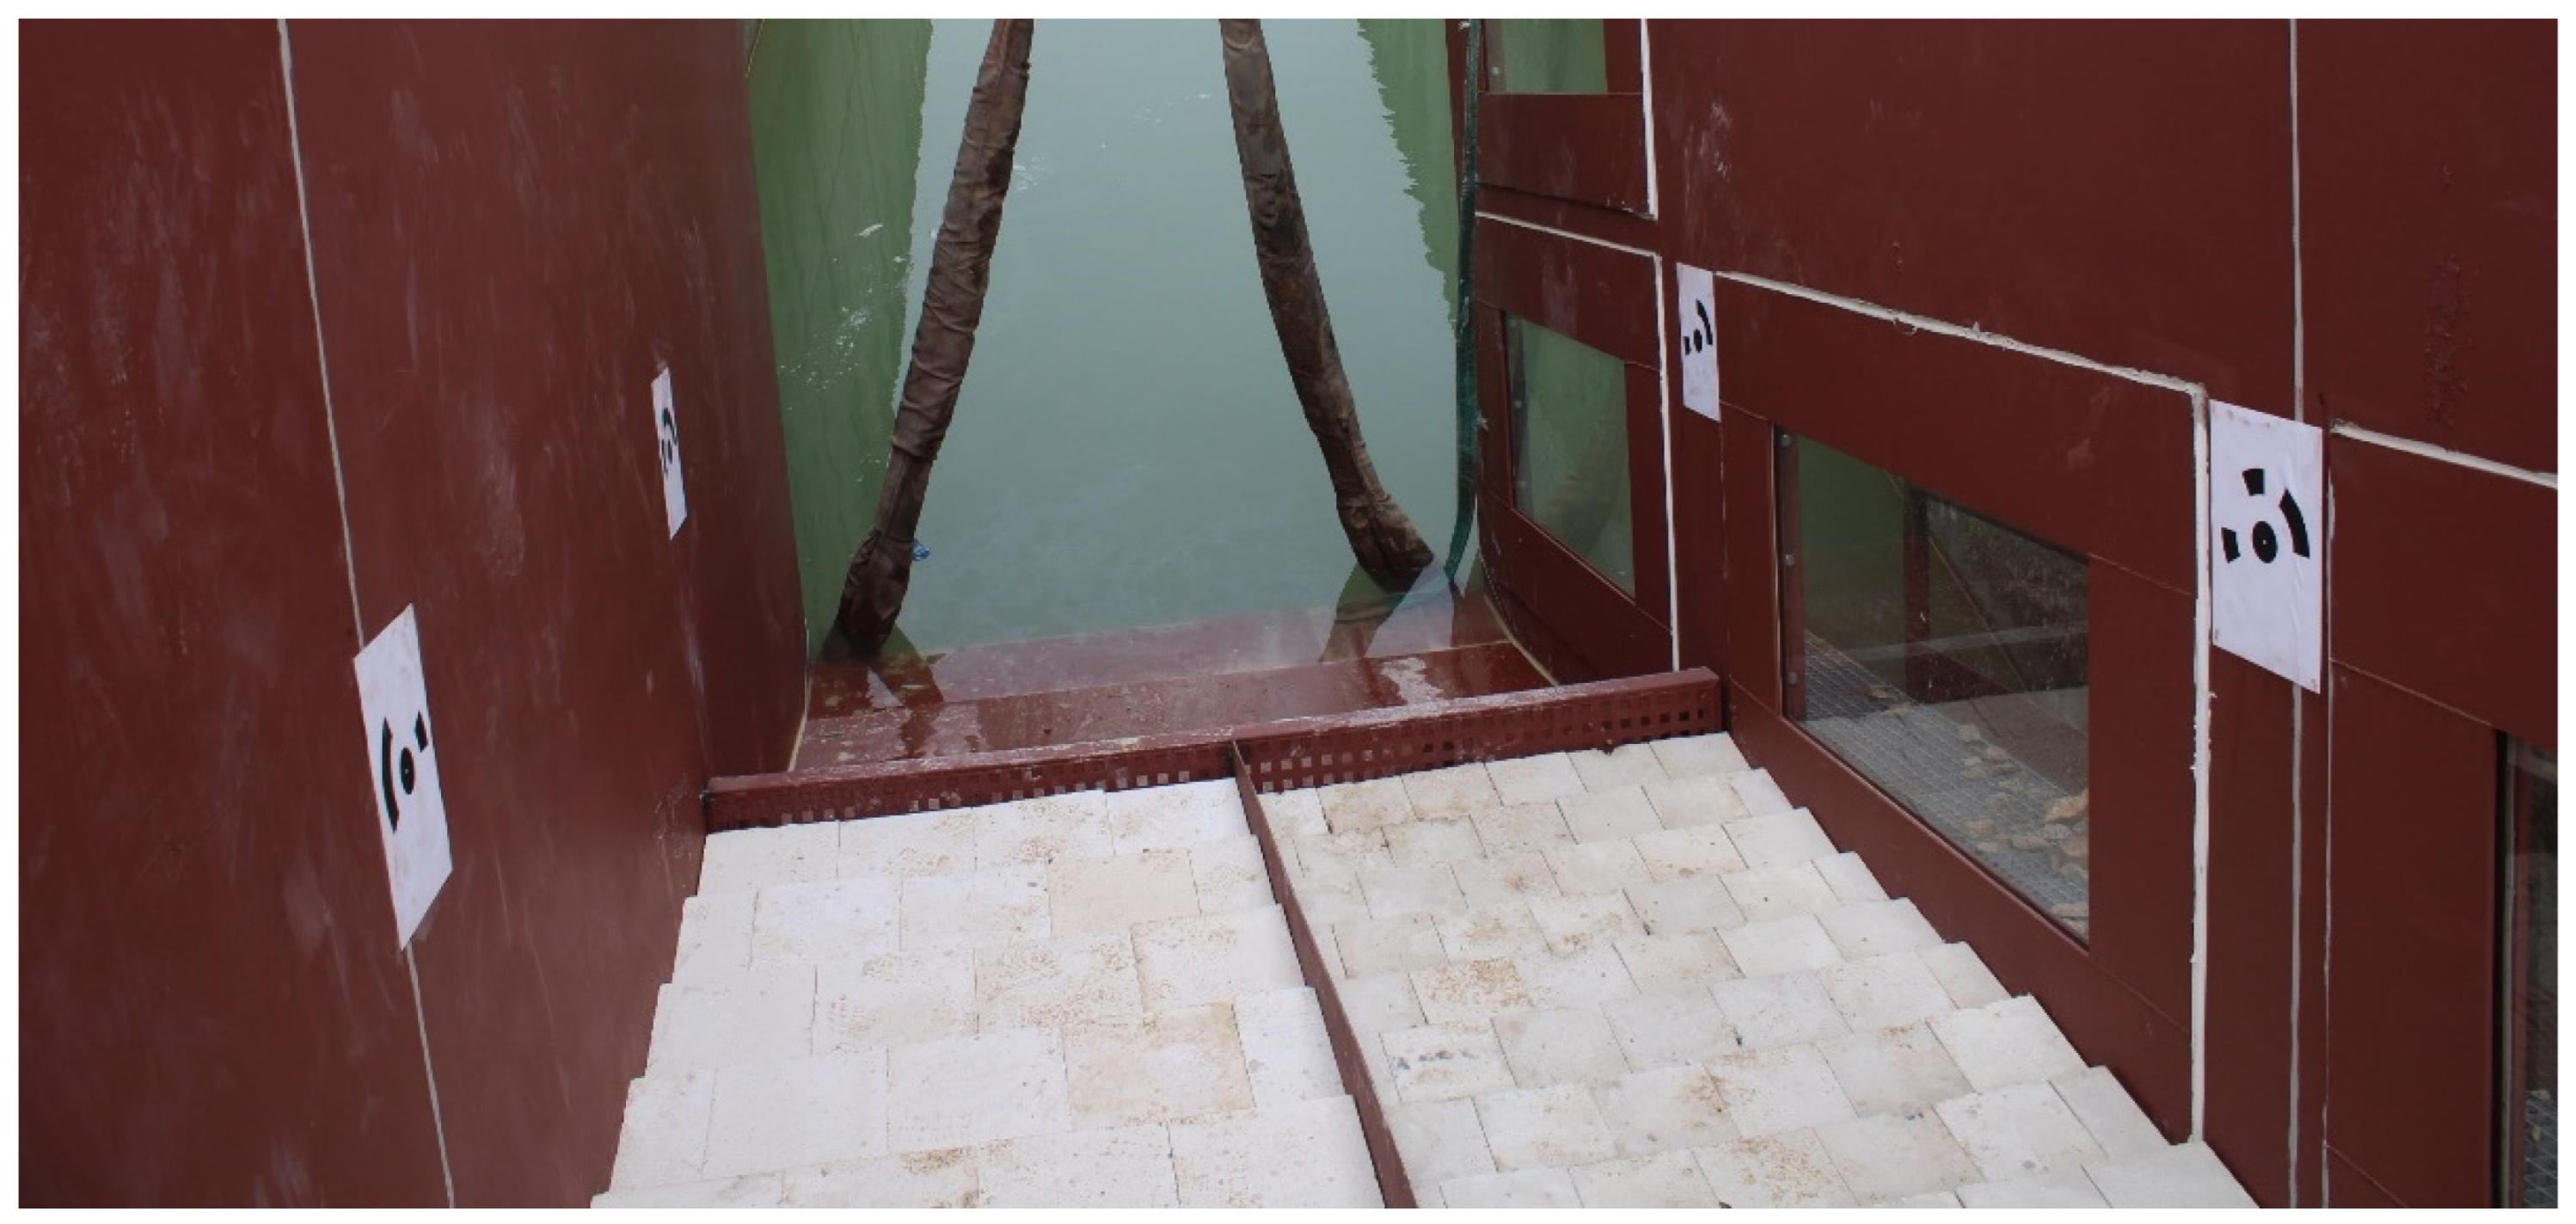
The movements of the blocks after each test session were measured by means of a comparison between 3D digital models of the external surface of the initial and final state. Digital terrain models (DTM) were obtained from photographs with digital cameras processed by Agisoft PhotoScan Professional v.1.4.3. The assignment of scale and a reference system to the DTM required a series of known support points (targets) that must appear in the different frames. Therefore, 18 targets were generated and adhered to the side walls of the chute (Figure 11). Nine were installed on the right wall of the chute, numbered from 1 (downstream) to 9 (upstream), and the other nine were installed on the left wall of the chute, numbered from 11 (downstream) to 19 (upstream).
3. Results and Discussion
The main results of the two testing sessions are presented in this section. It should be noted that during the first session of tests, both small and medium sized WSBs were able to withstand flow rates, with a maximum steady flow of 1.8 m3 s−1 and a final flow rate peak of 2.0 m3 s−1, without apparent damage. In the second test session, the small blocks failed, at a steady flow rate of 4.7 m3 s−1. The session continued until reaching maximum steady flow rates of 6.8 m3 s−1 with maximum peaks of 7.2 m3 s−1, without any damage to the large blocks. However, at the end of the session, during the abrupt decrease in Acequia de Sora flow supply (which quickly decreased from more than 7 m3 s−1 to less than 1 m3 s−1, in roughly 10 min), there was a sudden failure of most of the large blocks and the granular bedding layer. As a result, the session ended and the WSB movement survey photos could not be obtained, nor could the extraction tests be performed.
The results were organized into three parts. The Section 1 describes the overall performance of the tests and the hydraulic loading. The following sections describe the movements of the WSB and the extraction tests (only for the first session of tests).
3.1. Hydraulic Loading and Performance of the WSB Armorings
3.1.1. Test Session 1
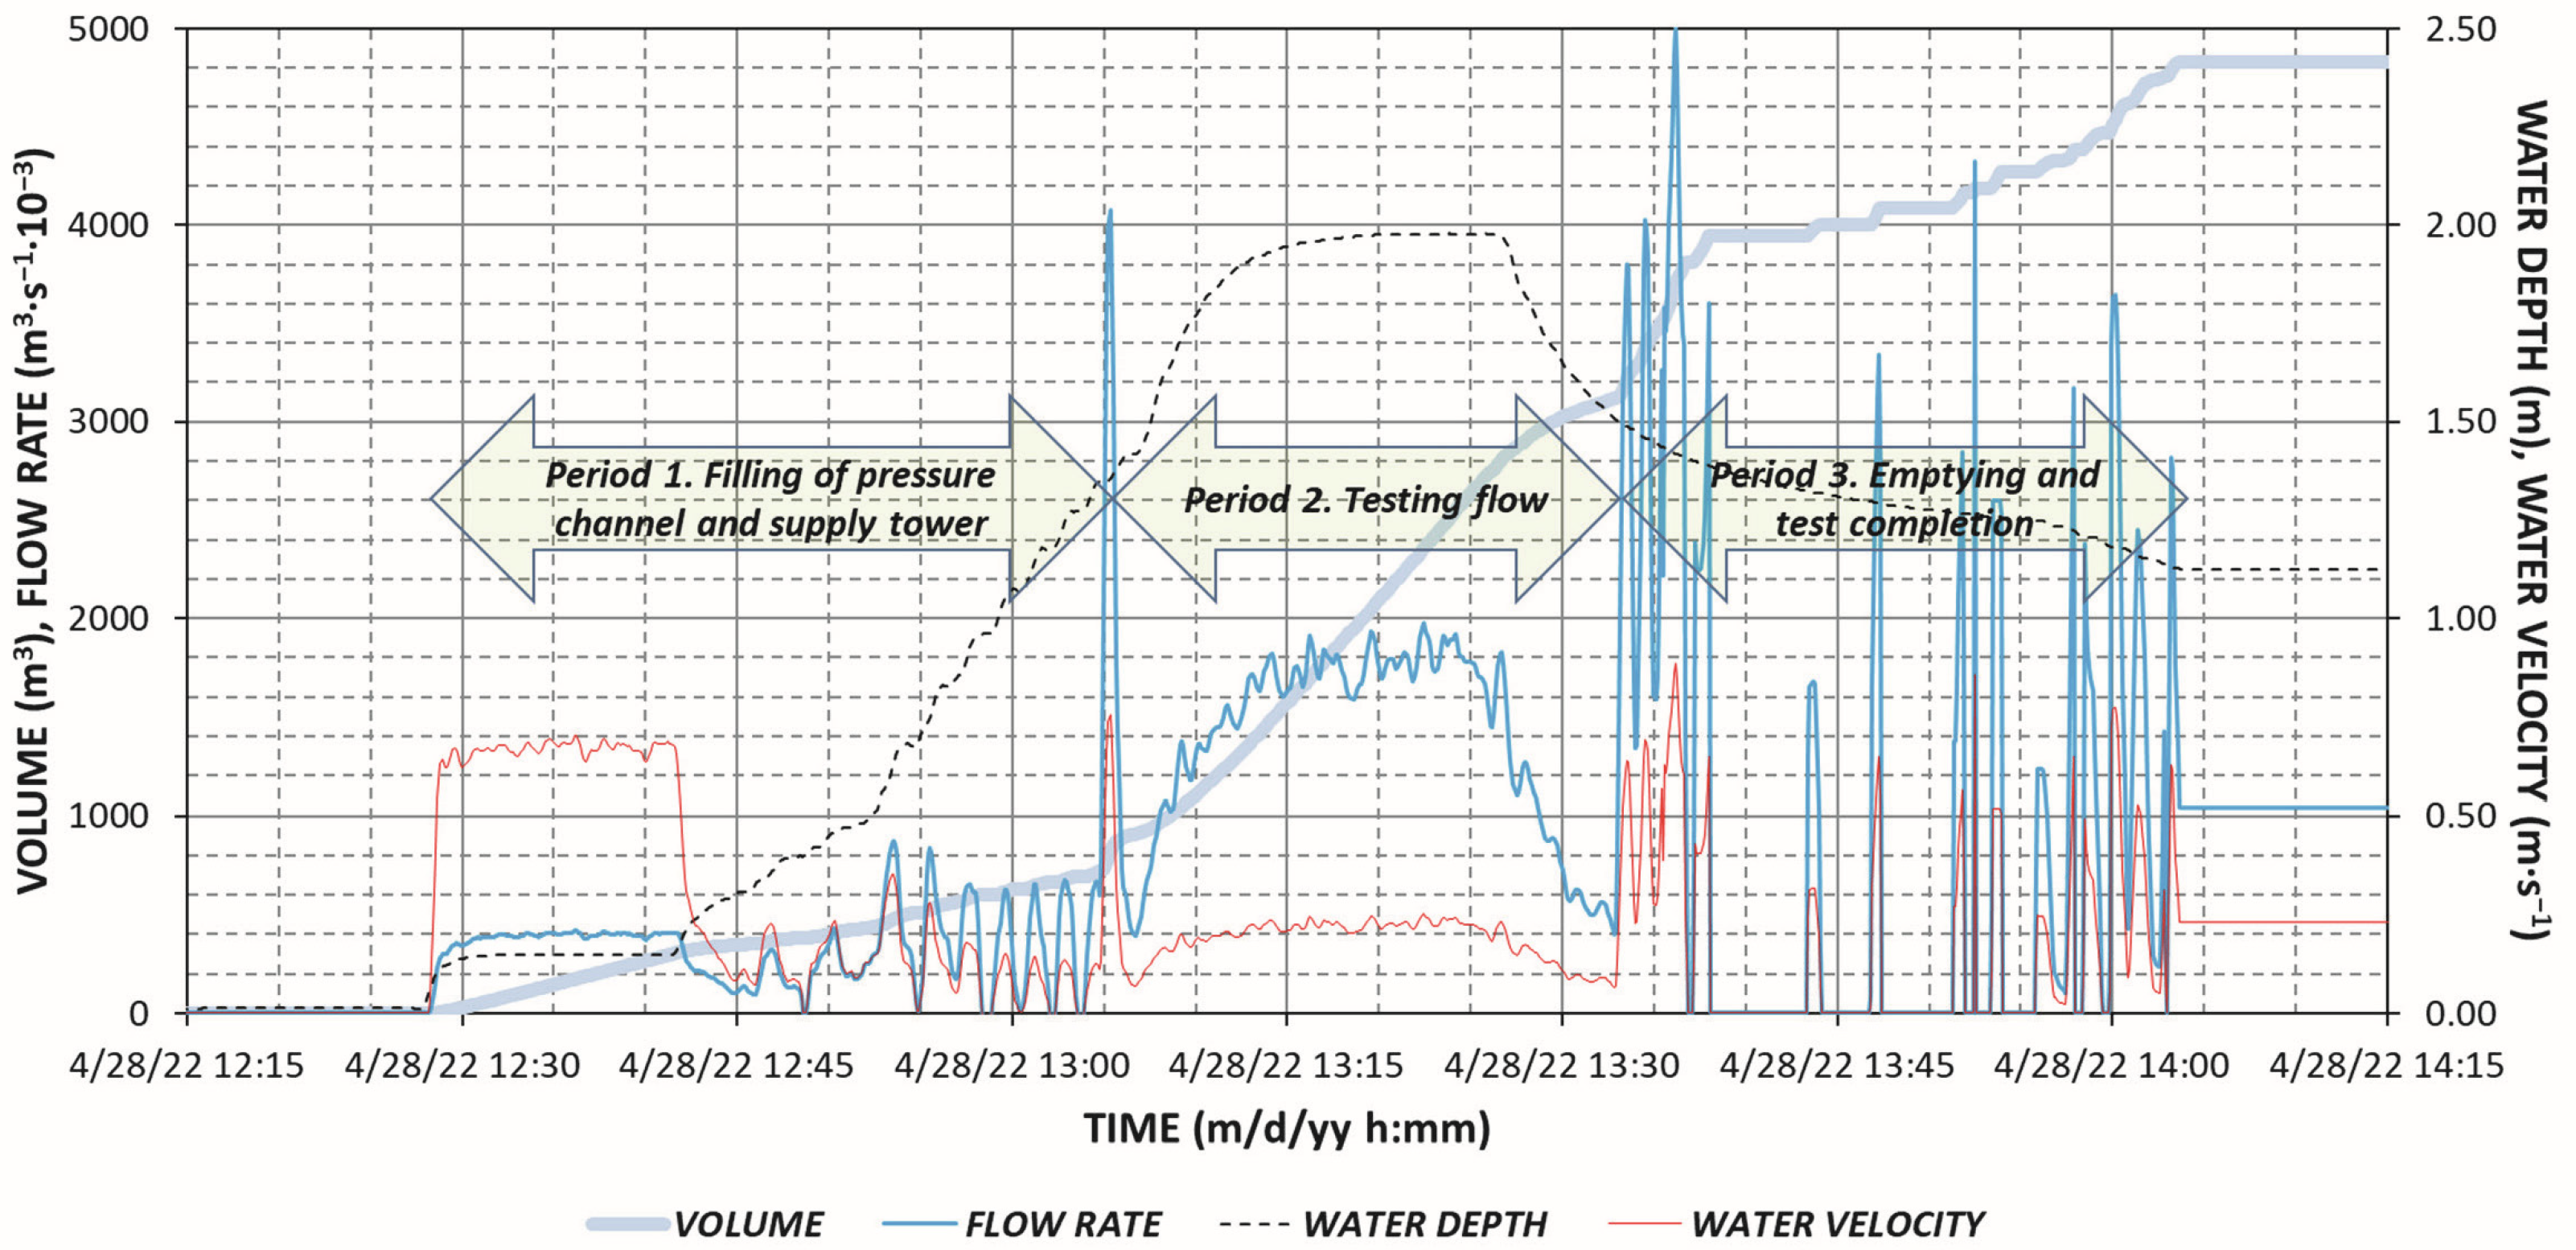
The session began with the filling of both the pressure channel and the supply tower. A constant flow rate of approximately 0.4 m3 s−1 was supplied until the elevation of the water surface at the tower reached the bottom of the upstream section of the testing chute. Subsequently, the flow rate was increased to an average of approximately 1.8 m3 s−1. This discharge was applied for nearly 20 min, presenting some peak discharges of 2.0 m3 s−1. After this period, a leak was observed in the joint between the supply tower and the test chute, and the session had to be ended (Videos S4 and S5 in the Supplementary Materials). The total volume of water supplied from Acequia de Sora was 4000 m3 of the 58,000 m3 originally planned for this session.
The inflow hydrograph and the time series of water velocities, water depths, and water supply volume during this session are presented in Figure 13 with data registered every 5 s.
During test session 1, neither the small nor the medium-sized blocks suffered apparent damage with unit flows of 0.9 m2 s−1 and peaks up to 1.0 m2 s−1. According to the methodology developed by San Mauro et al. [24] the thickness of the drainage layer should be between 0.60 and 0.95 m. These values were obtained through various calculations in which a sensitivity study was carried out, varying the estimate of seepage based on the investigations carried out by Caballero et al. [23] and San Mauro et al. [25] considering the permeability of the drainage layer. It should be noted that the methodology of San Mauro et al. aims to avoid the existence of uplift pressures in the drainage layer. Therefore, in this case, with a 0.20 m gravel layer, uplift pressures could develop at the base of the WSB. Such pressures were resisted by a combination of actions, such as the weight of the WSB, the positive pressure of the skimming flow that impinges on the upper face of the WSB, the overlap of the different rows, and the drainage of the seepage flow through the vents of the blocks.
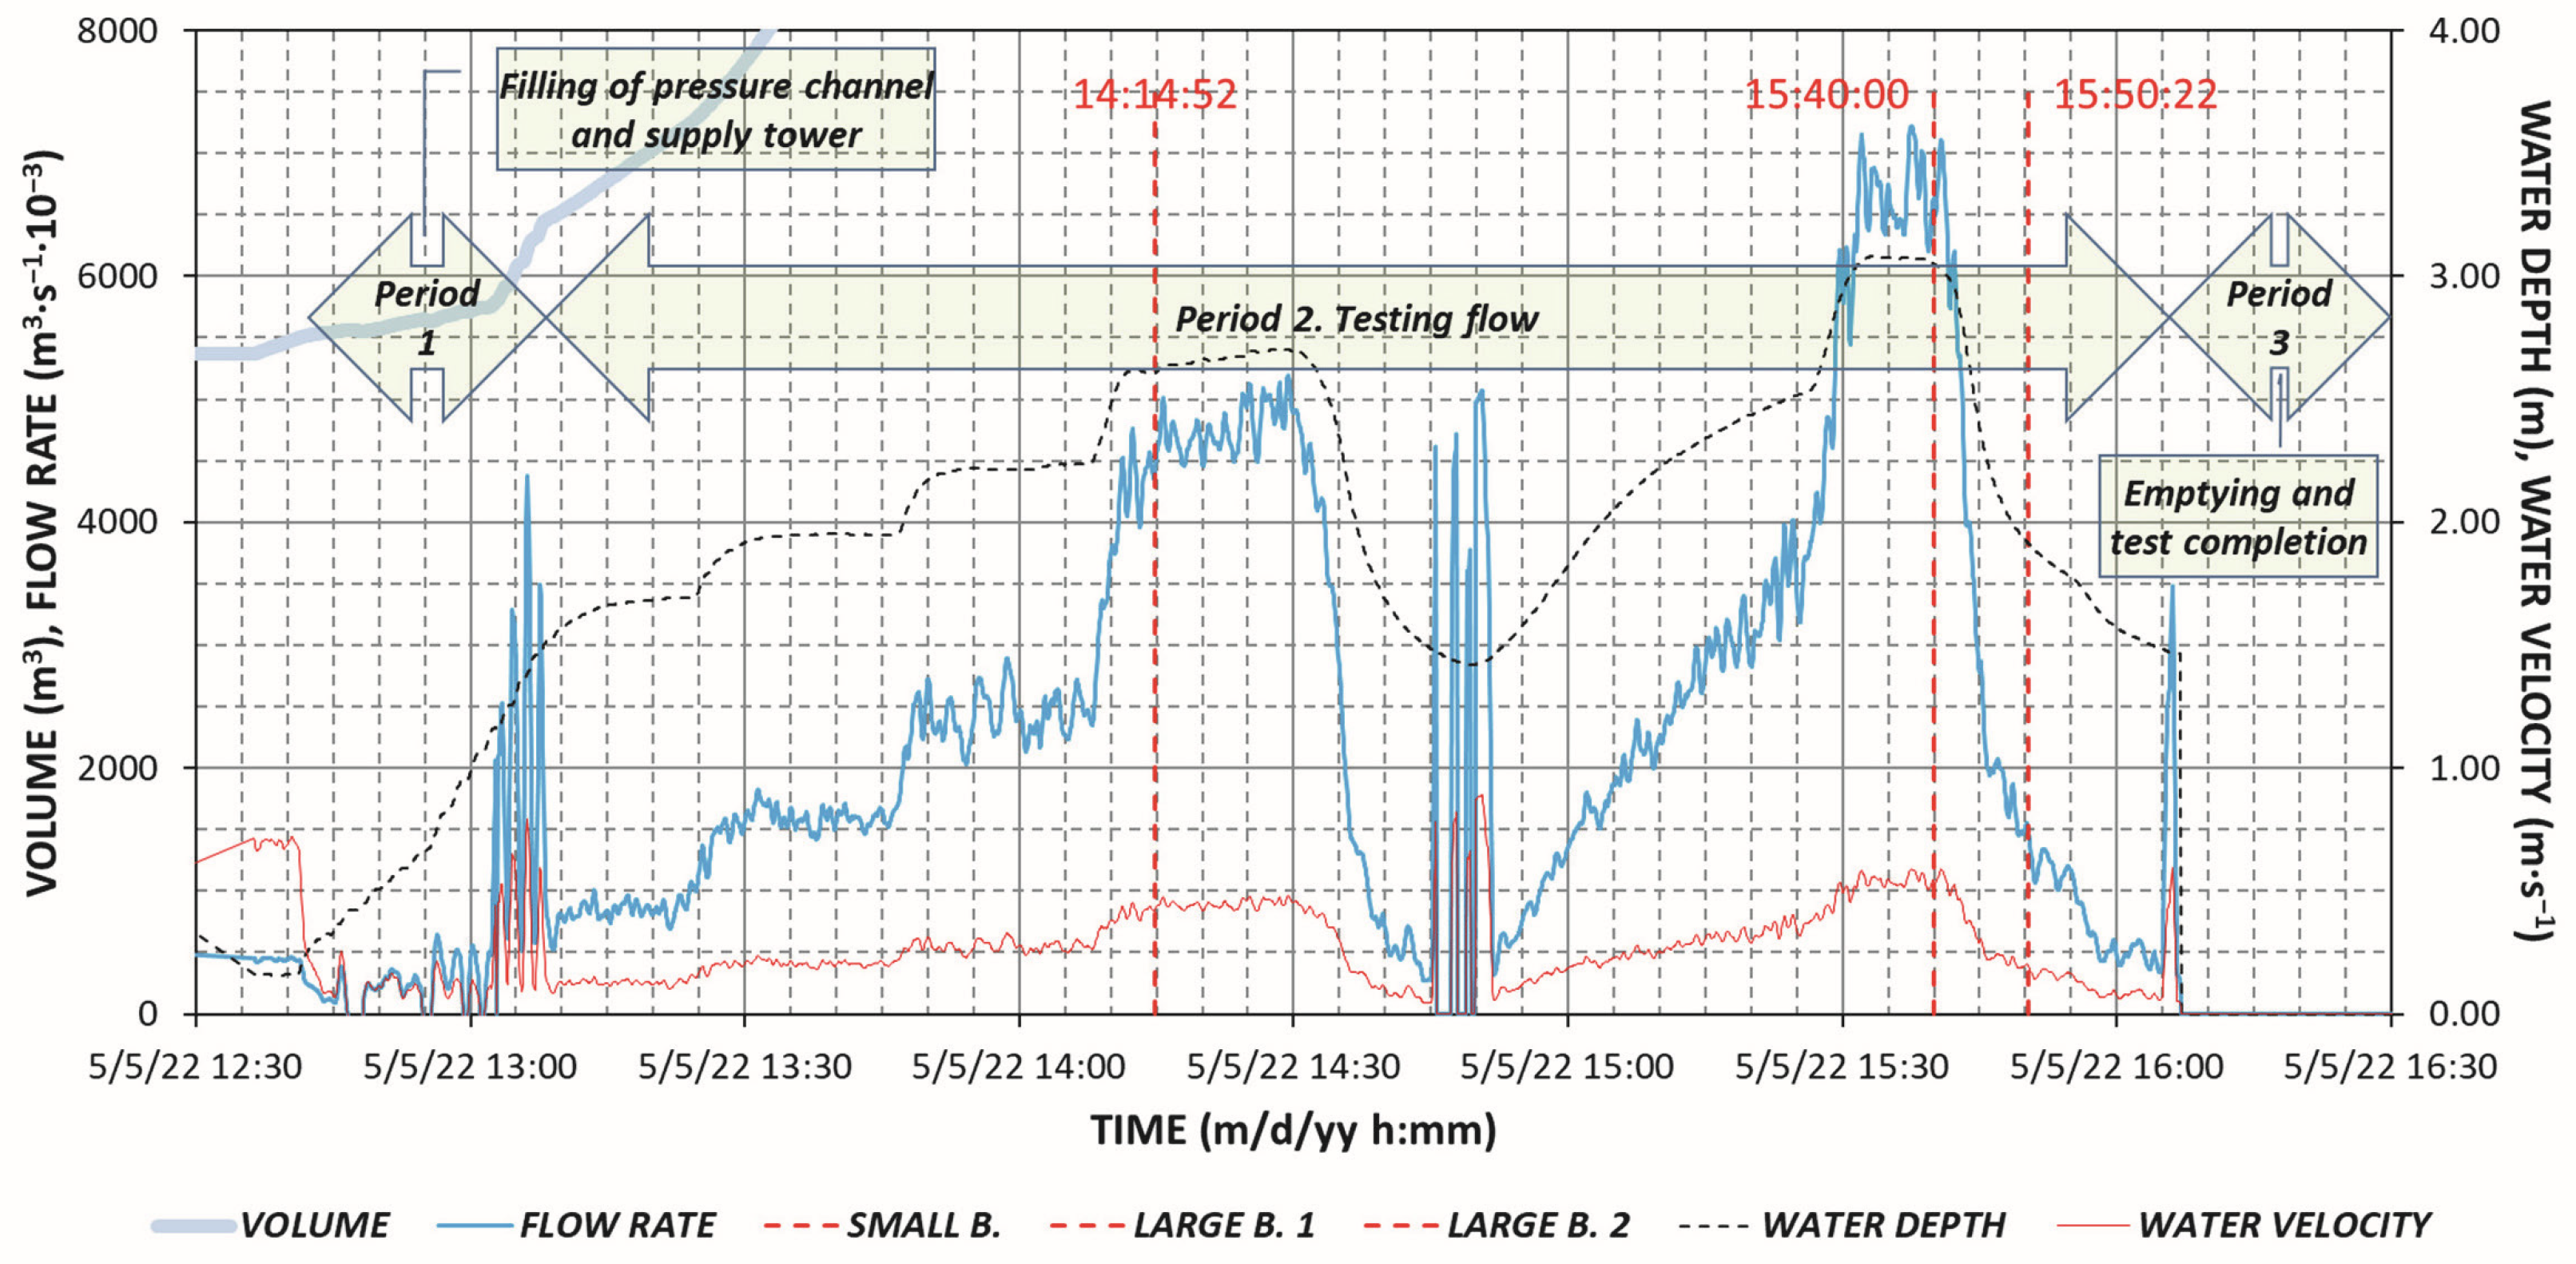
3.1.2. Test Session 2
In test session 2, the pressure channel and the supply tower were filled with a flow rate of 0.3 to 0.4 m3 s−1, similarly as in test session 1. After the filling period, a discharge of approximately 0.9 m3 s−1 was supplied for 15 min. The discharge was increased to 1.7 m3 s−1 for another 15 min and again to 2.5 m3 s−1, which was applied for another 20 min, for a total time of approximately 1 h. Next discharge was increased for 20 min to an average flow rate of 4.7 m3 s−1, with maximum peaks of 5.2 m3 s−1 (Video S6 in the Supplementary Materials).
The last discharge was the maximum possible inflow that could be supplied through the inlet control gate. Higher discharges required the closure of the gate to be able to operate the overflow weir at the inlet. This operation lasted almost 1 h, at which time the discharges were significant and the level in the Acequia de Sora increased. At that time, the Acequia intake gate was completely reopened and a discharge of 6.8 m3 s−1 was achieved with peaks of 7.2 m3 s−1. This hydraulic loading was the maximum discharge that could be achieved with the conditions of the Acequia de Sora at that time. The team decided to end the test session by closing the control gate as quickly as possible to save the maximum volume of water. The total volume of water supplied from Acequia de Sora, during approximately 3 h of the test session 2, was almost 30,000 m3 of the 52,000 m3 that was planned. The inflow hydrograph and the evolution of the water velocities, water depths, and volume of water supply during this session are presented in Figure 14 with data registered every 5 s.
The performance of the WSB armoring was different for the two sizes of blocks during test session 2. The small WSBs could resist unit discharges up to 2.4 m2 s−1. For higher discharges, they were destabilized and completely washed downstream. The large WSBs could resist overflowing discharges of 3.4 m2 s−1 with peaks of up to 3.6 m2 s−1. However, it was surprisingly observed that large WSBs were destabilized and moved downstream during shutdown operations after the session when the overflowing discharge was rapidly decreased, for overflowing discharges significantly lower than those that the WSB armoring could resist during the continuous flow testing. The large WSBs were completely removed during this sudden failure, except for the 4 upper rows.
Similarly to test session 1, the minimum thickness of the drainage layer needed to avoid uplift pressure was calculated to be between 1.4 and 2.2 m, significantly larger than the provided thickness. In this case, uplift pressures may be one of the possible causes of the small WSB protection failure. The large WSBs could have also been affected by this action during the rapid decrease in discharge during shutdown of the test.
3.2. Movements of the Surface of the WSB Armoring
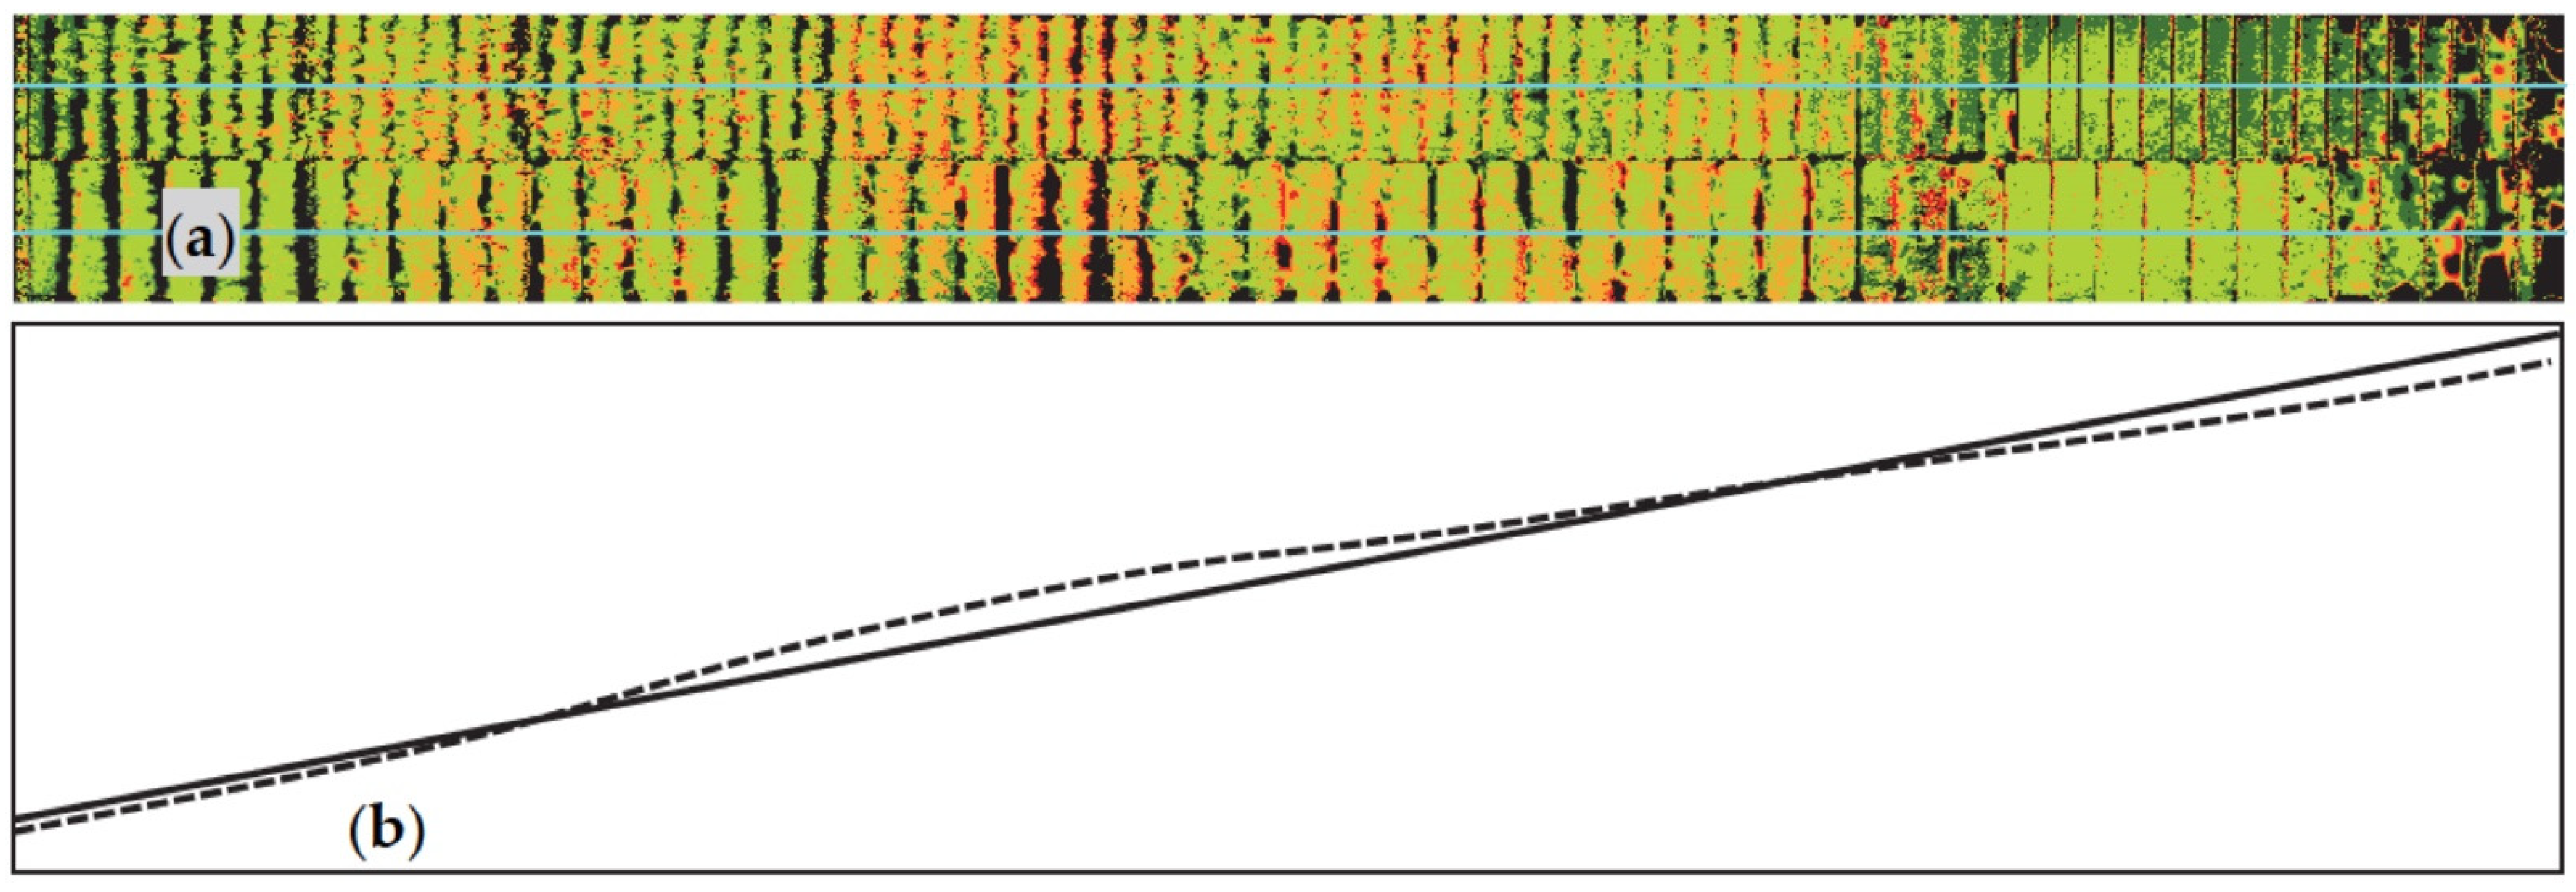
The movements of the WSB armoring could only be measeured in test session 1 due to the failure of the WSBs in test session 2. Both DTMs were obtained before and after the test session. Each DTM was processed by GIS software to obtain the raster difference between the initial and final DTM and 3 longitudinal profiles for each WSB size representing the original and final state and the difference between the original and final states.
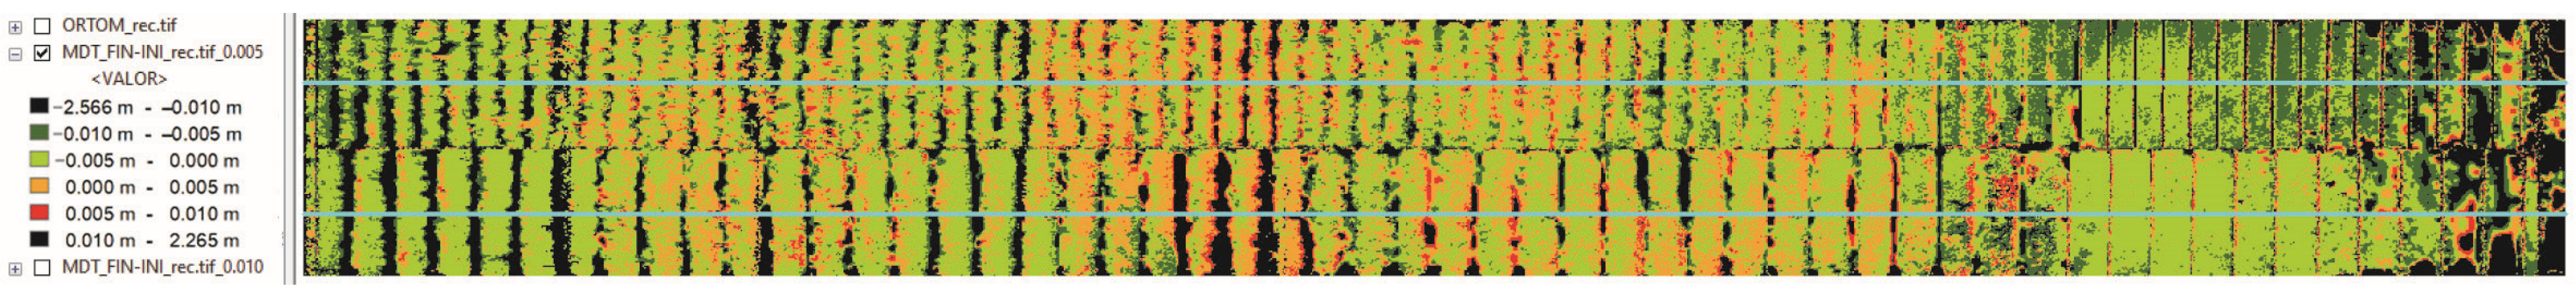
Figure 15 shows the displacements of the points that experience downward movements (from 0 to 5 mm in light green and from 5 to 10 mm in dark green) and upward movements (from 0 to 5 mm in orange and from 5 to 10 mm in red). In general, downward vertical displacement of less than 5 mm (light green) dominates, with some areas that reach 10 mm (dark green) and 20 mm.
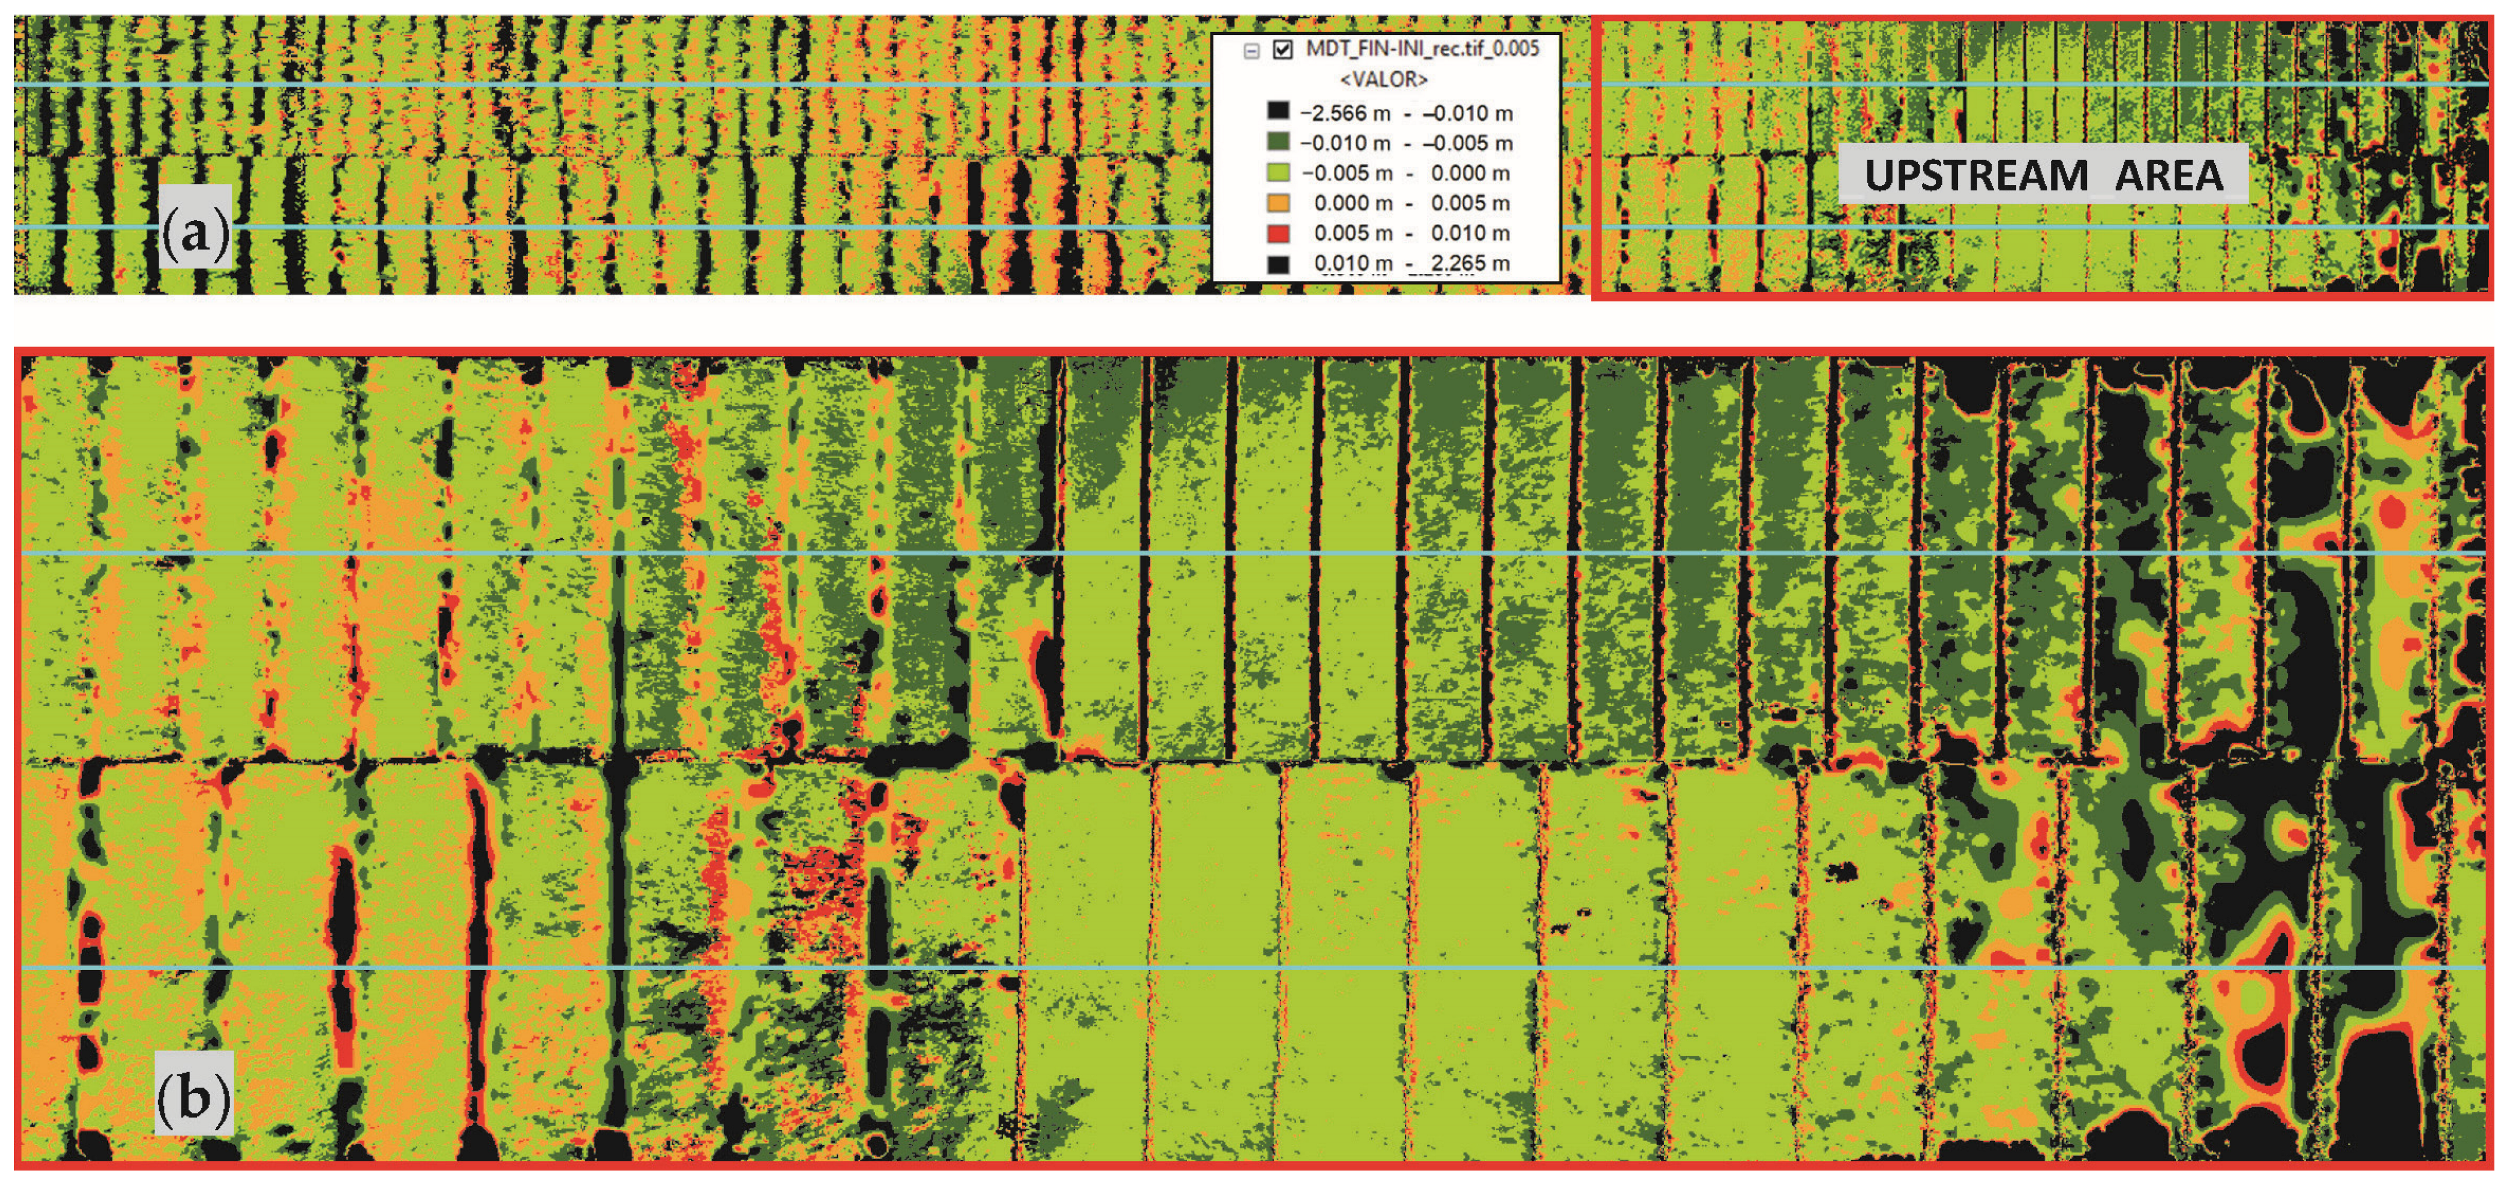
- A more detailed representation of the upper rows of the WSB armoring (rows #53 to #81 of the small WSB and #35 to #54 of the medium WSB) is shown in Figure 16. In the initial and final zones of the channel, the decrease occurs in complete blocks (mainly green zones) and is especially pronounced in the small blocks of the upper part of the channel (dark green).
Figure 16.
(a) Sketch of the situation of the upper rows in the test chute. (b) Detail of the upstream area of the channel (rows #53 to #81 of the small WSB, in the upper part of the photograph, and rows #35 to #54 of the medium WSB, at the bottom of the figure).
Figure 16.
(a) Sketch of the situation of the upper rows in the test chute. (b) Detail of the upstream area of the channel (rows #53 to #81 of the small WSB, in the upper part of the photograph, and rows #35 to #54 of the medium WSB, at the bottom of the figure).

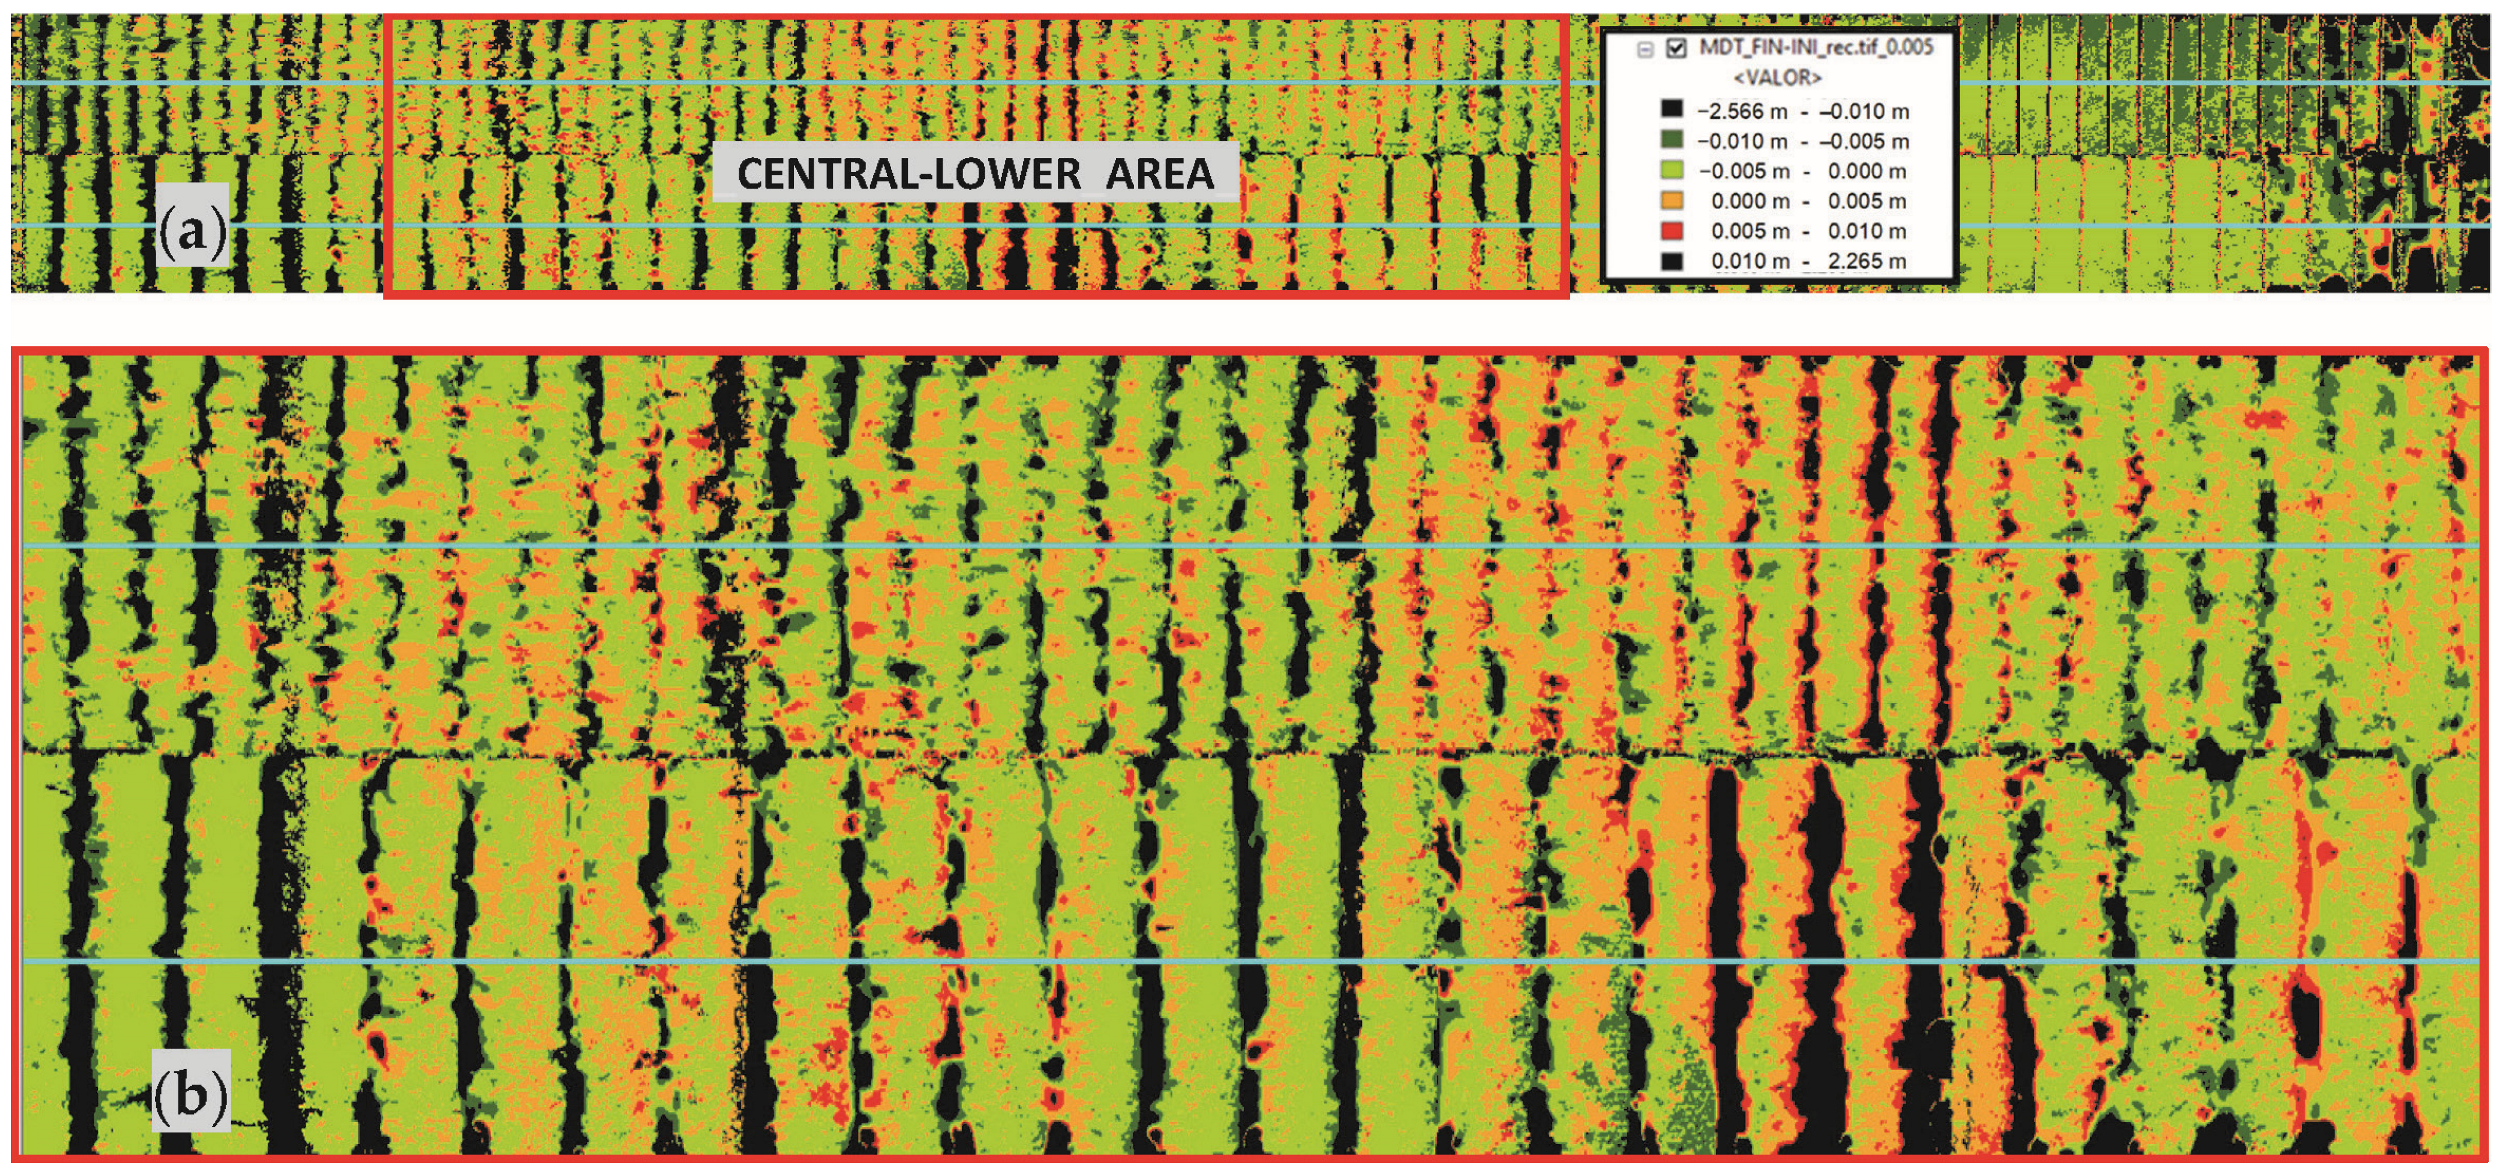
- In contrast to the upper rows, upward movements appeared frequently in the lower and central rows, but with values lower than 5 mm (orange colors), and were usually accompanied by areas with downward movements (green colors) within the same row of blocks (Figure 17).
Figure 17.
(a) Sketch of the situation of the central-lower rows in the testing chute (b) Detail of the upstream area of the channel (rows #6 to #43 of the small WSB, in the upper part of the photograph, and rows #4 to #29 of the medium WSB, at the bottom of the figure).
Figure 17.
(a) Sketch of the situation of the central-lower rows in the testing chute (b) Detail of the upstream area of the channel (rows #6 to #43 of the small WSB, in the upper part of the photograph, and rows #4 to #29 of the medium WSB, at the bottom of the figure).

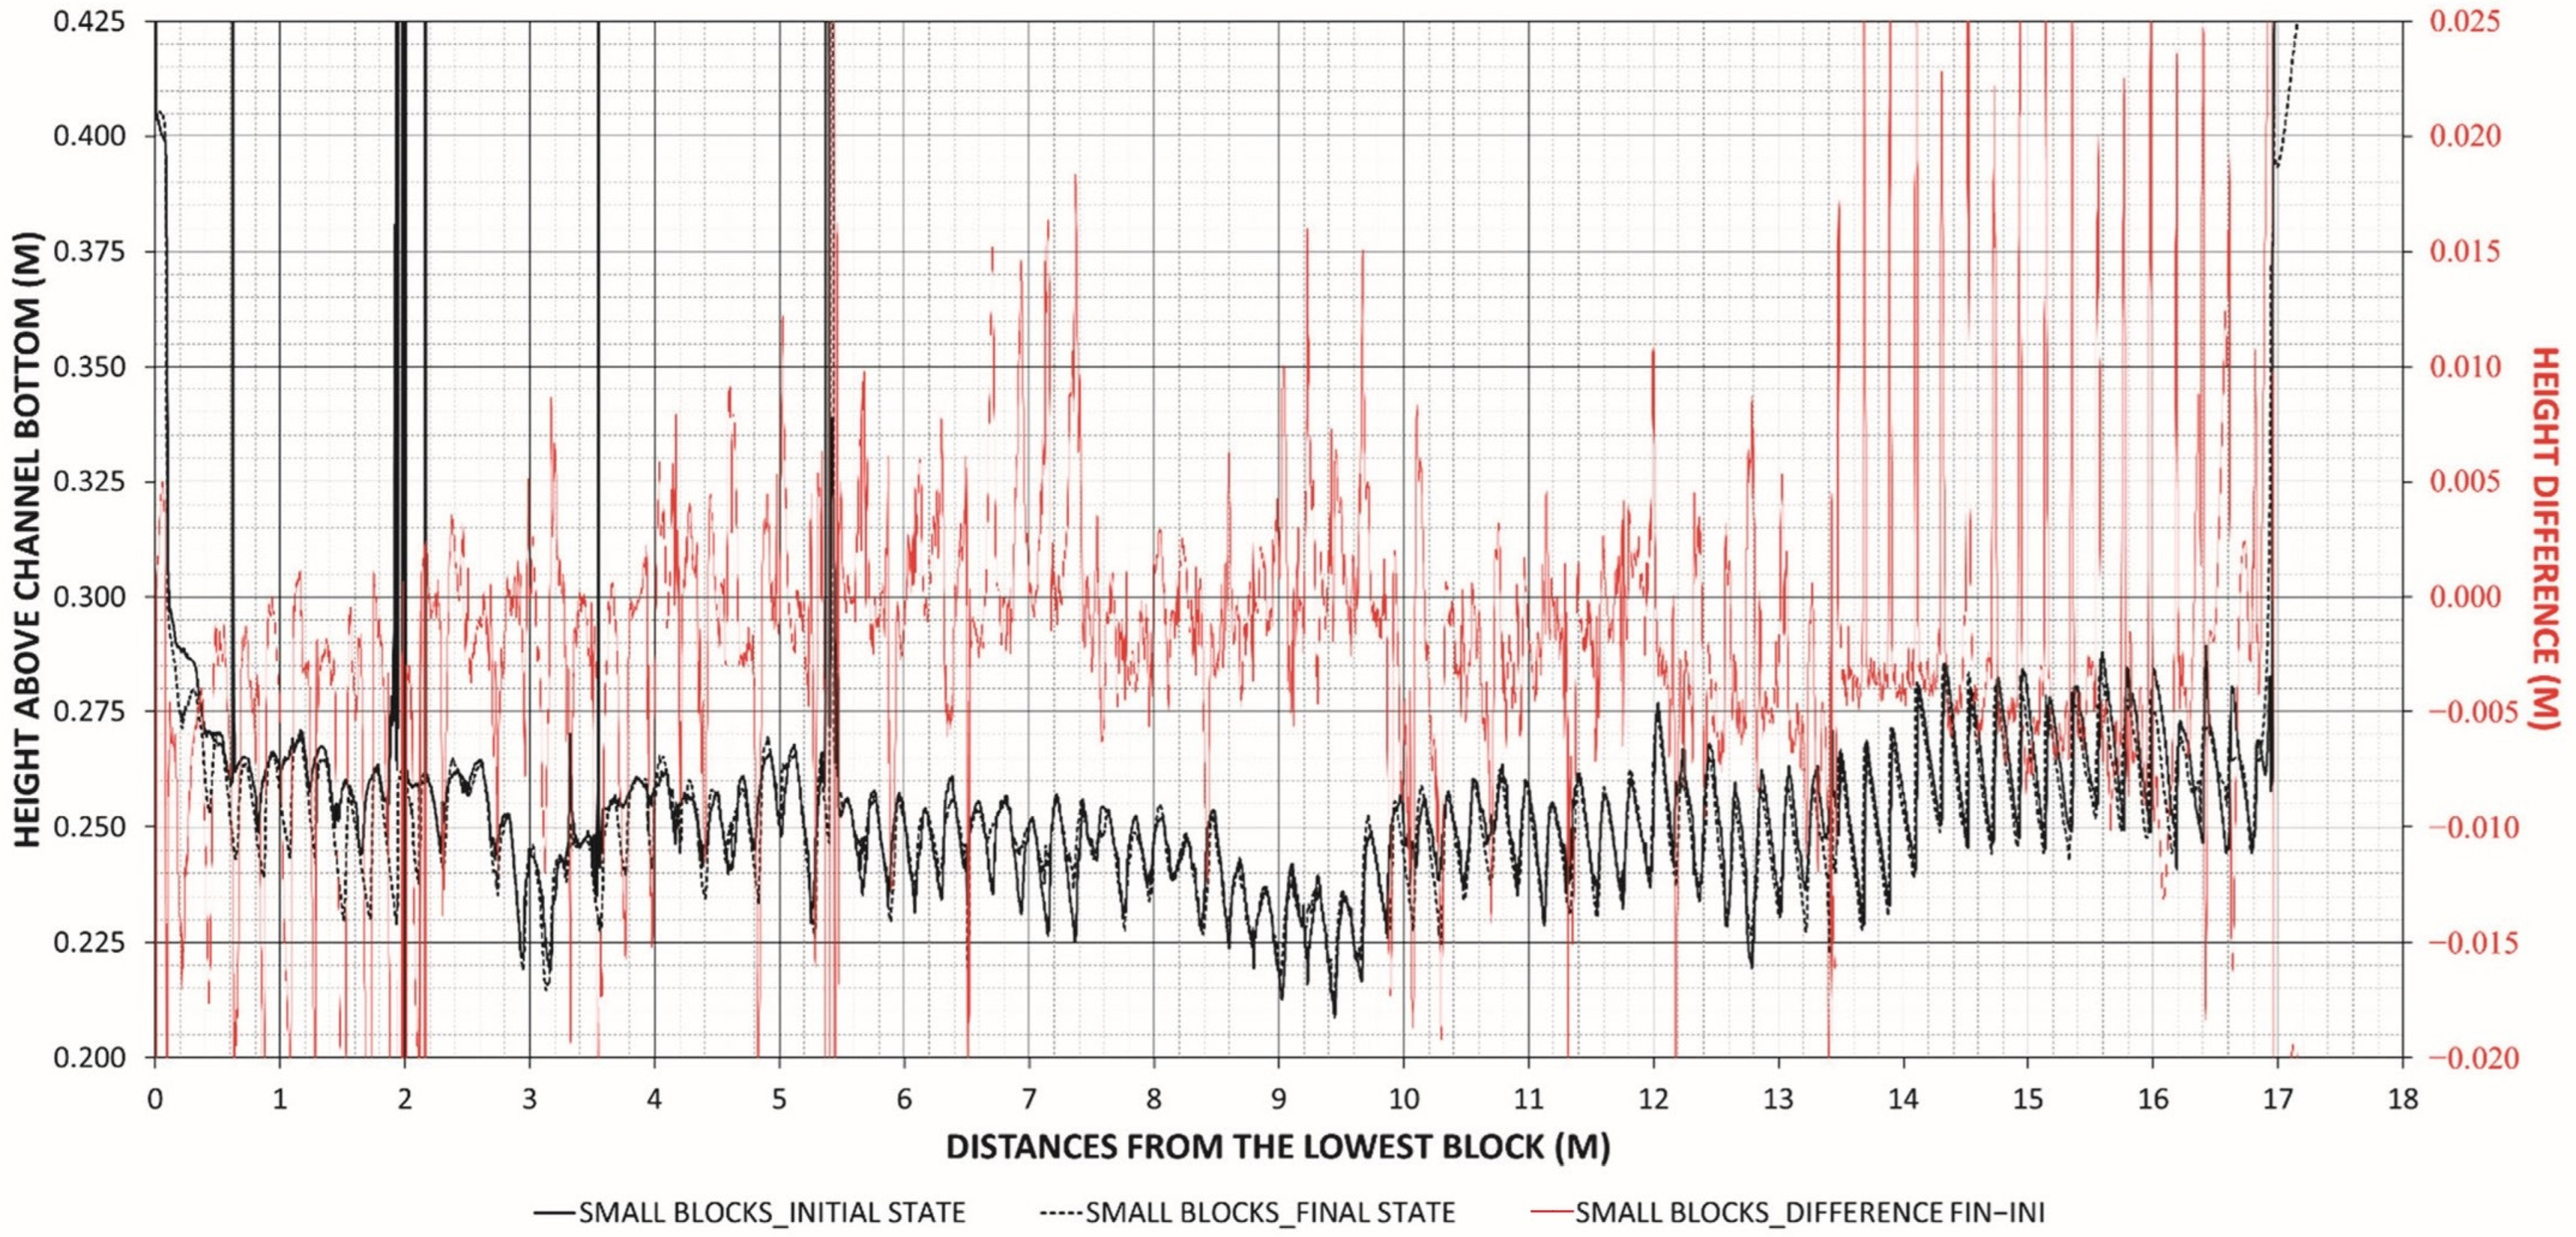
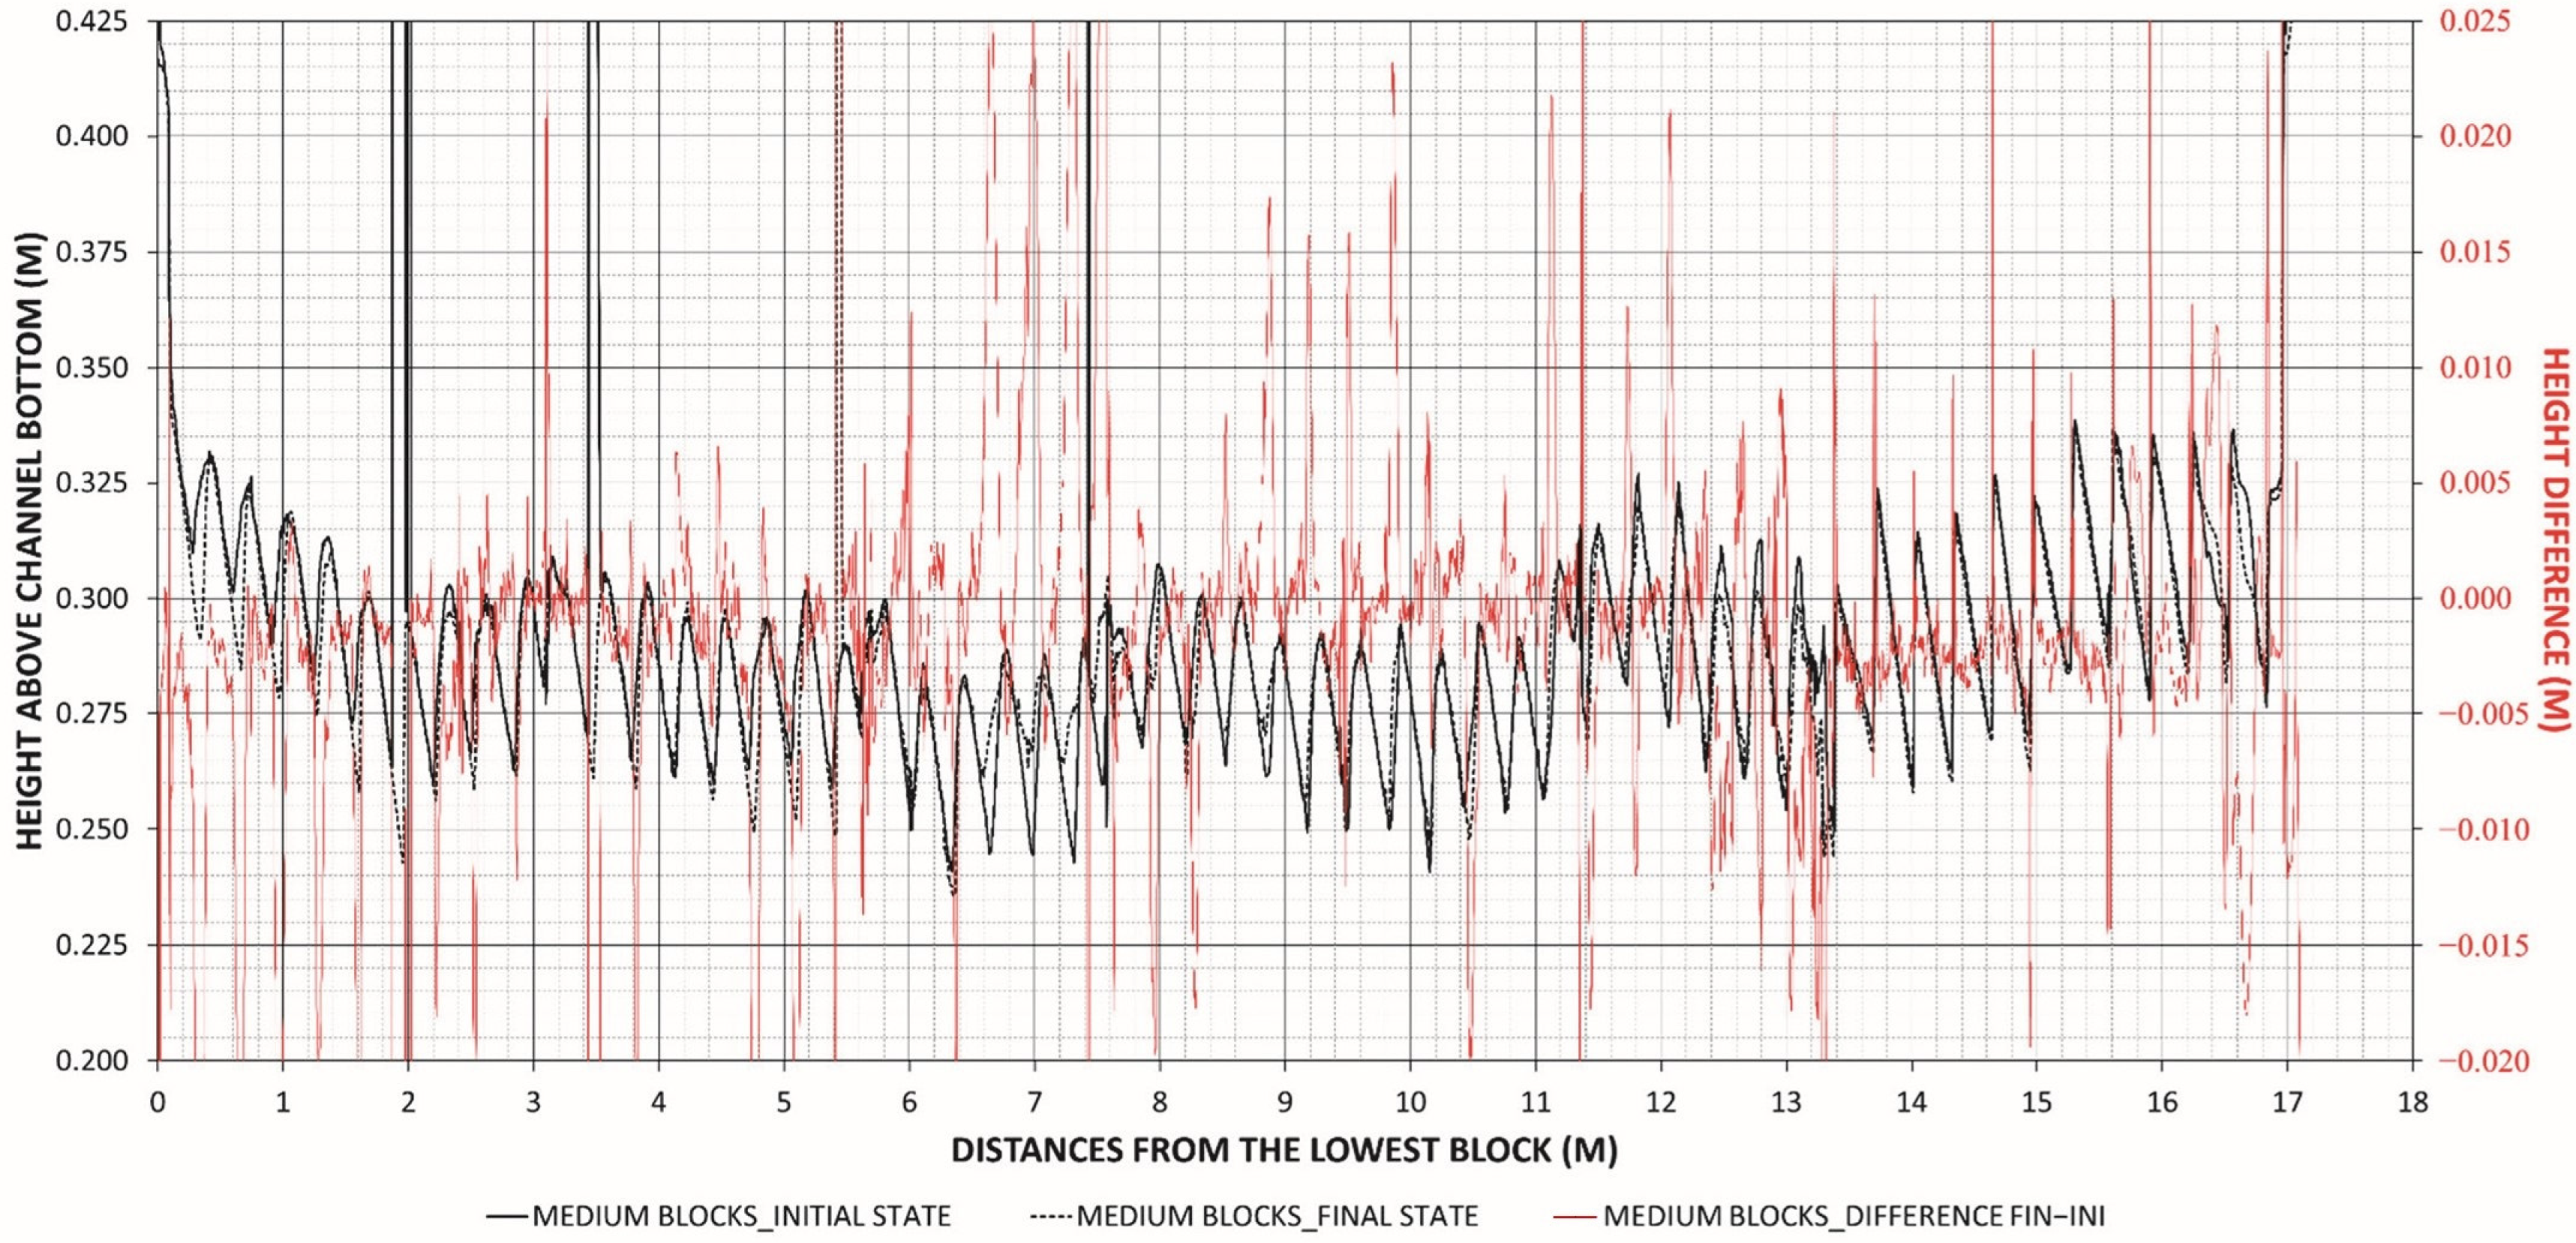
The longitudinal profiles of the WSB armoring in the initial and final states, and the differences between both are presented in Figure 18 (for the small WSB) and Figure 19 (for the medium WSB). The blue lines in Figure 15 show the position of the axes where the longitudinal cross sections were obtained.
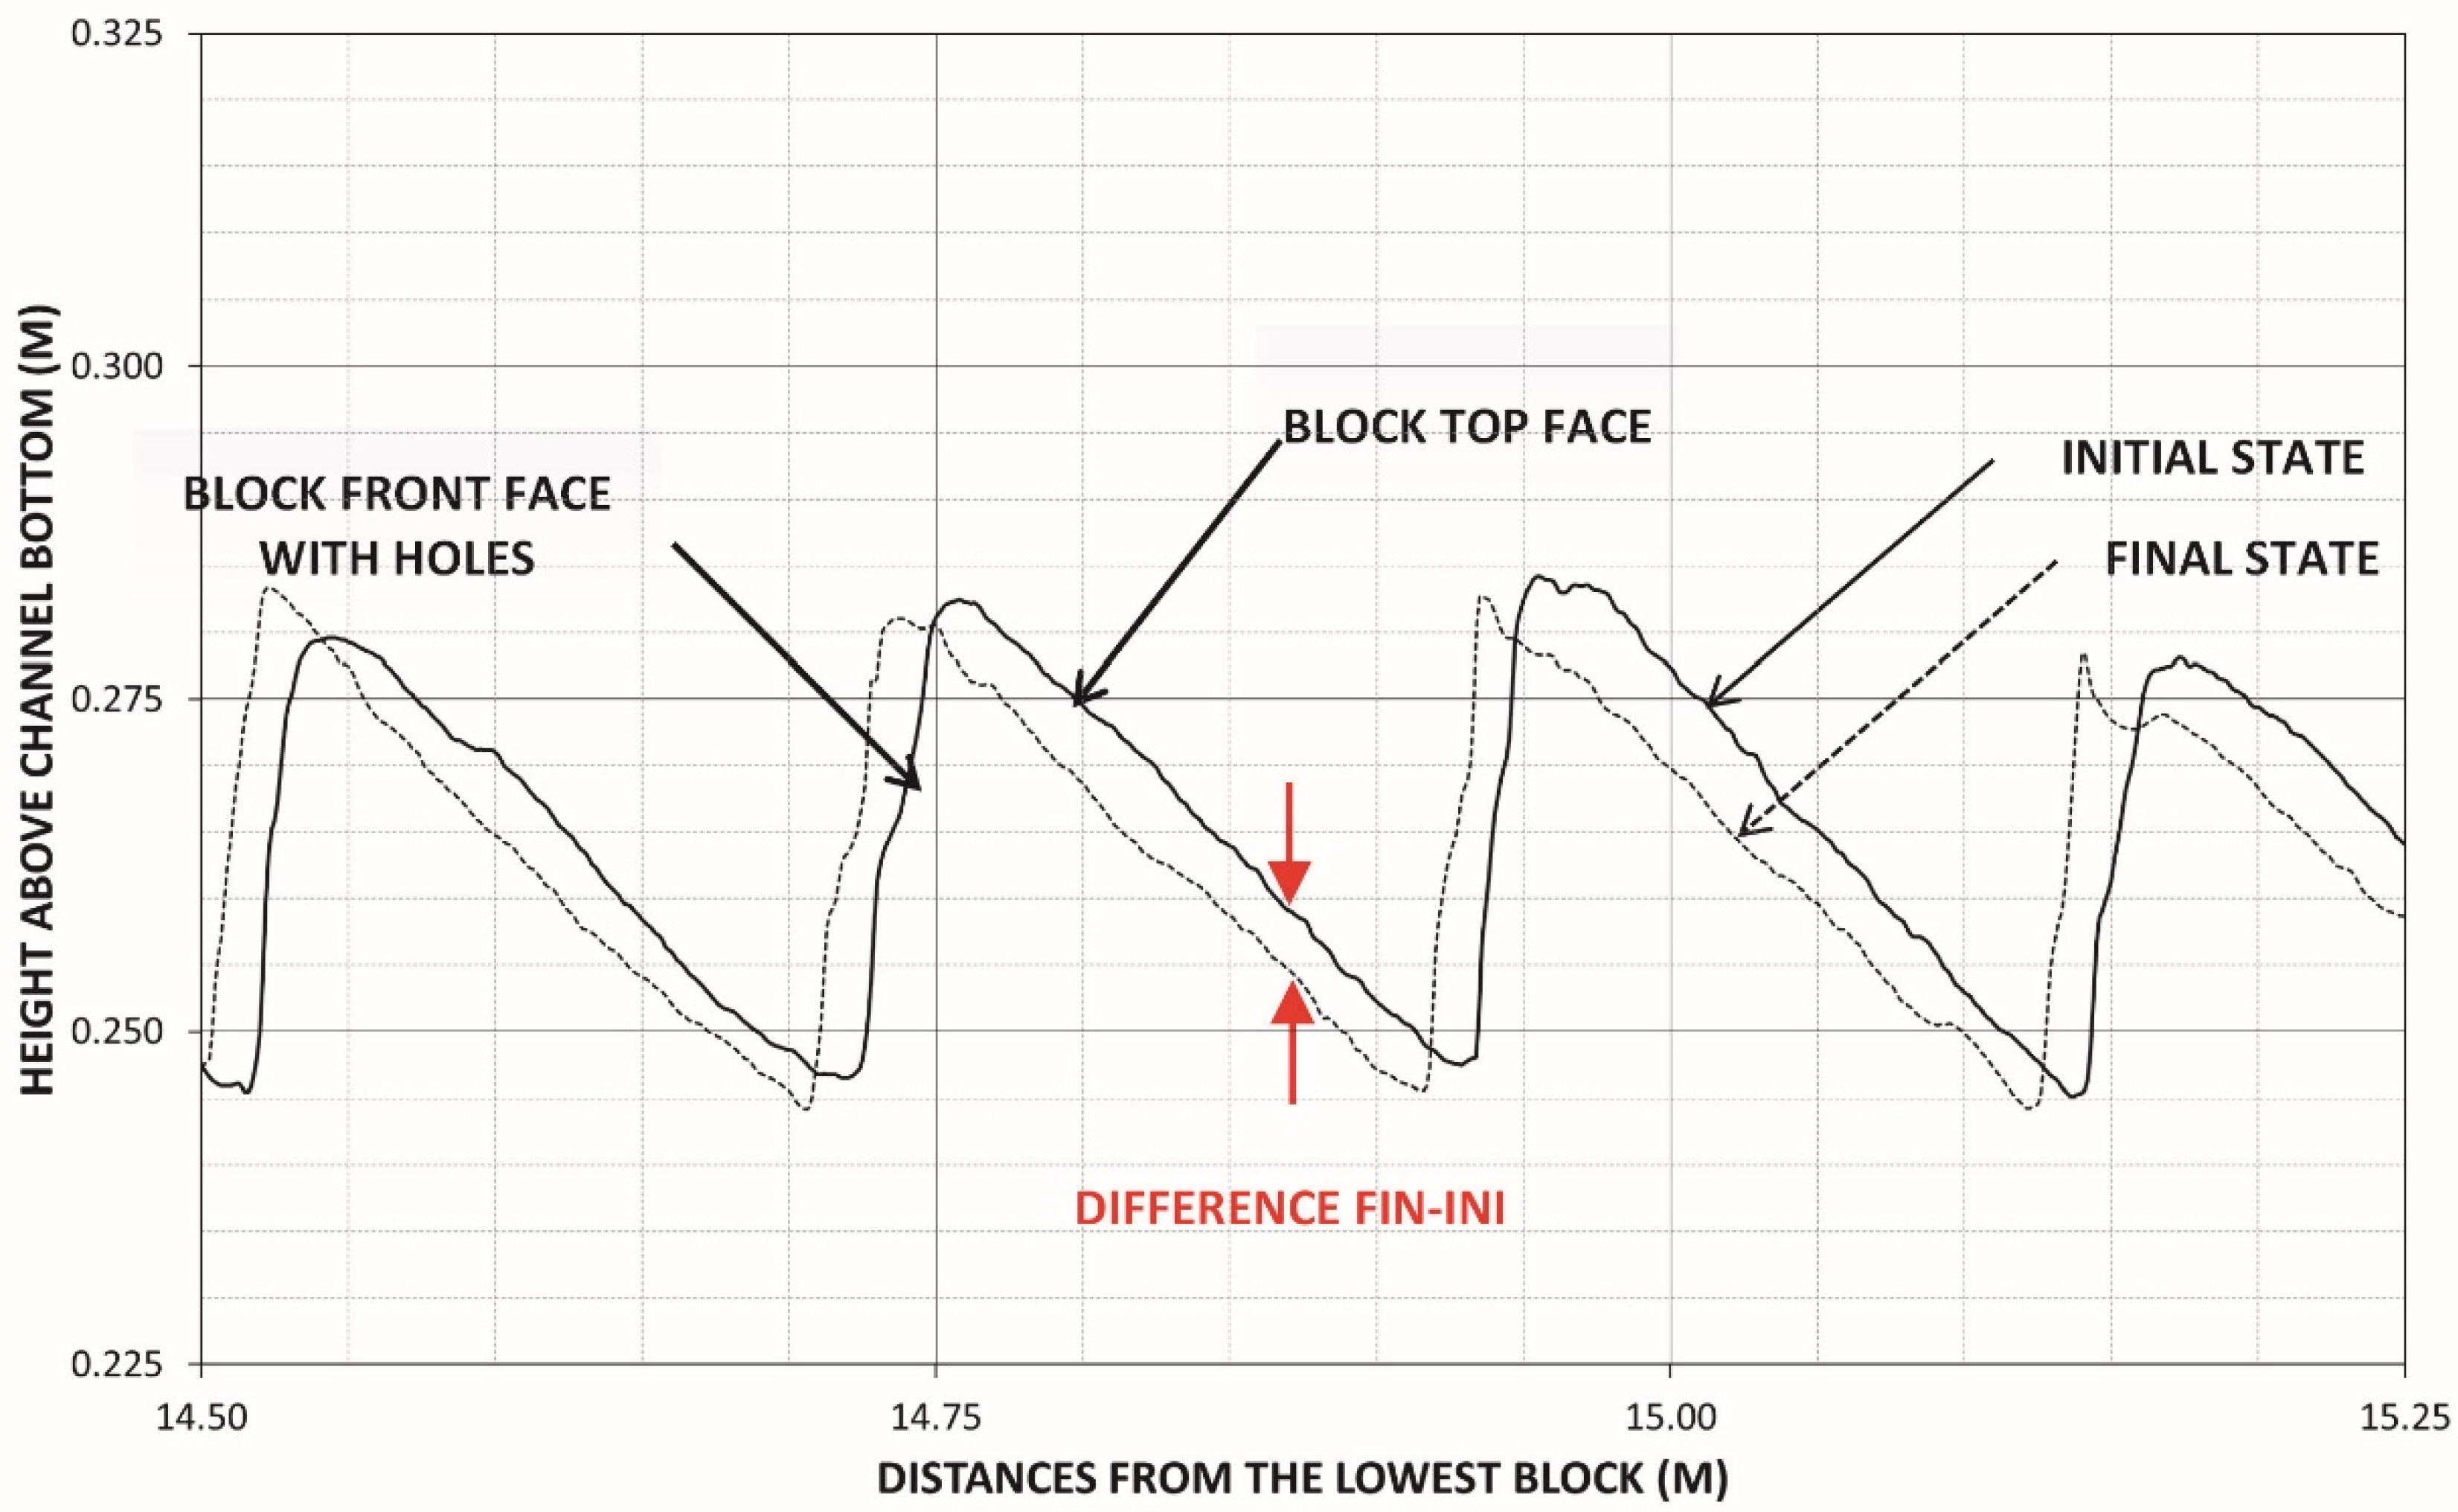
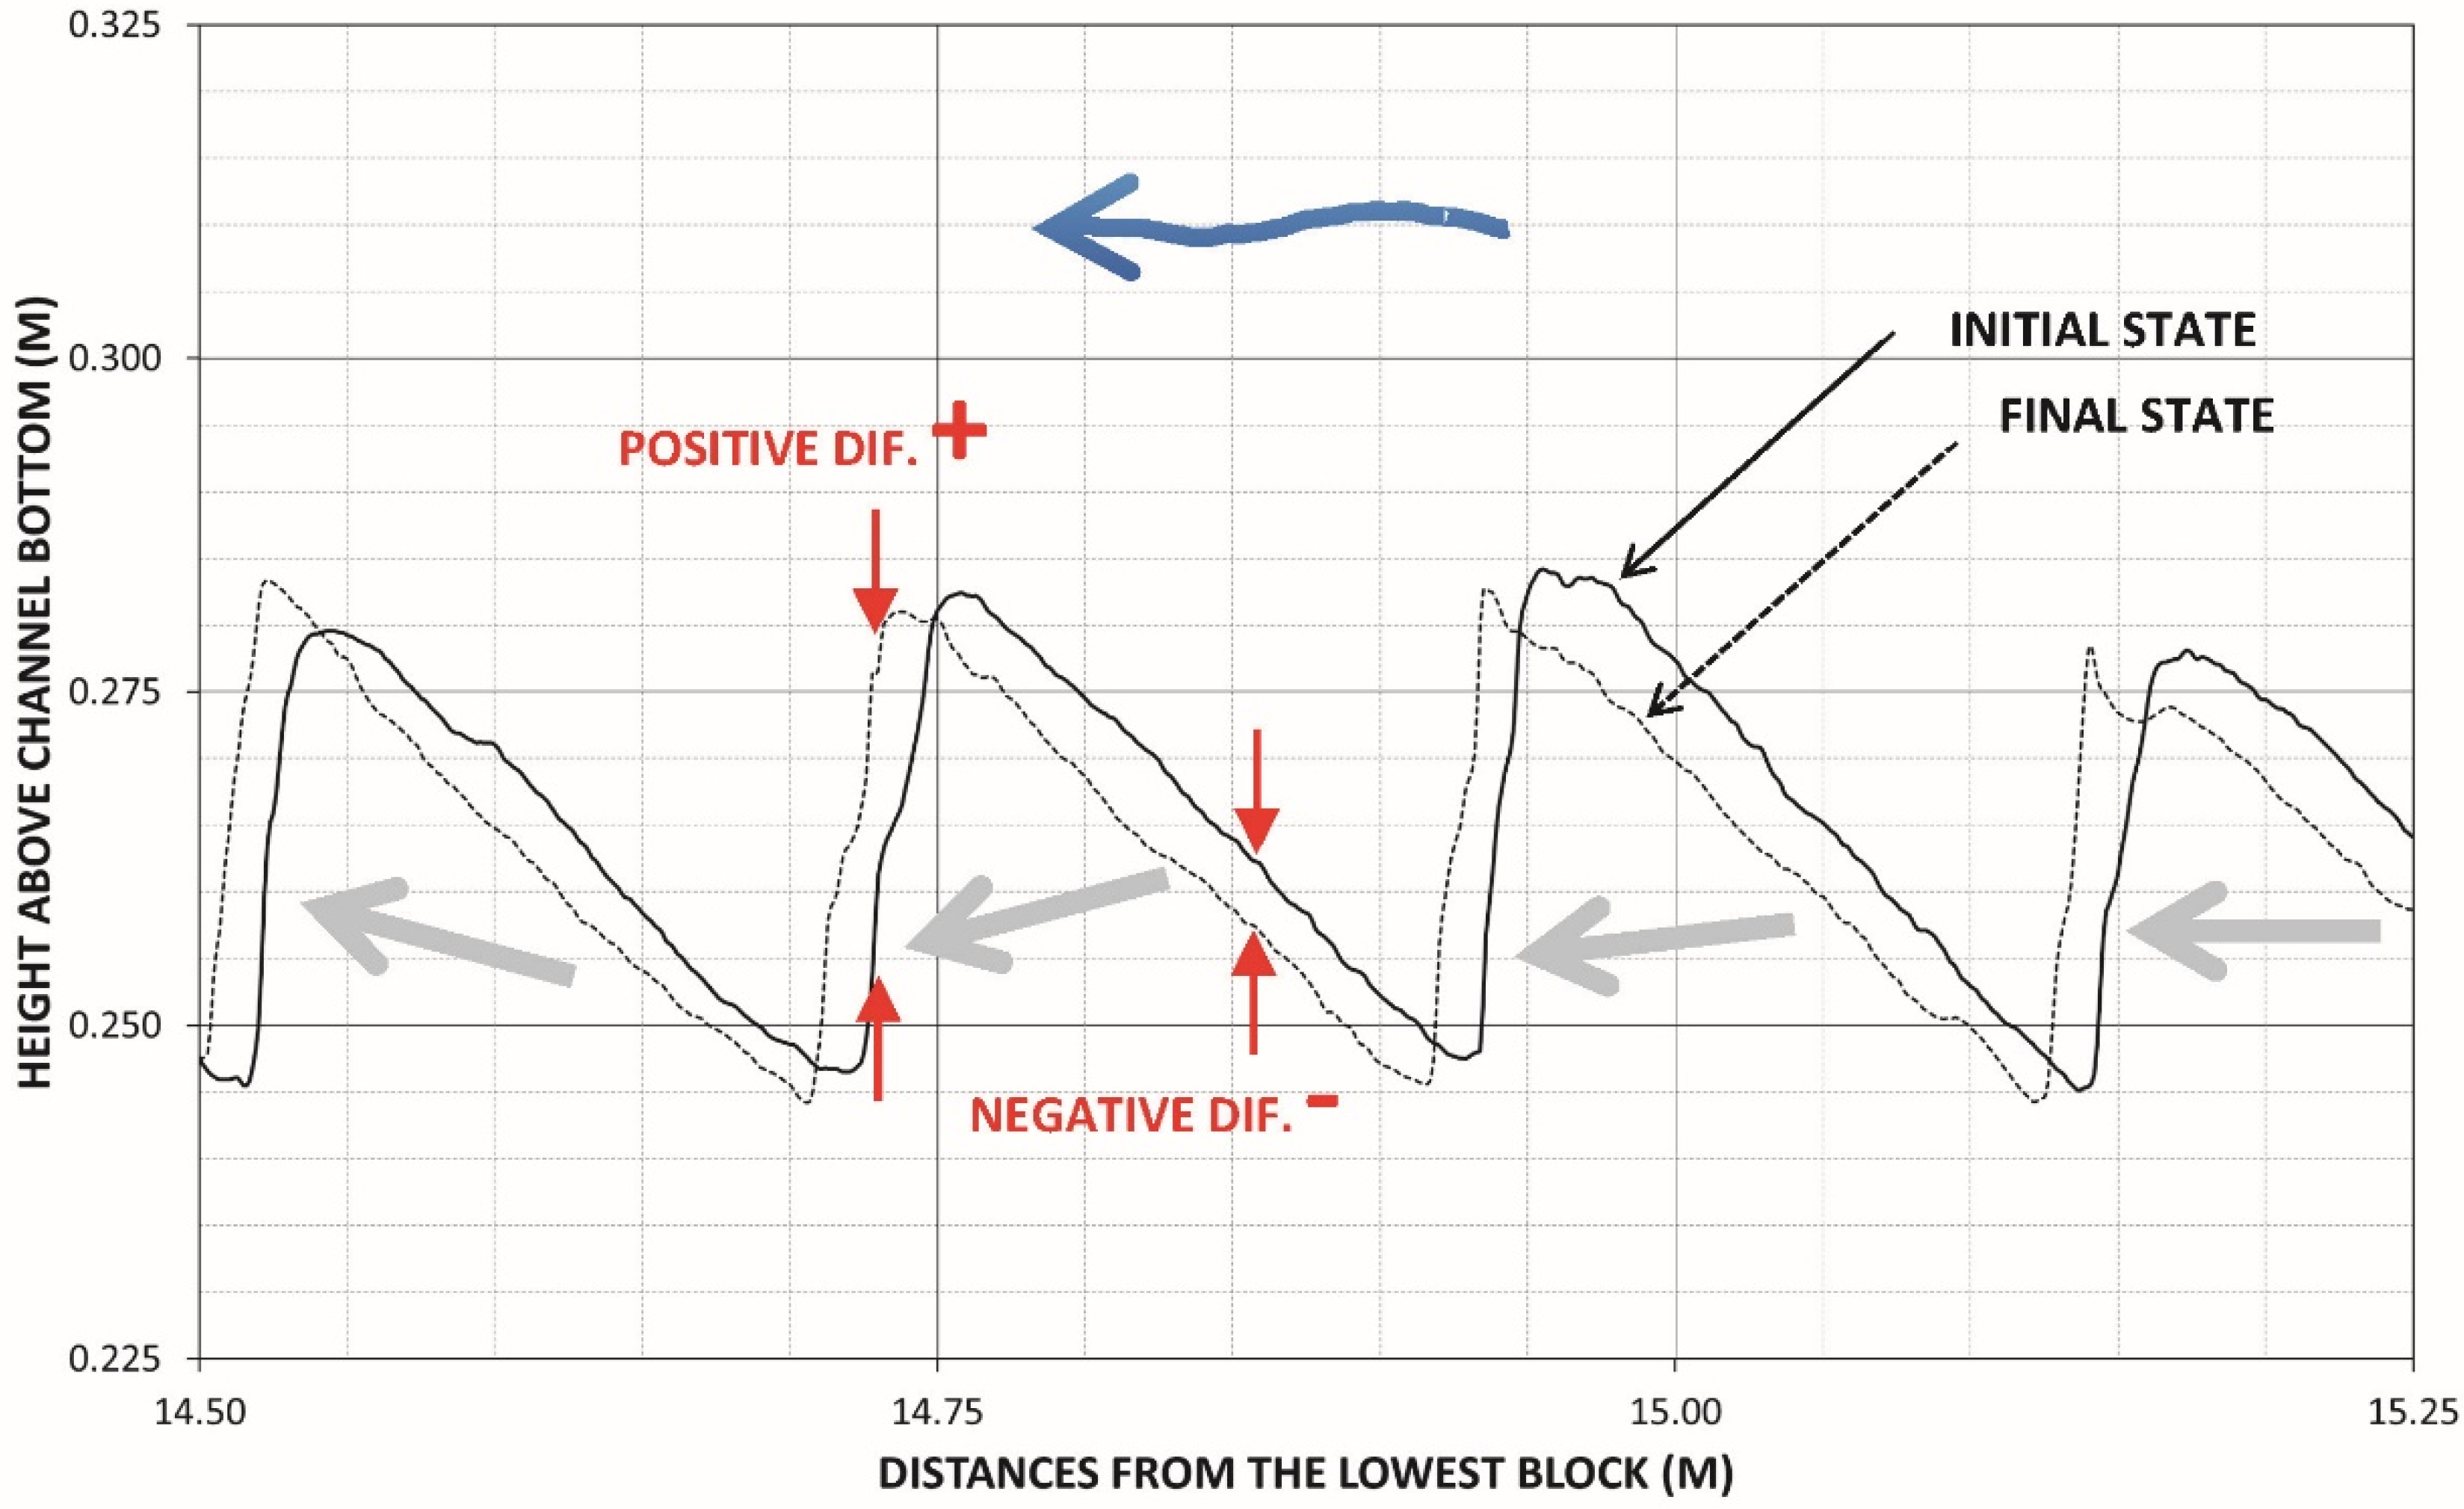
Figure 20 presents a scheme to help interpret the vertical differences between the original and the final DTMs presented above. Therefore, Figure 20 shows a detail of the longitudinal profile of four blocks that have experienced displacements (indicated with grey arrows in Figure 21) at the end of the test session 1, which illustrates the predominance of green (small negative differences in the upper faces of the WSB) and orange-red black (large positive differences at the downstream edges of the WSB). As can be observed, the armoring direction of the displacement of WSBs is mainly in the downstream-downward direction, as could be expected.
Thus, the green colors on the upper face of the blocks in Figure 15 indicate displacement downstream, or a combination of downstream displacement and settlement, but not solely settlement since the decrease in elevation is, in general, due to its displacement downstream. The areas dominate by orange-red colors indicate an increase in the external surface of the WSB armoring. A conceptual scheme of the displacements of the WSBs in the longitudinal cross section, considering the vertical and horizontal movements, is presented in Figure 22.
Measurement of WSB movements shows that there has been a slight displacement of the pieces downstream that increases in the upstream direction, which may be due to a readjustment of the pieces locally, reducing the gaps between consecutive rows. This displacement is especially noticeable in the upper and lower rows. The WSBs of the upper rows show a slight settlement while the ones in the central zone, and especially the central-lower one, present a slight rise and tilt. Some of the possible causes that could lead to the movements registered in the WSB armoring can be downstream sliding of the granular layer (or the WSBs over it) towards downstream, the buckling of the surface of the WSB armoring, the dynamic hydraulic pressures, vibrations in the chute, the uplift pressures under the WSBs, or the development of stagnation pressures beneath of the WSB armoring at the downstream end of the testing chute, among others.
3.3. Measurement of the Forces Needed to Extract the WSB from the Armoring System
Measurements could be made just in test session 1 for the medium WSB, once the testing chute was empty of water. As mentioned in Section 3, the extracted WSBs were the central blocks in rows #10 (Videos S7 and S8 in Supplementary Materials), #18, #24, #30, #36, and #42. The results of the extraction tests are shown in Table 3.
The average force needed to extract the medium WSBs (with a weight of 147 N per block) in the 4 trials is 2680 N, which is more than 18 times the WSB weight. Minimum and maximum values were 918 N (roughly six times the weight of the block) and 3945 N (27 times higher). There is no apparent relationship between the extraction force and the WSB row position of the row along the testing chute. The extraction forces are so high in comparison with the WSB weight due to the overlapping of the rows and the staggered placement, which makes it necessary to mobilize several blocks to pull a single WSB from its original position.
3.4. Disscusion on the Performance of the WSB Armoring
The armoring composed of small WSBs failed for a unit discharge of 2.4 m2 s−1. The medium and large WSBs were stable for maximum unit discharges of 1 and 3.6 m2 s−1, respectively, which was the maximum available at the facility on the days when the the tests were performed. The armoring with the large WSB failed during shutdown and draining of the test chute. The failure occurred several minutes after the end of the test session, during a rapid drop in flow rate and for a unit discharge less than 3.6 m2 s−1 (i.e., the maximum unit discharge used during the test time). Some of the possible causes of such failure are discussed next, and further investigations should be carried out to confirm or refute them.
Excessive uplift pressures could be one of the causes of failure. Furthermore, during the emptying time, there was a quick reduction in the depth of the water and the positive pressure at the top of the WSB. Additionally, the reduction in flow velocity could lead to a lower stabilizing force provided by hydraulic suction under the WSB.
Another cause could be the insufficient drainage capacity of the supporting drainage layer for rapid reduction in skimming flow. Furthermore, the perforated metal supporting the downstream row of WSBs (Figure 23), could limit drainage and cause an increase in uplift pressure under the lower rows of WSBs. This metal plate at the downstream end of the chute also formed was an obstacle for the skimming flow due to the offset between the pseudo bottom of the stepped WSB armoring and the top of the plate. This could cause hydraulic jacking due to the development of the stagnation pressure by transformation of the kinetic energy of the flow into pressure energy, causing large static or dynamic pressures that are transmitted to the base, destabilizing the downstream rows of the WSBs.
4. Conclusions
Testing of the new ACUÑA block was performed following the construction of a large experimental facility (HEFLR) capable of carrying out tests on a quasi-prototype size with maximum discharges of up to 7 m3 s−1 and maximum unit flow rates of up to 14 m2 s−1 with the minimum width of 0.5 m in the testing chute. The HEFLR will allow future evaluation of the performance of systems or technologies for the overflowing protection of dams and levees under quasi-prototype conditions, with high hydraulic loadings.
WSB armoring tests with the ACUÑA block were performed for three different block sizes (small, medium, and large, with weights of 5, 15 and 35 kg, respectively). The small blocks failed for a unit discharge of 2.4 m2 s−1. The medium size was tested for a maximum unit discharge of 1.0 m2 s−1 and no damage was observed. Finally, the large WSBs could resist unit discharges of 3.4 m2 s−1, with peaks of up to 3.6 m2 s−1 without damage during the testing time. However, a failure of the large WSBs suddenly occurred during the shutdown and draining of the flume, at the end of the test. This failed ocurred for lower unit discharges than those applied during the testing time. Such failure mode, caused by a quick reduction in the water flow, was unexpected and has not been previously reported in state of the art WSB literature.
In the test session in which the WSB armoring remained in place in the chute after the testing time and the emptying operation, the displacements of the blocks within the flume were recorded using photographs that were processed to create digital terrain models. Generalized movement occurred but was not dramatic slightly larger for small WSBs than for medium. In general, the displacements showed settlement (from 0 to 10 mm) and downstream sliding (from 0 to 5 mm) with a minor increase in elevation (0 to 5 mm) of the WSBs located in the central area of the testing chute.
A total of 4 extraction tests were performed on medium-sized blocks after the end of the first session of tests. The average force needed to pull out the blocks weighing 147 N (15 kp) was 2680 N (273.25 kp), which is more than eighteen times their weight, due to the overlapping of the rows and the staggered placement, which makes it necessary to mobilize several blocks around the one blocl being pulled out from its original position. No relationship could be inferred between the required extraction force and the WSB position of the WSBs along the length of flume. Finally, the need for further research to complement the results presented in this article is evident. In the new research, installation details should be modifiedto avoid the formation of stagnation pressures at the downstream end, and recordings of the fluctuating pressures at the base of the blocks should be made. In addition, a study of the stability of the granular support layer should be carried out, testing possible improvements such as the use of geocells, among others.
Supplementary Materials
The following are available online at https://zenodo.org/record/7262363#.Y-MVE61BxPY: Experimental_set_up and test sessions (8 videos): VIDEO_01_Intake_work_GATE_closed; VIDEO_02_Intake_work_GATE_open; VIDEO_03_Chute_lowered_by_crane; VIDEO_04_Test 01_from_downstream; VIDEO_05_Test 01 from_methacrylate_windows; VIDEO_06_Qmax_Test02; VIDEO_07_Extraction_test_01_row10 (1); VIDEO_08_Extraction_test_01_row10 (2).
Author Contributions
Conceptualization, F.J.C., R.M., M.Á.T. and J.P.; methodology, F.J.C., R.M., M.Á.T. and J.P.; formal analysis, F.J.C., R.M., M.Á.T. and J.P.; investigation, F.J.C. and J.P.; data curation, J.P.; visualization, J.P.; writing—original draft preparation, F.J.C. and J.P.; writing—review and editing, R.M. and M.Á.T.; supervision, R.M. and M.Á.T. All authors have read and agreed to the published version of the manuscript.
Funding
This research was funded by the Spanish Ministry of Science and Innovation (Ministerio de Ciencia e Innovación, MICINN) through the PABLO project (grant number RTC-2017-6196-5).
Institutional Review Board Statement
Not applicable.
Informed Consent Statement
Not applicable.
Data Availability Statement
Data are available on request.
Acknowledgments
The authors would like to acknowledge the collaboration of Luis Ruano† from PREHORQUISA, without whose involvement these projects would not have been possible, and the Red de Aulas CIMNE. Also to the Bardenas Channel Irrigation Association as a user; ACUAES (Aguas de las cuencas de España) as an operator; and Ebro River Basin Authority as an owner, by the transfer of preexisting infrastructures for use with research purposes. And the company ACIS2in, which has collaborated with the R + d Consortium (formed by the company PREHORQUISA, the Universidad Politécnica de Madrid, UPM, and the International Center for Numerical Methods in Engineering, CIMNE) in the execution of the tests during the year 2022. Finally, the authors would also like to acknowledge María Monterde from PREHORQUISA; Ricardo Monteiro-Alves from the Dam Safety Research Group (SERPA) of UPM; Fernando Salazar and Javier San Mauro from CIMNE; and Iván Gabriel from ACIS2in.
Conflicts of Interest
The authors declare that they have no conflict of interest.
References
- ICOLD. Bulletin No. 99. Dam Failures—Statistical Analysis; International Commission on Large Dams (ICOLD): Paris, France, 1995. [Google Scholar]
- FEMA. Technical Manual: Overtopping Protection for Dams U.S. Department of Homeland Security; FEMA: Washington, DC, USA, 2014. [Google Scholar]
- Hewlett, H.; Baker RMay, R.; Pravdivets, Y.P. Design of Stepped-Block Spillways; Construction Industry Research and Information Association: London, UK, 1997. [Google Scholar]
- Grinchuk, A.S.; Pravdivets, Y.P.; Shekhtman, N.V. Test of earth slope revetments permitting the flow of water at large specific discharges. Hydrotech. Constr. 1977, 11, 367–373. [Google Scholar] [CrossRef]
- Pravdivets, Y.P.; Slissky, S.M. Passing floodwaters over embankment dams. Int. Water Power Dam Constr. 1981, 33, 30–32. [Google Scholar]
- Baker, R.; Gardiner, K. Construction and performance of a wedge block spillway at Brushes-Clough reservoir. In Proceedings of the 8th Conference of the British Dam Society on Reservoir Safety and the Environment, Exeter, UK, 4–17 September 1994; pp. 214–223. [Google Scholar]
- Baker, R.; Pravdivets, Y.; Hewlett, H. Design considerations for the use of wedge-shaped precast concrete blocks for dam spillways. Proc. Inst. Civ. Eng. Water Marit. Eng. 1994, 106, 317–323. [Google Scholar] [CrossRef]
- Baker, R.; Gardiner, K.D. Building blocks. Int. Water Power Dam Constr. 1995, 47, 2. [Google Scholar]
- Bramley, M.; May, R.; Baker, R. Performance of Wedge-Shaped Blocks in High-Velocity Flow. CIRIA Research Project 407. Stage 1 Report-July 1989, Construction Industry Research and Information Association (CIRIA): London, UK, Unpublished work. 1989.
- Bramley, M.; May, R.; Baker, R. Performance of Wedge-Shaped Blocks in High-Velocity Flow. CIRIA Research Project 407. Stage 2 Report-July 1991, Construction Industry Research and Information Association (CIRIA): London, UK, Unpublished work. 1991.
- Cloppper, P.E. Hydraulic Stability of Articulated Concrete Block Revetment Systems during Overtopping Flow; Federal Highway Administration: Washington, DC, USA, 1989. [Google Scholar]
- Slovensky, G.G., Jr. Near-Prototype Testing of Wedge-Block Overtopping Protection. Master’s Thesis, Colorado State University, Fort Collins, CO, USA, 1993. [Google Scholar]
- Gaston, M.L. Air Entrainment and Energy Dissipation on a Stepped Block Spillway. Master’s Thesis, Colorado State University, Fort Collins, CO, USA, 1995. [Google Scholar]
- Frizell, K.H. Protecting embankment dams with concrete stepped overlays. Hydro Rev. 1997, 16, 36–45. [Google Scholar]
- Frizell, K.H. ArmorwedgeTM Analysis Report: Block Size Scaling and Bedding Information, Bureau of Reclamation and Amortec Inc.: Washington, DC, USA, Unpublished work (confidential). 2007.
- Thornton, C.I.; Robeson, M.D.; Varyu, D.R. ArmorwedgeTM Data Report 2006 Testing for Armortec Erosion Control Solutions, Inc. Colorado State University: Fort Collins, CO, USA, Unpublished work (confidential). 2006.
- Relvas, A.T.; Pinheiro, A.N. Closure of “Inception Point and Air Concentration in Flows on Stepped Chutes Lined with Wedge-Shaped Concrete Blocks”. J. Hydraul. Eng. 2010, 136, 86–88. [Google Scholar] [CrossRef]
- Relvas, A.T. Descarregadores de Cheias de Blocos de Betão Prefabricados em Forma de Cunha sobre Barragens de Aterro. Ph.D. Thesis, Universidade Tecnica de Lisboa, Instituto Superior Técnico, Lisboa, Portugal, 2008. (In Portuguese). [Google Scholar]
- Relvas, A.T.; Pinheiro, A.N. Inception point and Air Concentration in flows on Stepped Chutes Lined with wedge-shaped concrete blocks. J. Hydraul. Eng. 2008, 134, 1042–1051. [Google Scholar] [CrossRef]
- Relvas, A.T.; Pinheiro, A.N. Stepped chutes lined with wedge-shaped concrete blocks: Hydrodynamic pressures on blocks and stability analysis. Can. J. Civ. Eng. 2011, 38, 338–349. [Google Scholar] [CrossRef]
- Relvas, A.T.; Pinheiro, A.N. Velocity Distribution and Energy Dissipation along Stepped Chutes Lined with Wedge-Shaped Concrete Blocks. J. Hydraul. Eng. 2011, 137, 423–431. [Google Scholar] [CrossRef]
- Morán, R. Wedge-Shaped Blocks: A Historical Review. 2nd International Seminar on Dam Protections against Overtopping. Protections 2016. Colorado State University (CSU). 2016. Available online: https://mountainscholar.org/handle/10217/179790 (accessed on 6 February 2023).
- Caballero, F.J.; Toledo, M.Á.; Moran, R.; San Mauro, J. Hydrodynamic Performance and Design Evolution of Wedge-Shaped Blocks for Dam Protection against Overtopping. Water 2021, 13, 1665. [Google Scholar] [CrossRef]
- Mauro, J.S.; Toledo, M.; Salazar, F.; Caballero, F.F.J. A Methodology for the Design of Dam Spillways with Wedge-Shaped Blocks Based on Numerical Modeling, Revista Internacional de Métodos Numéricos para Cálculo y Diseo en Ingeniería (RIMNI) 2018. (Online First). Available online: https://www.scipedia.com/public/San_Mauro_et_al_2018a (accessed on 6 February 2023).
- San Mauro, J.; Larese, A.; Salazar, F.; Irazábal, J.; Morán, R.; Toledo, M.Á. Hydraulic and Stability Analysis of the Supporting Layer of Wedge-Shaped Blocks. 2nd International Seminar on Dam Protections against Overtopping and Accidental Leakage. Protections 2016. Colorado State University (CSU). 2017. Available online: https://mountainscholar.org/handle/10217/179782 (accessed on 6 February 2023).
Figure 1.
Location of test facilities (geographic coordinates 42°3′59.34″ N, 1°4′12.22″ W).

Figure 2.
Intake work in the Acequia de Sora channel: (a) View from downstream of the flow control gate in operation. (b) Flow control structure on the left and side spillway from the Acequia de Sora to the auxiliary channel.
Figure 2.
Intake work in the Acequia de Sora channel: (a) View from downstream of the flow control gate in operation. (b) Flow control structure on the left and side spillway from the Acequia de Sora to the auxiliary channel.

Figure 3.
3D view of the auxiliary channel (a) Initial situation (b) Situation after the installation of HEFLR.
Figure 3.
3D view of the auxiliary channel (a) Initial situation (b) Situation after the installation of HEFLR.

Figure 4.
(a) View of HEFLR from the right bank of the auxiliary channel. (b) View of the interior of the auxiliary channel from upstream of the pressure channel. (c) Storage of the honeycomb slabs used to cover the pressure channel. (d) Metallic frames used to support the honeycomb slabs of the pressure channel and the metallic plates on the connection to the tower supply. (e) Detail of the sealing between the slabs and the channel walls (view from inside the pressure channel).

Figure 5.
(a) General view of the supply tower and the test chute before being lowered to the bottom of the auxiliary channel (b) Photographic montage of the water inside the supply tower (left) exiting towards the test chute (right). (c) Wall gate of the supply tower and 250 mm diameter butterfly valve to facilitate its operation by emptying the water retained upstream.

Figure 6.
Picture of the placement of the WSB on the gravel bedding layer.

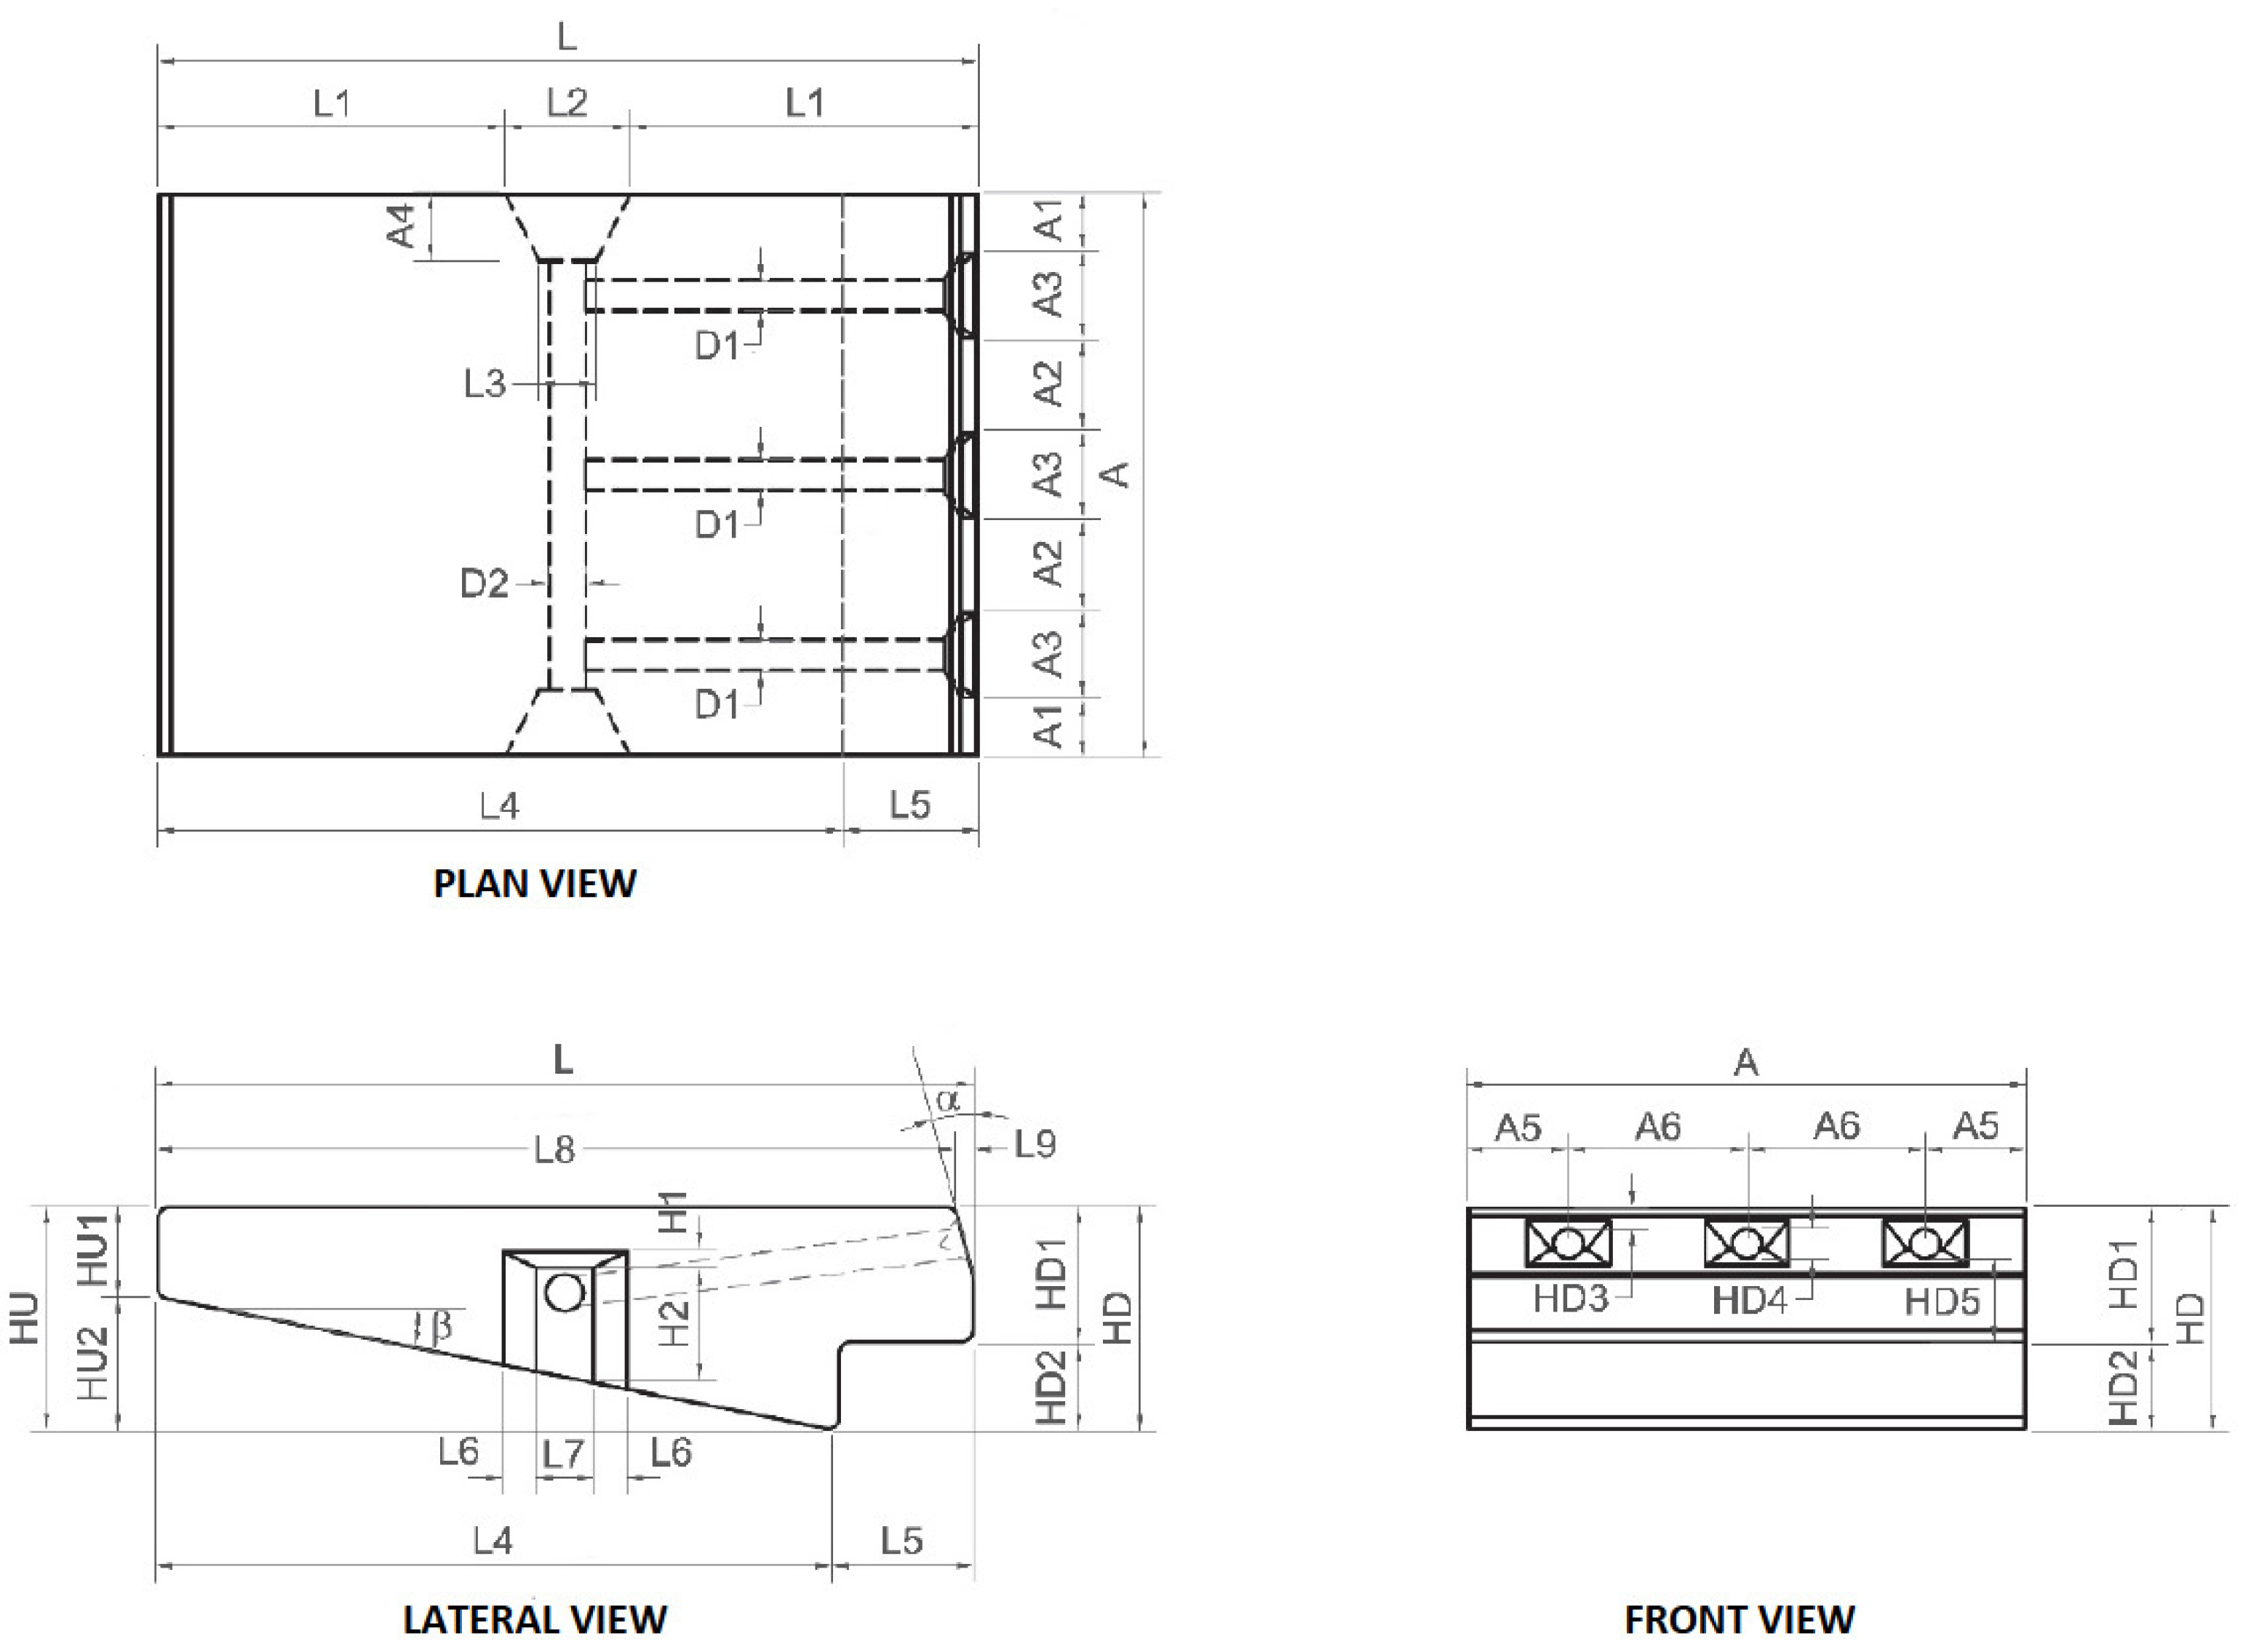
Figure 7.
Geometrical parameters of the ACUÑA® blocks.

Figure 8.
Scheme of the placement of WSB in rows and the creation of staggered longitudinal joints by using half-WSB. The arrows represent the flow of water.
Figure 8.
Scheme of the placement of WSB in rows and the creation of staggered longitudinal joints by using half-WSB. The arrows represent the flow of water.

Figure 9.
Picture of the intermediate wall dividing the two areas with different WSB sizes and eyebolts installed on some of the WSBs for block-extraction tests.
Figure 9.
Picture of the intermediate wall dividing the two areas with different WSB sizes and eyebolts installed on some of the WSBs for block-extraction tests.

Figure 10.
Picture of the sensor of the Nivus Portable Flowmeter installed in the centre of the auxiliary channel, upstream of the testing chute.
Figure 10.
Picture of the sensor of the Nivus Portable Flowmeter installed in the centre of the auxiliary channel, upstream of the testing chute.

Figure 11.
Picture of the targets on the sides of the testing chute.

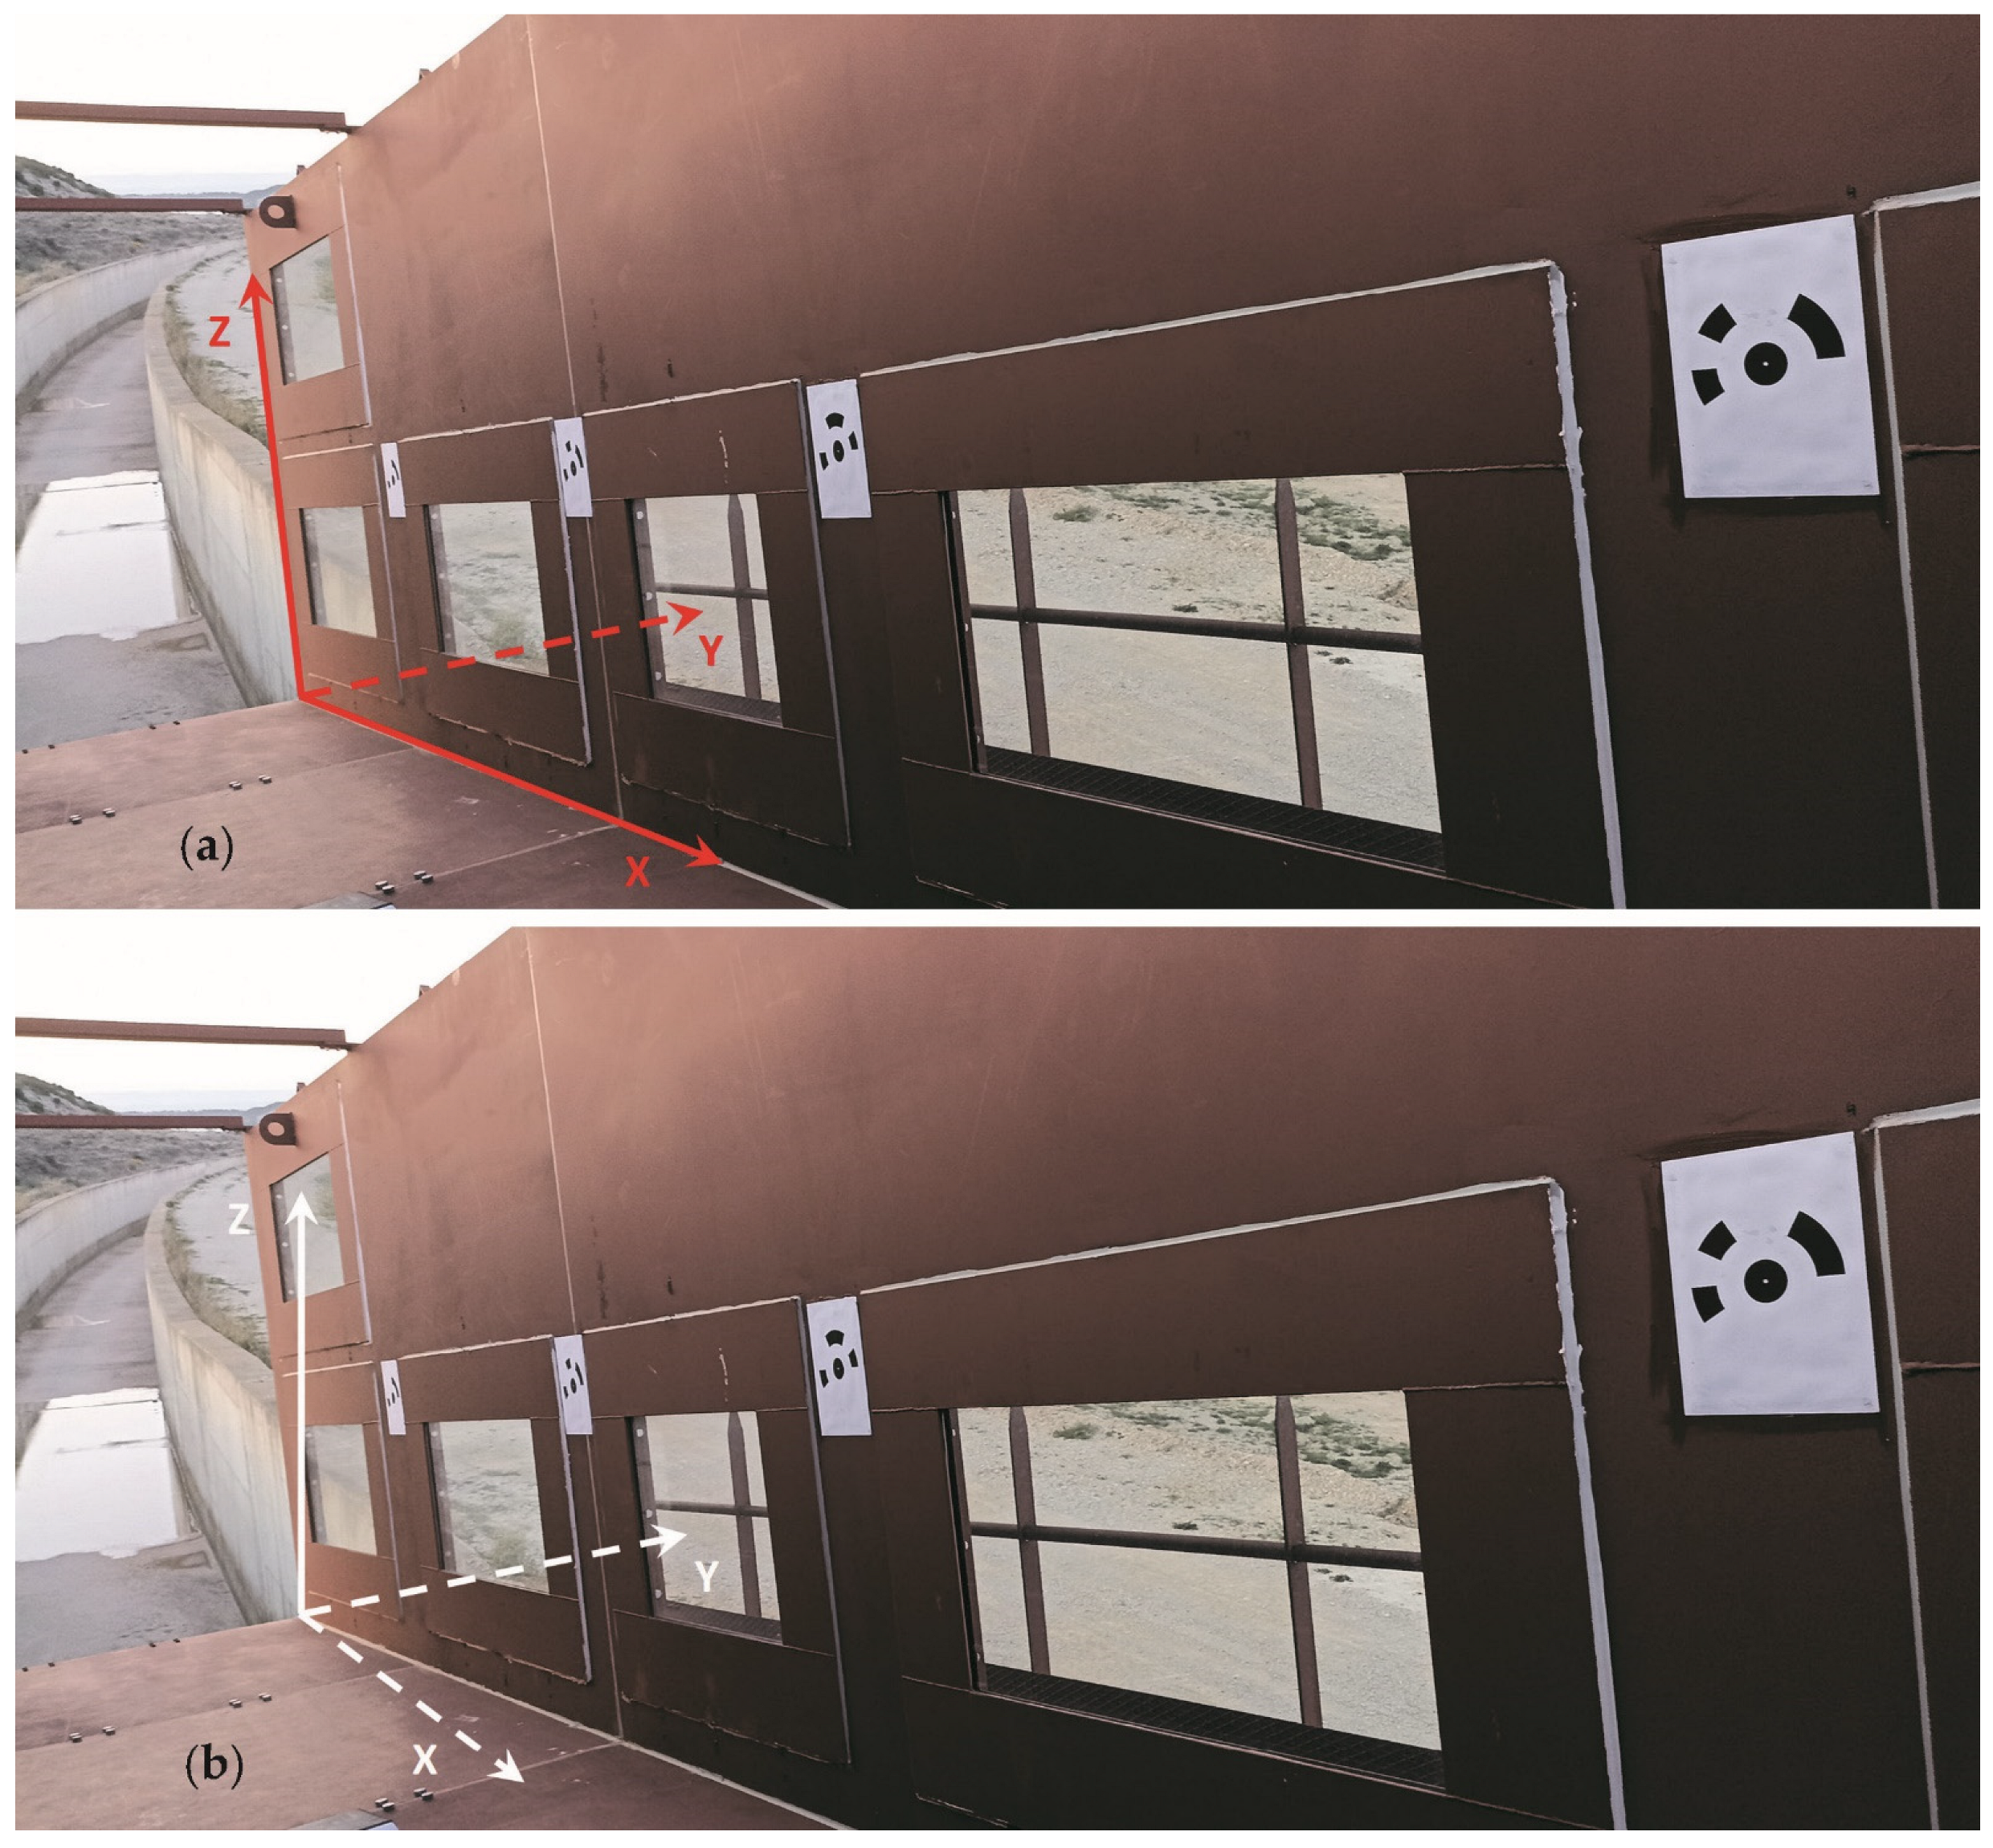
Figure 12.
Location of the coordinate systems in the testing chute. Relative ((a), red line) and absolute ((b), white line).
Figure 12.
Location of the coordinate systems in the testing chute. Relative ((a), red line) and absolute ((b), white line).

Figure 13.
Test Session 1: Inflow hydrograph, water volume, water depth, and flow velocity recorded by the flowmeter in the auxiliary channel.
Figure 13.
Test Session 1: Inflow hydrograph, water volume, water depth, and flow velocity recorded by the flowmeter in the auxiliary channel.

Figure 14.
Test Session 2: Inflow hydrograph, water volume, water depth, and flow velocity recorded by the flowmeter in the auxiliary channel.
Figure 14.
Test Session 2: Inflow hydrograph, water volume, water depth, and flow velocity recorded by the flowmeter in the auxiliary channel.

Figure 15.
Raster difference between the initial and final DTM. Small blocks in the top half of the coloured area and medium blocks in the lower half. The flow direction is from right to left of the figure.
Figure 15.
Raster difference between the initial and final DTM. Small blocks in the top half of the coloured area and medium blocks in the lower half. The flow direction is from right to left of the figure.

Figure 18.
Longitudinal profiles in small blocks: initial state (continuous black line), final state (continuous dotted line), and difference final vs. initial (red line).
Figure 18.
Longitudinal profiles in small blocks: initial state (continuous black line), final state (continuous dotted line), and difference final vs. initial (red line).

Figure 19.
Longitudinal profiles in the medium blocks: initial state (continuous black line), final state (continuous dotted line), and difference final vs. initial (red line).
Figure 19.
Longitudinal profiles in the medium blocks: initial state (continuous black line), final state (continuous dotted line), and difference final vs. initial (red line).

Figure 20.
Detail of the longitudinal profile of the WSB armouring. The black dotted lines represent the final state, while the continuous black line represents the original state.
Figure 20.
Detail of the longitudinal profile of the WSB armouring. The black dotted lines represent the final state, while the continuous black line represents the original state.

Figure 21.
Support scheme for the interpretation of the values obtained (the blue arrow indicates the direction of the flow).
Figure 21.
Support scheme for the interpretation of the values obtained (the blue arrow indicates the direction of the flow).

Figure 22.
(a) Position of the longitudinal axes in the plan view of the WSB armoring at the testing chute; (b) Conceptual scheme of the longitudinal profiles of the initial (continuous) and final (discontinuous) states of the WSB armouring in Test Session 1.
Figure 22.
(a) Position of the longitudinal axes in the plan view of the WSB armoring at the testing chute; (b) Conceptual scheme of the longitudinal profiles of the initial (continuous) and final (discontinuous) states of the WSB armouring in Test Session 1.

Figure 23.
Detail of the perforated metal plate, where the downstream row of the WSB was supported.


Table 1.
Dimensions and weights of the three sizes of the tested blocks.
| BLOCK SIZE | L | L1 | L2 | L3 | L4 | L5 | L6 | L7 | L8 | L9 | α |
| (mm) | (mm) | (mm) | (mm) | (mm) | (mm) | (mm) | (mm) | (mm) | (mm) | (°) | |
| Small | 243.3 | 103.0 | 37.0 | 103.3 | 17.0 | 203.3 | 40.0 | 10.0 | 238.6 | 4.8 | 15.0 |
| Medium | 364.3 | 154.2 | 55.4 | 154.7 | 25.4 | 304.4 | 59.9 | 15.0 | 357.1 | 7.1 | 15.0 |
| Large | 480.8 | 203.5 | 73.1 | 204.2 | 33.6 | 401.8 | 79.0 | 19.8 | 471.4 | 9.4 | 15.0 |
| BLOCK SIZE | A | A1 | A2 | A3 | A4 | A5 | A6 | HU | HU1 | HU2 | β |
| (mm) | (mm) | (mm) | (mm) | (mm) | (mm) | (mm) | (mm) | (mm) | (mm) | (°) | |
| Small | 167.0 | 17.5 | 28.5 | 25.0 | 19.5 | 30.0 | 53.5 | 65.9 | 27.2 | 38.7 | 10.8 |
| Medium | 250.0 | 26.2 | 42.7 | 37.4 | 29.2 | 44.9 | 80.1 | 98.7 | 40.7 | 57.9 | 10.8 |
| Large | 330.0 | 34.6 | 56.3 | 49.4 | 38.5 | 59.3 | 105.7 | 130.3 | 53.7 | 76.5 | 10.8 |
| BLOCK SIZE | Weight | HD | HD1 | HD2 | HD3 | HD4 | HD5 | H1 | H2 | D1 | D2 |
| (kg) | (mm) | (mm) | (mm) | (mm) | (mm) | (mm) | (mm) | (mm) | (mm) | (mm) | |
| Small | 5.0 | 65.9 | 40.0 | 25.9 | 6.3 | 8.7 | 25.0 | 5.0 | 34.2 | 9.0 | 11.0 |
| Medium | 15.0 | 98.7 | 59.9 | 38.8 | 9.4 | 13.0 | 37.4 | 7.5 | 51.3 | 13.5 | 16.5 |
| Large | 35.0 | 130.3 | 79.0 | 51.3 | 12.4 | 17.2 | 49.4 | 9.9 | 67.7 | 17.8 | 21.7 |
Table 2.
Coordinates of the targets in the relative system.
| TARGET NUM. | X (mm) | Y (mm) | Z (mm) |
|---|---|---|---|
| 1 | 2.102 | 0.000 | 1.057 |
| 2 | 3.987 | 0.000 | 1.057 |
| 3 | 5.587 | 0.000 | 1.057 |
| 4 | 7.591 | 0.000 | 1.075 |
| 5 | 9.589 | 0.000 | 1.075 |
| 6 | 11.595 | 0.000 | 1.064 |
| 7 | 13.589 | 0.000 | 1.064 |
| 8 | 15.584 | 0.000 | 1.051 |
| 9 | 17.590 | 0.000 | 1.072 |
| 11 | 2.085 | −2.008 | 1.045 |
| 12 | 3.963 | −2.008 | 1.050 |
| 13 | 5.395 | −2.008 | 1.044 |
| 14 | 7.400 | −2.008 | 1.043 |
| 15 | 9.408 | −2.008 | 1.043 |
| 16 | 11.407 | −2.008 | 1.043 |
| 17 | 13.410 | −2.008 | 1.044 |
| 18 | 15.410 | −2.008 | 1.044 |
| 19 | 17.410 | −2.008 | 1.044 |
Table 3.
Measurements of forces needed to extract the medium WSB after Test Session 1.
| Extraction Num. | Row (from Downstream) | X * (m) | Z * (m) | Force (N) |
|---|---|---|---|---|
| - | 42 | 13.10 | 6.55 | - |
| 1 | 36 | 11.23 | 5.62 | 2770 |
| - | 30 | 9.36 | 4.68 | - |
| 2 | 24 | 7.49 | 3.74 | 3950 |
| 4 | 18 | 5.62 | 2.81 | 920 |
| 3 | 10 | 3.12 | 1.56 | 3090 |
| Total length (m) | 16.54 | |||
| Total drop (m) | 8.27 |
Note(s): * Distance X from the lowest block and Height Z above channel bottom.
Disclaimer/Publisher’s Note: The statements, opinions and data contained in all publications are solely those of the individual author(s) and contributor(s) and not of MDPI and/or the editor(s). MDPI and/or the editor(s) disclaim responsibility for any injury to people or property resulting from any ideas, methods, instructions or products referred to in the content. |
© 2023 by the authors. Licensee MDPI, Basel, Switzerland. This article is an open access article distributed under the terms and conditions of the Creative Commons Attribution (CC BY) license (https://creativecommons.org/licenses/by/4.0/).
Share and Cite
MDPI and ACS Style
Caballero, F.J.; Toledo, M.Á.; Moran, R.; Peraita, J. Quasi-Prototype Size Testing of Wedge-Shaped Block for Armoring Embankment Dams and Levees. Water 2023, 15, 662. https://doi.org/10.3390/w15040662
AMA Style
Caballero FJ, Toledo MÁ, Moran R, Peraita J. Quasi-Prototype Size Testing of Wedge-Shaped Block for Armoring Embankment Dams and Levees. Water. 2023; 15(4):662. https://doi.org/10.3390/w15040662
Chicago/Turabian StyleCaballero, Francisco Javier, Miguel Ángel Toledo, Rafael Moran, and Javier Peraita. 2023. "Quasi-Prototype Size Testing of Wedge-Shaped Block for Armoring Embankment Dams and Levees" Water 15, no. 4: 662. https://doi.org/10.3390/w15040662
Note that from the first issue of 2016, this journal uses article numbers instead of page numbers. See further details here.