Article

First Comprehensive Analysis of Potential Ecological Risk and Factors Influencing Heavy Metals Binding in Sewage Sludge from WWTPs Using the Ultrasonic Disintegration Process

Institute of Environmental Engineering, Polish Academy of Sciences, 34 M. Skłodowskiej-Curie St., 41-819 Zabrze, Poland
*
Author to whom correspondence should be addressed.
Water 2023, 15(4), 666; https://doi.org/10.3390/w15040666
Submission received: 5 January 2023 / Revised: 3 February 2023 / Accepted: 5 February 2023 / Published: 8 February 2023
(This article belongs to the Special Issue Environmental Biotechnology for Wastewater and Sludge Treatment)

Abstract

:
In this study, the occurrence, fractionation, and potential ecological risk associated with seven heavy metals (HMs), i.e., Cd, Cr, Cu, Ni, Pb, Zn and Hg in sewage sludge (SS) were investigated. The main aim of the study was to conduct the first comprehensive analysis of the potential ecological risk of HMs in SS collected from two municipal wastewater treatment plants (WWTPs) using ultrasonic disintegration (UD) of thickened excess sludge aimed at improving the effects of anaerobic digestion (AD). In order to assess the level of potential ecological risk, two groups of indices related to the total content of HMs and their chemical forms were used. For this purpose, a modified BCR sequential extraction was conducted. The obtained results revealed that according to the values of total indices, the highest potential ecological risk was posed by Cd, Cu and Zn (and to a lesser extent by Ni and Cr), while in relation to speciation indices by Ni, Zn, Cd (and in some cases by Cr). In general, the highest risk was indicated at the beginning (primary and excess SS) and the two final stages of sludge processing (digested and dewatered SS). This means that the level of ecological risk may strongly depend on the processes used in WWTPs and especially on AD, dehydration and the activated sludge process, as well as on the characteristics of raw wastewater. The results of the statistical analysis and balance sheets revealed that the key factors which may influence the way that HMs bind in SS are: pH, TOC, OM and Eh. The obtained results showed that UD does not cause any significant changes in the total HMs concentrations in SS, and their release into supernatant in the mobile forms. This proves that UD is a safe and environmentally friendly method of sewage sludge pretreatment.

1. Introduction

Sewage sludge (SS) is a solid, semi-solid, or liquid waste produced in a wastewater treatment plant (WWTP) as a by-product of wastewater treatment processes [1,2,3]. In recent decades, SS production has rapidly increased around the world, especially in developing countries. The main reasons for the increased volume of SS are population growth, new wastewater treatment technologies and the development of industry [2,4,5].
Sewage sludge is characterized by a large amount of organic compounds and nutrients necessary for plant growth [4,6,7]. For this reason, sludge can be used as an organic fertilizer. However, it also contains pollutants which can have a negative impact on soil properties and plant growth, i.e., hazardous pathogens, toxic organic compounds and potentially bio accumulative, toxic and carcinogenic heavy metals (HMs) [8,9,10]. One of the most important parameters which limits the use of SS for agricultural purposes is heavy metals content [7]. The permissible levels of HMs in the application of SS in Poland and European Union (EU) countries are regulated by relevant legal acts [11,12]. However, agricultural applications of SS are still the most ecological and sustainable way of managing of this waste [1,9]. However, the presence of HMs in sludge may pose a potential ecological risk. Therefore, in order to minimize the negative impact of sludge on soil and water environments, as well as on plant growth, it should be properly stabilized before use [8]. This is crucial, bearing in mind that through the consumption of plants grown on fields fertilized with sewage sludge the HMs enter the food chain, which may result in negative health effects [5,10].
Anaerobic digestion (AD) is one of the most important and commonly used processes for sewage sludge stabilization, in which microorganisms break down the organic matter (OM) under anaerobic conditions [4,13]. The crucial goal of AD is to generate environmentally friendly and safe waste which can be used for agricultural purposes [13]. Moreover, one of the positive effects of AD is the production of biogas which can be a source of renewable energy [14]. This is an important aspect, due to the fact that according to Directive (EU) 2018/2001 [15], at least 32% of gross final energy consumption in the EU is required to come from renewable energy sources (RES) by 2030. As a part of the EU community, Poland has declared that it aims to achieve 21–23% of RES share in gross final energy consumption by 2030 [16]. However, AD may also have disadvantages which include the biodegradability of sludge, high hydraulic retention time, low pathogen inactivation, etc. Therefore, it is necessary to use appropriate processes to improve the effects of AD on sludge [13]. Currently, the growing interest in green technologies is encouraging the use of alternative and environmentally friendly methods of sludge pretreatment. One of them is ultrasonic disintegration (UD) [17]. UD is based on the cavitation phenomenon. As a result of cavitation, microbubbles are formed, the implosion of which generates increased shear forces. These forces disrupt the sludge structure, which increases the amount of biodegradable matter available as a substrate to the microorganisms involved in the subsequent phases of the AD process [17,18]. UD shortens the rate-limiting phase of AD, i.e., hydrolytic phase, and increases the efficiency of the process [19]. The effects of UD are mainly affected by sonication parameters (power, intensity, frequency, energy supplied) and sludge characteristics [4,18]. According to literature data, the successful, full-scale application of UD technology increases biogas production by up to 50% [4,14]. Moreover, while maintaining an optimal input to output energy ratio, the full-scale application of UD results in the lowest impacts on climate change, greenhouse gas emissions, fossil fuel depletion and stratospheric ozone depletion [17]. The main advantages of UD pretreatment of sludge are the absence of byproducts, the absence of additional reagents and the possibility to intervene at any stage of the process [18,20]. UD installations are used on a full-scale around the world, e.g., in Austria, the United Kingdom, France, Germany, Italy, Japan, the Netherlands, Sweden, etc. [19]. For comparison, in Poland, the ultrasound pretreatment of sewage sludge in not that common. There are several WWTPs which use UD at scale, e.g., in Masovian (in Polish Mazowieckie), Greater Poland (Wielkopolskie), Subcarpathian (Podkarpackie), Lubelskie (Lubelskie) and Kuyavian-Pomeranian (Kujawsko-Pomorskie) Voivodeships, etc. The main reason why WWTPs have stopped or have decided not to use UD is the fact that SS has undergone changes during the process [18] which, in turn, may affect its final physicochemical characteristics. However, this problem can be easily eliminated by systematically controlling the parameters of sludge subjected to UD.
Considering the above mentioned data and also the fact that the content of HMs in sewage sludge depends on the origin of the raw wastewater and the treatment methods, it was decided to carry out the first comprehensive assessment of the potential ecological risk (balance) in relation to WWTPs conducting UD (non-conventional) pretreatment of sewage sludge prior to AD. The presented approach is a novelty and can be an important contribution to further research in this direction. For this purpose, several sludge samples from the two selected WWTPs were collected throughout the processing line. The assessment of potential ecological risk was based on the two groups of indices, and refers to the total content and chemical forms (fractions) of HMs in the sludge samples. This approach results from the fact that knowledge of the total concentrations of HMs in sewage sludge only gives information on overall pollution levels, while their toxicity, mobility and bioavailability depend strongly on their chemical (speciation) forms [5,21,22]. For this purpose, the modified three-step BCR sequential extraction proposed by the Community Bureau of Reference (BCR, now the Standards, Measurements and Testing Program) was used [5,23,24]. This method allows to determine the components of sludge that particular metals are associated with. Unfortunately, so far there is no legislation concerning the analysis of speciation forms of HMs in sewage sludge. Therefore, there is a need to conduct further research in this area to search for factors influencing the way that HMs bind in sewage sludge and their potential mobility, as well as bioavailability in the environment. All of the above mentioned arguments justify undertaking the research in question.
The aims of this study are: (1) to determine the content of HMs (Cd, Cr, Cu, Ni, Pb, Zn and Hg) and their chemical forms in SS samples collected from the two WWTPs conducting UD; (2) to evaluate the degree and effects of full-scale UD sludge processing; (3) to assess the potential ecological risk of HMs in SS samples using two groups of indices; (4) to define the relationship between HMs and other parameters of SS, and indicate the factors influencing their binding and mobility; (5) to determine the first balance of ecological risk based on total concentrations of HMs and their chemical forms.

2. Materials and Methods

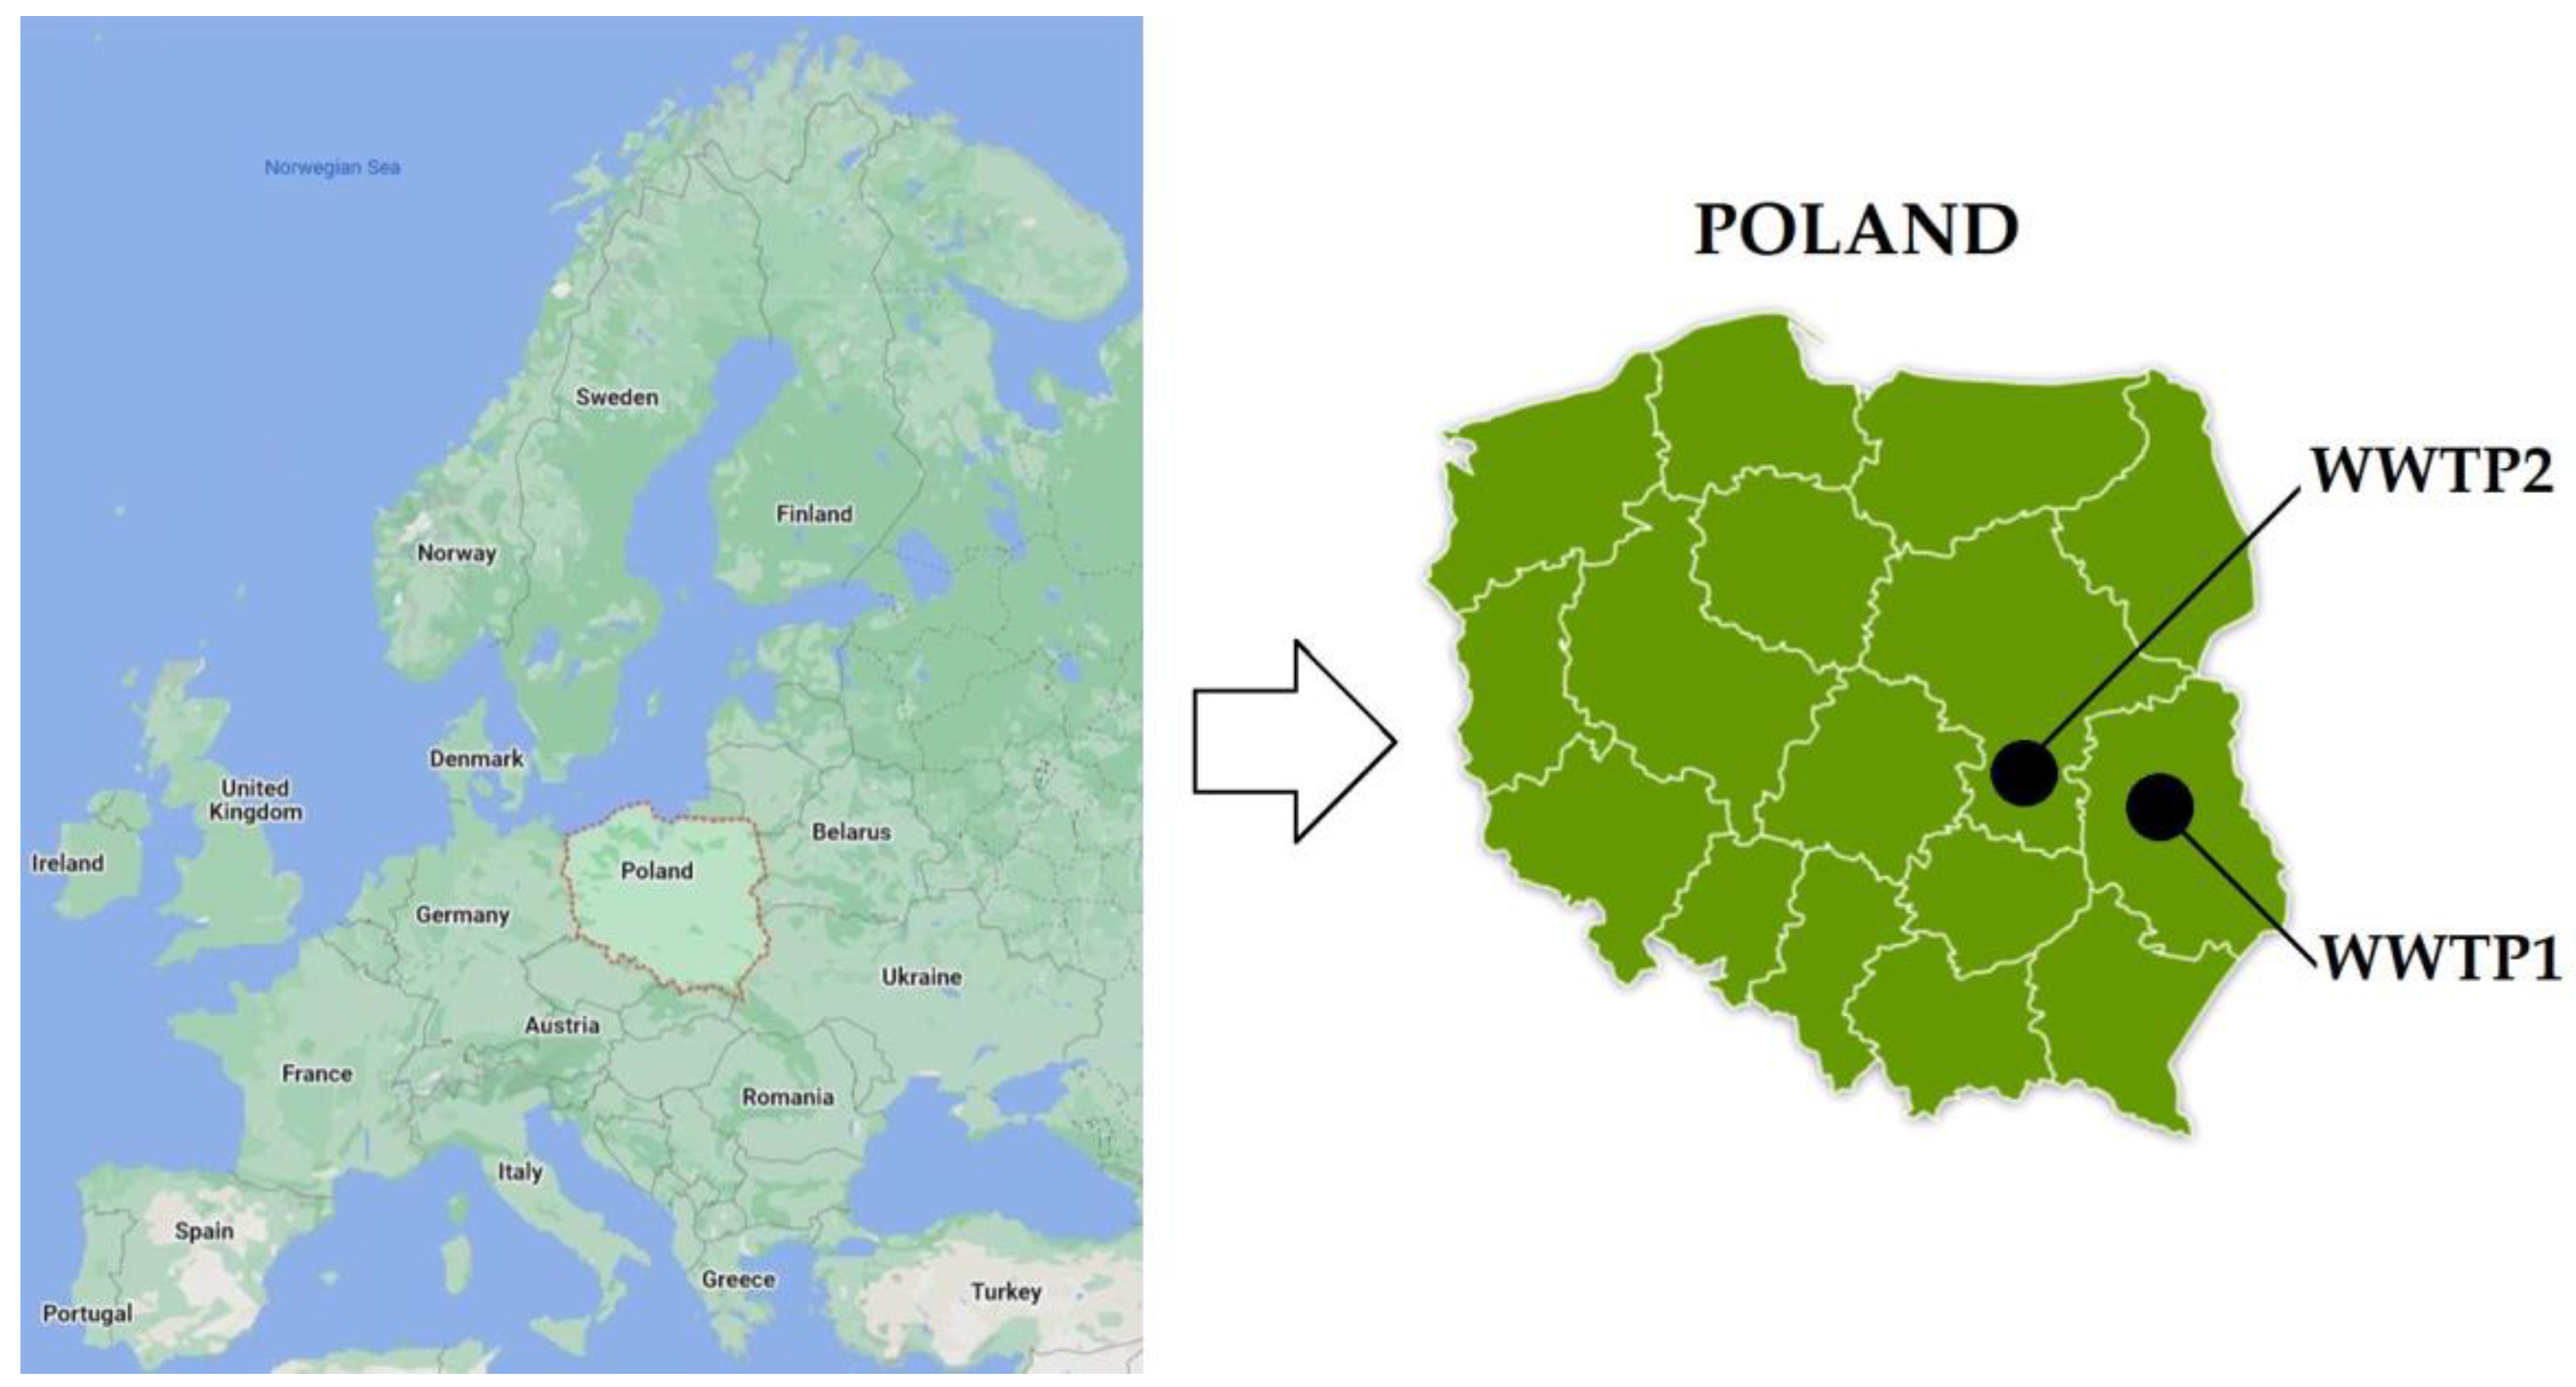
2.1. Study Area and Sampling

The sewage sludge samples were collected from two mechanical-biological wastewater treatment plants (WWTPs) located in Eastern Poland (Central Europe). The first WWTP is located in the Lubelskie Voivodeship (WWTP1), while the second one is in the Masovian Voivodeship (WWTP2) (Figure 1). They are located approximately 110 km apart and both accept municipal and industrial wastewater. The WWTPs are both equipped with a VTA-GSD installation (VTA Technologie GmbH) for the ultrasonic disintegration of excess sludge, which is aimed at increasing the effectiveness of anaerobic digestion, one of the most important processes of sludge treatment.
The research was conducted in 2021. Sludge samples were collected at every stage of processing twice per year, i.e., in the winter and summer season. Seven sludge samples (weighing about 3 kg each) were collected at each WWTP, i.e., the primary sludge (after thickening—WWTP1; mixture of primary and flotated sludge—WWTP2) (S1), excess sludge (S2), thickened excess sludge (S3), disintegrated sludge (S4), mixed sludge (thickened primary sludge + thickened excess sludge + disintegrated sludge—WWTP1; primary and flotated sludge + disintegrated sludge—WWTP2) (S5), digested sludge (S6), dewatered sludge (S7). In both cases, samples of digested and dewatered sludge were collected after the completion of the AD time, characteristic for a given WWTP. SS samples were kept in polypropylene containers and stored in a refrigerator at 4 °C until laboratory analysis. The basic operational parameters of the WWTPs are shown in Table 1.

2.2. Physicochemical Analysis

Basic Parameters of Sewage Sludge

Physicochemical properties of the sludge samples were determined by dry matter (DM) (PN–EN 12880:2004) [26] and organic matter (OM) content (PN–EN 12879:2004) [27], total organic carbon (TOC) (PN-EN 13137:2004) [28], pH and redox potential (Eh) (potentiometric method; according to manufacturer instructions). DM and OM were examined by using a laboratory dryer SUP-100G (Wamed, Warszawa, Poland) and oven SM-2002 (Czylok, Jastrzębie-Zdrój, Poland), while TOC using a TOC analyzer 5000A (Shimadzu, Kyoto, Japan). The values of pH and Eh were measured by using a digital CPR-411 m (Elmetron, Zabrze, Poland) equipped with two electrodes IJ-44A and ERS-2, respectively.

2.3. Assessment of the Sewage Sludge Disintegration Degree

The disintegration degree (DDCOD) was determined based on an indicator proposed by Müller (1996) [29] (Equation (1)). The chemical oxygen demand (COD) was determined by using a photometer NANOCOLOR 500 D (Macherey-Nagel, Düren, Germany) according to PN-ISO 15705:2005 [30] (NANOCOLOR tube test, Düren, Germany).
D D C O D = S C O D U D S C O D 0 S C O D N a O H S C O D 0 × 100   ( % )
where:
DDCOD—disintegration degree (%), SCODUD—supernatant COD of the sonicated sample (mg·L−1); SCOD0—supernatant COD of the original sample (mg·L−1); SCODNaOH—COD release in the supernatant after alkaline hydrolysis of sludge with 0.5 M NaOH (POCH, Gliwice, Poland), ratio of 1:1 for 22 h at 20 °C (mg·L−1) [18,29,31].
Evaluation of the disintegration effects also included determination of changes in the content of total organic carbon in excess sludge supernatant, as well as excess sludge susceptibility to dewatering by using the capillary suction time (CST) test. TOC content in sludge supernatant was determined using a TOC analyzer 5000A (Shimadzu, Kyoto, Japan), and CST with a capillary suction timer (Envolab, Długomiłowice, Poland). TOC and CST were measured according to Internal Research Procedure PB4 (Issue 6, 10 July 2019) [32] and PN–EN 14701–1:2007 [33], respectively.

2.4. Heavy Metal Determination

Prior to HMs analysis, the sludge samples were dried in a laboratory dryer (SUP-100G, Wamed) to a constant mass at 105 °C. In the next step, samples were ground in a mortar (Mortar Grinder Pulverisette 2, Fritsch, Idar-Oberstein, Germany) and sieved through a 0.2 mm sieve. The only SS which was difficult to grind and sieve was the primary sludge. This was due to the fact that primary sludge is characterized by high moisture content, and during drying formed a thick and hard layer. Therefore, after drying, the primary sludge samples were divided into small particles with Teflon scissors and milled [5].
Afterwards, the sludge samples underwent microwave-assisted acid digestion (mineralization). For this purpose, 0.2 g of sample was placed in a Teflon flask, and a mixture of 15 mL 35–38% hydrochloric acid (HCl) and 5 mL 65% nitric acid (HNO3) was then added carefully. In the next step, the Teflon flask was placed in a Multiwave 3000 digestion system (Anton Paar GmbH, Graz, Austria). After cooling, the obtained solution was filtered through quantitative filter papers with a medium pore size (grade 390; Filtrak-Munktell, Ahlstrom-Munksjö, Helsinki, Finland/Sweden) and diluted with 5% HNO3 to a volume of 50 mL. Distilled-deionized water (HLP 10UV, Hydrolab, Straszyn, Poland) and analysis-pure (a.p.) hydrochloric and nitric acids (POCH, Gliwice, Poland) were used to prepare sludge samples and standards.
Heavy metals analysis in the obtained solutions was conducted using inductively coupled plasma atomic emission spectroscopy (ICP-OES; Avio 200 ICP-OES, PerkinElmer, Inc., Waltham, MA, USA). Determination of the mercury concentration was carried out with cold vapor atomic absorption spectrometry (CVAAS). Identical procedures were applied for the analysis of HMs content in the leachate (L) and obtained extracts. The operating parameters for ICP-OES, wavelengths, and limits of detection (LOD) for the analyzed HMs are presented in Table 2.

2.5. Quality Control

In order to verify the precision and accuracy of the method used for total heavy metals determination, quality control was conducted. For this purpose, the ERM-CC144 (Joint Research Center; JRC), a certified reference material (CRM) was used. All analysis was carried out in triplicate with a reagent blank. The corrections to dry mass were carried out with the manufacturer’s instructions. The recovery rates (R) for HMs in the CRM were in the range of 87.4–101.0%, while the average values of the relative standard deviation (RSD) amounted to less than 10% for each of the analyzed HMs and ranged from 0.3% to 2.9%. The data on quality control originate from our previous study [5], which is an integral part of the discussed research.

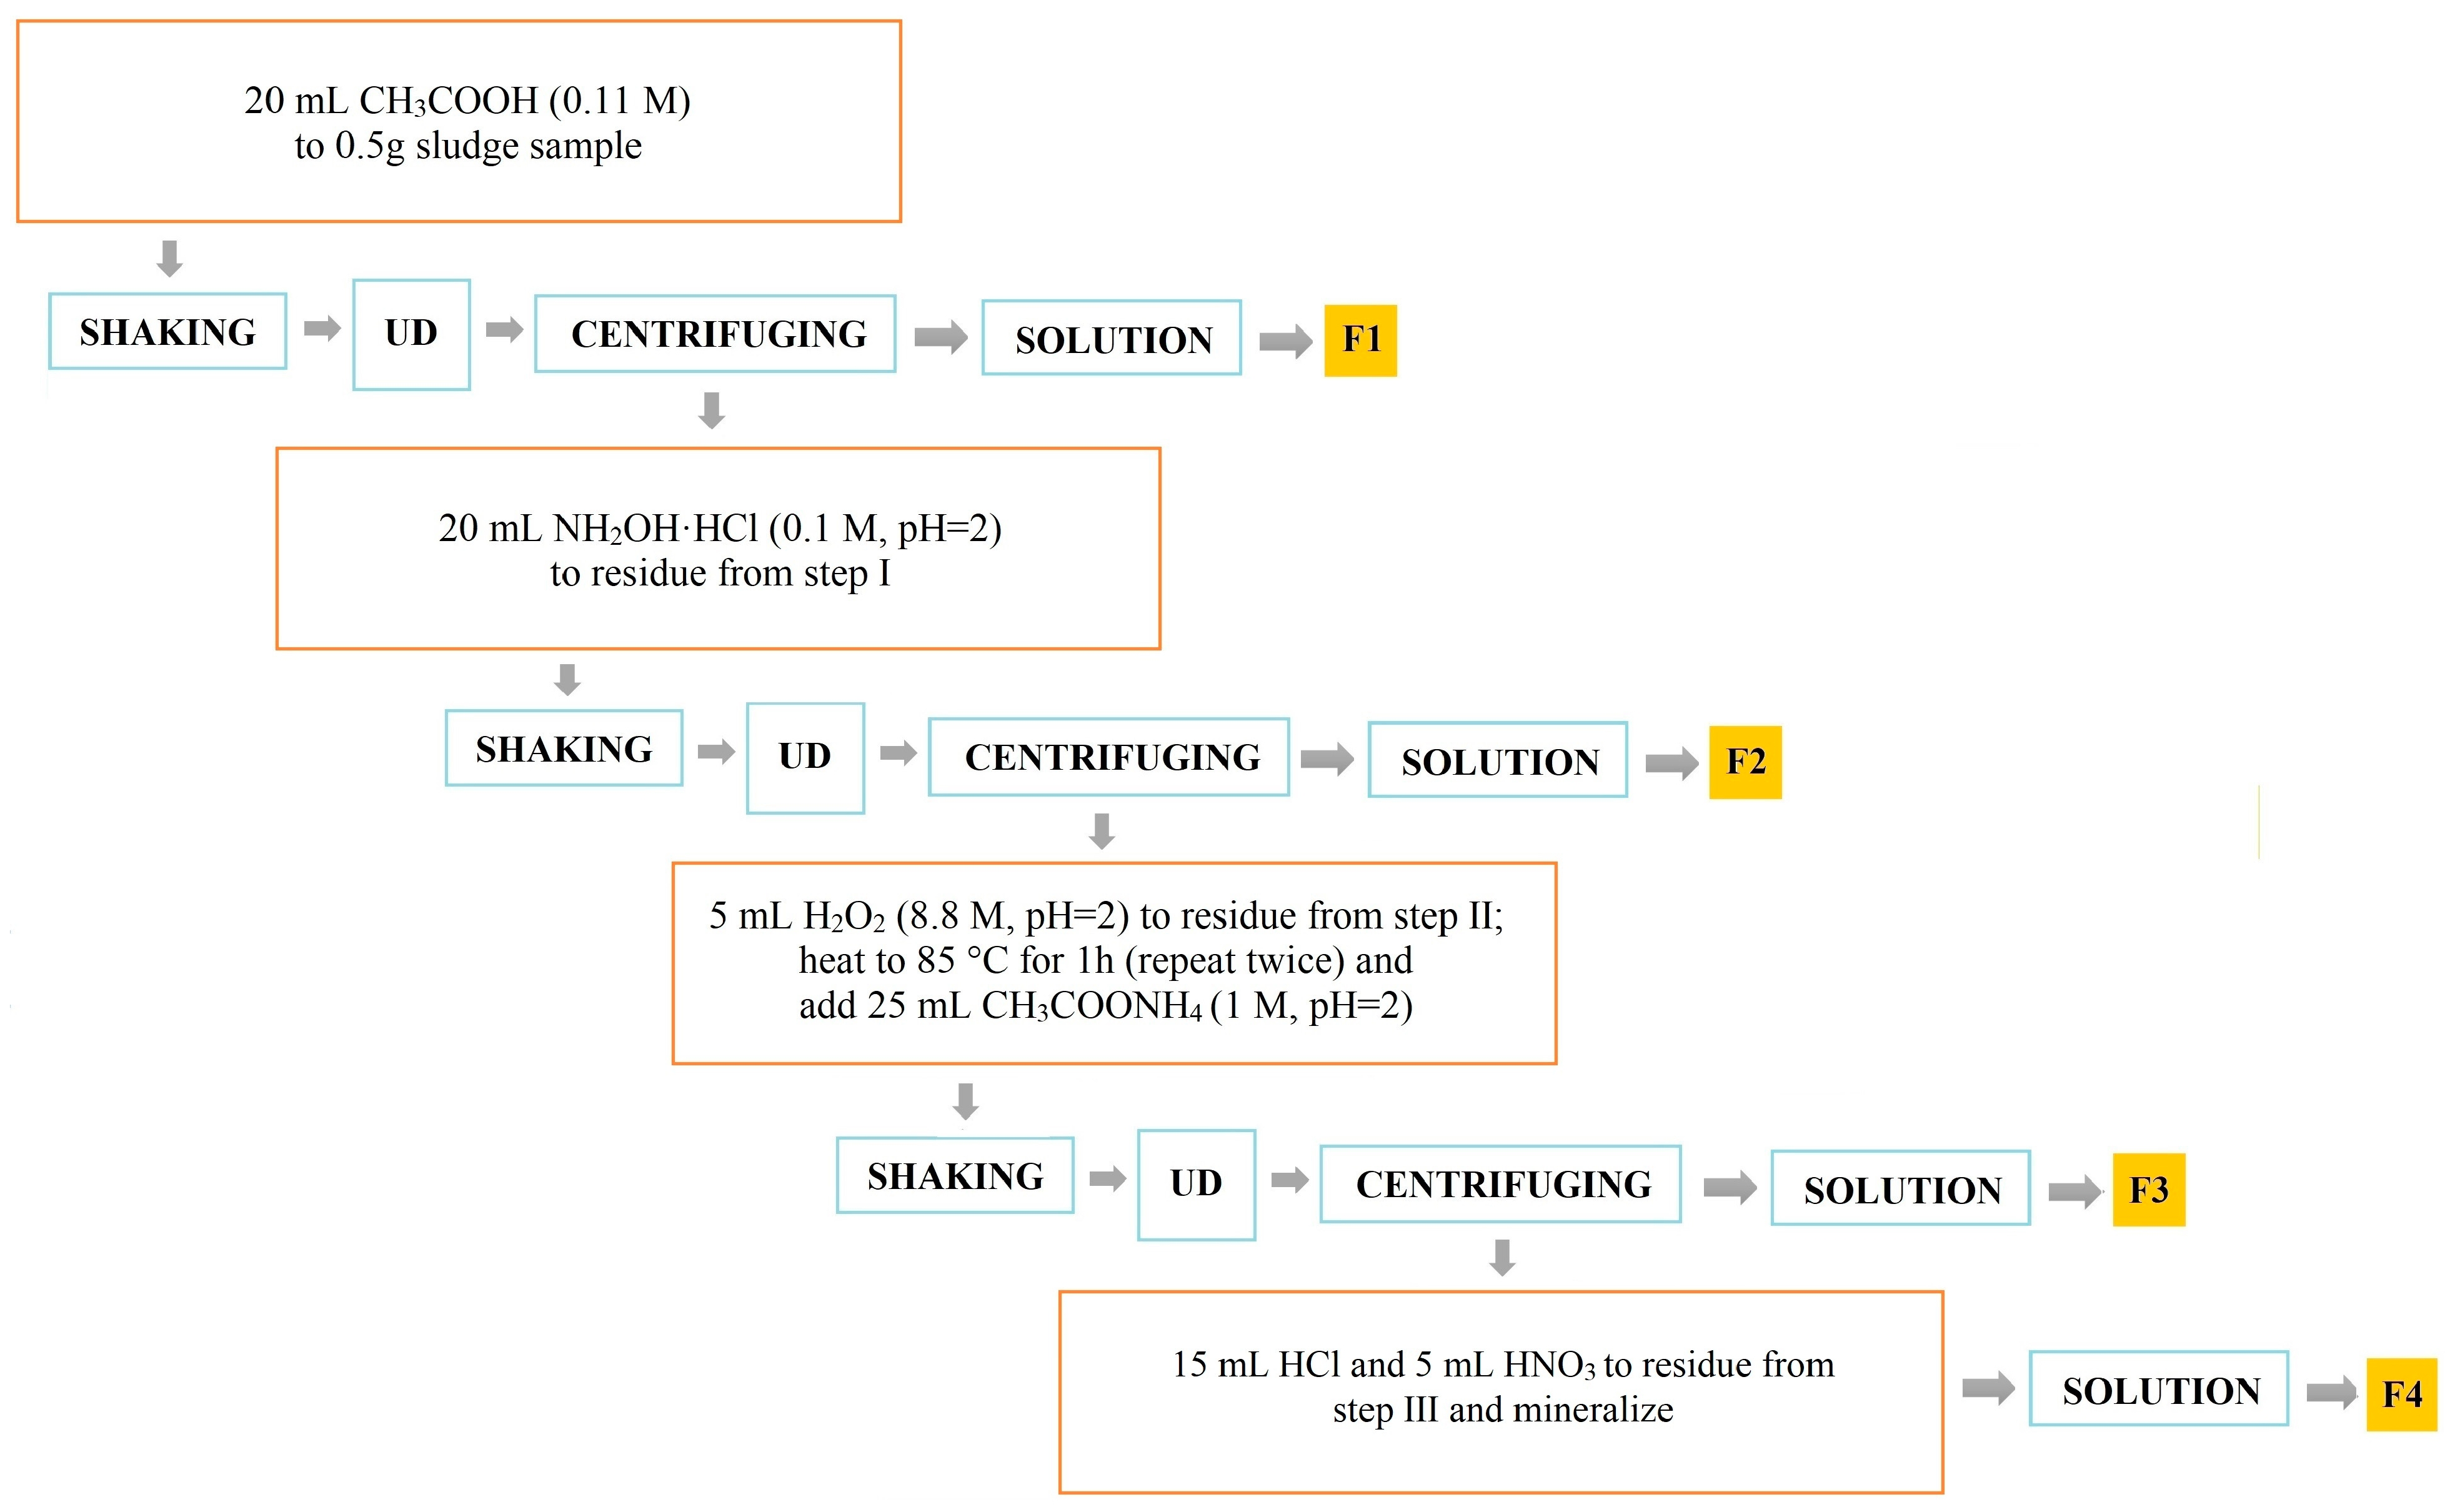
2.6. Sequential Extraction and Heavy Metals Chemical Speciation

BCR sequential extraction is the three-step (SI-SIII) procedure proposed by the Community Bureau of Reference (now the Standards, Measurements and Testing Program) for chemical fractionation of heavy metals. However, there is also a fourth step which is optional [23,24,34]. The BCR sequential extraction allowed the determination of three main chemical speciation forms of HMs based on their migration capacity, i.e., acid soluble/exchangeable fraction—bound to carbonates (F1), reducible fraction—bound to Mn and Fe oxides (F2), oxidizable fraction—bound to organic matter and sulfides (F3), and the last optional step—the residual fraction (F4). The first two fractions are mobile, while the third and fourth are immobile. The most mobile fraction is F1 [3,10].
In this study, the modified, ultrasound assisted BCR sequential extraction procedure was used [5]. This was aimed at reducing the extraction time from a dozen to several hours. The flowchart for the BCR sequential extraction method used in this study is shown in Figure 2.
The ultrasound treatment was carried out in an ultrasonic bath (Sonic 5, Polsonic, Warszawa, Poland) for 30 min and was repeated after each extraction step (except for the fourth step). The extraction tubes were placed in a special basket equipped with a stainless steel plate which ensures a stable tubes position throughout the process conducting. The working parameters of the ultrasonic bath were 2 × 320 W and 40 kHz. The water temperature in the ultrasonic bath was kept constant at a level of 30 °C ± 5 °C. However, in order to thoroughly mix the sludge with the reagent before ultrasound treatment, the sample was shaken for 30 min. For comparison, in the classical procedure the sample is shaken for 16 h. After completion of centrifuging, the obtained solution was taken for analysis while the residue was washed with deionized water, and then the next regent was added. The effectiveness of the ultrasound-assisted extraction procedure has been confirmed by other scientists, who indicated that this method gives comparable results as conventional method [5,35]. The chemical reagents used in the sequential extraction were as follows: acetic acid; 99.5–99.9% a.p. (CH3COOH; POCH, Gliwice, Poland), hydroxylamine hydrochloride a.p. (NH2OH·HCl; Chempur, Piekary Śląskie, Poland), hydrogen peroxide; 30% a.p.; (H2O2; Chempur, Piekary Śląskie, Poland), hydrochloric acid; 35–38% a.p. (POCH, Gliwice, Poland) and acetic acid; 65% a.p. (POCH, Gliwice, Poland).
One should note that the use of ultrasonic waves in the sequential extraction procedure should not be equated with the process of ultrasonic disintegration used in WWTPs. In sequential extraction, the sample is placed in the extraction tube; therefore, ultrasonic waves do not directly affect the sludge structure, but only support the action of individual extractants.

2.7. Potential Ecological Risk Assessment

The potential ecological risk assessment of HMs (Cd, Cr, Cu, Ni, Pb, Zn and Hg) in sludge samples from two WWTPs was carried out by using two different groups of indices, i.e., total content and speciation indices. The obtained results make the first balance sheet of the level of potential ecological risk posed by HMs, as a function of sludge processing. The authors also proposed two new indices. The ecological risk criteria for heavy metals are shown in Table 3.

2.8. Statistical Analysis

A comprehensive statistical analysis was conducted to evaluate the obtained results. The confidence interval of statistical analyses was selected as 95% (p < 0.05). The normality of the distribution was examined using the Shapiro-Wilk test. To determine the relationship between groups of analyzed variables (HMs, pH, Eh, DM, OM, TOC) the Pearson’s correlation coefficients (r) were calculated. To check the differences in the mean values of specific parameters of the thickened excess sludge before and after its ultrasonic disintegration (TOC, CST), the Student’s t-test correlation coefficient was applied. All calculations and analyses were performed using MS Excel ver. 2211 (Microsoft 365) and Statistica ver. 12.0 (StatSoft).

3. Results and Discussion

3.1. Basic Physicochemical Parameters of Sewage Sludge

The basic parameters of sewage sludge at successive stages of its processing are presented in Table 4.
The physicochemical characteristics of SS samples collected at WWTP1 and WWTP2 indicate low fluctuations of individual parameters in the considered seasons. In accordance with the literature data, the above-presented values of SS parameters are typical [3,7,9,41]. Sludge samples collected at the beginning of the processing line (S1) were characterized by the lowest pH values, while at the final stage (S7) by the highest. It can be assumed that lower pH values in primary SS compared to those at other points results from the characteristics of raw wastewater. Moreover, the lowest Eh values were observed in digested sludge (S6). Considering the fact that one of the main requirements for the proper course of the AD is to provide reducing conditions, low Eh values in the above-mentioned SS are typical. Moreover, the sludge samples at sampling point S7 were characterized by the highest DM content. It was caused by the reduction of water content in SS as a result of the dewatering process. In both WWTPs, the lowest OM content and TOC were indicated in digested sludge samples (S6). However, despite the similar content of OM in the raw SS samples, the digested sludge from WWTP1 was characterized by a lower content of OM in comparison with the sludge from WWTP2. This means that SS from the first WWTP was better stabilized. Taking into account that the pH value of sludge and temperature during AD in WWTP2 are within the acceptable ranges, i.e., 6.8–7.4 and 33–37 °C [41], the reason for the higher organic matter content might be too short of a stabilization time or the composition of the mixed sludge subjected to AD. Moreover, in both cases, the redox potential should be lower, because the limit value of this parameter in the AD process is within the range of −490 mV to −550 mV [41].

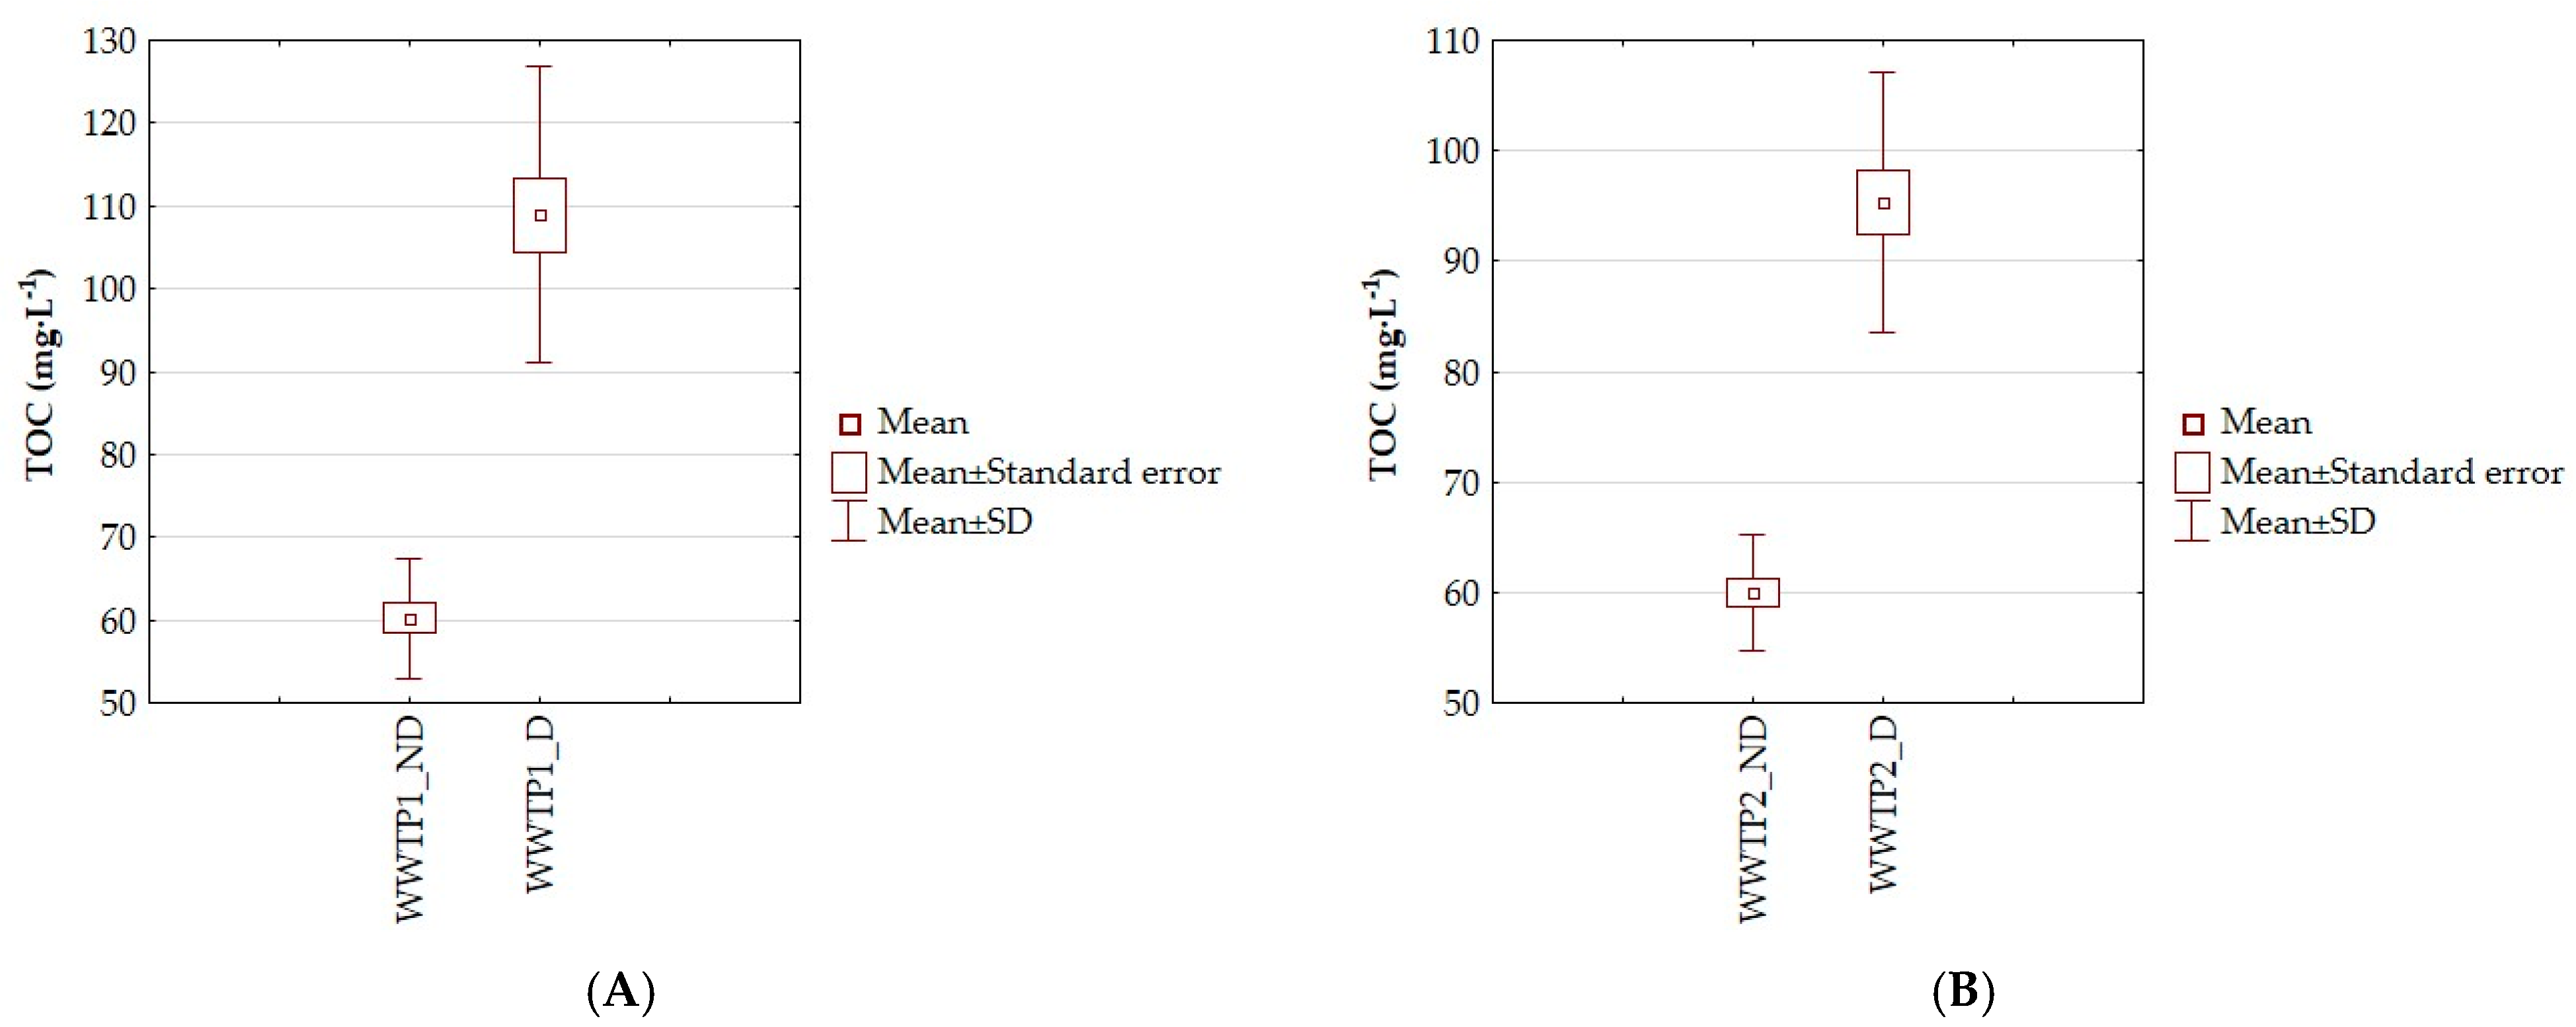
3.2. Degree of Disintegration

Generally, the conducted research indicated that the process of ultrasonic disintegration did not negatively affect the basic parameters of thickened excess sludge (pH, Eh, DM, OM, TOC). Similar observations were made by other scientists who analyzed the effect of ultrasound treatment on selected sludge parameters when conducting the full-scale process in one of Singapore’s WWTPs [42]. In accordance with the literature data, the application of UD requires the constant control of several parameters, such as ultrasonic frequency, power and intensity, DM content, pH, and temperature [18,19]. In practice, the most important parameter is DM content. According to scientific data, the DM should be in the range of 2.3–3.2%. This avoids decreasing the UD efficiency and eliminates the increases in energy consumption [17]. Unfortunately, this fact is often neglected by exploiters of WWTPs. In the discussed research, in both of the analyzed WWTPs, the mean content of DM in the thickened excess sludge samples (S3) were higher than allowed, i.e., 5.2% (WWTP1) and 4.0% (WWTP2). This could negatively affect the efficiency of the process.
The disintegration degree (DDCOD) of thickened excess sludge from WWTP1 and WWTP2 amounted to 0.7% to 1.5% (average 1.1%) and from 0.8% to 2.2% (average 1.4%), respectively. While considering the ratio of SCOD content in the sludge samples before and after UD, the multiplicity of this parameter increase was the same for both WWTPs and amounted to 1.7 (increase in SCOD concentrations by 66%). It is important to note that the presented results concern the UD of thickened excess SS in the full-scale installation. Therefore, the DDCOD will not be as high as in the bench-scale, where the power and intensity of ultrasound are much higher, and the volume of SS is incomparably smaller. This parameter was only used to confirm that the UD process is running correctly. Moreover, the degree of disintegration would also be higher if the DM concentrations of SS samples were lower. However, the DDCOD is one of the most commonly used indices for the assessment of disintegration degree while conducting the process at bench-scale and semi-technical scale [18,43,44,45].
Further proof that UD treatment went flawlessly, there were also changes observed in the sewage sludge characteristics after the process was completed, i.e., the increase in the capillary suction time and in the content of total organic carbon in the supernatant liquids. The obtained results indicated that CST increased from 131 s to 565 s, and from 26 s to 66 s for thickened excess sludge samples collected from the WWTP1 and WWTP2, which gives an increase of 331% and 154%, respectively. A similar trend was noted in relation to the content of TOC in sludge supernatant after SS sonication. The content of TOC increased from 60.2 mg·L−1 to 109.0 mg·L−1, and from 60.0 mg·L−1 to 95.3 mg·L−1 for sludge samples collected from WWTP1 and WWTP2, which gives 81% and 59% increases, respectively. Similar conclusions were also presented in our previous research [18,46,47]. Despite the lower content of DM in the sludge collected from WWTP1, the disintegration effects were weaker. This may be due to the use of different frequencies, intensity or power during the process in the two WWTPs. However, the dependent sample t-test confirmed that in both cases, the observed changes were statistically significant. The results of the t-test are shown in Figure 3A,B and Figure 4A,B.

3.3. Total Content of Heavy Metals

The concentrations of heavy metals in sewage sludge samples from two WWTPs are presented in Table 5. The content of HMs showed no significant variability in the considered seasons. The only exceptions were the content of Pb and Cr at WWTP1, as well as Cr and Zn at WWTP2. The dominant HM in sludge samples was Zn, while Hg presented the lowest concentrations. In general, the total content of HMs did not exceed the permissible levels in sewage sludge used for agricultural purposes, both in Poland [11] and in the European Union [12].
The mean concentrations of HMs in the sludge samples, in the entire processing line, were as follows: Zn > Cu > Ni > Cr > Pb > Cd > Hg and Zn > Cr > Cu > Ni > Pb > Cd > Hg for WWTP1 and WWTP2, respectively. A similar series of HMs were also presented by other scientists, e.g., Zn > Cr > Cu > Pb > Ni > Cd [1], Zn > Cu > Cr > Ni > Pb > Cd [48] and Zn > Cu > Pb > Cr > Ni [49]. The scientific literature presents information about the high adsorption ability of activated sludge (AS), for example in relation to Cu or Zn [50,51]. In this study the AS is represented by excess sludge, which is an excess of activated sludge that goes to the secondary tank (S2). This relationship was observed only to a certain extent in this research. It was indicated that the summary content of HMs in excess sludge slightly increased in comparison with the primary sludge (S1). However, in both cases, the highest concentration of each of the analyzed HMs was found at the last two stages of the processing line, i.e., in the digested (S6) and dewatered sludge (S7) samples. The literature data report that increasing pH favors the adsorption of HM ions (as a result of less competition between H+ and HM ions for adsorption sites) [51]. Comparing the slight variations in pH, Eh (except for S1–S2 and S6–S7), OM and TOC values with fluctuation with regard to DM content, most likely, the key factor of changes in the total content of HMs in sludge were the dry matter content. The value of this parameter was subjected to dynamic changes in subsequent processes used in the WWTPs (especially at sampling points S2, S3 and S6). However, considering the high concentrations of HMs in the digested sludge, and considering the decrease in the content of DM, OM and TOC, the reason for the increase of heavy metals content was probably their adsorption on the surface of sludge flocs.
In summary, the total content of all analyzed HMs in sewage sludge samples exhibited a similar order, i.e., S6 > S7 > S3 > S5 > S4 > S2 > S1 (WWTP1) and S7 > S6 > S3 > S4 > S2 > S1 > S5 (WWTP2). Small differences may result from changes in the parameters of the conducted processes or temporary disturbances in their courses. Understanding the processes used in WWTPs is one of the most crucial factors in explaining the mechanisms of HMs migration in sewage sludge. Unfortunately, in the scientific literature there are only a few studies of the distribution of chemical forms of HMs and their trends of migration in WWTP [3,7,51,52].
Considering the data presented in Table 5, it can be also stated that the process of ultrasonic disintegration does not strongly affect the HMs concentration in the thickened excess sludge. Moreover, a slight decrease in the content of HMs in SS after UD was observed (except for Hg). However, this is also further proof that ultrasonic disintegration is an environmentally friendly method of SS pretreatment.
To determine whether there is a relationship between the analyzed HMs, the Pearson’s correlation matrixes were prepared. Considering the obtained results, the existence of a correlation between analyzed heavy metals, with a few exceptions, can be confirmed. However, this relationship is statistically significant only between some of them. The strong correlation means that HMs probably had the same behavior during transport and even source of origin [53,54]. Similar conclusions have also been drawn by other scientists [54,55,56]. The obtained results are presented in Table 6.

3.4. Heavy Metals Balance

In order to indicate at which sampling points the greatest differences in the summary HMs content occurred, simplified balance sheets were prepared (Figure 5A,B). The balances do not include the concentrations of heavy metals in the leachate due to their small impact on the overall HMs content in the SS. In the WWTP1, leachates are generated during thickening of primary (L1) and excess sludge (L2) as well as during dewatering of digested sludge (L3), while in the WWTP2 during thickening of excess sludge (L2) and dewatering (L3). In general, the measured levels of HMs are below the limits of detection, which means that the leachate stream returned to the processing line of the WWTPs does not pose a threat. The percentage shares of individual HMs in leachate, in comparison with their total content in sludge samples, are low, with some exceptions, i.e., Cd (27.9%; L3), Ni (42.4%; L1) and Pb (31.3%; L1) in the WWTP1, as well as Pb (32.3%; L2 and 17.4%; L3) in the WWTP2. However, it should be noted that the volume of leachate generated during sludge processing constitutes a small percentage of the volume of SS produced.
The idea of a simple HMs balance results from the fact that in order to make a full balance, it is necessary to know, i.e., the concentrations of HMs in raw wastewater, flow rates and the mass of sludge produced [50,57]. The publication of such data depends on the decision of the given WWTP. The obtained results indicated that, in total, the highest content of heavy metals was found in the stabilized (S6) and dewatered (S7) sludge samples, i.e., 1564.7 mg·kg−1 and 1479.8 mg·kg−1 (WWTP1), and also 981.4 mg·kg−1 and 988.0 mg·kg−1 (WWTP2). However, the balance prepared for WWTP1 shows that the greatest differences in HMs content in SS were reported between sampling points S2 and S3 (17.8%), as well as between S5 and S6 (27.6%), while in the WWTP2 between S5 and S6 (40.7%). The above mentioned changes probably resulted from the processes used at the individual WWTP, i.e., thickening and stabilization. While the increase in the concentrations of heavy metals between excess and thickened excess sludge can be explained by an increase of the dry matter content, in the case of digested sludge it is not so obvious. It was indicated that despite the decrease in DM content, the concentrations of HMs in digested sludge increased. Anaerobic digestion is a very complex process during which a number of transformations (phases) occur that may contribute to the accumulation of HMs by the microorganisms conducting the process. The high concentrations of HMs could be related to their good binding to the solid particles of SS, and also to the changes in its characteristics during the process (pH, Eh, OM, etc.). The results described above partly confirm the authors’ previous observations [3,7].

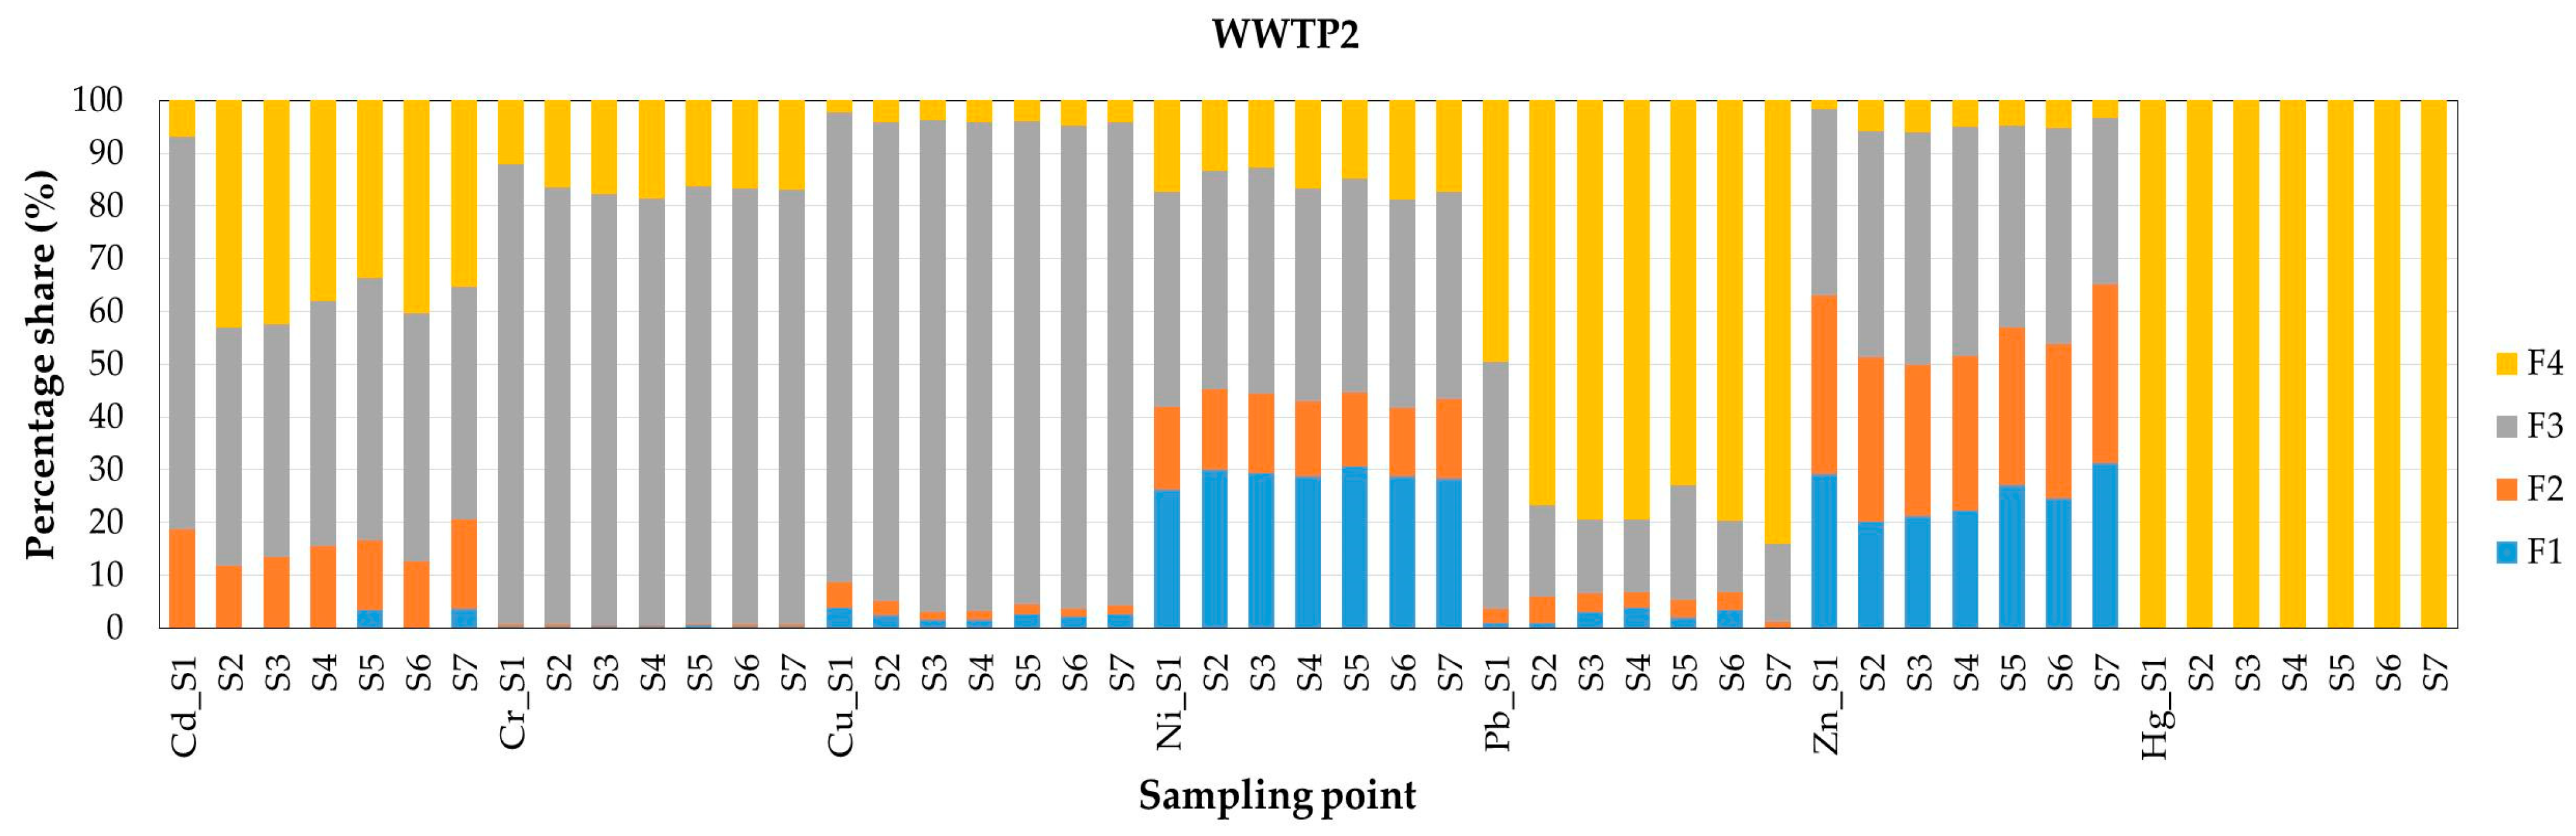
3.5. Chemical Speciation of Heavy Metals

The mean concentrations of heavy metals in sewage sludge at successive stages of its processing are presented in Table 7 and Table 8. The recovery rate (RM) (excluding Hg) ranged from 85% to 133% and 87% to 132%, for WWTP1 and WWTP2, respectively. Similar values of RM were presented by other scientists, i.e., 90–131% [53]; 103–123% [58] and 46–108% [59]. In relation to mercury, lower recoveries were achieved, most probably since each extraction step influences volatilization of this element and its removal from the sludge [34]. A similar tendency was also observed in previous research [3,7,34]. Moreover, the concentrations of selected HMs in different chemical fractions were below the limit of detection for particular elements, i.e., Cd, Pb and Hg (WWTP1), as well as Cd and Hg (WWTP2). Most of the analyzed HMs were mainly bound to the oxidizable (F3) fraction. Heavy metals bound to immobile fractions should not pose a threat in the case of the agricultural use of sewage sludge [2]. However, according to literature data, HMs bounded to organic and sulfide material are supposed to remain in the sludge for longer periods in comparison to the acid soluble/exchangeable and reducible fractions but may also be mobilized by decomposition processes [21,60]. In general, the mean concentrations of HMs in different chemical fractions followed the orders:
Cd: F3 > F2 > F4 > F1 (WWTP1) and F3 > F4 > F2 > F1 (WWTP2)
Cr: F3 > F4 > F2 > F1 (WWTP1 and WWTP2)
Cu: F3 > F4 > F2 > F1 (WWTP1 and WWTP2)
Ni: F3 > F1 > F2 > F4 (WWTP1 and WWTP2)
Pb: F4 > F3 > F2 > F1 (WWTP1 and WWTP2)
Zn: F3 > F2 > F1 > F4 (WWTP1 and WWTP2)
Hg: F4 (WWTP1 and WWTP2)
The obtained results indicate that the percentage share of particular heavy metals in sewage sludge at successive stages of its processing showed some fluctuation (Figure 6 and Figure 7). Cadmium in sludge mainly existed in the oxidizable fraction within the range of 42–81% and 40–70%, for WWTP1 and WWTP2, respectively. However, the percentage share of this element in the mobile fractions (F1 + F2) was also noticeable, i.e., 12–40% (WWTP1) and 12–20% (WWTP2). The main occurring form of Cr, Cu, Ni, Pb and Zn was the same as for cadmium and amounted to 67%; 93%; 51%; 51%; 58% (WWTP1) and to 87%; 93%; 43%; 47%; 44% (WWTP2), respectively. In turn, mercury was found only in the residual fraction, which was reported to be stable and hardly affected by environmental factors (pH, Eh, etc.) [21,61]. However, in the case of Ni and Zn, it was found that they were also strongly bound with acid soluble/exchangeable (F1) and reducible (F2) fractions, which are more readily released into the environment and might pose a threat both for plants and animals, and even for humans, as a result of entering the food chain [2]. The percentage share of these two elements in mobile fractions ranged from 43% to 60% (Ni) and 36% to 61% (Zn), and also from 42% to 45% (Ni) and 50% to 65% (Zn), for SS from the WWTP1 and WWTP2, respectively. The above presented data are in good agreement with those reported in the other scientific papers [1,3,7,10].
The biggest differences between the distribution of selected HMs (Cd, Ni and Zn) in the sum of mobile fractions were noted between the sludge samples at the following points: S1 and S2; S5 and S6; S6 and S7. With regard to SS from WWTP1, the differences amounted to +25%, −16%, +12% (Cd); +17%, −10%, +10% (Ni); +1%, −24%, +18% (Zn), for S1–S2, S5–S6 and S6–S7 sampling points, respectively. In turn, in relation to SS from WWTP2, the differences were: −7%, −4%, +6% (Cd); +3%, −3%, +1% (Ni), −12%, −3%, +11% (Zn), respectively. The differences were more visible in relation to sewage sludge from WWTP1. Similar observations with regard to Zn in digested and dewatered sludge were made by other researchers [52]. Moreover, this tendency was also shown in the authors’ previous study [3,7]. According to literature data, HMs in SS can be released mainly due to changes in pH, Eh, dissolved oxygen content and OM content [62]. Taking into account that the activated sludge process is conducted in aerated reactors, the dissolved oxygen underwent changes. Moreover, simultaneously, an increase of the pH and Eh values in excess sludge was observed. It is possible that these parameters have significantly affected the distribution of HMs fractions in excess sludge. However, this was observed only in excess sludge from WWTP1. In general, the changes in species distribution of HMs in WWTP2 were less noticeable than in WWTP1. As was previously mentioned, the second biggest difference in relation to the content of HMs in mobile fractions was noted between the mixed (S5) and digested sludge (S6) samples. Considering that during stabilization, the organic matter underwent reduction, as a result of decomposition by microorganisms conducting the process [62], automatically, heavy metals that were bound to organic matter are released, which results in an increase in the share of HMs in the non-mobile fraction (F3) in relation to the mobile ones (F1 + F2). In turn, it is difficult to explain why, after dewatering, the concentrations of HMs in mobile forms rose again. So far, the authors of this paper and other scientists have not observed this trend in their research [3,52] or noted it but to a lesser extend [7]. It may possibly related to changes in pH and Eh values. In addition, in the dewatering process, polyelectrolytes can also be added, which can also cause an increase in the share of heavy metals in mobile forms. The possible mechanisms of the influences of the dewatering process on the distribution of acid soluble/exchangeable and reducible fractions of heavy metals in sewage sludge will be studied in the future.
Given the fact that in both WWTPs conducting ultrasonic disintegration of thickened excess sludge, the impact of this process on the distribution of HMs in chemical forms (especially in mobile ones) of SS was also investigated (Table 7 and Table 8). The obtained results indicated that there was no direct effect of the disintegration on the increase in concentrations of particular heavy metals in mobile forms (F1 + F2). Moreover, the UD also did not change the way that HMs bind in sewage sludge. The HMs concentrations in mobile forms of SS before and after UD were at the comparable level (Figure 6 and Figure 7).
Pearson’s correlation coefficient was calculated to assess the strength of the correlations between the basic physicochemical parameters of sewage sludge (in the processing line of the studied WWTPs) and the concentrations of chemical forms of the HMs (Table 9). The results of a statistical analysis indicated that some of the parameters of sewage sludge correlated with the concentrations of individual heavy metals in certain chemical fractions, i.e., pH values correlated significantly with the concentrations of Cr and Ni (WWTP1), and Ni (WWTP2) in the fractions F1, F2 and F3 (WWTP2), and also Cr and Pb (WWTP2) in the fraction F4. There were also strong or moderate correlations in relation to other HMs but they were statistically insignificant. However, it is well-known that pH is one of the key parameters (factors) that affect the HMs distribution [62,63]. A strong, statistically significant correlation existed between Eh and the content of Cr and Cd (WWTP1) in the fractions F1 and F3, respectively, as well as of Pb (WWTP2) in the fraction F1. Another parameter which correlated with HMs is the dry matter content. The DM content in the sludge samples from WWTP2 correlated with the content of Zn in the fraction F1, and with the content of almost all of the analyzed HMs (except Cu) in the fraction F2. For comparison, this tendency was not observed in relation to sewage sludge from WWTP1. Also, the authors’ previous research did not show such a relationship [3,7]. In turn, the organic matter content in sewage sludge from WWTP2 correlated strongly with the content of Zn in the fraction F1, and with all analyzed HMs (except Cu) in the fraction F2. Similar observations in relation to Cr, Cu and Pb in the sum of mobile fractions [52], as well as to Pb and Zn in the fraction F2 [53] were made by other scientists. As in the case of DM content, this tendency was not observed in the case of sludge samples from WWTP1. A strong, negative and statistically significant correlation existed between TOC and the content of all HMs in sludge from WWTP1, as well as Cd, Cr, Cu and Zn in sludge from WWTP2, in the fraction F4. Moreover, a similar tendency was observed in relation to HMs in the fraction F3, however, in this case only a few correlations were statistically significant. The results of statistical analysis confirmed that the content of organic substances (OM and TOC) and pH values are the key parameters that affected the distribution of heavy metals in sewage sludge. However, it should be noted that changes in the content of heavy metals in the individual chemical fractions, in sewage sludge is associated with the processes used in WWTPs. As a result of these processes, the physicochemical parameters of sewage sludge undergo changes, which have a direct impact on the distribution of heavy metals in individual chemical fractions.

3.6. Assessment of Potential Ecological Risk of Heavy Metals

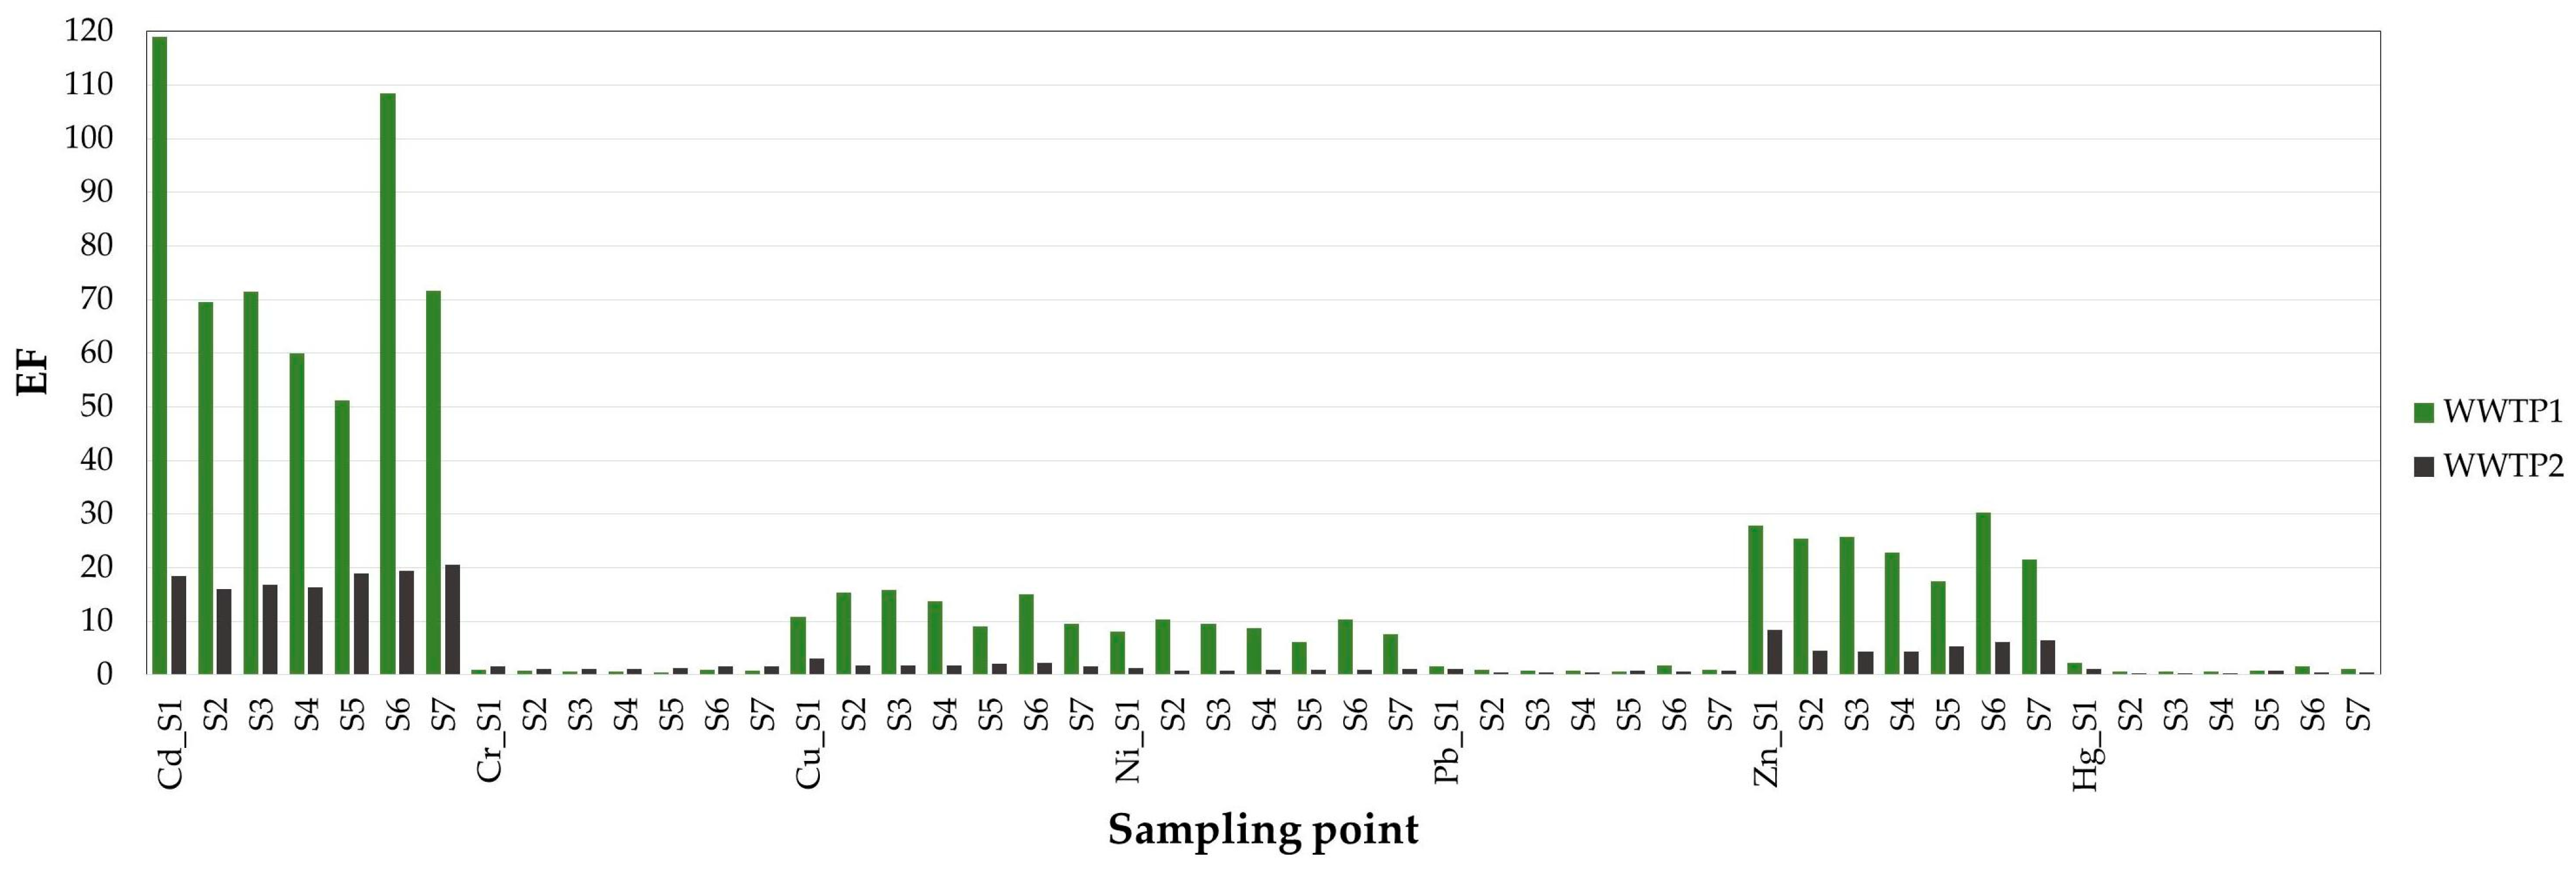
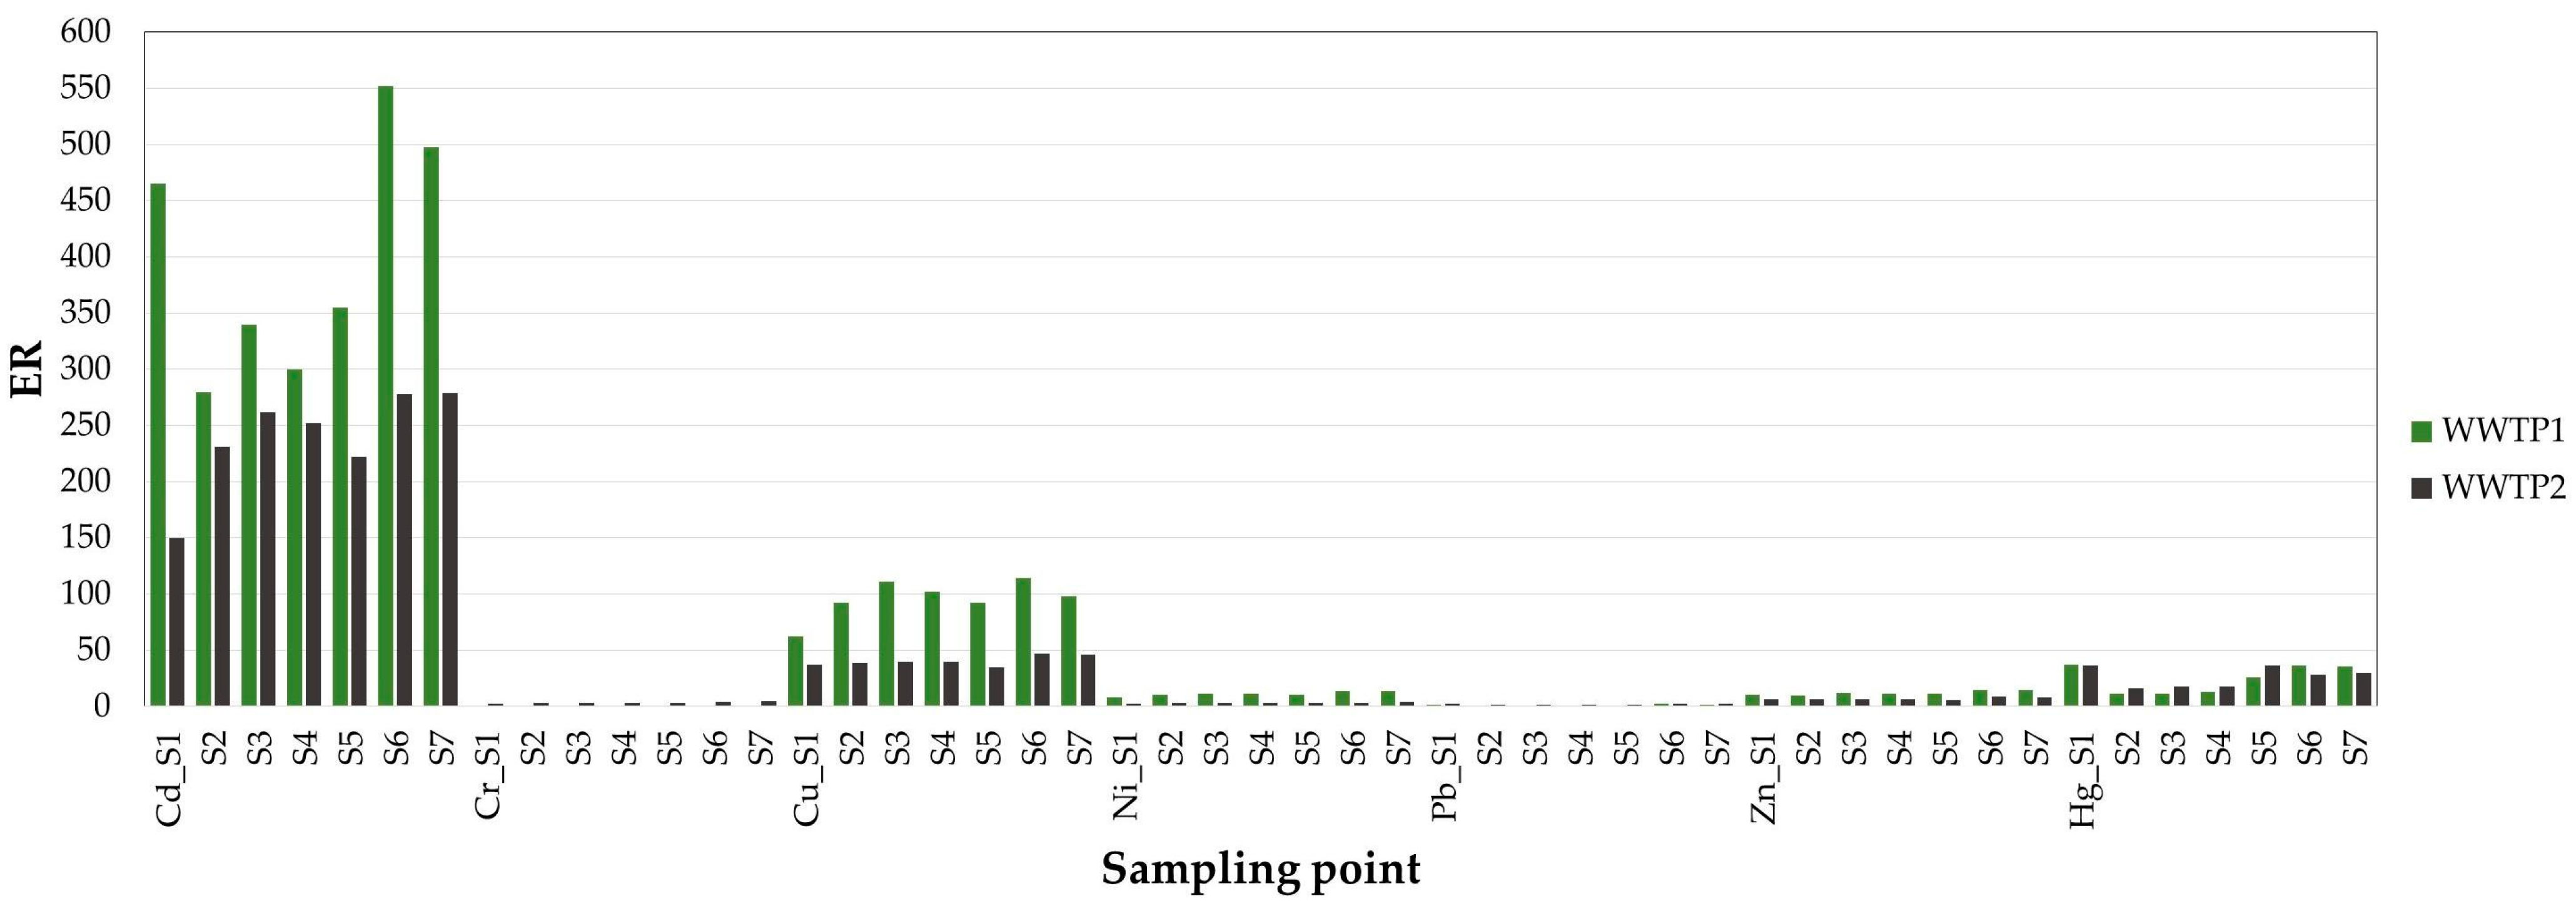
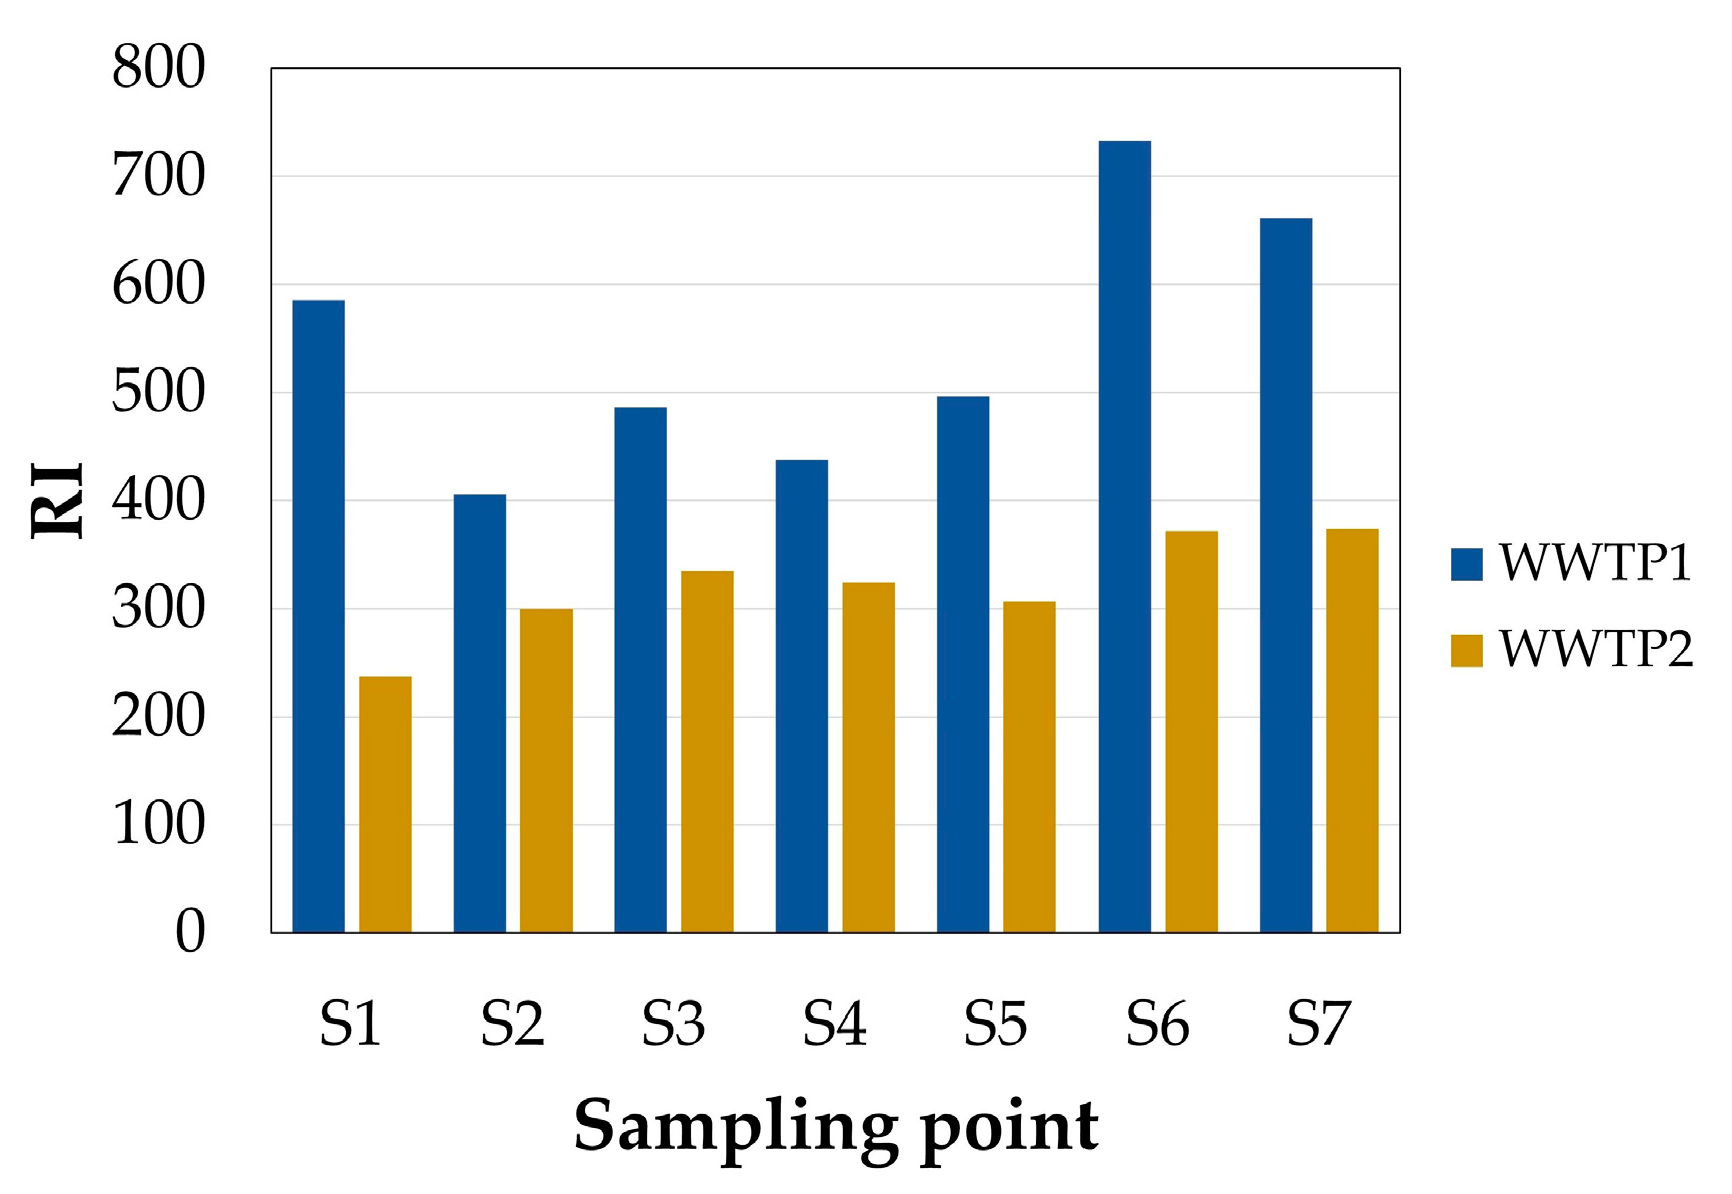
3.6.1. Assessment of Potential Ecological Risk Using Total Content Indices

The values of enrichment factor (EF) for analyzed heavy metals are shown in Figure 8. The EF according to Sakan et al. (2009) [36] was calculated to evaluate the possible impact of anthropogenic activity [9]. Fe was selected as a reference element for geochemical normalization. The EF values for HMs undergo fluctuation at successive stages of sludge processing. The highest values of this index were indicated with regard to Cd and Zn, and to a lesser extent to Cu and Ni. EF values for Cd and Zn were in the following ranges: 51.3–119.0; 17.4–30.2 (WWTP1) and 16.1–20.6; 4.3–8.5 (WWTP2), respectively. With regard to Cu and Ni, only in the SS from WWTP1, the severe enrichment was indicated with these metals. For other HMs, the EF values were lower than 5 which indicate a moderate enrichment. The conducted analysis revealed that if the dewatered sewage sludge from the two analyzed WWTPs is used as a fertilizer, this may result in soil enrichment mainly with Cd and Zn, and to a much lesser extent with Cu and Ni. This is associated with a potential risk related to the possibility of secondary contamination of the water and soil environment with these elements. Similar observations in relation to Cd and Zn were reported by other researchers who analyzed sludge samples from industrial and non-industrial cities in Haryana located along the Western Yamuna Canal (China). Moreover, they also indicated that EFs for Ni and Cr were found to be extremely severe for sewage sludge from selected WWTPs, while for Mn there was minor or no enrichment [64].
The potential ecological risk index (ER) was calculated based on Hakanson’s (1980) [39] to assess the toxicity risk associated with the analyzed HMs. It is a monomial, potential ecological risk coefficient of the individual heavy metal [65]. The values of ER are presented in Figure 9. The obtained results indicated that for both WWTPs, the highest potential ecological risk was indicated with regard to Cd and Cu. Cadmium posed a considerable to very high risk (ER = 279.9–551.5 for WWTP1; and ER = 149.5–278.8 for WWTP2), while copper a low to considerable risk (ER = 62.7–114.0 for WWTP1; and ER = 35.2–46.9 for WWTP2). ER values for other HMs were below 40, which mean that they pose a low risk. The average ER values of heavy metals were in the decreasing order of Cd > Cu > Hg > Zn > Ni > Pb > Cr and Cd > Cu > Hg > Zn > Ni > Cr > Pb, for SS from WWTP1 and WWTP2, respectively. The obtained results are in good agreement with those obtained by other researchers who conducted the study in four municipal WWTPs, and indicated that Cd posed the highest potential ecological risk (ER = 145.04), while Cr the lowest (ER = 0.66) [2]. A similar trend was observed by Yakamercan and Aygün (2021) [9].
In this study, the risk index (RI) was calculated based on Hakanson’s (1980) [39] approach. RI, just like the ER, considers the accumulation, toxicity, and environmental behavior of heavy metals, but, above all, presents the overall potential ecological risk and sensitivity associated with all of the analyzed elements [65]. The values of RI for HMs are shown in Figure 10. The calculations made revealed that RI values for HMs undergo fluctuations during successive stages of sludge processing. The average RI values of all of the HMs in sludge samples at different sampling points were in the decreasing order of S6 > S7 > S1 > S5 > S3 > S4 > S2 and S7 > S6 > S3 > S4 > S5 > S2 > S1, for WWTP1 and WWTP2, respectively. The highest RI values were noted in the digested (S6) and dewatered (S7) sludge samples, i.e., RI = 733.2 and RI = 661.1 (WWTP1), as well as RI = 371.7 and RI = 374.0 (WWTP2), respectively. In general, HMs in SS posed a considerable to high risk (RI = 405.6–733.2), and also from a moderate to considerable risk (RI = 237.3–374.0), for WWTP1 and WWTP2, respectively. Similar observations were also reported by other researchers who revealed that RI values for all of the analyzed elements (As, Cd, Cr, Cu, Pb, Zn, and Hg) in sludge samples collected from different WWTPs (central Shanxi Province, China) ranged from 244.77 to 1438.39 [65]. In turn, other scientists indicated that the values of RI for sludge samples collected from eight WWTPs (southeastern Anhui Province, China) ranged from 25.91 to 790.01, thus, posed a low to high ecological risk [54].
In order to compare the level of potential ecological risk of individual heavy metal in sewage sludge at the beginning and at the end of the WWTP process, the authors proposed a new index, i.e., the ecological risk of total metal (ERTOT). The obtained results indicated that HMs posed from moderate to high risk (Figure 11). The values of ERTOT ranged from 1.1 to 1.7, and from 0.8 to 1.9, for HMs from WWTP1 and WWTP2, respectively. All of the analyzed heavy metals, except Hg in SS samples at WWTP2, reached ERTOT above 1. The highest values were obtained for Ni and Cu (WWTP1), as well as for Cd, Cr and Ni (WWTP2). The values of ERTOT for the above-mentioned metals were higher than 1.5, which means that these elements may pose a considerable risk. Moreover, the obtained results confirmed that the concentrations of HMs in the whole processing line undergo changes, which may increase or reduce the level of a potential ecological risk. It was also indicated that the content of heavy metals in sewage sludge and the levels of potential ecological risk that they pose depends, to a large extent, on the characteristics of wastewater entering a given WWTP.

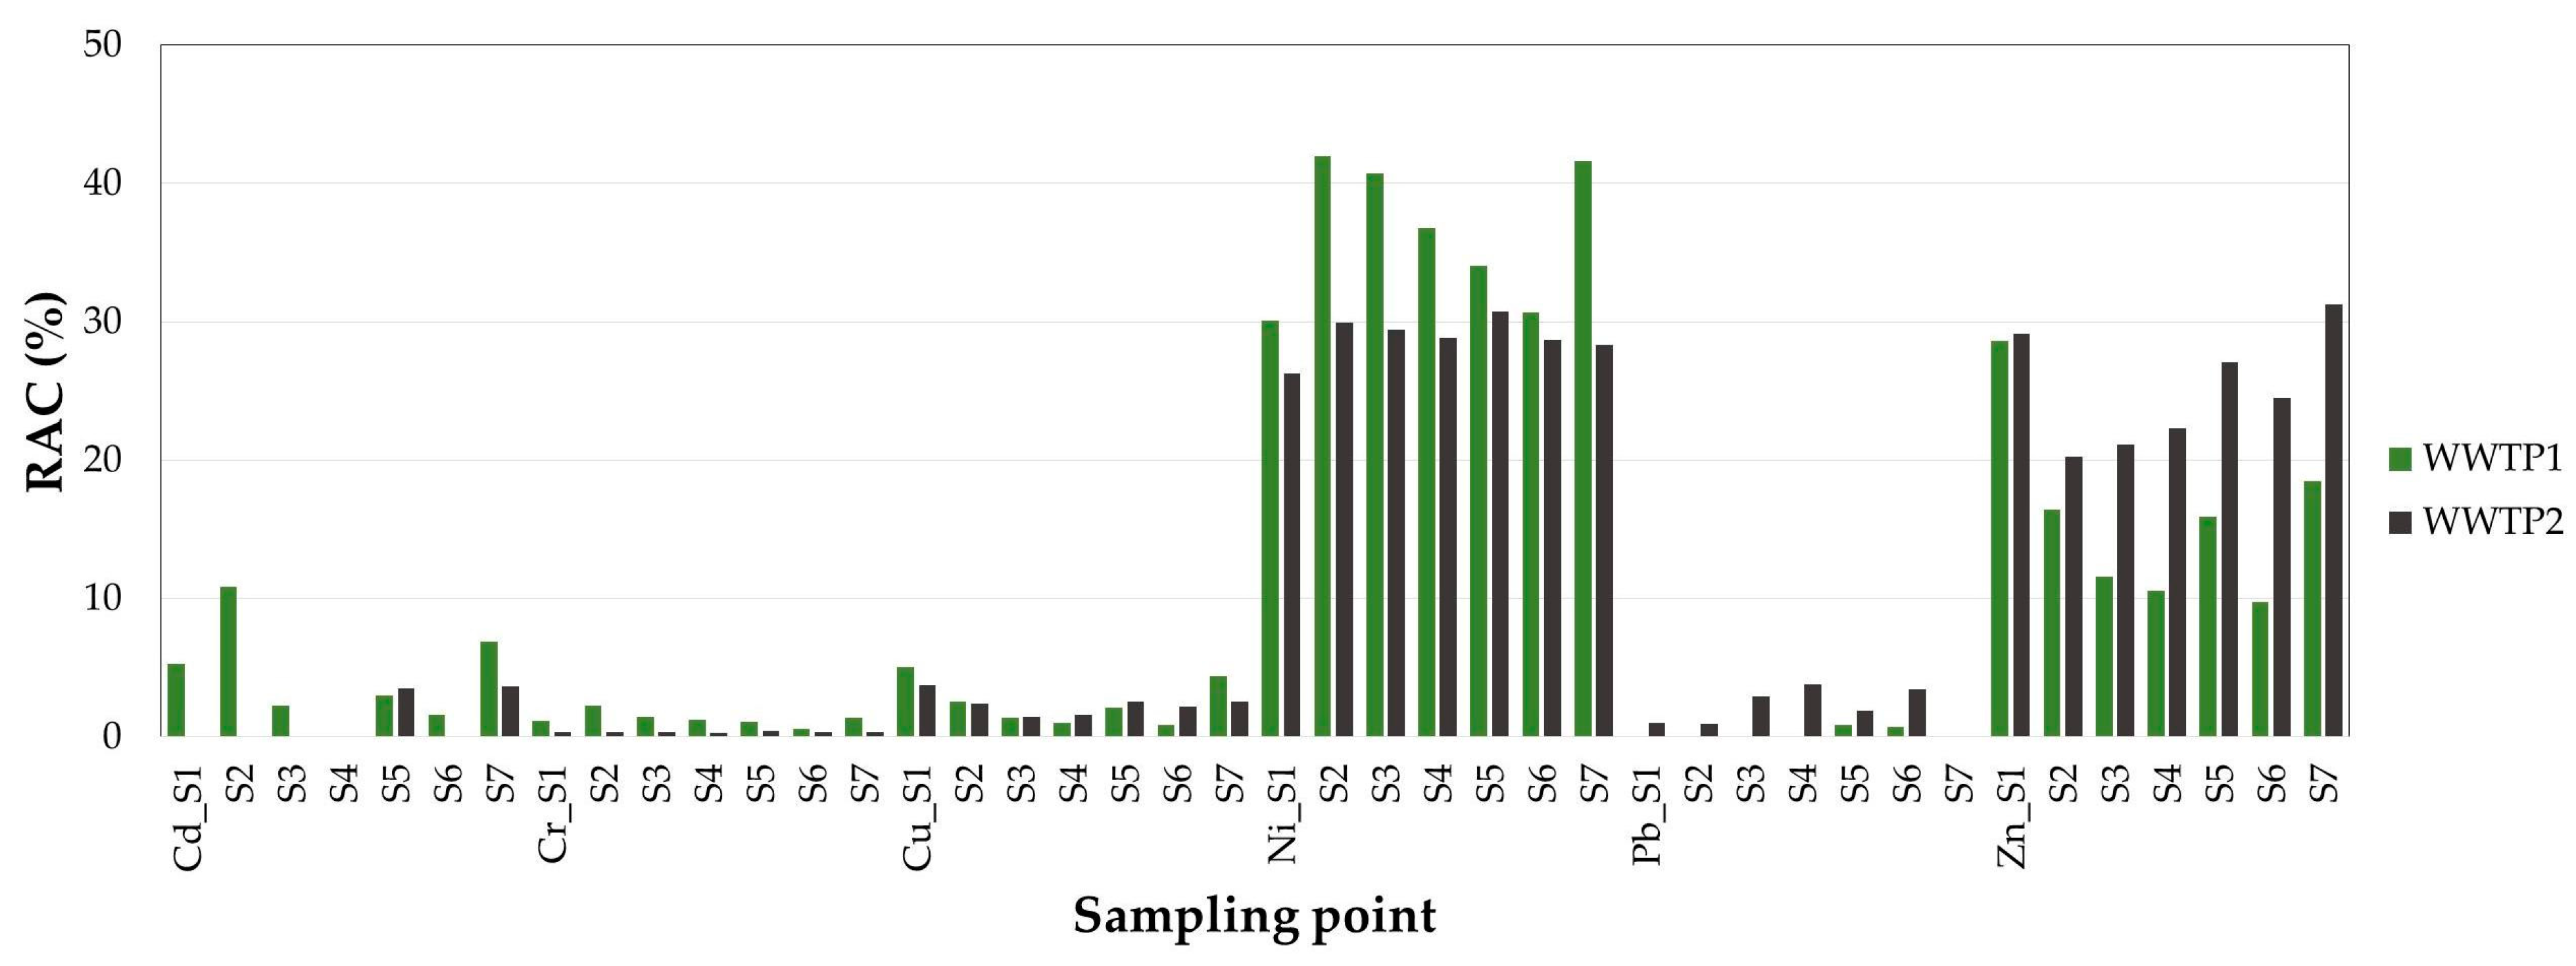
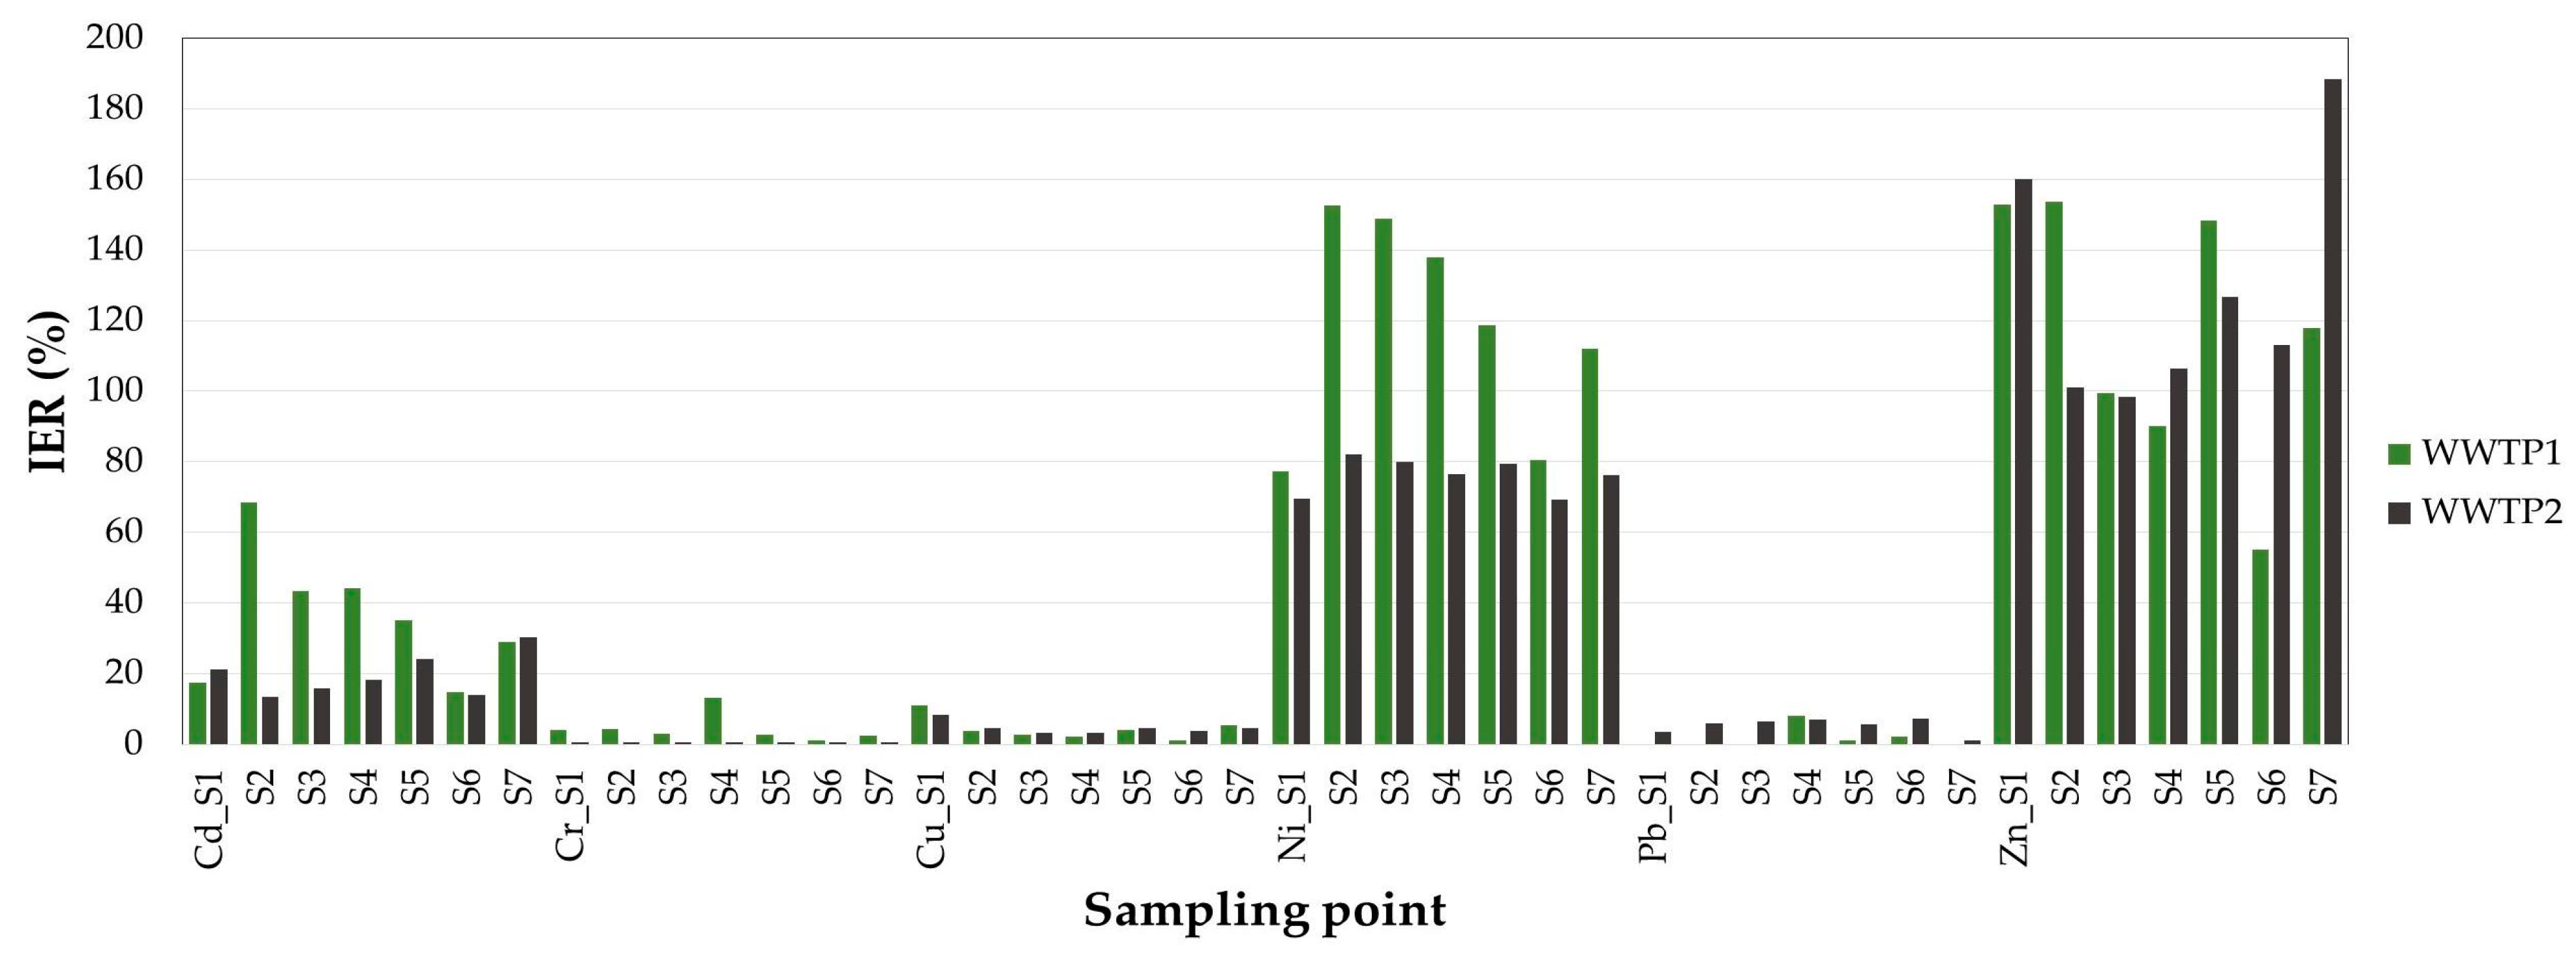
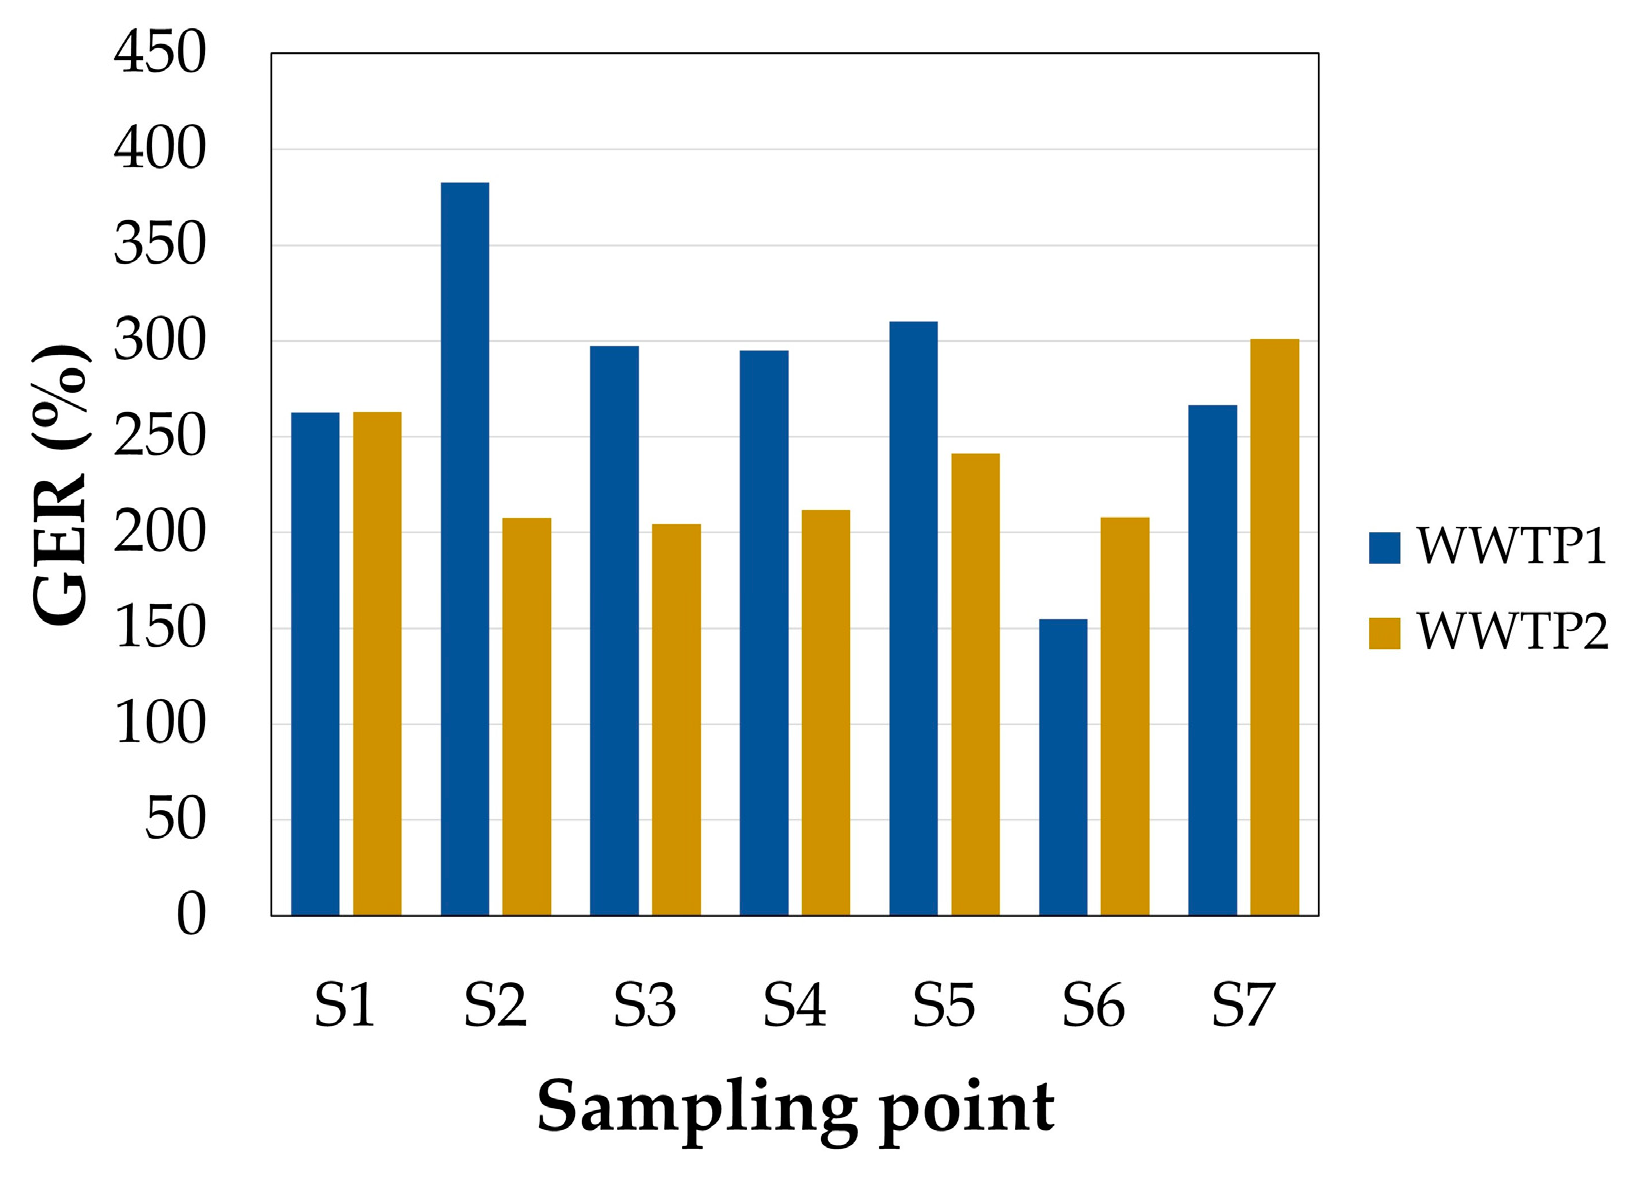
3.6.2. Assessment of Potential Ecological Risk Using Speciation Indices

The risk assessment code (RAC) introduced by Perin et al. (1985) [40], is a quantitative method for determining the mobility and bioavailability of heavy metals. This index includes the content of individual heavy metals in acid soluble/exchangeable fraction (F1), which is the most mobile fraction. The values of RAC for HMs analyzed in this study are shown in Figure 12. The obtained results revealed that the highest values of RAC were present with regard to Ni and Zn, i.e., RAC = 30.1–42.0% (Ni) and RAC = 9.8–28.6% (Zn), and also RAC = 26.3–30.0% (Ni) and RAC = 20.2–31.3% (Zn), for sludge samples from WWTP1 and WWTP2, respectively. This means that Ni and Zn posed low to high risk. The obtained results are in good agreement with the author’s previous research [3]. Contrary to our study, scientists from Poland indicated that the highest percentage share in the fraction F1 was reported for Cd (RAC = 25%), but it did not reach the high-risk level [10]. In turn, other researchers from China found that, the average values of RAC of seven heavy metals in sludge from different WWTPs are As (26.38%) > Ni (17.42%) > Zn (14.42%) > Pb (14.14%) > Cd (13.28%) > Cu (11.18%) > Cr (1.99%) [2].
The individual ecological risk (IER) and global ecological risk (GER) indices were presented in the author’s previous study [34]. IER is an alternative to the RAC index. This is due to the fact that RAC includes only the content of individual heavy metal in the first mobile fraction, while IER considers both mobile fractions and compares them to the content of HM in immobile ones. In turn, GER is the sum of IER, and relates to all of the analyzed HMs. The values of IER for analyzed HMs are shown in Figure 13, while GER is presented in Figure 14. The highest values of IER were reported regarding Zn, Ni and Cd, i.e., IER = 55.0–153.6%; IER = 77.3–152.6%; IER = 14.8–68.5% (WWTP1), and IER = 98.5–188.3%; IER = 69.4–82.0%; IER = 13.3–30.3% (WWTP2), respectively. In conclusion, according to IER values Zn and Ni may pose moderate to high risk, while Cd low to high risk. However, the values of IER for Cd in SS samples from WWTP2 did not reach high risk levels. Similar results were obtained in the author’s previous research, where Zn, Cd and Ni in the dewatered sludge from five WWTPs in Poland (Upper-Silesian region) posed high to very high (Zn and Cd) and moderate to high risks (Ni) [34].
The average GER values of all of the HMs varied in the range of 154.9–382.7% and 204.4–301.0% for SS samples from WWTP1 and WWTP2, respectively (Figure 14). The obtained results indicated that analyzed HMs posed from moderate to high risk. However, if we look at these results more closely, we can see that the levels of ecological risk at the beginning (S1) and the final stage (S7) are comparable. Similar outcomes were presented in another author’s work, where GER values for the same HMs ranged from 438.1% to 723.7% [34].
As in the case of total indices, we also proposed another authors’ index named ecological risk of metal mobile forms (ERMF). The new index includes the concentration of individual heavy metal in the sum of two mobile forms (F1 + F2), in the sludge samples collected at the beginning and the final stage of the processing line. This is crucial in the assessment of potential ecological risk, in the view of the whole WWTP processing line. The obtained results are presented in Figure 15. The values of ERMF ranged from 0.8 to 2, and 0.3 to 2, for HMs from WWTP1 and WWTP2, respectively. The highest values of the discussed index were noted for Ni and in the less extent for Cd (WWTP1), and also for Cd, Cr and Ni (WWTP2). In both cases, the content of the above mentioned elements in mobile fractions may pose a considerable risk. The obtained results indicate that the content of individual HM in the mobile fractions undergo changes in the processes used in WWTPs, which can have an impact on the level of the potential ecological risk posed by these elements.
In conclusion, according to values obtained for speciation indices, an increase in the mobility of HMs in sewage sludge, in successive stages of its processing, may cause an increase in the level of potential ecological risk that these elements pose to the environment, plants and living organisms. It was confirmed that chemical forms in which heavy metals occur in sewage sludge determine the level of potential ecological risk more precisely than their total concentrations. Therefore, the content of HMs in the mobile fractions should be monitored, as is the case with the total metal content.

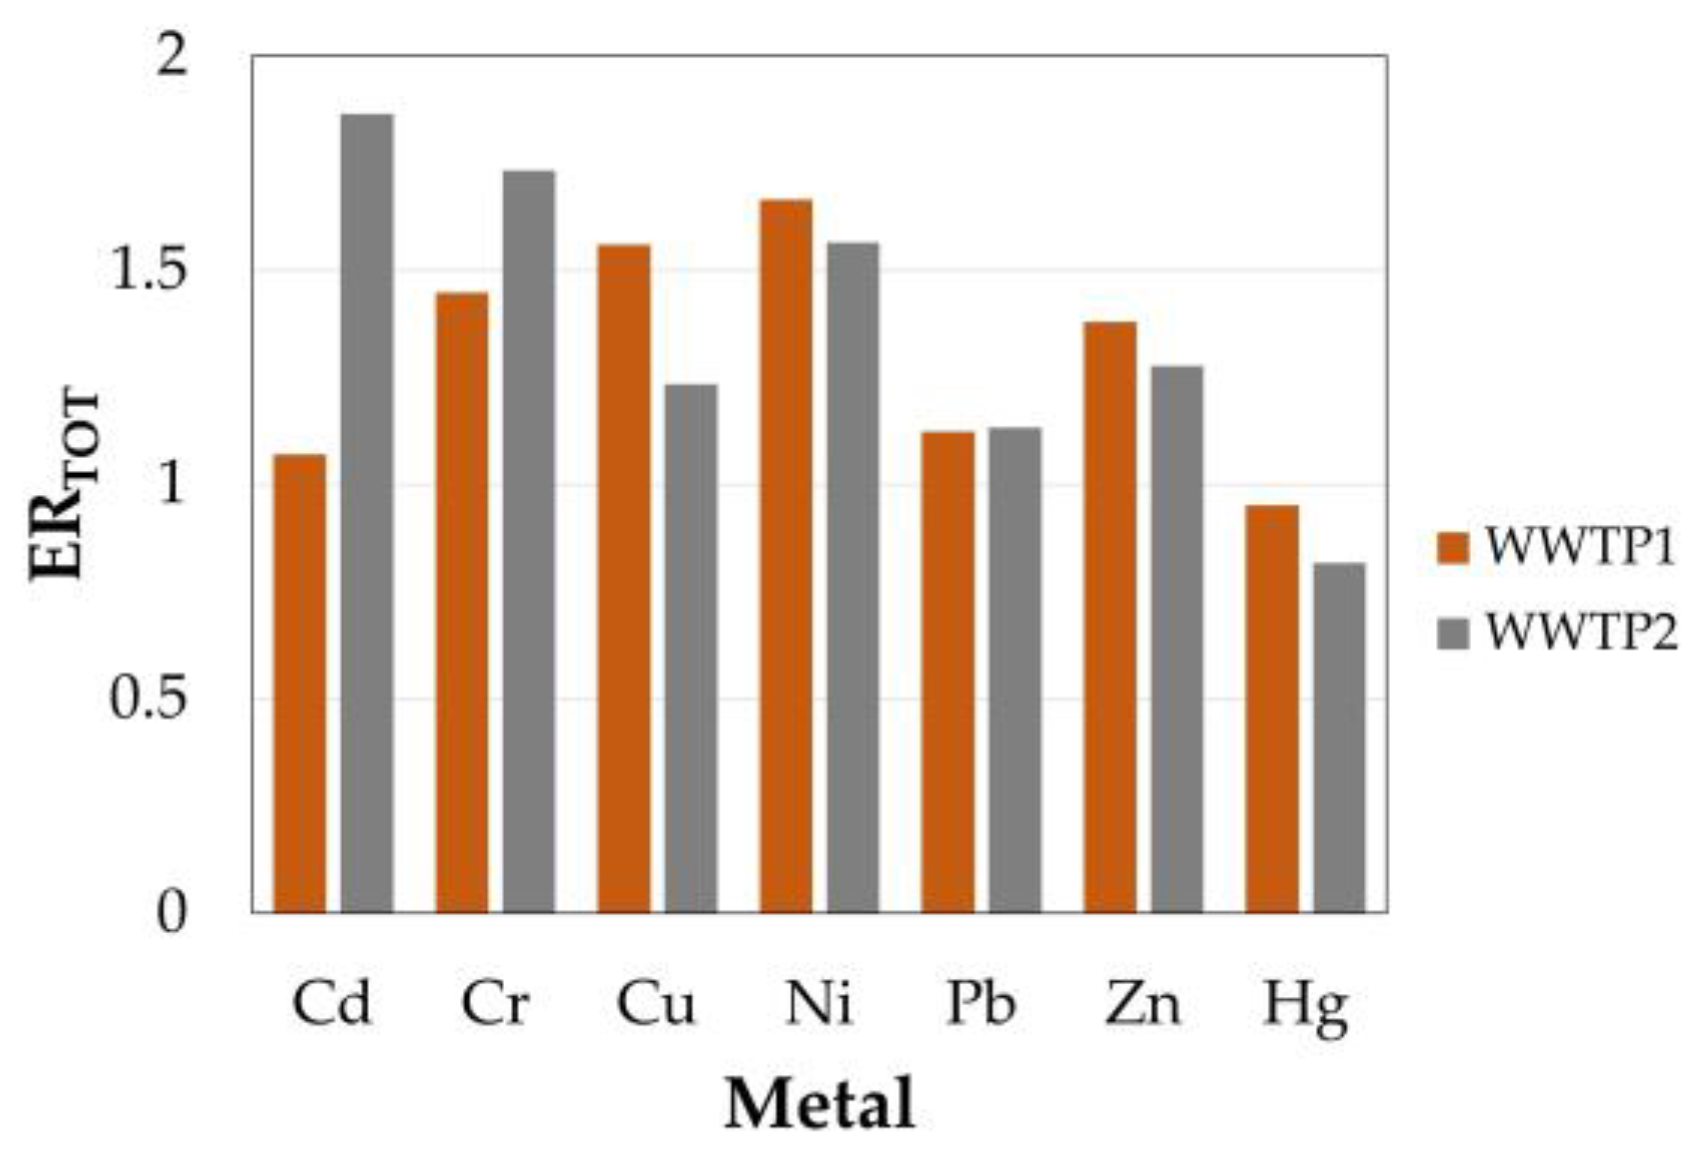
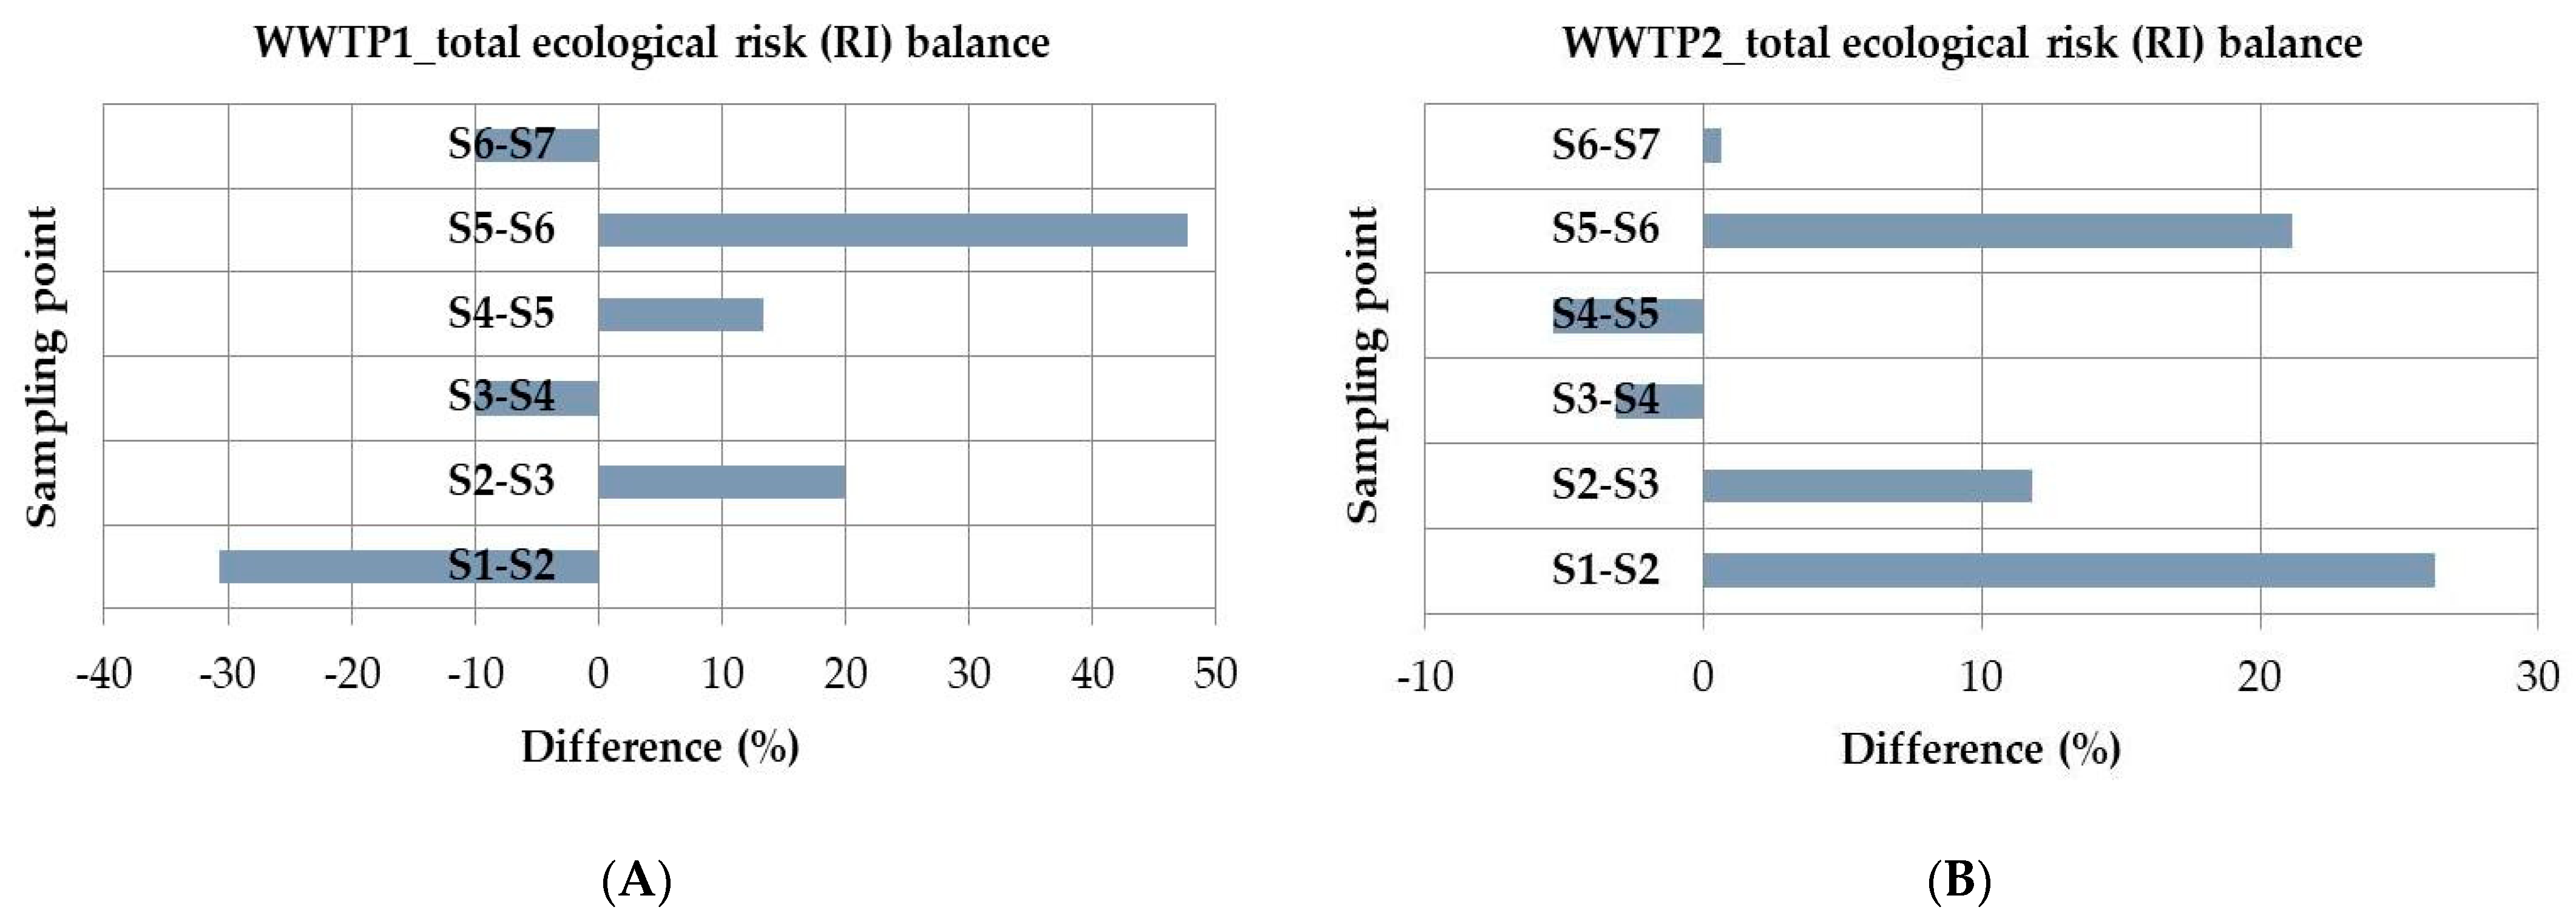
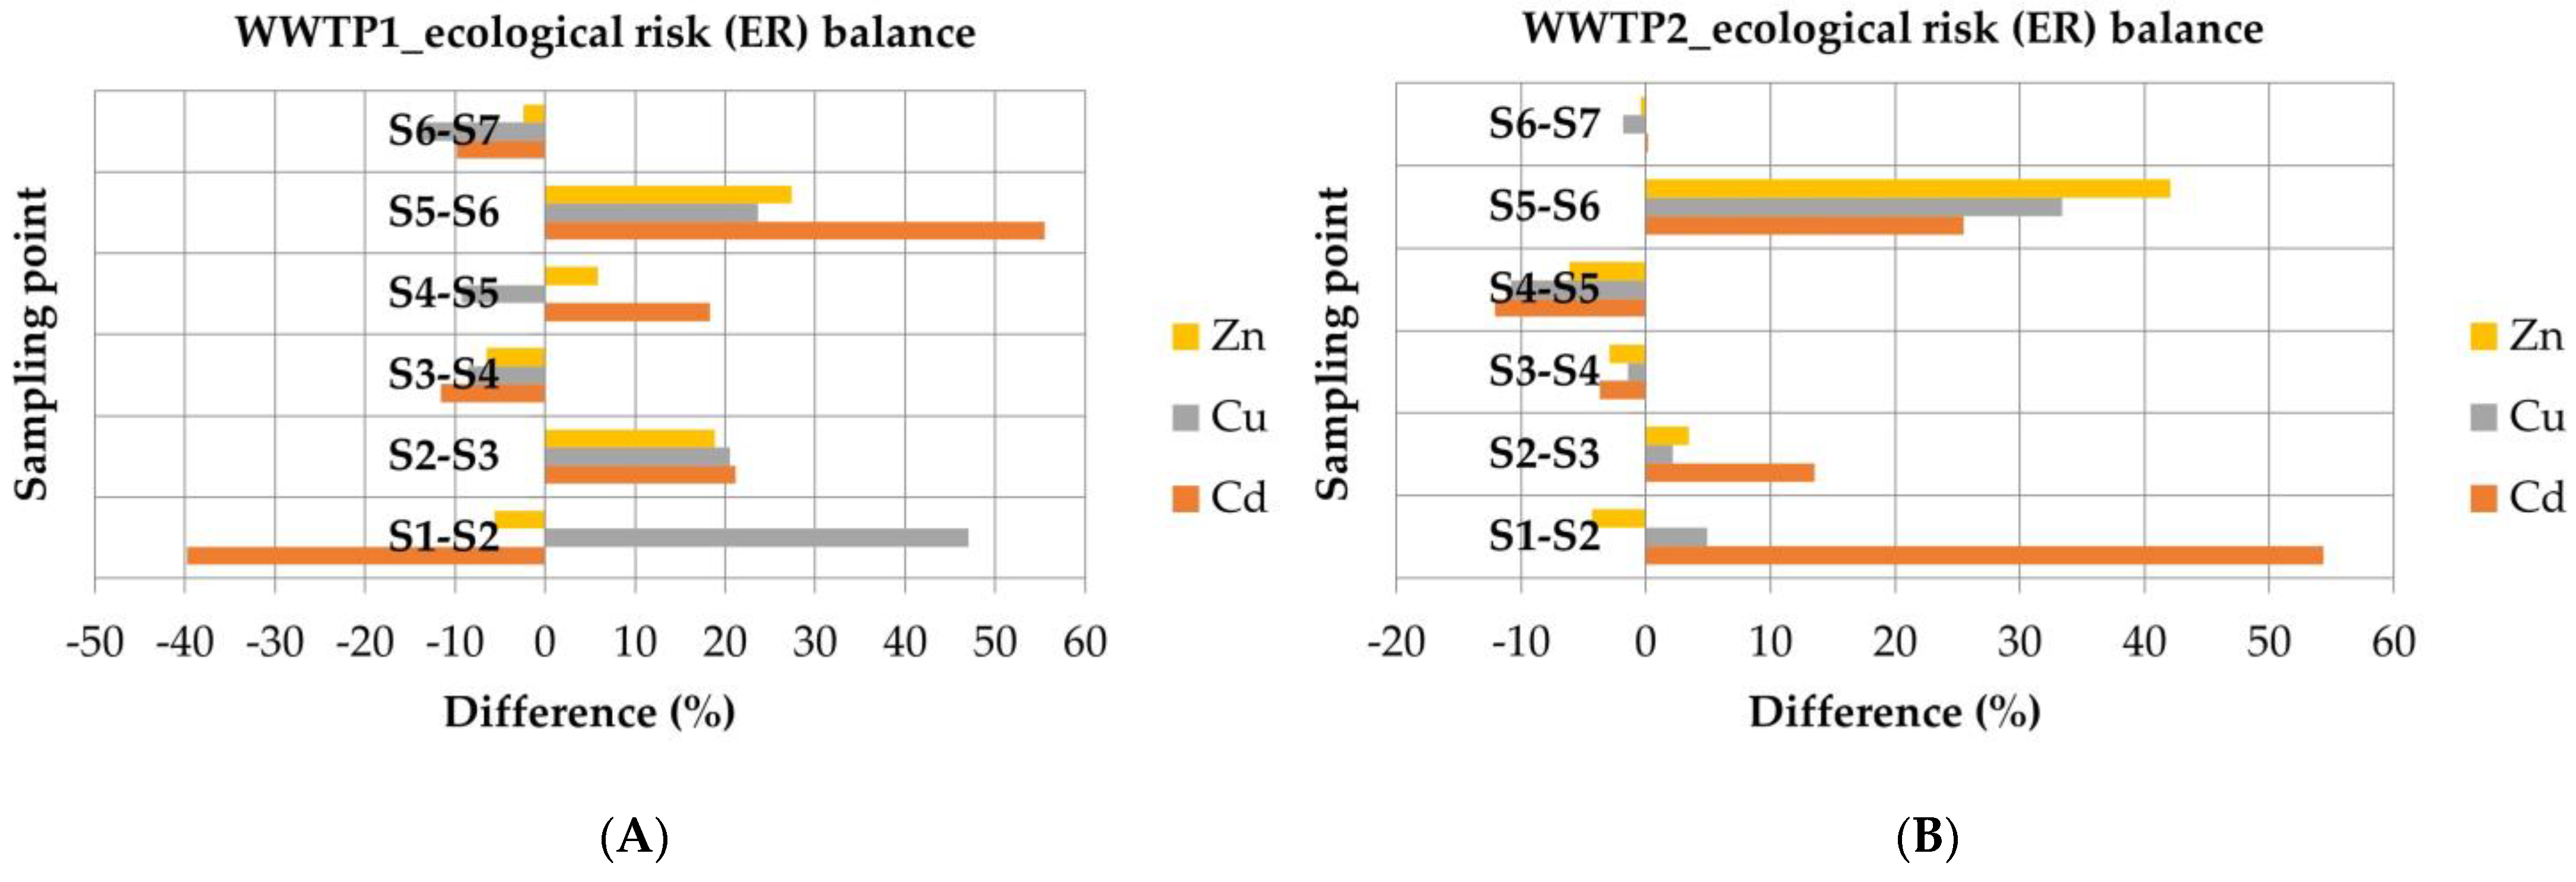
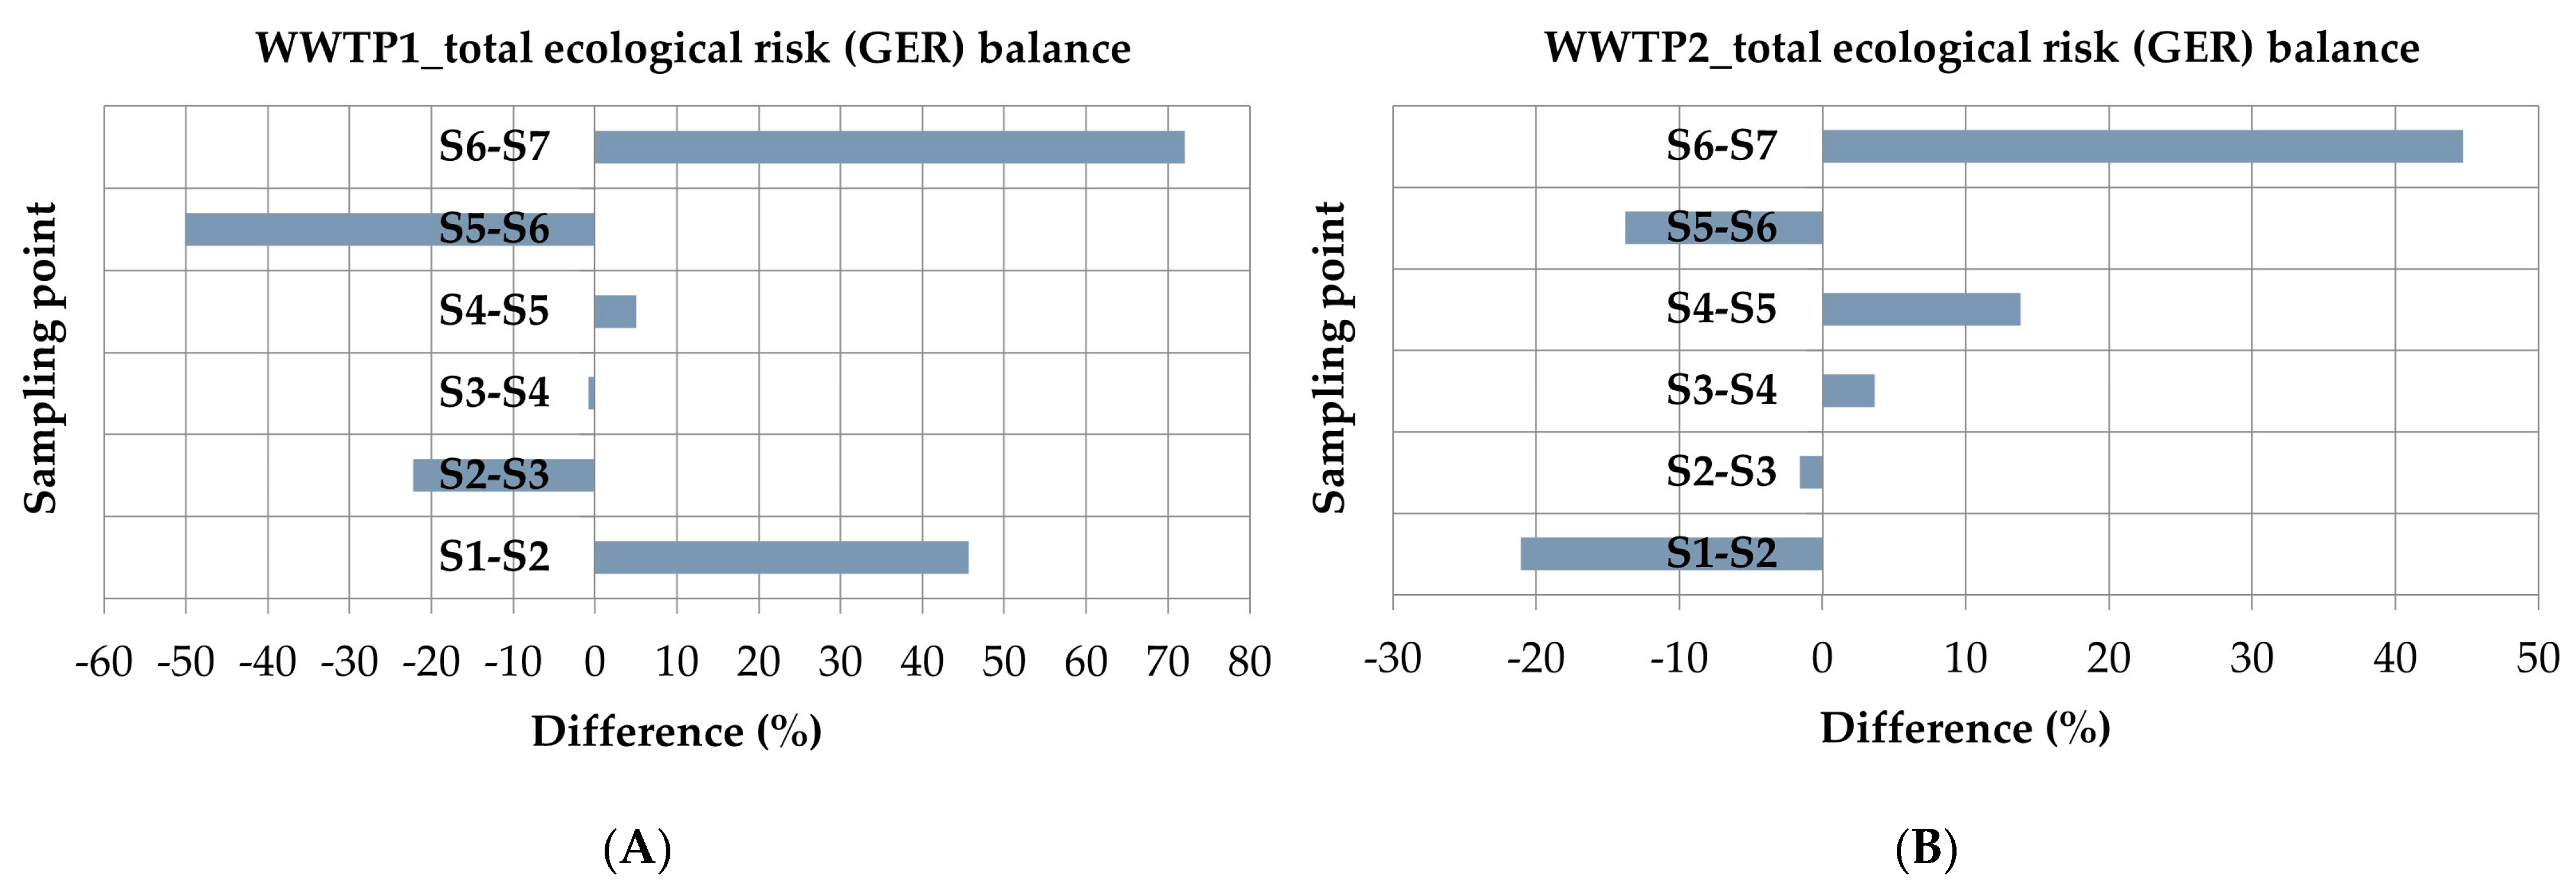
3.7. Potential Ecological Risk Balance

The preparation of a simple balance sheet of the potential ecological risk requires a choice of the most relevant risk indices. In our opinion, the most suitable for this purpose are RI and ER (Figure 16A,B and Figure 17A,B), as well as GER and IER (Figure 18A,B and Figure 19A,B). The balance sheets based on concentration of an individual heavy metal or its chemical forms in different sewage sludge samples were prepared only for elements that pose the highest potential ecological risk.
The obtained results indicate that according to simple balance sheets created based on RI values (Figure 16A,B), in both WWTPs, the biggest differences in the levels of potential ecological risk posed by the sum of the total concentrations of the analyzed HMs occur between the sampling points S5 and S6 (47.7%—WWTP1 and 21.2%—WWTP2), as well as S1 and S2 ((−30.7%)—WWTP1; 26.3%—WWTP2). Moreover, in the case of points S1–S2, the RI value in WWTP1 decreased, while in WWTP2 increased. It can also be seen that there are considerable differences between sampling points S2 and S3 (19.9%—WWTP1; 11.8%—WWTP2), especially in the case of the WWTP1, which means that the process of sludge thickening could affect the characteristics of sludge, and at the same time also the level of ecological risk posed by the analyzed HMs. The above presented data partly correspond with the results obtained from the HMs balance sheets (Figure 5A,B), where the biggest difference between the sum of the HMs content were reported between sampling points S5 and S6. In turn, there was no relationship between the changes in the level of potential risk at sampling points S1 and S2, and the sum of the total HMs content at these two points. These incompatibilities may result from the fact that the RI index includes the toxicity of analyzed HMs, which affects the level of potential ecological risk.
The balance sheets of potential ecological risk based on the ER values were prepared for Zn, Cu and Cd (Figure 17A,B). The Zn was included due to the high enrichment of analyzed sludge samples with this element. On the other hand, we omitted Ni and Cr, as only one index indicated their significant share in the ecological risk assessment. The balance sheets for selected HMs in sludge samples from the two WWTPs shows that the biggest differences in the levels of potential ecological risk for individual HM occurs between the sampling points S5–S6, S1–S2 and S2–S3; i.e., for Zn—S5S6 and S2–S3; Cd—S5–S6, S1–S2, S2–S3; Cu—S1–S2, S5–S6, S2–S3, as well as Zn—S5–S6; Cd—S1–S2 and S5–S6; Cu—S5–S6, for WWTP1 and WWTP2, respectively. The obtained results are in good agreement with the conclusion made based on the balance sheets with regard to the RI index. In relation to some of the considered HMs, the level of risk posed by these elements has been reduced compared to those at the previous sampling point. This may indicate a positive impact of the use of individual treatment processes on changes in the characteristics of sludge, which may reduce the potential ecological risk associated with the presence of heavy metals.
The simple balance sheets created based on the values of the speciation index, i.e., GER, show that the biggest differences in the levels of potential ecological risk posed by all of the analyzed HMs occur between the sampling points S6 and S7 (72.1%), S5 and S6 (−50.1%), S1–S2 (45.6%), and also between S6–S7 (44.8%), S1–S2 (−21.1%), S4–S5 and S5–S6 (+/−13.8%), for WWTP1 and WWTP2, respectively (Figure 18A,B). GER does not include the toxicity of individual HM, but only the ratio of its content in mobile forms to immobile forms. The obtained results clearly indicate that processes applied in the WWTPs may cause the changes in the content of HMs in mobile forms. Some of them, like anaerobic digestion or activated sludge process, have a positive impact on the reduction of the level of potential ecological risk posed by heavy metals.
The balance sheets based on IER values were prepared in relation to the presence of Cd, Ni and Zn in the sludge samples (Figure 19A,B). The biggest differences in the levels of potential ecological risk for individual elements were noted between the sampling points S1–S2, S6–S7 and S5–S6; i.e., Cd—S1–S2 and S6–S7; Ni—S1–S2 and S6–S7; Zn—S6–S7, as well as Cd—S6–S7, S5–S6, S1–S2; Ni—S1–S2; Zn—S6–S7 and S1–S2, for WWTP1 and WWTP2, respectively. A similar tendency was presented in the balance sheets created based on GER values. Once again, we observed that certain processes used in WWTPs may increase the level of potential ecological risk of individual heavy metals and some of them reduce the risk, i.e., the activated sludge process and dehydration (increase the level of risk) and anaerobic digestion (decreases the level of risk). Moreover, some processes both increase and decrease the level of potential risk associated with individual metals, like the activated sludge process.

4. Conclusions

The main aim of this study was to conduct the first comprehensive analysis of the potential ecological risk of seven heavy metals in sewage sludge collected from the processing line of two WWTPs conducting non-conventional process, i.e., ultrasonic disintegration of thickened excess sludge aimed at improving the effects of anaerobic digestion.
It was indicated that the concentrations of HMs in SS samples were ordered by their mean concentrations as Zn > Cu > Ni > Cr > Pb > Cd > Hg and Zn > Cr > Cu > Ni > Pb > Cd > Hg for WWTP1 and WWTP2, respectively. All of the elements were within the standard limits. The highest concentrations of heavy metals were noted in digested (S6) and dewatered (S7) sludge samples. It is very likely that the key factors for the changes in the total concentrations of HMs in sewage sludge were the DM content and their ability to adsorb on the surface of sludge flocs. The above mentioned findings were confirmed by the simple balance sheets of HMs created for both of the analyzed WWTPs.
The results of the sequential extraction indicate that most of the analyzed HMs, including Cd, Cr, Cu, Ni, Pb and Zn, were mainly bound to the oxidizable (F3) fraction, while Hg was bound to the residual (F4) one. Despite this, the values of speciation indices indicated that Ni, Zn, Cd, and in some cases Cr, posed the greatest ecological threat. In turn, analysis conducted according to total indices revealed that the highest risk was posed by Cd, Cu and Zn and to a less extent by Ni and Cr. The statistical analysis revealed that the key factors that may influence the way heavy metals bind in sewage sludge are pH, TOC, OM and Eh. Moreover, the mobility of HMs and the level of potential ecological risk that they pose may also strongly depend on the processes used in WWTPs, especially from anaerobic digestion, dehydration and the activated sludge process, as well as on characteristics of raw wastewater. The results of potential ecological risk analysis based on the two different groups of indices confirm that the chemical forms in which HMs occur in sewage sludge determine the level of risk more precisely than their total concentrations. Moreover, the obtained results also indicate that ultrasonic disintegration of thickened excess sludge enables lysis of microorganisms’ cells without increasing the total heavy metals concentrations in SS, and their release into the supernatant in the mobile forms. The above findings prove that UD is a safe and environmentally friendly method of sewage sludge pretreatment.
The obtained results are an important source of information about the HMs in sewage sludge, both for WWTPs operators and representatives of institutions involved in the creation of legal acts in the field of environmental protection and waste management.

Author Contributions

Conceptualization, M.T.; Methodology, M.T.; Validation, M.T.; Formal analysis, M.T., K.W.-R., J.K., Z.B. and K.S.; Investigation, M.T.; Writing—original draft preparation, M.T.; Writing—review and editing, M.T., K.W.-R. and J.K.; Visualization, M.T.; Supervision, M.T.; Project administration; M.T.; Funding acquisition, M.T. All authors have read and agreed to the published version of the manuscript.

Funding

This research was funded by the National Science Centre, Poland, under grant number 2019/35/D/ST10/02575 (“The way of metals binding in sewage sludge and the ecological risk”).

Institutional Review Board Statement

Not applicable.

Informed Consent Statement

Not applicable.

Data Availability Statement

Data are provided as tables and figures.

Acknowledgments

The authors gratefully acknowledge Justyna Klyta and Ewa Miszczak for their technical support during the research.

Conflicts of Interest

The authors declare no conflict of interest.

References

  1. Kowalik, R.; Latosińska, J.; Gawdzik, J. Risk Analysis of Heavy Metal Accumulation from Sewage Sludge of Selected Wastewater Treatment Plants in Poland. Water 2021, 13, 2070. [Google Scholar] [CrossRef]
  2. You, M.; Hu, Y.; Yan, Y.; Yao, J. Speciation Characteristics and Ecological Risk Assessment of Heavy Metals in Municipal Sludge of Huainan, China. Molecules 2021, 26, 6711. [Google Scholar] [CrossRef] [PubMed]
  3. Tytła, M. Assessment of Heavy Metal Pollution and Potential Ecological Risk in Sewage Sludge from Municipal Wastewater Treatment Plant Located in the Most Industrialized Region in Poland—Case Study. Int. J. Environ. Res. Public Health 2019, 16, 2430. [Google Scholar] [CrossRef] [PubMed]
  4. Tawfik, A.; Mohsen, M.; Ismail, S.; Alhajeri, N.S.; Osman, A.I.; Rooney, D.W. Methods to alleviate the inhibition of sludge anaerobic digestion by emerging contaminants: A review. Environ. Chem. Lett. 2022, 20, 3811–3836. [Google Scholar] [CrossRef]
  5. Tytła, M.; Widziewicz-Rzońca, K.; Bernaś, Z. A Comparison of Conventional and Ultrasound-Assisted BCR Sequential Extraction Methods for the Fractionation of Heavy Metals in Sewage Sludge of Different Characteristics. Molecules 2022, 27, 4947. [Google Scholar] [CrossRef]
  6. Turek, A.; Wieczorek, K.; Wolf, W.M. Digestion Procedure and Determination of Heavy Metals in Sewage Sludge—An Analytical Problem. Sustainability 2019, 11, 1753. [Google Scholar] [CrossRef]
  7. Tytła, M.; Widziewicz, K.; Zielewicz, E. Heavy metals and its chemical speciation in sewage sludge at different stages of processing. Environ. Technol. 2015, 37, 899–908. [Google Scholar] [CrossRef]
  8. Saffari, M.; Saffari, V.R.; Khabazzadeh, H.; Naghavi, H. Assessment of content and chemical forms of arsenic, copper, lead, and chromium in sewage sludge compost as affected by various bulking agents. Main Group Met. Chem. 2020, 43, 56–66. [Google Scholar] [CrossRef]
  9. Aygün, A. Ecological risk assessment of domestic sewage sludge: A case study. Sigma J. Eng. Nat. Sci. 2021, 39, 422. [Google Scholar] [CrossRef]
  10. Kowalik, R.; Gawdzik, J.; Bąk-Patyna, P.; Ramiączek, P.; Jurišević, N. Risk Analysis of Heavy Metals Migration from Sewage Sludge of Wastewater Treatment Plants. Int. J. Environ. Res. Public Health 2022, 19, 11829. [Google Scholar] [CrossRef]
  11. Regulation of the Minister of Environment of 6th February 2015 on the Municipal Sewage Sludge (J. L. 2015, Item. 257). Available online: https://isap.sejm.gov.pl/isap.nsf/DocDetails.xsp?id=wdu20150000257 (accessed on 19 December 2022).
  12. Directive (EU) 86/278/EEC on the Protection of the Environment, and in Particular of the Soil, When Sewage Sludge Is Used in Agriculture. Available online: https://eur-lex.europa.eu/legal-content/PL/TXT/PDF/?uri=CELEX:31986L0278&from=EN (accessed on 19 December 2022).
  13. Ruiz-Espinoza, J.E.; Córdova-Lizama, A.; Yañez-Palma, R.; Hernández-Martínez, G.; Ben-Youssef, C.; Zepeda-Pedreguera, A. Ultrasonic pretreatment of sewage sludge, an effective tool to improve the anaerobic digestion: Current challenges, recent developments, and perspectives. In Development in Wastewater Treatment Research and Processes: Treatment and Reuse of Sewage Sludge: An Innovative Approach for Wastewater Treatment, 1st ed.; Shah, M., Rodriguez-Couto, S., Shah, N., Banerjee, R., Eds.; Elsevier Science: Amsterdam, The Netherlands, 2022; Chapter 8; pp. 119–138. [Google Scholar]
  14. Zubrowska-Sudol, M.; Sytek-Szmeichel, K.; Krawczyk, P.; Bisak, A. Energy-Positive Disintegration of Waste Activated Sludge—Full Scale Study. Energies 2022, 15, 555. [Google Scholar] [CrossRef]
  15. Directive (EU) 2018/2001 of the European Parliament and of the Council on the Promotion of the Use of Energy from Renewable Sources. Available online: https://eur-lex.europa.eu/legal-content/EN/TXT/PDF/?uri=CELEX:32018L2001 (accessed on 19 December 2022).
  16. Ministry of State Assets (Poland). Poland’s National Energy and Climate Plan for the Years 2021–2030; Ministry of State Assets: Warsaw, Poland, 2019. Available online: https://www.gov.pl/ (accessed on 19 December 2022).
  17. Mitraka, G.-C.; Kontogiannopoulos, K.N.; Batsioula, M.; Banias, G.F.; Zouboulis, A.I.; Kougias, P.G. A Comprehensive Review on Pretreatment Methods for Enhanced Biogas Production from Sewage Sludge. Energies 2022, 15, 6536. [Google Scholar] [CrossRef]
  18. Tytła, M. The Effects of Ultrasonic Disintegration as a Function of Waste Activated Sludge Characteristics and Technical Conditions of Conducting the Process—Comprehensive Analysis. Int. J. Environ. Res. Public Health 2018, 15, 2311. [Google Scholar] [CrossRef]
  19. Le, N.T.; Julcour-Lebigue, C.; Delmas, H. An executive review of sludge pretreatment by sonication. J. Environ. Sci. 2015, 37, 139–153. [Google Scholar] [CrossRef]
  20. Zielewicz, E. Effects of ultrasonic disintegration of excess sewage sludge. Top Curr. Chem. 2016, 149–174. [Google Scholar] [CrossRef]
  21. Nkinahamira, F.; Suanon, F.; Chi, Q.; Li, Y.; Feng, M.; Huang, X.; Yu, C.-P.; Sun, Q. Occurrence, geochemical fractionation, and environmental risk assessment of major and trace elements in sewage sludge. J. Environ. Manag. 2019, 249, 109427. [Google Scholar] [CrossRef]
  22. Pohl, A.; Tytła, M.; Kernert, J.; Bodzek, M. Plastics-derived and heavy metals contaminants in the granulometric fractions of bottom sediments of anthropogenic water reservoir—Comprehensive analysis. Desalination Water Treat. 2022, 258, 207–222. [Google Scholar] [CrossRef]
  23. Ure, A.M.; Quevauviller, P.; Muntau, H.; Griepink, B. Speciation of Heavy Metals in Soils and Sediments. An Account of the Improvement and Harmonization of Extraction Techniques Undertaken Under the Auspices of the BCR of the Commission of the European Communities. Int. J. Environ. Anal. Chem. 1993, 51, 135–151. [Google Scholar] [CrossRef]
  24. Álvarez, E.; Mochón, M.; Sánchez, J.; Rodrı́guez, M. Heavy metal extractable forms in sludge from wastewater treatment plants. Chemosphere 2002, 47, 765–775. [Google Scholar] [CrossRef]
  25. Google Maps. Available online: https://www.google.pl/maps/@55.1360109,21.7839944,4z (accessed on 21 November 2022).
  26. PN−EN 12880:2004; Characteristics of Sewage Sludge, Determination of Dry Residue and Water Content. Polish Committee for Standardization: Warsaw, Poland, 2004.
  27. PN−EN 12879:2004; Characteristics of Sewage Sludge, Determination of Loss on Ignition of Dry Matter. Polish Committee for Standardization: Warsaw, Poland, 2004.
  28. PN-EN 13137:2004; Characterization of Waste—Determination of Total Organic Carbon (TOC) in Waste. Sludges and Sediments. Polish Committee for Standardization: Warsaw, Poland, 2004.
  29. Müller, J. Mechanischer Klärschlammaufschluß. Ph.D. Thesis, Technical University of Braunschweig, Braunschweig, Germany, 1996. [Google Scholar]
  30. PN-ISO 15705:2005; Water Quality—Determination of the Chemical Oxygen Demand Index (ST−COD)—Small−Scale Sealed−Tube Method. Polish Committee for Standardization: Warsaw, Poland, 2005.
  31. Zielewicz, E. Ultrasonic Disintegration of Excess Sludge to Produce Volatile Fatty Acids (Scientific Papers of Silesian University of Technology), 1st ed.; Publishing House of Silesian University of Technology: Gliwice, Poland, 2007; pp. 21–23. [Google Scholar]
  32. IEE PAS Internal Research Procedure PB4 “Determination of Organic Carbon and Inorganic Carbon in Water and Wastewater”. Issue 6. 10/07/2019, Zabrze, Poland.
  33. PN−EN 14701–1:2007; Characterization of Sludges–Filtration Properties—Part 1: Capillary Suction Time (CST). Polish Committee for Standardization: Warsaw, Poland, 2007.
  34. Tytła, M. Identification of the Chemical Forms of Heavy Metals in Municipal Sewage Sludge as a Critical Element of Ecological Risk Assessment in Terms of Its Agricultural or Natural Use. Int. J. Environ. Res. Public Health 2020, 17, 4640. [Google Scholar] [CrossRef]
  35. Kazi, T.; Jamali, M.; Siddiqui, A.; Kazi, G.; Arain, M.; Afridi, H. An ultrasonic assisted extraction method to release heavy metals from untreated sewage sludge samples. Chemosphere 2006, 63, 411–420. [Google Scholar] [CrossRef] [PubMed]
  36. Sakan, S.M.; Đorđević, D.S.; Manojlović, D.D.; Predrag, P.S. Assessment of heavy metal pollutants accumulation in the Tisza river sediments. J. Environ. Manag. 2009, 90, 3382–3390. [Google Scholar] [CrossRef] [PubMed]
  37. Wedepohl, K.H. The composition of the continental crust. Geochim. Cosmochim. Acta 1995, 59, 1217–1232. [Google Scholar] [CrossRef]
  38. Kabata-Pendias, A. Trace Elements in Soils and Plants, 4th ed.; Taylor & Francis: New York, NY, USA, 2011; pp. 41–42. [Google Scholar]
  39. Håkanson, L. An ecological risk index for aquatic pollution control. A sedimentological approach. Water Res. 1980, 14, 975–1001. [Google Scholar] [CrossRef]
  40. Perin, G.; Craboledda, L.; Lucchese, M.; Cirillo, R.; Dotta, L.; Zanetta, M.L.; Oro, A.A. Heavy metal speciation in the sediments of northern Adriatic Sea. A new approach for environmental toxicity determination. In Heavy Metals in the Environment; Lakkas, T.D., Ed.; CEP Consultants: Edinburgh, Scotland, 1985; Volume 2, pp. 454–456. [Google Scholar]
  41. Cieślik, B.M.; Namieśnik, J.; Konieczka, P. Review of sewage sludge management: Standards, regulations and analytical methods. J. Clean. Prod. 2015, 90, 1–15. [Google Scholar] [CrossRef]
  42. Xie, R.; Xing, Y.; Ghani, Y.A.; Ooi, K.-E.; Ng, S.-W. Full-scale demonstration of an ultrasonic disintegration technology in enhancing anaerobic digestion of mixed primary and thickened secondary sewage sludge. J. Environ. Eng. Sci. 2007, 6, 533–541. [Google Scholar] [CrossRef]
  43. Górka, J.; Cimochowicz-Rybicka, M.; Fryźlewicz-Kozak, B. Effect of ultrasonic and thermal disintegration of water treatment sludge. In Proceedings of the E3S Web of Conferences, 10th Conference on Interdisciplinary Problems in Environmental Protection and Engineering EKO-DOK, Polanica-Zdrój, Poland, 16–18 April 2008; EDP Sciences: Krakow, Poland, 2008; Volume 44, p. 00045. [Google Scholar] [CrossRef]
  44. Skórkowski, Ł; Zielewicz, E.; Kawczyński, A.; Gil, B. Assessment of Excess Sludge Ultrasonic, Mechanical and Hybrid Pretreatment in Relation to the Energy Parameters. Water 2018, 10, 551. [Google Scholar] [CrossRef]
  45. Yuan, D.; Zhou, X.; Jin, W.; Han, W.; Chi, H.; Ding, W.; Huang, Y.; He, Z.; Gao, S.; Wang, Q. Effects of the Combined Utilization of Ultrasonic/Hydrogen Peroxide on Excess Sludge Destruction. Water 2021, 13, 266. [Google Scholar] [CrossRef]
  46. Tytła, M.; Zielewicz, E. The effect of ultrasonic disintegration process conditions on the physicochemical characteristics of excess sludge. Arch. Environ. Prot. 2016, 42, 19–26. [Google Scholar] [CrossRef] [Green Version]
  47. Tytła, M.; Zielewicz, E. The impact of temporal variability of excess sludge characteristics on the effects obtained in the process of its ultrasonic disintegration. Environ. Technol. 2017, 39, 3020–3032. [Google Scholar] [CrossRef]
  48. Shrivastava, S.K.; Banerjee, D.K. Speciation of Metals in Sewage Sludge and Sludge-amended Soils. Water Air Soil Pollut. 2004, 152, 219–232. [Google Scholar] [CrossRef]
  49. Sánchez, C.H.; Gutiérrez, Á.; Galindo, J.M.; González-Weller, D.; Rubio, C.; Revert, C.; Burgos, A.; Hardisson, A. Heavy metal content in sewage sludge: A management strategy for an ocean island. Rev. Salud Ambient. 2017, 17, 3–9. [Google Scholar]
  50. Gulyas, G.; Pitas, V.; Karpati, A.; Fazekas, B.; Domokos, E.; Redey, A. HEAVY METAL BALANCE IN A HUNGARIAN MUNICIPAL SEWAGE TREATMENT PLANT. Environ. Eng. Manag. J. 2014, 13, 2039–2044. [Google Scholar] [CrossRef]
  51. Kang, D.; Xie, D.; Ke, P. Modeling of Heavy Metals Adsorption by Inorganic Particles and Activated Sludge in Domestic Wastewater Treatment Plant. Asian J. Chem. 2014, 26, 4475–4480. [Google Scholar] [CrossRef]
  52. Wang, C.; Li, X.-C.; Ma, H.-T.; Qian, J.; Zhai, J.-B. Distribution of extractable fractions of heavy metals in sludge during the wastewater treatment process. J. Hazard. Mater. 2006, 137, 1277–1283. [Google Scholar] [CrossRef]
  53. Gusiatin, Z.M.; Kulikowska, D.; Klik, B.K.; Hajdukiewicz, K. Ecological risk assessment of sewage sludge from municipal wastewater treatment plants: A case study. J. Environ. Sci. Health Part A 2018, 53, 1167–1176. [Google Scholar] [CrossRef]
  54. Zhang, H.; Huang, Y.; Zhou, S.; Wei, L.; Guo, Z.; Li, J. Pollution level and risk assessment of heavy metals in sewage sludge from eight wastewater treatment plants in Wuhu City, China. Span. J. Agric. Res. 2020, 18, e1103. [Google Scholar] [CrossRef]
  55. Li, J.; Luo, G.; Gao, J.; Yuan, S.; Du, J.; Wang, Z. Quantitative evaluation of potential ecological risk of heavy metals in sewage sludge from three wastewater treatment plants in the main urban area of Wuxi, China. Chem. Ecol. 2014, 31, 235–251. [Google Scholar] [CrossRef]
  56. Doležalová Weissmannová, H.; Mihočová, S.; Chovanec, P.; Pavlovský, J. Potential ecological risk and human health risk assessment of heavy metal pollution in industrial affected soils by coal mining and metallurgy in Ostrava, Czech Republic. Int. J. Environ. Res. Public Health 2019, 16, 4495. [Google Scholar] [CrossRef]
  57. Gulyás, G.; Pitás, V.; Fazekas, B.; Kárpáti, Á. Heavy Metal Balance in a Communal Wastewater treatment Plant. Hung. J. Ind. Chem. 2015, 43, 19–23. [Google Scholar] [CrossRef] [Green Version]
  58. Łukowski, A. Fractionation of selected heavy metals (Zn, Ni, Cu) in municipal sewage sludges from podlasie province. J. Ecol. Eng. 2017, 18, 133–139. [Google Scholar] [CrossRef]
  59. Gwebu, S.; Tavengwa, N.T.; Klink, M.J.; Mtunzi, F.M.; Modise, S.J.; Pakade, V.E. Quantification of Cd, Cu, Pb and Zn from sewage sludge by modified-BCR and ultrasound assisted-modified BCR sequential extraction methods. Afr. J. Pure Appl. Chem. 2017, 11, 9–18. [Google Scholar] [CrossRef]
  60. Tessier, A.; Campbell, P.G.C.; Bisson, M. Sequential extraction procedure for the speciation of particulate trace metals. Anal. Chem. 1979, 51, 844–851. [Google Scholar] [CrossRef]
  61. Kousi, P.; Remoundaki, E.; Hatzikioseyian, A.; Korkovelou, V.; Tsezos, M. Fractionation and leachability of Fe, Zn, Cu and Ni in the sludge from a sulphate-reducing bioreactor treating metal-bearing wastewater. Environ. Sci. Pollut. Res. 2018, 25, 35883–35894. [Google Scholar] [CrossRef] [PubMed]
  62. Janas, M.; Zawadzka, A.; Cichowicz, R. The influence of selected factors on leaching of metals from sewage sludge. Environ. Sci. Pollut. Res. 2018, 25, 33240–33248. [Google Scholar] [CrossRef]
  63. Feizi, M.; Jalali, M.; Renella, G. Assessment of nutrient and heavy metal content and speciation in sewage sludge from different locations in Iran. Nat. Hazards 2018, 95, 657–675. [Google Scholar] [CrossRef]
  64. Sundha, P.; Basak, N.; Rai, A.K.; Chandra, P.; Bedwal, S.; Yadav, G.; Yadav, R.K.; Sharma, P.C. Characterization and ecotoxicological risk assessment of sewage sludge from industrial and non-industrial cities. Environ. Sci. Pollut. Res. 2022, 1–17. [Google Scholar] [CrossRef]
  65. Duan, B.; Feng, Q. Risk Assessment and Potential Analysis of the Agricultural Use of Sewage Sludge in Central Shanxi Province. Int. J. Environ. Res. Public Health 2022, 19, 4236. [Google Scholar] [CrossRef]
Figure 1. Location map of study area. The map on the left shows the Europe with borders of Poland; (the original source file from: https://www.google.pl/maps/@55.1360109,21.7839944,4z (accessed on 21 November 2022)) [25].
Water 15 00666 g001
Figure 2. A flowchart for the ultrasound-assisted BCR sequential extraction method.
Water 15 00666 g002
Figure 3. (A,B). CST for non-disintegrated (ND) and disintegrated (D) thickened excess sludge from WWTP1 (A) and WWTP2 (B).
Water 15 00666 g003
Figure 4. (A,B). TOC in sludge supernatant for non-disintegrated (ND) and disintegrated (D) thickened excess sludge from WWTP1 (A) and WWTP2 (B).
Water 15 00666 g004
Figure 5. (A,B). The balance sheets of HMs at successive stages of sludge processing in WWTP1 (A) and WWTP2 (B).
Water 15 00666 g005
Figure 6. Distribution of heavy metals in chemical fractions of sewage sludge from WWTP1.
Water 15 00666 g006
Figure 7. Distribution of heavy metals in chemical fractions of sewage sludge from WWTP2.
Water 15 00666 g007
Figure 8. The EF of heavy metals in sewage sludge from two WWTPs.
Water 15 00666 g008
Figure 9. The ER of heavy metals in sewage sludge from two WWTPs.
Water 15 00666 g009
Figure 10. The RI of heavy metals in sewage sludge from two WWTPs.
Water 15 00666 g010
Figure 11. The ERTOT of heavy metals in sewage sludge from two WWTPs.
Water 15 00666 g011
Figure 12. The RAC of heavy metals in sewage sludge from two WWTPs.
Water 15 00666 g012
Figure 13. The IER of heavy metals in sewage sludge from two WWTPs.
Water 15 00666 g013
Figure 14. The GER of heavy metals in sewage sludge from two WWTPs.
Water 15 00666 g014
Figure 15. The ERMF of heavy metals in sewage sludge from two WWTPs.
Water 15 00666 g015
Figure 16. (A,B). The balance of potential ecological risk of HMs in sewage sludge from WWTP1 (A) and WWTP2 (B)—based on the total content index.
Water 15 00666 g016
Figure 17. (A,B). The balance of potential ecological risk of selected HMs in sewage sludge from WWTP1 (A) and WWTP2 (B)—based on the total content index.
Water 15 00666 g017
Figure 18. (A,B). The balance of potential ecological risk of HMs in sewage sludge from WWTP1 (A) and WWTP2 (B)—based on the speciation index.
Water 15 00666 g018
Figure 19. (A,B). The balance of potential ecological risk of selected HMs in sewage sludge from WWTP1 (A) and WWTP2 (B)—based on the speciation index.
Water 15 00666 g019
Table 1. The operational parameters of the WWTPs.
ParameterWWTP1WWTP2
Population equivalent (P.E.)694,83341,250
Average daily flow71,906 m3·d−15500 m3·d−1
Wastewater treatment methodactivated sludgeactivated sludge
Phosphorus precipitant agentPIX 113PIX 113
% share of industrial wastewater18%13–20%
% of sludge disintegrated80%100%
Method of sludge dewateringmechanicalmechanical
Stabilization time21–23 d24 d
Stabilization temperature37 °C37 °C
Data obtained from WWTPs.
Table 2. Operating parameters for ICP-OES.
Instrument ConditionsUnitICP-OES
Manufacturer-PerkinElmer, Inc.
Model-Avio 200
RF powerW1400
Auxiliary gas flowL·min−10.2
Nebulizer gas flowL·min−10.7
Plasma gas flowL·min−112
Pump flow ratemL·min−11
ParameterUnitHeavy metals determination
CdCrCuNiPbZnHg
Wavelengthnm214.440267.716324.752231.604220.353213.857253.652
LODmg·L−10.0040.0060.0050.0070.0090.0080.0001
Table 3. Potential ecological risk indices.
IndicesEquationClassDescription
Total Content Indices
Enrichment factor; single-metal [36] E F = C x   / C r e f s a m p l e B x   / B r e f   b a c k g r o u n d
Cx and Cref—the concentrations of metal x and reference element (Fe) in the sample; Bx and Bref—the concentrations of metal x and reference element (Fe) in the background (earth crust) (mg·kg−1) [37,38]
EF < 1
1 < EF < 3
3 < EF < 5
5 < EF <10
10 < EF < 25
25 < EF < 50
EF > 50
No enrichment
Minor enrichment
Moderate enrichment
Moderately severe enrichment
Severe enrichment
Very severe enrichment
Extremely severe enrichment
Potential Ecological Risk Index; single-metal [39] E R = T f i C F
CF—Contamination Factor [39];
T—the “toxic response” factor for the individual metal
ER < 40
40 ≤ ER < 80
80 ≤ ER < 160
160 ≤ ER < 320
ER ≥ 320
Low risk
Moderate risk
Considerable risk
High risk
Very high risk
Risk Index;
Multi-metal [39]
R I = E R
ER—Potential Ecological Risk Factor
RI < 150
150 ≤ RI < 300
300 ≤ RI < 600
RI ≥ 600
Low risk
Moderate risk
Considerable risk
High risk
Ecological Risk of Total Metal;
authors’ index; single-metal [This study]
E R T O T = T M 2 T M 1
TM1 and TM2—the total content of metal (mg·kg−1) in sludge at the beginning and the final stage of its processing, respectively
ERTOT ≤ 1
ERTOT ≥ 1.5
ERTOT ≥ 2
No risk
Considerable risk
Very high risk
Speciation indices
Risk Assessment Code; single-metal [40] R A C = F 1
F1—the percentage share of metal in acid soluble/exchangeable fraction
RAC ≤ 1%
1% < RAC ≤ 10%
10% < RAC ≤ 30%
30% < RAC ≤ 50%
RAC > 50%
No risk
Low risk
Medium risk
High risk
Very high risk
Individual
Ecological Risk; single-metal [34]
I E R = F 1 + F 2 F 3 + F 4 × 100
IER—Individual Ecological Risk;
F1–F4—the content of metal (mg·kg−1) in chemical fractions
ER ≤ 50%
50% < IER ≤ 100%
100% < IER ≤ 250%
IER > 250%
Low risk
Moderate risk
High risk
Very high risk
Global Ecological Risk; multi-metal [34] G E R = I E R
GER—Global Ecological Risk
GER ≤ 100%
100% < GER ≤ 250%
250% < GER ≤ 500%
GER > 500%
Low risk
Moderate risk
High risk
Very high risk
Ecological Risk of Metal Mobile Forms; authors’ index; single-metal [This study] E R M F = M F s 2 M F s 1
MFs1 and MFs2—the content of metal (mg·kg−1) in mobile forms
(F1 + F2) at the beginning and the final stage of its processing, respectively
ERMF ≤ 1
ERMF ≥ 1.5
ERMF ≥ 2
No risk
Considerable risk
Very high risk
Table 4. Physicochemical properties of sewage sludge from two WWTPs.
WWTP1
SeasonParameterUnitS1S2S3S4S5S6S7
WinterpH-6.47.16.86.76.76.88.0
Summer6.57.36.86.66.77.28.5
x ¯ 6.57.26.86.76.77.08.3
WinterEhmV−180−115−101−120−163−228−115
Summer−189−76−157−195−177−240−112
x ¯ −185−96−129−157−170−234−114
WinterDM%4.80.75.35.35.13.224.2
Summer3.30.65.05.24.73.326.9
x ¯ 4.00.65.25.24.93.325.6
WinterOM%DM73.372.278.778.677.361.261.8
Summer74.969.077.477.376.857.557.3
x ¯ 74.170.678.077.977.059.359.5
WinterTOC%37.930.534.634.634.827.629.5
Summer36.929.333.733.635.026.128.2
x ¯ 36.929.334.134.135.026.128.2
WWTP2
WinterpH-6.67.47.07.36.86.77.9
Summer5.77.26.96.96.47.07.5
x ¯ 6.27.37.07.16.66.97.7
WinterEhmV−206−124−227−225−201−218−134
Summer−146−122−192−206−171−259−168
x ¯ −176−123−209−216−186−239−151
WinterDM%4.32.63.43.54.02.516.5
Summer3.22.14.54.03.52.516.7
x ¯ 3.72.34.03.73.72.516.6
WinterOM%DM81.680.680.780.581.268.671.4
Summer69.277.579.279.179.070.872.4
x ¯ 75.479.080.079.880.169.771.9
WinterTOC%40.734.734.434.838.932.034.9
Summer39.635.835.634.938.033.734.9
x ¯ 39.635.835.034.838.033.734.9
Table 5. Heavy metals concentrations in sewage sludge from two WWTPs.
WWTP1
SeasonHMS1S2S3S4S5S6S7
mg·kg−1
WinterCd3.72.92.92.82.95.44.1
Summer5.02.33.12.83.84.95.2
x ¯ 4.32.63.22.83.35.14.6
WinterCr35.539.326.631.228.242.342.6
Summer31.722.627.526.030.955.654.7
x ¯ 33.630.929.328.629.549.048.6
WinterCu195.5337.7359.3362.2309.0373.9339.0
Summer238.6300.8352.2341.3329.1415.2338.1
x ¯ 217.1319.3384.8351.8319.0394.5338.5
WinterNi49.676.489.272.968.380.078.5
Summer68.279.580.589.790.9118.0117.6
x ¯ 58.977.984.081.379.699.098.1
WinterPb7.44.74.33.73.37.57.7
Summer10.26.06.97.29.017.812.1
x ¯ 8.85.45.65.56.212.79.9
WinterZn777.7672.6778.4719.2746.7925.6912.9
Summer642.4667.7757.4769.5829.81083.11047.2
x ¯ 710.1670.2796.3744.4788.21004.3980.0
WinterHg0.040.020.020.020.030.060.06
Summer0.080.020.020.020.050.050.05
x ¯ 0.060.020.020.020.040.060.05
WWTP2
WinterCd1.52.42.42.72.33.03.0
Summer1.32.02.52.01.92.22.2
x ¯ 1.42.22.42.42.12.62.6
WinterCr75.0101.8117.2133.893.1187.4206.9
Summer166.8178.8205.6195.0178.5219.5212.1
x ¯ 120.9140.3161.4164.4135.8203.4209.5
WinterCu112.3128.3122.5126.3106.3154.2160.5
Summer146.0142.7154.3146.5137.0170.3158.2
x ¯ 129.1135.5138.4136.4121.6162.3159.3
WinterNi17.019.224.226.620.527.332.7
Summer21.123.224.724.822.521.727.0
x ¯ 19.121.224.425.721.524.529.8
WinterPb11.99.79.910.110.812.713.7
Summer13.811.213.013.113.015.515.5
x ¯ 12.910.411.411.611.914.114.6
WinterZn377.7364.7362.3395.1352.1595.4592.8
Summer518.6493.0525.3466.5456.6553.6551.4
x ¯ 448.2428.9443.8430.8404.3574.5572.1
WinterHg0.070.010.020.010.060.050.04
Summer0.050.040.040.040.050.040.05
x ¯ 0.060.020.030.030.060.040.05
Table 6. Pearson’s correlation matrix of heavy metals concentrations in sewage sludge from two WWTPs.
WWTP1WWTP2
CdCrCuNiPbZnHg CdCrCuNiPbZnHg
Cd1.00 Cd1.00
Cr0.88 *1.00 Cr0.86 *1.00
Cu−0.010.261.00 Cu0.710.94 *1.00
Ni0.370.680.84 *1.00 Ni0.83 *0.88 *0.721.00
Pb0.97 *0.92 *0.100.461.00 Pb0.250.690.710.511.00
Zn0.79 *0.89 *0.540.85 *0.80 *1.00 Zn0.550.88 *0.96 *0.640.88 *1.00
Hg0.92 *0.74−0.330.120.86 *0.591.00Hg−0.46−0.12−0.11−0.230.580.181.00
* Bold—significant correlations at p < 0.05.
Table 7. Chemical speciation of heavy metals in sewage sludge from WWTP1—mean values.
HMFS1S2S3S4S5S6S7
mg·kg−1
CdF10.2 ± 0.10.3 ± 0.10.2 ± 0.1BLOD0.2 ± 0.10.2 ± 0.10.3 ± 0.1
F20.5 ± 0.10.8 ± 0.40.8 ± 0.60.7 ± 0.40.8 ± 0.40.6 ± 0.40.7 ± 0.4
F34.0 ± 0.41.2 ± 0.51.7 ± 0.11.7 ± 0.042.1 ± 0.54.0 ± 0.42.6 ± 1.3
F40.1 ± 0.10.4 ± 0.10.6 ± 0.10.6 ± 0.10.7 ± 0.51.2 ± 0.31.1 ± 0.2
RM 112%106%104%109%113%114%102%
CrF10.4 ± 0.030.5 ± 0.10.4 ± 0.10.4 ± 0.10.3 ± 0.10.3 ± 0.10.6 ± 0.1
F21.0 ± 0.10.5 ± 0.030.5 ± 0.030.4 ± 0.020.5 ± 0.030.3 ± 0.040.5 ± 0.1
F324.5 ± 6.815.6 ± 8.217.6 ± 7.420.6 ± 8.018.5 ± 2.832.5 ± 7.226.4 ± 14.3
F410.4 ± 1.79.5 ± 0.211.4 ± 0.411.4 ± 1.310.9 ± 1.523.0 ± 2.921.0 ± 3.0
RM 108%85%102%114%102%115%100%
CuF111.6 ± 5.07.2 ± 1.85.5 ± 3.03.9 ± 0.47.4 ± 3.04.1 ± 1.915.3 ± 2.0
F210.9 ± 0.94.7 ± 1.44.8 ± 0.74.3 ± 2.95.9 ± 0.91.4 ± 1.23.0 ± 0.4
F3195.8 ± 12.3296.6 ± 139.5350.1 ± 117.0359.5 ± 91.7319.5 ± 28.6450.0 ± 9.9307.4 ± 68.7
F47.2 ± 1.015.8 ± 1.719.8 ± 4.317.8 ± 3.313.0 ± 3.829.3 ± 1.224.4 ± 1.9
RM 104%102%99%129%108%123%103%
NiF120.8 ± 3.235.5 ± 3.338.2 ± 10.233.7 ± 13.028.6±11.839.4 ± 19.246.4 ± 16.0
F29.3 ± 2.915.6 ± 2.117.6 ± 0.720.4 ± 1.216.0±2.816.2 ± 3.613.2 ± 2.19
F334.7 ± 2.929.1 ± 5.432.7 ± 5.534.8 ± 1.833.0±2.158.6 ± 10.244.8 ± 26.0
F44.1 ± 0.44.4 ± 0.24.8 ± 0.64.6 ± 0.64.6±1.910.5 ± 1.98.4 ± 0.2
RM 117%108%112%115%103%126%115%
PbF1BLODBLODBLODBLOD0.1±0.10.1 ± 0.1BLOD
F2BLODBLODBLOD0.4 ± 0.3BLOD0.1 ± 0.2BLOD
F35.0 ± 1.40.1 ± 0.10.3 ± 0.50.6 ± 0.80.5 ± 0.71.1 ± 1.51.4 ± 1.9
F44.9 ± 2.44.9 ± 0.75.3 ± 1.54.8 ± 0.95.5 ± 1.810.2 ± 2.39.8 ± 2.1
RM 113%94%100%107%97%91%113%
ZnF1257.2 ± 75.5128.1 ± 5.4103.4 ± 14.493.3 ± 43.9140.2 ± 30.7130.0 ± 13.6214.3 ± 32.1
F2281.6 ± 57.1347.8 ± 15.3344.7 ± 9.2326.8 ± 39.7387.4 ± 10.2342.8 ± 35.0411.2 ± 10.9
F3342.5 ± 71.0271.6 ± 117.2394.1 ± 98.9413.5 ± 98.7323.0 ± 42.7774.4 ± 96.6466.5 ± 134.1
F49.9 ± 1.138.3 ± 8.256.1 ± 1.952.4 ± 3.332.4 ± 12.884.6 ± 14.864.3 ± 9.1
RM 126%117%114%119%112%133%118%
HgF1BLODBLODBLODBLODBLODBLODBLOD
F2BLODBLODBLODBLODBLODBLODBLOD
F3BLODBLODBLODBLODBLODBLODBLOD
F40.05 ± 0.0130.02 ± 0.0010.02 ± 0.0030.02 ± 0.0010.03 ± 0.0140.06 ± 0.0080.05 ± 0.004
RM 81%85%99%81%80%101%97%
Results are expressed as the mean ± standard deviation (SD).
Table 8. Chemical speciation of heavy metals in sewage sludge from WWTP2—mean values.
HMFS1S2S3S4S5S6S7
mg·kg−1
CdF1BLODBLODBLODBLOD0.2 ± 0.1BLOD0.2 ± 0.1
F20.3 ± 0.040.3 ± 0.030.3 ± 0.030.3 ± 0.020.3 ± 0.040.3 ± 0.10.4 ± 0.04
F31.1 ± 0.11.0 ± 0.01.0 ± 0.021.0 ± 0.11.1 ± 0.21.2 ± 0.61.0 ± 0.1
F40.2 ± 0.10.9 ± 1.00.9 ± 0.020.8 ± 0.10.7 ± 0.21.0 ± 0.00.8 ± 0.1
RM 110%102%91%92%111%97%87%
CrF10.5 ± 0.10.5 ± 0.10.6 ± 0.040.6 ± 0.010.7 ± 0.20.8 ± 0.030.8 ± 0.1
F20.5 ± 0.10.4 ± 0.10.4 ± 0.020.4 ± 0.10.4 ± 0.10.5 ± 0.10.7 ± 0.1
F3127.8 ± 78.2134.6 ± 68.0158.5 ± 63.0160.6 ± 22.6134.6 ± 64.8179.9 ± 19.4198.6 ± 2.7
F418.3 ± 12.626.9 ± 13.633.2 ± 7.337.4 ± 7.226.8 ± 14.435.8 ± 5.740.6 ± 1.5
RM 122%116%119%121%120%107%115%
CuF15.0 ± 2.83.2 ± 2.12.6 ± 0.42.7 ± 1.23.5 ± 1.13.8 ± 0.94.9 ± 1.6
F26.7 ± 2.73.6 ± 2.02.8 ± 0.82.5 ± 1.02.6 ± 1.02.6 ± 0.043.2 ± 1.3
F3137.7 ± 49.7139.8 ± 48.4163.4 ± 6.6153.1 ± 6.1131.3 ± 18.6160.5 ± 11.0173.8 ± 7.0
F44.3 ± 5.46.4 ± 3.16.5 ± 2.56.9 ± 1.75.8 ± 3.98.3 ± 0.48.0 ± 2.9
RM 119%113%127%121%118%108%119%
NiF14.7 ± 0.56.4 ± 2.66.8 ± 1.47.4 ± 0.86.5 ± 0.26.7 ± 1.07.4 ± 0.3
F22.8 ± 0.043.3 ± 0.33.4 ± 0.63.5 ± 0.042.9 ± 0.043.1 ± 0.53.9 ± 0.6
F37.6 ± 2.78.9 ± 1.910.0 ± 2.410.2 ± 2.58.7 ± 1.09.6 ± 3.610.3 ± 0.4
F43.3 ± 1.32.8 ± 1.52.9 ± 0.14.1 ± 1.63.2 ± 1.64.6 ± 1.74.5 ± 0.8
RM 97%101%95%97%99%98%88%
PbF10.2 ± 0.20.1 ± 0.20.3 ± 0.20.4 ± 0.10.3 ± 0.40.5 ± 0.2BLOD
F20.3 ± 0.40.5 ± 0.20.4 ± 0.010.4 ± 0.10.4 ± 0.20.5 ± 0.10.1 ± 0.2
F35.8 ± 0.92.0 ± 0.21.5 ± 0.21.6 ± 0.12.6 ± 0.81.9 ± 0.62.2 ± 0.1
F46.9 ± 4.49.4 ± 4.09.1 ± 3.99.7 ± 3.59.9 ± 4.811.1 ± 0.812.3 ± 0.7
RM 102%115%99%104%111%99%101%
ZnF1155.5 ± 23.4103.5 ± 8.9114.2 ± 14.4126.8 ± 21.0142.2 ± 3.6158.1 ± 26.7234.1 ± 50.0
F2184.9 ± 17.2162.1 ± 12.9154.6 ± 9.0165.0 ± 25.1157.2 ± 2.0195.0 ± 28.2252.8 ± 25.9
F3203.4 ± 112.9232.7 ± 102.6239.8 ± 44.1246.3 ± 17.5208.9 ± 81.8278.7 ± 108.6234.7 ± 22.1
F49.4 ± 6.730.0 ± 5.133.1 ± 13.728.1 ± 3.027.4 ± 19.534.0 ± 7.223.8 ± 10.8
RM 123%123%122%131%132%116%130%
HgF1BLODBLODBLODBLODBLODBLODBLOD
F2BLODBLODBLODBLODBLODBLODBLOD
F3BLODBLODBLODBLODBLODBLODBLOD
F40.02 ± 0.0070.02 ± 0.0060.03 ± 0.0090.03 ± 0.0140.02 ± 0.0020.04 ± 0.0110.04 ± 0.013
RM 36%87%94%105%42%83%90%
Results are expressed as the mean ± standard deviation (SD).
Table 9. Pearson’s correlation matrix of chemical forms of HMs and basic parameters of sewage sludge from two WWTPs.
WWTP1Cd_F1Cr_F1Cu_F1Ni_F1Pb_F1Zn_F1WWTP2Cd_F1Cr_F1Cu_F1Ni_F1Pb_F1Zn_F1
pH0.560.86 *0.620.80 *−0.160.24pH0.270.42−0.170.81 *−0.320.31
Eh0.360.77 *0.340.33−0.75−0.07Eh0.30−0.360.33−0.19−0.86 *0.11
DM0.340.670.750.59−0.240.43DM0.670.510.540.40−0.670.88 *
OM0.280.640.730.56−0.270.41OM0.680.500.520.40−0.670.87 *
TOC−0.30−0.410.03−0.80 *−0.380.20TOC0.21−0.560.43−0.76 *−0.32−0.03
Cd_F2Cr_F2Cu_F2Ni_F2Pb_F2Zn_F2 Cd_F2Cr_F2Cu_F2Ni_F2Pb_F2Zn_F2
pH0.28−0.36−0.50−0.15−0.260.75pH0.650.52−0.570.91 *−0.170.46
Eh0.720.00−0.010.07−0.280.37Eh−0.210.190.350.20−0.130.21
DM0.10−0.13−0.25−0.24−0.160.65DM0.78 *0.88 *−0.050.76 *−0.82 *0.87 *
OM0.12−0.12−0.22−0.21−0.130.64OM0.78 *0.86 *−0.060.76 *−0.83 *0.85 *
TOC−0.120.700.84 *−0.17−0.01−0.50TOC−0.47−0.290.72−0.56−0.27−0.20
Cd_F3Cr_F3Cu_F3Ni_F3Pb_F3Zn_F3 Cd_F3Cr_F3Cu_F3Ni_F3Pb_F3Zn_F3
pH−0.110.240.080.32−0.230.16pH−0.520.690.670.81 *−0.720.42
Eh−0.77 *−0.70−0.36−0.64−0.35−0.68Eh−0.53−0.25−0.24−0.270.20−0.54
DM0.060.31−0.090.280.050.12DM−0.410.690.630.45−0.06−0.07
OM0.030.27−0.100.230.040.08OM−0.440.670.620.45−0.07−0.09
TOC−0.06−0.47−0.64−0.690.45−0.64TOC−0.05−0.72−0.71−0.81 *0.83 *−0.94 *
Cd_F4Cr_F4Cu_F4Ni_F4Pb_F4Zn_F4 Cd_F4Cr_F4Cu_F4Ni_F4Pb_F4Zn_F4
pH0.580.590.540.530.660.45pH0.640.80 *0.740.370.77 *0.49
Eh−0.26−0.38−0.15−0.43−0.32−0.18Eh−0.18−0.30−0.26−0.37−0.05−0.32
DM0.500.540.360.410.570.29DM−0.060.520.400.510.61−0.19
OM0.480.490.320.360.520.26OM−0.060.520.390.480.60−0.19
TOC−0.77 *−0.77 *−0.86 *−0.82 *−0.80 *−0.81 *TOC−0.86 *−0.82 *−0.92 *−0.50−0.69−0.81 *
* Bold—significant correlations at p < 0.05.
Disclaimer/Publisher’s Note: The statements, opinions and data contained in all publications are solely those of the individual author(s) and contributor(s) and not of MDPI and/or the editor(s). MDPI and/or the editor(s) disclaim responsibility for any injury to people or property resulting from any ideas, methods, instructions or products referred to in the content.

