Article

Comparative Assessment of the Quality and Potential Uses of Groundwater in a Typical Rural Settlement in Colombia

by
Geraldine Jhafet Huerfano-Moreno
1,*,
Jose Ismael Rojas-Peña
1,
Yair Leandro Zapata-Muñoz
1,
Juan Manuel Trujillo-González
1,*,
Marco Aurelio Torres-Mora
1,
Francisco J. García-Navarro
2 and
Raimundo Jiménez-Ballesta
3
1
Instituto de Ciencias Ambientales de la Orinoquia Colombiana ICAOC, Facultad de Ciencias Básicas e Ingeniería, Universidad de Los Llanos, Campus Barcelona, Villavicencio 500001, Colombia
2
Higher Technical School of Agricultural Engineers, University of Castilla-La Mancha, 13007 Ciudad Real, Spain
3
Department of Geology and Geochemistry, Autonoma University of Madrid, 28049 Madrid, Spain
*
Authors to whom correspondence should be addressed.
Water 2023, 15(4), 667; https://doi.org/10.3390/w15040667
Submission received: 17 January 2023 / Revised: 4 February 2023 / Accepted: 6 February 2023 / Published: 8 February 2023

Abstract

:
The Sustainable Development Goals of the United Nations (SDGs) establish the need to guarantee quality water for all people. In numerous rural settlements of Colombia, access to clean drinking water is a formidable challenge as frequently observed when waterborne diseases arise, mainly in vulnerable populations without basic sanitation systems. The main objective of this study was to assess the quality and potential use of groundwater sampled from 17 monitored wells in a typical rural settlement in Colombia. Water quality was determined by applying a quality index and performing a principal component analysis (PCA) to determine the weights of each parameter. The results of the Phosphorus, Nitrates, Thermotolerant coliforms and pH variables exceeded regulatory limits, mainly in areas affected by anthropogenic sources with an insufficient sewage network. Coliform population and NO3 exceeded World Health Organization recommended thresholds for drinking water. Therefore, the qualities of the studied water samples were unsuitable for human consumption without prior adequate treatment and, hence, one recommendation is to regulate groundwater monitoring quality. In addition, unhealthy waste disposal practices should be abolished, while permanently controlled modern techniques should be introduced.

1. Introduction

The Sustainable Development Goals (SDGs) focus on avoiding a global water crisis due to increased demand and increased pressure on water resources [1,2]. At the same time, groundwater quality assessments are critical for resource planning and environmental management [3]. Globally speaking, increased anthropogenic activities frequently contaminate water sources in numerous world regions, and in such a way that equitable administration of water resources has become a challenge for today’s growing society due to demand in performed human activities [4,5,6], which increasingly resort to extracting underground sources [7,8,9]. The need to immediately dispose of these resources [10] leads to overexploitation of this resource, which is frequently accompanied by water stress and contamination processes that reduce supply capacity and access to opportunity [9,11,12,13]. This fact is especially patent in Latin America, where 61.7% of the population do not benefit from improved water services and 43.4% do not have efficient basic sanitation facilities. These conditions are exacerbated in rural areas [14,15,16].
Although Colombia is not water deficient for climate reasons (on the contrary in fact), water scarcity and environmental degradation are major problems, at least in certain regions of this country. In line with this, groundwater in many urban and rural areas of Colombia represents the most important and valuable source of drinking water for public and private consumers considering its multiple uses. In these areas, sewage disposal, landfill sites and septic tanks are considered one of the largest sources of pollutant discharge to the environment. This problem is still to be solved in this region, as it is in other less-developed areas of the world, and even in developed areas [17]. For example, in some eastern central European countries, sewage infiltration into groundwater is a crucial issue due to inadequate sewage management and a lack of wastewater treatment systems [18,19,20,21]. Stigter et al. [22] have conducted groundwater quality studies in Portugal where, according to the water quality index, groundwater has a high contamination level due to agricultural activity. It is not, therefore, unusual that groundwater quality has significantly decreased in these areas as a consequence of all this [23].
In Colombia, the lack of infrastructure and economic resources for water management purposes (consumption and residual) enhanced the risks of transmitting diseases and public health problems mainly in vulnerable populations with no basic sanitation systems [24]. Despite abundant rainfall (between 2000 and 5000 mm/year), groundwater is an important water resource in both urban and rural areas of Colombia. In these cases, groundwater becomes an effective alternative for supplying rural communities that are not connected to central water systems [25]. For this reason, the community is self-sufficient by pumping from underground wells (cisterns) and pouring wastewater into another septic tank [26]. Furthermore, water disposal systems in rural areas are managed in a mixed way with dumping in open fields, and common sewerage and water sources that circulate near another community [27].
The water used for livestock farming, extractive mining and crops is added to the water infiltrations that occur in these areas [28,29]. As neither the technology nor the necessary technical assistance for water to return is lacking, the guarantees of removing solid waste and other contaminating agents (which are not so easy to perceive with the naked eye) are not secure [30,31]. To this, concentrations of ions such as nitrites, nitrates and phosphates are added, which are the product of excessive fertilizer, soap and pesticide use [32]. Microbiological pathogens can also pose a significant hazard for groundwater consumption, with cases of a cholera epidemic in recent times. Therefore, it is not surprising that inadequate water management is one of the causes of gastrointestinal diseases, fever and watery diarrhea [33,34].
The consequence is to acknowledge the properties of groundwater resources, which is essential if these resources are to be employed for human, irrigation and industrial uses, among others. Physical, chemical and bacteriological testing is carried out to understand groundwater quality [35]. Higher education centers use groundwater resources for educational activities, such as laboratory practices, sports areas (swimming pools), agricultural production areas and human consumption, and these centers manage and ensure optimal quality conditions for their wells. While in households, groundwater use is mainly domestic, and people do not guarantee adequate maintenance of wells. For these reasons, this study aimed to assess groundwater quality in these two different areas: a higher education center and households. The final purpose is to check in a representative rural area in Colombia its potential suitability for consumption under healthy physico-chemical and microbiological conditions. This information is to act as the basis to draw up a good practices plan for processes to capture, use and dispose of underground resources in an attempt to contribute to sustainable management and public health.

2. Materials and Methods

2.1. Study Area

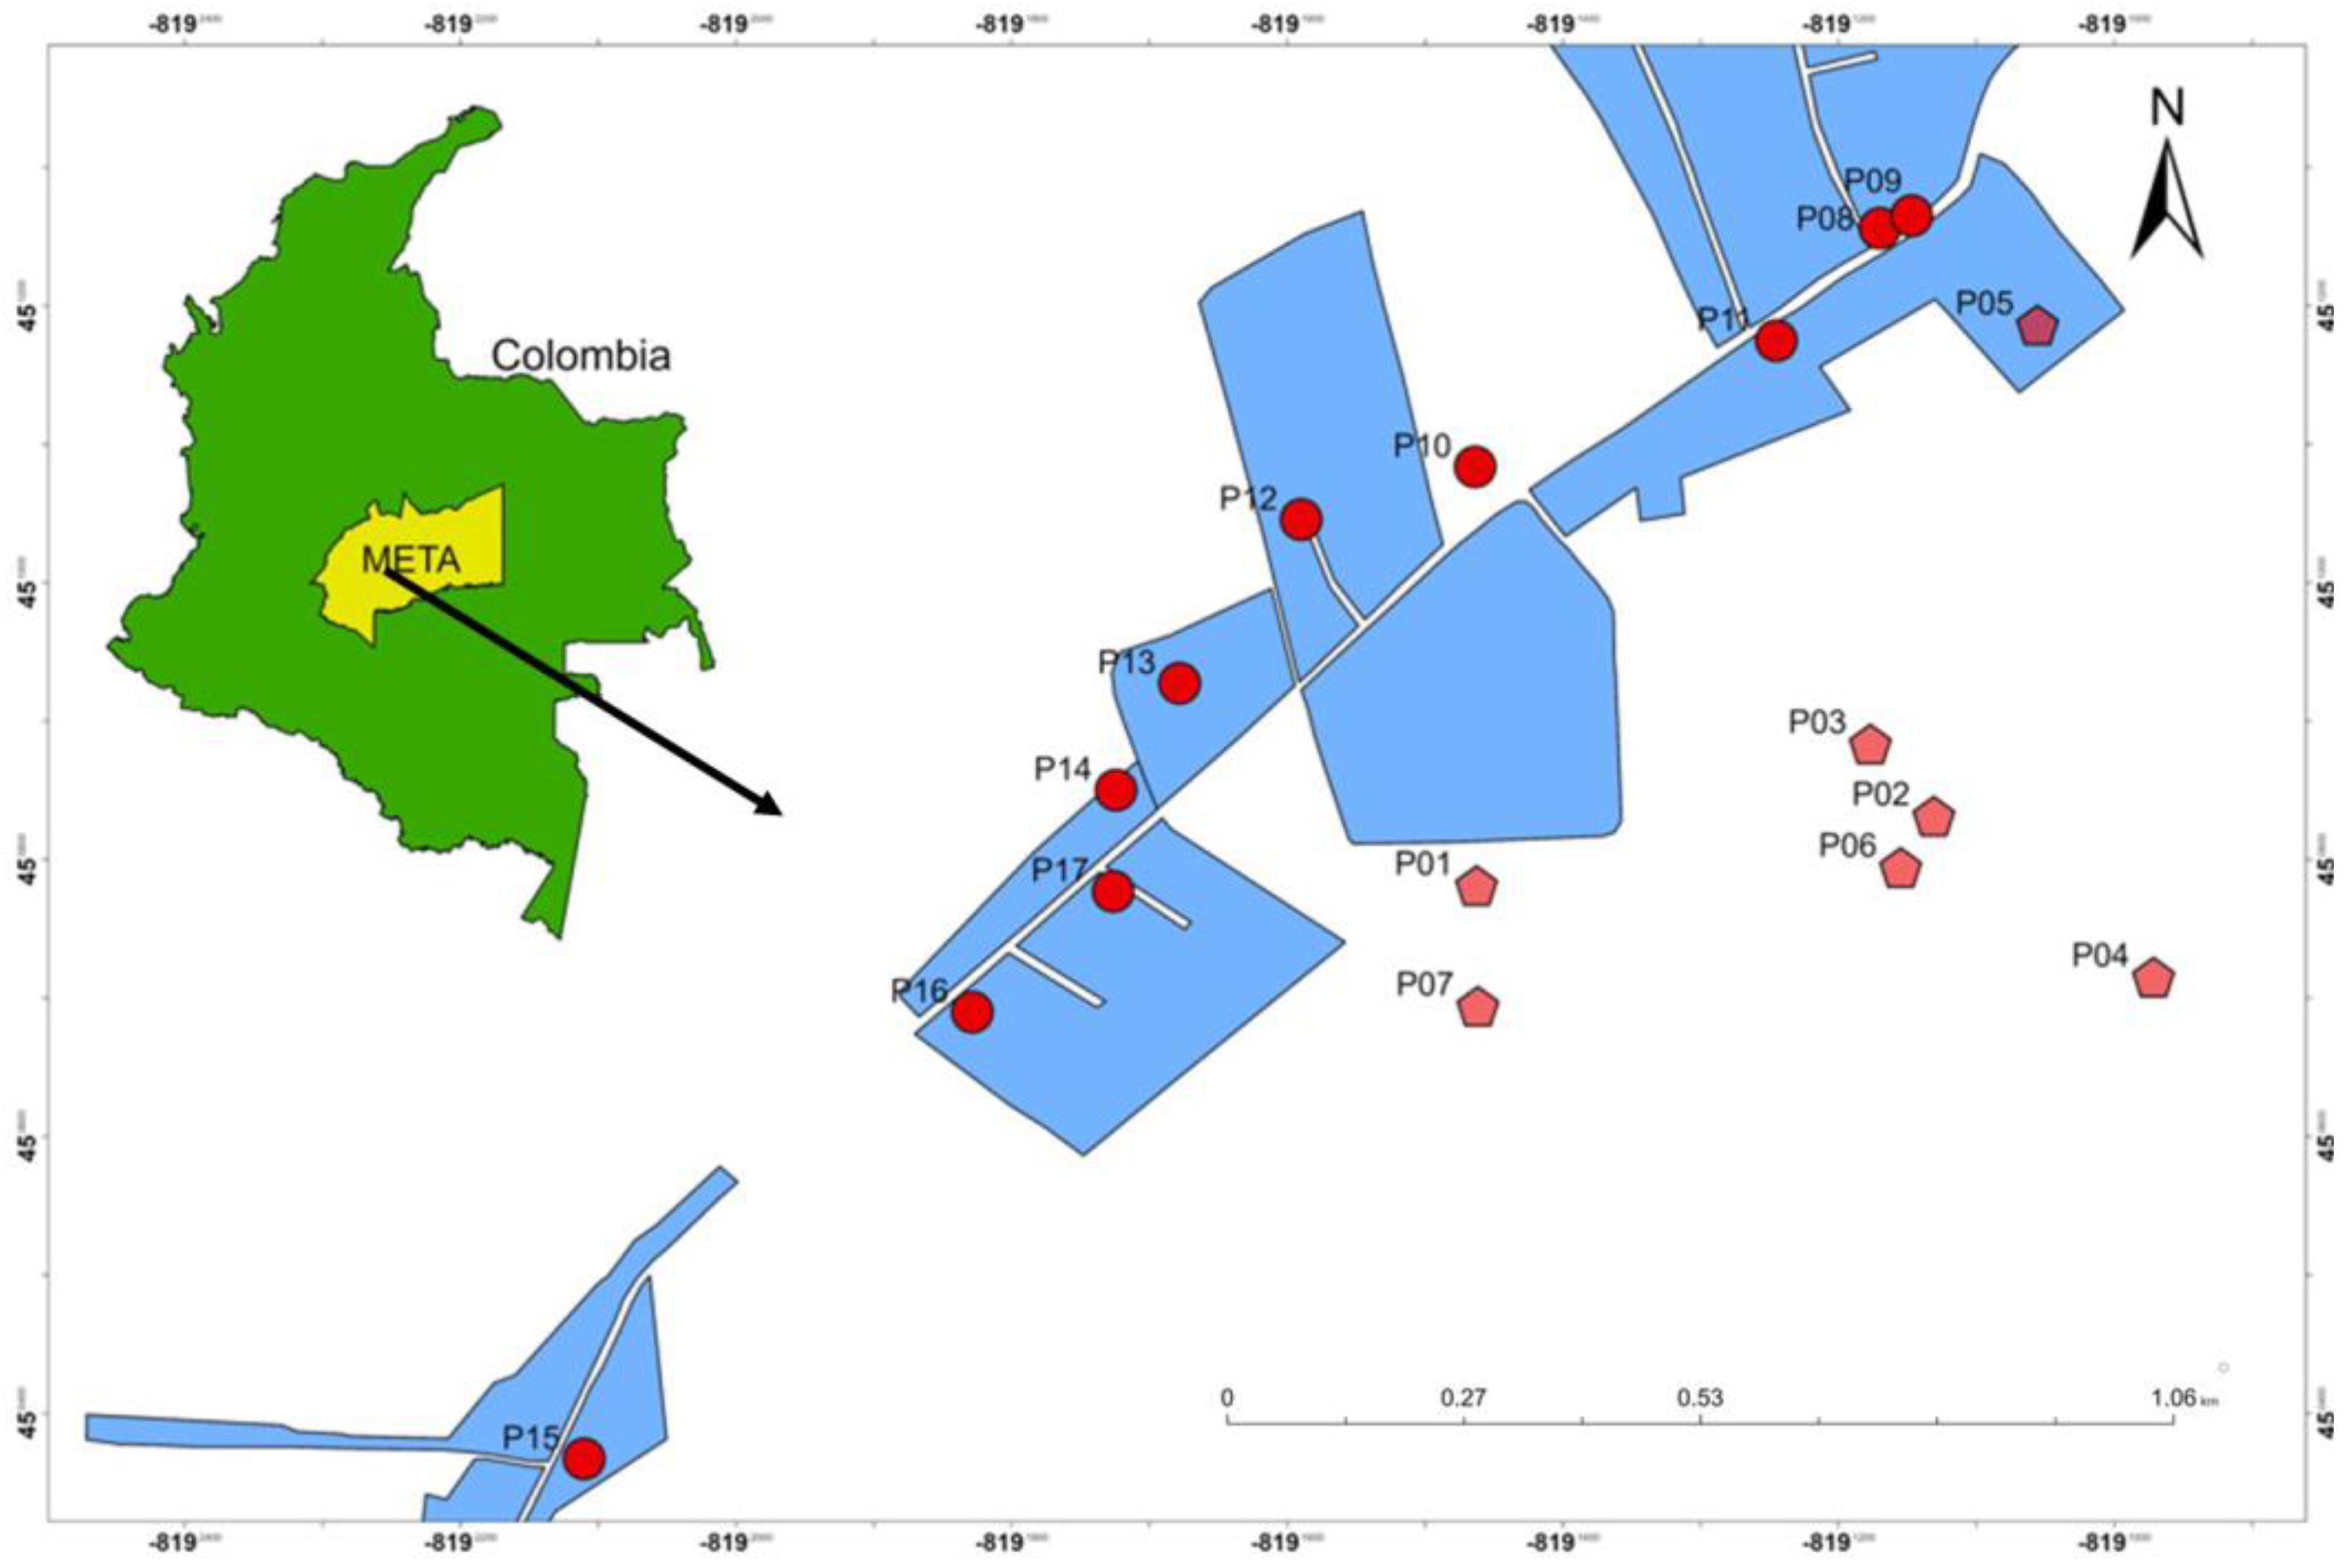
The study was carried out in a rural settlement located in the municipality of Villavicencio, Colombia, with geographic coordinates 4°04′25.7″ north and 73°35′13.9″ west, and lies at an altitude of 467 m.a.s.l. (Figure 1). The study area is associated by proximity to a higher education center (HEC) with around 7000 students. In physiographical terms, the area is located in the landscapes of mountain foothills with very heterogeneous geological features; lithologies consist of sandstone and shale in mountains, while clays, conglomerates and mixed sediments predominate in piedmont areas [36]. Its average temperature ranges between 21.0 and 31.5 °C, with 80% average relative humidity [37]. Two climatic seasons are presented, rainy and dry seasons, which begin in March or April and end in November. The other months are dry or receive little rain. The area is used mainly for agricultural activities, where 73% of the residents own properties, 14% rent and 13% are unaware of this information [38]. Agricultural uses include pastures for livestock production (42.9%), palm oil (22%), rice (19.4%) and cultivation. The remaining 0.5% is related to other production types [39]. The area also has savanna vegetation. The groundwater level is close to the surface at a depth of 4–17 m, presents a natural recharge level of 600 mm/year and the surface runoff is estimated at 2871 mm/year. However, currently, hydrogeological studies in the region are scarce [40]. Consequently, only some soil types have formed under the influence of water (hydromorphism). In the study area, the most frequent soil types are Oxisols, Inceptisols and Entisols [41].

2.2. Sampling Design

As groundwater quality differs from place to place and this may, therefore, affect its suitability for consumption, groundwater was sampled from selected wells in rural and urban areas during the 2019 rainy season. Ten groundwater samples were sampled in the rural location, (specifically from domestic cisterns,) while seven samples were collected from the HEC. All of them were associated with different land use sites.
Points were positioned using GPS equipment. Of the 17 sampling points, 10 were taken from houses in the typical rural settlement and were characterized mainly by using cisterns to supply the houses’ water supply network, with septic tanks for wastewater disposal. Some sampling points shared commercial activities and agricultural practices.
The other seven points were taken in a HEC by selecting points according to different uses (agricultural, fish farming, livestock, sports, academic activities). Water samples were collected directly from wells in plastic and glass containers, which were labeled and transported to the laboratory to continue and guarantee the cold chain. Location data were recorded at the cistern’s location and in areas close to the property that could represent some major interactions with cistern water quality. As usual, special precautions were taken to maintain quality assurance, e.g., all the reagents were of analytical grade and purchased from the Aldrich Chemical Company, England. The samples for the metal analysis were preserved with 3 mL concentrated HNO3 per liter in the field.

2.3. Analytical Methods

The water quality parameters, analyzed in accordance with standard APHA methods [42], were (Table 1): pH, temperature, conductivity, total solids (TS), total suspended solids (TSS), total dissolved solids (TDS), turbidity, nitrate (NO3), sulfate (SO42−), phosphate (PO43−), dissolved oxygen (DO), chemical oxygen demand (COD), biochemical oxygen demand (BOD), fecal coliform (FC) and total coliform (TC) counts (Table 1). The samples for COD, NO, SO42− and PO43− were refrigerated and analyzed as soon as possible, and always within 24 h. The containers for the bacteriological analysis, in addition to the previous treatments, were sterilized in an autoclave at 121 °C for 15 min. For the quality control of analytical tests, blanks, fortified blanks, the fortified matrix with their respective duplicates and the use of analytical grade reagents were considered.

2.4. Water Quality Index

Globally speaking, an important part of country-wide indices is based on international standards, which differ substantially from Colombia’s own regional water characteristics [43,44]. In fact, it is difficult to combine criteria and to develop a universally acceptable general water quality index that is ultimately accepted by the scientific community [45,46]. The use of water quality indices (WQI) is particularly relevant in ecosystem monitoring programs. In fact, with its calculations, it is possible to inform the general public and decision makers about the state of the environment [47].
For that purpose, the WQI proposed by Dinius [48] was used in this work for the groundwater quality index evaluation. It explores the relation between contamination levels in relation to several water uses by describing water suitability. It includes 11 parameters in the following formula:
W Q I = i = 1 n I i W i
where:
WQI: quality index (a number between 0 and 100).
n: number of variables.
Wi: unit weight of the polluting variable (a number between 0–1).
Ii: pollution subindex.
Π: indicates multiplying terms.

2.5. Statistical Analysis and Spatial Distribution

The collected data were analyzed for the descriptive statistics. Using IBM SPSS Statistic 25.0 software, the mean, standard deviation (SD), coefficient of variation (CV %), minimum and maximum were calculated. Additionally, the Mann–Whitney U test was used to study any variation in the normality of parameters at the 0.05% confidence level. Multivariate statistical methods, such as Spearman’s correlation analysis and the principal component analysis (PCA), were used to identify possible sources and groupings. The spatial distribution of the parameters in the study area was analyzed with ArcGIS, version 10.3 (ESRI, Redlands, CA, USA). A decision was made to follow the ordinary Kriging method to evaluate the spatial distribution in the study area of the selected study.

3. Results and Discussion

Table 2 shows the descriptive statistics of the dataset obtained from the monitored wells, which come in two groups, the first and second housings that form part of the HEC. Table 3 shows the microbiological data, where the highest values are reported in the groundwater from wells at homes. The results show that the waters of all the studied wells are beyond the limits recommended by current regulations for at least one hydrogeochemical variable. Water quality is affected mainly in the wells located in urbanized and agricultural areas.

3.1. pH, Alkalinity and Electrical Conductivity

The groundwater pH indicates a slight acidic condition, which may pose a consumption risk. As it is well known, at low pH, metals tend to go to solution and, thereby, make it readily available [49]. The average pH value was 5.18 which, for human consumption, goes beyond the acceptance range according to the Colombian Resolution 2115 of 2007. Its values are relatively homogeneous and have a general CV of 5.60%. These values are associated with the nature of the rocky materials in the area, but also with the nature of the acid of soils, and finally, with climatology [50,51]. The low pH of water in most samples cannot be attributed to sulfur or amino acid compounds from human and animal excreta.
The alkalinity results were heterogeneous, with a CV over 80%. The average value was 2.9 mg CaCO3/L, with a range between 0.27 and 12.30 mg CaCO3/L. The highest value was obtained in the HEC next to agricultural crops, which suggests that the influence was derived from adding fertilizers and salts, which are used to adapt and neutralize soil for cultivation and planting purposes. In any case, this parameter is far from the 200 mg CaCO3/L set out by the Colombian Resolution 2115 of 2007. The electrical conductivity (EC) values were within the permissible limit of 400–1250 µS/cm described by Mento [52]. For the three parameters, no significant difference was found in the groundwater values at households and the HEC after applying the Mann–Whitney U test at the 0.05 significance level. This parameter followed a similar pattern to those of TDS, TS, color and turbidity.

3.2. Chlorides, Electrical Conductivity and Hardness

The chloride values oscillated between 0 and 13.40 mg Cl/L. The CV over 100% was striking and, therefore, data were heterogeneous. The maximum value was obtained in the HEC near an area with a pool, where it is common to treat water with chlorides. This high chloride value coincided with the maximum conductivity value in the same area. On the contrary, the area with the maximum hardness value was in the crop area (6.00 mg CaCO3/L), a value influenced by minerals added to crop soils. However, the value of this parameter is acceptable (300 mg CaCO3/L) for Resolution 2115/2007. In this case, a significant difference (p > 0.05) was found between the HEC and the monitored households. No significant difference was found for chlorides and EC.

3.3. BOD, COD and Nitrates

The BOD results fell within the 0.54–2.05 range, with a wide CV (100%) and were, therefore, very heterogeneous. The fact that the highest value was in contact with soil substrates fosters an environment that encourages greater biological activity (Bifano et al., 2020). In any case, the values fell within the typical BOD range for groundwater (from 1 to 5 mg O₂/L) according to Moreno et al. [53]. Furthermore, in line with the WHO Drinking Water Standard, the BOD also coincided with the suggested range of 3–6 mg/L.
The maximum COD ranges were between 10 and 10.80 mg O₂/L. These values were below the 200 mg O₂/L level established in Resolution 631 de Vertimientos y Reuso de Aguas Residuales (Resolution about Dumping and Wastewater Reuse of 2015).
The nitrate content was between 0.06 and 5.28 mg NO3N/L, and the maximum was related to the application of fertilizers and pesticides in irrigation and horticulture areas, albeit in populated areas with septic tanks and infiltrations between underground networks [54,55,56]. In any case, the results were below the maximum value of 10 mg/L according to the Colombian Resolution 2115.
Drinking water supply should not exceed a COD value of 2.5 mg/L and any drinking water with a COD content of more than 7.5 mg/L is regarded as poor [57]. High COD interferes with oxygen transfer to soil and, thus, affects plant growth. Drinking water sources should have BOD values below 3 mg/L. If this value is exceeded, coagulation and rapid sand-filtration processes of conventional water treatment are adversely affected. For environmental conservation purposes, the BOD is set at less than 10 mg/L to prevent odors caused by anaerobic organic matter decomposition. Water with a BOD5 of less than 4 mg/L is of good quality, while levels above 10 mg/L are polluted, as reported by Environment Canada [58].

3.4. Microbiological Analysis

The average value of total coliforms around the HEC was 792.43 CFU/100 mL, while it was 4189.30 CFU/100 mL in the housing area with a CV of 20.36%, which was lower than that of the HEC. These results revealed that the groundwater in houses was contaminated with microbiological agents, which is probably associated with the deficient sanitation system in rural areas. Felista et al. [59], 2019, have indicated that wells should remain shut to prevent possible contaminating agents from accessing them, and chlorine compounds should be applied to guarantee water quality. According to Resolution 2115, coliforms and E. coli should be at 0 CFU/100 mL.
Coliform populations are indicators of pathogenic organisms. They should not be found in drinking water, but are usually present in surface water, soil and feces of humans and animals. Human waste contaminants in water cause waterborne diseases, such as diarrhea, typhoid and hepatitis [60,61]. High coliform populations in all water samples indicate poor sanitary conditions in a community. The inadequate and unhygienic solid waste managing in rural areas can generate high concentrations of microbial organisms. High coliform counts have proven characteristic of rural ground water quality in Nigeria, which is consistent with the works of other researchers who have worked on the bacteriological and chemical characteristics of rural water supplies in other parts of the country [61,62,63].

3.5. Spearman’s Coefficient Correlation

Positive and negative Spearman’s correlation coefficients were obtained for the water quality parameters. The results showed that parameters influenced one another. The Spearman’s coefficient results appear in Table 4, which expresses the correlation levels among the studied parameters, where a high correlation coefficient comes close to 1 (direct) and −1 (inverse), and indicates a good relation between two variables, while values close to 0 specify that there is no correlation between them at a significance level of p < 0.05 [64].
The Spearman coefficient of the HEC and households, respectively, is shown in Table 4. The EC-Cl, Total cols-Alk and Total cols-BOD5 couples showed high positive correlation; BOD5-Alk, Total Hardness-EC and Nitrate-EC showed high correlations significant with p < 0.01; and Nitrate-Cl (r = 0.95 **) were significantly correlated with p < 0.05 for the HEC wells. It is generally interpreted that the presence of these parameters in groundwater is usually the result of intense rainfall, which carries agricultural residue and rock minerals until effluents are recharged [64,65,66]. While in the households, the highest Alk-pH (0.88 **), EC-Cl (0.83 **) and Nitrate-EC (0.83 **) couples were significantly correlated with p < 0.01. This related to the deficient sanitation of underground water wells.

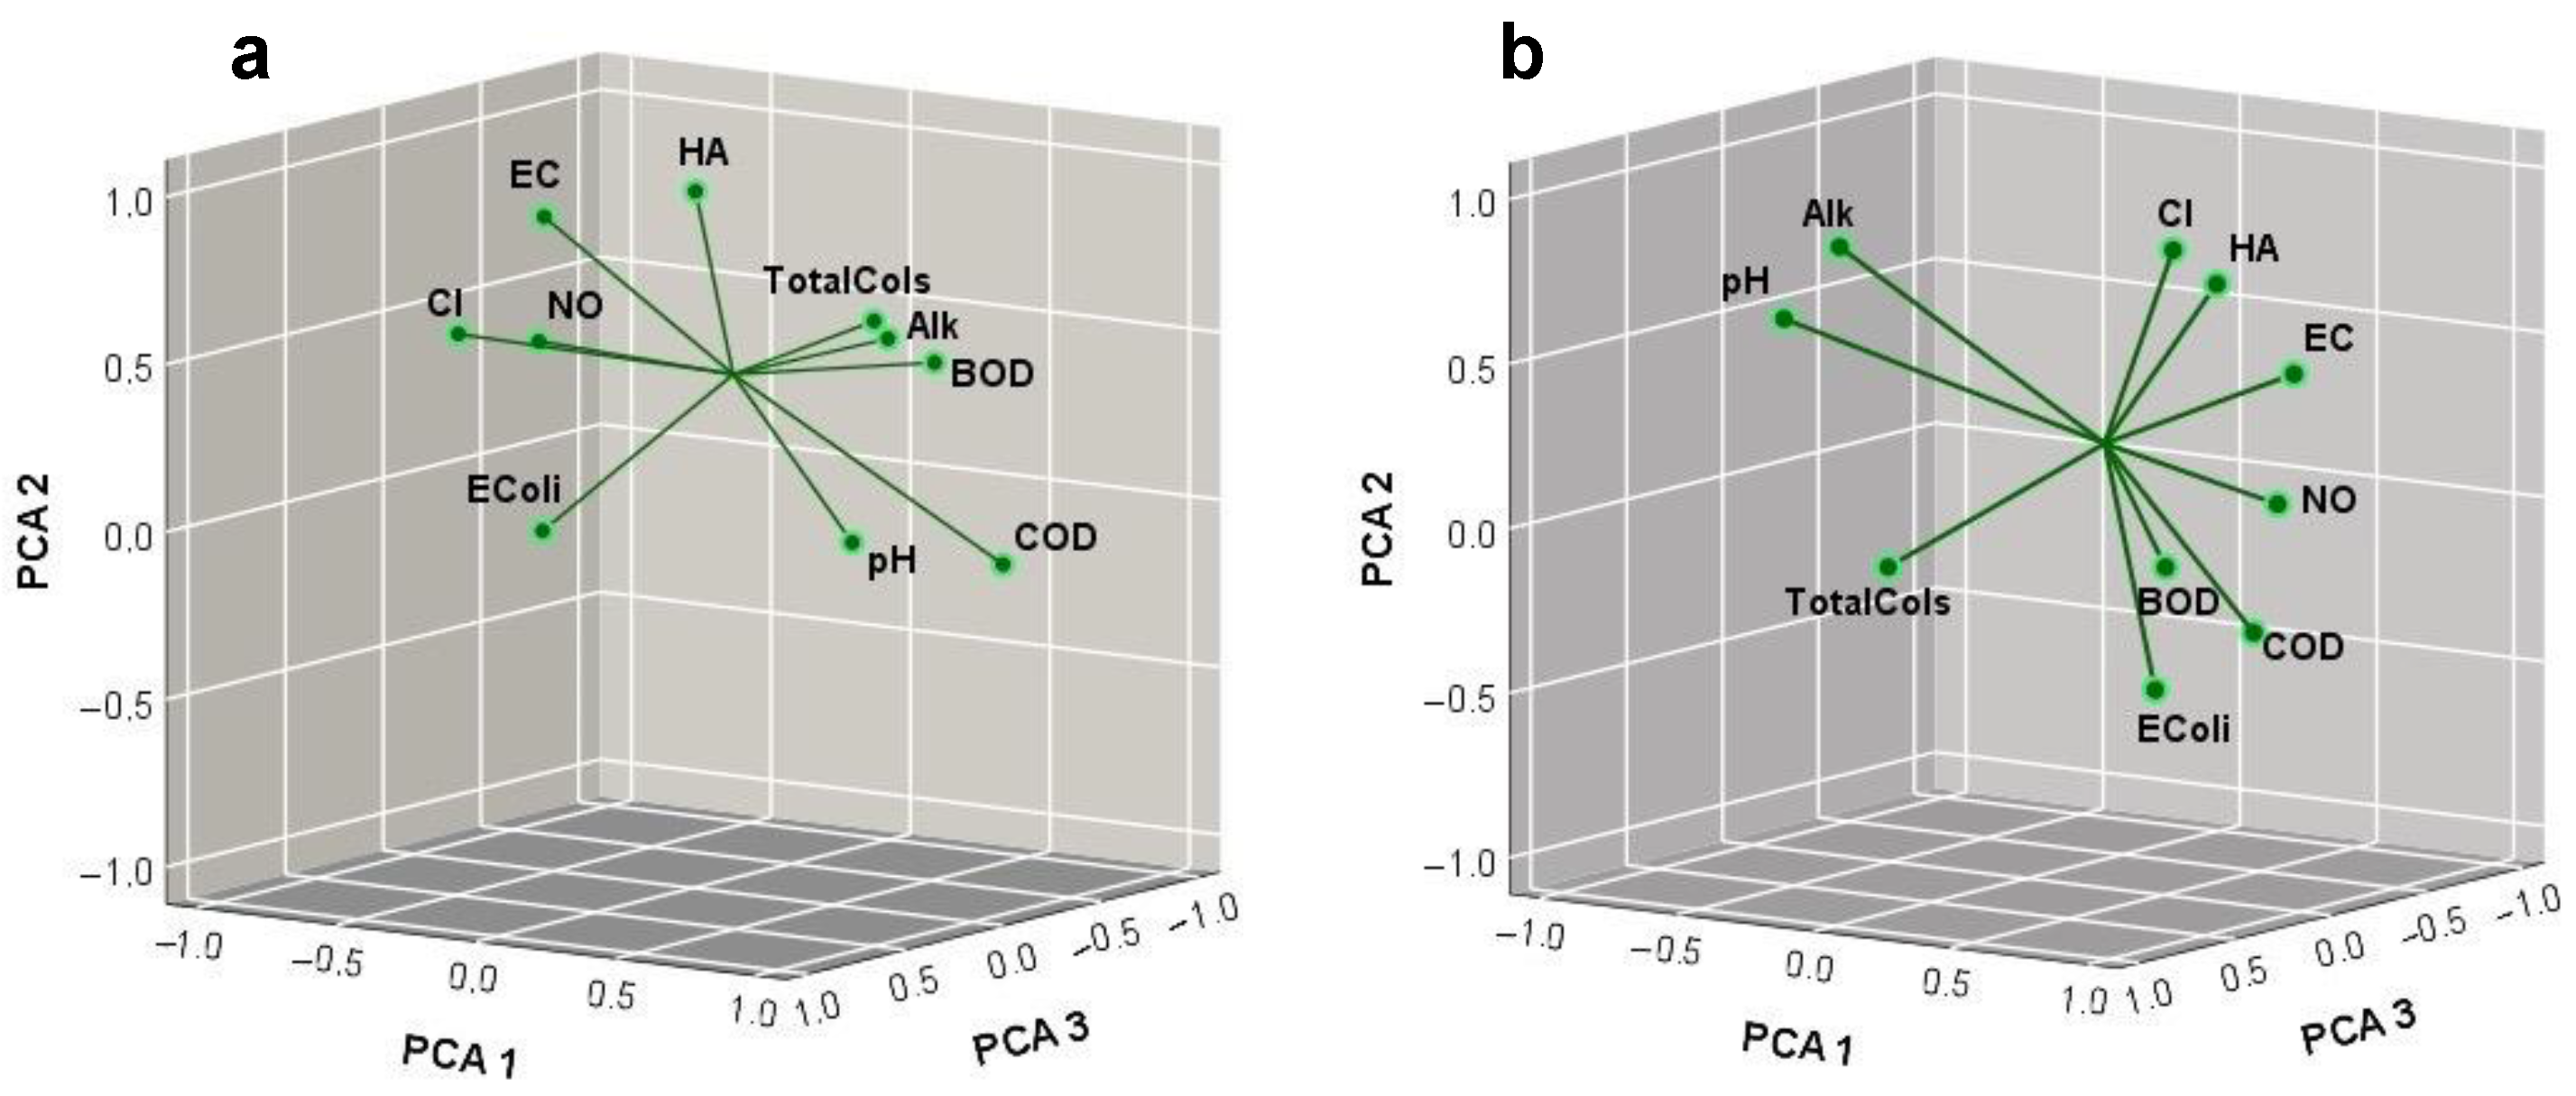
3.6. Principal Component Analysis (PCA)

The PCA of the groundwater samples is presented in Table 5, where the total variance of each component and the values obtained from the parameters in the extracted components are shown, with percentages that represent the amount of information that can explain the method of the analyzed data. From the varimax PCA, four factors with 85.7% of the explained variance were identified. Factor 1, which represented 35.8% of the variance, was characterized by significant loadings for nitrates (0.952), conductivity (0.841), total hardness (0.700), E. coli (0.684) and negative pH charge (−0.682). This factor could represent mixed pollution sources from waste dump leachates, industrial effluent, agricultural run-off and septic tanks [67,68]. Obviously, E. coli indisputably indicates fecal contamination and, potentially, ammonium was also found in feces as a result of the proximity of some cisterns available for wastewater [69] altering.
Table 5 and Figure 2 show that the HEC PC1 was strongly dominated by the alkalinity (0.77), BOD (0.76), pH (0.74), COD (0.64) and total cols (0.57), which indicates that groundwater quality is influenced by the activities that take place on campus, while in the households, the PC1 was dominated by NO3 (0.97), EC (0.84), BOD (0.80), E. coli (0.75) and total hardness (0.60). While in the PC2 for the HEC, the Cl, EC and total hardness are the ones that dominate and, in the households, the dominant in the PC2 is Cl (0.82) used as a mechanism to improve the water quality. Finally, the PC3 in the HEC is dominated by E. coli and in total cols (0.91) in households. In general, the results show that the quality of water in homes is associated with poor sanitation caused by contamination.

3.7. Analysis of the Water Quality Index

Obviously, water quality varies according to the type of use, and can even vary from time to time and from region to region. Currently, employing quality indices in ecosystem monitoring programs provides information about environmental status [70,71]. WQIs have been used for evaluation and communication purposes in agri-environmental policies [72]. Many indices have been developed in past decades and display water quality with a single value by comparing different parameters as per standards. Since Horton proposed the first WQI index in 1965, and a little later the weighted average WQI was developed by Brown et al. (1970), many others have followed. Such indices are the Canadian Council of Ministers of the Environment Water Quality Index (CCMEwqi) [73], the British Columbia Water Quality Index (BCWQI), the Oregon Water Quality Index (OWQI) [74,75] and the weighted average WQI developed by Brown et al. [76].
Table 6 shows the classification for all five uses of water resources following the Dinius criteria. The results obtained with the Dinius Quality Index (DQI) are shown in Table 7, where sampling points and the calculated DQI value and its corresponding classification are seen. The quality index is relatively varied, and in such a way that areas such as swimming pools and sports obtained 77.154, which is an excellent value for recreational uses. The agricultural area with 74.067 and livestock with 72.625 obtained an acceptable valuation. Therefore, it can be concluded that treatments are applied according to the needs contemplated in uses. However, some areas with agronomic facilities obtained a value of 62.499, which communicates a regular drinking use character. Thus, it is necessary to avoid water intake at these points and, if possible, to apply corrective actions to improve quality. Although in inhabited areas (homes) recreational water use was between excellent and acceptable, in these areas water intake should be avoided because all the samples from homes had an index of ≤80, which is attributed to the high values presented by the microbiological parameters. We ought to remember that these parameters for the Dinius method have a strong influence when calculating the index.
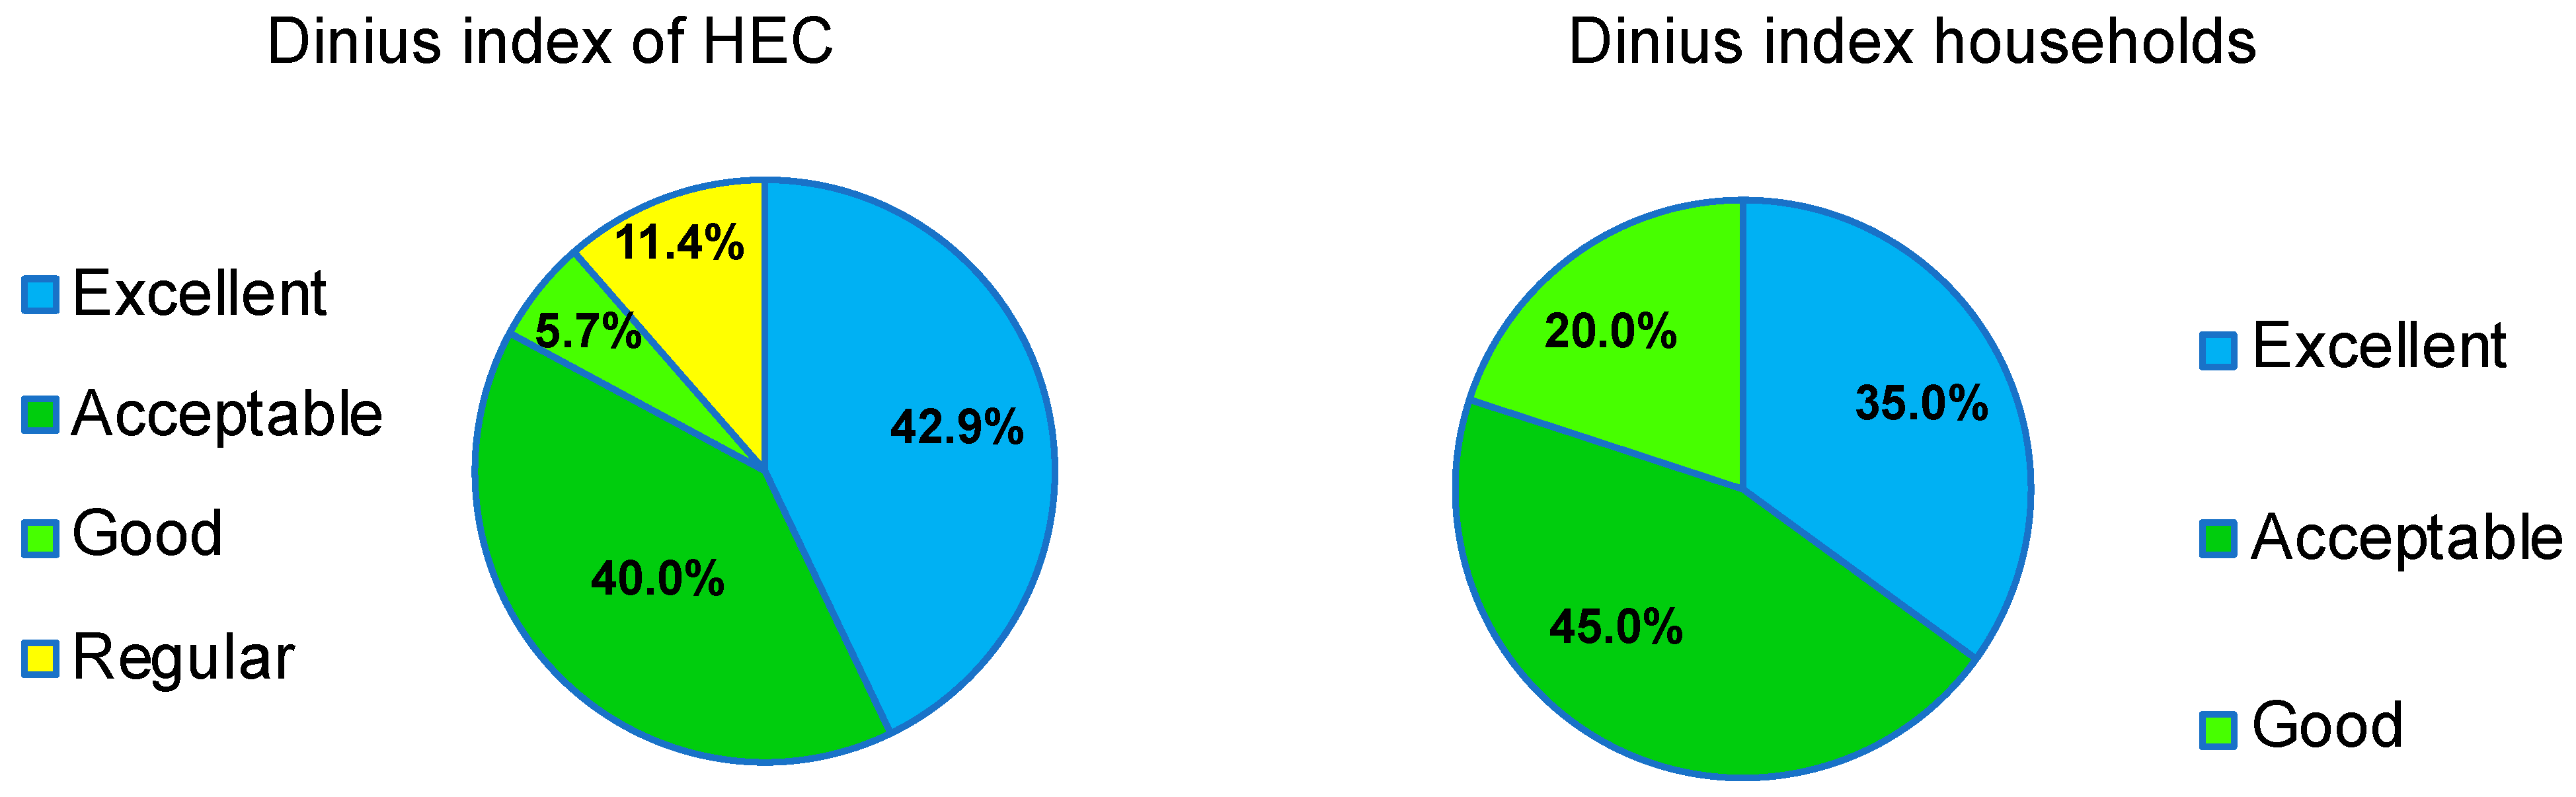
The application of the DQI pointed out that most of the water samples in the HEC entered the “Excellent” category with 42.9% (for recreation and fishing and aquatic life activities), while 40% is classifiable as “Acceptable” and 5.7% as “Good” if use is related to industry and agriculture activities. Only 11.4% were “Regular” for drinking water. Conversely, in households, the “Acceptable” category predominated with 36%, where the indices qualified for use in agricultural and industrial activities that require light conditioning treatments. In this group, they were qualified in the “Excellent” category with 28% for recreation and fishing and aquatic life activities, followed not very far behind in third place by drinking water and 20% for the “Regular” water quality category. Finally, ranges were “Good” with 16% of the total (Figure 3).

4. Conclusions

The present study evaluates the groundwater quality of a typical rural settlement in Colombia. From the obtained results, it can be concluded that the pH of the studied samples is acidic, which is attributed to the natural factors of the region, particularly the type of geological, climatic and edaphic formations. These values are not valid for human consumption according to the Colombian Resolution 2115 of 2007. Therefore, one suggestion is to monitor groundwater accordingly. Chlorides play a fundamental role at the points that receive chlorination treatments and, therefore, inhibit bacterial growth. The alkalinity, hardness and nitrate parameters are associated mainly with sowing and cultivation areas, and although they are agricultural areas, they fall within the maximum limit accepted by the aforementioned Resolution. Likewise, the conductivity values are immersed in areas where chloride and hardness obtain significant results, which is very valuable when detecting areas where incrustation and corrosion problems could be manifested in pipes.
Spearman’s analysis reveals that the correlation coefficient with the highest level of significance is that related to nitrates and conductivity, and is evidence that agricultural and livestock activities bring about silent groundwater contamination. Certainly, conductivity also significantly correlates with chlorides and hardness which, in turn according to the PCA, are associated with E. coli and pH. In fact, these parameters contribute the most information to understand the study of cisterns in the rural community.
The application of a quality index leads to the conclusion about the potential that water from wells have to achieve excellent and acceptable qualities for agricultural, industrial, recreational and fishing activities and aquatic life. However, drinking water is regular. Hence the need to set up adequate treatments for suitable human consumption.

Author Contributions

G.J.H.-M., J.M.T.-G., M.A.T.-M. and R.J.-B. conceived and designed this study; G.J.H.-M., J.I.R.-P. and Y.L.Z.-M. participated in the collection of water samples; software, J.I.R.-P., G.J.H.-M., J.M.T.-G. and F.J.G.-N.; formal analysis, G.J.H.-M., J.I.R.-P., Y.L.Z.-M., J.M.T.-G. and M.A.T.-M.; writing—original draft preparation, F.J.G.-N., R.J.-B. and J.M.T.-G.; writing—review and editing, all authors. All authors have read and agreed to the published version of the manuscript.

Funding

This research was funded by the Dirección General de Investigaciones (Universidad de los Llanos/2022-I) and the Centro de Calidad de Aguas of the Instituto de Ciencias Ambientales de la Orinoquia Colombiana ICAOC.

Data Availability Statement

Not applicable.

Acknowledgments

The authors are grateful to the Dirección General de Investigaciones of the Universidad de los Llanos, and to the Instituto de Ciencias Ambientales de la Orinoquía Colombiana (ICAOC).

Conflicts of Interest

The authors declare no conflict of interest.

References

  1. Ibrahimova, M. Depth: Groundwater: A Remedy for Water Crises. UNESCO Cour. 2022, 2, 46–49. [Google Scholar] [CrossRef]
  2. Goyal, V.; Dharwal, M. SDGs Laid Down by UN 2030 Document. In Deep Learning Technologies for the Sustainable Development Goals; Kadyan, V., Singh, T.P., Ugwu, C., Eds.; Springer: Singapore, 2023. [Google Scholar] [CrossRef]
  3. Mohamed, A.K.; Dan, L.; Kai, S.; Mohamed, M.A.; Aldaw, E.; Elubid, B.A. Hydrochemical analysis and fuzzy logic method for evaluation of groundwater quality in the North Chengdu Plain, China. Int. J. Environ. Res. Public Health 2019, 16, 302. [Google Scholar] [CrossRef] [PubMed]
  4. Pahl-Wostl, C. The role of governance modes and meta-governance in the transformation towards sustainable water governance. Environ. Sci. Policy 2019, 91, 6–16. [Google Scholar] [CrossRef]
  5. Reymond, P.; Chandragiri, R.; Ulrich, L. Governance arrangements for the scaling up of small-scale wastewater treatment and reuse systems–lessons from India. Front. Environ. Sci. 2020, 8, 72. [Google Scholar] [CrossRef]
  6. Rey Santos, O. El Agua en un Mundo en Crisis Revista de Estudios Estratégicos, No.1.; Centro de Investigaciones de Política Internacional: La Habana, Cuba, 2014. [Google Scholar]
  7. Barranco, A. El Agua Subterránea y su Importancia Socioambiental. In Agua: Tesoro Subterráneo; El Colegio de San Luis: San Luis, Mexico, 2018; pp. 16–21. [Google Scholar]
  8. Fernández-Cirelli, A. Programa Futuros: Escuela de Posgrado: Agua + Humedales. In El Agua en Latinoamérica; Universidad Nacional de San Martín y Fundación Innovación Tecnológica (FUNINTEC): Buenos Aires, Argentina; UNSAM: Buenos Aires, Argentina, 2018; ISBN 978-987-4027-68-9. [Google Scholar]
  9. Aderemi, B.A.; Olwal, T.O.; Ndambuki, J.M.; Rwanga, S.S. A review of groundwater management models with a focus on IoT-based systems. Sustainability 2022, 14, 148. [Google Scholar] [CrossRef]
  10. Chandnani, G.; Gandhi, P.; Kanpariya, D.; Parikh, D.; Shah, M. A comprehensive analysis of contaminated groundwater: Special emphasis on nature-ecosystem and socio-economic impacts. Groundw. Sustain. Dev. 2022, 19, 100813. [Google Scholar] [CrossRef]
  11. Peña, H. Recursos Naturales y Desarrollo. CEPAL—Serie Recursos Naturales e Infraestructura N 178. In Desafíos de la Seguridad Hídrica en América Latina y el Caribe; Digital Repository: Santiago, Chile, 2016; ISSN 1680-9017. [Google Scholar]
  12. Del Valle-Melendo, J. El Agua, un Recurso Cada Vez Más Estratégico. In Cuadernos de Estrategia; paper edition; Ministerio de Defensa: Madrid, Spain, 2017; Volume 186, pp. 71–118. [Google Scholar]
  13. UNESCO, ONU-Agua. Informe Mundial de las Naciones Unidas Sobre el Desarrollo de los Recursos Hídricos 2020: Agua y Cambio Climático; UNESCO: París, France, 2020; Available online: https://unesdoc.unesco.org/ark:/48223/pf0000373611.locale=es (accessed on 17 June 2020).
  14. Salazar, C.E. Structural Precariousness in Self-Managed Settlements in Cities of Latin America and the Caribbean. In The Routledge Handbook of Urban Studies in Latin America and the Caribbean; Routledge: London, UK, 2023; pp. 286–317. [Google Scholar]
  15. World Health Organization. Progress on Household Drinking Water, Sanitation and Hygiene 2000–2020: Five Years into the SDGs; WHO: Geneva, Switzerland, 2021.
  16. Mejía, A.; Castillo, O.; Vera, R. Desafíos de la seguridad hídrica en América Latina y el Caribe: Políticas públicas para la gestión de las interconexiones entre agua, energía y alimentación. In CEPAL—Serie Recursos Naturales e Infraestructura N 178; Digital Repository: Santiago, Chile, 2016; SSN 1680–9017. [Google Scholar]
  17. Reay, W.G. Septic tank impacts on ground water quality and nearshore sediment nutrient flux. Groundwater 2004, 42, 1079–1089. [Google Scholar] [CrossRef]
  18. Mester, T.; Balla, D.; Karancsi, G.; Bessenyei, É.; Szabó, G. Effects of nitrogen loading from domestic wastewater on groundwater quality. Water SA 2019, 45, 349–358. [Google Scholar] [CrossRef]
  19. Janža, M.; Prestor, J.; Pestotnik, S.; Jamnik, B. Nitrogen mass balance and pressure impact model applied to an urban aquifer. Water 2020, 12, 1171. [Google Scholar] [CrossRef] [Green Version]
  20. Devic, G.; Djordjevic, D.; Sakan, S. Natural and anthropogenic factors affecting the groundwater quality in Serbia. Sci. Total Environ. 2014, 468, 933–942. [Google Scholar] [CrossRef]
  21. Bugajski, P.M.; Kurek, K.; Młyński, D.; Operacz, A. Designed and real hydraulic load of household wastewater treatment plants. J. Water Land Dev. 2019, 40, 155–160. [Google Scholar] [CrossRef]
  22. Stigter, T.Y.; Ribeiro, L.; Dill, A.C. Application of a groundwater quality index as an assessment and communication tool in agro-environmental policies–two Portuguese case studies. J. Hydrol. 2006, 327, 578–591. [Google Scholar] [CrossRef]
  23. Balla, D.; Zichar, M.; Tóth, R.; Kiss, E.; Karancsi, G.; Mester, T. Geovisualization techniques of spatial environmental data using different visualization tools. Appl. Sci. 2020, 19, 6701. [Google Scholar] [CrossRef]
  24. Assmus, G.; Ortiz, A. Agua, Pobreza y Equidad: Un Análisis Asimétrico. Rev. Lat. Bioética 2015, 15, 90–99, ISSN 1657–4702. Available online: https://www.redalyc.org/articulo.oa?id=127033012008 (accessed on 1 December 2022).
  25. Cardona, A.; Gil, A.; Reyes, H.; Márquez, L. Disponibilidad y Uso Eficiente de Agua en Zonas Rurales. In Investigación y Ciencia; Universidad Autónoma de Aguascalientes: Aguascalientes, México, 2014; Volume 22, pp. 67–73, ISSN 1665-4412; Available online: https://www.redalyc.org/articulo.oa?id=67435407008 (accessed on 1 December 2022).
  26. Ordoñez, J. El agua y el sector rural en Colombia. Rev. Ing. 2020, 49, 10–17. Available online: https://revistas.uniandes.edu.co/doi/full/10.16924/revinge.49.3 (accessed on 1 December 2022). [CrossRef]
  27. Delgado-García, S.; Trujillo-González, J.; Torres-Mora, M. Gestión del agua en comunidades rurales; caso de estudio cuenca del río Guayuriba, Meta—Colombia. Luna Azul 2017, 45, 59–70. [Google Scholar] [CrossRef]
  28. Aguirre, M.; Buitrago, O.; Guillermo, A. Efectos de actividades humanas extractivas y servicios recreativos sobre la calidad del agua. Rev. De Gestión Soc. Y Ambient. 2021, 14, 82–104, ISSN 1981–982X. [Google Scholar] [CrossRef]
  29. Mautner, M.; Escobar, M. Abastecimiento de Agua Rural en Chiquitania; Stockholm Environment Institute: Stockholm, Sweden, 2022. [Google Scholar]
  30. Vargas-Pineda, O.I.; Trujillo-González, J.M.; Torres-Mora, M.A. Supply–demand of water resource of a basin with high anthropic pressure: Case study Quenane-Quenanito Basin in Colombia. Air Soil Water Res. 2020, 13, 1178622120917725. [Google Scholar] [CrossRef]
  31. Peng, Y.; Rongrong, H.; Danping, L.; Rongfang, Y.; Fei, W.; Zhongbing, C.; Beihai, Z.; Huilun, C. Nitrogen removal from rural domestic wastewater by subsurface wastewater infiltration system: A review. Process Saf. Environ. Prot. 2022, 159, 309–322, ISSN 0957-5820. [Google Scholar] [CrossRef]
  32. Piguave-Reyes, J.M.; Castellano-González, M.J.; Macías-Avia, A.M.; Vite-Solórzano, F.A.; Ponce-Pibaque, M.D.; Avila-Ávila, J.A. Calidad microbiológica del agua subterránea como riesgo epidemiológico en la producción de enfermedad diarreica infantil. Revisión Sistemática. Zenodo 2019, 47, 153–173. [Google Scholar] [CrossRef]
  33. Ríos-Tobón, S.; Agudelo-Cadavid, R.M.; Gutiérrez-y Builes, L.A. Patógenos e indicadores microbiológicos de calidad del agua para consumo humano. Rev. Fac. Nac. Salud Pública 2017, 35, 236–247. [Google Scholar] [CrossRef]
  34. Sabale, R.; Venkatesh, B.; Jose, M. Sustainable water resource management through conjunctive use of groundwater and surface water: A review. Innov. Infrastruct. Solut. 2023, 8, 17. [Google Scholar] [CrossRef]
  35. Sunkari, E.D.; Abangba, T.; Ewusi, A.; Tetteh, S.E.K.; Ofosu, E. Hydrogeochemical evolution and assessment of groundwater quality for drinking and irrigation purposes in the Gushegu Municipality and some parts of East Mamprusi District, Ghana. Environ. Monit. Assess. 2023, 195, 1–25. [Google Scholar] [CrossRef] [PubMed]
  36. IGAC. General Study of Soils and Land Zoning of Meta. In General Study; Agustín Codazzi Geographic Institute: Bogotá, Colombia, 2004. [Google Scholar]
  37. IDEAM. Características climatológicas, medias mensuales de Villavicencio. In Subdirección de Meteorología; (IDEAM) Instituto De Hidrología Meteorología Y Estudios Ambientales: Bogotá, Colombia, 2022. Available online: https://bart.ideam.gov.co/cliciu/villao/temperatura.htm (accessed on 13 January 2023).
  38. DANE. Tercer Censo Nacional Agropecuario; Departamento Administrativo Nacional de Estadística: Bogotá, Colombia, 2014. Available online: https://www.dane.gov.co/index.php/estadisticas-por-tema/agropecuario/censo-nacional-agropecuario-2014#1 (accessed on 12 January 2023).
  39. Trujillo-González, J.M.; Torres-Mora, M.A.; Jiménez-Ballesta, R.; Brevik, E.C. Spatial variability of the physicochemical properties of acidic soils along an altitudinal gradient in Colombia. Environ. Earth Sci. 2022, 81, 108. [Google Scholar] [CrossRef]
  40. Cormacarena; Ecopetrol, S.A. Modelo hidrogeológico conceptual de aguas subterráneas, en el área de influencia de la superintendencia de operaciones central en el departamento del Meta. diseño e inicio de la implementación de la red de monitoreo de aguas subterráneas en los municipios de Villavicencio, Acacías, Guamal y Castilla la Nueva, para la formulación del plan de manejo; In Final Report; Repository Villavicencio: Villavicencio, Colombia, 2012; p. 180. [Google Scholar]
  41. Soil Survey Staff. Key to Soil Taxonomy, 12th ed.; USDA-Natural Resources, Conservation Service: Washington DC, USA, 2014; p. 379.
  42. American Public Health Association. Standard Methods for Examination of Water and Wastewater, 23rd ed.; APHA, AWWA, WPCF: Washington, USA, 2017.
  43. Zhang, F.; Huang, G.; Hou, Q.; Liu, C.; Zhang, Y.; Zhang, Q. Groundwater quality in the Pearl River Delta after the rapid expansion of industrialization and urbanization: Distributions, main impact indicators, and driving forces. J. Hydrol. 2019, 577, 124004. [Google Scholar] [CrossRef]
  44. Gaikwad, S.; Ajaykumar, K.; Kadam, R.; Ramgir, S.; Kashikar, M.; Wagh, M.; Kandekar, P.; Gaikwad, B.; Madale, J.; Pawar, D. Assessment of the groundwater geochemistry from a part of the west coast of India using statistical methods and water quality index. Hydro Res. 2020, 3, 46–48. [Google Scholar] [CrossRef]
  45. Santana de Almeida, R.A.; Brandão de Oliveira, L. Groundwater quality index (E-IQUAS): Application to communicate the water status in two case studies—Camaçari (BA) and Verdelândia (MG) Underground waters. Rev. Águas Subterr. 2017, 31, 88–103. [Google Scholar]
  46. Poonam, T.; Tanushree, B.; Sukalyan, C. Water quality indices important tools for water quality assessment: A review. International. J. Adv. Chem. 2013, 1, 15–28. [Google Scholar]
  47. Venkatramanan, S.; Chung, S.Y.; Selvam, S.; Lee, S.Y.; Elzain, H.E. Factors controlling groundwater quality in the Yeonjegu District of Busan City, Korea, using the hydrogeochemical processes and fuzzy GIS. Environ. Sci. Pollut. Res. 2017, 24, 23679–23693. [Google Scholar] [CrossRef]
  48. Dinius, S.H. Social accounting system for evaluating water resources. Water Resour. Res. 1972, 8, 1159–1177. [Google Scholar] [CrossRef]
  49. EPA. Environmental Chemistry, Transport and Fate 2003. Available online: https://www.epa.gov/raf/metalsframework/pdfs/chaper3.pdf (accessed on 18 August 2014).
  50. Owamah, H.I. Assessment of groundwater quality properties in a university sub-urban community in Delta State, Nigeria: Part b-correlation analysis and household water treatment adoption. J. Appl. Sci. Environ. Manag. 2019, 23, 469–474. [Google Scholar] [CrossRef]
  51. Sojobi, A.O. Evaluation of groundwater quality in a rural community in North Central of Nigeria. Environ. Monit. Assess. 2016, 188, 192. [Google Scholar] [CrossRef] [PubMed] [Green Version]
  52. Mento d I’exploitant de Leauet del I’assainissesment; Lyonnaise Deseaux: Paris, France, 1980; pp. 273–283.
  53. Moreno, L.; Liquiñano, M.C.; Rubio, J.C.; Murillo, J.M. Eliminación de aguas residuales urbanas mediante infiltración directa sobre el terreno. Impacto sobre el sistema solución del suelo-agua subterránea. Boletín Geol. y Minero 2000, 111, 47–62, ISSN 0366-0176. [Google Scholar]
  54. Adimalla, N. Controlling factors and mechanism of groundwater quality variation in semiarid region of South India: An approach of water quality index (WQI) and health risk assessment (HRA). Environ. Geochem. Health 2019, 6, 1725–1752. [Google Scholar] [CrossRef] [PubMed]
  55. Khan, N.; Malik, A.; Nehra, K. Groundwater hydro-geochemistry, quality, microbiology and human health risk assessment in semi-arid area of Rajasthan, India: A chemometric approach. Environ. Monit. Assess. 2021, 193, 234. [Google Scholar] [CrossRef]
  56. Hassan, A.M.; Firat-Ersoy, A. Statiscal assessment of seasonal variation of groundwater quality in Carsamba coastal plain, Samsin (Turkey). Environ. Monit. Assess. 2022, 194, 135. [Google Scholar] [CrossRef]
  57. Esa, R. Drilled Wells and Groundwater in the Precambrian Crystalline Bedrock of Finland, 52; Water Research Institute: Helsinki, Finland, 1983; p. 57. [Google Scholar]
  58. Environment Canada. Analytical Methods Manual. In Inland Water Directorate, Part 1–5; Water Quality Branch: Ottawa, Canada, 1979. [Google Scholar]
  59. Felistas, M.; Mhosisi, M.; Sherpherd, M. Groundwater quality assessment using a water quality index and GIS: A case of Ushewokunze Settlement, Harare, Zimbabwe. Phys. Chem. Earth 2019, 112, 134–140. [Google Scholar] [CrossRef]
  60. Root, J.; Graveland, A.; Schultink, L.J. Consideration of organic matter in drinking water treatment. Water Res. 1982, 16, 113–122. [Google Scholar]
  61. Esry, S.A.; Habicht, J.P. Epidemiologic evidence for health benefits from improved water and sanitation in developing countries. Epidemiol. Rev. 1986, 8, 117–128. [Google Scholar] [CrossRef]
  62. Asubiojo, O.I.; Nkono, N.A.; Ogunsua, A.O.; Oluwole, A.F.; Wardi, N.I.; Akanle, O.A.; Spyrou, N.M. Trace elements in drinking and groundwater samples in southern Nigeria. Sci. Total Environ. 1997, 208, 1–8. [Google Scholar] [CrossRef]
  63. Sangodoyin, A.Y. Considerations on contamination of groundwater by waste disposal systems in Nigeria. Environ. Technol. 1993, 14, 957–964. [Google Scholar] [CrossRef]
  64. Amadi, P.A.; Ofoegbu, C.O.; Morrison, T. Hydrogeochemical assessment of groundwater quality in parts of the Niger Delta, Nigeria. Environ. Geol. Water Sci. 1989, 14, 195–202. [Google Scholar] [CrossRef]
  65. Kumar, M.; Ramanathan, A.L.; Rao, M.S.; Kumar, B. Identification and evaluation of hydrogeochemical processes in the groundwater environment of Delhi, India. Environ. Geol. 2006, 50, 1025–1039. [Google Scholar] [CrossRef]
  66. Soro, T.D.; Soro, G.; Ahoussi, K.E.; Oga, Y.M.S.; Soro, N. Hydrogeochemical and groundwater quality studies in the High Bandama Watershed at Tortiya (Northern of Côte d’Ivoire). J. Geosci. Environ. Prot. 2019, 7, 49–61. [Google Scholar]
  67. Shakya, B.M.; Nakamura, T.; Kamei, T.; Shrestha, S.D.; Nishida, K. Seasonal groundwater quality status and nitrogen contamination in the shallow aquifer system of the Kathmandu Valley, Nepal. Water 2019, 11, 2184. [Google Scholar] [CrossRef] [Green Version]
  68. Wakida, F.T.; Lerner, D.N. Non-agricultural sources of groundwater nitrate: A review and case study. Water Res. 2005, 39, 3–16. [Google Scholar] [CrossRef]
  69. Rusydi, A.F.; Onodera, S.I.; Saito, M.; Ioka, S.; Maria, R.; Ridwansyah, I.; Delinom, R.M. Vulnerability of groundwater to iron and manganese contamination in the coastal alluvial plain of a developing Indonesian city. SN Appl. Sci. 2021, 3, 399. [Google Scholar] [CrossRef]
  70. Tiwari, A.K.; Singh, P.K.; Singh, A.K.; De Maio, M. Estimation of heavy metal contamination in groundwater and development of a heavy metal pollution index by using GIS technique. Bull. Environ. Contam. Toxicol. 2016, 96, 508–515. [Google Scholar] [CrossRef]
  71. Bilgin, A. Evaluation of surface water quality by using Canadian Council of Ministers of the Environment Water Quality Index (CCME WQI) method and discriminant analysis method: A case study Coruh River Basin. Environ. Monit. Assess. 2018, 190, 554. [Google Scholar] [CrossRef]
  72. Alobaidy, A.H.; Maulood, B.K.; Kadhem, A.J. Evaluating raw and treated water quality of Tigris River within Baghdad by index analysis. J. Water Resour. Prot. 2010, 2, 629. [Google Scholar] [CrossRef]
  73. Lumb, A.; Halliwell, D.; Sharma, T. Application of CCME Water Quality Index to monitor water quality: A case study of the Mackenzie River basin, Canada. Environ. Monit. Assess. 2006, 113, 411–429. [Google Scholar] [CrossRef] [PubMed]
  74. Debels, P.; Figueroa, R.; Urrutia, R.; Barra, R.; Niell, X. Evaluation of water quality in the Chillán River (Central Chile) using physicochemical parameters and a modified water quality index. Environ. Monit. Assess. 2005, 110, 301–322. [Google Scholar] [CrossRef] [PubMed]
  75. Kannel, P.R.; Lee, S.; Lee, Y.S.; Kanel, S.R.; Khan, S.P. Application of water quality indices and dissolved oxygen as indicators for river water classification and urban impact assessment. Environ. Monit. Assess. 2007, 132, 93–110. [Google Scholar] [CrossRef] [PubMed]
  76. Brown, R.M.; McClelland, N.I.; Deininger, R.A.; Tozer, R.G. A water quality index-do we dare. Water Sew. Work. 1970, 117, 339–343. [Google Scholar]
Figure 1. Location of the studied rural settlement (Villavicencio) in Colombia.
Water 15 00667 g001
Figure 2. Spatial distribution of components. (a) HEC and (b) Households.
Water 15 00667 g002
Figure 3. Percentage of the Dinius Quality Index based on the two established groups: HEC and households.
Water 15 00667 g003
Table 1. Physico-chemical and microbiological methods conducted for groundwater samples analyses.
Variables or ParametersMethodsLower Limit of Detection (LLOD)
Dissolved oxygen (mg O₂/L)SM 4500-O, H0.1
pH (units of pH)SM 4500 H+ BNA
Water temperature (°C)SM 2550 BNA
Ambient temperature (°C)NANA
Total alkalinity (mg CaCO3/L)SM 2320 B1.0
Chlorides (mg Cl/L)SM 4500 B2.0
Conductivity (μS/cm)SM 2510 B0.01
Temperature (°C)NA
BOD5 (mg O₂/L)SM 5210 B Y SM 4500-O, H4.0
COD (mg O₂/L)SM 5220 C20.0
Total hardness (mg CaCO3/L)SM 2340 C1.0
Nitrates (mg NO3N/L)ISO 7890-30.11
Nitrites (mg NO2N/L)SM 4500 NO₂ B0.03
Total coliforms (CFU/100 mL)SM 9222 J0.0
Escherichia coli (CFU/100 mL)SM 9222 J0.0
SM = Standard methods [42]; NA = not applicable.
Table 2. Descriptive statistics of the dataset obtained from the monitored wells in a rural settlement.
LocationStatisticspHAlk mg/L as CaCO3Chlorides, mg/LEC (μs/cm)DBO5 (mg O₂/L)DQO (mg O₂/L)Hardness, mg/L as CaCO3NO3 mg/L
HECMean5.3 a3.63 a2.84 a38.05 a0.54 a5.8 a3.2 a1.07 a
SD0.284.44.7722.560.74.262.171.09
Min4.940.2709.1300.620.240.06
Max5.6712.313.478.12.051062.64
CV %5.28121.21167.9659.29129.6373.4567.81101.87
HouseholdsMean5.09 a2.4 a1.33 a43.08 a0.55 a3 a9 b1.76 a
SD0.271.941.5323.760.564.454.81.54
Min4.690.29016.50.0802.630.19
Max5.545.593.8382.72.0710.816.15.28
CV %5.3080.83115.0455.15101.82148.3353.3387.50
OverallN1717171717171717
Mean5.182.91.9541.010.554.166.631.47
SD0.293.123.2322.690.64.474.821.38
Min4.690.2709.13000.240.06
Max5.6712.313.482.72.0710.816.15.28
CV %5.60107.59165.6455.33109.09107.4572.7093.88
The means identified with the same letter do not present a significant difference at a confidence level of p > 0.05.
Table 3. Results of the descriptive statistics of the microbiological parameters.
LocationStatisticsCol. T (CFU/100 mL)E. coli (CFU/100 mL)
Higher education center (HEC)mean792.43 a107.43 a
SD793.53281.15
Min0.000.00
Max1810.00745.00
CV %100.14261.71
HouseholdsMean4189.30 b579.30 b
SD3342.28911.69
Min95.000.00
Max8540.002320.00
CV %79.78157.38
OverallMean2790.59385.00
SD3080.46744.64
Min00
Max85402320
CV %110.39193.41
The means identified with the same letter do not present a significant difference at a confidence level of p > 0.05.
Table 4. Spearman’s coefficient between the physico-chemical and microbiological parameters of the higher education center (HEC) and households.
LocationParameterspHAlkClECBOD5CODHardNO3ColTE. coli
HECpH1.000
Alkalinity0.6431.000
Chlorides−0.595−0.2521.000
EC−0.2860.1790.7211.000
BOD50.2910.873 *−0.2290.1451.000
COD0.2340.378−0.400−0.2520.3671.000
Total hardness0.0710.3930.3060.857 *0.327−0.2521.000
Nitrates−0.714−0.5000.955 **0.607−0.436−0.3780.1791.000
Total cols0.4290.714−0.2520.1790.764 *0.3600.464−0.3571.000
E. coli0.1780.4900.4490.2670.431−0.0220.1340.2670.4451.000
HouseholdspH1.000
Alkalinity0.887 **1.000
Chlorides0.0500.2541.000
EC−0.267−0.1220.832 **1.000
BOD5−0.174−0.2380.1570.0431.000
COD−0.5620-.705 *−0.1760.089−0.0921.000
Total hardness−0.0120.1700.769 **0.758 *0.225−0.0681.000
Nitrates−0.547−0.4010.669 *0.830 **0.3100.1780.5761.000
Total cols−0.091−0.036−0.038−0.0060.377−0.259−0.030−0.1151.000
E. coli−0.596−0.614−0.131−0.0300.4740.137−0.3210.2240.648 *1.000
** correlation is significant at the 0.01 level (bilateral); * correlation is significant at the 0.05 level (bilateral).
Table 5. Matrix of the principal components for higher education center (HEC) and households.
HECHouseholds
ParametersComponentsComponents
123123
pH0.7380.0300.241−0.7220.5490.236
Alk0.7670.6210.100−0.5240.7870.228
Cl−0.8340.4600.0120.4230.818−0.157
EC−0.5420.836−0.0100.8350.476−0.199
BOD0.7600.513−0.1480.806−0.0230.428
COD0.643−0.176−0.6660.489−0.385−0.484
HA0.0030.968−0.0070.6060.738−0.124
NO3−0.7770.396−0.3190.9680.1350.075
ColT0.5690.623−0.1120.131−0.0210.911
E. coli0.1150.1020.9350.747−0.4050.398
Total4.0543.0811.5234.4422.6921.599
% variance40.5430.8115.2344.4226.9215.99
% accumulated40.5471.3686.5944.4271.3487.33
Table 6. Color scale and ranges of the water quality index.
Indicative ColorQualityDescriptionD.W.REFRAMF.A.L.IND
ExcellentDoes not require purification90 ≤ 10070 ≤ 10090 ≤ 10070 ≤ 10090 ≤ 100
AcceptableMinor purification/treatment required for consumption, agriculture and industry80 ≤ 9050 ≤ 7070 ≤ 9060 ≤ 7070 ≤ 90
GoodDoubtful for recreational use and aquatic life; does not require treatment for most crops and industrial activities-40 ≤ 5050 ≤ 7050 ≤ 6050 ≤ 70
RegularTreatment required for consumption. Avoid contact only with boats. Treatment for most crops and industrial activities is limited for aquatic life50 ≤ 8030 ≤ 4030 ≤ 5030 ≤ 5040 ≤ 50
BadDoubtful for consumption. Evident contamination. Restricted and limited use for aquatic life, crops and industrial activities40 ≤ 5020 ≤ 3020 ≤ 3020 ≤ 3030 ≤ 40
UnacceptableUnacceptable. Contamination present0 ≤ 400 ≤ 200 ≤ 200 ≤ 200 ≤ 30
D.W., drinking water; RE, recreational; FAR, farming; F.A.L., fish and aquatic life; IND, industrial.
Table 7. Application of the Dinius Water Quality Index to groundwater samples.
Description of Sampling SitesTotal IndexD.W.REFARMF.A.LIND
HECArea with fish activity95.425
Academic halls area85.945
Administrative services area82.530
Pool and sports area77.154
Agricultural crops area74.067
Livestock farm area72.625
Agronomic facilities area62.499
HOUSEHOLDSResidential housing area79.134
Commercial housing area77.658
Country housing area76.621
Residential housing area75.628
Commercial housing area71.970
Residential housing area71.716
Country housing area70.346
Area with a housing complex66.987
Commercial housing area59.174
Country housing area56.694
Disclaimer/Publisher’s Note: The statements, opinions and data contained in all publications are solely those of the individual author(s) and contributor(s) and not of MDPI and/or the editor(s). MDPI and/or the editor(s) disclaim responsibility for any injury to people or property resulting from any ideas, methods, instructions or products referred to in the content.

