Article

Interactions between Aquatic Plants and Cyanobacterial Blooms in Freshwater Reservoir Ecosystems

1
Institute of Hydrobiology of the National Academy of Sciences of Ukraine, Geroiv Stalingrada Ave., 12, 04210 Kyiv, Ukraine
2
Institute of Hydrobiology and Aquatic Ecosystem Management (IHG), University of Natural Resources and Life Sciences, Gregor-Mendel-Straße 33/DG, 1180 Vienna, Austria
3
Spatiolab, 03189 Kyiv, Ukraine
4
M.G. Kholodny Institute of Botany of the National Academy of Sciences of Ukraine, Tereshchenkivska St., 2, 01601 Kyiv, Ukraine
5
BIOME Lab, Department of Biological, Geological and Environmental Sciences—BiGeA, Alma Mater Studiorum, University of Bologna, Via Selmi 3, 40126 Bologna, Italy
*
Author to whom correspondence should be addressed.
Water 2023, 15(4), 672; https://doi.org/10.3390/w15040672
Submission received: 22 December 2022 / Revised: 30 January 2023 / Accepted: 6 February 2023 / Published: 8 February 2023

Abstract

:
Climate change and nutrient pollution are echoed by worldwide increasing trends in the frequency, duration, and toxicity of cyanobacterial (blue-green algal) blooms. Therefore, searching for the best options to mitigate blooms is relevant and timely. Aquatic vascular plants offer a promising solution through biological control. In this study, we use reservoirs regularly affected by intensive blooms (the Kyiv and Kaniv Reservoirs of the Dnipro River, Ukraine) to investigate whether macrophytes may inhibit or reduce the massive development of cyanobacteria. Special attention was paid to plants with floating leaves and free-floating plants since data on their effects on cyanobacteria are controversial. On the basis of field and satellite observations, the spatial distribution of cyanobacterial blooms and aquatic macrophyte patches was assessed. Multispectral images captured by satellites Sentinel-2a (S2A) and Sentinel-2b (S2B) were used. In addition, based on data from field observations, a comparative analysis of phytoplankton and physical and chemical parameters between areas of the reservoirs overgrown and not overgrown by macrophytes was carried out. The obtained results indicate that in macrophyte patches phytoplankton structure differed from that observed in open waters. However, in areas of reservoirs dominated by floating-leaf plants or free-floating plants, a significant decrease in phytoplanktic or cyanobacterial biomass was not observed. This is most likely due to the fact that these macrophytes did not reduce the concentration of biogenic substances to a level that would limit cyanobacterial growth. On the contrary, intensive overgrowth of floating-leaf plants (in particular, Trapa natans) along the river sections of the reservoirs, as well as other factors, contributed to nitrogen and phosphorus enrichment. Therefore, in the face of relevant nutrient supply, these ecological groups of macrophytes (floating-leaf plants and free-floating plants) have not shown statistically significant effectiveness in controlling the process of cyanobacterial blooms in reservoir ecosystems.

1. Introduction

Cyanobacterial (blue-green algal) blooms in reservoir ecosystems are of global concern. The reason is the toxicity and consequent risk posed by some species of cyanobacteria to natural systems, human health, and coastal economies [1]. For hydro-biota and people, the harm of cyanobacterial blooms lies in the production of powerful toxins. Cyanotoxins cause sublethal and lethal effects in aquatic organisms at all taxonomic levels, including different groups of algae, macrophytes, zooplankton, and fish [2]. In addition, bioaccumulation in the aquatic food chain occurs, which can pose a threat to both aquatic ecosystems’ and human health [3]. These toxins can also affect people in various ways, but do so mainly through the consumption of contaminated food (fish, prawns, and molluscs) or drinking water. Cyanotoxins are secondary metabolites that are grouped by their specific toxic effects on animals and people (for example, hepatotoxins such as microcystins could impair the liver, and neurotoxins such as anatoxin-a affect the nervous system) [4]. From temperate and continental climate zones, the most well-known producers of different kinds of cyanotoxins are the following species of cyanobacteria: Dolichospermum flosaquae (Bornet and Flahault) P. Wacklin, L. Hoffmann and Komárek (=Anabaena flosaquae Brébisson ex Bornet and Flauhault); Aphanizomenon flosaquae Ralfs ex Bornet and Flahault; Planktothrix agardhii (Gomont) Anagnostidis and Komárek; Planktothrix rubescens (De Candolle ex Gomont) Anagnostidis and Komárek; Cylindrospermopsis raciborskii (Woloszynska) Seenaya and Sabbaraju (=Raphidiopsis raciborskii (Woloszynska) Aguilera, Berrendero Gómez, Kastovsky, Echenique and Salerno); and many others [5,6,7,8].
Climate change and nutrient pollution are echoed by worldwide increasing trends of the frequency and duration of water blooms caused by cyanobacteria in natural systems [1,5]. Expanded nutrient availability and higher temperatures have the potential to boost not only the frequency, biomass, duration, and distribution of cyanobacterial blooms but also their toxicity [5,9,10]. In general, increased temperatures combined with high phosphorus concentrations favour the growth rate of toxic Microcystis cells in wild populations [9,10]. According to [11], the temperatures with maximum of replication rates of toxic cyanobacterial cells were >20 °C for Aphanizomenon flosaquae and Planktothrix agardhii, and 28 °C for Microcystis aeruginosa.
Shallow plain reservoir ecosystems are particularly prone to eutrophication and are consequently frequently affected by cyanobacterial blooms during the summer. This is caused by a number of factors: agricultural activity in the catchment area; high catchment: reservoir area ratio, associated with high input of nutrients; intensive settling of solid particles and precipitation of dissolved material; slowing of water exchange; thermal stratification, etc. [12,13,14]. Excessive accumulation of cyanobacterial biomass can cause water quality problems in reservoirs, such as diurnal fluctuations in oxygen content, oxygen depletion in bottom waters, and unpleasant taste and odour in water [13]. Absence or low values of oxygen leads to fish death and decomposition of various groups of algae and aquatic plants that create secondary pollution. Therefore, in view of the above, the problem of cyanobacterial blooms is particularly acute, and searching for the best options to mitigate blooms is relevant and timely.
One of the known approaches to mitigate cyanobacterial blooms is biological control of such processes with the help of aquatic plants [15]. The interactions between aquatic plants and cyanobacterial blooms in freshwater ecosystems is displayed in the lowering of dissolved-nutrient concentrations, the synthesis and release of allelopathic compounds which control algal numbers.
The interest in such interactions is based on safer effect of macrophytes on other biota living in water as compared to chemical methods to control or reduce cyanobacterial blooms [16,17]. Many researchers [17,18,19,20] emphasize the importance of submerged plants in the biological control of cyanobacterial blooms and restoring water quality, while data on the role of other macrophytes, in particular floating-leaf plants and free-floating plants, in these processes are very controversial [15,19,21]. With this work, we wanted to test the hypothesis that floating-leaf plants and free-floating plants can inhibit or reduce the massive development of cyanobacteria in reservoirs regularly suffering from intense blooms of these organisms.

2. Materials and Methods
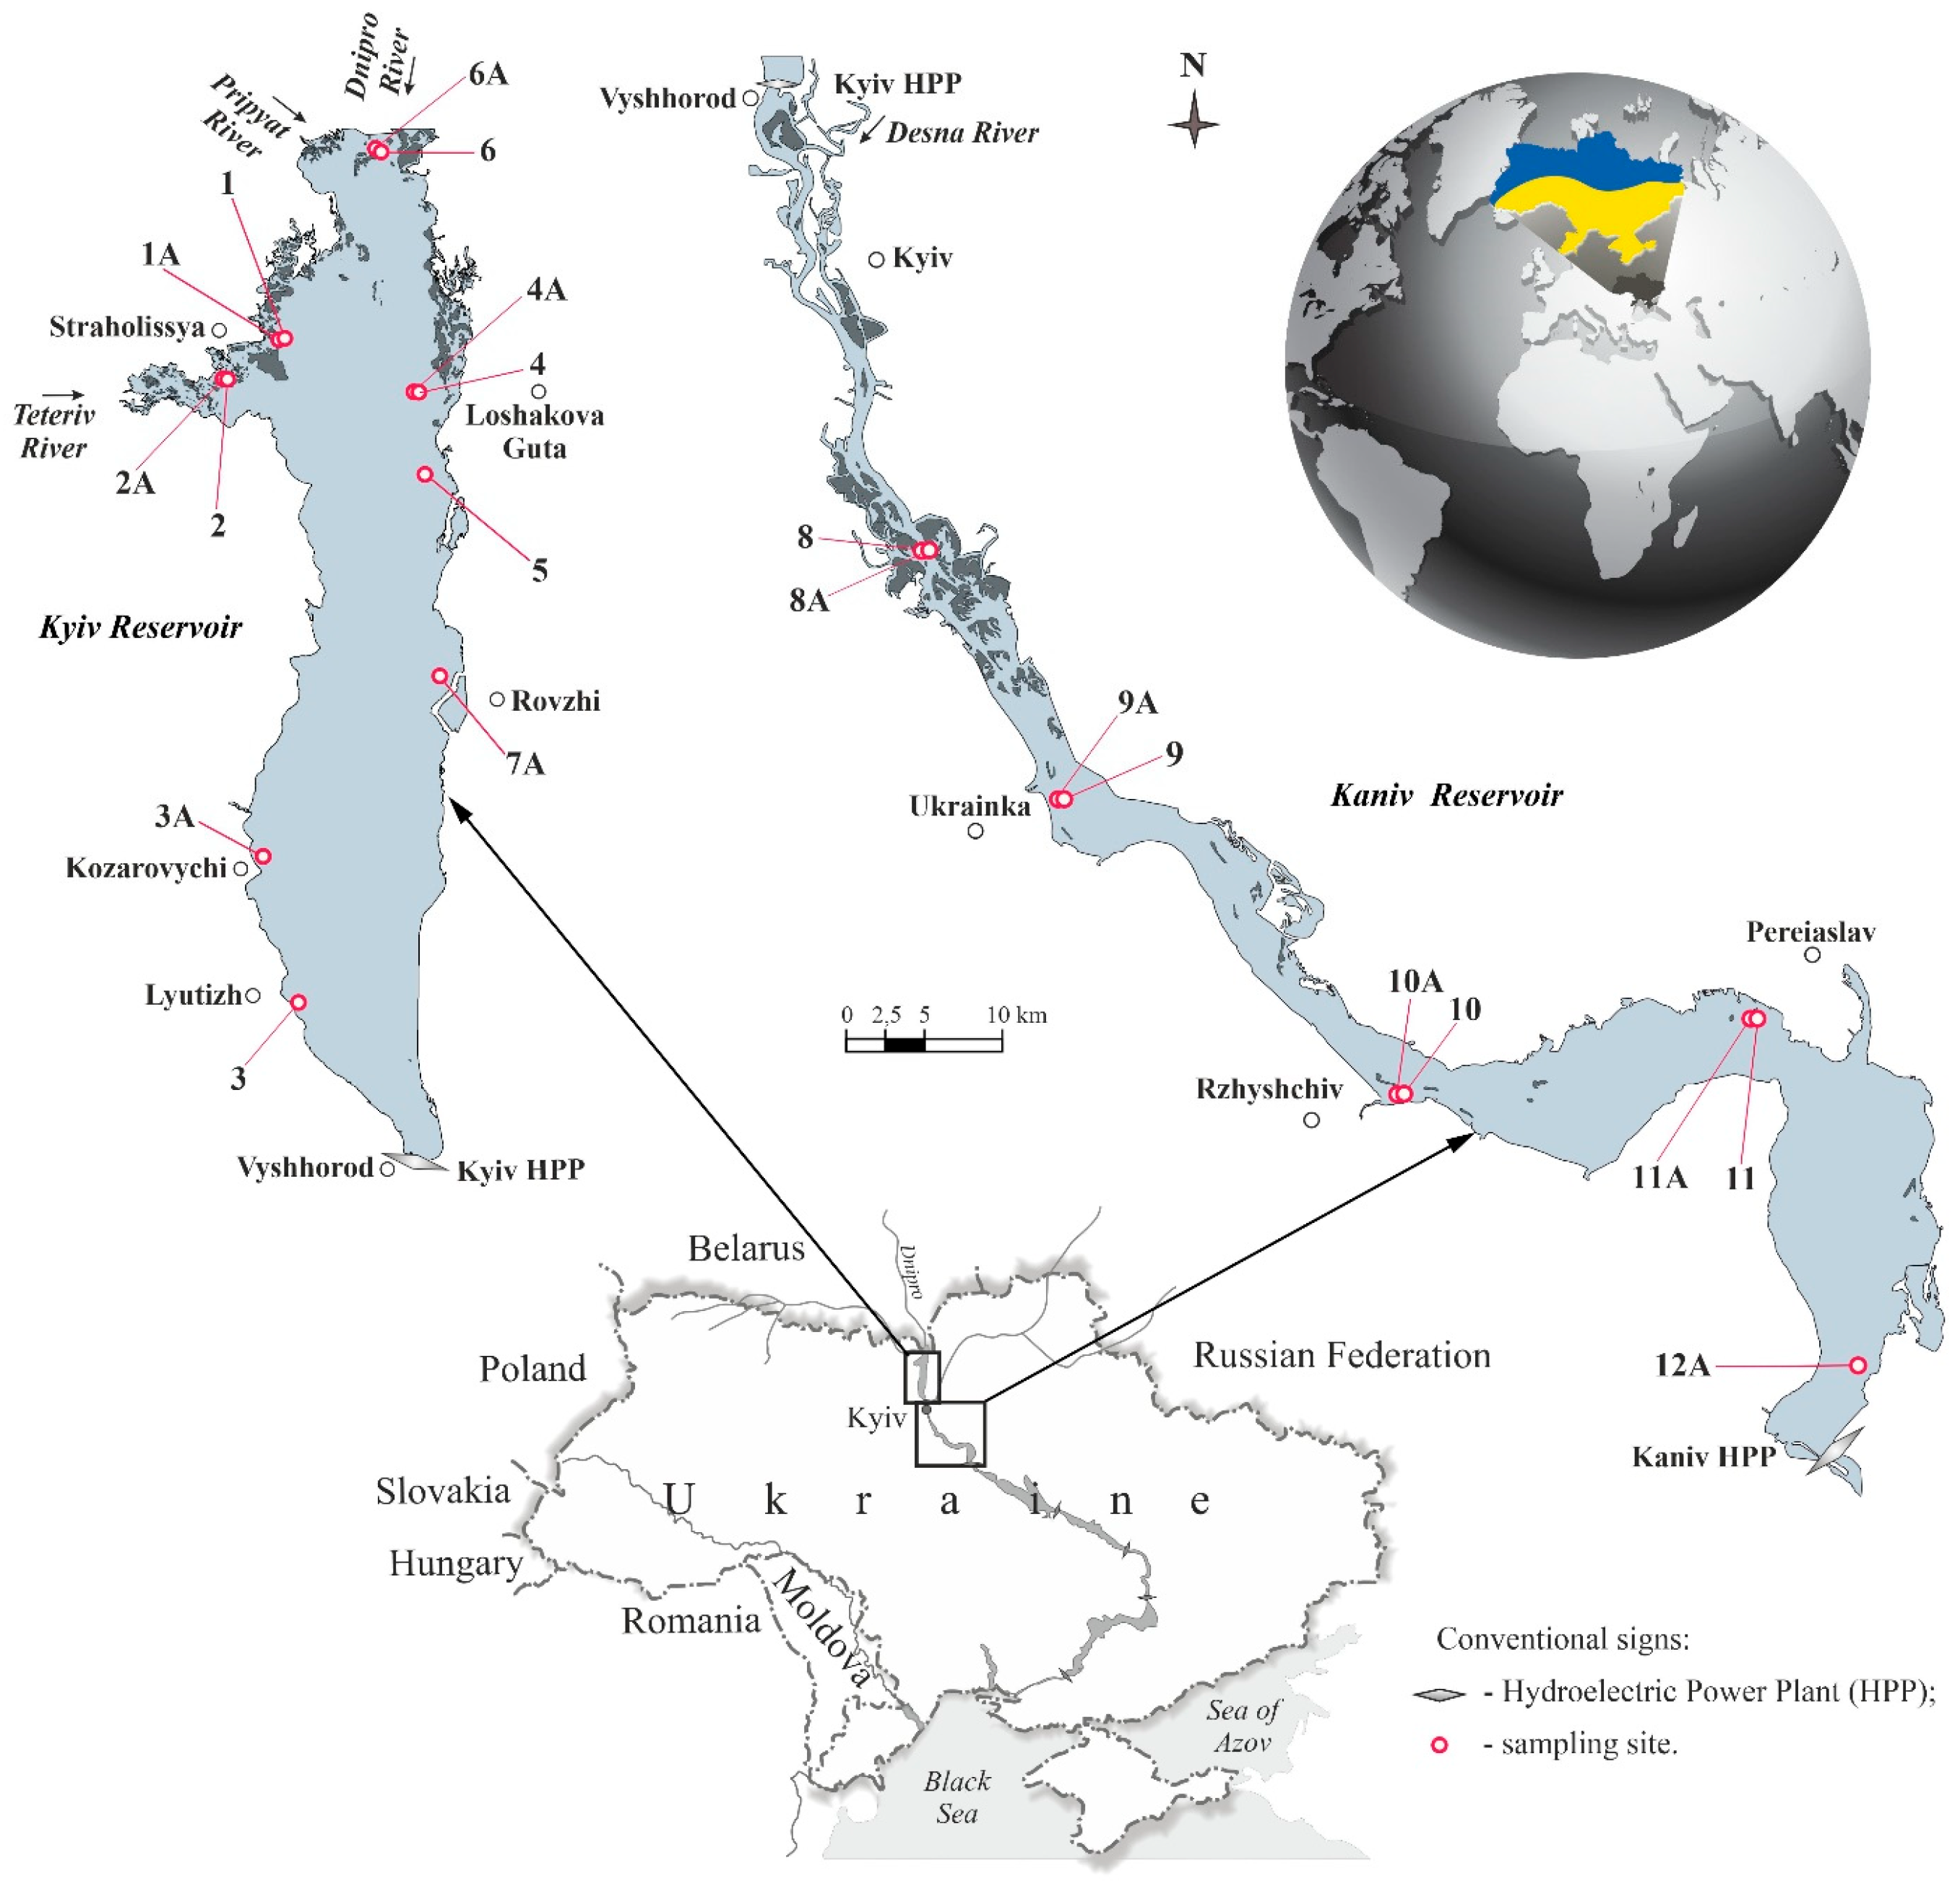
2.1. Study Area

The work was conducted on the upper reservoirs of the Dnipro River cascade, namely the Kyiv and Kaniv Reservoirs (Figure 1). The main characteristics of these reservoirs are relatively small depths and large areas of shallow waters, which significantly warmed up in summer [14]. The average depth of the Kyiv Reservoir is 4 m, and of the Kaniv Reservoir, 3.9 m. The area of shallow water in the Kyiv Reservoir occupies 34% of the total area (922 km2), and in the Kaniv Reservoir, 26% (582 km2) [14]. Due to slow water exchange, they have become intensively overgrown with macrophytes in recent years. Thus, these reservoirs were selected for our research.
The Kyiv Reservoir provides partial seasonal regulation of water flow, especially for the spring flood. In other periods, fluctuations in water levels and flows are minimal. The peculiarity of this reservoir is that it receives natural (unregulated) flow of river water from the upper Dnipro River and the Pripyat River, which in the spring period makes up more than 60% of the volume of the annual inflow [22]. The second in the cascade, the Kaniv Reservoir, is characterized by a very small regulating capacity (0.5 km3) and performs only daily and weekly flow regulation. Kyiv Reservoir runoff (75%) is of significant importance for the formation of the water balance of the reservoir. Unregulated runoff from the Desna River, precipitation, as well as domestic and industrial wastewater discharges add to the rest of the water balance [23,24].
With the regulation of the flow of the Dnipro River, the flow velocity has significantly decreased. In an average hydrological year, it is 1.5–7 cm/s (20–25 cm/s in spring), while before regulation it was 60–80 cm/s [23,24,25]. Irregular operation of the hydroelectric power plant (HPP) during the day and over the week causes an unstable current velocity regime in the upper and especially in the lower pool of hydroelectric units. When the HPP units are turned off, current velocity almost drops to zero; when they are turned on, it reaches 1 m/s in the upper pool and 1.5–2.5 m/s in the lower pool of the hydraulic unit. Wind currents (5–15 cm/s) became more noticeable in the water area of reservoirs. According to the data of the Kyiv weather station, western, southern and north-western winds prevail throughout the year. Northerly winds prevail from April to August. Westerly winds have the highest frequency (17.1%), and easterly winds have the lowest frequency (6.8%). In Kaniv city, during the year, winds from the west, south-west and east prevail. In the period from April to August, westerly winds are most frequent (21.1%); southeast winds are least frequent (6.8%).
The significant length of the Dnipro cascade reservoirs from north to south affects the periods of spring heating and autumn cooling of the water. In Kyiv and Kaniv Reservoirs, the spring water temperature transition by 0.2 °C occurs in the third week of March. The autumn transition of water temperature by 0.2 °C to zero values in these reservoirs occurs in the first and second weeks of December. Around this period is the beginning of the establishment of the ice freeze-up on the reservoirs [25].
Water mineralization in the Kyiv and Kaniv Reservoirs in August, 2021 was in a wide range of 192–245 and 211–240 mg/L, respectively. In the Kyiv Reservoir, the minimum values of water mineralization were observed near the left bank. This is due to the fact that the water of the Dnipro River is less mineralized than that of the Pripyat River and the Teteriv River (right bank) [26]. In the Kaniv Reservoir, the values also change due to the influence of more mineralized water from the Desna River. The flow of the Pripyat, Teteriv, and Desna is on average 27, 2.4, and 21% of the total flow of the Dnipro, respectively [27], which is the reason for such different values of water mineralization in the water area of the studied reservoirs.

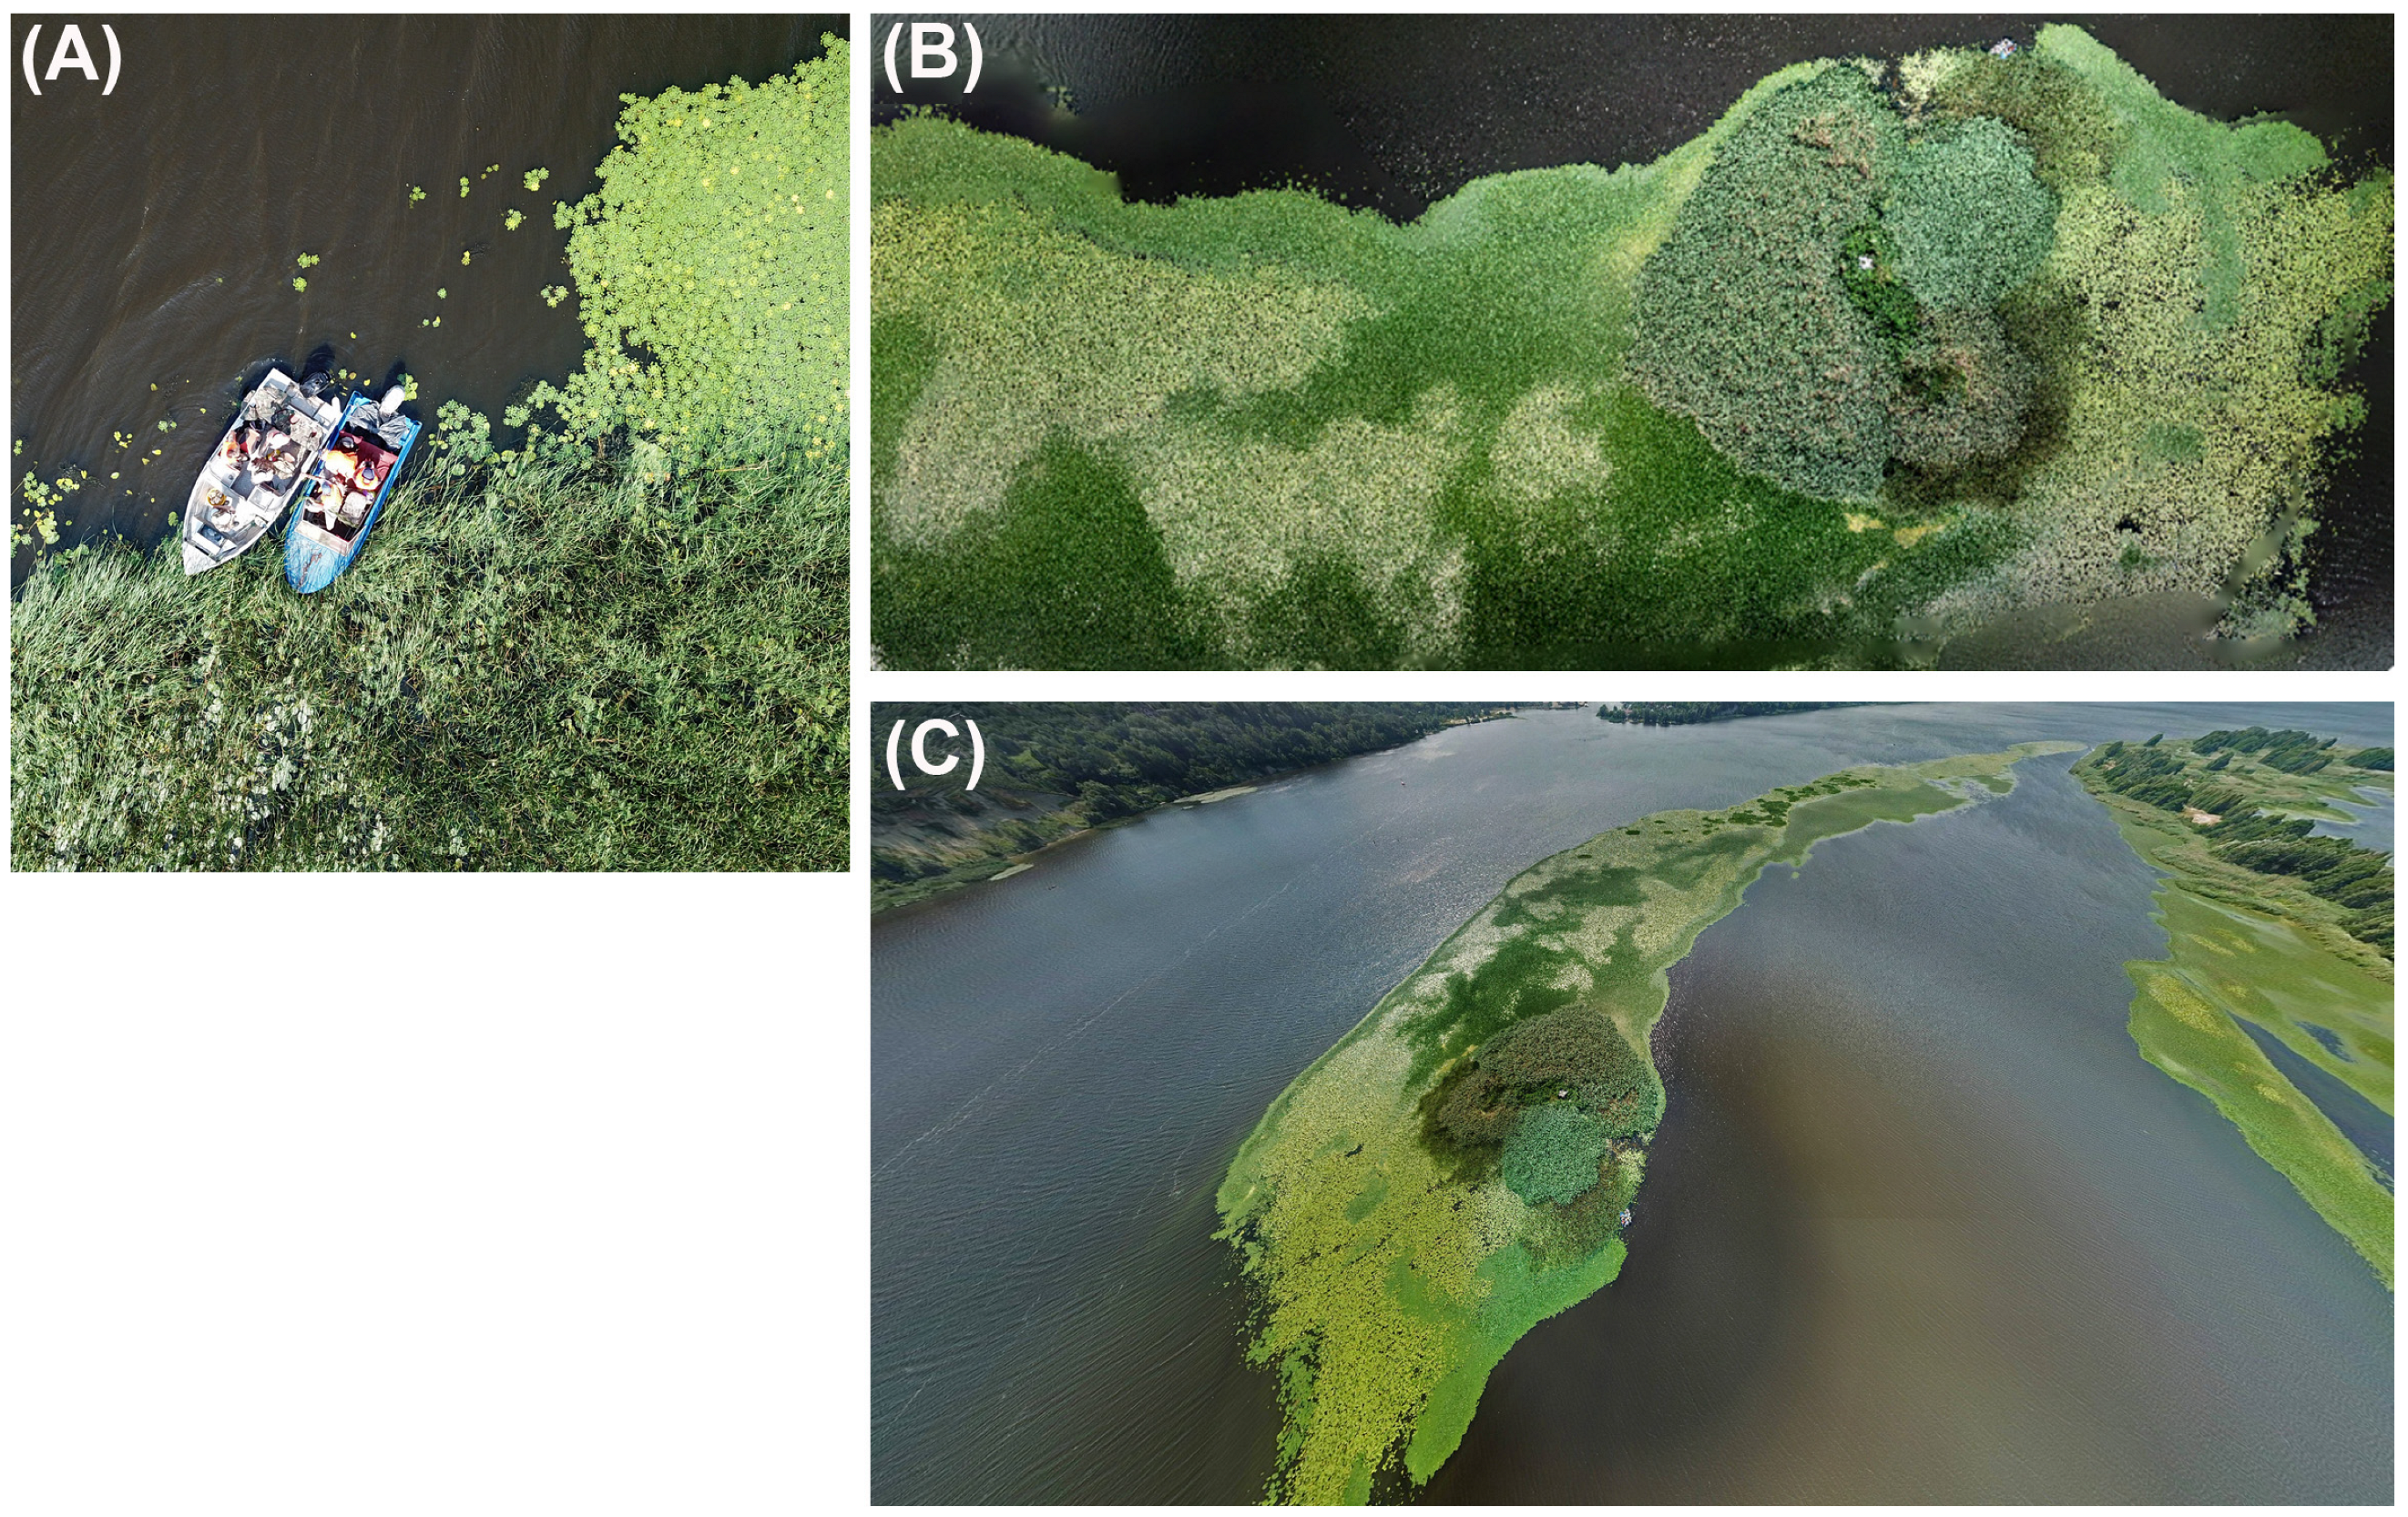
2.2. Sampling Strategy

Our field trips were conducted in August of 2021 on motor boats over the area of two big reservoirs located in the Dnipro River, above and below the city of Kyiv, Ukraine. According to the scientific question tackled in this project, the sampling sites were organized to cover the whole area of the Kyiv and Kaniv Reservoirs (Figure 1, Table 1). In turn, the samples were taken mainly in the patches of aquatic macrophytes and 2 m away from them. We also sampled in areas without macrophytes (sites 7A and 12A).
At each sampling site, the physical and chemical parameters of the water (temperature, pH, dissolved oxygen, conductivity, salinity, and total dissolved solids—TDS) were measured using the multifunction device AZ-86031 (AZ Instrument Corp., Taiwan); the results are presented in Table 1.
Figure 1. Sampling sites in Kyiv and Kaniv Reservoirs in August 2021. The sites without plants (open water areas) have the letter “A”. For sites with aquatic macrophyte patches, no additional letter was added.
Water 15 00672 g001

2.3. Hydrochemical Investigations in the Studied Reservoirs

Hydrochemical studies were conducted for water samples that were taken from the surface layer (~0.5 m) (Table 2). To separate suspended substances, samples with a volume of 1.0–1.5 L were passed through a nitrocellulose filter (Filtres Fioroni S.A.S., Ingré, France) with a pore diameter of 0.45 μm. The content of suspended solids was determined by the difference between the mass of the filter with suspension, dried at 105 °C to a constant mass, and the mass of the filter itself. In the obtained water filtrate, the content of inorganic forms of nitrogen and phosphorus, the total content of nitrogen and phosphorus, the concentration of organic nitrogen and phosphorus, and the content of polyphosphates were determined.
The concentration of inorganic forms of nitrogen and phosphorus in water was determined using commonly used spectrophotometric methods. Ferrous salt with Nessler’s reagent was used to determine ammonium nitrogen, Griess’s reagent for nitrites, sodium salicylate for nitrates, and ammonium molybdate with ascorbic acid for inorganic phosphorus [28,29]. The content of total nitrogen was determined after oxidation of nitrogen-containing organic compounds and inorganic nitrogen compounds to nitrate ions using potassium persulfate in an alkaline medium. The concentration of total phosphorus was determined in water filtrates after photochemical oxidation of dissolved organic substances in an acidic environment, and the content of polyphosphates after acid hydrolysis [28,29].

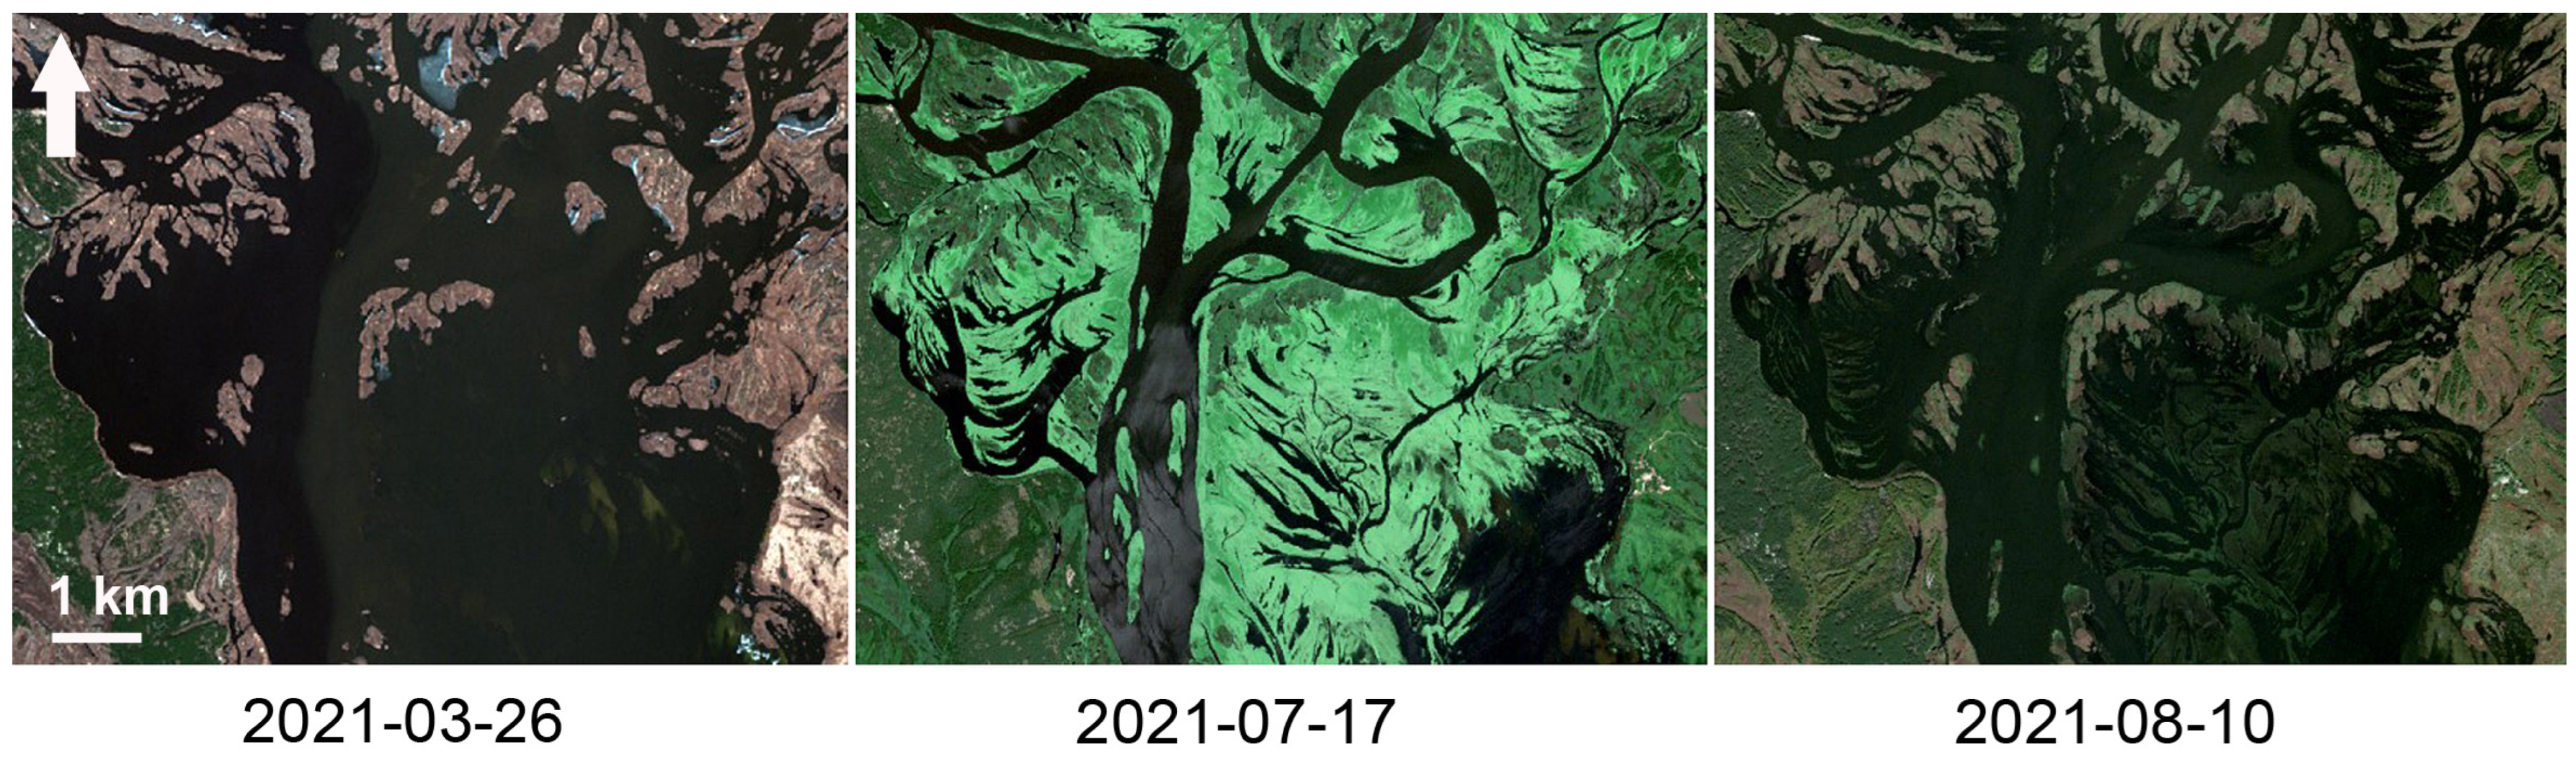
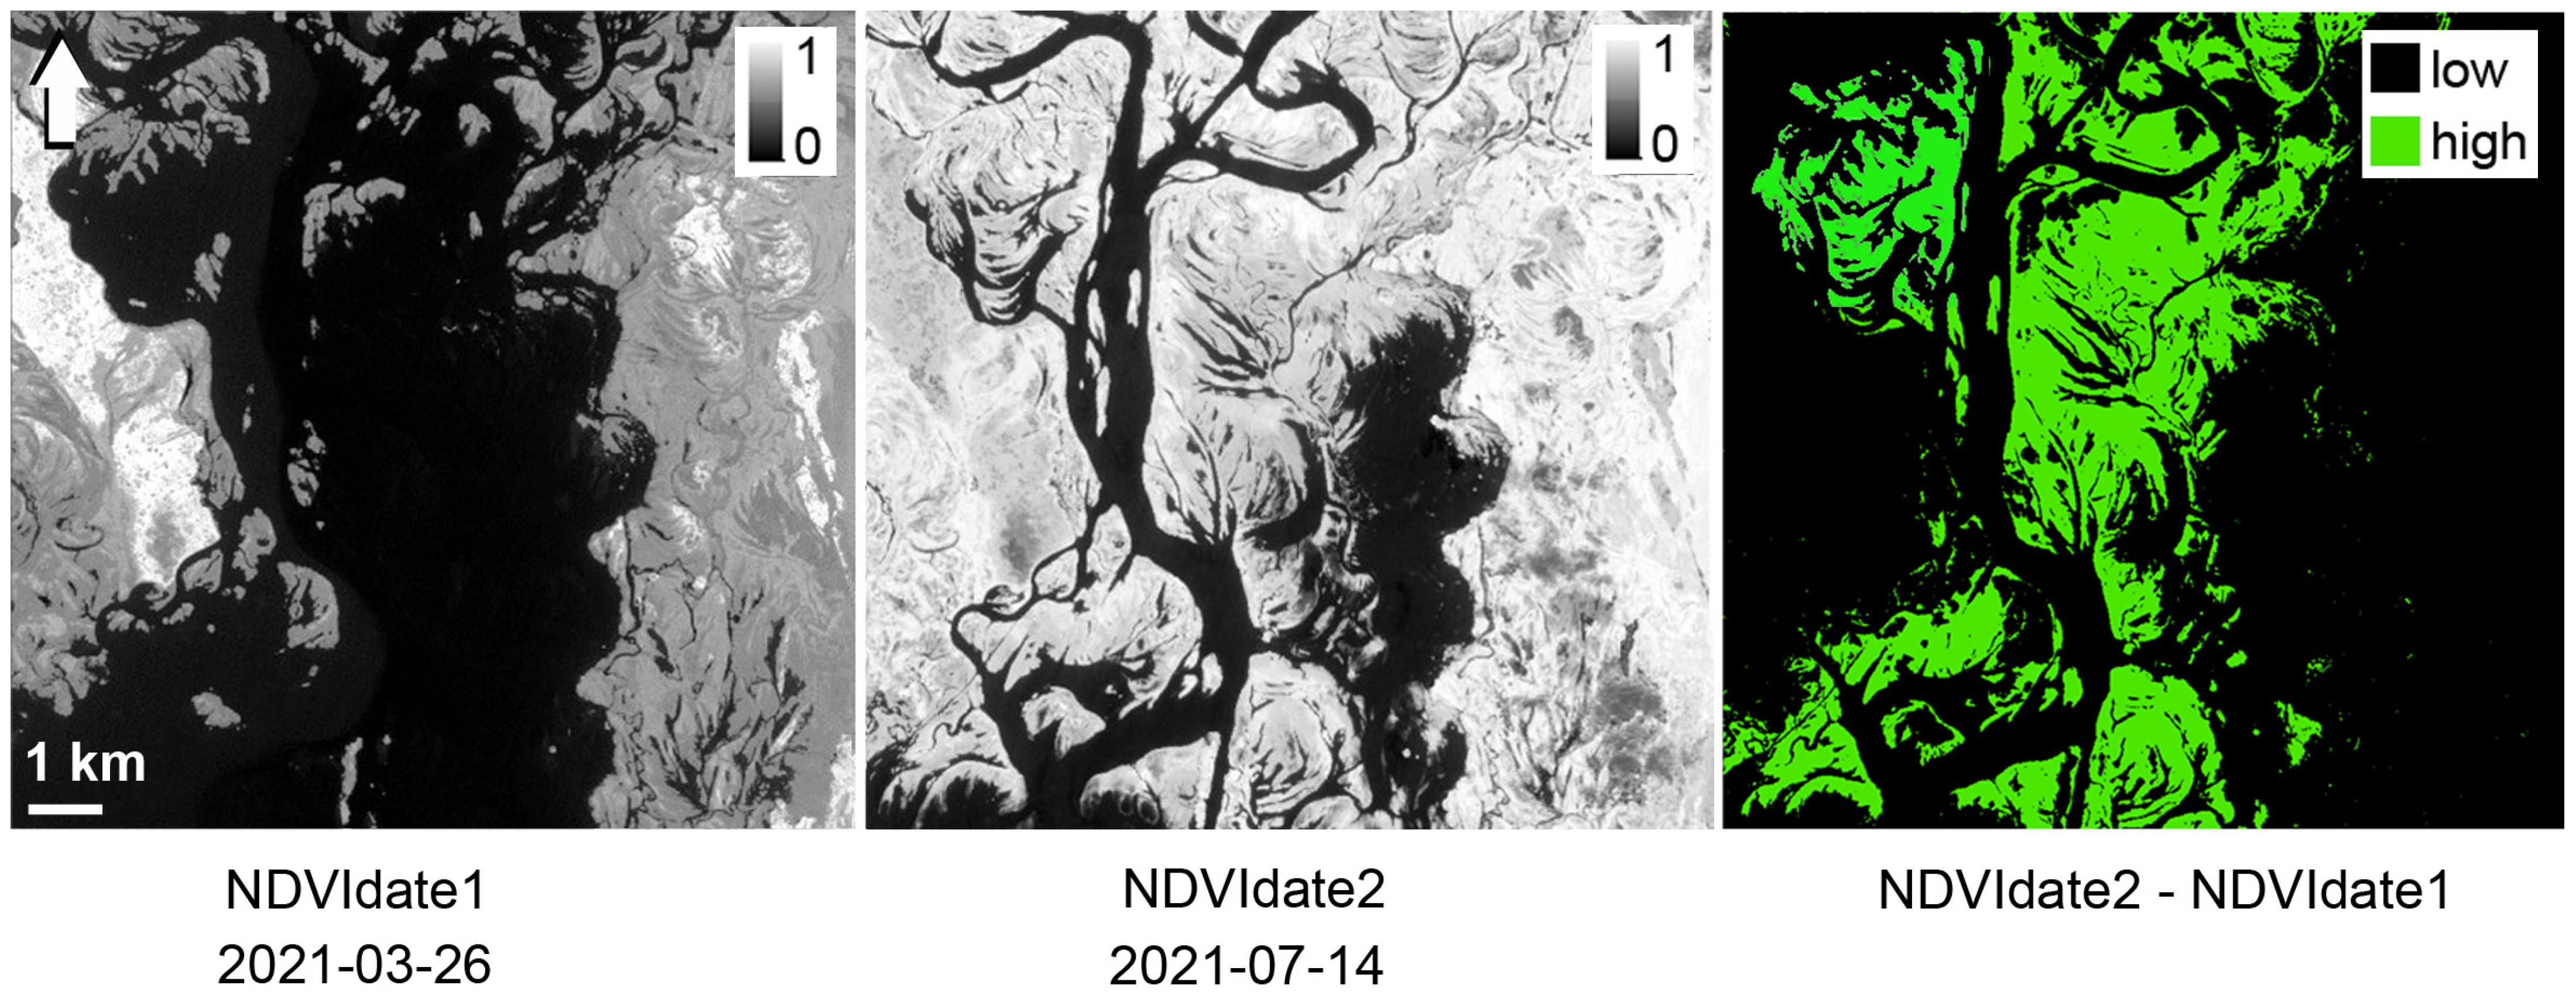
2.4. Mapping of Hydrophytes and Algae Distribution with UAV and Satellite Data

Distribution of hydrophytes and algae within water bodies of the Kyiv and Kaniv Reservoirs was mapped by means of satellite imagery analysis. Training and validation data for the analysis were obtained from aerial photo surveys of hydrophytes communities with an unmanned aerial vehicle (UAV).
Aerial surveys with UAV were performed together with other activities on each study point. Quadro-copter DJI Mavic Pro (DJI Mavic Pro, Shenzhen DJI Sciences and Technologies Ltd., Shenzhen, China) was used to capture single-nadir images at an altitude from 5 to 100 m. Additionally, on most of the study points, a set of images for generating ortho-mosaics and/or spherical photo-panoramas were captured at altitudes from 50 to 100 m. The images were then processed in PixD Mapper 4.5.6 for generating ortho-mosaics and Agisoft Metashape 1.5.2 software for generating spherical photo-panoramas (Figure 2).
For the satellite data, multispectral images captured by satellites Sentinel-2a (S2A) and Sentinel-2b (S2B) were used. These satellites were launched in 2015 (S2A) and 2016 (S2B) by the European Space Agency and provide images globally with 5–7-day intervals. The images are freely available and can be downloaded from web platform such as Google Earth Engine (Available online: https://code.earthengine.google.com/ (accessed on 21 December 2022) with Javascript API to access images, and others. Sentinel images contain 13 spectral bands in visual (VIS), near-infrared (NIR) and shortwave-infrared (SWIR) regions with spatial resolution 10, 20, or 60 m depending on the spectral band (Table 3). The images undergo atmospheric correction and preliminary classification including cloud detection [30].
Among available satellite images captured during spring–summer 2021, 3 cloudless images were selected for each reservoir showing different levels of development of aquatic vegetation (Table 4, Figure 3).
The obtained images were cropped to the margins of the Kaniv and Kyiv Reservoirs by using the borders files available from Open Street Maps Projects (OSM). This allowed us to cut off most of the vegetation on islands and banks which could complicate classification of hydrophytes and algae. The classification was performed in 3 stages.
At the first stage, the satellite images were classified using ESRI ArcGIS 10.4 software with the Maximum Likelihood Supervised Classification tool [32]. Images captured on 14 July 2021 (Kyiv Reservoir) and 21 June 2021 (Kaniv Reservoir) were selected for classification for these dates among others available, which correspond to the maximal development of the aquatic vegetation. The following spectral bands were used: B2 (blue), B3 (green), B4 (red), and B8 (NIR). These bands were selected due to having the highest spatial resolution (10 m). Training areas were selected with reference to UAV imagery. Images captured with UAV showed that populations of hydrophytes usually contain several species which cannot be distinguished with Sentinel satellite imagery because of lack of spatial resolution. Due to this, the following classes were selected for the classification: “dense hydrophytes”, “sparse hydrophytes”, “bryophytes and ground vegetation”, “water” (including algae aggregation) and “other” (Figure 4).
At the second stage, images of Normalized Difference Vegetation Index (NDVI) were created from spectral bands B4 (red) and B8 (NIR) using the formula NDVI = (B8 − B4)/(B8 + B4) [33]. Differences in NDVI between Date 2 and Date 1 (see Table 4) were then calculated using the formula NDVIdif = NDVI (date2) − NDVI (date1). Low values of NDVIdif were used as a negative mask to filter out wrong pixels from the class “Dense hydrophytes” (Figure 5).
At the third stage, NDVI values were used to assess locations and levels of algae aggregations within the “water” class (Figure 6).

2.5. Sampling Phytoplankton and Further Determination of Algae

The phytoplankton samples were collected using a bathometer at a depth of 0.5 m in all sampling sites. Further samples were processed in the laboratory of the Institute of Hydrobiology of NAS of Ukraine, determining the taxonomic composition of algal assemblages and performing counts for phytoplankton quantification. Light microscopic (LM) observations were performed by means of Axio Imager A1 (Carl Zeiss, Oberkochen, Germany) with 40× HCX PLAN objective and 100× oil-immersion objective lens (total magnification was 400–1000) equipped with digital camera AxioCam 506 color (Carl Zeiss, Oberkochen, Germany). Identification was performed using the Süßwasserflora von Mitteleuropa [34,35,36,37,38,39], with some newer updates from Diatoms of Europe [40,41,42] and some additional monographs [43,44,45,46,47,48,49,50,51,52]. The identified taxa, as well as all lists of algal species from previous studies of the area, were checked for nomenclatural correctness using the AlgaeBase system [53]. The quantitative characteristics of algae were recorded by direct counting in a Nageotte chamber (volume 0.02 mL) using a light microscope Axio Imager A1 (Carl Zeiss, Oberkochen, Germany). The biomass of algae was obtained equating the cells to specific geometrical forms according to Hillebrand et al. [54].

2.6. Determination of the Concentration of Chlorophyll a in Phytoplankton

The concentration of chlorophyll a was determined by the extract-spectrophotometric method [55]. To determine the concentration of chlorophyll a, algal and cyanobacterial cells were concentrated by filtration using cellulose nitrate 0.45 μm pore size membrane filters (Sartorius, Sartorius Stedim Biotech, Goettingen, Germany) under low vacuum conditions. Pigments were extracted using 90% acetone; the optical density of acetone extracts was read at 630, 647, 664, and 750 nm [55]. The concentration of chlorophyll a was calculated using the equation of Jeffrey and Humphrey [56].

2.7. Statistical Data Analysis

For the identification of the essential environmental determinants affecting phytoplankton abundance and community structure, we used constrained ordination implemented in the R package ‘vegan’ [57,58].
The environmental variables driving the heterogeneity of phytoplankton community structure were distinguished. According to the suggestion of Šmilauer and Lepš [59], detrending correspondence analysis (DCA) was used first to test whether phytoplankton abundance data showed linear or unimodal responses to the underlying gradients. Because the length of gradient was more than 4, we decided to perform a canonical correspondence analysis (CCA) [60]. Explanatory environmental variables were chosen by the step-wise selection procedure based on Monte Carlo permutation tests of the constraint’s significance implemented in the ‘ordistep’ function, and only those variables that were significantly related to the community structure (at p < 0.05) were selected to be considered in the CCA and to be shown in the ordination diagram, as suggested by Legendre and Legendre [57]. In the present analysis, total phosphorus (TP), organic phosphorus and polyphosphates (P org poly), NO2, salinity, organic nitrogen (N org), total nitrogen (TN) in Kyiv Reservoir or NO3 in Kaniv Reservoir, were included (Table 2). To improve the estimation of the effect of salinity, the effects of transparency and mass of suspended matter were partialled out. The presence of aquatic plants was encoded as the dummy variable ‘AqP’ and added as an explanatory variable. Adding this variable led to the impossibility of Monte Carlo permutation tests due to overdetermination of the model and elimination of the residual component but did not change the coordinate space, i.e., scores of other variables. Therefore, we decided to include this variable in the plots and show the significance of CCA without them in the tables. As the community structure parameters, species number and abundance per division of Bacillariophyta, Chlorophyta, Cyanobacteria, and total chlorophyll a concentration were included in the model.

3. Results

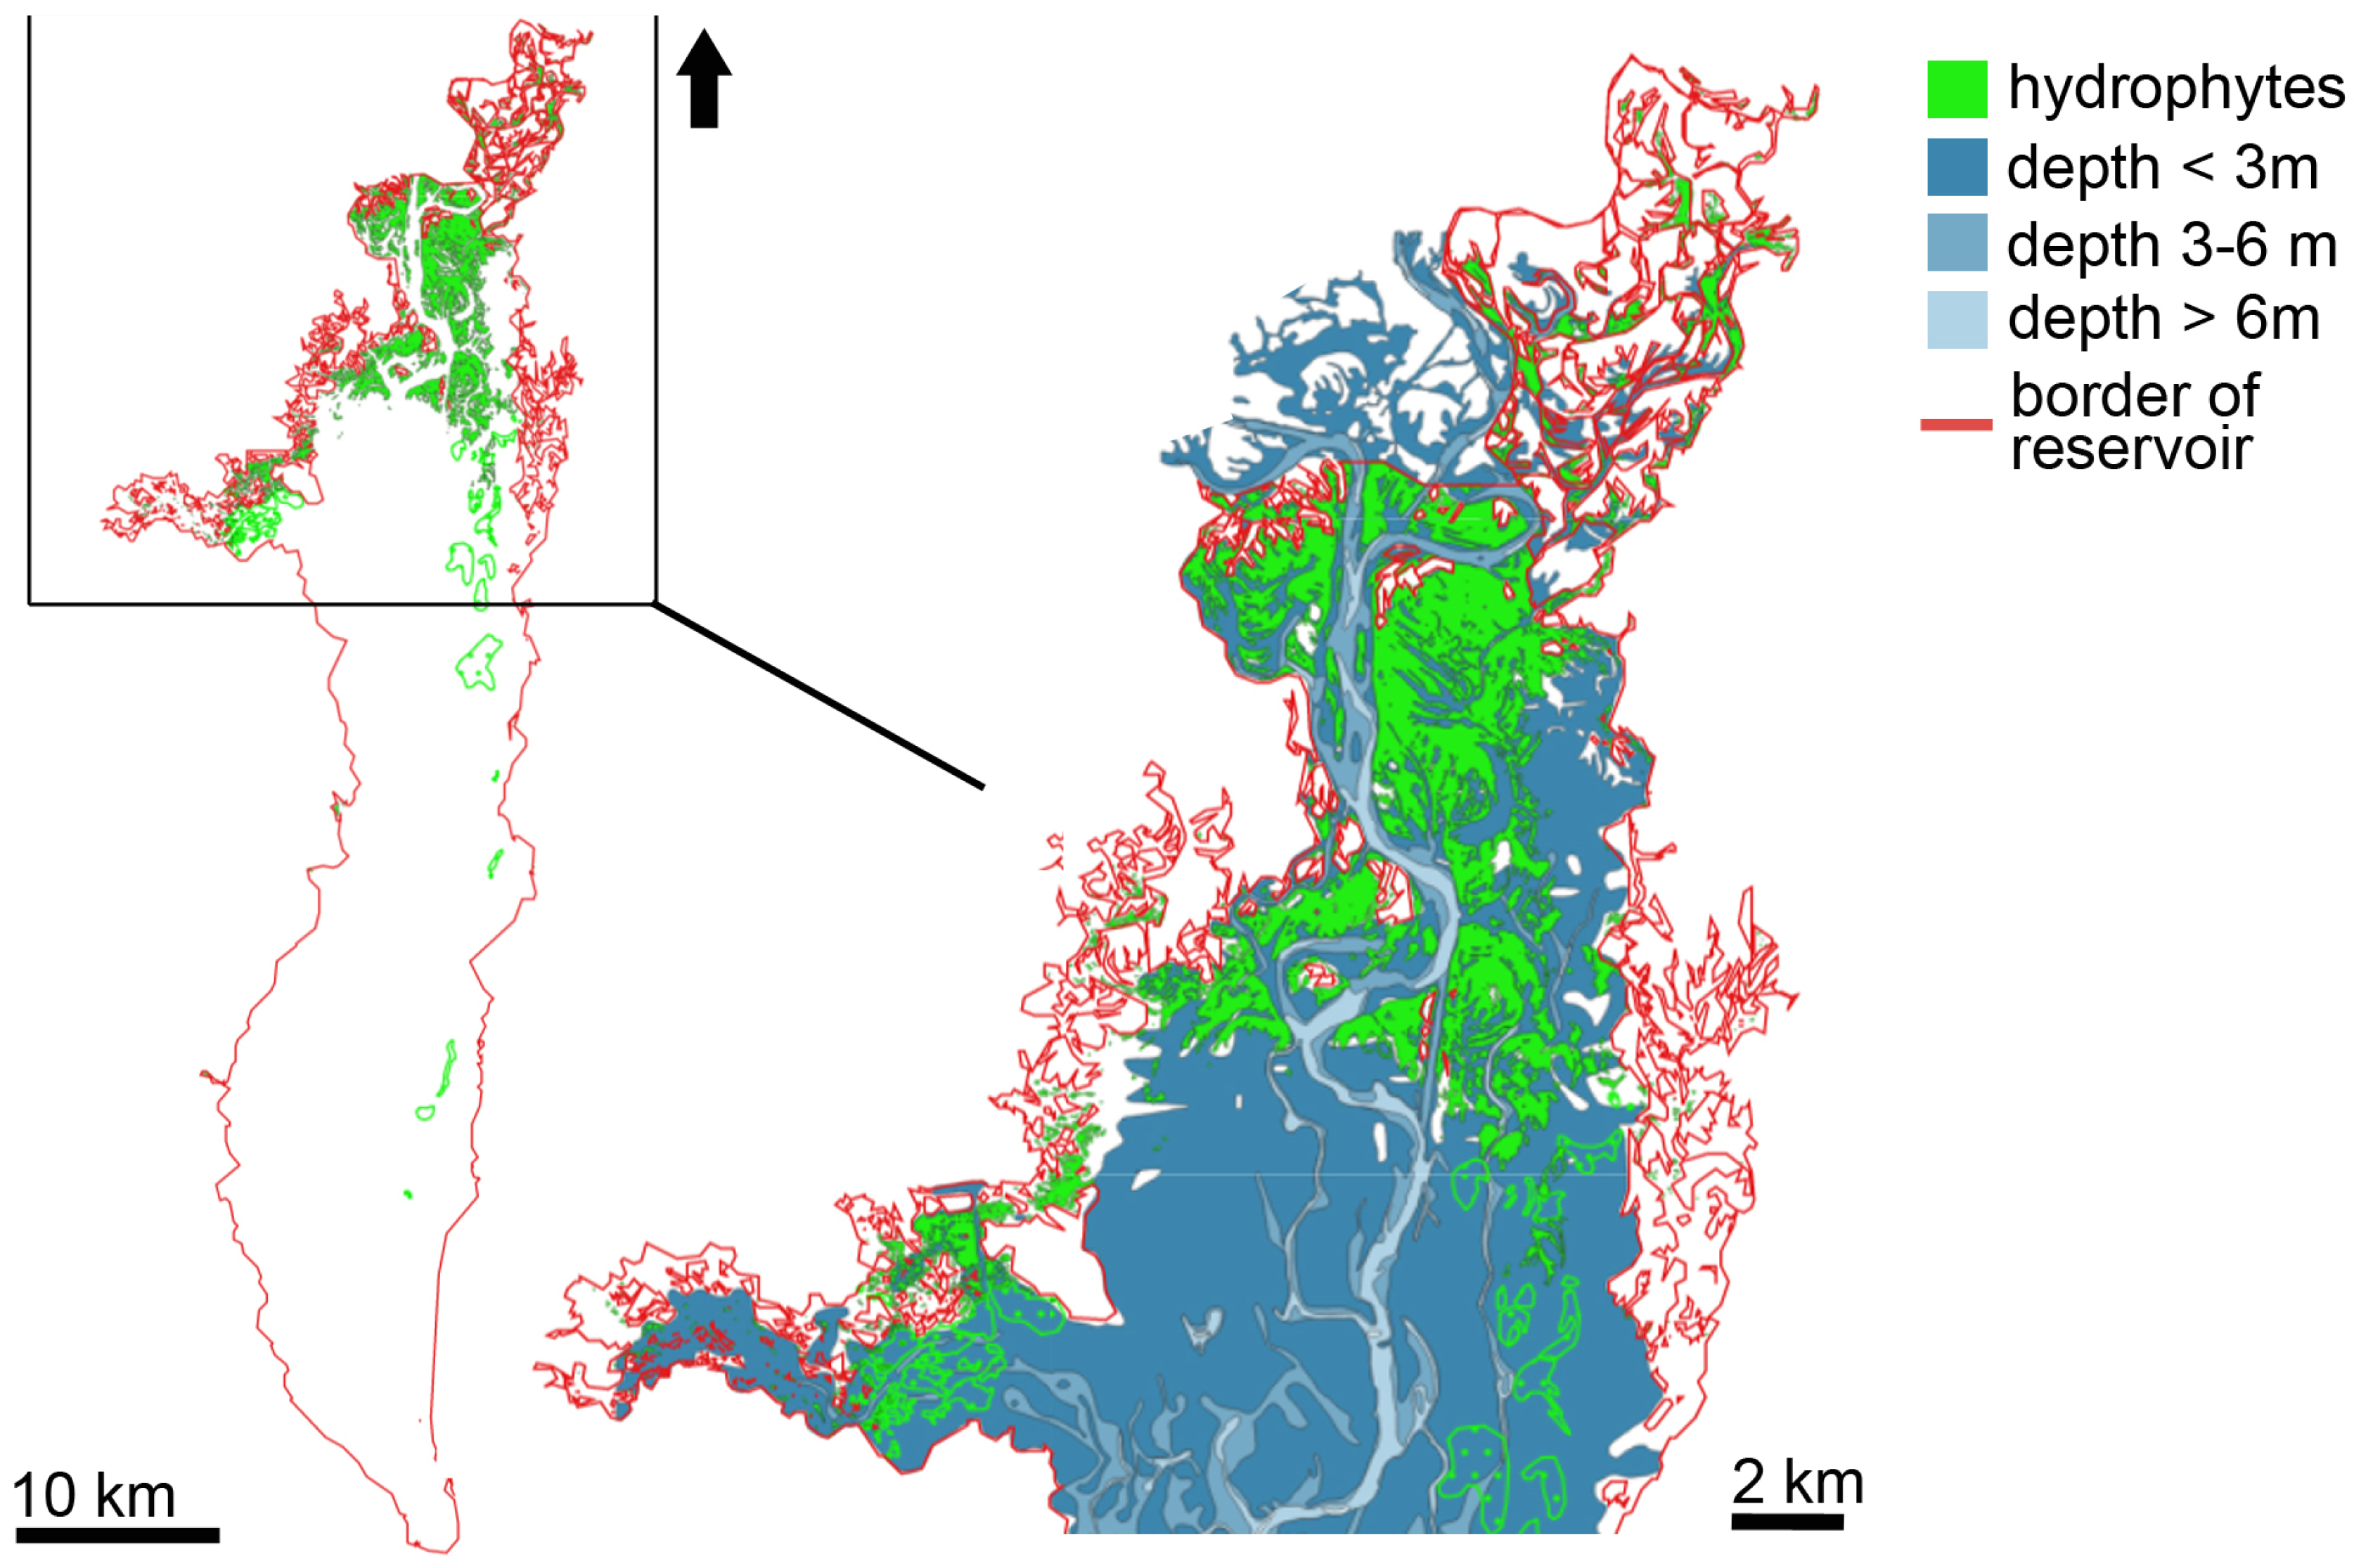
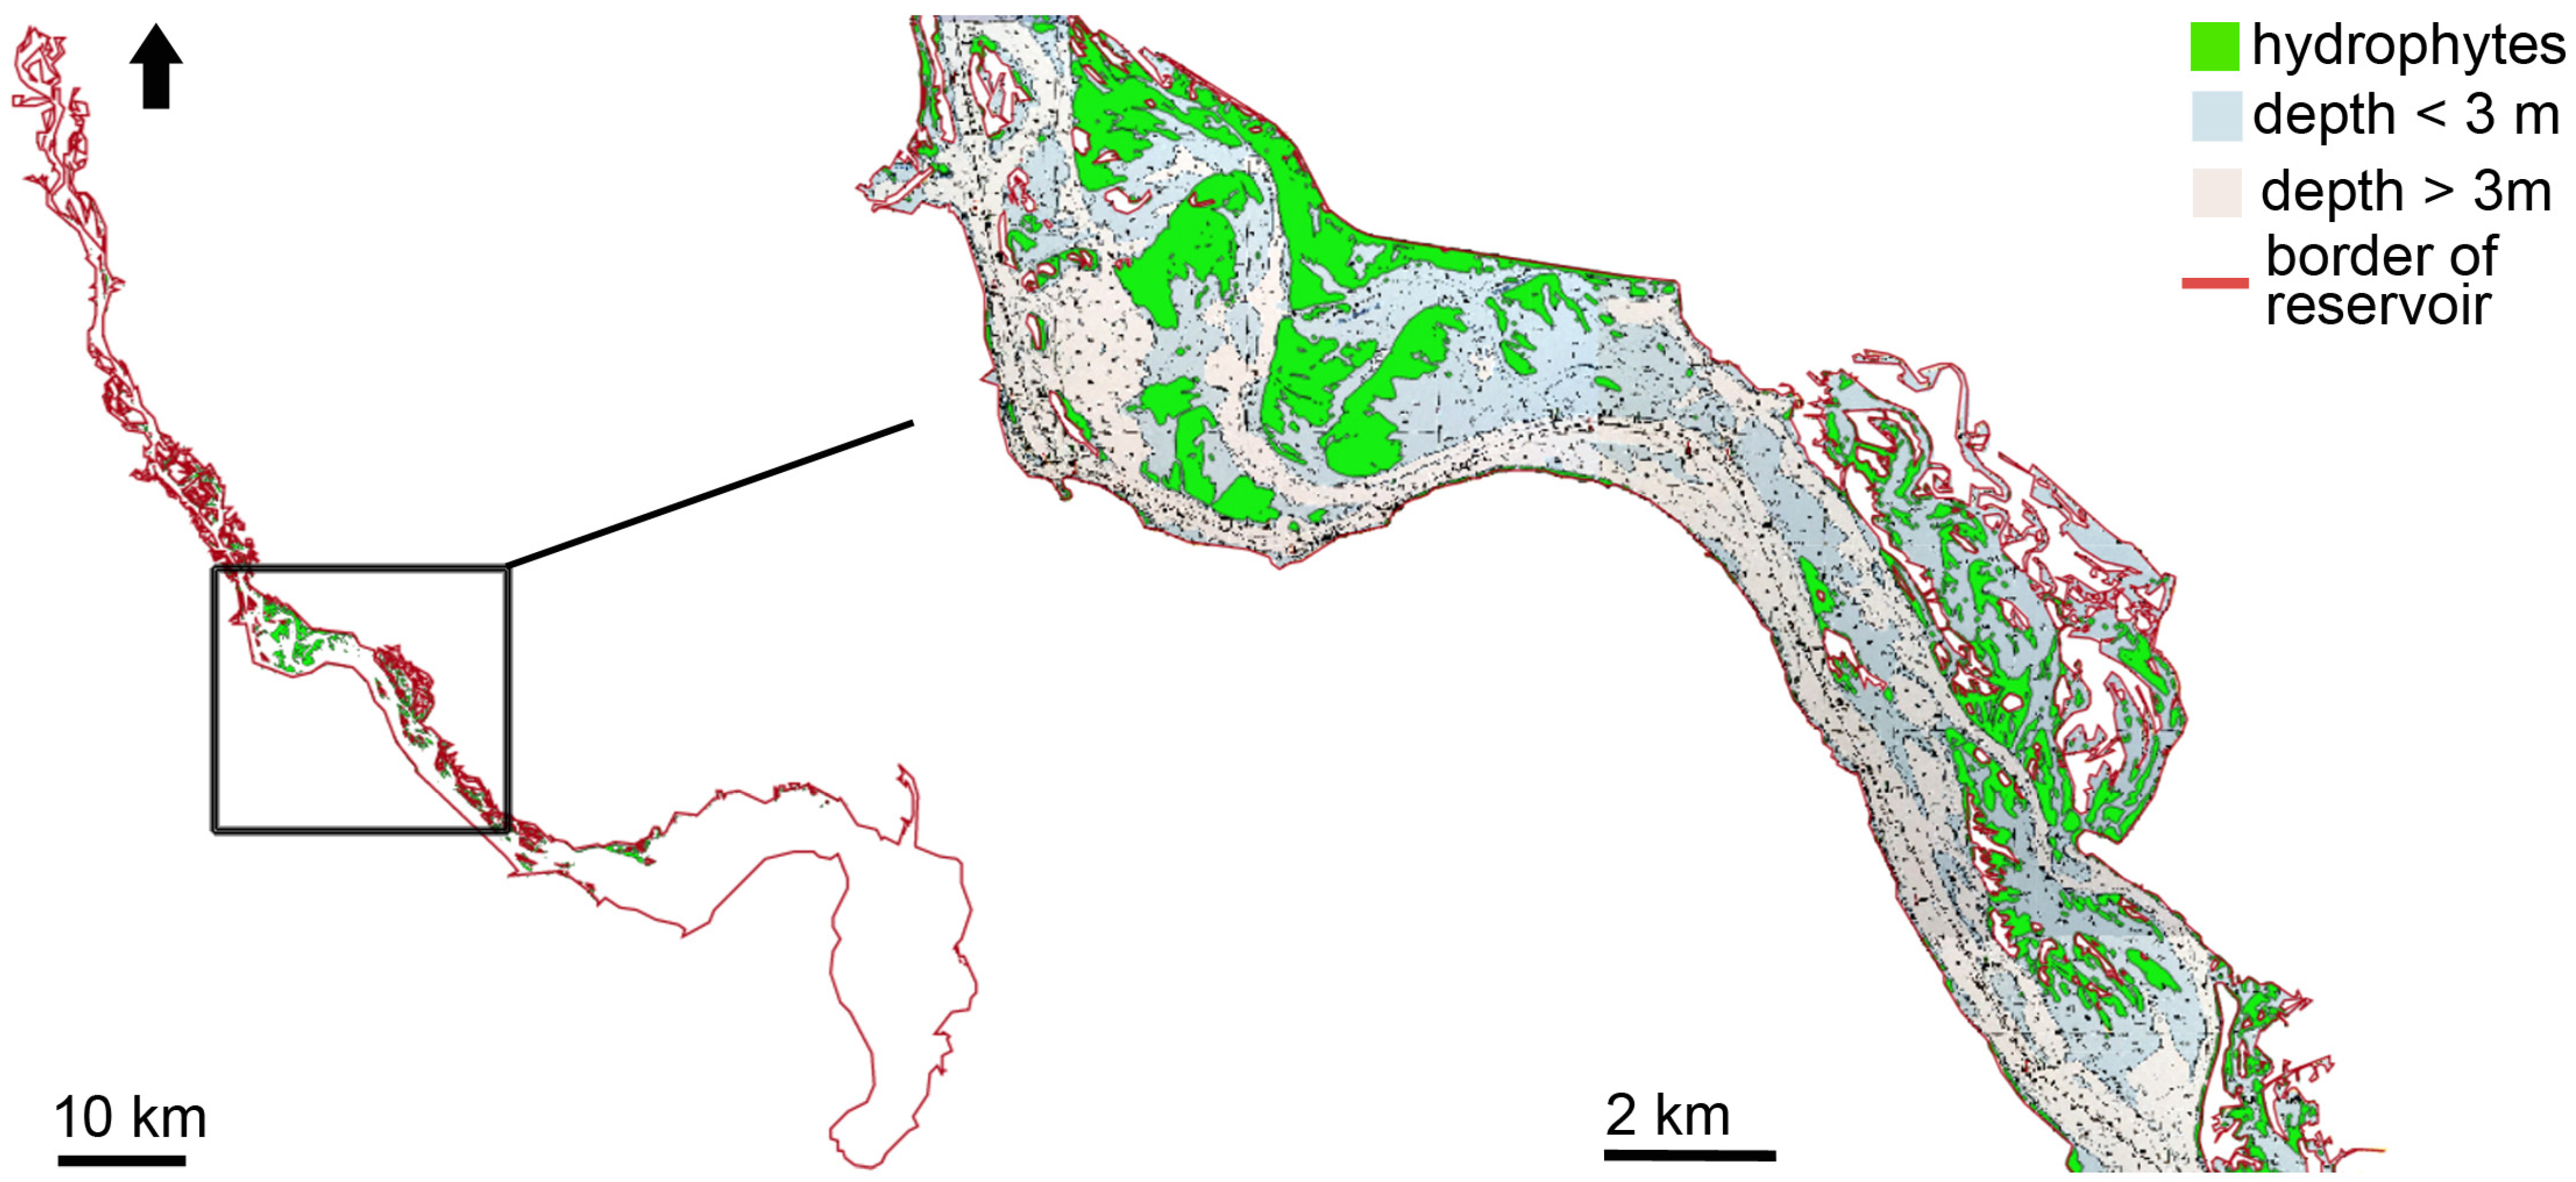
3.1. Distribution of Hydrophytes within the Kyiv and Kaniv Reservoirs

3.1.1. Kyiv Reservoir’s Hydrophytes

According to the results of satellite data analysis, the area of the population of hydrophytes in Kyiv reservoir in summer 2021 was about 56 km2. This number included 43 km2 of dense vegetation (100% of the water surface is covered with plants) and 13 km2 of sparse vegetation (mix of open water and plants).
Dense hydrophytes were mainly located in the upper reach of the reservoir, aside the main stream in areas with depth less than 2–3 m. Sparse hydrophytes were distributed in the delta of the Teteriv River and in the central part of the reservoir with depth less than 3 m (Figure 7).

3.1.2. Hydrophytes’ Distribution in the Kaniv Reservoir

In the Kaniv Reservoir, area of hydrophytes in 2021 reached 34 km2, including 29 km2 of dense and about 5 km2 of sparse aquatic vegetation. The hydrophytes were located predominantly in the widest parts of the main reach of the reservoir, in areas with depth less than 3 m. The rest of the hydrophytes were located in multiple bays (gulfs) and billabongs along the upper and middle reach of the reservoirs (Figure 8).

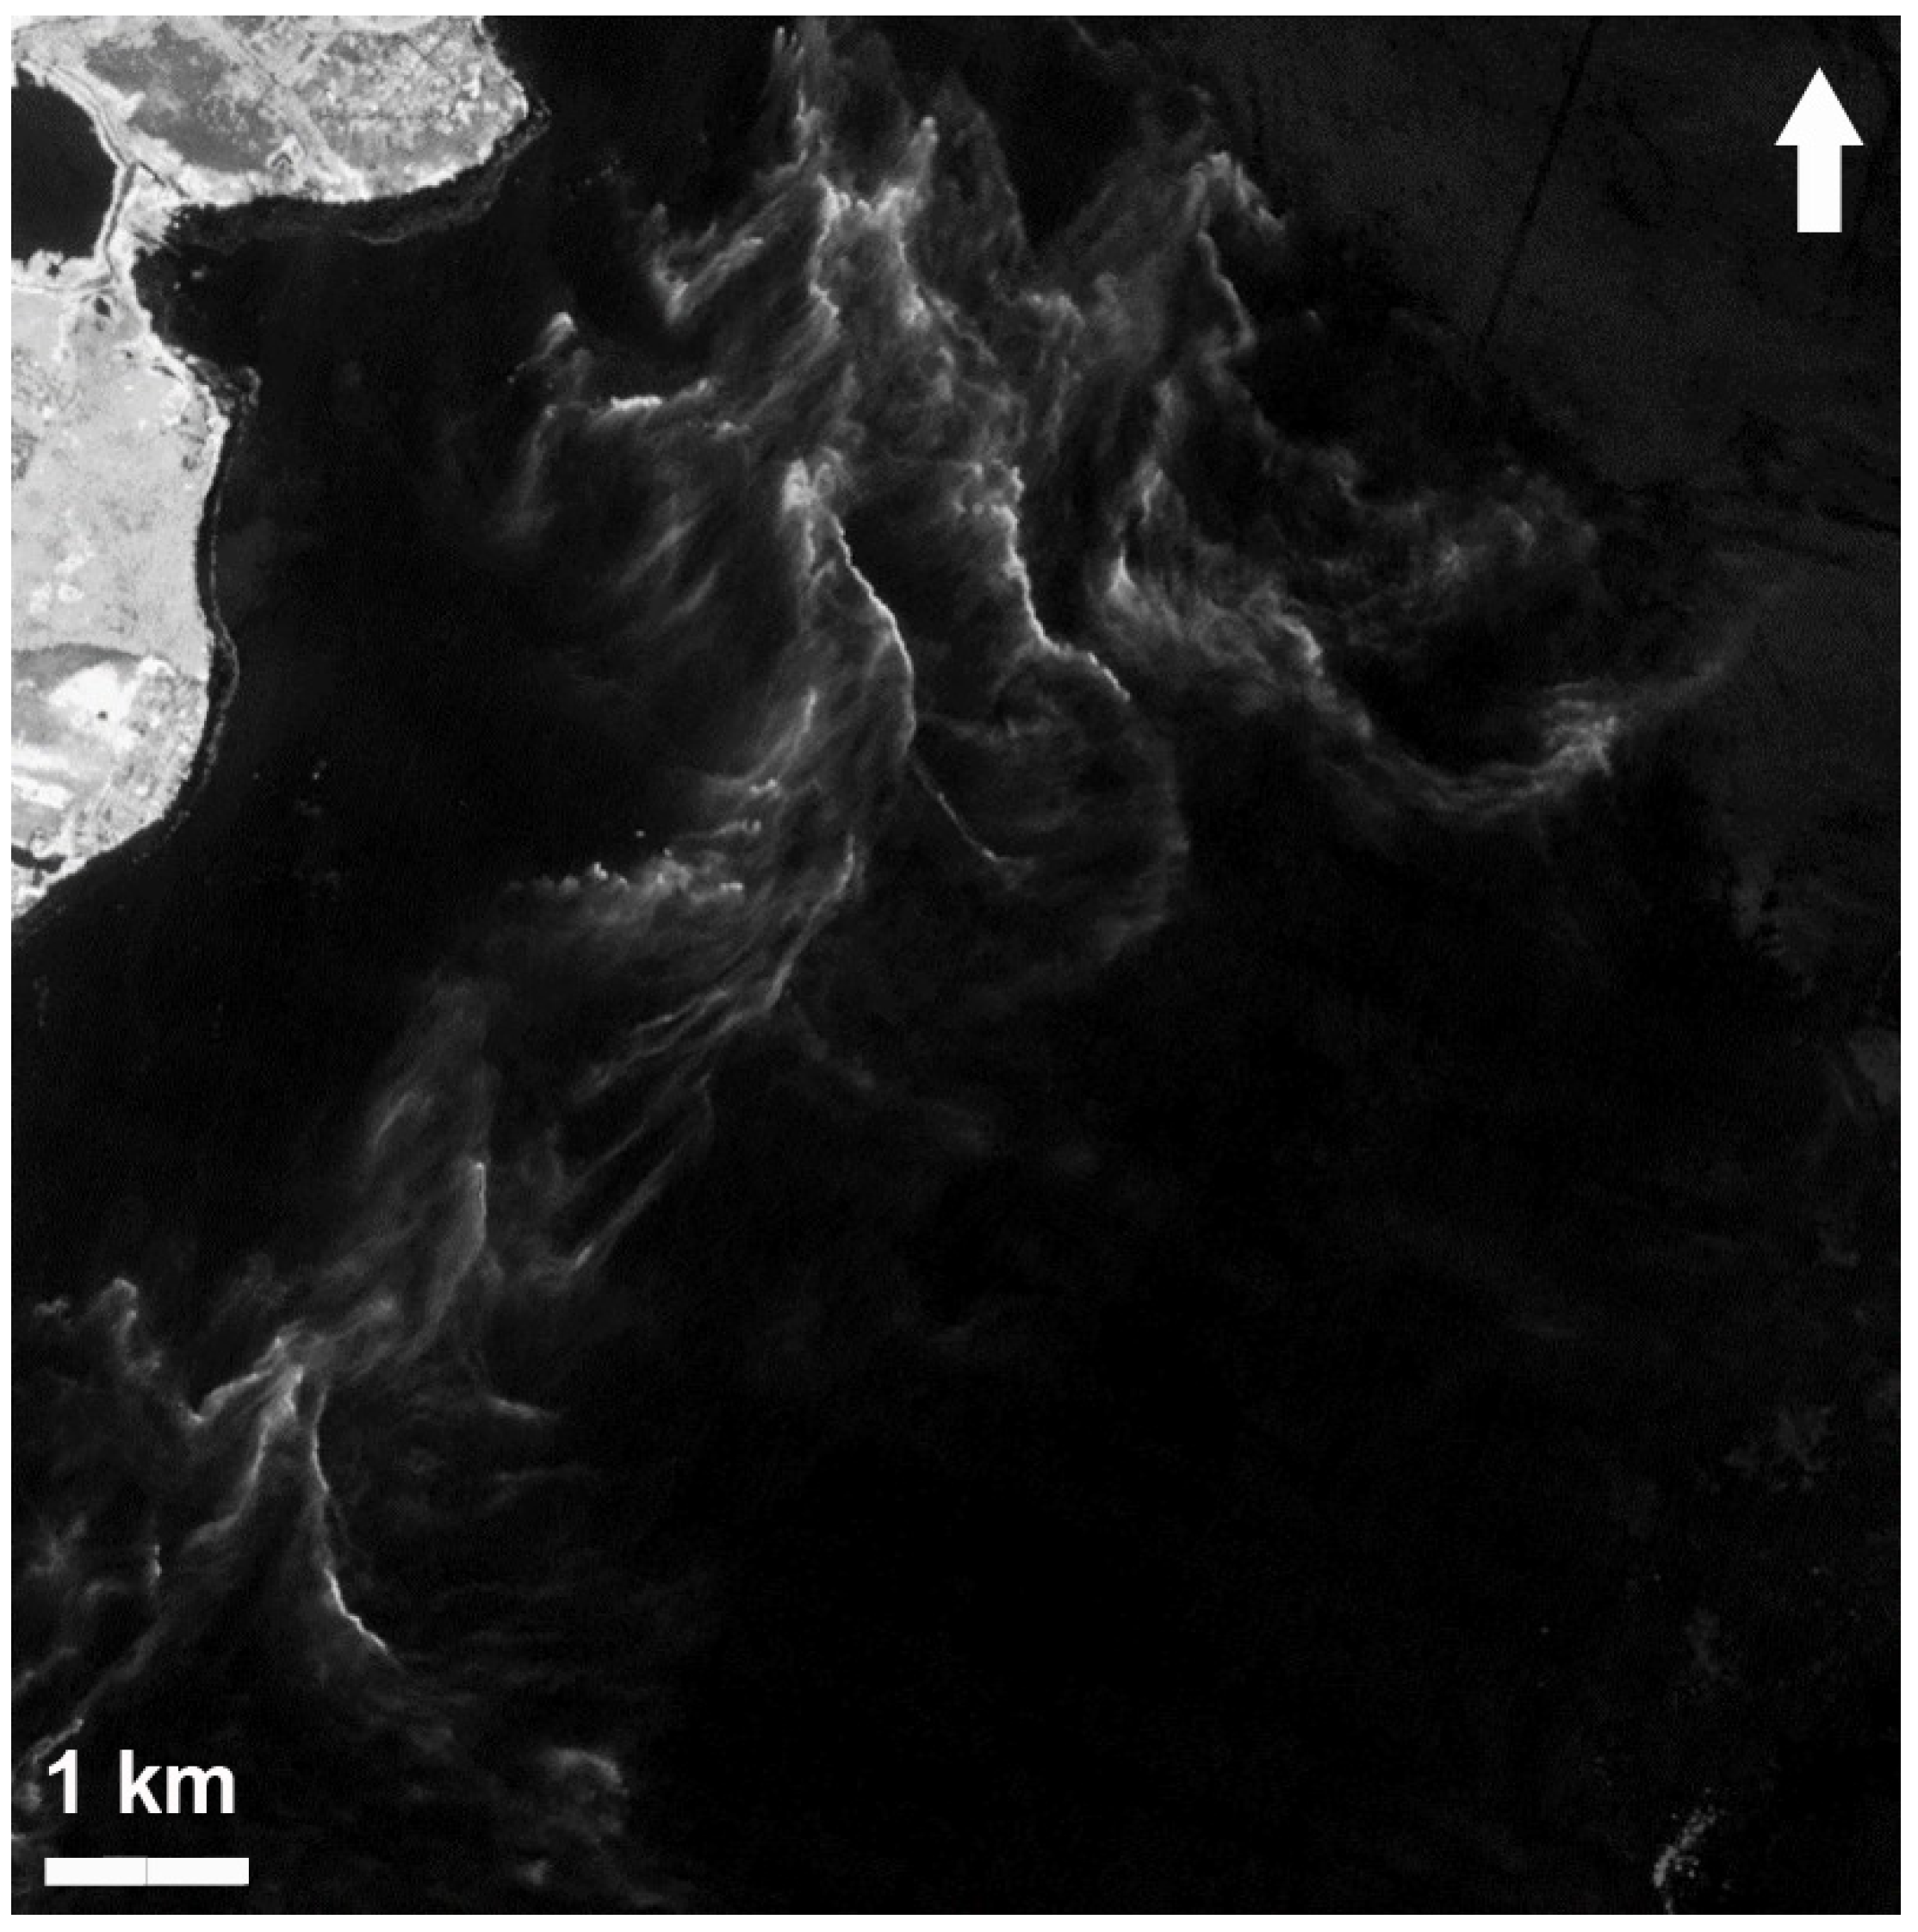
3.2. Distribution of Algal Blooms within the Kyiv and Kaniv Reservoirs

The remote sensing data from Sentinel-2 allowed us to visualize the distribution of the algal blooms in the Kyiv and Kaniv Reservoirs. The assessment was made following the “water” classification according to NDVI index described in the Methods section.
In Figure 9, one can observe the intensity of the water bloom that was caused by cyanobacteria (blue-green algae) in the Kyiv (Figure 9A) and Kaniv Reservoirs (Figure 9B). The change of colour from bright yellow to red one signifies the amount of algae.
It can be noted that the highest values of bloom-forming algae are in shallow and warmer areas. In turn, the algal bloom could be connected with the effect of wind impact that also forms water mass circulations that are visible by increases cyanobacterial abundance on the maps (Figure 9).

3.3. Hydrochemical Characteristics of the Reservoirs Studied

Analysing aquatic plant thickness and its impact on algal blooms, it is worth considering the Kyiv and Kaniv Reservoirs separately. They had wide ranges of dissolved oxygen (DO) values over the sites studied.
DO concentrations varied over a wide range: 3.8–18 and 3.3–10.4 mg/L (Table 1). DO deficiency can be defined as concentrations <4 mg/L and <50% saturation. Under these conditions, secondary pollution occurs by inorganic nitrogen and phosphorus compound intake from the bottom sediments. DO deficiency was observed in the Kyiv Reservoir along the right bank, which is impacted by Pripyat water masses with a high amount of humic substances, which are oxidized with important DO consumption. DO deficiency was also observed over the whole Kaniv Reservoir (Table 1). Increases in DO concentration were matched by simultaneous pH increases due to CO2 consumption during photosynthesis.
In the waters of the Kyiv Reservoir, ammonium nitrogen dominated among the inorganic N forms: its share varied between 41.6 and 89.2% and was 63.8% (Ninor) on average. The dominance of ammonium nitrogen additionally indicates the formation of a DO deficit and the predominance of pollution over self-purification in the water environment. The content of ammonium nitrogen, nitrite, and nitrate ions in the water of the Kyiv Reservoir was within the limits 0.047–0.249, 0.003–0.018, and 0.027–0.125 mg N/L, respectively. The content of inorganic, organic and total nitrogen in the Kyiv Reservoir in summer 2021 varied within 0.092–0.304, 0.395–1.723, and 0.525–1.913 mg N/L, respectively. The share of inorganic and organic nitrogen was 6.8–46.6 and 53.4–93.2% total dissolved nitrogen (TDN), respectively, i.e., nitrogen was mainly present in the form of nitrogen-containing organic compounds. According to TDN content, the Kyiv Reservoir can be classified as mesotrophic or eutrophic [61]. Concentrations of inorganic phosphorus, organic phosphorus with polyphosphates, and total phosphorus in the Kyiv Reservoir in summer 2021 amounted to 0.052–0.221, 0.138–0.374, and 0.254–0.506 mg P/L, respectively. The phosphorus of organic compounds, the share of which was 43.0–83.6% and on average 64.6% total dissolved phosphorus (TDP), dominated among the P forms. According to the TDP content, the Kyiv Reservoir was typically eutrophic as it exceeded 0.1 mg P/L [61].
The concentration ranges of ammonium nitrogen, nitrite, and nitrate ions in the Kaniv Reservoir were 0.023–0.215, 0.0–0.047, and 0.031–0.119 mg N/L, respectively (Table 2). Compared to the Kyiv Reservoir, the nitrite concentrations were slightly higher, whilst ammonium nitrogen and nitrate contents were similar. The average share of ammonium nitrogen and nitrate ions was 43 and 44% Ninorg, respectively. The content ranges of inorganic, organic, and total nitrogen in the Kaniv Reservoir in summer 2021 were 0.080–0.308, 0.547–1.266, and 0.732–1.529 mg N/L, respectively (see Table 2). The share of inorganic and organic nitrogen was 6.1–25.3 and 74.7–93.9% of TDN, respectively, i.e., N mainly occurred in the form of nitrogen-containing organic compounds. According to the TDN content, the Kaniv Reservoir was typically mesotrophic [61]. The concentrations of inorganic phosphorus, organic phosphorus with polyphosphates, and total phosphorus in the Kaniv Reservoir in summer 2021 were 0.193–0.331, 0.187–0.414, and 0.422–0.656 mg P/L, respectively (see Table 2). Thus, the phosphorus of organic compounds dominated, the share of which was 43.0–67.1% and on average 50.4% TDP. The Kaniv Reservoir could be characterized as eutrophic according to the TDP content [61]. In the Kaniv Reservoir, the contents of inorganic phosphorus, of organic phosphorus with polyphosphates, and of total phosphorus were on average 2, 1.1, and 1.4 times higher, respectively, than in the Kyiv Reservoir. Therefore, TDP increases in the Kaniv Reservoir depended on increases in the concentration of inorganic phosphorus. These inputs were due to drainage and wastewater, since the Kaniv Reservoir is under the anthropogenic influence of a metropolis, which is not the case of the Kyiv Reservoir.

3.4. Phytoplankton Taxonomic Composition and Quantitative Values in the Kyiv and Kaniv Reservoirs

The summer phytoplankton composition during intensive water blooms of the Kyiv and Kaniv reservoirs included 124 species. Algal and cyanobacterial composition at the division level was as follows: Chlorophyta—48 species, Bacillariophyta—42, Cyanobacteria—13, Euglenozoa—9, Miozoa (Dinophyceae)—8, Ochrophyta (Chrysophyceae and Xanthophyceae)—3, Charophyta—1.
In the Kyiv Reservoir, species amount of algae in plankton varied from site to site in a comparable way in the range of 16–44 species found per sampling site. Within the aquatic plants, 25–44 species were typically present in the phytoplankton. In the sampling points with relatively small distance from the aquatic plants (2 m), 16–38 species of algae were found. The samples from open areas without aquatic plants included 18–22 species of algae in plankton.
Similar species numbers of algae were observed for the Kaniv Reservoir, where species numbers per site varied from 13 to 27: 19–27 species among the aquatic plants, 15–21 species 2 m from them, and 13 species in the open water.
Quantitative parameters of the phytoplankton (abundance and biomass) provided uneven figures. In the Kyiv Reservoir, the abundance of algal cells varied from 280 × 103 to 222,625 × 103. In macrophyte patches, phytoplankton cells varied from 4180 × 103 to 34,490 × 103. At a distance of 2 m from aquatic plants, algal abundance was from 980 × 103 to 32,332.5 × 103 cells. In open waters, the abundance was 280 × 103–222,625 × 103 cells.
The Kaniv Reservoir (1300 × 103 cells to 65,835 × 103 cells) also had diverse values that varied as follows: from 2002.5 × 103 to 37,287.5 × 103 cells in stands of aquatic plants, from 1300 × 103 cells to 65,835 × 103 cells at a distance of 2 m from aquatic plants, and 15,165 × 103 cells in open waters.
The most numerous representatives of cyanobacteria in the Kyiv and Kaniv reservoirs were Dolichospermum flosaquae (Brébisson ex Bornet and Flahault) P. Wacklin, L. Hoffmann and J. Komárek, Microcystis aeruginosa (Kützing) Kützing, Microcystis flosaquae (Wittrock) Kirchner, and Microcystis wesenbergii (Komárek) Komárek ex Komárek.

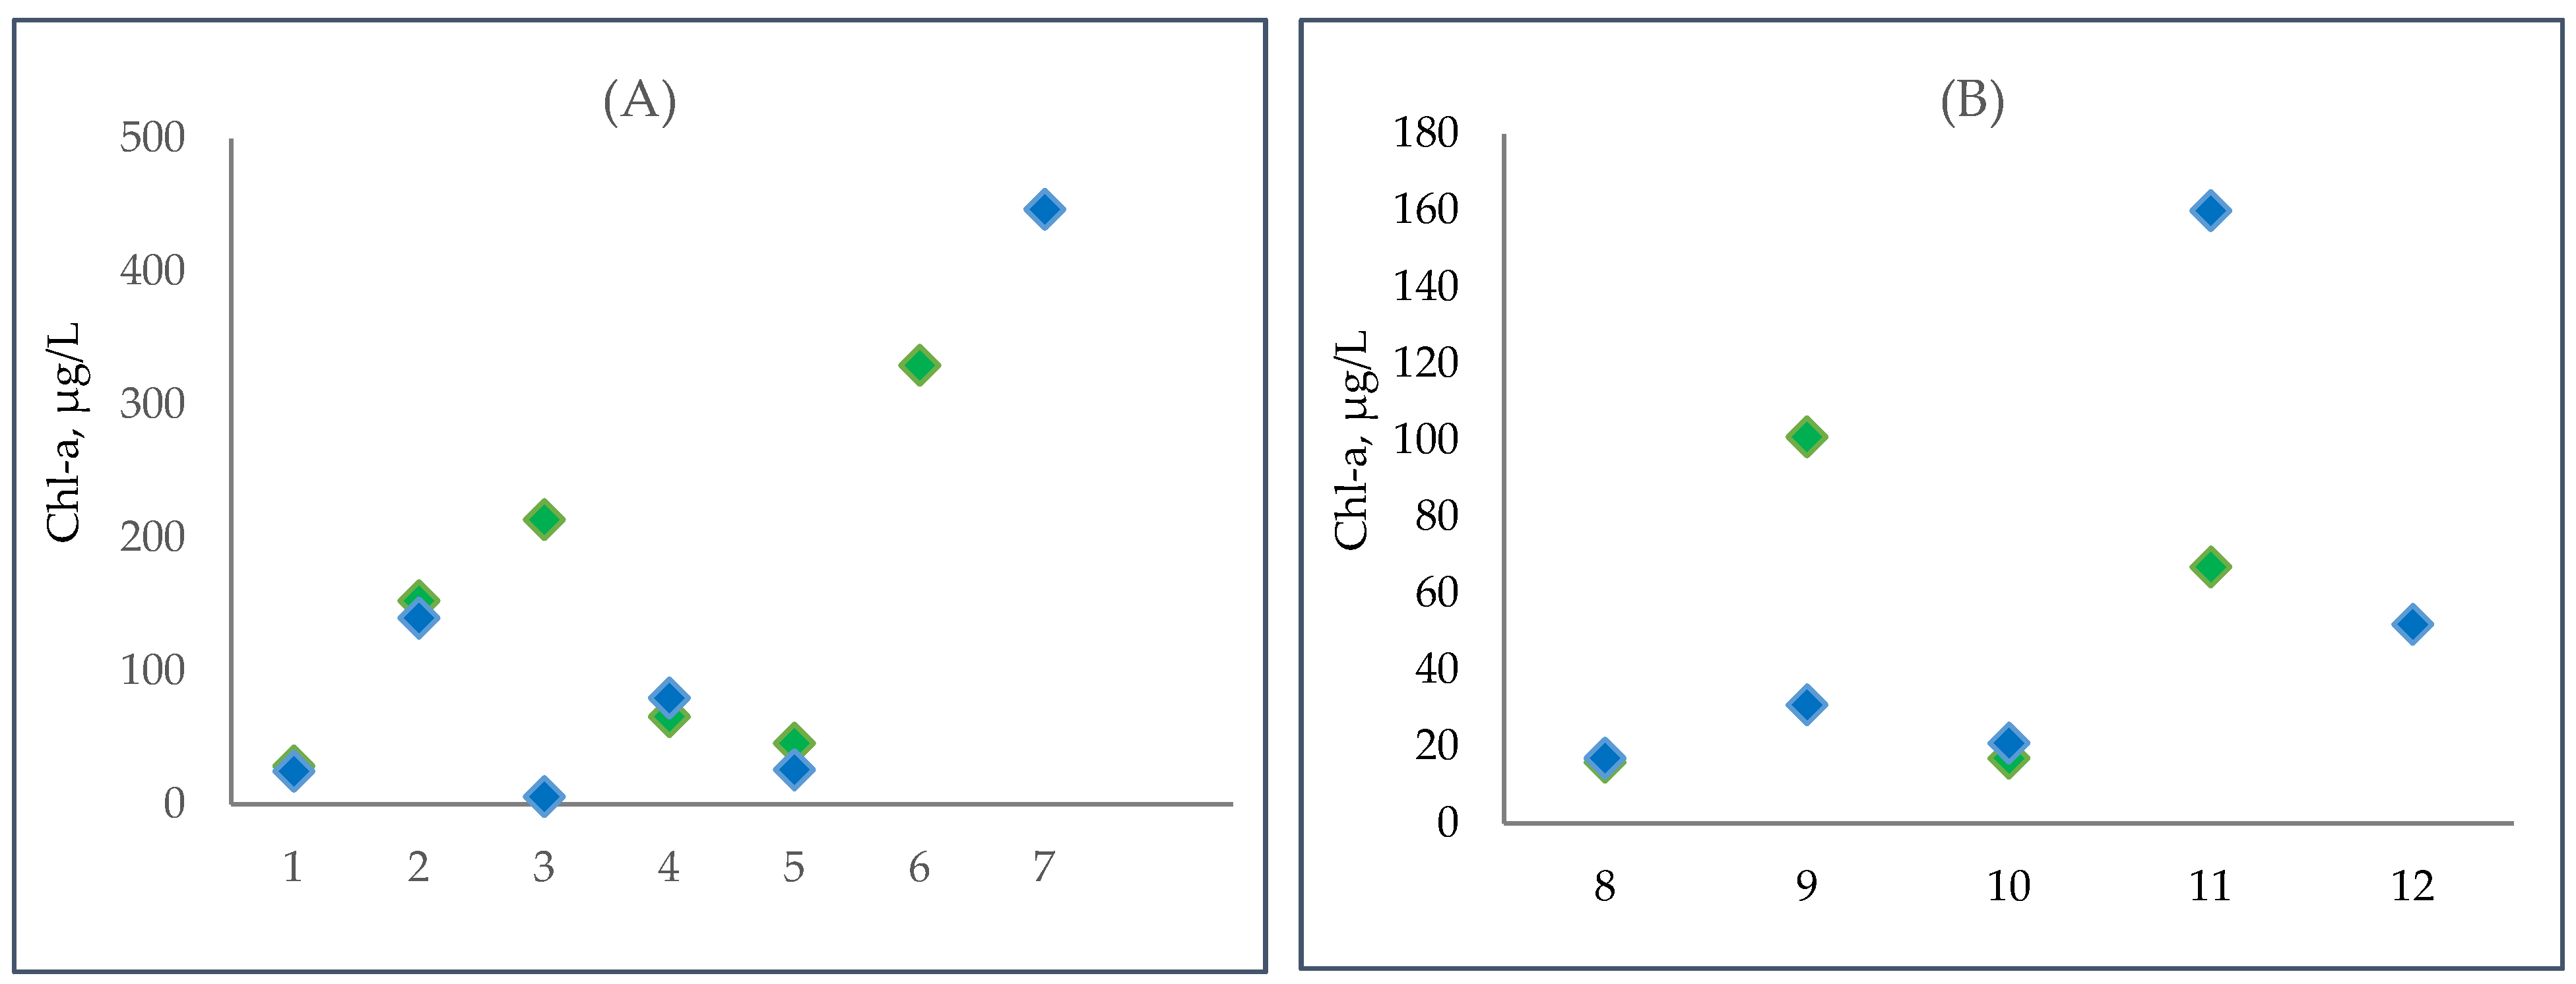
3.5. Changes in Phytoplanktic Chlorophyll a Concentration in the Kyiv and Kaniv Reservoirs

Chlorophyll a values are commonly used to detect algal blooms and understand their dynamics as well as to estimate primary productivity [62,63].
In the Kyiv Reservoir (Figure 10A), [Chl-a] in macrophyte patches ranged from 35 to 445 μg/L, whilst in the open water it ranged from 6 to 333 μg/L. The maximum values of this parameter were recorded at sites 6 and 7. At most sampling points, [Chl-a] in macrophyte stands did not differ significantly from that recorded in open water (p > 0.05).
In the Kaniv Reservoir (Figure 10B), the [Chl-a] in areas overgrown with macrophytes varied from 16 to 101 μg/L, and in areas without macrophytes, it varied from 17 to 160 μg/L. The maximum values were recorded at site 11. At this station, a significant decrease of the [Chl-a] in macrophyte patches was also observed compared to the open water (p ≤ 0.05). At other sampling stations, a significant effect of macrophytes on the [Chl-a] was either not observed (sites 8 and 10) or even an increase was recorded (site 9).

3.6. Statistical Analysis of the Interactions between Aquatic Plants and Cyanobacterial Blooms

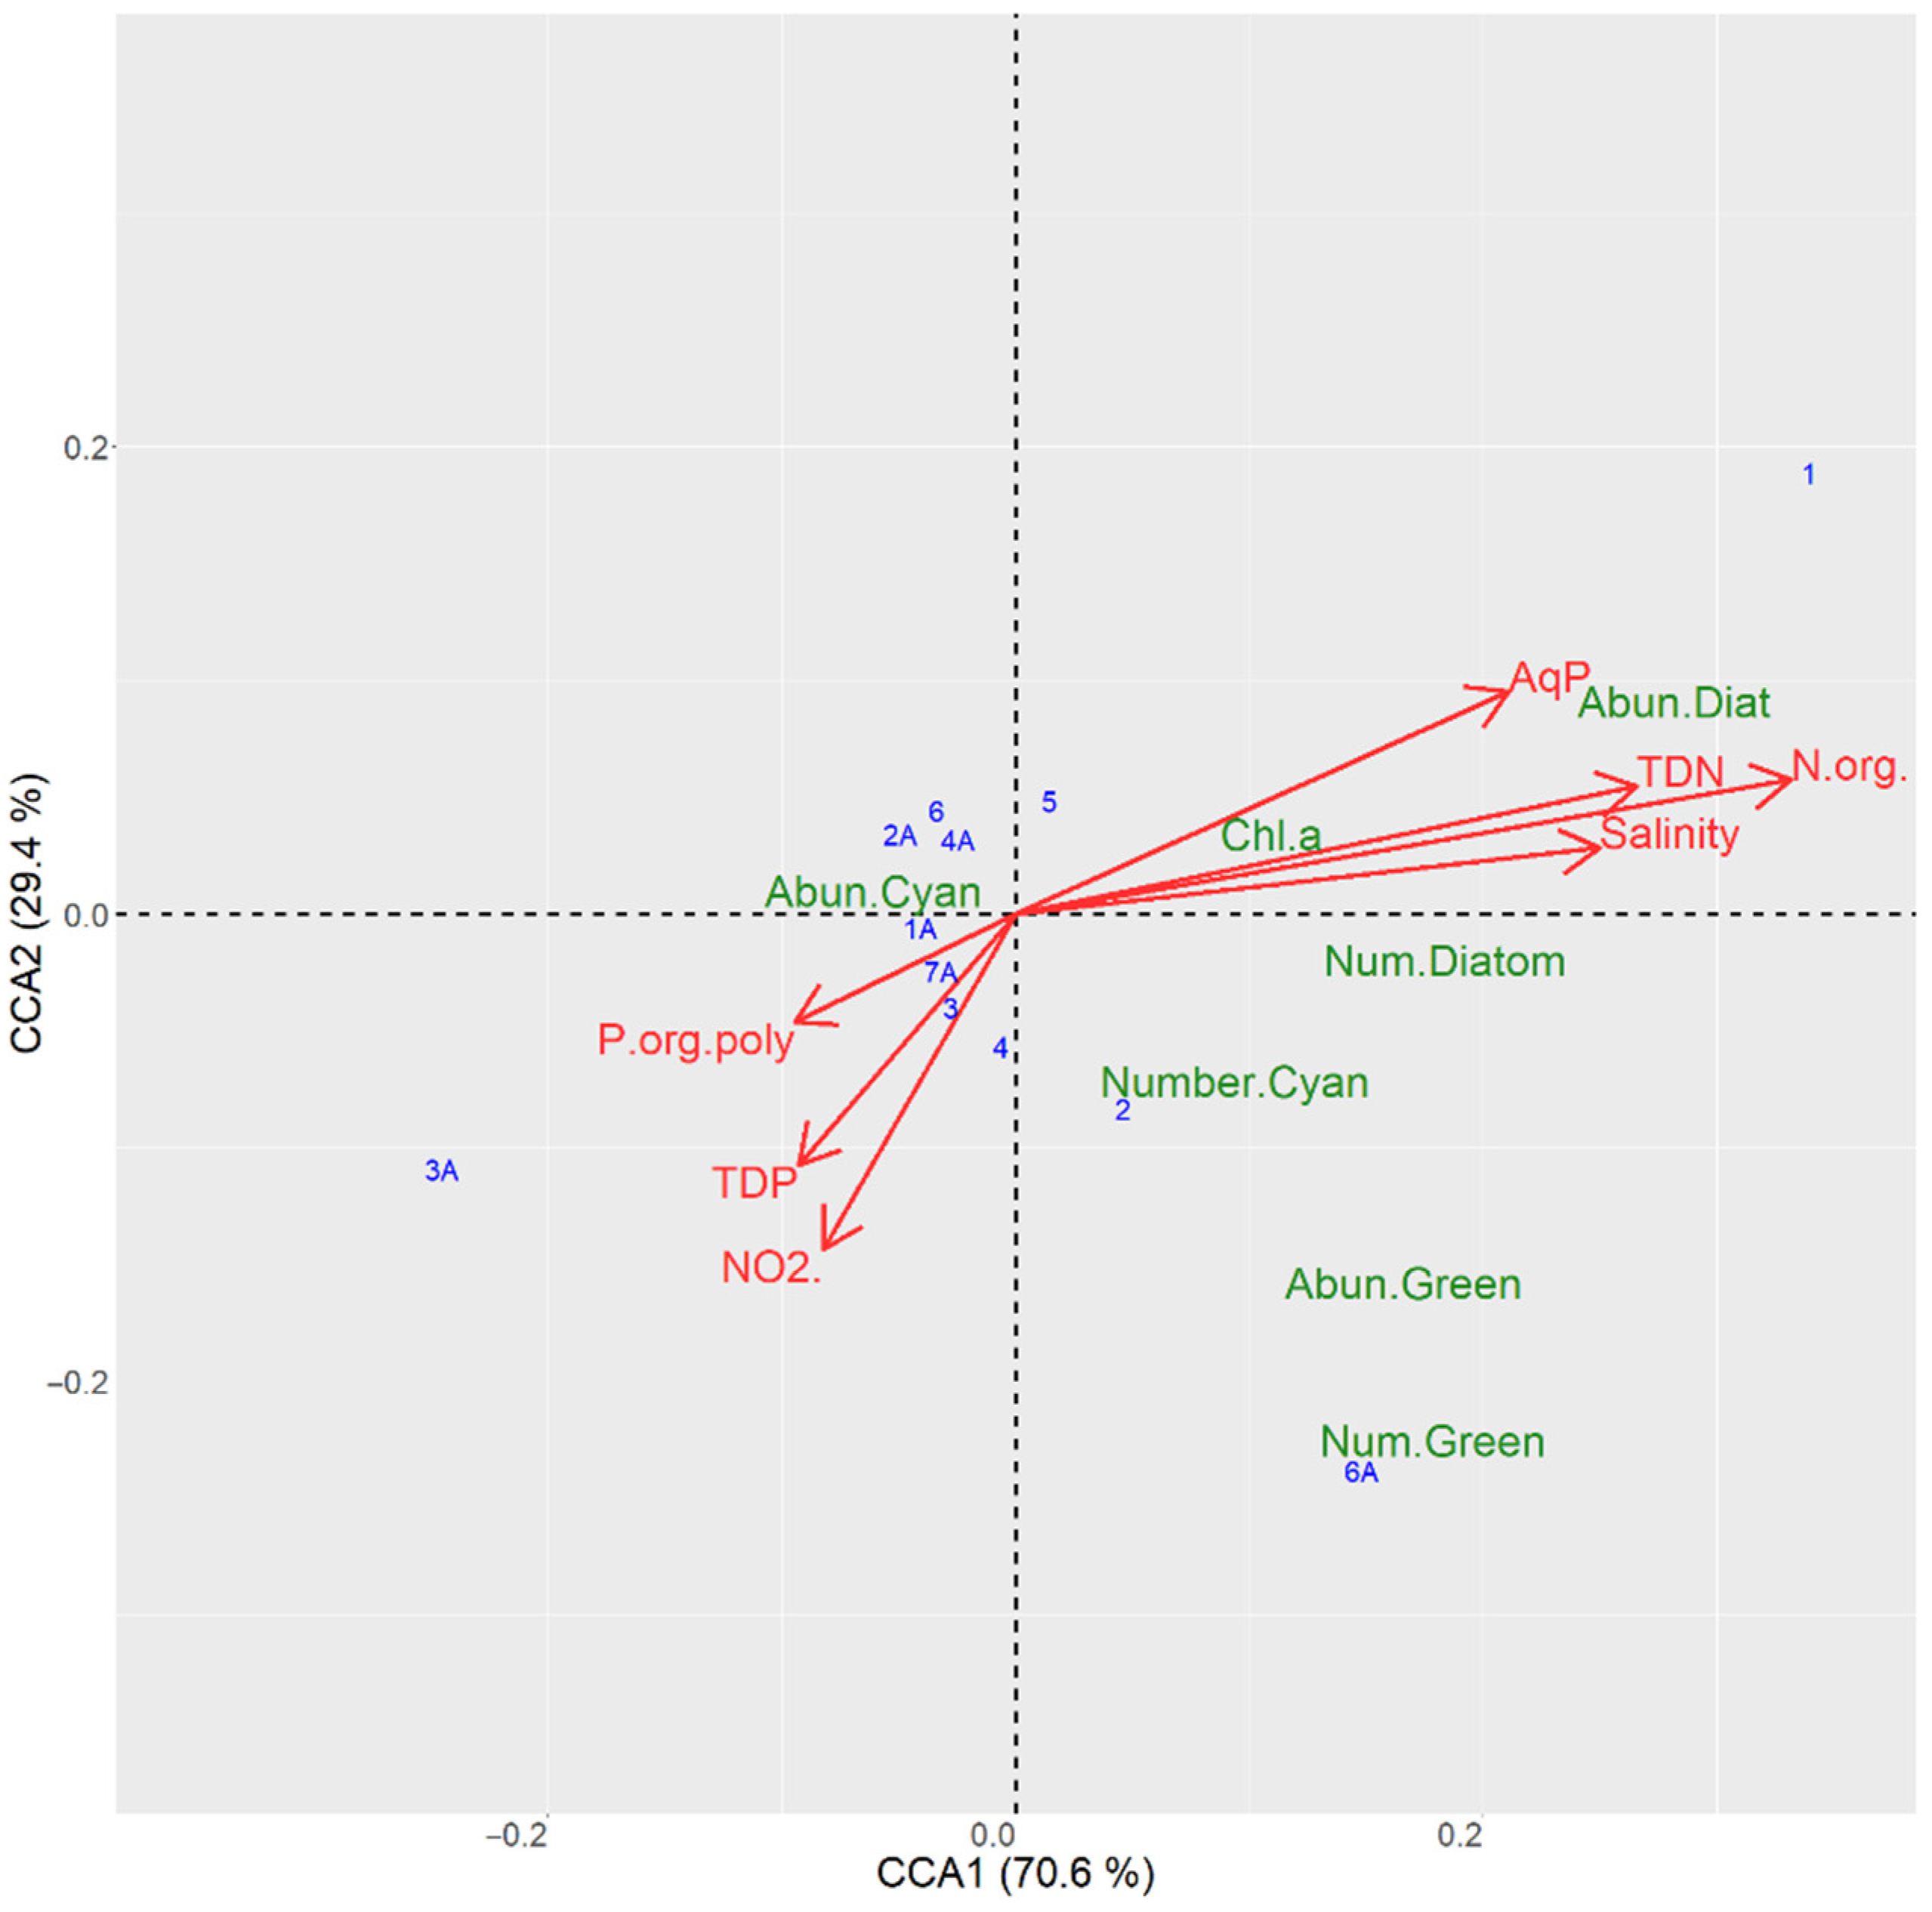
3.6.1. CCA Ordination for the Sampling Sites in the Kyiv Reservoir

ANOVA-like Monte Carlo permutation tests in CCA showed that phytoplankton structure was significantly related to several environmental variables (Table 5 and Table 6, Figure 11). Specifically, the species number and abundance of Chlorophyta were weakly related to higher water salinity and inorganic nitrogen and phosphorus compounds but independent from organic phosphorus compounds, polyphosphates, and the presence of aquatic plants. The species number and abundance of Bacillariophyta were related to higher salinity, total and organic nitrogen compounds, the presence of aquatic plants, and to lower phosphorus compounds and NO2.
The species number and abundance of Cyanobacteria were roughly inversely related. The abundance was weakly inversely related to the presence of aquatic plants, salinity, and total and organic nitrogen, and directly related to higher organic phosphorus compounds and polyphosphates. The number of Cyanobacteria species, just like Chlorophyta, was weakly related to higher salinity and inorganic nitrogen and phosphorus compounds but independent from organic phosphorus compounds, polyphosphates, and the presence of aquatic plants. Chlorophyll a, indicative of total phytoplankton abundance, was directly related to the presence of aquatic plants, salinity, and total and organic nitrogen, and inversely related to higher organic phosphorus compounds and polyphosphates.

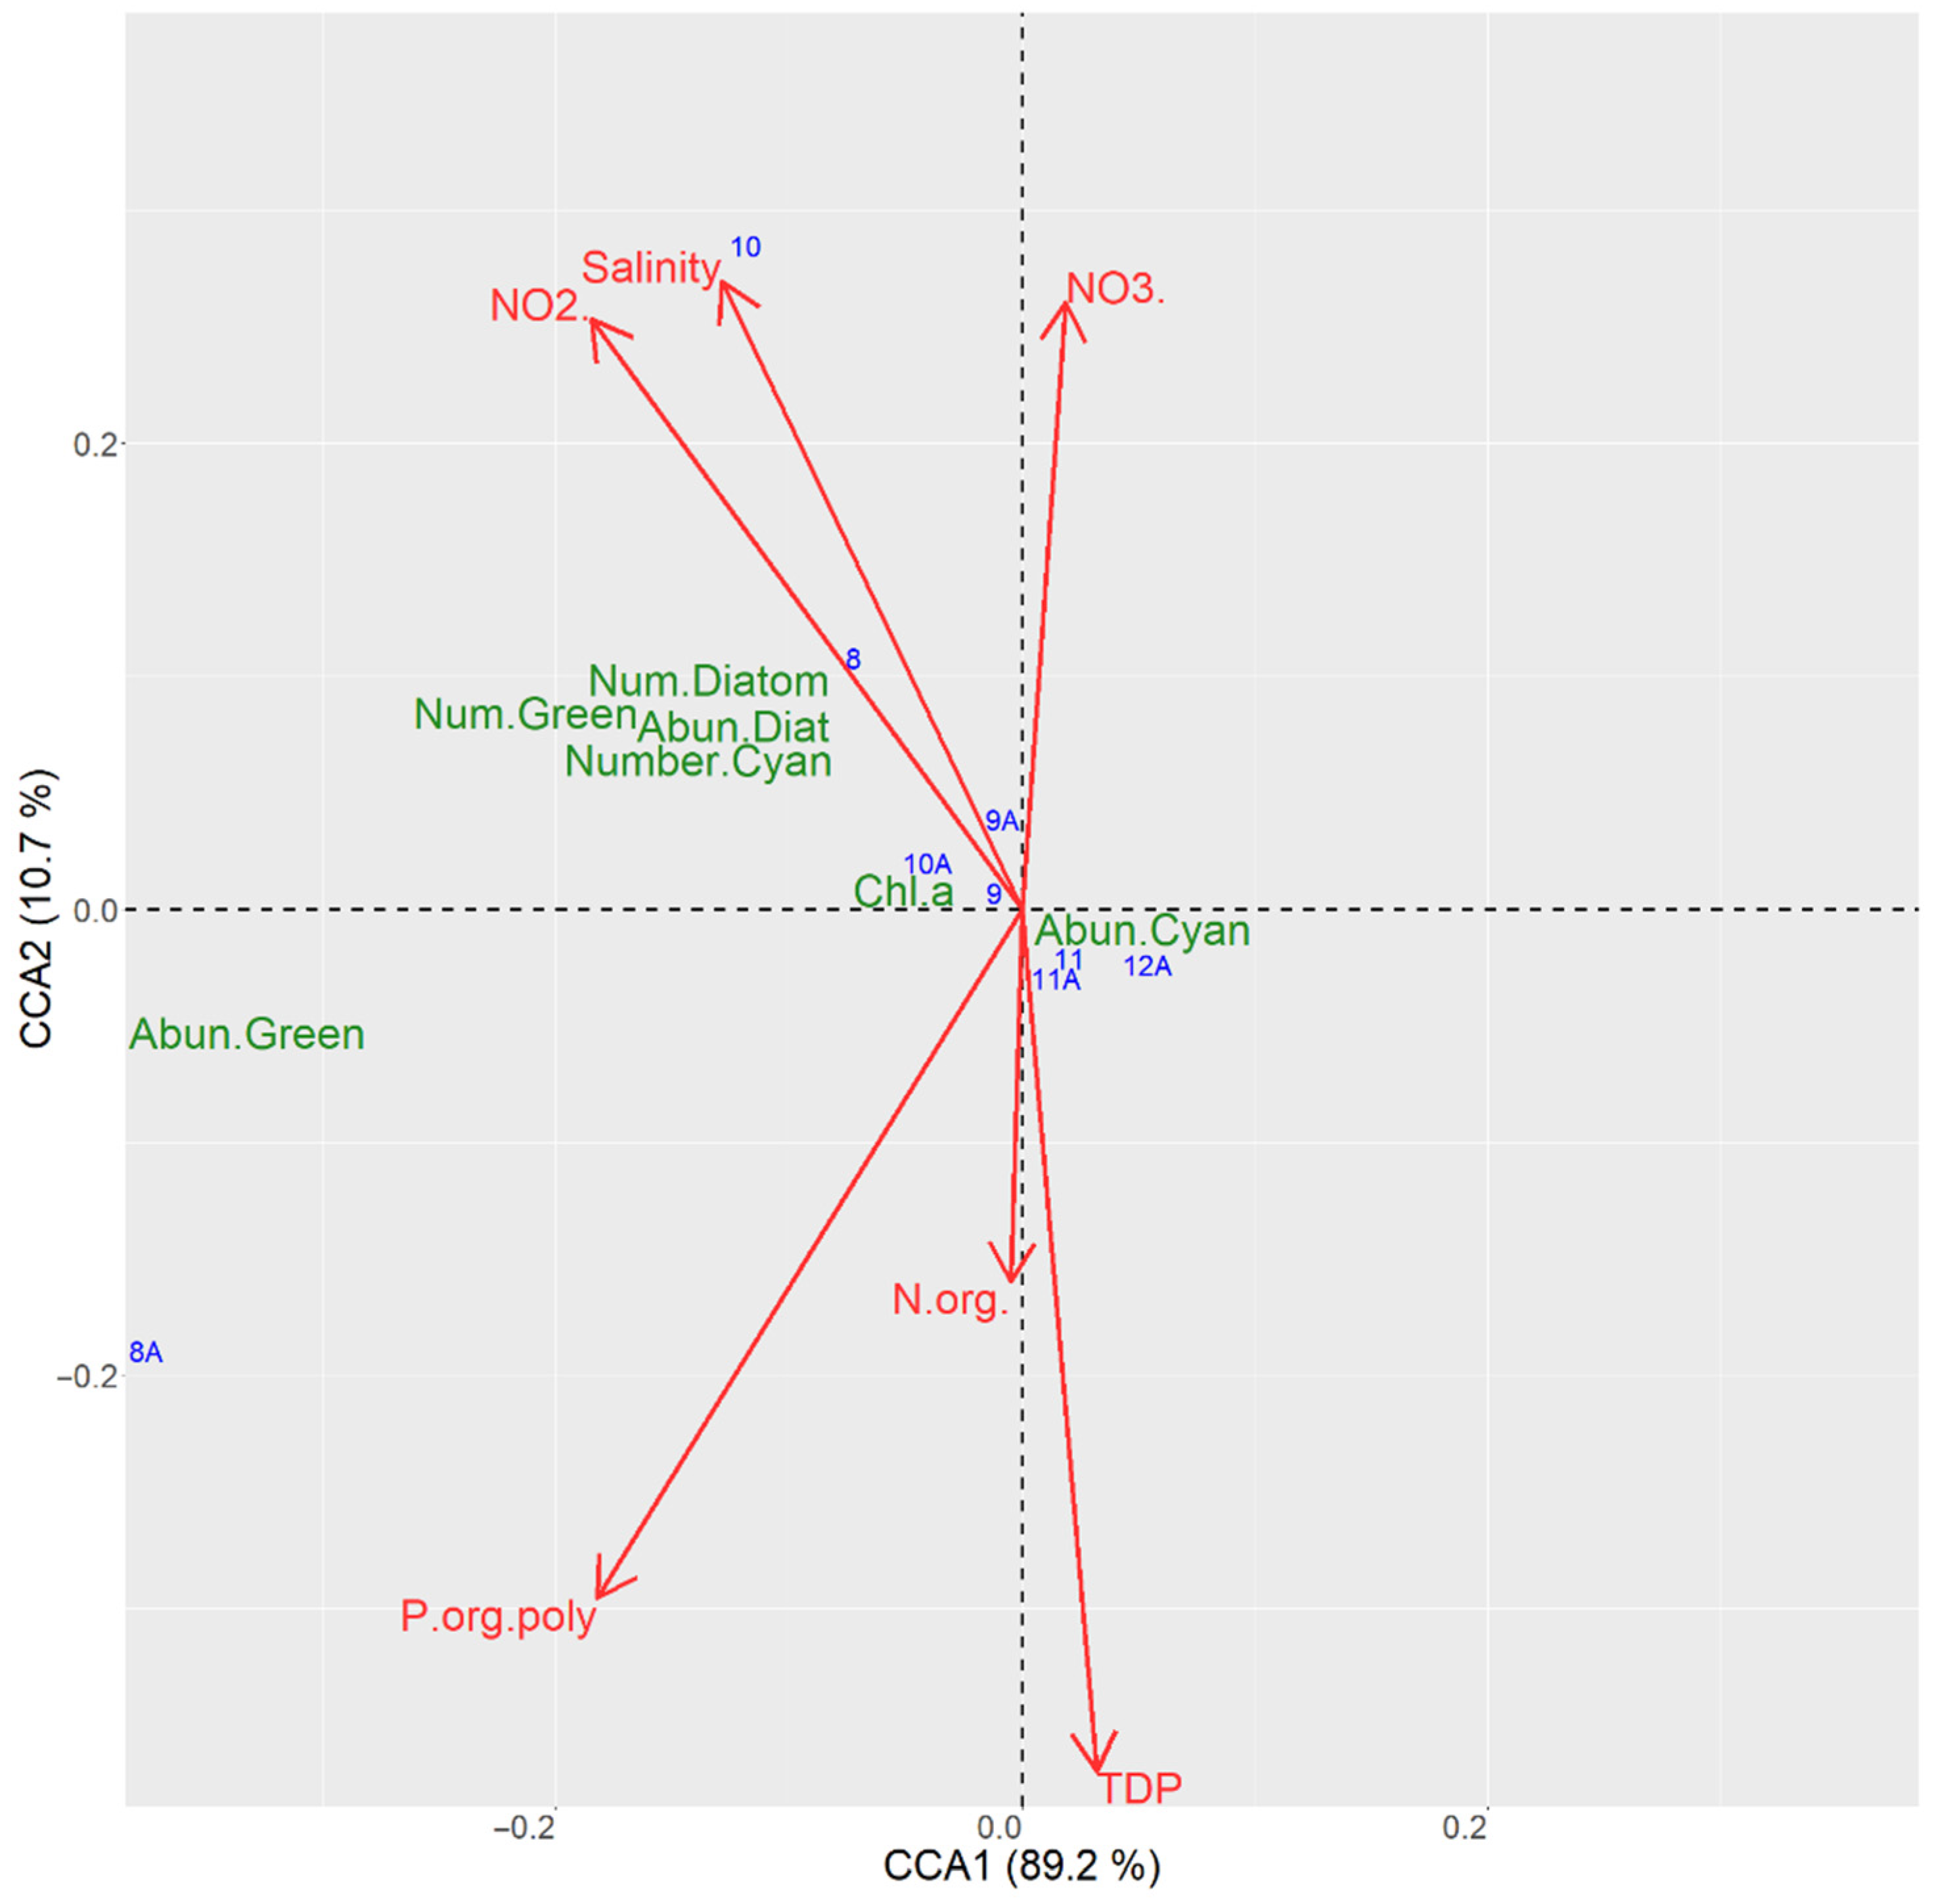
3.6.2. CCA Ordination for the Sampling Sites in the Kaniv Reservoir

In the Kaniv Reservoir, Chlorophyta abundance was weakly related to higher salinity, NO2, organic phosphorus compounds and polyphosphates but independent from NO3, the presence of aquatic plants, and organic nitrogen compounds, while Chlorophyta species numbers were also directly related to the presence of aquatic plants (Table 7 and Table 8, Figure 12).
The species number and abundance of Bacillariophyta were related to higher salinity, NO2, NO3, and the presence of aquatic plants, and to lower total phosphorus compounds and organic nitrogen compounds. The species number and abundance of Cyanobacteria were roughly inversely related. The abundance was weakly inversely related to the presence of aquatic plants, salinity, NO2, and NO3, and related to higher total phosphorus compounds. The number of Cyanobacteria species, just like Chlorophyta, was weakly related to higher salinity, the presence of aquatic plants, and NO2 but independent from organic phosphorus compounds and polyphosphates. Chlorophyll a was directly related to the presence of aquatic plants, salinity, and NO2, and inversely related to total phosphorus compounds.
The effects of aquatic plants on phytoplankton that were consistent between the two reservoirs were as follows: higher species number and abundance of diatoms, higher chlorophyll a, and lower abundance of Cyanobacteria. Furthermore, aquatic plants were associated with higher salinity, nitrogen, and lower phosphorus compounds.

4. Discussion

4.1. Spatial Distribution of Patches of Floating-Leaf and Free-Floating Macrophytes in the Kyiv and Kaniv Reservoirs

The Kyiv and Kaniv Reservoirs have relatively small depths and large areas of shallow waters [14,23,64,65,66]. Analysis of current and retrospective data [67,68,69,70,71] testifies a noticeable increase in the overgrowth of shallow areas of these reservoirs with aquatic plants. A reduction in the areas colonized by submerged vegetation and an increase in the areas with floating-leaves and free-floating plants could also be pointed out.
The areas of aquatic macrophyte patches in the Kyiv and Kaniv Reservoirs in 2021 were estimated based on data from space images of the same year. The calculations reveal that plants with floating leaves and free-floating plants occupy 18% of the total area of the Kyiv Reservoir, considering dense and sparse vegetation together. The same calculations revealed 23% coverage of the total area of the Kaniv Reservoir by different types of aquatic plants. For our interactions study, the crucial datum is the percentage of coverage of shallow areas. For the Kyiv Reservoir, the percentage of shallow area coverage by aquatic plants is 34%, and for the Kaniv Reservoir, where the shallow areas are not that much developed, it is estimated to be 26%. It is worth mentioning that the coverage estimates provided are true only for the year of investigation and could vary from year to year depending on the specific meteorological and hydrological conditions.
Investigations carried out in 2014 reveal a smaller percentage of coverage of the upper part of the Kaniv Reservoir than the one calculated by us in the present study (2021) [68]. Results of previous studies showed that the area occupied by plants with floating leaves varied from 5 to 8.3 km2 from May to June, even within one year [72]. Thus, thoughtful calculations and prediction modelling based on a long period of observations should be carried out before undertaking any management solutions regarding the reduction of the amount of aquatic plants.
The situation in 2021 also showed that the shallow waters of the river section of the reservoirs are overgrown most intensively with common aquatic plants for this area over the modern period of existence of the reservoir. For both reservoirs, we observed a typical distribution pattern: the plants with floating leaves were somewhat less present in the transitional section and had the lowest cover in the lake section. In the upper part of the reservoirs, among the dominant plant species, the leading place was occupied by water caltrop (Trapa natans L.). Downstream, the share in patches decreased, while that of other plants with floating leaves [yellow waterlily, Nuphar lutea (L.) Sm.], white waterlily [Nymphaea alba (L.) All.] increased. In addition, free-floating vegetation [common duckweed (Lemna minor L.), floating fern (Salvinia natans (L.) All.], and riparian aquatic vegetation [common reed (Phragmites communis Trin.), narrowleaf cattail (Typha angustifolia L.), broadleaf cattail (Typha latifolia L.) etc.] grew intensively.
The most significant role in the formation of aquatic macrophyte patches is played by the morphology of the reservoir, by the nature of the banks and their erosion, by fluctuations in water levels, current speed, by the chemical composition of the water, and bottom sediments [67,68,69,73,74,75,76,77]. When water-level fluctuations and current speed decrease, changes in the structure of communities are observed, and plants with floating leaves and free-floating plants begin to occupy a dominant position in the phytocoenosis [67,73,75]. Therefore, the reduction of water-level fluctuations is the main factor that allows new species to enter the phytocoenosis. Plants with floating leaves belong to species that change environmental conditions unfavourably for former dominants. During the period of generative maturity (5–7 years), there is a strong branching of the root, which allows them to inhabit increasingly large areas [67]. The advantage of Trapa natans compared to other plants with floating leaves (Nuphar lutea, Nymphaea alba) is that it forms a long-branched root, with the help of which its rooting takes place. This allows it to settle in deeper water areas (below 3.5 m) as well as in areas with frequent fluctuations in water level and current speed [68,70,74,75]. Instead, N. lutea and N. alba prefer shallower areas with reduced water-level fluctuations, and in these areas, they limit the spread of T. natans. In particular, this is due to the fact that N. lutea develops earlier and, limiting the availability of light, delays its transition from the heterotrophic to the autotrophic phase [73,74,75]. This explains the decrease in the share of T. natans in the communities of higher aquatic plants downstream. The area and density of macrophyte patches were determined by the degree of water pollution with autochthonous and allochthonous nutrients.

4.2. Spatial Distribution of Cyanobacterial Blooms in the Kyiv and Kaniv Reservoirs

The results of the investigations conducted in nature reveal significant spatial variations in the quantitative (number of cells, biomass, and concentration of chlorophyll a) and qualitative (species composition) features of the phytoplankton in the ecosystems of the Kyiv and Kaniv Reservoirs; this trend can also be traced in earlier studies [78,79,80,81,82]. In reservoirs, such elements of hydrodynamics as flow speed, mixing, wave processes and water-level fluctuations are the main factors that influence physical and chemical conditions and determine phytoplankton biomass and diversity [79,80,83,84,85,86,87,88,89,90,91]. During the research period, phytoplankton biomass was mainly formed by cyanobacteria and diatoms. Intensive cyanobacterial blooms were recorded in the middle (transitional) section of the Kyiv and Kaniv Reservoirs. Conversely, intermediate values of the quantitative indicators of the growth of these planktic algae were recorded in the lower (lake) section and minimum values in the upper (river) section. The fact that the main causative agents of water bloom were toxin-producing species, Dolichospermum flosaquae and Microcystis aeruginosa, causes serious concerns as this water is often used for drinking purposes after purification in special water treatment plants.
The river sections of the reservoirs are characterized by inputs of large amounts of nutrients, but light attenuation and general lotic conditions limit cyanobacterial growth, in agreement with the results of similar studies [81,82,84,86,89,90]. On the other hand, in the middle (transitional) and lower (lake) areas of reservoirs, conditions such as slowing down of water-flow speed, higher sedimentation of suspended solids, and, as a result, higher transparency, better penetration of light through the water column, and heating of water masses favour cyanobacterial growth. Moreover, higher nutrient concentrations and ratios contributed to an increase in phytoplankton abundance and species richness, in particular of cyanobacterial species, as also found in previous studies [79,81,84,89,90]. Canonical correspondence analysis (CCA) showed that higher concentrations of nitrogen compounds and lower concentrations of phosphorus compounds contributed to the increase in phytoplankton biomass. In addition, this analysis demonstrated a close relationship between qualitative and quantitative indicators of phytoplankton and higher aquatic plants.

4.3. Interactions between Aquatic Plants and Cyanobacterial Blooms

Floating-leaf plants and free-floating plants are known for their ability to reduce the number of phytoplankton cells due to different interactions. Such interactions are especially relevant when the amount of cyanobacteria (blue-green algae), cells and biomass, that should be reduced is enormous. As one of the main reasons for algal blooms is the high amount of nutrients, the potential role of the named aquatic plants can be important in reducing nutrient availability (ammonia, nitrates, and phosphates) for hydrobionts [92,93,94,95]. Thus, such a process can be one of the possible actions for preventing cyanobacterial blooms.
Another key point of the interactions between aquatic plants and algae is their effective attenuation of the incident light (i.e., the dark conditions that prevail under dense floating plant mats) [21]. As light is one of the most important conditions for blue-green algae growth, the lack thereof can reduce or even prevent cyanobacterial blooms. The secretion of allelochemicals and increased densities of herbivorous zooplankton may also contribute to the decrease in algal abundance when floating-leaf plants and free-floating plants are dominant [15,96,97]. All the discussed interactions are good methods to fight against algal blooms, the intensity of which is also projected to increase due to climate change.
Such background information helped us to test the hypothesis that floating-leaf plants and free-floating plants can inhibit or reduce the massive development of cyanobacteria. Our results indicate that, in macrophyte patches, phytoplankton structure differed from that observed in open waters, in particular by a higher number of diatoms and a lower number of cyanobacterial species. This is because low light availability favours phytoplankton species with physiological and morphological characteristics that improve their adaptation to such conditions [93,94,95]. Many species of Bacillariophyta are well adapted to low light conditions [98,99]. Diatoms living in low-light areas (turbid estuaries, shaded stream segments, and high-latitude lakes) have been shown to have high amounts of chlorophyll a but low xanthophyll quantity [98].
In turn, low light conditions could also be the reason for changes in the morphological characteristics of algae, such as an increase in cell size and volume, surface-to-volume ratio, etc. [95]. However, we did not observe a reduction in total biomass of phytoplankton and cyanobacteria in the areas of reservoirs dominated by floating-leaf plants and free-floating plants. One of the possible explanations of such a case is the adaptive strategies of some species of cyanobacteria to poorly illuminated environments [11,21].
At some research stations, phytoplankton biomass was even higher in overgrown areas as compared to open waters. We assume that this phenomenon could be associated with wind-wave action as it is known that, due to wind-wave activity, phytoplankton can accumulate in large quantities in areas overgrown with plants with floating leaves, where it will remain due to the reduced flow [67,100].
The suppression of the growth of harmful cyanobacterial taxa by macrophytes is observed with the simultaneous action of different mechanisms, for example, dark conditions and limited access to nutrients, i.e., when a synergistic effect occurs [15,21]. However, according to the obtained results, a decrease in the concentration of biogenic substances to a level that would limit the growth of cyanobacteria in reservoirs was not observed. Intensive overgrowth of the river sections of the Kyiv and Kaniv Reservoirs with floating-leaf plants (in particular, water caltrop), on the contrary, contributed to the enrichment of water with nitrogen and phosphorus compounds. The almost complete restriction of light access under dense patches of water caltrop inhibits the growth of submerged macrophytes, which leads to a deficiency of dissolved oxygen in the river sections of the reservoirs. Indeed, a particularly low oxygen content (0.2–1.7 mg/L) was observed in the bottom layer of the Kyiv Reservoir [69]. The same trend was shown for the eutrophic Lake Inba, Japan, where Trapa natans prevailed and the bottom layer had low oxygen content, even causing anoxia in some cases [101]. The anoxia plays an important role in the release of nutrients from sediments, potentially promoting the growth of macrophytes and phytoplankton [95,102]. In addition, anoxic conditions promote the heterotrophic microflora, which participate in the mineralization of organic matter, which also contributes to the enrichment of water with biogenic substances [102].
A decrease in dissolved oxygen concentration can also occur as a result of the death and decomposition of plants of the lower layer in macrophyte communities. This is confirmed by the increase of organic nitrogen and phosphorus concentrations in the areas occupied by dense floating-leaf plant patches. Among the submerged macrophytes, one of the dominant species in the Kyiv and Kaniv Reservoirs is Potamogeton perfoliatus L. It has three generations during the growing season. The first generation accumulates the maximum biomass in July, the second in August, and the third in October [68]. The dying of the first generation occurs in late July–early August [68], which coincided with the period of our research. Since cyanobacteria are mixotrophs, they can use both inorganic and organic forms of nitrogen and phosphorus to maintain their metabolism. This ability is related to the presence of specific enzymes. For instance, they can assimilate phosphorus from organic compounds with the participation of phosphatases [11,103].
It should be noted that the enrichment of water with biogenic substances could be facilitated by the influence of not only the biotic factor (intensive overgrowth of water bodies with macrophytes) but also abiotic factors such as the supply of nutrients with surface runoff and, possibly, warming of the water column due to global climate change. Obviously, the complex influence of all these factors led to a decrease in the competition between macrophytes and phytoplankton for biogenic substances. This trend was also observed in the studies of other authors, in particular, Peretyatko et al. [19]. Their 4-year monitoring of eutrophic suburban ponds in Brussels showed that floating-leaf plants (Nuphar lutea and Nymphaea alba) did not cause a reduction in phytoplankton biomass, even when they covered approximately 50% of the pond surface. In addition, it was shown that in warm shallow lakes and reservoirs, phytoplankton chlorophyll a was high under duckweed (≈50–70 μg/L), water lettuce (≈30–60 μg/L), and water hyacinth (≈50 μg/L) [95]. Interestingly, in lakes dominated by submerged plants, a significant decrease in phytoplankton biomass is observed [19,95]. In the section of the Kaniv Reservoir where submerged (Potamogeton perfoliatus) and emergent (Phragmites communis) macrophytes dominated (e.g., site 11), a significant decrease in phytoplankton biomass was observed. For the open water area without macrophytes patches, such correlation was not recorded. On the basis of the investigations conducted and the literature review, it can be assumed that floating-leaf and free-floating plants are less effective in controlling water bloom processes than submerged plants in the face of increased nutrient availability.

5. Conclusions

Ongoing climate change and increasing nutrient pollution of water bodies are issues that are highly discussed and pose a global concern due to the worldwide increase of cyanobacterial blooms. With this work, we wanted to check the suitability of biological control for cyanobacterial bloom mitigation.
As the Kyiv and Kaniv Reservoirs are characterized by macrophyte overgrowth, they served as excellent study sites to test our hypothesis. Canonical correspondence analysis (CCA) revealed that the phytoplankton structure in macrophyte patches differed from the structure of algal communities observed in open waters. In particular, in macrophyte patches, the diatom species numbers were higher, but the number of cyanobacterial species was lower. This could be explained by the fact that low light availability favours phytoplankton species with physiological and morphological characteristics that improve their adaptation to these conditions. However, in areas of the reservoirs dominated by floating-leaf plants and free-floating plants, a significant decrease in phytoplanktonic or cyanobacterial biomass was not observed. We assume that the reason for this could be that these macrophytes did not reduce nutrient concentrations to levels that would limit cyanobacterial growth in reservoirs. Intensive overgrowing of the river sections of the reservoirs with floating-leaf plants (in particular, Trapa natans), along with other factors, on the contrary, contributed to nitrogen and phosphorus enrichment. Therefore, in the face of relevant nutrient supply, these ecological groups of macrophytes were ineffective in controlling cyanobacterial blooms in reservoir ecosystems.

Author Contributions

Conceptualization of this study was performed by O.P.B. and I.N.; the investigation was conducted by O.P.B., I.N., V.Z., S.B., T.L., T.Z. and T.K.; the methodology was prepared by O.P.B., I.N., O.P., S.D., S.B. and T.K.; statistics and mapping were prepared by O.P.; the manuscript was written and edited by O.P.B., I.N., T.K., O.P., S.D., S.B. and M.C. All authors have read and agreed to the published version of the manuscript.

Funding

This research was funded by the grant of the National Academy of Sciences of Ukraine to research laboratories/groups of young scientists to conduct research in priority areas of science and technology Project State Reg. No. 0121U110756, grant number 26/02-2022(3).

Data Availability Statement

The data presented in this study are available on request from the corresponding author.

Acknowledgments

The authors acknowledge financial and organizational support given by the Institute of Hydrobiology of the National Academy of Science of Ukraine. Additionally, our sincere gratefulness goes to Sergey Afanasyev, who provided a significant contribution to the development of the project idea and helped us to bring it to life.

Conflicts of Interest

The authors declare no conflict of interest.

References

  1. Hallegraeff, G.M.; Anderson, D.M.; Belin, C.; Bottein, M.-Y.; Bresnan, E.; Chinain, M.; Enevoldsen, H.; Iwataki, M.; Karlson, B.; McKenzie, C.H.; et al. Perceived global increase in algal blooms is attributable to intensified monitoring and emerging bloom impacts. Commun. Earth Environ. 2021, 2, 117. [Google Scholar] [CrossRef]
  2. Zanchett, G.; Oliveira-Filho, E.C. Cyanobacteria and cyanotoxins: From impacts on aquatic ecosystems and human health to anticarcinogenic effects. Toxins 2013, 5, 1896–1917. [Google Scholar] [CrossRef] [PubMed]
  3. Huang, I.S.; Zimba, P.V. Cyanobacterial bioactive metabolites-A review of their chemistry and biology. Harmful Algae 2019, 83, 42–94. [Google Scholar] [CrossRef] [PubMed]
  4. Blinkova, M.; Zdraveski, N.; Krstić, S.S. Blue-Green Algae, the Janus of Nature. In Proceedings of the 5th International Scientific Conference BALWOIS, Ohrid, Republic of Macedonia, 28 May–2 June 2012; pp. 1–12. [Google Scholar]
  5. O’Neil, J.M.; Davis, T.W.; Burford, M.A.; Gobler, C.J. The rise of harmful cyanobacteria blooms: The potential roles of eutrophication and climate change. Harmful Algae 2012, 14, 313–334. [Google Scholar] [CrossRef]
  6. Burford, M.A.; Beardall, J.; Willis, A.; Orr, P.T.; Magalhaes, V.F.; Rangel, L.M.; Azevedo, S.M.F.O.E.; Neilan, B.A. Understanding the winning strategies used by the bloom-forming cyanobacterium Cylindrospermopsis raciborskii. Harmful Algae 2016, 54, 44–53. [Google Scholar] [CrossRef]
  7. Kurmayer, R.; Deng, L.; Entfellner, E. Role of toxic and bioactive secondary metabolites in colonization and bloom formation by filamentous cyanobacteria Planktothrix. Harmful Algae 2016, 54, 69–86. [Google Scholar] [CrossRef]
  8. Li, X.; Dreher, T.W.; Li, R. An overview of diversity, occurrence, genetics and toxin production of bloom-forming Dolichospermum (Anabaena) species. Harmful Algae 2016, 54, 54–68. [Google Scholar] [CrossRef]
  9. Davis, T.W.; Berry, D.L.; Boyer, G.L.; Gobler, C.J. The effects of temperature and nutrients on the growth and dynamics of toxic and non-toxic strains of Microcystis during cyanobacteria blooms. Harmful Algae 2009, 8, 715–725. [Google Scholar] [CrossRef]
  10. Lürling, M.; Van Oosterhout, F.; Faassen, E. Eutrophication and Warming Boost Cyanobacterial Biomass and Microcystins. Toxins 2017, 9, 64. [Google Scholar] [CrossRef]
  11. Reynolds, C.S. Ecology of Phytoplankton; Cambridge University Press: Cambridge, UK, 2006; p. 552. [Google Scholar]
  12. Tarczyńska, M.; Romanowska-Duda, Z.; Jurczak, T.; Zalewski, M. Toxic cyanobacterial blooms in a drinking water reservoir—Causes, consequences and management strategy. Water Sci. Technol. 2001, 1, 237–246. [Google Scholar] [CrossRef]
  13. Kuo, J.-T.; Lung, W.-S.; Yang, C.-P.; Liu, W.-C.; Yang, M.-D.; Tang, T.-S. Eutrophication modelling of reservoirs in Taiwan. Environ. Model. Softw. 2006, 21, 829–844. [Google Scholar] [CrossRef]
  14. Khilchevskyi, V.; Grebin, V.; Dubniak, S.; Zabokrytska, M.; Bolbot, H. Large and small reservoirs of Ukraine. J. Water Land Dev. 2022, 52, 101–107. [Google Scholar] [CrossRef]
  15. Nezbrytska, I.; Usenko, O.; Konovets, I.; Leontieva, T.; Abramiuk, I.; Goncharova, M.; Bilous, O. Potential use of aquatic vascular plants to control cyanobacterial blooms: A review. Water 2022, 14, 1727. [Google Scholar] [CrossRef]
  16. Tan, K.; Huang, Z.; Ji, R.; Qiu, Y.; Wang, Z.; Liu, J. A review of allelopathy on microalgae. Microbiology 2019, 165, 587–592. [Google Scholar] [CrossRef] [PubMed]
  17. Stroom, J.M.; Kardinaal, W.E.A. How to combat cyanobacterial blooms: Strategy toward preventive lake restoration and reactive control measures. Aquat. Ecol. 2016, 50, 541–576. [Google Scholar] [CrossRef]
  18. Basu, B.K.; Kalff, J.; Pinel-Alloul, B. The influence of macrophyte beds on plankton communities and their export from fluvial lakes in the St Lawrence River. Freshw. Biol. 2000, 45, 373–382. [Google Scholar] [CrossRef]
  19. Peretyatko, A.; Triest, L.; Symoens, J.J. Impact of macrophytes on phytoplankton in eutrophic peri-urban ponds, implications for pond management and restoration. Belg. J. Bot. 2007, 140, 83–99. [Google Scholar] [CrossRef]
  20. Usenko, O.M.; Sakevich, A.I. Allelopathic influence of higher aquatic plants on the functional activity of plankton algae. Hydrobiol. J. 2005, 41, 54–66. [Google Scholar] [CrossRef]
  21. De Tezanos Pinto, P.; Allende, L.; O’Farrell, I. Influence of free-floating plants on the structure of a natural phytoplankton assemblage: An experimental approach. J. Plankton Res. 2006, 29, 47–56. [Google Scholar] [CrossRef]
  22. Timchenko, V.M.; Linnyk, P.M.; Kholodko, O.P. Abiotic Components of the Ecosystem of the Kyiv Reservoir: A Monograph; LOGOS: Kyiv, Ukraine, 2013; p. 60. (In Ukrainian) [Google Scholar]
  23. Denisova, A.I.; Timchenko, V.M.; Nakshina, E.P.; Novikov, B.Y.; Ryabov, A.K.; Bass, Y.I. Hydrology and Hydrochemistry of the Dnieper River and Its Basin; Naukova Dumka: Kyiv, Ukraine, 1989; p. 215. (In Russian) [Google Scholar]
  24. Timchenko, V.M. Ecological Hydrology of Reservoirs of Ukraine: Monograph; Naukova Dumka: Kyiv, Ukraine, 2006; p. 383. (In Ukrainian) [Google Scholar]
  25. Romanenko, V.D. The Dnieper Reservoirs, Their Significance and Problems. Hydrobiol. J. 2018, 54, 3–9. [Google Scholar] [CrossRef]
  26. Tseeba, Y.Y.; Maystrenko, Y.G. Kiev Reservoir: Hydrochemistry, Biology, Productivity; Naukova Dumka: Kyiv, Ukraine, 1972; p. 460. (In Ukrainian) [Google Scholar]
  27. Almazov, A.M.; Denisova, A.I.; Majstrenko, Y.G.; Nakhshina, E.P. Hydrochemistry of the Dnieper, Its Reservoirs and Tributaries; Naukova Dumka: Kyiv, Ukraine, 1967; p. 316. (In Ukrainian) [Google Scholar]
  28. Nabyvanets, B.Y.; Osadchiy, V.I.; Osadcha, N.M.; Nabyvanets, Y.B. Analytical Chemistry of Surface Waters; Naukova Dumka: Kyiv, Ukraine, 2007; p. 456. (In Ukrainian) [Google Scholar]
  29. DSTU 4078-2001; Water Quality. Determination of Nitrate. Part 3: Spectrometric Method Using Sulfosalicylic Acid (ISO 7890 3:1998, MOD); State Standard of Ukraine: Kyiv, Ukraine, 2002; p. 7. (In Ukrainian)
  30. Sentinel Online. Level-2A Algorithm Overview. Available online: https://sentinels.copernicus.eu/web/sentinel/technical-guides/sentinel-2-msi/level-2a/algorithm (accessed on 14 December 2022).
  31. Hawryło, P.; Wężyk, P. Predicting growing stock volume of scots pine stands using Sentinel-2 satellite imagery and airborne image-derived point clouds. Forests 2018, 9, 274. [Google Scholar] [CrossRef]
  32. Image Classification Using the ArcGIS Spatial Analyst Extension. Available online: https://desktop.arcgis.com/en/arcmap/latest/extensions/spatial-analyst/image-classification/image-classification-using-spatial-analyst.htm (accessed on 15 December 2022).
  33. Rouse, J.W.; Haas, R.H.; Schell, J.A.; Deering, D.W. Monitoring vegetation systems in the great plains with ERTS. In Third ERTS-1 Symposium NASA, NASA SP-351; NASA: Washington, DC, USA, 1974; pp. 309–317. [Google Scholar]
  34. Krammer, K. Bacillariophyceae 1. Naviculaceae. In Süßwasserflora von Mitteleuropa; Gustav Fischer Verlag: Stuttgart, Germany, 1986; pp. 1–876. [Google Scholar]
  35. Krammer, K. Bacillariophyceae. 4. Achnanthaceae. Kritische Erganzungen zu Navicula (Lineolatae) und Gomphonema. In Süßwasserflora von Mitteleuropa; Gustav Fischer Verlag: Stuttgart, Germany, 1991; pp. 1–437. [Google Scholar]
  36. Krammer, K.; Lange-Bertalot, H. Bacillariophyceae. 3. Centrales, Fragilariaceae, Eunotiaceae. In Süßwasserflora von Mitteleuropa; Gustav Fischer Verlag: Stuttgart, Germany, 1991; pp. 1–600. [Google Scholar]
  37. Komárek, J. Cyanoprokaryota 3. Teil/3rd Part: Heterocystous genera. In Süsswasserflora von Mitteleuropa; Budel, B., Gärtner, G., Krienitz, L., Schagerl, M., Eds.; Springer Spektrum: Heidelberg, Germany, 2013; pp. 1–1130. [Google Scholar]
  38. Komarek, J.; Anagnostidis, K. Cyanoprokaryota. 1. Chroococcales. In Susswasserflora von Mirreleuropa; Bd. 19/1; Gustav Vischer Verlag: Jena, Germany, 1998; pp. 1–548. [Google Scholar]
  39. Komárek, J.; Anagnostidis, K. Cyanoprokaryota. Teil 2. Oscillatoriales. In Süßwasserflora von Mitteleuropa; Bd 19/2; Elsevier: München, Germany, 2005; pp. 1–759. [Google Scholar]
  40. Krammer, K. The Genus Pinnularia. In Diatoms of Europe; A.R.G. Gantner Verlag: Königstein, Germany, 2000; Volume 1, pp. 1–703. [Google Scholar]
  41. Krammer, K. Cymbella. In Diatoms of Europe; A.R.G. Gantner Verlag, K.-G.: Ruggell, Liechtenstein, 2002; Volume 3, pp. 1–584. [Google Scholar]
  42. Krammer, K. Cymbopleura, Delicata, Navicymbula, Gomphocymbellopsis, Afrocymbella. In Diatoms of Europe; A.R.G. Gantner Verlag, K.-G.: Ruggell, Liechtenstein, 2003; Volume 4, pp. 1–530. [Google Scholar]
  43. Vetrova, Z.I. Euglenophyta. In Flora of Algae of the Continental Water Bodies of the Ukrainian SSR. 1; Naukova Dumka: Kiev, Ukraine, 1986; pp. 1–348. (In Russian) [Google Scholar]
  44. Tsarenko, P.M. Short Identification Book of Chlorococcales of the Ukraine SSR; Naukova Dumka: Kiev, Ukraine, 1990; pp. 1–208. (In Russian) [Google Scholar]
  45. Vetrova, Z.I. Euglenales, Family 2. Euglenaceae. Genus 1. Trachelomonas. Group II. Genus 2. Strombomonas. Genus 3. Euglena. In Flora of Algae of the Continental Water Bodies of Ukraine. 1; Naukova Dumka: Kiev, Ukraine, 1993; pp. 1–260. (In Russian) [Google Scholar]
  46. Krammer, K. Die cymbelloiden Diatomeen. Eine Monographie der weltweit bekannten Taxa. 1. Allegmeins und Encyonema Part. In Bibliotheca Diatomologica; J. Cramer: Berlin Germany; Stuttgart, Germany, 1997; pp. 1–382. [Google Scholar]
  47. Palamar-Mordvintseva, G.M. Desmidiales. Gonatozygaceae, Peniaceae, Closteriaceae, Desmidiaceae. In Flora of Algae of the Continental Water Bodies of Ukraine; Fasc. 1, Part 1; Akademperiodyka Press: Kiev, Ukraine, 2003; pp. 1–355. (In Ukrainian) [Google Scholar]
  48. Vetrova, Z.I. Euglenofitovye vodorosli. In Flora of Algae of the Continental Water Bodies of Ukraine. 2; Lileia Press: Kiev, Ukraine, 2004; pp. 1–272. (In Russian) [Google Scholar]
  49. Palamar-Mordvintseva, G.M. Desmidiales. In Flora of Algae of the Continental Water Bodies of Ukraine. Fasc. 1, Pars 2; Akademperiodyka Press: Kyiv, Ukraine, 2005; pp. 1–573. (In Ukrainian) [Google Scholar]
  50. Kovalenko, O.V. Cyanoprokaryota. Ordo Chroococcales. In Flora of Algae of Ukraine. 1. Fasc. 1; VELES: Kyiv, Ukraine, 2009; pp. 1–397. (In Ukrainian) [Google Scholar]
  51. Palamar-Mordvintseva, G.M.; Petlovany, O.A. Streptophyta. Familia Mesotaeniaceae. In Flora of Algae of Ukraine. 12. Fasc. 1; VELES: Kyiv, Ukraine, 2009; pp. 1–158. (In Ukrainian) [Google Scholar]
  52. Lange-Bertalot, H.; Hofmann, G.; Werum, M.; Cantonati, M. Freshwater Benthic Diatoms of Central Europe: Over 800 Common Species Used in Ecological Assessment; Koeltz Botanical Books: Schmitten-Oberreifenberg, Germany, 2017; pp. 1–942. [Google Scholar]
  53. Guiry, M.D.; Guiry, G.M. AlgaeBase. World-Wide Electronic Publication, National University of Ireland, Galway. 2021. Available online: http://www.algaebase.org (accessed on 21 December 2022).
  54. Hillebrand, H.; Dürselen, C.D.; Kirschtel, D.; Pollingher, U.; Zohary, T. Biovolume calculation for pelagic and benthic microalgae. J. Phycol. 1999, 35, 403–424. [Google Scholar] [CrossRef]
  55. SCOR-UNESCO. Determination of Photosynthetic Pigments in Sea Water; Monographs on Oceanographic Methodology, 1; UNESCO: Paris, France, 1966; p. 69. [Google Scholar]
  56. Jeffrey, S.; Humphrey, F.H. New spectrophotometric equations for determining chlorophyll a, b, c1 and c2 in higher plants, algae and natural phytoplankton. Biochem. Physiol. Pflanz. 1975, 167, 171–194. [Google Scholar] [CrossRef]
  57. Legendre, P.; Legendre, L. Numerical Ecology, 3rd ed.; Elsevier Publishing: Amsterdam, The Netherlands, 2012; pp. 1–989. [Google Scholar]
  58. Oksanen, F.J.; Blanchet, G.; Friendly, U.M.; Kindt, R.; Legendre, P.; McGlinn, D.; Minchin, P.R.; O’Hara, R.B.; Simpson, G.L.; Solymos, P.; et al. Vegan: Community Ecology Package. R Package Version 2.4-3. 2017. Available online: https://CRAN.R-project.org/package=vegan (accessed on 14 December 2022).
  59. Šmilauer, P.; Lepš, J. Using Canoco 5. In Multivariate Analysis of Ecological Data Using CANOCO 5; Cambridge University Press: Cambridge, UK, 2014; pp. 15–38. [Google Scholar] [CrossRef]
  60. Ter Braak, C.J.F. Canonical correspondence analysis: A new eigenvector technique for multivariate direct gradient analysis. Ecology 1986, 67, 1167–1179. [Google Scholar] [CrossRef]
  61. Dodds, W.K.; Jones, J.R.; Welch, E.B. Suggested classification of stream trophic state: Distributions of temperate stream types by chlorophyll, total nitrogen, and phosphorus. Water Res. 1998, 32, 1455–1462. [Google Scholar] [CrossRef]
  62. Kutser, T. Quantitative Detection of Chlorophyll in Cyanobacterial Blooms by Satellite Remote Sensing. Limnol. Oceanogr. 2004, 49, 2179–2189. [Google Scholar] [CrossRef]
  63. Aranha, T.R.B.T.; Martinez, J.-M.; Souza, E.P.; Barros, M.U.G.; Martins, E.S.P.R. Remote Analysis of the Chlorophyll-a Concentration Using Sentinel-2 MSI Images in a Semiarid Environment in Northeastern Brazil. Water 2022, 14, 451. [Google Scholar] [CrossRef]
  64. Timchenko, V.M.; Timchenko, O.V.; Guliyaeva, O.O.; Kholodko, O.P. Ecological and hydrodynamic zoning of cascade valley reservoirs. Hydrol. Hydrochem. Hydroecology 2010, 19, 23–29. [Google Scholar]
  65. Timchenko, V.M.; Timchenko, O.V.; Lakhai, Y.O.; Ivanova, N.O.; Kushnir, N.I. Environmental Regulation of the operation mode of Dnipro hydroelectric power stations. Sci. Technol. 2009, 2, 1–4. (In Ukrainian) [Google Scholar]
  66. Timchenko, V.M. Ecological hydrology of Dnieper reservoirs. Hydrobiol. J. 2006, 42, 76–90. [Google Scholar] [CrossRef]
  67. Tsaplina, K.M.; Linchuk, M.I. Distribution of plant communities in the Kaniv reservoir depending on environmental factors. Sci. Work. UkrNDGMI 2003, 251, 184–189. (In Ukrainian) [Google Scholar]
  68. Tsaplina, Y.N.; Kholodko, O.P.; Linchuk, M.I. Thickets of higher aquatic plants in the estuarine sections of the rivers flowing into the Kiev reservoir. Hydrobiol. J. 2014, 50, 17–31. [Google Scholar] [CrossRef]
  69. Kurhanskyi, S.V.; Buzevych, O.A. The influence of the development of the water nut (Trapa natans) on the conditions of grazing of young fish of the Kyiv reservoir. Fish. Sci. Ukr. 2014, 28, 5–13. (In Ukrainian) [Google Scholar]
  70. Shevchuk, S.A.; Vishnevskyi, V.I.; Shevchenko, I.A. The use of DZD data to establish the ecological state of the Dnipro reservoirs. In Proceedings of the Central Geophysical Observatory; Kosovets, O.O., Ed.; Interpress LTD: Kyiv, Ukraine, 2014; Volume 24, pp. 72–78. (In Ukrainian) [Google Scholar]
  71. Shevchuk, S.A.; Vyshnevskyi, V.I.; Shevchenko, I.A.; Kozytskyi, O.M. Research of water objects of Ukraine using the data of remote sensing of the Earth. Land Reclam. Water Mngmn. 2019, 2, 146–156. (In Ukrainian) [Google Scholar]
  72. Soloveychuk, Y.S.; Starodubtsev, V.M. Seasonal dynamics of the Kaniv reservoir overgrow. In Proceedings of the Intellectual potential of the XXI century ‘2015. Biology—Ecology and Biotechnology, Odesa, Ukraine, 10–22 November 2015; (In Ukrainian). Available online: https://sworld.education/konferm2/2.pdf (accessed on 21 December 2022).
  73. Blaženčić, J. The efect on the water chestnut (Trapa L.) survival in associations with the white and yellow water lily [Nymphaea alba L. and Nuphar lutea (L.) Sm. in Sibth. et Sm.]. In 8th Symposium on the Lora of Southeastern Serbia and Neighbouring Regions; Faculty of Natural Sciences and Mathematics: Niš, Serbia, 2005; p. 68. [Google Scholar]
  74. Schneider, E. Aquatic macrophytes in the Danube Delta—Indicators for water quality and habitat parameters. Stud. Univ. Babeş-Bolyai, Biol. 2009, 54, 21–31. [Google Scholar]
  75. Džigurski, D.; Ljevnaić-Mašić, B.; Nikolić, L. Trapetum natantis Müller et Görs 1960 in hydromeliorative facilities in Serbia. Acta Soc. Bot. Pol. 2013, 82, 125–133. [Google Scholar] [CrossRef]
  76. Klochenko, P.D.; Shevchenko, T.F. Phytoepiphyton of macrophytes of various ecological groups of the Kiev Reservoir. Hydrobiol. J. 2016, 52, 3–16. [Google Scholar] [CrossRef]
  77. Klochenko, P.D.; Shevchenko, T.F.; Tarashchuk, O.S. Phytoepiphyton of the additional net of the Kanev Reservoir. Hydrobiol. J. 2016, 52, 22–37. [Google Scholar] [CrossRef]
  78. Sirenko, L.A.; Korelyakova, I.L.; Mikhaylenko, L.E.; Kostikova, L.E.; Litvinova, M.A.; Myslovich, V.O.; Skorik, L.V.; Khoroshikh, L.A.; Shcherbak, V.I.; Yakubovsky, A.B.; et al. Vegetation and Bacterial Population of the Dnieper and Its Reservoirs; Naukova Dumka: Kiev, Ukraine, 1989; p. 232. (In Russian) [Google Scholar]
  79. Shcherbak, V.I. Structural and Functional Characteristics of the Dnieper Phytoplankton. Ph.D. Thesis, Institute of Hydrobiol. NASU, Kyiv, Ukraine, 2000. (In Ukrainian). [Google Scholar]
  80. Oksiyuk, O.P.; Davydov, O.A.; Melenchuk, G.V. Formation of species diversity of phytoplankton in river sections of the Dnieper reservoirs. Algology 2005, 15, 78–85. (In Russian) [Google Scholar]
  81. Maistrova, N.V. Phytoplankton diversity of the Kyiv reservoir. Ukr. Bot. J. 2009, 66, 220–233. (In Ukrainian) [Google Scholar]
  82. Shcherbak, V.I. Phytoplankton succession of the Kyiv water reservoir and assessment of its transboundary section. TNPU Ser. Biol. 2015, 3–4, 757–760. (In Ukrainian) [Google Scholar]
  83. Kimmel, B.L.; Groeger, A.W. Factors controlling primary production in lakes and reservoirs: A perspective. Lake Reserv. Manag. 1984, 1, 277–281. [Google Scholar] [CrossRef]
  84. Thornton, K.W.; Kimmel, B.L.; Payne, F.E. Reservoir Limnology: Ecological Perspectives; John Wiley and Sons: Hoboken, NJ, USA, 1990; p. 256. [Google Scholar]
  85. Calijuri, M.C. Temporal changes in the phytoplankton community structure in a tropical and eutrophic reservoir (Barra Bonita, S.P.—Brazil). J. Plankton Res. 2002, 24, 617–634. [Google Scholar] [CrossRef]
  86. Brooks, B.W.; Scott, J.T.; Forbes, M.G.; Valenti, T.W.; Stanley, J.K.; Doyle, R.D. Reservoir zonation and water quality. Lake Line 2009, 25, 39–41. [Google Scholar]
  87. Mac Donagh, M.E.; Casco, M.A.; Claps, M.C. Plankton relationships under small water level fluctuations in a subtropical reservoir. Aquat. Ecol. 2008, 43, 371–381. [Google Scholar] [CrossRef]
  88. Araújo, F.G.; Costa de Azevedo, M.C.; Lima Ferreira, M.d.N. Seasonal changes and spatial variation in the water quality of a eutrophic tropical reservoir determined by the inflowing river. Lake Reserv. Manag. 2011, 27, 343–354. [Google Scholar] [CrossRef]
  89. Dai, H.; Mao, J.; Jiang, D.; Wang, L. Longitudinal Hydrodynamic Characteristics in Reservoir Tributary Embayments and Effects on Algal Blooms. PLoS ONE 2013, 8, e68186. [Google Scholar] [CrossRef]
  90. Gil Guarín, I.C.; Villabona-González, S.L.; Parra-García, E.; Echenique, R.O. Environmental factors driving phytoplankton biomass and diversity in a tropical reservoir. Rev. Acad. Colomb. Cienc. Ex. Fis. Nat. 2020, 171, 423–436. [Google Scholar] [CrossRef]
  91. Mhlanga, L.; Madzivanzira, T.; Nhiwatiwa, T.; Tendaupenyu, P.; Barson, M.; Marufu, L.; Songore, N. Physico-chemical limnology during the filling phase of Tugwi-Mukosi, a tropical reservoir in Zimbabwe. Afr. J. Aquat. Sci. 2020, 45, 412–420. [Google Scholar] [CrossRef]
  92. Ruggiero, A.; Solimini, A.G.; Carchini, G. Nutrient and chlorophyll a temporal patterns in eutrophic mountain ponds with contrasting macrophyte coverage. Hydrobiologia 2003, 506–509, 657–663. [Google Scholar] [CrossRef]
  93. Abdel-Tawwab, M. Effect of free floating macrophyte, Azolla pinnata R. Brown on water physico-chemistry, primary productivity, and the production of Nile Tilapia, Oreochromis niloticus (L.), and common carp, Cyprinus carpio L., in fertilized earthen ponds. J. Appl. Aquac. 2006, 18, 21–41. [Google Scholar] [CrossRef]
  94. Cunha, D.G.F.; Bottino, F.; do Carmo Calijuri, M. Can free-floating and emerged macrophytes influence the density and diversity of phytoplankton in subtropical reservoirs? Lake Reserv. Manag. 2012, 28, 255–264. [Google Scholar] [CrossRef]
  95. De Tezanos Pinto, P.; O’Farrell, I. Regime shifts between free-floating plants and phytoplankton: A review. Hydrobiologia 2014, 740, 13–24. [Google Scholar] [CrossRef]
  96. Gross, E.M. Allelopathy of aquatic autotrophs. Crit. Rev. Plant Sci. 2003, 22, 313–339. [Google Scholar] [CrossRef]
  97. Hu, H.; Hong, Y. Algal-bloom control by allelopathy of aquatic macrophytes—A review. Front. Environ. Sci. Eng. China 2008, 2, 421–438. [Google Scholar] [CrossRef]
  98. Rodriguez, P.; Solange Vera, M.; Pizarro, H. Primary production of phytoplankton and periphyton in two humic lakes of a South American wetland. Limnology 2012, 13, 281–287. [Google Scholar] [CrossRef]
  99. Shi, P.; Xie, P.; Liu, L.; Cui, J.; Wang, X.; Yang, P. Photoacclimation in freshwater diatoms: Interspecific and inter-habitat comparisons. J. Freshw. Ecol. 2020, 35, 391–407. [Google Scholar] [CrossRef]
  100. Lukina, L.F.; Smirnova, N.N. Physiology of Higher Aquatic Plants; Naukova Dumka: Kiev, Ukraine, 1988; p. 185. (In Russian) [Google Scholar]
  101. Akabori, Y.; Takagi, S.; Nishihiro, J.; Kagami, M. Effects of Floating-Leaved Plant, Trapa Natans, on the Water Qualities in lake Inba. Jpn. J. Limnol. 2015, 77, 155–166. [Google Scholar] [CrossRef]
  102. Kemp, W.M.; Boynton, W.R.; Adolf, J.E.; Boesch, D.F.; Boicourt, W.C.; Brush, G.; Cornwell, J.C.; Fisher, T.R.; Glibert, P.M.; Hagy, J.D.; et al. Eutrophication of Chesapeake Bay: Historical trends and ecological interactions. Mar. Ecol. Prog. Ser. 2005, 303, 1–29. [Google Scholar] [CrossRef] [Green Version]
  103. Nezbrytska, I.M.; Shamanskyi, S.Y.; Boichenko, S.V.; Kharchenko, G.V. Some Problems of the Use of Microalgae for Nitrogen and Phosphorus Removal from Wastewater (a Review). Hydrobiol. J. 2021, 57, 62–78. [Google Scholar] [CrossRef]
Figure 2. Examples of UAV imagery. (A) single image; (B) ortho-mosaic; (C) fragment of spherical panorama.
Water 15 00672 g002
Figure 3. Sentinel-2 natural colour images of upstream fragment of the Kyiv Reservoir captured on different dates during spring–summer 2021.
Water 15 00672 g003
Figure 4. True colour Sentinel image (A) and result of the Maximum Likelihood Supervised Classification (B) of upstream fragment of the Kyiv Reservoir. Classes: 1—hydrophytes; 2—ground vegetation and halophytes; 3—water; 4—other (mostly bare soil).
Water 15 00672 g004
Figure 5. Using difference of NDVI on two different dates to separate ground vegetation from hydrophytes in upstream fragment of the Kyiv Reservoir.
Water 15 00672 g005
Figure 6. NDVI image showing algae aggregation in medium reaches on the Kyiv Reservoir.
Water 15 00672 g006
Figure 7. Map of hydrophytes’ distribution (marked in green) in the Kyiv Reservoir.
Water 15 00672 g007
Figure 8. Map of hydrophytes’ distribution (marked in green) in the Kaniv Reservoir.
Water 15 00672 g008
Figure 9. Maps of the distribution of algal blooms (yellow-red) in the Kyiv (A) and Kaniv (B) Reservoirs.
Water 15 00672 g009
Figure 10. Chlorophyll a concentration in the sites with aquatic macrophytes (marked in green) and without macrophytes (marked in blue) in Kyiv (A) and Kaniv (B) Reservoirs. The numbers of the sites correspond to numbers on Figure 1 and in the Table 1 and Table 2.
Water 15 00672 g010
Figure 11. CCA ordination diagram of site scores, phytoplankton community structure parameters, and selected environmental variables (represented by arrows) in the Kyiv Reservoir. The numbers on the diagram correspond to the numbers of sites according to Figure 1. The sites without plants (open water area) have the letter A in their name. For sites with aquatic macrophyte patches, no additional letter was added. Only the significant explanatory environmental variables (p < 0.05) are presented.
Water 15 00672 g011
Figure 12. CCA ordination diagram of site scores, phytoplankton community structure parameters, and selected environmental variables (represented by arrows) in the Kaniv Reservoir. The numbers on the diagram correspond to the numbers of sites according to Figure 1. The sites without plants (open water area) have the letter A in their name. For sites with aquatic macrophyte patches, there is no additional letter for the number. Only the significant explanatory environmental variables (p < 0.05) are presented.
Water 15 00672 g012
Table 1. The physical and chemical parameters of water and GIS coordinates of the sampling sites in the Kyiv and Kaniv Reservoirs of the Dnipro River in August 2021. The sites without plants (open water area) have the letter A. For sites with aquatic macrophyte patches, no additional letter was added. We have provided two values in the columns to underline differences between macrophyte patches (first value) and open waters (second value); single values refer to areas without plants. Coordinates are organized according to the World Geographic System-84 (WGS-84) system of coordinates, decimal degrees of east longitude and north latitude.
SiteCoordinatesWater Temperature, °CpHDissolved Oxygen (DO), mg/LDO %Conductivity,
µS/cm
Salinity,
g/L (ppt)
Total Dissolved Solids, ppm
LongitudeLatitude
Kyiv Reservoir
1/1A30.42081651.06750426.8/27.37.89/8.455.5–5.361.6/58.9348/3400.20/0.20233/227
2/2A30.36659251.04713126.9/26.78.02/8.028.1/8.399.8/104.4338/3430.20/0.19226/229
3/3A30.37748450.76712026.6/27.68.59/8.424.0/6.450.1/90337/3330.18/0.18225/223
4/4A30.54597651.03589527.9/30.79.00/8.9613.5/13.7164/182306/314205/211
530.55446950.98439927.18.9816.3190288192
6/6A30.51963451.17513527.7/27.48.13/8.073./4.038.1/46.1367/3370.21/0.20245/225
7A30.55132750.76712127.48.8618.0190.0304203
Kaniv Reservoir
8/8A30.63896250.30147025.9/26.17.88/8.213.3/4.041.0/49.1359/3460.19/0.19240/231
9/9A30.76126150.15417227.4/29.18.16/8.214.3/3.953.6/51.8354/3510.19/0.20237/235
10/10A31.07383649.98073627.7/27.38.07/7.864.4/4.652.5/59.7346/3420.19/0.20231/229
11/11A31.40283550.02511525.1/26.58.77/9.126.2/10.474.6/127.0328/3150.18/0.17219/211
12A31.50362549.81449526.28.685.668.13220.18215
Table 2. The hydrochemical parameters of water in the Kyiv and Kaniv Reservoirs of the Dnipro River in August 2021.
SiteTranspa-rency, mMass of Suspended Matter,
mg/L
NH4+,
mg N/L
NO2,
mg N/L
NO3,
mg N/L
N inorg.,
mg N/L
N org.,
mg N/L
Total Dissolved Nitrogen (TDN),
mg N/L
P inorg.,
mg P/L
P org.+ Polyph.,
mg P/L
Total Dissolved Phosphorus (TDP),
mg P/L
Kyiv Reservoir
1/1A0.65/1.1014.4/8.70.113/0.0470.007/0.0080.070/0.0580.190/0.1131.723/0.7621.913/0.8750.113/0.1380.141/0.1380.254/0.276
2/2A0.50/0.5037.7/23.20.079/0.0910.010/0.0080.045/0.0470.134/0.1460.763/0.7380.897/0.8840.164/0.1580.185/0.1670.349/0.325
3/3A2.00/0.404.8/18.00.155/0.1270.012/0.0120.075/0.1250.242/0.2640.931/1.0271.173/1.2910.221/0.1280.167/0.3470.388/0.475
4/4A0.9010.7/30.20.091/0.0710.012/0.0070.027/0.0450.130/0.1230.395/0.7690.525/0.8920.085/0.0520.207/0.2650.292/0.317
50.3513.80.2040.0110.0480.2631.0691.3320.1170.3460.463
6/6A0.85/0.8512.7/22.20.055/0.0530.007/0.0030.054/0.0360.116/0.0921.118/1.2521.234/1.3440.152/0.1480.242/0.2090.394/0.357
7A0.257.60.2490.0180.0370.3041.2971.6010.1320.3740.506
Kaniv Reservoir
8/8A0.60/.507.2/5.00.040/0.0230.021/0.0260.040/0.0310.101/0.0801.195/1.2401.296/1.3200.193/0.2030.256/0.4140.449/0.617
9/9A0.60/0.6010.9/4.20.154/0.0740.045/0.0470.109/0.1200.308/0.2411.013/1.0131.321/1.2540.276/0.2540.380/0.1970.656/0.451
10/10A1.00/1.258.8/6.80.043/0.0420.032/0.0250.119/0.1180.194/0.1850.886/0.5471.080/0.7320.235/0.2290.187/0.2010.422/0.430
11/11A0.75/0.455.5/9.50.101/0.1090.000/0.0000.100/0.0770.201/0.1860.816/1.2161.017/1.4020.292/0.3230.244/0.3030.536/0.626
12A1.406.80.2150.0000.0480.2631.2661.5290.3310.2500.581
Table 3. Characteristics of spectral bands of Sentinel satellite images according to Hawrylo and Wezyk [31].
Band NameSpatial Resolution, mSpectral Range, nmBand Description
B160433–453Coastal aerosol
B210458–523Blue
B310543–578Green
B410650–680Red
B520698–713Red edge 1
B620733–748Red edge 2
B720773–793Red edge
B810785–900Near-infrared (NIR)
B8A20855–875Near-infrared narrow (NIRn)
B960935–955Water vapour
B10601360–1390Shortwave infrared/Cirrus
B11201565–1655Shortwave infrared 1 (SWIR 1)
B12202100–2280Shortwave infrared 2 (SWIR 2)
Table 4. Dates of capture of Sentinel-2 images used in the analysis.
Date No.Kyiv ReservoirKaniv Reservoir
Date 126 March 202128 March 2021
Date 217 July 202121 June 2021
Date 310 August 202131 July 2021
Table 5. Ranking of the environmental variables that significantly influenced phytoplankton community structure in the Kyiv Reservoir based on Monte Carlo permutation tests in CCA.
Environmental VariableVariability Explained, %F-Valuep-Value
TP32.8124.20.001
P org poly24.492.30.000
NO221.681.60.001
Salinity8.632.40.006
TN6.524.50.010
N org5.922.40.009
Table 6. Significance of the first two axes of the CCA model based on Monte Carlo permutation tests in the Kyiv Reservoir.
CCA AxisVariability Explained, %F-Valuep-Value
Axis 170.6534.10.002
Axis 229.1220.60.032
Table 7. Ranking of environmental variables that significantly influenced phytoplankton community structure in the Kaniv Reservoir based on Monte Carlo permutation tests in CCA.
Environmental VariableVariability Explained, %F-Valuep-Value
TP60.2812.70.001
N org14.3192.30.000
Salinity10.7144.70.002
NO26.689.60.001
NO36.385.40.002
P org poly1.723.50.007
Table 8. Significance of the first two axes of the CCA model based on Monte Carlo permutation tests in the Kaniv Reservoir.
CCA Axis Variability Explained, %F-Valuep-Value
Axis 189.23611.40.000
Axis 210.7432.90.027
Disclaimer/Publisher’s Note: The statements, opinions and data contained in all publications are solely those of the individual author(s) and contributor(s) and not of MDPI and/or the editor(s). MDPI and/or the editor(s) disclaim responsibility for any injury to people or property resulting from any ideas, methods, instructions or products referred to in the content.

