

Parallel Factor Analysis with 3DEEMS of Dissolved Organic Matter from Deep Porous Medium Reservoirs in the City of Kaifeng

1
School of Surveying and Land Information Engineering, Henan Polytechnic University, Jiaozuo 454000, China
2
Collaborative Innovation Center of Coal Work Safety and Clean High Efficiency Utilization, Jiaozuo 454000, China
3
Institute of Energy and Chemical Industry, China Pingmei Shenma Group, Pingdingshan 467000, China
4
School of Resources & Environment, Henan Polytechnic University, Jiaozuo 454000, China
*
Authors to whom correspondence should be addressed.
Water 2023, 15(4), 677; https://doi.org/10.3390/w15040677
Submission received: 29 November 2022
/
Revised: 30 January 2023
/
Accepted: 6 February 2023
/
Published: 9 February 2023
(This article belongs to the Section Water Use and Scarcity)
Abstract
:The deep geothermal water found within Kaifeng City, Henan province, China, is mainly contained within a loose-pore geothermal reservoir in the Minghuazhen Formation (Neogene Period). To understand the role and composition of Dissolved Organic Matter (DOM) in geothermal water, water samples collected from 13 geothermal wells at different depths were studied using three-dimensional (3D) excitation-emission matrix-parallel factor (EEM-PARAFAC) analysis. Fluorescent components were analyzed according to depth, and DOM in geothermal water between 800 m and 1600 m was classified. The results show that the fluorescence index (FI), biological index (BIX), and humification index (HIX) of DOM differ among geothermal water from different thermal reservoirs. Based on these three indices, the humification degree of DOM in deep geothermal water in Kaifeng City is low and is mainly derived from an endogenous source, which is closely related to microbial activities in thermal reservoirs. The fluorescent components of DOM in geothermal water from depths less than 1200 m are mainly tryptophan, tyrosine, and fulvic acid-like. The fluorescent components of DOM in geothermal water from depths greater than 1200 m are more complex, with tryptophan, tyrosine, humic acid, and fulvic acid-like components. Therefore, the characteristics of DOM composition in the geothermal water from different reservoirs in Kaifeng can also be used to infer and explain that the quality of deep geothermal water has not been affected by human activities, and there is no obvious hydraulic connection between the geothermal water of each thermal reservoir.
1. Introduction
Dissolved Organic Matter (DOM) is a complex mixture of organic molecules containing oxygen, nitrogen, and sulfur functional groups. DOM is widely distributed in various aqueous environments and plays an important role in aquatic ecosystems [1]. Therefore, understanding the distribution and composition of DOM in aqueous environments, and its impact on biogeochemical processes, is an important theme in environmental science research. In recent years, three-dimensional excitation-emission matrix (3DEEM) fluorescence spectroscopy has been widely applied to obtain fluorescence information for DOM, this method has several advantages including high sensitivity, applicability to small samples, simple preparation, and a short measurement time. The effectiveness of 3DEEM fluorescence spectroscopy has been demonstrated by numerous studies conducted in surface aquatic environments [2], including lakes [3,4], streams [5,6], and oceans [7,8,9], however, there have been very few studies on DOM in deep groundwater, especially geothermal water. Therefore, more research on DOM in deep geothermal water is required to improve the understanding of the variability in DOM therein in different thermal reservoirs and to help elucidate the hydraulic connections between thermal reservoirs.
Kaifeng City in Henan Province, China, is located in the center of the east Henan plain. There is abundant geothermal water in deep underground areas. The deep geothermal water found within Kaifeng City is an important natural mineral water resource containing a variety of microelements that are beneficial to human health; thus, it has been used intensively as a source of drinking water, bathing, and medical care applications since the early 1990s. Due to excessive exploitation of deep geothermal water in central urban areas, depleted water resources and water quality deterioration have been observed in recent years. DOM is a sensitive indicator of burial conditions, movement, chemical characteristics, and the geochemical environment, and is also very important in the chemical evolution of groundwater.
It is therefore important to study the composition of DOM in geothermal water at different depths, as this can serve as an indicator of changes in the geothermal water environment and provides a scientific basis for the rational development and utilization of geothermal water [10].
The 3DEEMs technique can provide qualitative information on DOM. To achieve this, a fluorescence intensity spectrum is projected onto the plane such that excitation and emission wavelengths are converted to vertical and horizontal coordinates in the form of contour lines [11,12]. However, due to the interference among the fluorescence peaks, there are some limitations when using 3DEEMs alone, and some fluorescence information cannot be fully interpreted, efficient analysis of 3DEEMs represents a significant challenge.
Parallel factor (PARAFAC) analysis is a statistical method based on an alternating least squares algorithm that has unique advantages [13]. PARAFAC is often used to decompose the 3DEEM spectra of DOM into several independent fluorescent components, and to estimate the relative contribution of each fluorescent component to the total DOM fluorescence [14,15]. PARAFAC is a powerful tool for separating and analyzing DOM components, and EEM-PARAFAC analysis has opened new routes to the evaluation of the composition, distribution, and dynamics of DOM in recent years [16,17,18]. The aims of this paper were to identify the composition, source, and distribution characteristics of DOM in deep pore geothermal water using 3DEEMs and PARAFAC analysis. This will aid in analyzing the effects of DOM on the ecological environment, and provide a foundation for understanding hydraulic connections in deep-buried porous geothermal water in Kaifeng City.
2. Materials and Methods
2.1. Sample Preparation and Spectral Analysis
According to existing research basis, the Neogene Minghuazhen (Nm) and Guantao (Ng) formations contain abundant geothermal water. Therefore, water samples were collected from these two strata in Kaifeng City, across a depth range of 800 to 1600 m. The area was divided into four thermal reservoirs at 200 m depth intervals, and at least two geothermal water samples were collected from each thermal reservoir. A total of 13 geothermal water samples were collected, including GW01, GW02, and GW03 from the thermal reservoir at 800 to 1000 m depth; GW04, GW05, GW06, and GW07 from 1000 to 1200 m depth; GW08, GW09, GW10, and GW11 from 1200 to 1400 m depth, and GW12, and GW13 from 1400 m to 1600 m depth. Each sample was collected from the outlet nearest to the geothermal well and water was discharged continuously until its temperature was stable. The geothermal water samples were collected into glass bottles that had been thoroughly cleaned with 10% hydrochloric acid and deionized water beforehand.
All geothermal water samples were transferred to the laboratory as soon as possible and filtered with a 0.45-μm filtration membrane. Then, the ultraviolet absorption spectra and three-dimensional (3D) fluorescence spectra of the filtrates were analyzed.
2.2. Experimental Method
2.2.1. Detection and Analysis
The 3DEEM spectra of the 13 geothermal water samples were determined using a fluorescence spectrophotometer (F-7000, Hitachi, Tokyo, Japan) equipped with a 150 W Xenon arc lamp light source. The slit widths for excitation and emission were set at 5 nm. The excitation wavelength was increased from 200 to 450 nm in 5 nm steps, and the emission wavelength was increased from 240 to 500 nm in 2 nm steps. Fluorescence data were processed using Origin software (Microcal, Inc., Northampton, MA, USA), and a contour map was produced.
2.2.2. Fluorescence Parameter Calculation
Based on the 3D fluorescence data, the fluorescence index (FI), biological index (BIX), and humification index (HIX) were calculated. The FI, which is the ratio of the fluorescence emission intensities at 450 and 500 nm at an excitation wavelength of 370 nm, can be used to analyze and characterize the source of DOM and is usually negatively correlated with the aromaticity of fulvic acid and provides an index thereof. When the FI is greater than 1.9, DOM mainly comes from endogenous sources with obvious autogenous characteristics, and when the FI is less than 1.4 DOM mainly comes from exogenous inputs, with relatively low endogenous contributions. The BIX is the ratio of fluorescence emission intensities at 380 and 430 nm, at an excitation wavelength of 310 nm, and mainly reflects the relative contributions of endogenous sources. When the value of the BIX is between 0.6 and 0.8, the contribution of endogenous sources to DOM is usually small; When the value of the BIX is between 0.8 and 1.0, there are more endogenous sources of DOM, and when the value of the BIX is greater than 1.0, the DOM mainly comes from endogenous sources and is newly generated. The HIX reflects the degree of humification of DOM. Higher HIX values indicate greater humification of DOM and vice versa. At an excitation wavelength of 254 nm, the HIX is given by the integral of the fluorescence intensity between 435 and 480 nm, divided by the sum of the integral of the fluorescence intensity between 300 and 345 nm and the integral of the fluorescence intensity between 435 and 480 nm.
2.2.3. PARAFAC Analysis
PARAFAC analysis is an effective method for decomposing EEM data into the underlying fluorescent components. There are two ways to apply PARAFAC analysis, the first is to create and validate a model based on a complete EEM dataset, as described in detail by C.A. Stedmon and Markager S et al. in 2003 [2]. The second is to verify the applicability of an already established PARAFAC model by fitting the EEMs. In this study, the first method was used. Briefly, a series of 3DEEMs were expressed as array X with dimensions I, J, and K, which was decomposed into score matrix A, load matrices B and C, and a residual matrix using the following mathematical equation:
where Xijk is the fluorescence intensity of the ith sample at the kth excitation and jth emission wavelength, F is the number of components, akf are scores proportional to the concentration of the fth fluorescence component in the ith sample, bif and cif are estimates (loadings) of the emission and excitation spectra, respectively, for the fth fluorescence component, and σijk are the residual elements of the model. The values for akf, F, bjf, and cif are obtained by minimizing the sum of squared residuals (σ2ijk).
Three-dimensional EEMs data of 13 samples were analyzed using PARAFAC in the MATLAB software (Math Work, Inc., Natick, MA, USA) with the drEEM1.0 toolbox. Before applying the model, the EEM data were preprocessed to remove spectral effects such as Raman and Rayleigh Scattering. The fluorescence components were preliminarily determined by comparing the squared error curves of the excitation and emission spectra of different components. According to the above formula, it can be determined that the smoother the square error curves of the two groups, that is, the smaller the residual error is, the closer the PARAFAC model fits with the data. Reliability was verified by comparing the values of the nuclear functions among different component models (when the value of the nuclear function is less than 50%, the analytical results of PARAFAC models are usually considered unreasonable). Finally, the number of fluorescent components was determined for PARAFAC analysis.
3. Results and Discussion
3.1. Three-Dimensional Fluorescence Spectral Characteristics
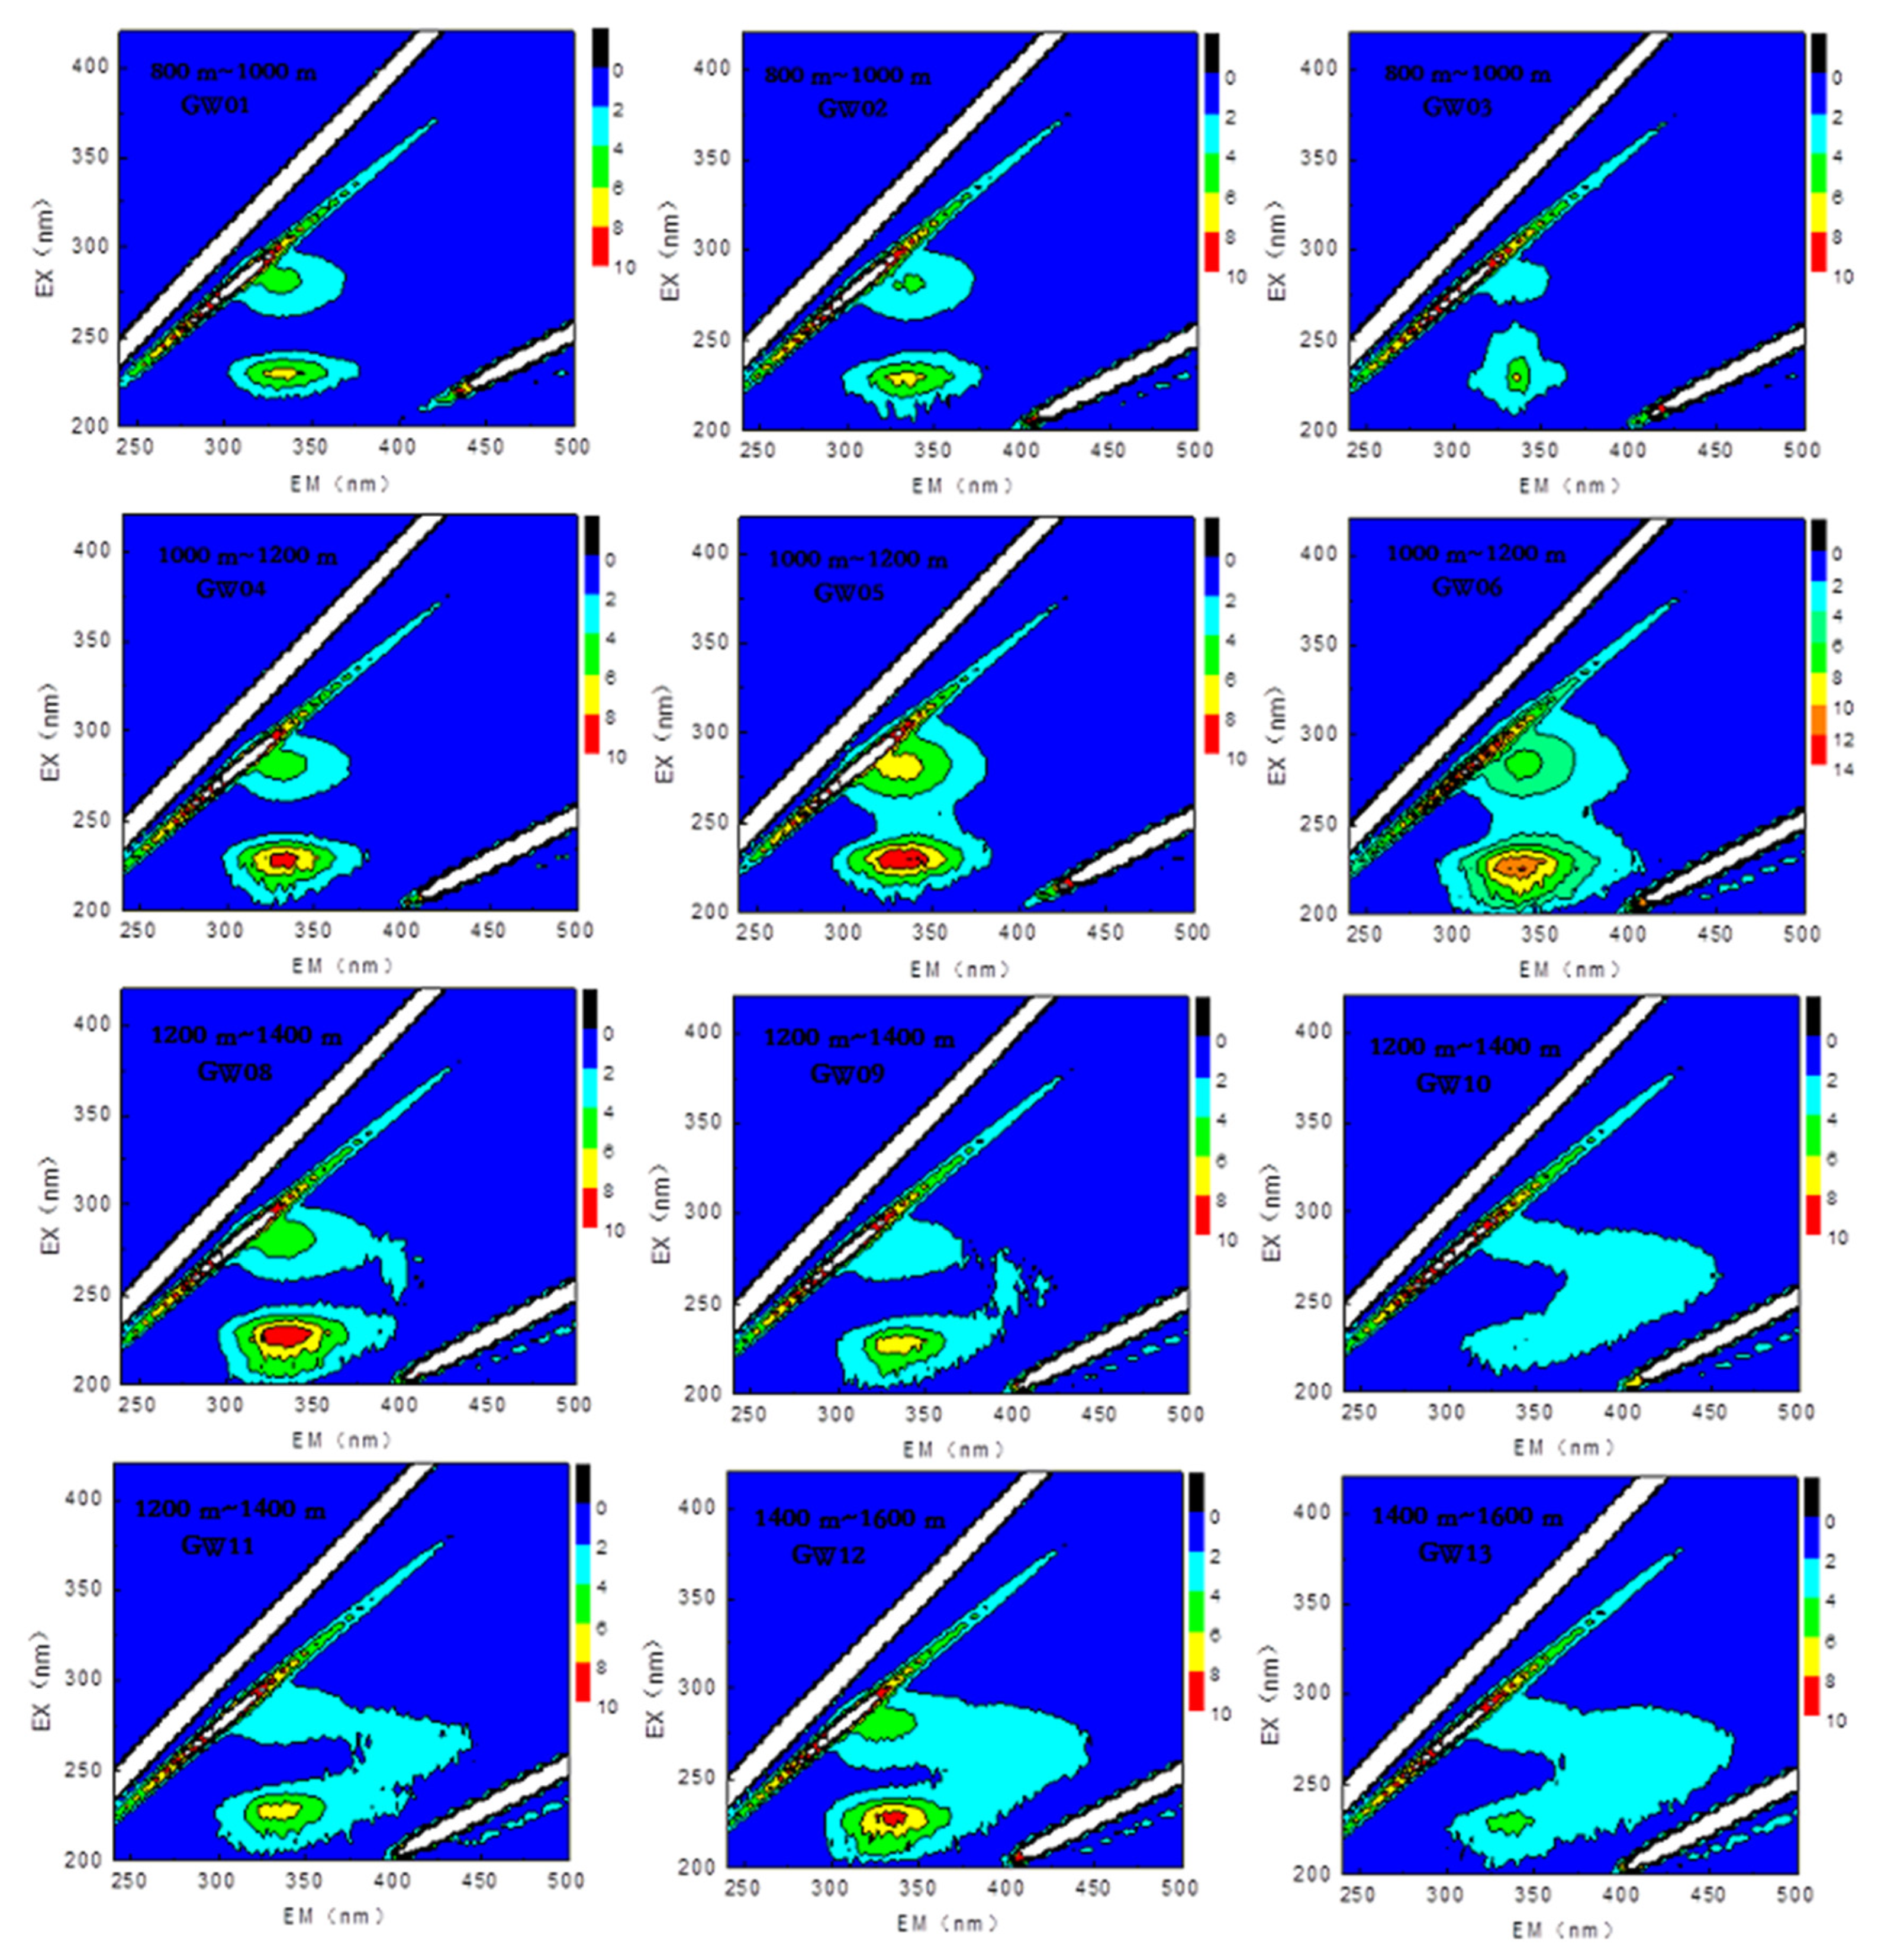
The 3D fluorescence spectra of DOM were obtained for the four thermal reservoirs at depths of 800 to 1000 m, 1000 to 1200 m, 1200 to 1400 m, and 1400 to 1600 m, as shown in Figure 1. Protein-like fluorescence peaks appeared in the excitation/emission range of 220~250 nm/300~380 nm and 250~200 nm/300~ 380 nm in all four thermal reservoirs. Among the two thermal reservoirs, at a depth range of 1200 to 1400 m and 1400 to 1600 m, in addition to the protein-like fluorescence peaks, fulvic acid, and humic acid fluorescence peaks also appeared in the excitation/emission range of 220~250 nm/380~500 nm and 250~400 nm/380~500 nm. Therefore, the fluorescence substances in DOM in the geothermal water from the two thermal reservoirs at depth ranges of 800 to 1000 m and 1000 to 1200 m were mainly composed of protein-like components, while the fluorescence substances in DOM in geothermal water from the two thermal reservoirs at depth ranges of 1200 to 1400 m and 1400 to 1600 m contain fulvic acid and humic acid components, as well as protein-like components.
3.2. Analysis of Fluorescent Index Characteristics
Table 1 shows the FI, BIX, and HIX values of geothermal water in the four thermal reservoirs. As discussed above, the FI can be used to analyze and characterize the source of DOM. Generally, when the FI is greater than 1.9, DOM is mainly endogenous, showing obvious autogenic characteristics, and when the FI is less than 1.4, DOM is mainly derived from external sources.
As shown in Table 1, the FI of geothermal water samples from all four thermal reservoirs was greater than 1.9. Therefore, the DOM in deep geothermal waters in Kaifeng City is from an endogenous source, being mainly derived from microbial activities inside the thermal reservoir. The value of the BIX also reflects the relative contributions of endogenous sources. In general, the higher the value of the BIX, the greater the contribution of endogenous sources to DOM. As shown in Table 1, the BIX value of geothermal water in all four thermal reservoirs was greater than 1.0. It can be inferred that DOM in the deep geothermal water of Kaifeng City is mainly from autogenic sources, and is newly generated. In other words, these BIX values indicate that internal microbial activity is the main source of DOM in geothermal water, consistent with the results for the FI. The HIX reflects the degree of DOM humification, and higher values indicate greater humification. As shown in Table 1, the HIX values of geothermal water in all four reservoirs were small (<1.0), and the minimum value was just 0.20. Therefore, the degree of humification of DOM in deep geothermal water in Kaifeng City is very low.
Figure 2 shows the variation in characteristic fluorescence parameters of DOM in geothermal water samples from the four thermal reservoirs (800~1000 m, 1000~1200 m, 1200~1400 m, and 1400~1600 m). It can be seen that the FI, BIX, and HIX values of DOM in geothermal water differ among these four thermal reservoirs. The average value of FI showed very little difference among the four thermal reservoirs, although the FI value of the reservoir between 1200 and 1400 m was slightly lower than that of the other three thermal reservoirs. The BIX values of the two thermal reservoirs, with a depth greater than 1200 m, were significantly lower than those of the two shallower reservoirs, indicating that the DOM in the shallower thermal reservoirs have more obvious autogenic characteristics. In general, as the depth increased, the contribution of self-generated sources to DOM increased slightly, and then decreased. Figure 2 shows that the HIX value of DOM in the four thermal reservoirs (800~1000 m, 1000~1200 m, 1200~1400 m, and 1400~1600 m) increased gradually, indicating greater humification of DOM in deeper geothermal water.
3.3. Fluorescence Components of DOM in Geothermal Water
It can be seen from Figure 1 that there is a distinct difference between the 3D fluorescence spectra of geothermal water between depths greater than 1200 m and less than 1200 m. Therefore, the 3D fluorescence spectra of waters from these two depth sections were analyzed in terms of the fluorescence components of DOM.
3.3.1. Depth Less Than 1200 m
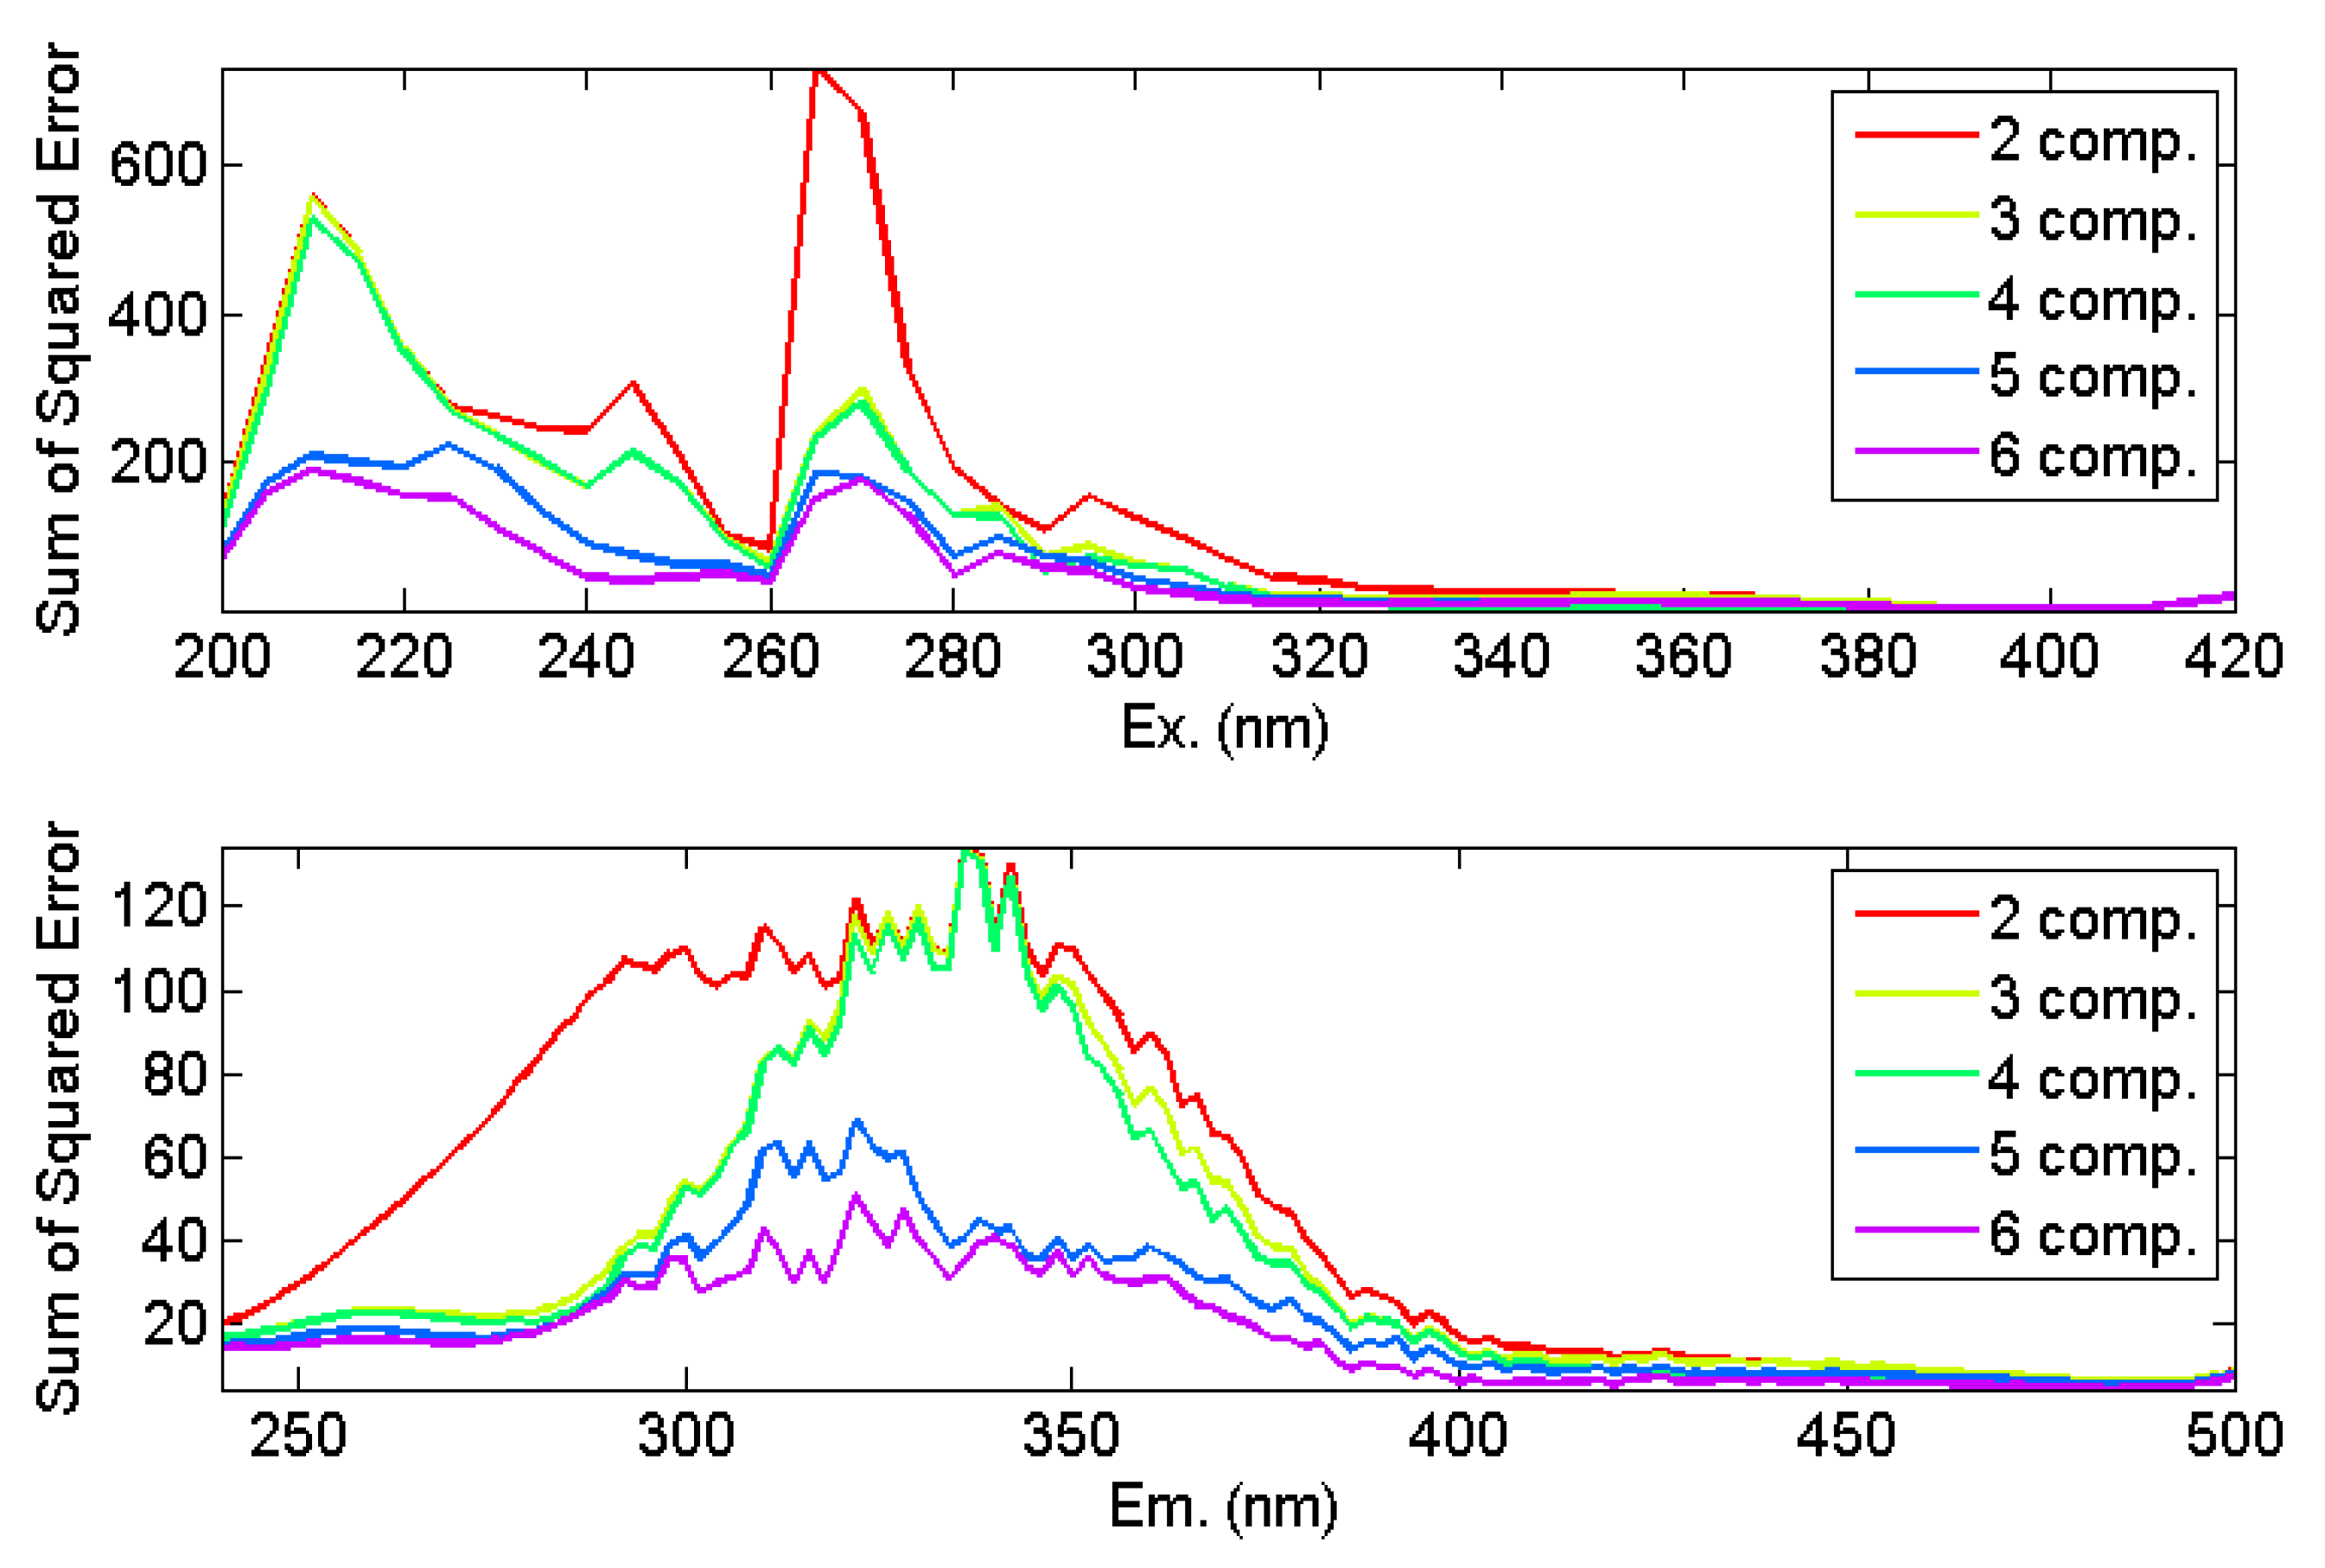
First, the 3D fluorescence data of seven geothermal water samples, GW01-GW07, were imported into MATLAB2014a. Roman and Rayleigh scattering were eliminated, and a fluorescence matrix was constructed conforming to trilinear theory. Then, using the drEEM1.0 Matlab toolbox, PARAFAC was performed to calculate the kernel function of different component models, as well as the sum of squared errors of the excitation and emission spectra. The calculation results showed that the kernel function values of the two- and the three-component models were 81.38% and 77.48%, respectively, which indicates reasonable model fit, while the kernel function values of the four- and the five-component models were −6.44% and 14.60%, respectively, as these values were far below 50%, the model fit to the data was insufficient. As shown in Figure 3, when the number of model components increases from 2 to 5, the curve of the sum of squared errors of the excitation and emission spectrum changes, while when the number of components increases from 5 to 6, the curve decreases slightly. After combining the results of the sum of squared errors and nuclear analysis, a three-component PARAFAC model was used to analyze the 3D fluorescence spectra of DOM in the geothermal water from depths of less than 1200 m. The classification results are shown in Figure 4.
As shown in Figure 4, comp 1, a fluorescent component, has two excitation peaks and one emission peak, corresponding to low- and high-excitation tryptophan-like fluorescence peaks with excitation/emission wavelengths of 230/340 nm and 280/340 nm, respectively. Comp 2 has two excitation peaks and two emission peaks, corresponding to a fulvic acid-like fluorescence peak and a humic acid-like fluorescence peak, with excitation/emission wavelengths of 260/370 nm and 300/370 nm, respectively. The last fluorescent component, comp 3, has an excitation peak and an emission peak (the high-excitation tyrosine fluorescence peak), with an excitation/emission wavelength of 270/290 nm.
3.3.2. Depth Greater Than 1200 m
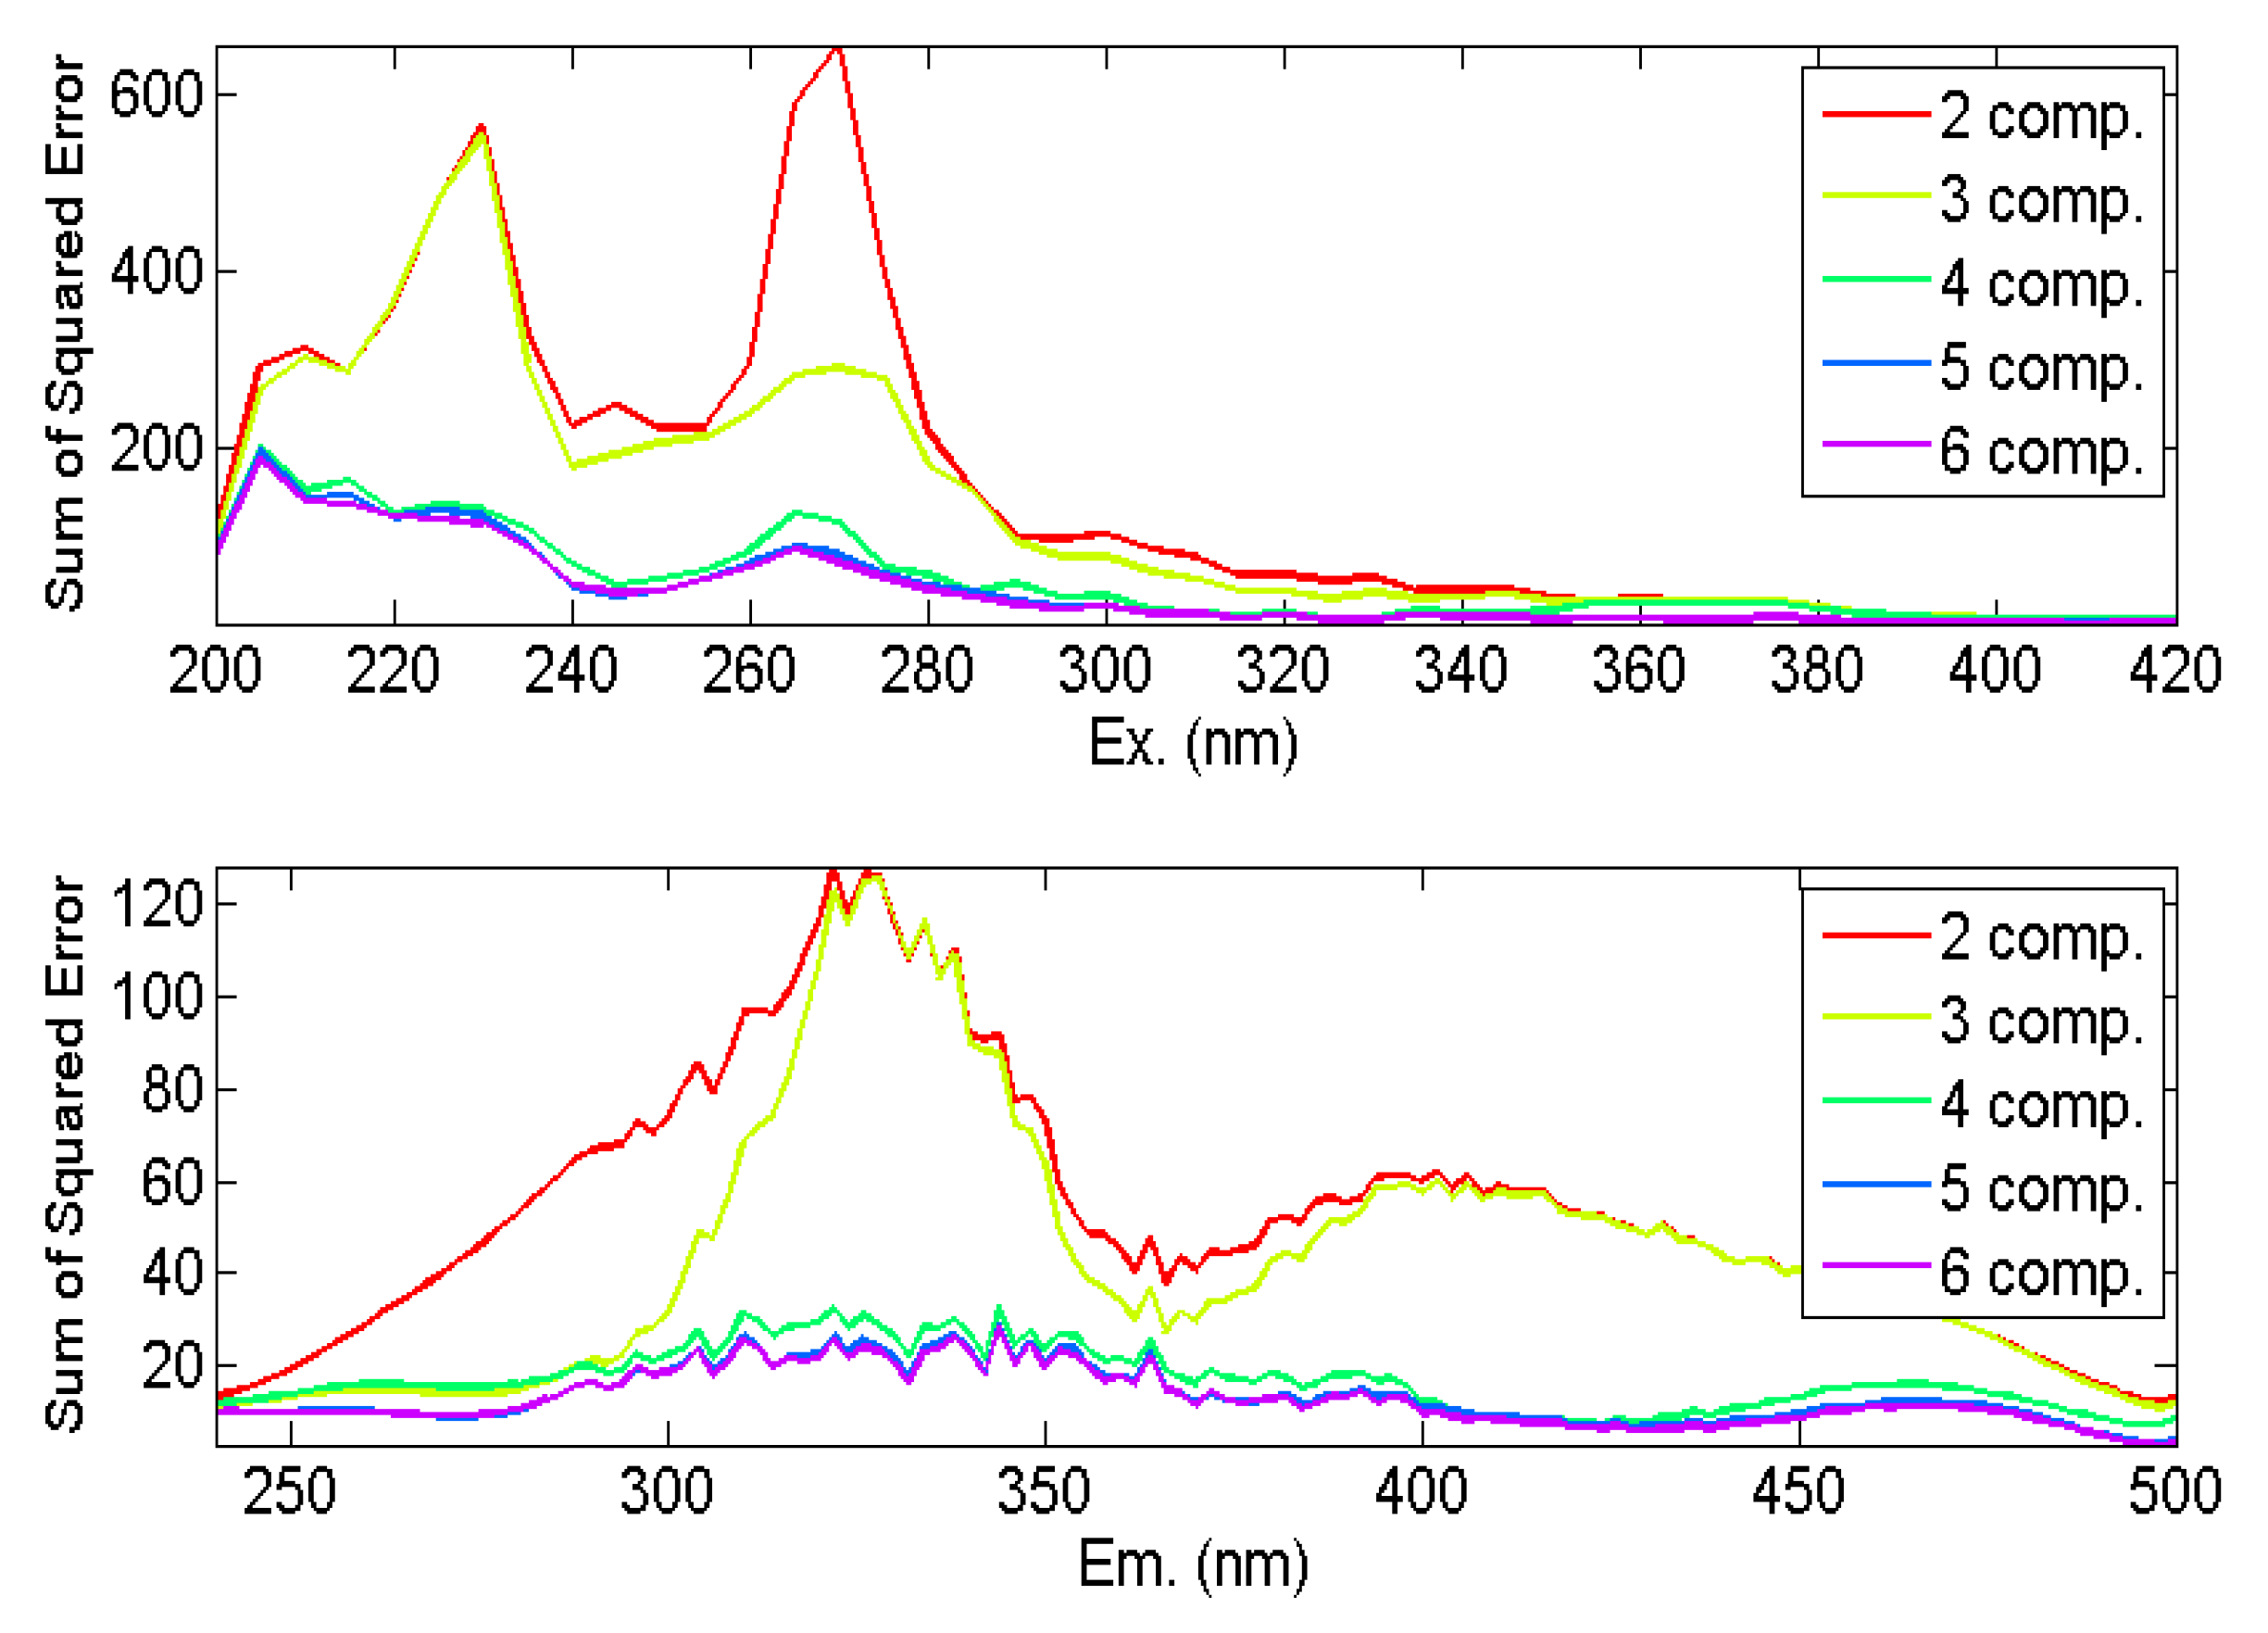
A total of 12 3D fluorescence datasets, for geothermal water samples GW08-GW13, were imported into MATLAB 2014a. Roman and Rayleigh scattering were eliminated and a fluorescence matrix was constructed. The results of kernel function analysis showed that the kernel function values of the two-, three-, and four-component models were 88.63%, 60.64%, and 37.97%, respectively, indicating that the two- and three-component models fitted the data reasonably well. The sum of squared error curves of the excitation and emission spectra of the different component models are shown in Figure 5. The curve of the sum of squared errors of the excitation spectrum and emission spectra decreases dramatically when the number of components of the model increases from 3 to 4, indicating that the fit of the four-component model was better than that of the three-component model. Therefore, the four-component PARAFAC model was used for the analysis of the 3D fluorescence spectrum of DOM in the geothermal water from depths greater than 1200 m. The classification results are shown in Figure 6.
As shown in Figure 6, the fluorescent components Comp 1, Comp 2, and Comp 3 all have two excitation peaks and one emission peak, but with different excitation/emission wavelengths. Comp 1 has two fluorescence peaks, corresponding to low- and high-excitation tryptophan-like fluorescence peaks. However, the center of the fluorescence peak is slightly shifted, and the excitation/emission wavelengths of the center are 230/330 nm and 270/330 nm, respectively. Comp 2 also has two fluorescence peaks, and the corresponding excitation/emission wavelengths are 240/350 nm and 280/350 nm, respectively, which indicates a tryptophan-like fluorescence peak and a soluble microbial metabolite fluorescence peak, respectively. Similarly, Comp 3 also has two fluorescence peaks, with excitation/emission wavelengths of 270/420 nm and 340/420 nm, which indicates humic acid-like fluorescence peaks. The last fluorescence component, Comp 4, has one excitation peak and one emission peak, with excitation/emission wavelengths of 270/280 nm, which indicates a tyrosine-like fluorescence peak.
3.4. Discussion
According to 3DEEMs of geothermal water, the fluorescence intensity of DOM is not generally high, and there is a significant difference in the center position of the fluorescence peak. There is some information may not be recognized because of the superimposition of fluorescence peaks. To further explore the composition and the origin of DOM in Kaifeng geothermal water, the parallel factor analysis method is used to maximize the extraction and utilization of three-dimensional fluorescence data. The composition of DOM was finally successfully identified. Compared with compositions of DOM in the geothermal water from five reservoirs, it is clear that, tryptophan-like, tyrosine-like, and soluble microbial metabolites are the components of DOM. Combining three indices, FI, BIX, and HIX, the humification degree of DOM in deep geothermal water in Kaifeng City is low. Considering the buried depth of geothermal water, it can be considered that the geothermal water has not been polluted by exogenous organic matter, that is, DOM in geothermal water is mainly derived from endogenous sources, which is closely related to microbial activities in thermal reservoirs.
4. Conclusions
(1) The 3D fluorescence spectra of DOM in geothermal water samples obtained from the same thermal reservoir in Kaifeng City were similar, but the 3D fluorescence spectra of the DOM were different, indicating differences in the content and composition of fluorescent substances in DOM in geothermal water from different depths, and these differences were more obvious at depths greater than 1200 m.
(2) Through analysis of three fluorescence characteristic indices of DOM in the geothermal water from four thermal reservoirs (800 to 1000 m, 1000 to 1200 m, 1200 to 1400 m, and 1400 to 1600 m), it was found that DOM in deep geothermal water in Kaifeng City had a relatively low degree of humification, and was mainly from endogenous sources (microbial activities in the thermal reservoir). Moreover, the FI, BIX, and HIX values of DOM in geothermal water differed among the thermal reservoirs.
(3) A PARAFAC model was used to characterize and classify DOM in geothermal water in deep multi-thermal reservoirs in Kaifeng City. The results showed that the fluorescent substances in DOM in geothermal water from depths of less than 1200 m mainly consisted of three fluorescent components: tryptophan-like, tyrosine-like, and soluble microbial metabolites. However, the composition of fluorescent substances in DOM in geothermal water from depths of greater than 1200 m is more complicated, including four main fluorescent substances: tryptophan-like, tyrosine-like, soluble microbial metabolites, and fulvic acid-like.
(4) Based on the above analysis, there are certain similarities in the composition of DOM in geothermal water from the same thermal reservoir, while there are certain differences in the composition of DOM in geothermal water from different thermal reservoirs, showing certain regularity in the vertical direction. Therefore, it can be inferred that there is no obvious hydraulic connection between the geothermal water of each thermal reservoir.
Author Contributions
Conceptualization, W.Q. and X.W.; methodologg, W.Q.; software, W.Q.; validation, W.Q.; formal analysis, W.Q.; investigation, W.Q. and X.W.; resources, X.W.; data curation, W.Q.; writing-original draft, W.Q.; writing-review and editing, X.W.; funding acquisition, W.Q. All authors have read and agreed to the published version of the manuscript.
Funding
This study is financially supported by the National Natural Science Foundation of China (No.41972254) and the Doctoral Foundation of Henan Polytechnic University (B2020-17).
Institutional Review Board Statement
This research article is not involved humans study, I think that ethical approval is not neces.
Informed Consent Statement
This research article is not involved humans study.
Data Availability Statement
The date that support the findings of this study are available from the corresponding author upon reasonable request.
Acknowledgments
This work was financially supported by the Doctoral Foundation of Henan Polytechnic University (B2020-17) and the Collaborative Innovation Center of Coal Work Safety and Clean High Efficiency Utilization.
Conflicts of Interest
The authors declare no conflict of interest.
References
- Marhaba, T.F.; Lippincott, R.L.; Van, D. Characterizing dissolved organic matter fractions using spectral fluorescent signatures and post processing by principal component analysis. Fresenius’ J. Anal. Chem. 2000, 366, 22–25. [Google Scholar] [CrossRef]
- Stedmon, C.A.; Markager, S.; Bro, R. Tracing dissolved organic matter in aquatic environments using a new approach to fluorescence spectroscopy. Mar. Chem. 2003, 82, 239–254. [Google Scholar] [CrossRef]
- Lu, S.; Jiang, T.; Zhang, J.; Yan, J.; Wang, D.; Wei, S.; Liang, J.; Gao, J. Three-dimensional fluorescence characteristic differences of dissolved organic matter (DOM) from two typical reservoirs. China Environ. Sci. 2015, 35, 516–523. [Google Scholar]
- De Haan, H.; De Boer, T. Applicability of light absorbance and fluorescence as measures of concentration and molecular size of dissolved organic carbon in humic lake tjeukemeer. Water Res. 1987, 21, 731–734. [Google Scholar] [CrossRef]
- O’Donnell, J.A.; Aiken, G.R.; Walvoord, M.A.; Butler, K.D. Dissolved organic matter composition of winter flow in the Yukon River basin: Implications of permafrost thaw and increased groundwater discharge. Glob. Biogeochem. Cycles 2012, 26, GB0E06. [Google Scholar] [CrossRef]
- Cai, W.L.; Xu, X.Y.; Du, X.; Zhu, H.; Luo, G. Parallel factor analysis with EEM on dissolved organic matter in chongqing section of Jialing River. Res. Environ. Sci. 2012, 25, 276–281. [Google Scholar]
- Helms, J.R.; Stubbins, A.; Perdue, E.M.; Green, N.W.; Chen, H.; Mopper, K. Photochemical bleaching of oceanic dissolved organic matter and its effect on absorption spectral slope and fluorescence. Mar. Chem. 2013, 155, 81–91. [Google Scholar] [CrossRef]
- Moore, W.S. The Effect of Submarine Groundwater Discharge on the Ocean. Annu. Rev. Mar. Sci. 2010, 2, 59–88. [Google Scholar] [CrossRef] [PubMed]
- Yamashita, Y.; Cory, R.M.; Nishioka, J.; Kuma, K.; Tanoue, E.; Jaffé, R. Fluorescence characteristics of dissolved organic matter in the deep waters of the Okhotsk Sea and the northwestern North Pacific Ocean. Deep. Sea Res. Part II Top. Stud. Oceanogr. 2010, 57, 1478–1485. [Google Scholar] [CrossRef]
- Qiao, W.; Wang, X.; Liu, X.; Zhen, X.; Guo, J.; Wang, S.; Yang, F.; Chen, G.; Zhang, B. Characterization of Dissolved Organic Matter in Deep Geothermal Water from Different Burial Depths Based on Three-Dimensional Fluorescence Spectra. Water 2017, 9, 266. [Google Scholar] [CrossRef]
- Zhou, J.; Wang, J.J.; Baudon, A.; Chow, A.T. Improved Fluorescence Excitation-Emission Matrix Regional Integration to Quantify Spectra for Fluorescent Dissolved Organic Matter. J. Environ. Qual. 2013, 42, 925–930. [Google Scholar] [CrossRef] [PubMed]
- Zhu, G.; Yin, J.; Zhang, P.; Wang, X.; Fan, G.; Hua, B.; Ren, B.; Zheng, H.; Deng, B. DOM removal by flocculation process: Fluorescence excitation–emission matrix spectroscopy (EEMs) characterization. Desalination 2014, 346, 38–45. [Google Scholar] [CrossRef]
- Jutaporn, P.; Laolertworakul, W.; Tungsudjawong, K.; Khongnakorn, W.; Leungprasert, S. Parallel factor analysis of fluorescence excitation emissions to identify seasonal and watershed differences in trihalomethane precursors. Chemosphere 2021, 282, 131061. [Google Scholar] [CrossRef] [PubMed]
- Wunsch, U.J.; Murphy, K.R.; Stedmon, C.A. The One-Sample PARAFAC Approach Reveals Molecular Size Distributions of Fluorescent Components in Dissolved Organic Matter. Environ. Sci. Technol. 2017, 51, 11900–11908. [Google Scholar] [CrossRef] [PubMed]
- Lopez-Fornieles, E.; Brunel, G.; Devaux, N.; Roger, J.M.; Taylor, J.; Tisseyre, B. Application of Parallel Factor Analysis (PARAFAC) to the Regional Characterisation of Vineyard Blocks Using Remote Sensing Time Series. Agronomy 2022, 12, 2544. [Google Scholar] [CrossRef]
- Wang, H.; Zhang, L.; Huo, T.; Wang, B.; Yang, F.; Chen, Y.; Tian, M.; Qiao, B.; Peng, C. Application of parallel factor analysis model to decompose excitation-emission matrix fluorescence spectra for characterizing sources of water-soluble brown carbon in PM 2.5. Atmos. Environ. 2020, 223, 117192. [Google Scholar] [CrossRef]
- Zhang, X.L.; Wang, H.B.; Yang, F.; Wang, S.Y.; Guo, X.Y.; Feng, H.J. Parallel factor analysis with three-dimensional excitation-emission matrix spectroscopy on dissolved organic matter of rural black and odorous water bodies in Pingdu City of Shandong Province. J. Environ. Eng. Technol. 2022, 12, 651–659. [Google Scholar]
- Wang, X.; Zhang, M.; Liu, L.; Wang, Z.; Lin, K. Using EEM-PARAFAC to identify and trace the pollution sources of surface water with receptor models in Taihu Lake Basin, China. J. Environ. Manag. 2022, 321, 115925. [Google Scholar] [CrossRef]
Figure 1.
Three-dimensional fluorescence spectra of Dissolved Organic Matter (DOM) in geothermal water from different reservoirs.
Figure 1.
Three-dimensional fluorescence spectra of Dissolved Organic Matter (DOM) in geothermal water from different reservoirs.

Figure 2.
Dissolved organic matter (DOM) fluorescence spectra parameters (FI: fluorescence index, BIX: biological index, HIX: humification index) in geothermal water from different reservoirs.
Figure 2.
Dissolved organic matter (DOM) fluorescence spectra parameters (FI: fluorescence index, BIX: biological index, HIX: humification index) in geothermal water from different reservoirs.

Figure 3.
The sum of squared error of the three-dimensional excitation-emission matrix (3DEEM) fluorescence spectroscopy excitation and emission spectra for geothermal water from a depth of less than 1200 m.
Figure 3.
The sum of squared error of the three-dimensional excitation-emission matrix (3DEEM) fluorescence spectroscopy excitation and emission spectra for geothermal water from a depth of less than 1200 m.

Figure 4.
Excitation-emission matrices (EEMs) and excitation and emission spectrum loadings of three fluorescence components from the parallel factor (PARAFAC) model of geothermal water from depths less than 1200 m.
Figure 4.
Excitation-emission matrices (EEMs) and excitation and emission spectrum loadings of three fluorescence components from the parallel factor (PARAFAC) model of geothermal water from depths less than 1200 m.

Figure 5.
The sum of squared error of the excitation spectrum and emission spectra.

Figure 6.
Excitation-emission matrices (EEMs), excitation, and emission spectrum loadings of four fluorescence components derived from a parallel factor (PARAFAC) model of geothermal water from depths greater than 1200 m.
Figure 6.
Excitation-emission matrices (EEMs), excitation, and emission spectrum loadings of four fluorescence components derived from a parallel factor (PARAFAC) model of geothermal water from depths greater than 1200 m.


Table 1.
Fluorescence index (FI), biological index (BIX), and humification index (HIX) of geothermal water in different reservoirs.
Table 1.
Fluorescence index (FI), biological index (BIX), and humification index (HIX) of geothermal water in different reservoirs.
| Depths | Geothermal Well | FI | BIX | HIX |
|---|---|---|---|---|
| 800~1000 m | GW01 | 1.91 | 1.29 | 0.35 |
| GW02 | 2.83 | 2.54 | 0.20 | |
| GW03 | 2.56 | 1.64 | 0.30 | |
| Average | 2.43 | 1.82 | 0.29 | |
| 1000~1200 m | GW04 | 2.58 | 1.25 | 0.30 |
| GW05 | 2.32 | 2.05 | 0.24 | |
| GW06 | 3.06 | 2.38 | 0.32 | |
| GW07 | 2.10 | 2.26 | 0.34 | |
| Average | 2.52 | 1.98 | 0.30 | |
| 1200~1400 m | GW08 | 2.11 | 1.35 | 0.67 |
| GW09 | 2.09 | 1.26 | 0.45 | |
| GW10 | 2.13 | 1.16 | 0.51 | |
| GW11 | 2.07 | 1.20 | 0.58 | |
| Average | 2.10 | 1.24 | 0.55 | |
| 1400~1600 m | GW12 | 2.63 | 1.08 | 0.45 |
| GW13 | 2.26 | 1.15 | 0.67 | |
| Average | 2.44 | 1.12 | 0.56 |
Disclaimer/Publisher’s Note: The statements, opinions and data contained in all publications are solely those of the individual author(s) and contributor(s) and not of MDPI and/or the editor(s). MDPI and/or the editor(s) disclaim responsibility for any injury to people or property resulting from any ideas, methods, instructions or products referred to in the content. |
© 2023 by the authors. Licensee MDPI, Basel, Switzerland. This article is an open access article distributed under the terms and conditions of the Creative Commons Attribution (CC BY) license (https://creativecommons.org/licenses/by/4.0/).
Share and Cite
MDPI and ACS Style
Qiao, W.; Wang, X. Parallel Factor Analysis with 3DEEMS of Dissolved Organic Matter from Deep Porous Medium Reservoirs in the City of Kaifeng. Water 2023, 15, 677. https://doi.org/10.3390/w15040677
AMA Style
Qiao W, Wang X. Parallel Factor Analysis with 3DEEMS of Dissolved Organic Matter from Deep Porous Medium Reservoirs in the City of Kaifeng. Water. 2023; 15(4):677. https://doi.org/10.3390/w15040677
Chicago/Turabian StyleQiao, Weifang, and Xinyi Wang. 2023. "Parallel Factor Analysis with 3DEEMS of Dissolved Organic Matter from Deep Porous Medium Reservoirs in the City of Kaifeng" Water 15, no. 4: 677. https://doi.org/10.3390/w15040677
Note that from the first issue of 2016, this journal uses article numbers instead of page numbers. See further details here.