
Drainage Ratio Controls Phytoplankton Abundance in Urban Lakes

1
Basin Water Environmental Research Department, Changjiang River Scientific Research Institute, Wuhan 430010, China
2
Jiangsu Collaborative Innovation Center of Atmospheric Environment and Equipment Technologies, Jiangsu Key Laboratory of Atmospheric Environmental Monitoring & Pollution Control, School of Environmental Science & Engineering, Nanjing University of Information Science & Technology, Nanjing 210044, China
3
Changjiang Spatial Information Technology Engineering Co., Ltd., Wuhan 430010, China
*
Author to whom correspondence should be addressed.
Water 2023, 15(4), 683; https://doi.org/10.3390/w15040683
Submission received: 2 January 2023
/
Revised: 28 January 2023
/
Accepted: 6 February 2023
/
Published: 9 February 2023
(This article belongs to the Special Issue Nutrient Biogeochemical Cycles in Eutrophic Inland Waters and Eutrophication Control)
Abstract
:Urban lakes located in densely populated regions are highly vulnerable freshwater ecosystems compared to lakes in rural areas due to intense anthropogenic activities. However, the impacts of intrinsic lake morphometry on the water quality of urban lakes remain unclear. In the present study, the water quality of 14 lakes and the underlying factors associated with such quality were explored in Wuhan City, China. Of these surveyed urban lakes, 92.9% were eutrophic or hypereutrophic; phytoplankton biomass ranged between 3.2 and 62.0 mg/L and was positively correlated with drainage ratio values (catchment area/lake area) during the phytoplankton bloom season. These results are consistent with the fact that small lakes associated with a large watershed area generally exhibit high levels of areal nutrient accumulation that rise with the drainage ratio, supporting phytoplankton growth. There were no significant differences in phytoplankton diversity among lakes (p > 0.05), remaining stable at the low Shannon index of 1.9–2.9, which is possibly due to high eutrophication pressure and similar local climatic conditions across the relatively limited study area. Overall, the results of this study will provide a valuable foundation for future efforts to improve water quality management efforts for urban lakes.
1. Introduction
Lakes are complex and productive biological ecosystems that provide a range of ecological benefits to their surrounding communities, including high levels of biodiversity, recreational opportunities, flood mitigation utility, and various industrial, agricultural, and domestic applications [1,2,3]. The urbanization of human societies has grown increasingly pronounced since the 20th century [4], with approximately 55% of the global population living in urban areas as of 2018 and a projected increase in this proportion to 68% as of 2050 [5]. The regions with the highest degree of urbanization include North America (82%), Latin America and the Caribbean (81%), and Europe (74%) [6]. The progressive urbanization of many developing nations is spurring an increase in the number and size of megacities, exacerbating environmental issues including changes in land cover and the production and flow regimes for pollution, all of which can have a substantial impact on nearby lakes [7,8,9].
While nutrients are essential to the integrity of lake ecosystems and the maintenance of bioactivity therein, excessive nutrient accumulation can contribute to adverse outcomes including eutrophication and the consequent development of odoriferous phytoplankton blooms, ultimately resulting in decreased water quality and a drop in overall biodiversity [10,11,12,13]. Ho et al. [14] found that peak summertime phytoplankton bloom intensity has risen in most global lakes, highlighting the marked exacerbation of these blooms in recent years. Wang et al. [15] determined that such eutrophication results in a marked loss of biodiversity and contributes to the development of cross-taxon congruence in lakes. A massive phytoplankton bloom in Taihu Lake in China that was observed in May of 2007 was sufficiently large to overwhelm local water treatment plants, thereby causing a severe drinking water crisis affecting over two million people for one week [16]. Unlike rural lakes, urban lakes tend to be small, shallow, and extremely artificial. These factors, combined with the high levels of anthropogenic activity to which they are exposed, have led to the classification of urban lakes as being among the most vulnerable freshwater ecosystems in the world [17]. Until now, the impacts of anthropogenic activities on urban lakes have been intensively studied [18,19,20]; however, it still remains unclear whether and how intrinsic lake morphometry influences urban lakes.
Lake morphometry (surface area, depth, volume, hydraulic residence time, etc.), catchment properties (geology, size, and land use), and hydrologic setting all influence the quantities of terrestrial substances that enter into lakes and govern how long it takes them to decompose, thereby strongly regulating lake water quality [21,22,23,24]. Small ponds, for example, are important contributors to inland water CO2 and CH4 emissions as they are very shallow, exhibit high levels of sedimentation, have larger edge-to-water ratios, and undergo frequent mixing [22]. Drainage ratio values are calculated by dividing the catchment area of a lake by the area of the lake itself, and are commonly used to evaluate hydrologic loads, hydrologic residence time, and substance loads [24,25]. Rasmussen et al. [26] reported a positive correlation between water color and drainage ratios in 337 lakes throughout the US and Canada. Cremona et al. [27] further demonstrated the value of drainage ratio as a robust predictor of allochthonous carbon budget in hemiboreal lakes. Based on these prior results, we hypothesized that drainage ratio may influence nutrient loads in urban lakes, thereby controlling the phytoplankton abundance in these vulnerable water bodies.
To test this hypothesis, the present study was designed to explore the effects of drainage ratio on the abundance of phytoplankton in 14 urban lakes in Wuhan City, China. Moreover, the correlation between land use and the eutrophication of these lakes was assessed. The overall goals of these analyses were to clarify the mechanisms underlying such eutrophication and to identify promising approaches to the management of water quality in urban lakes.
2. Materials and Methods
2.1. Study Area
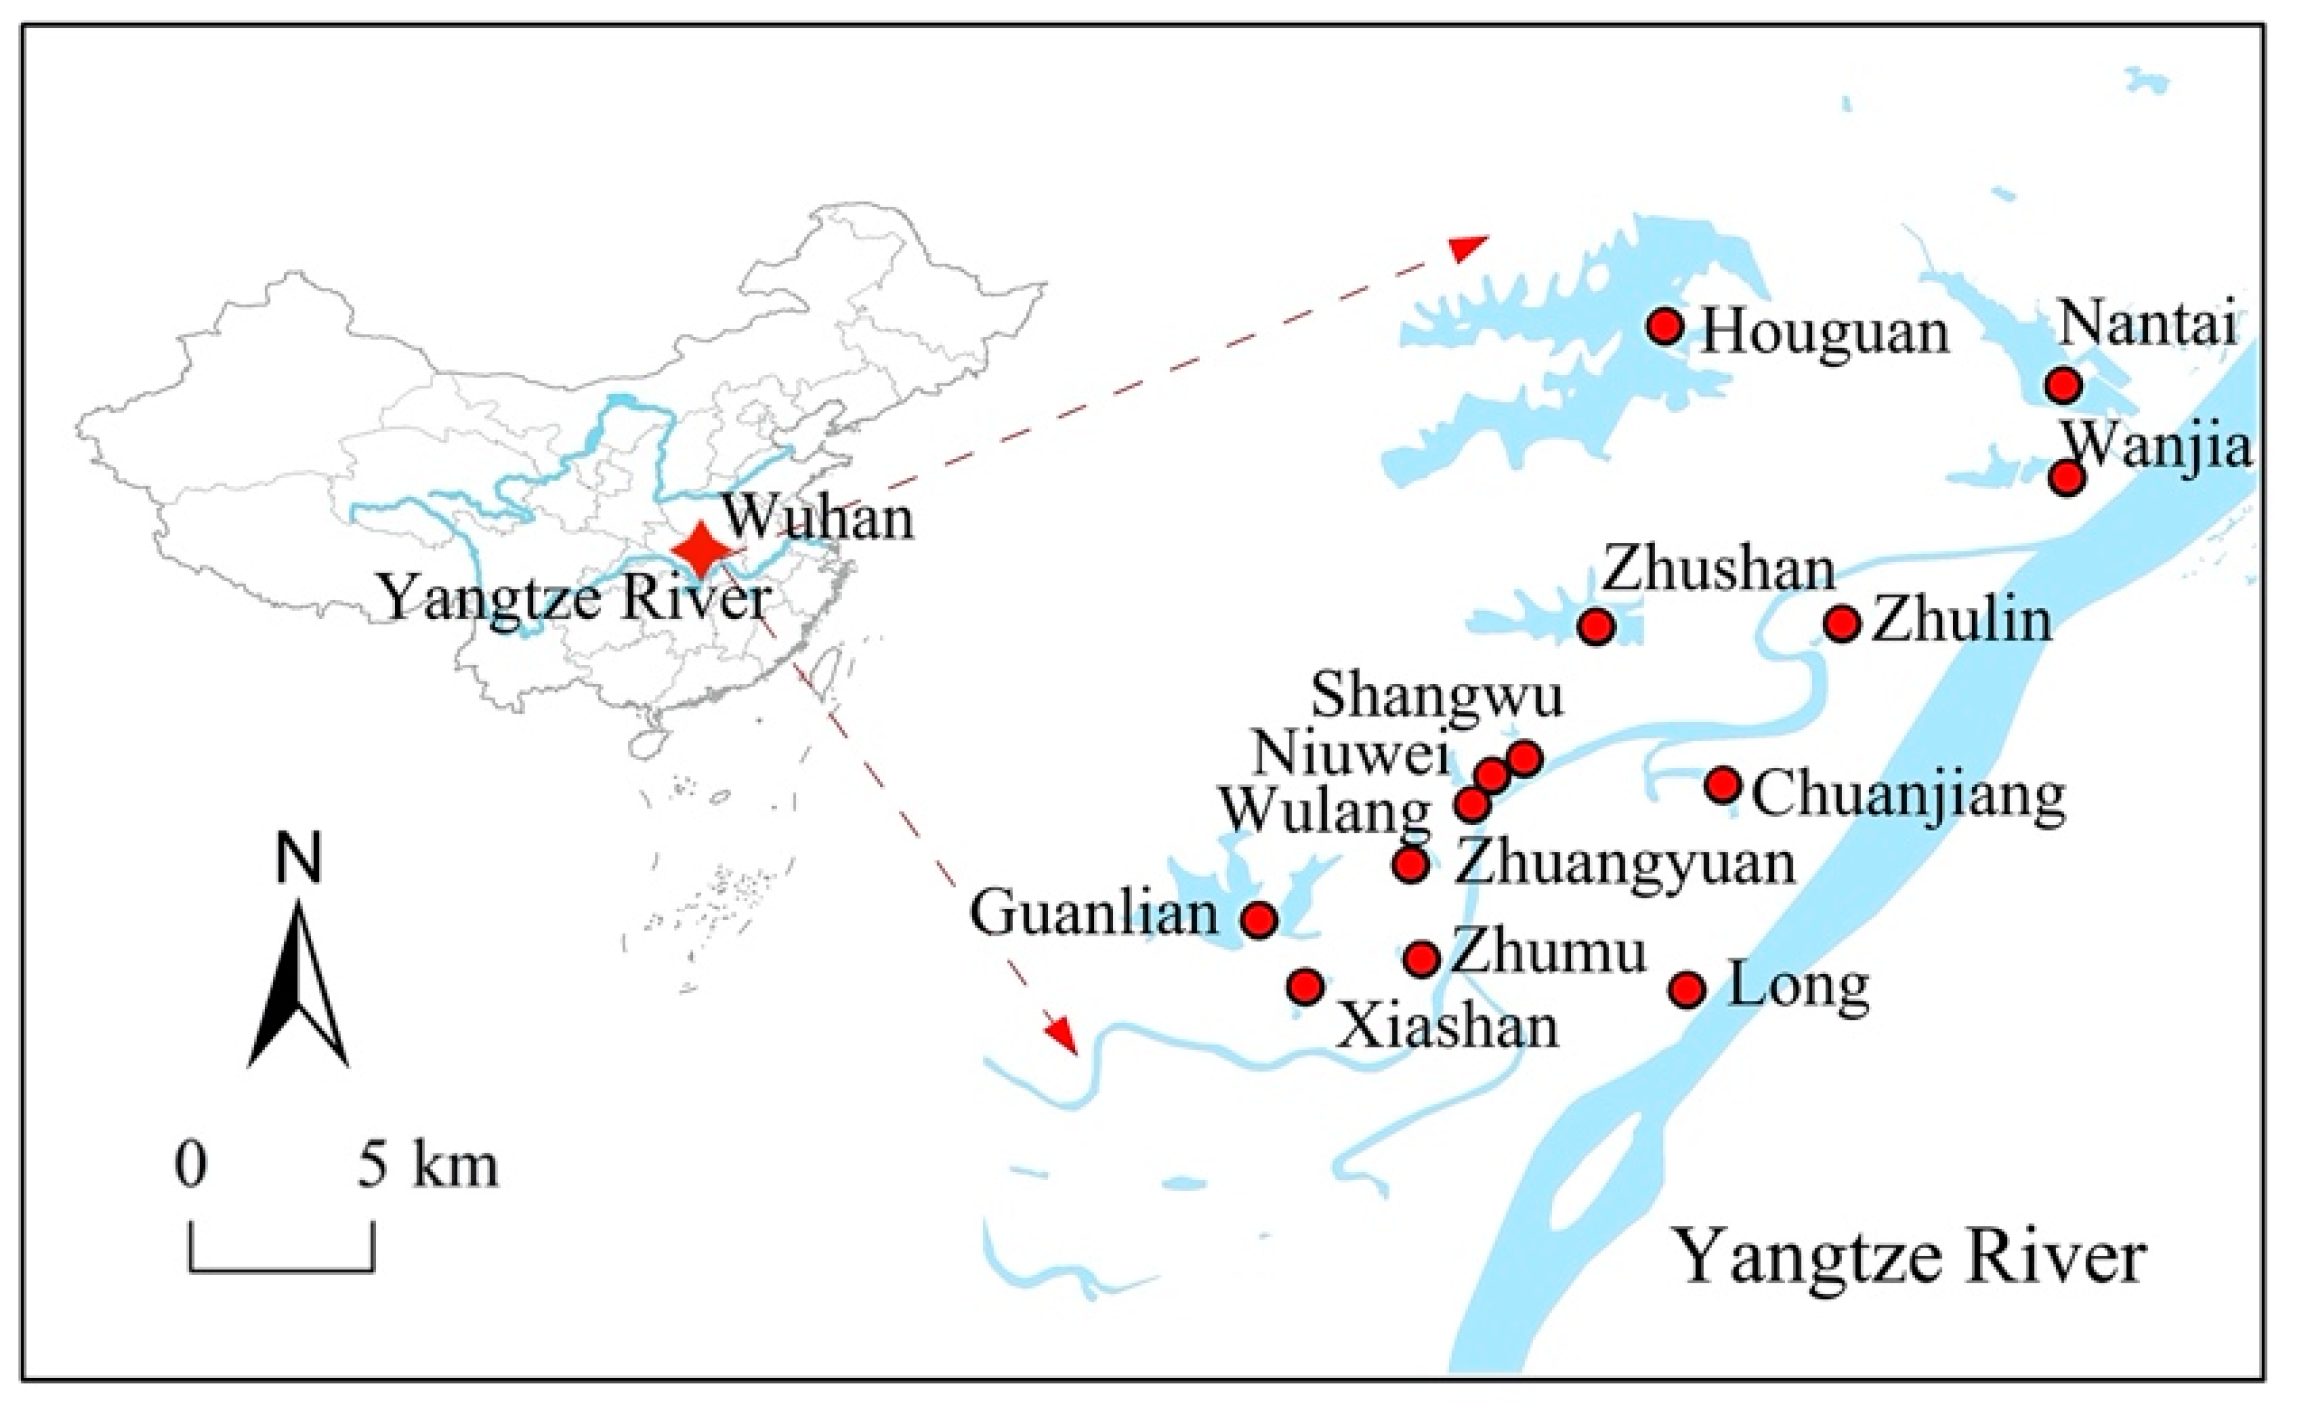
The study area was located in the national Wuhan Economic and Technological Development Zone (WETDZ) in China, which has an administrative area of 489.7 km2 and a population of nearly 400,000 (Figure 1). Wuhan, the capital of Hubei Province in China (113°41′–115°05′ E, 29°58′–31°55′ N), has the largest water surface coverage of all cities in China. These lakes range from 0.01 to 2255 km2 in size and exhibit widely varying water quality and optical properties [28]. Rapid socioeconomic development in the WETDZ has subjected this area to a range of public health and ecological risks that threaten further sustainable development. According to a 2016 report from the local department of environmental protection, over 70% of lakes in the WETDZ are worse than Class IV based on the standards established by the State Environment Protection Bureau of China. The deterioration of water quality can harm lake ecosystems and degrade associated ecological functions.
2.2. Field Survey
In order to comprehensively understand the phytoplankton community, a field survey in urban lakes was conducted during the phytoplankton bloom season. Two field surveys of 14 lakes in the WETDZ were performed by several workgroups within several adjacent days in August 2017 and August 2018. Three sampling sites were selected per lake based on spatial heterogeneity considerations. Triplicate water samples were collected randomly at each site using a stainless-steel bucket. These samples were fully homogenized and then a portion of the homogenized sample was used as the representative study site sample. Of this sample, 500 mL was frozen in acid-washed PVC bottles for nutrient analyses, while 1000 mL was preserved with 1% Lugol’s solution and concentrated to a final volume of 30 mL, following sedimentation for 48 h to facilitate phytoplankton analyses.
2.3. Chemical Analyses
In situ measurements of water temperature (WT), dissolved oxygen (DO), and pH were made with a Yellow Springs Instruments (YSI) 556 MPS. Water samples were used to measure chemical oxygen demand (COD), biochemical oxygen demand (BOD), total nitrogen (TN), and total phosphorus (TP) levels. BOD and COD were analyzed as per standard protocols established by the State Environment Protection Bureau of China (2002) [29], while TN and TP were respectively assessed via alkaline potassium persulphate digestion ultraviolet spectrometry and potassium persulfate digestion-Mo-Sb-Vc colorimetric methods [30].
A Sedgwich-R counting chamber was used to assess phytoplankton density (magnification × 400), while phytoplankton species were identified as detailed previously by Hu and Wei (2006) [31]. The Shannon index, which is a function of the number of taxa identified in the community (S; taxa richness) and the relative biomass of each taxon, was calculated to assess phytoplankton diversity [32,33]:
where s is the total number of phytoplankton types in a sample (richness), i is the total biomass of individuals of one type, and pi is the proportion of biomass of type i relative to the total biomass across all types.
2.4. Lake Watershed Area and Land Use Analyses
DEM, land use, and satellite remote-sensing data were collected to evaluate land use and the watershed area associated with the analyzed urban lakes. DEM data were obtained from the Computer Network Information Center of the Chinese Academy of Sciences (projection coordinates: WGS8; resolution: 30 × 30 m). Land use data from 2015 were obtained from the Computer Network Information Center of the Chinese Academy of Sciences at a resolution of 30 × 30 m with the ALBERS projection of the Krasovsky ellipsoid. Satellite remote-sensing data were collected from the TM data of the US Land Resources Satellites Landsat 8 (projection coordinates: WGS8; resolution: 30 × 30 m). The WETDZ GRID map was generated with the ArcGis software based on DEM data. WETDZ river systems were extracted by filling in depressions, analyzing flow direction, and calculating cumulative flow. Lake watershed area was divided according to outlet locations, and adjusted based on pipeline alignment, urban layouts, and road distributions.
2.5. Statistical Analysis
Statistical analyses were performed using SPSS v22.0 (SPSS Inc., IL, USA). To ensure that the data better conformed to a normal distribution, results were subjected to logarithmic transformation. Results were compared using t-tests following the Kolmogorov-Smirnov and variance homogeneity tests, with p < 0.05 as the threshold of significance. Relationships between the phytoplankton biomass and lake drainage ratio as well as land use type were assessed through correlation analyses using simple linear regression.
3. Results and Discussion
3.1. Urban Lake Eutrophication
Lakes situated in urban regions provide higher levels of societal value and recreational benefits to their densely populated local communities as compared to rural lakes [34]. Appropriately managing water quality in these lakes, however, is challenging, owing to these high levels of population density and associated urban encroachment [35]. Overly high pollutant loads can subject urban lakes to a range of ecological and environmental challenges [34]. For example, Regnery and Püttmann [36] demonstrated that the toxic organophosphate levels in rural lakes were substantially lower than those in urban lakes, while Wu et al. [37] performed an analysis of 12 urban lakes in the Chinese capital of Beijing and found the vast majority of these lakes to be subject to substantial eutrophication. In the urban lakes of the WETDZ, the mean values of DO, CODMn, BOD, TN, and TP in the water were 11.5, 4.9, 2.7, 2.1, and 0.19 mg/L, respectively. Per the Chinese national water quality standards, these urban lakes fall in the fifth poorest quality category, as these lakes represent artificial ecosystems that are generally small and relatively shallow in addition to being subjected to high levels of socioeconomic development. The exact water quality values for these surveyed lakes varied, with DO, CODMn, BOD, TN, and TP ranges of 7.4–13.4 (standard deviation: 1.8), 2.7–8.0 (standard deviation: 1.7), 1.3–5.6 (standard deviation: 1.3), 0.5–9.8 (standard deviation: 2.3), and 0.02–0.96 (standard deviation: 0.23) mg/L, respectively. Per these Chinese national water quality standards, the ChuanJian, Long Hougua, Nantai, Wanjia, Wulang, Zhulin, Zhumu, and Zhuangyuan lakes exhibited the poorest water quality (fifth category), with TN and TP values of 1.53–9.8 and 0.02–0.96 mg/L, respectively, whereas the Guanliang, Shangwu, and Zhushan lakes exhibited the best water quality (third category), with TN and TP levels of 0.5–0.9 and 0.07–0.12 mg/L, respectively. As shown in Table 1, the trophic level index (TLI) values for each lake were calculated as detailed by Wang et al. [38]. Based on these results, 92.9% of the analyzed urban lakes were eutrophic. ChuanJiang lake was oligotrophic, while Wanjia lake was supereutrophic and the others were lightly eutrophic or mesotrophic. Lakes are an essential component of urban ecosystems, and often produce outsized influence on urban ecosystem health. Urban lakes are, however, often overlooked due to their small size [39]. The prevailing poor water quality of urban lakes is certainly weakening their ecological functions. City officials need to pay more attention and try to address water quality problems in the future.
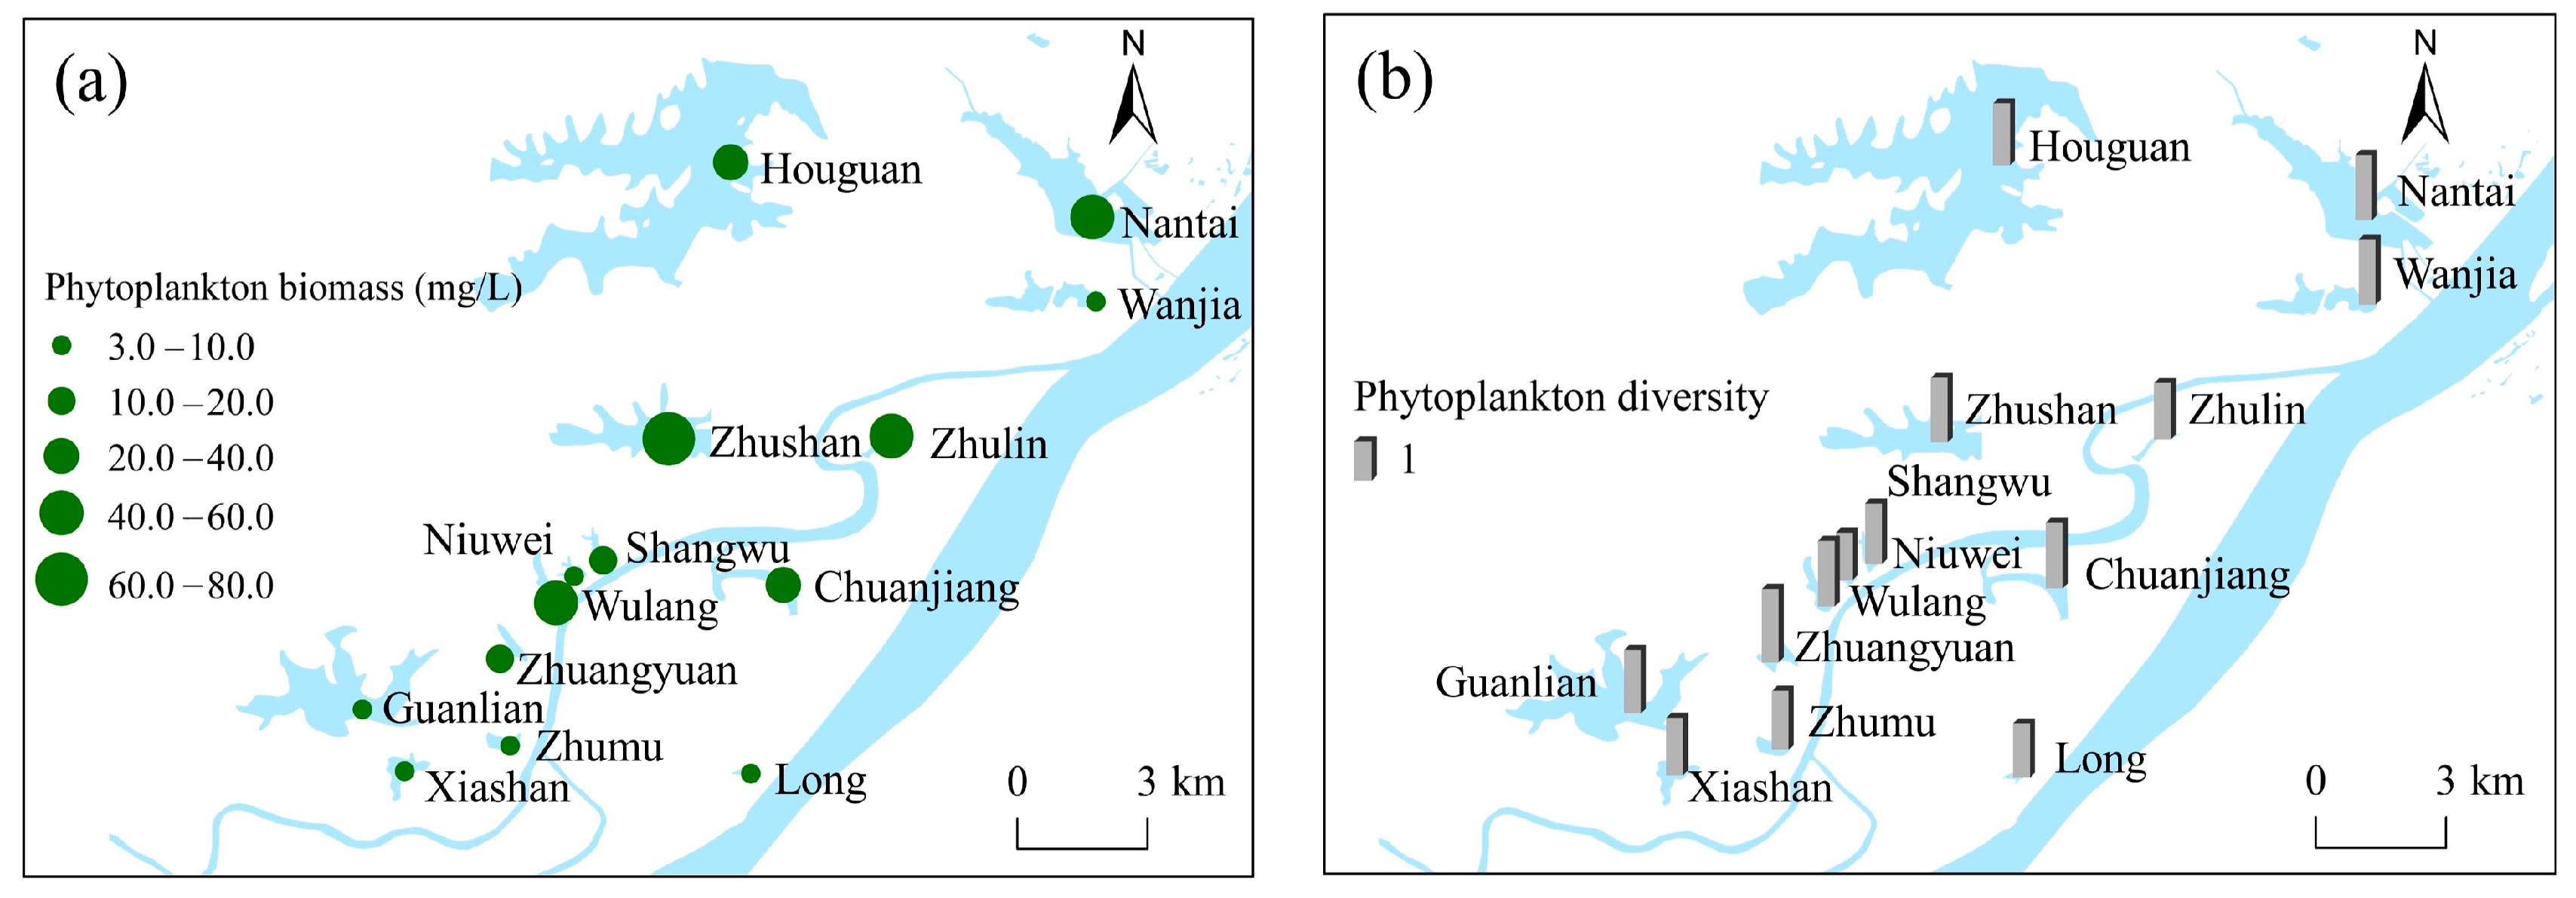
Nutrients are essential for phytoplankton growth, but the input of excessively high nutrient levels into a given body of water can result in adverse ecological outcomes including the rapid development of phytoplankton blooms [40,41]. Eutrophication and associated phytoplankton bloom formation can have a serious adverse impact on local water quality and ecological functionality [42]. The phytoplankton biomass in the surveyed lakes in this study was relatively high (mean: 30 mg/L), with substantial variation among the individual analyzed urban lakes in the WETDZ (range: 10–80 mg/L, standard deviation: 20 mg/L). The highest phytoplankton abundance was observed in Zhusan Lake (85 mg/L), with these levels being 5-fold higher than those in Wanjia Lake (15 mg/L) (Figure 2a). These urban lakes tended to exhibit low levels of phytoplankton diversity (range: 1.0–1.2) without any significant differences among the individual lakes (p > 0.05, t = 0.064, df = 13) (Figure 2b). The phytoplankton community showed high taxonomic similarity among these urban lakes with the dominant species of Chlorophyta (~60%). The other phytoplankton species includes Bacillariophyta, Cyanophyta, Cryptophyta, Euglenophyta, Pryrophyta, and Chrysophyta (Figure 3b). This may be attributable to high eutrophication pressure and similar local climatic conditions across the relatively limited study area. Eutrophication can decrease phytoplankton diversity in lakes [43], and climatic conditions can influence the structure of phytoplankton communities both directly through physiological changes and indirectly through changes in water column stratification and resource availability, thus altering light or nutrient availability and the intensity of grazing by heterotrophs [44].
3.2. The Relationships between Lake Morphometry and Eutrophication
Lake morphometry is closely linked to the accumulation of specific substances in lakes and the ecological processes that occur therein [45,46]. Zhou et al. [23] highlighted the high rates of eutrophication in shallow lakes, such as those often found in agricultural plains and lowland areas associated with high levels of population density. These shallow lakes are exposed to intensive human activity and high levels of anthropogenic nutrient input, unlike deeper lakes located in upland regions surrounded by primarily natural landscape features, where anthropogenic nutrient inputs are relatively minimal. Here, phytoplankton biomass was found to be positively correlated with the drainage ratio values with a correlation coefficient of 0.35 (p = 0.025) (Figure 3), with these values being calculated by dividing the catchment area by the associated lake area. The entry of terrestrial compounds from a large catchment area in small lakes generally results in high levels of areal substance accumulation, such that this accumulative capacity rises with lake drainage ratio values, ultimately providing nutrients to support higher levels of phytoplankton growth (Figure 2a).
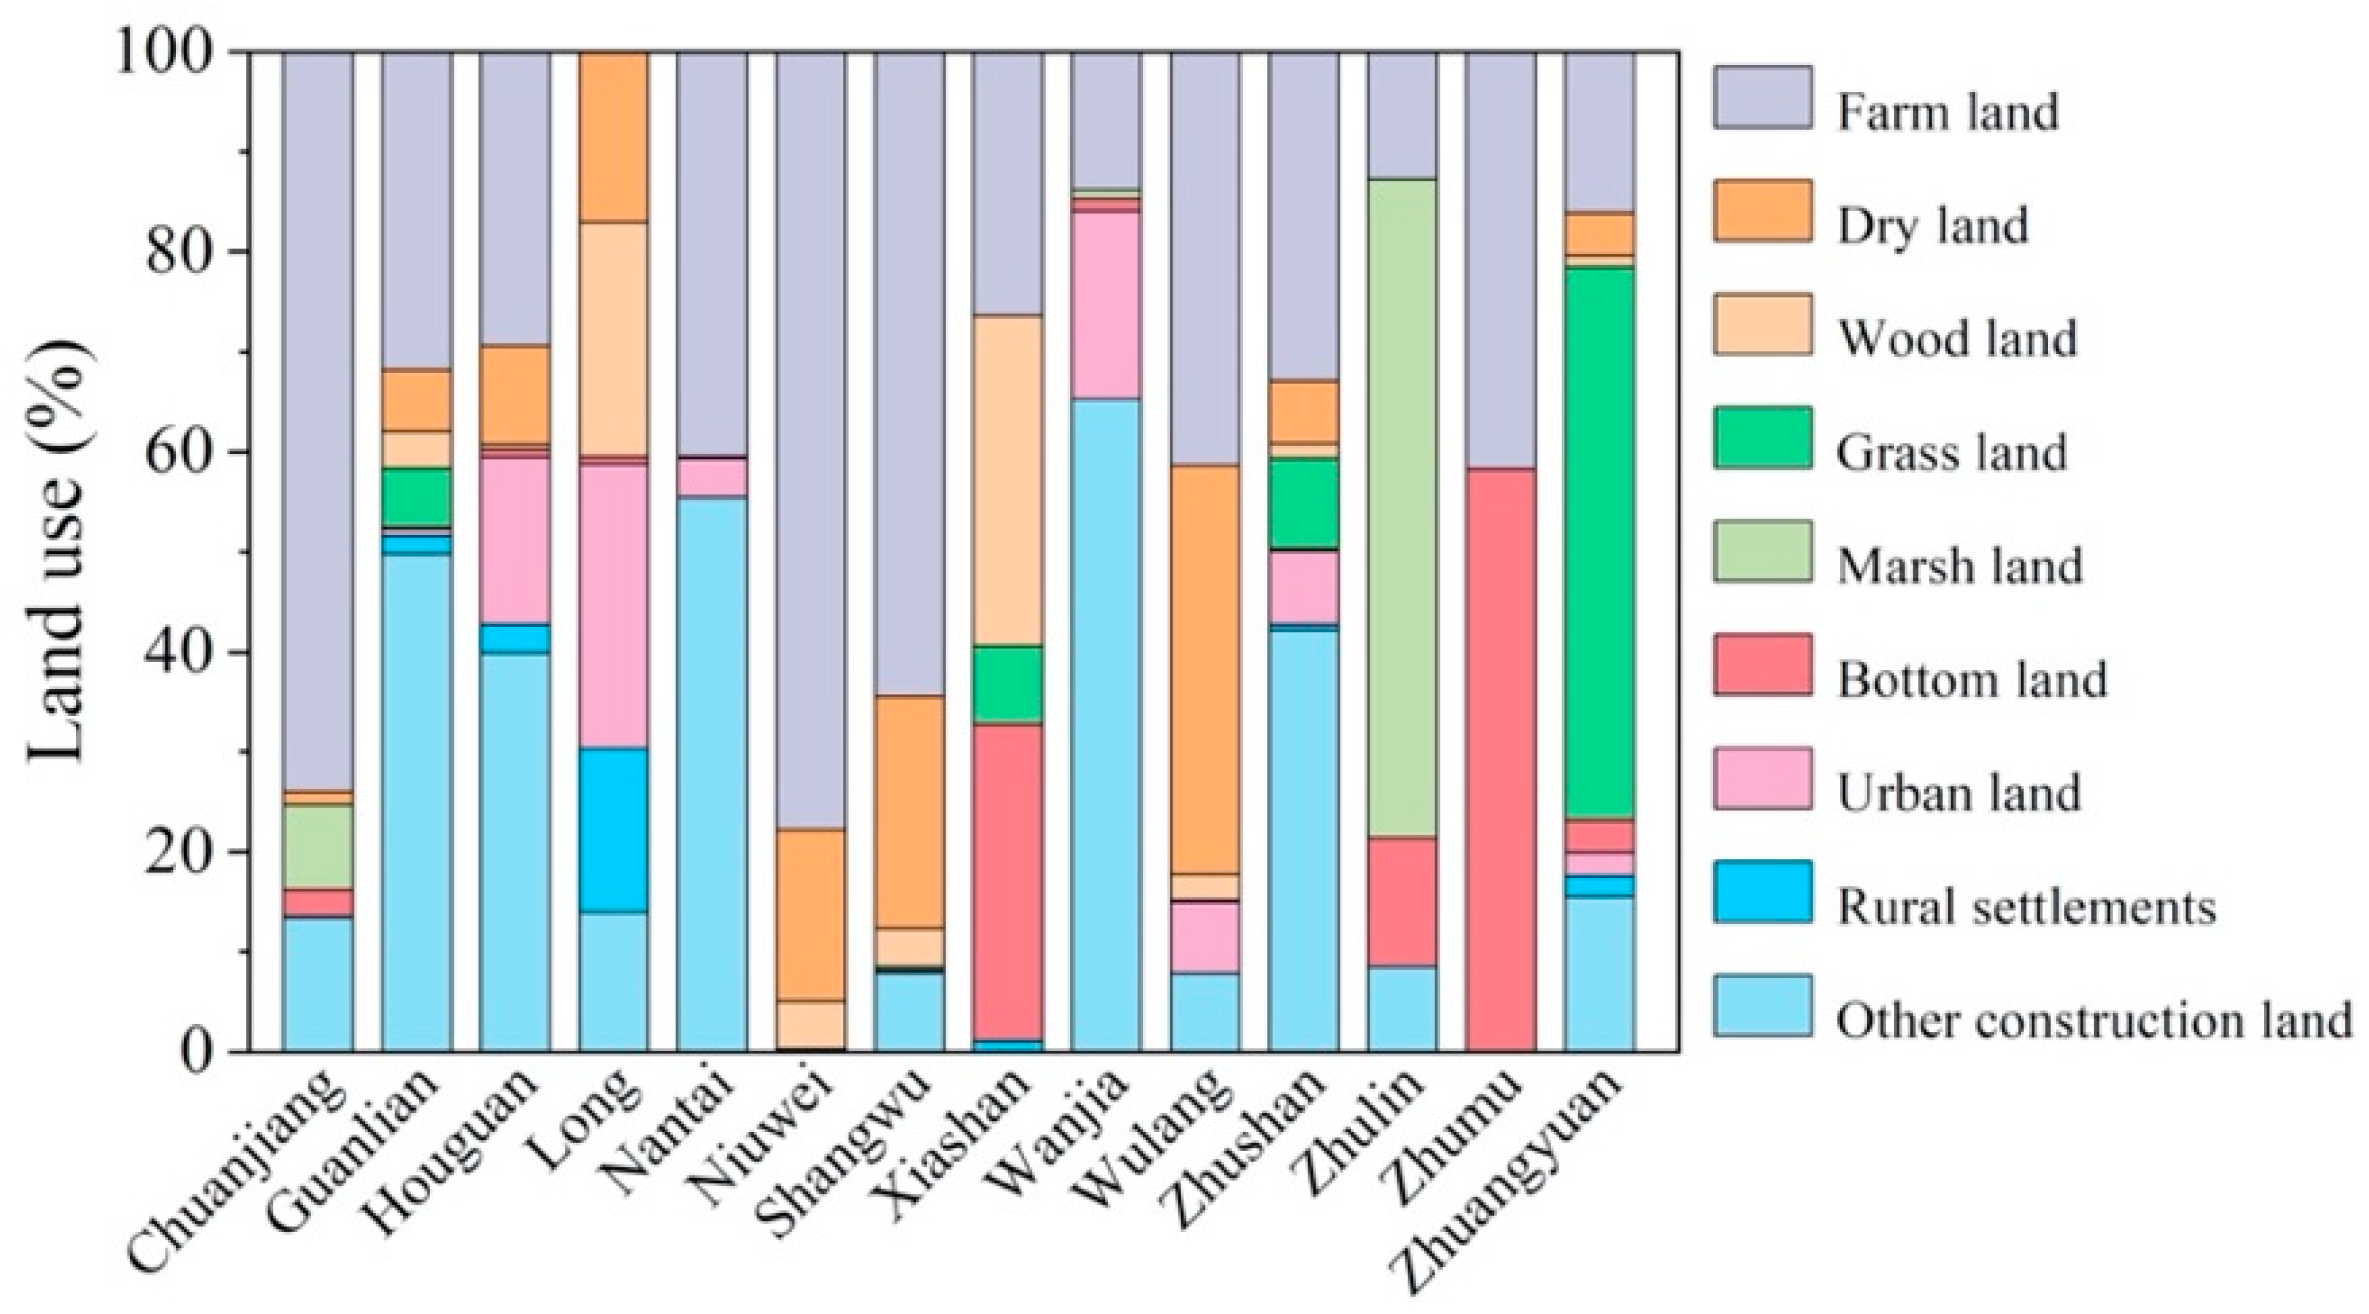
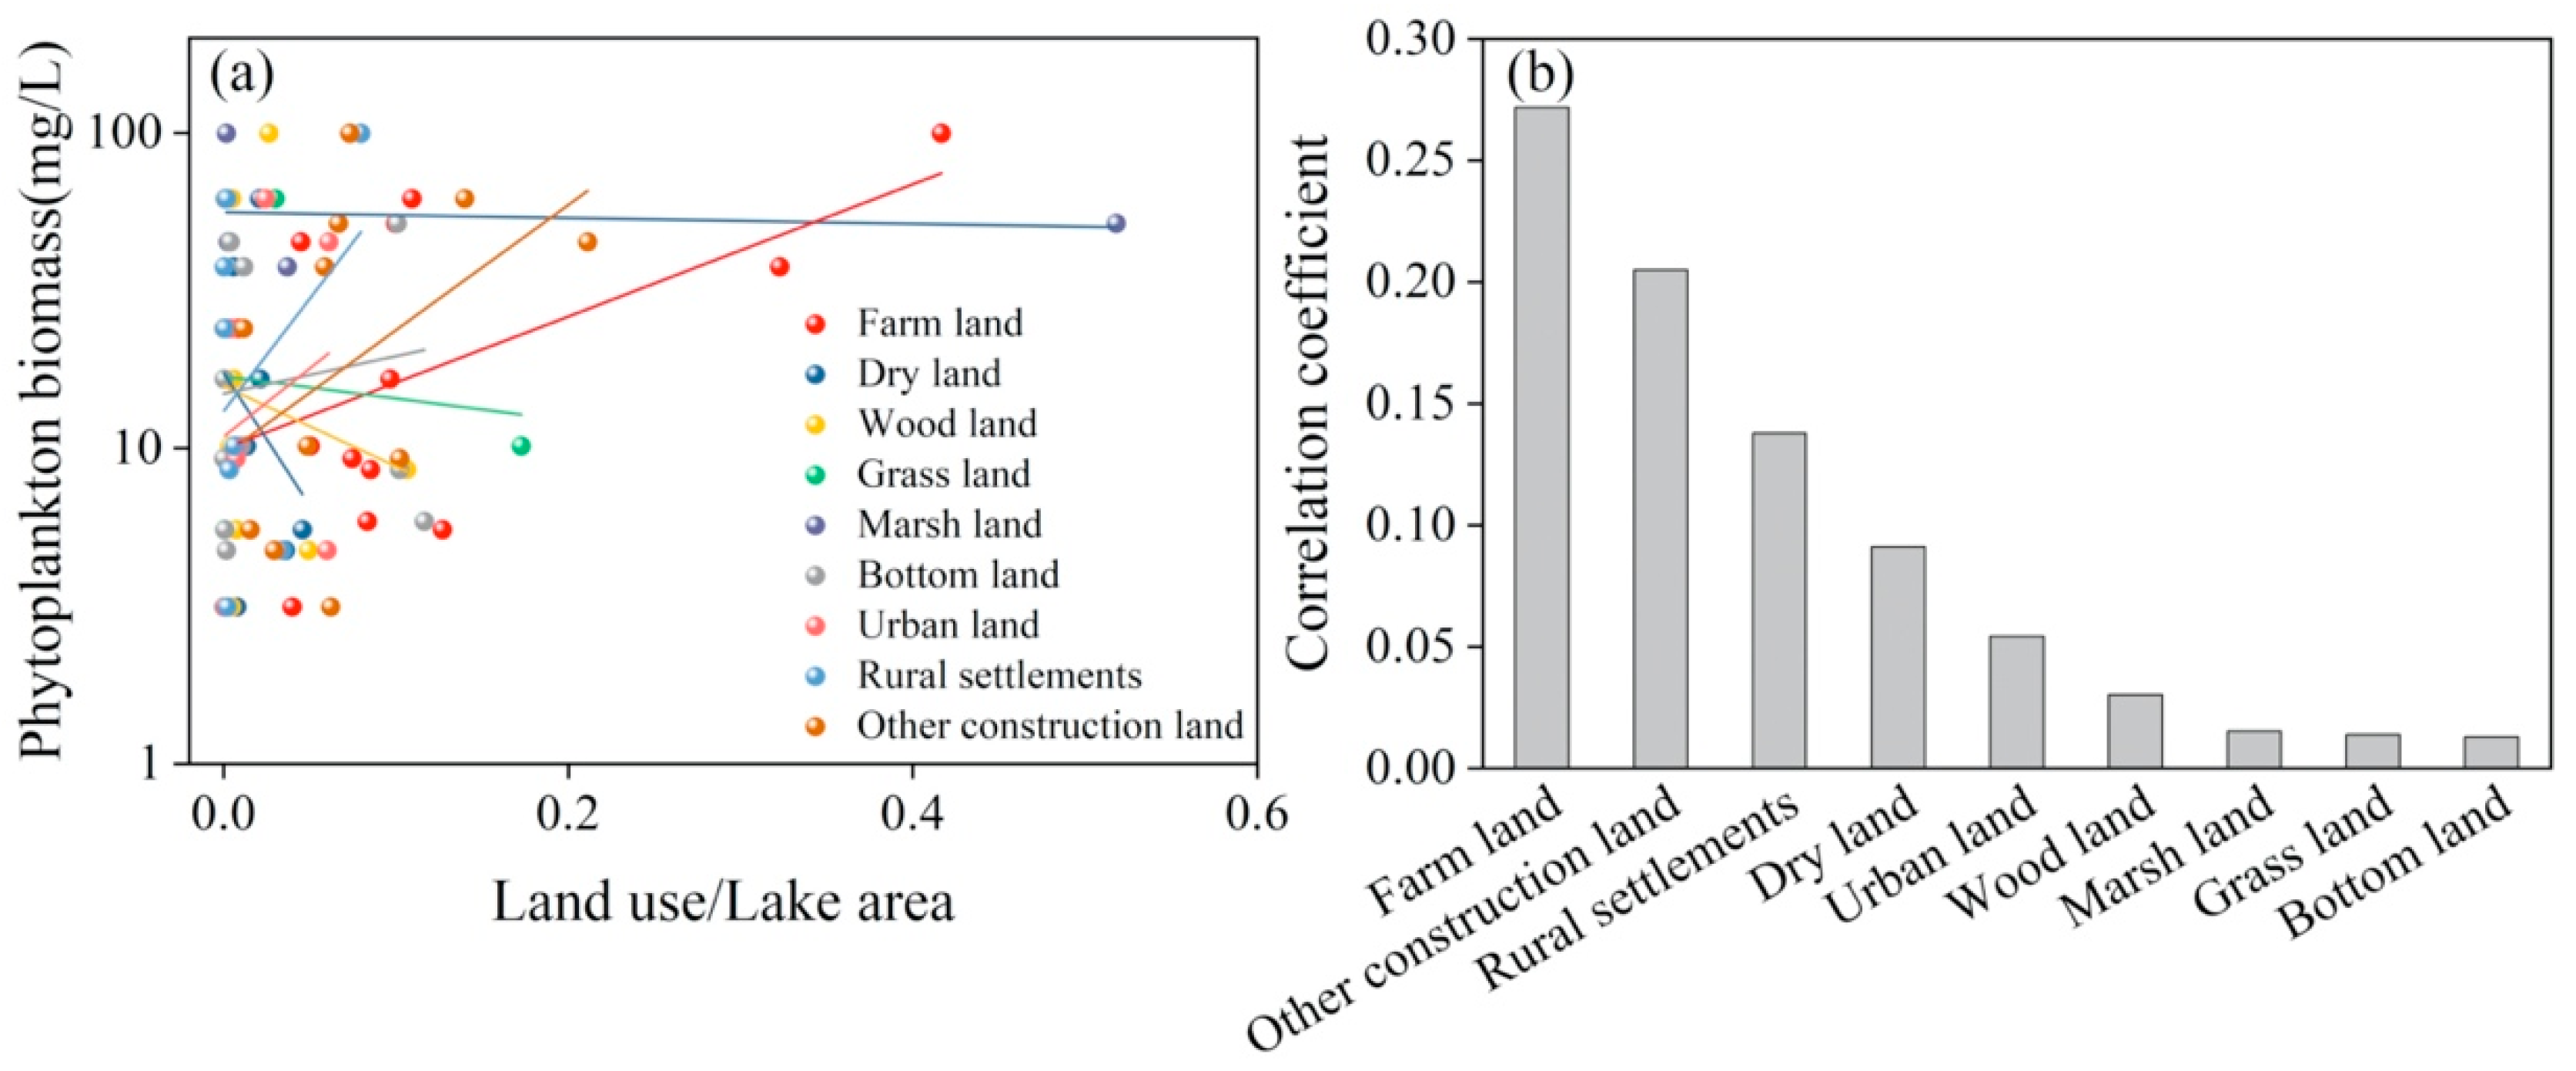
To evaluate the effects of watershed properties on the abundance of phytoplankton in these urban lakes, their associated watershed land use types were next evaluated. This approach revealed that farmland and construction were the two dominant land use types, with farmland, dry land, woodland, grassland, marshland, bottomland, urban land, rural settlements, and construction accounting for 32.23%, 5.86%, 2.54%, 5.15%, 2.62%, 2.78%, 7.90%, 1.20%, and 39.69% of land use activity, respectively (Figure 4). Analyses of the correlative relationships between land use type and phytoplankton abundance revealed that these levels differed substantially as a function of land use type. Specifically, a positive correlation was observed between phytoplankton levels and farmland, construction land, rural settlements, urban land, and bottomland, whereas these levels were negatively correlated with dry land, woodland, grassland, and marshland (Figure 5a). The strength of the correlation coefficients for farmland, construction land, rural settlements, and bottomland were 0.27, 0.21, 0.14, 0.05, and 0.01, respectively (Figure 5b). In contrast to more traditional urban zones, Chinese economic and technological development zones often harbor higher levels of industrial activity but lower levels of population density. The relatively low levels of water pollution generated by the primary industry in the WETDZ, automobile production, which are largely confined to associated industrial parks, thus resulting in farmland being the main contributor to associated urban lake pollution [47].
3.3. Future Perspectives for the Management of Urban Lake Water Quality
While urban lakes serve as an important provider of ecosystem services to their surrounding communities to a greater extent than do rural lakes, they are highly sensitive to the direct effects of anthropogenic activity. The present results revealed that urban lakes exhibit high rates of eutrophication, with drainage ratio values having a strong influence on phytoplankton abundance in these lakes owing to the high levels of nutrients that accumulate in smaller lakes associated with a large catchment. These urban lakes are widely considered to represent artificial ecosystems, and efforts to reduce the associated drainage ratio via increasing lake area or decreasing the associated catchment area have the potential to help protect against severe eutrophication, for example, by drawing flow to nearby lakes with lower drainage ratios. This water diversion has been widely used to control water quality in inland waters [48,49]. Land use in the watershed regions associated with urban lakes can also influence the pollutant loads therein, and a range of strategies can be employed in an effort to lower watershed-derived nutrient loads including geo-engineering tools, wetland construction, or the construction or optimization of wastewater treatment plants and technologies [50,51,52]. Moreover, based on the preliminary correlation between lake morphometry and water quality in this study, a model can be further established using machine learning in the future to predict water quality after collecting more data [53,54]. Such a model would facilitate management of urban lakes.
4. Conclusions
In the present analysis, the water quality of 14 urban lakes in Wuhan City, China, was assessed and the impacts of lake morphometric factors including land use and drainage ratio on water quality. The major findings of this study included the following:
- (1)
- The majority of surveyed urban lakes exhibited poor water quality, with 92.9% being classified as eutrophic and hypereutrophic.
- (2)
- Significant differences in phytoplankton biomass were observed among these lakes, with a mean value of 23.6 mg/L and values ranging between 10 and 80 mg/L, whereas no corresponding significant differences in phytoplankton diversity were observed (p > 0.05).
- (3)
- Phytoplankton biomass was positively correlated with lake drainage ratio (R2 = 0.35). Nutrient accumulation capacity rises with the drainage ratio, thereby providing nutrients that support greater levels of phytoplankton growth in these lake ecosystems.
- (4)
- More data need to be collected in the future to establish models to predict water quality using lake morphometry, which can be beneficial to urban lake management.
Author Contributions
Conceptualization, W.S.; methodology, W.G. and C.L.; investigation, W.G. and C.L.; data curation, Z.L. and B.L.; writing—original draft preparation, W.G. and W.S.; writing—review and editing, W.S.; supervision, W.S.; funding acquisition, W.G. and W.S. All authors have read and agreed to the published version of the manuscript.
Funding
This study was supported by the Fundamental Research Funds for Central Public Welfare Research Institutes (No. CKSF2019251/NY and CKSF2021299/NY), National Natural Science Foundation of China (No. 42277060, 51979171 and 52009009) and Starting Research Fund of Nanjing University of Information Engineering (No. 2021r097).
Data Availability Statement
The data supporting the findings of this study are available from the authors.
Conflicts of Interest
The authors declare no conflict of interest. The funders had no role in the design of the study; in the collection, analyses, or interpretation of data; in the writing of the manuscript, or in the decision to publish the results.
References
- Reynaud, A.; Lanzanova, D. A global meta-analysis of the value of ecosystem services provided by lakes. Ecol. Econ. 2017, 137, 184–194. [Google Scholar] [CrossRef]
- Steinman, A.D.; Cardinale, B.J.; Munns, W.R., Jr.; Ogdahl, M.E.; Allan, J.D.; Angadi, T.; Bartlett, S.; Brauman, K.; Byappanahalli, M.; Doss, M. Ecosystem services in the Great Lakes. J. Great Lakes Res. 2017, 43, 161–168. [Google Scholar]
- Zhao, Q.; Wang, Q. Water ecosystem service quality evaluation and value assessment of Taihu Lake in China. Water 2021, 13, 618. [Google Scholar] [CrossRef]
- Sun, Y.; Zhang, X.; Ren, G.; Zwiers, F.W.; Hu, T. Contribution of urbanization to warming in China. Nat. Clim. Chang. 2016, 6, 706–709. [Google Scholar] [CrossRef]
- Ritchie, H.; Roser, M. Urbanization. Our World in Data. Available online: https://ourworldindata.org/urbanization (accessed on 1 January 2023).
- United Nations, Department of Economic and Social Affairs, Population Division. World Urbanization Prospects: The 2018 Revision; United Nations: New York, NY, USA, 2019; pp. 1–123. ISBN 9789210043144. [Google Scholar]
- McGoff, E.; Solimini, A.G.; Pusch, M.T.; Jurca, T.; Sandin, L. Does lake habitat alteration and land-use pressure homogenize E uropean littoral macroinvertebrate communities? J. Appl. Ecol. 2013, 50, 1010–1018. [Google Scholar] [CrossRef]
- Luo, Y.; Zhao, Y.; Yang, K.; Chen, K.; Pan, M.; Zhou, X. Dianchi Lake watershed impervious surface area dynamics and their impact on lake water quality from 1988 to 2017. Environ. Sci. Pollut. Res. 2018, 25, 29643–29653. [Google Scholar]
- Jenny, J.-P.; Normandeau, A.; Francus, P.; Taranu, Z.E.; Gregory-Eaves, I.; Lapointe, F.; Jautzy, J.; Ojala, A.E.; Dorioz, J.-M.; Schimmelmann, A. Urban point sources of nutrients were the leading cause for the historical spread of hypoxia across European lakes. Proc. Natl. Acad. Sci. USA 2016, 113, 12655–12660. [Google Scholar]
- Lewis, W.M., Jr.; Wurtsbaugh, W.A.; Paerl, H.W. Rationale for control of anthropogenic nitrogen and phosphorus to reduce eutrophication of inland waters. Environ. Sci. Technol. 2011, 45, 10300–10305. [Google Scholar]
- Bianchi, T.S.; DiMarco, S.; Cowan Jr, J.; Hetland, R.; Chapman, P.; Day, J.; Allison, M. The science of hypoxia in the Northern Gulf of Mexico: A review. Sci Total Env. 2010, 408, 1471–1484. [Google Scholar]
- Porter, E.M.; Bowman, W.D.; Clark, C.M.; Compton, J.E.; Pardo, L.H.; Soong, J.L. Interactive effects of anthropogenic nitrogen enrichment and climate change on terrestrial and aquatic biodiversity. Biogeochemistry 2013, 114, 93–120. [Google Scholar] [CrossRef]
- Li, J.; Hansson, L.-A.; Persson, K.M. Nutrient control to prevent the occurrence of cyanobacterial blooms in a eutrophic lake in Southern Sweden, used for drinking water supply. Water 2018, 10, 919. [Google Scholar] [CrossRef]
- Ho, J.C.; Michalak, A.M.; Pahlevan, N. Widespread global increase in intense lake phytoplankton blooms since the 1980s. Nature 2019, 574, 667–670. [Google Scholar] [CrossRef]
- Wang, H.; García Molinos, J.; Heino, J.; Zhang, H.; Zhang, P.; Xu, J. Eutrophication causes invertebrate biodiversity loss and decreases cross-taxon congruence across anthropogenically-disturbed lakes. Environ. Int. 2021, 153, 106494. [Google Scholar] [CrossRef]
- Qin, B.; Paerl, H.W.; Brookes, J.D.; Liu, J.; Jeppesen, E.; Zhu, G.; Zhang, Y.; Xu, H.; Shi, K.; Deng, J. Why Lake Taihu continues to be plagued with cyanobacterial blooms through 10 years (2007–2017) efforts. Sci. Bull. 2019, 6, 354–356. [Google Scholar] [CrossRef]
- Steele, M.; Heffernan, J. Morphological characteristics of urban water bodies: Mechanisms of change and implications for ecosystem function. Ecol. Appl. 2014, 24, 1070–1084. [Google Scholar] [CrossRef]
- Gong, X.; Ding, Q.; Jin, M.; Zhao, Z.; Zhang, L.; Yao, S.; Xue, B. Recording and response of persistent toxic substances (PTSs) in urban lake sediments to anthropogenic activities. Sci. Total Environ. 2021, 777, 145977. [Google Scholar] [CrossRef]
- Friese, K.; Schmidt, G.; de Lena, J.C.; Nalini Jr, H.A.; Zachmann, D.W. Anthropogenic influence on the degradation of an urban lake–The Pampulha reservoir in Belo Horizonte, Minas Gerais, Brazil. Limnologica 2010, 40, 114–125. [Google Scholar]
- Gkelis, S.; Papadimitriou, T.; Zaoutsos, N.; Leonardos, I. Anthropogenic and climate-induced change favors toxic cyanobacteria blooms: Evidence from monitoring a highly eutrophic, urban Mediterranean lake. Harmful Algae 2014, 39, 322–333. [Google Scholar] [CrossRef]
- Qin, B.; Zhou, J.; Elser, J.J.; Gardner, W.S.; Deng, J.; Brookes, J.D. Water depth underpins the relative roles and fates of nitrogen and phosphorus in lakes. Environ. Sci. Technol. 2020, 54, 3191–3198. [Google Scholar] [CrossRef]
- Holgerson, M.A.; Raymond, P.A. Large contribution to inland water CO2 and CH4 emissions from very small ponds. Nat. Geosci. 2016, 9, 222–226. [Google Scholar] [CrossRef]
- Zhou, J.; Leavitt, P.R.; Zhang, Y.; Qin, B. Anthropogenic eutrophication of shallow lakes: Is it occasional? Water Res. 2022, 221, 118728. [Google Scholar] [CrossRef]
- Staehr, P.A.; Baastrup-Spohr, L.; Sand-Jensen, K.; Stedmon, C. Lake metabolism scales with lake morphometry and catchment conditions. Aquat. Sci. 2012, 74, 155–169. [Google Scholar] [CrossRef]
- Gergel, S.E.; Turner, M.G.; Kratz, T.K. Dissolved organic carbon as an indicator of the scale of watershed influence on lakes and rivers. Ecol. Appl. 1999, 9, 1377–1390. [Google Scholar] [CrossRef]
- Rasmussen, J.B.; Godbout, L.; Schallenberg, M. The humic content of lake water and its relationship to watershed and lake morphometry. Limnol. Oceanogr. 1989, 34, 1336–1343. [Google Scholar] [CrossRef]
- Cremona, F.; Laas, A.; Hanson, P.C.; Sepp, M.; Nõges, P.; Nõges, T. Drainage ratio as a strong predictor of allochthonous carbon budget in hemiboreal lakes. Ecosystems 2019, 22, 805–817. [Google Scholar] [CrossRef]
- Liu, H.; He, B.; Zhou, Y.; Yang, X.; Zhang, X.; Xiao, F.; Feng, Q.; Liang, S.; Zhou, X.; Fu, C. Eutrophication monitoring of lakes in Wuhan based on Sentinel-2 data. GIScience Remote Sens. 2021, 58, 776–798. [Google Scholar] [CrossRef]
- State Environment Protection Bureau of China. The Monitoring Analysis Method of Water and Wastewater; China Environmental Science Press: Beijing, China, 2002.
- Pan, G.; Dai, L.; Li, L.; He, L.; Li, H.; Bi, L.; Gulati, R.D. Reducing the recruitment of sedimented algae and nutrient release into the overlying water using modified soil/sand flocculation-capping in eutrophic lakes. Environ. Sci. Technol. 2012, 46, 5077–5084. [Google Scholar]
- Hu, H.; Yinxin, W. The Freshwater Algae of China: Systematics, Taxonomy and Ecology; Science Press: Beijing, China, 2006. (In Chinese) [Google Scholar]
- Urrutia-Cordero, P.; Ekvall, M.K.; Ratcovich, J.; Soares, M.; Wilken, S.; Zhang, H.; Hansson, L.A. Phytoplankton diversity loss along a gradient of future warming and brownification in freshwater mesocosms. Freshw. Biol. 2017, 62, 1869–1878. [Google Scholar] [CrossRef]
- Goebel, N.; Edwards, C.; Zehr, J.; Follows, M.; Morgan, S. Modeled phytoplankton diversity and productivity in the California Current System. Ecol. Model. 2013, 264, 37–47. [Google Scholar] [CrossRef]
- Birch, S.; McCaskie, J. Shallow urban lakes: A challenge for lake management. Hydrobiologia 1999, 395, 365–378. [Google Scholar] [CrossRef]
- Zhang, L.; Shao, S.; Liu, C.; Xu, T.; Fan, C. Forms of nutrients in rivers flowing into Lake Chaohu: A comparison between urban and rural rivers. Water 2015, 7, 4523–4536. [Google Scholar] [CrossRef]
- Regnery, J.; Püttmann, W. Occurrence and fate of organophosphorus flame retardants and plasticizers in urban and remote surface waters in Germany. Water Res. 2010, 44, 4097–4104. [Google Scholar] [CrossRef]
- Wu, Q.; Xia, X.; Li, X.; Mou, X. Impacts of meteorological variations on urban lake water quality: A sensitivity analysis for 12 urban lakes with different trophic states. Aquat. Sci. 2014, 76, 339–351. [Google Scholar] [CrossRef]
- Wang, M.; Liu, X.; Zhang, J. Evaluate method and classification standard on lake eutrophication. Environ. Monit. China 2002, 18, 47–49. [Google Scholar]
- Henny, C.; Meutia, A.A. Urban Lakes in Megacity Jakarta: Risk and Management Plan for Future Sustainability. Procedia Environ. Sci. 2014, 20, 737–746. [Google Scholar] [CrossRef]
- Huang, J.; Zhang, Y.; Huang, Q.; Gao, J. When and where to reduce nutrient for controlling harmful algal blooms in large eutrophic lake Chaohu, China? Ecol. Indic. 2018, 89, 808–817. [Google Scholar] [CrossRef]
- Wang, J.-H.; Li, C.; Xu, Y.-P.; Li, S.-Y.; Du, J.-S.; Han, Y.-P.; Hu, H.-Y. Identifying major contributors to algal blooms in Lake Dianchi by analyzing river-lake water quality correlations in the watershed. J. Clean. Prod. 2021, 315, 128144. [Google Scholar] [CrossRef]
- Paerl, H.W.; Gardner, W.S.; McCarthy, M.J.; Peierls, B.L.; Wilhelm, S.W. Algal blooms: Noteworthy nitrogen. Science 2014, 346, 175. [Google Scholar]
- Qin, B.; Gao, G.; Zhu, G.; Zhang, Y.; Song, Y.; Tang, X.; Xu, H.; Deng, J. Lake eutrophication and its ecosystem response. Chin. Sci. Bull. 2013, 58, 961–970. [Google Scholar] [CrossRef] [Green Version]
- Winder, M.; Sommer, U. Phytoplankton response to a changing climate. Hydrobiologia 2012, 698, 5–16. [Google Scholar] [CrossRef]
- Xenopoulos, M.A.; Lodge, D.M.; Frentress, J.; Kreps, T.A.; Bridgham, S.D.; Grossman, E.; Jackson, C.J. Regional comparisons of watershed determinants of dissolved organic carbon in temperate lakes from the Upper Great Lakes region and selected regions globally. Limnol. Oceanogr. 2003, 48, 2321–2334. [Google Scholar] [CrossRef]
- Hiscock, J.G.; Thourot, C.S.; Zhang, J. Phosphorus budget—Land use relationships for the northern Lake Okeechobee watershed, Florida. Ecol. Eng. 2003, 21, 63–74. [Google Scholar] [CrossRef]
- Geng, Y.; Hengxin, Z. Industrial park management in the Chinese environment. J. Clean. Prod. 2009, 17, 1289–1294. [Google Scholar] [CrossRef]
- Zhou, H.; Chen, Y.; Ye, Z.; Li, Y.; Zhu, C. River–Lake System Connectivity Effectively Reduced the Salinity of Lake Water in Bosten Lake, Northwest China. Water 2022, 14, 4002. [Google Scholar] [CrossRef]
- Li, P.; Li, G.; Guo, L.; Shi, D. A study on sediment avoidance diversion and the coordinated dispatch of water and sediment at an injection-water supply project on a sediment-laden river. Eng. Appl. Comput. Fluid Mech. 2021, 15, 530–548. [Google Scholar] [CrossRef]
- Tong, Y.; Wang, M.; Peñuelas, J.; Liu, X.; Paerl, H.W.; Elser, J.J.; Sardans, J.; Couture, R.-M.; Larssen, T.; Hu, H. Improvement in municipal wastewater treatment alters lake nitrogen to phosphorus ratios in populated regions. Proc. Natl. Acad. Sci. USA 2020, 117, 11566–11572. [Google Scholar]
- Kovacic, D.A.; Twait, R.M.; Wallace, M.P.; Bowling, J.M. Use of created wetlands to improve water quality in the Midwest—Lake Bloomington case study. Ecol. Eng. 2006, 28, 258–270. [Google Scholar]
- Golden, H.E.; Rajib, A.; Lane, C.R.; Christensen, J.R.; Wu, Q.; Mengistu, S. Non-floodplain wetlands affect watershed nutrient dynamics: A critical review. Environ. Sci. Technol. 2019, 53, 7203–7214. [Google Scholar] [CrossRef]
- Abdalrahman, G.; Lai, S.H.; Kumar, P.; Ahmed, A.N.; Sherif, M.; Sefelnasr, A.; Chau, K.W.; Elshafie, A. Modeling the infiltration rate of wastewater infiltration basins considering water quality parameters using different artificial neural network techniques. Eng. Appl. Comput. Fluid Mech. 2022, 16, 397–421. [Google Scholar] [CrossRef]
- Sun, K.; Rajabtabar, M.; Samadi, S.; Rezaie-Balf, M.; Ghaemi, A.; Band, S.S.; Mosavi, A. An integrated machine learning, noise suppression, and population-based algorithm to improve total dissolved solids prediction. Eng. Appl. Comput. Fluid Mech. 2021, 15, 251–271. [Google Scholar]
Figure 1.
The location of the analyzed urban lakes in the present study.

Figure 2.
Phytoplankton biomass and diversity in analyzed urban lakes. (a) Phytoplankton biomass; (b) Phytoplankton diversity.
Figure 2.
Phytoplankton biomass and diversity in analyzed urban lakes. (a) Phytoplankton biomass; (b) Phytoplankton diversity.

Figure 3.
Correlations between phytoplankton biomass and lake drainage ratio values and phytoplankton community in the analyzed urban lakes. (a) Correlation between phytoplankton biomass and lake drainage ratio values; (b) Phytoplankton community. The 95% confidence intervals are denoted by light red shading. The lake drainage ratio was calculated by dividing the catchment area by the lake area.

Figure 4.
Lake watershed land use for the analyzed urban lakes in this study.

Figure 5.
Correlations between phytoplankton biomass and drainage ratio values associated with different land use types. (a) Correlation analysis; (b) Correlation coefficient.
Figure 5.
Correlations between phytoplankton biomass and drainage ratio values associated with different land use types. (a) Correlation analysis; (b) Correlation coefficient.


Table 1.
The physicochemical properties of water in the urban lakes analyzed in this study.
| Lake Name | Lat. | Lon. | Catchment Area (ha) | Lake Area (ha) | WT (°C) | pH | DO (mg/L) | CODMn (mg/L) | BOD (mg/L) | TN (mg/L) | TP (mg/L) | TLI |
|---|---|---|---|---|---|---|---|---|---|---|---|---|
| ChuanJiang | 30.41 | 114.13 | 291 | 668 | 9.3 | 8.7 | 12.4 | 3.02 | 1.40 | 1.58 | 0.02 | 28.2 |
| Long | 30.37 | 114.13 | 35 | 168 | 9.6 | 8.5 | 11.0 | 2.70 | 1.90 | 1.72 | 0.07 | 42.1 |
| Guanliang | 30.38 | 114.05 | 1238 | 8082 | 9.3 | 8.3 | 10.3 | 3.58 | 1.80 | 0.51 | 0.08 | 43.5 |
| Houguan | 30.49 | 114.12 | 1812 | 61,215 | 9.5 | 8.9 | 11.0 | 3.89 | 2.80 | 2.41 | 0.06 | 40.3 |
| Nantai | 30.48 | 114.20 | 994 | 5357 | 10.5 | 8.9 | 8.4 | 5.25 | 2.50 | 3.41 | 0.29 | 57.8 |
| Niuwei | 30.41 | 114.09 | 34 | 258 | 5.0 | 8.2 | 12.8 | 6.17 | 1.70 | 0.90 | 0.19 | 53.1 |
| Shangwu | 30.41 | 114.10 | 54 | 279 | 3.8 | 8.1 | 12.5 | 4.47 | 1.57 | 0.71 | 0.12 | 48.0 |
| Wanjia | 30.46 | 114.20 | 511 | 1580 | 9.6 | 9.1 | 7.4 | 8.00 | 5.63 | 9.80 | 0.96 | 71.1 |
| Xiashan | 30.37 | 114.06 | 321 | 999 | 7.8 | 8.5 | 11.8 | 3.38 | 1.30 | 1.26 | 0.09 | 44.8 |
| Wulang | 30.41 | 114.09 | 82 | 660 | 11.1 | 8.4 | 12.6 | 7.51 | 4.70 | 1.61 | 0.22 | 54.7 |
| Zhushan | 30.43 | 114.11 | 2760 | 6690 | 9.9 | 8.8 | 12.7 | 3.65 | 2.90 | 0.93 | 0.07 | 42.1 |
| Zhulin | 30.43 | 114.15 | 270 | 345 | 9.8 | 8.5 | 12.1 | 4.24 | 3.90 | 1.79 | 0.14 | 49.7 |
| Zhumu | 30.37 | 114.08 | 68 | 342 | 3.4 | 8.2 | 13.4 | 6.72 | 2.70 | 1.53 | 0.16 | 51.2 |
| Zhuangyuan | 30.39 | 114.08 | 268 | 860 | 3.9 | 8.6 | 13.2 | 6.25 | 2.78 | 1.86 | 0.15 | 50.5 |
Disclaimer/Publisher’s Note: The statements, opinions and data contained in all publications are solely those of the individual author(s) and contributor(s) and not of MDPI and/or the editor(s). MDPI and/or the editor(s) disclaim responsibility for any injury to people or property resulting from any ideas, methods, instructions or products referred to in the content. |
© 2023 by the authors. Licensee MDPI, Basel, Switzerland. This article is an open access article distributed under the terms and conditions of the Creative Commons Attribution (CC BY) license (https://creativecommons.org/licenses/by/4.0/).
Share and Cite
MDPI and ACS Style
Guo, W.; Li, Z.; Li, C.; Liu, B.; Shi, W. Drainage Ratio Controls Phytoplankton Abundance in Urban Lakes. Water 2023, 15, 683. https://doi.org/10.3390/w15040683
AMA Style
Guo W, Li Z, Li C, Liu B, Shi W. Drainage Ratio Controls Phytoplankton Abundance in Urban Lakes. Water. 2023; 15(4):683. https://doi.org/10.3390/w15040683
Chicago/Turabian StyleGuo, Weijie, Ziqian Li, Cai Li, Boyi Liu, and Wenqing Shi. 2023. "Drainage Ratio Controls Phytoplankton Abundance in Urban Lakes" Water 15, no. 4: 683. https://doi.org/10.3390/w15040683
Note that from the first issue of 2016, this journal uses article numbers instead of page numbers. See further details here.