Article

Impact of Climate Change on the Hydrological Regimes of the Midstream Section of the Yarlung Tsangpo River Basin Based on SWAT Model

1
State Key Laboratory of Tibetan Plateau Earth System, Environment and Resources (TPESER), Institute of Tibetan Plateau Research, Chinese Academy of Sciences, Beijing 100101, China
2
University of Chinese Academy of Sciences, Beijing 100049, China
3
China Institute of Water Resources and Hydropower Research, Beijing 100048, China
4
Hydrology and Water Resources Investigation Bureau of Tibet Autonomous Region, Lhasa 850000, China
*
Author to whom correspondence should be addressed.
Water 2023, 15(4), 685; https://doi.org/10.3390/w15040685
Submission received: 15 January 2023 / Revised: 2 February 2023 / Accepted: 7 February 2023 / Published: 9 February 2023
(This article belongs to the Special Issue Hydrological Modeling of Climate Change Impact)

Abstract

:
Water resources and the water cycle in high mountain areas are significantly impacted by climate change. In this study, the midstream section of the Yarlung Tsangpo River basin, situated in the southern part of the Tibetan Plateau, was chosen as the target area, and the Soil Water Assessment Tool (SWAT) was used to assess how climate change may affect hydrological processes. The SWAT model proved effective for runoff and snow cover area simulation. Surface runoff, interflow, and groundwater accounted for 47.2%, 24.4%, and 28.4% of the total runoff, respectively. The spatial distribution of runoff was mainly influenced by precipitation and glacier distribution, whereas the spatial distributions of individual runoff components were mainly influenced by soil properties. Overall, the total runoff as well as its components (surface runoff, interflow, and groundwater) increased at a rate of 0.03–0.83%/10 yr (p > 0.05) in the study area during 1983–2017, which could be attributed to the increase in precipitation. Surface runoff peaked earlier (August) than interflow and groundwater (September), owing to the longer convergence time of interflow and groundwater. Future predictions showed a warming and wetting trend (p < 0.05) in the study area from 2020 to 2100 under the SSP1-2.6, SSP2-4.5, SSP3-7.0, and SSP5-8.5 scenarios. The total runoff was projected to increase at a rate of 0.92–3.56%/10 yr, and the change of total runoff mainly came from the increase of surface runoff.

1. Introduction

Climate change has a pronounced impact on the water cycle and water resource systems, and the study of the hydrological cycle and its spatial and temporal evolution in a changing environment has consequently received considerable academic attention recently [1,2,3]. With the onset of industrialization, the atmosphere, oceans, and land have experienced warming [4]. The average global temperature during 2010–2019 has risen by 0.9 to 1.2 °C compared to its value in 1850–1900 [5]. Mountain regions are vulnerable to climate change, and they may be more severely affected than nearby lowlands. The distribution of water resources downstream of these vulnerable mountain regions can also be impacted; this aspect has received increasing research attention recently [6,7,8].
The Tibetan Plateau (TP), which is considered to be the water tower of Asia, is one of the areas that is most susceptible to the impacts of climate change [9,10]. The rate of warming in the TP is higher than the average rate of warming in the northern hemisphere and considerably higher than the global average rate of warming [11,12]. Assessments of changes in runoff are currently focused on climate-change impacts and on the contributions of rainfall, snowmelt, and glacier melt [13,14,15,16,17]. Changes in runoff can affect changes in sediment transport and have an impact on water supplies [18,19].
The Yarlung Tsangpo River is the largest river in Tibet [20]. Temperature and precipitation in the Yarlung Tsangpo River basin have demonstrated an increasing trend, and a similar trend has been observed for runoff [21,22,23]. Various models have been used to analyze the hydrological regimes of this river. For example, Gao [24] used the GBHM model to analyze annual runoff depth and annual actual evaporation in the Yarlung Tsangpo River basin. Tang [21] used SWAT to study runoff above Lhaze of the Yarlung Tsangpo River basin and simulated future runoff processes. Zhang et al. [15] used the VIC model to simulate the contribution of rainfall, snowmelt, and glacier melt to the total annual runoff of the Yarlung Tsangpo River basin. To date, there are very few studies on the runoff contribution of surface runoff, interflow, and groundwater to the total annual runoff under climate change in the Yarlung Tsangpo River basin.
SWAT is a model commonly used in runoff studies, and recent research has primarily focused on the applicability of runoff simulations in specific areas, determination of model parameters, and the influence of climate-change and land-use factors on runoff and sediment and on non-point-source nutrient pollution [14,25,26,27,28,29]. However, studies of the Tibetan Plateau using the SWAT model are limited. Dou et al. [30] used SWAT to quantitatively analyze the impact of land-use change on runoff in the Lancang River basin under different scenarios. Zhang et al. [31] used SWAT to study runoff in the source basin of the Yangtze River. Wang et al. [32] used SWAT to study the Three-River-Source region. However, the aforementioned studies have not considered glaciers, owing to limitations in the original SWAT model. Zhou et al. [33] replaced glaciers with thick snow in the WEB-DHM model, and found that the WEB-DHM model could reproduce daily discharge well. Replacing glaciers with thick snow is a useful approach to include glaciers in the original SWAT model.
Global interest in climate change and its effects on runoff in high mountain regions has increased, and this study focused on the midstream section of the Yarlung Tsangpo River basin. The objectives of this study were to: (1) set up the SWAT model to simulate the spatiotemporal characteristics of runoff and its main influencing factors; (2) simulate and study variations in the different components of runoff, i.e., surface runoff, interflow, and groundwater runoff; and (3) assess the impacts of climate change on the hydrological regime.

2. Materials and Methods
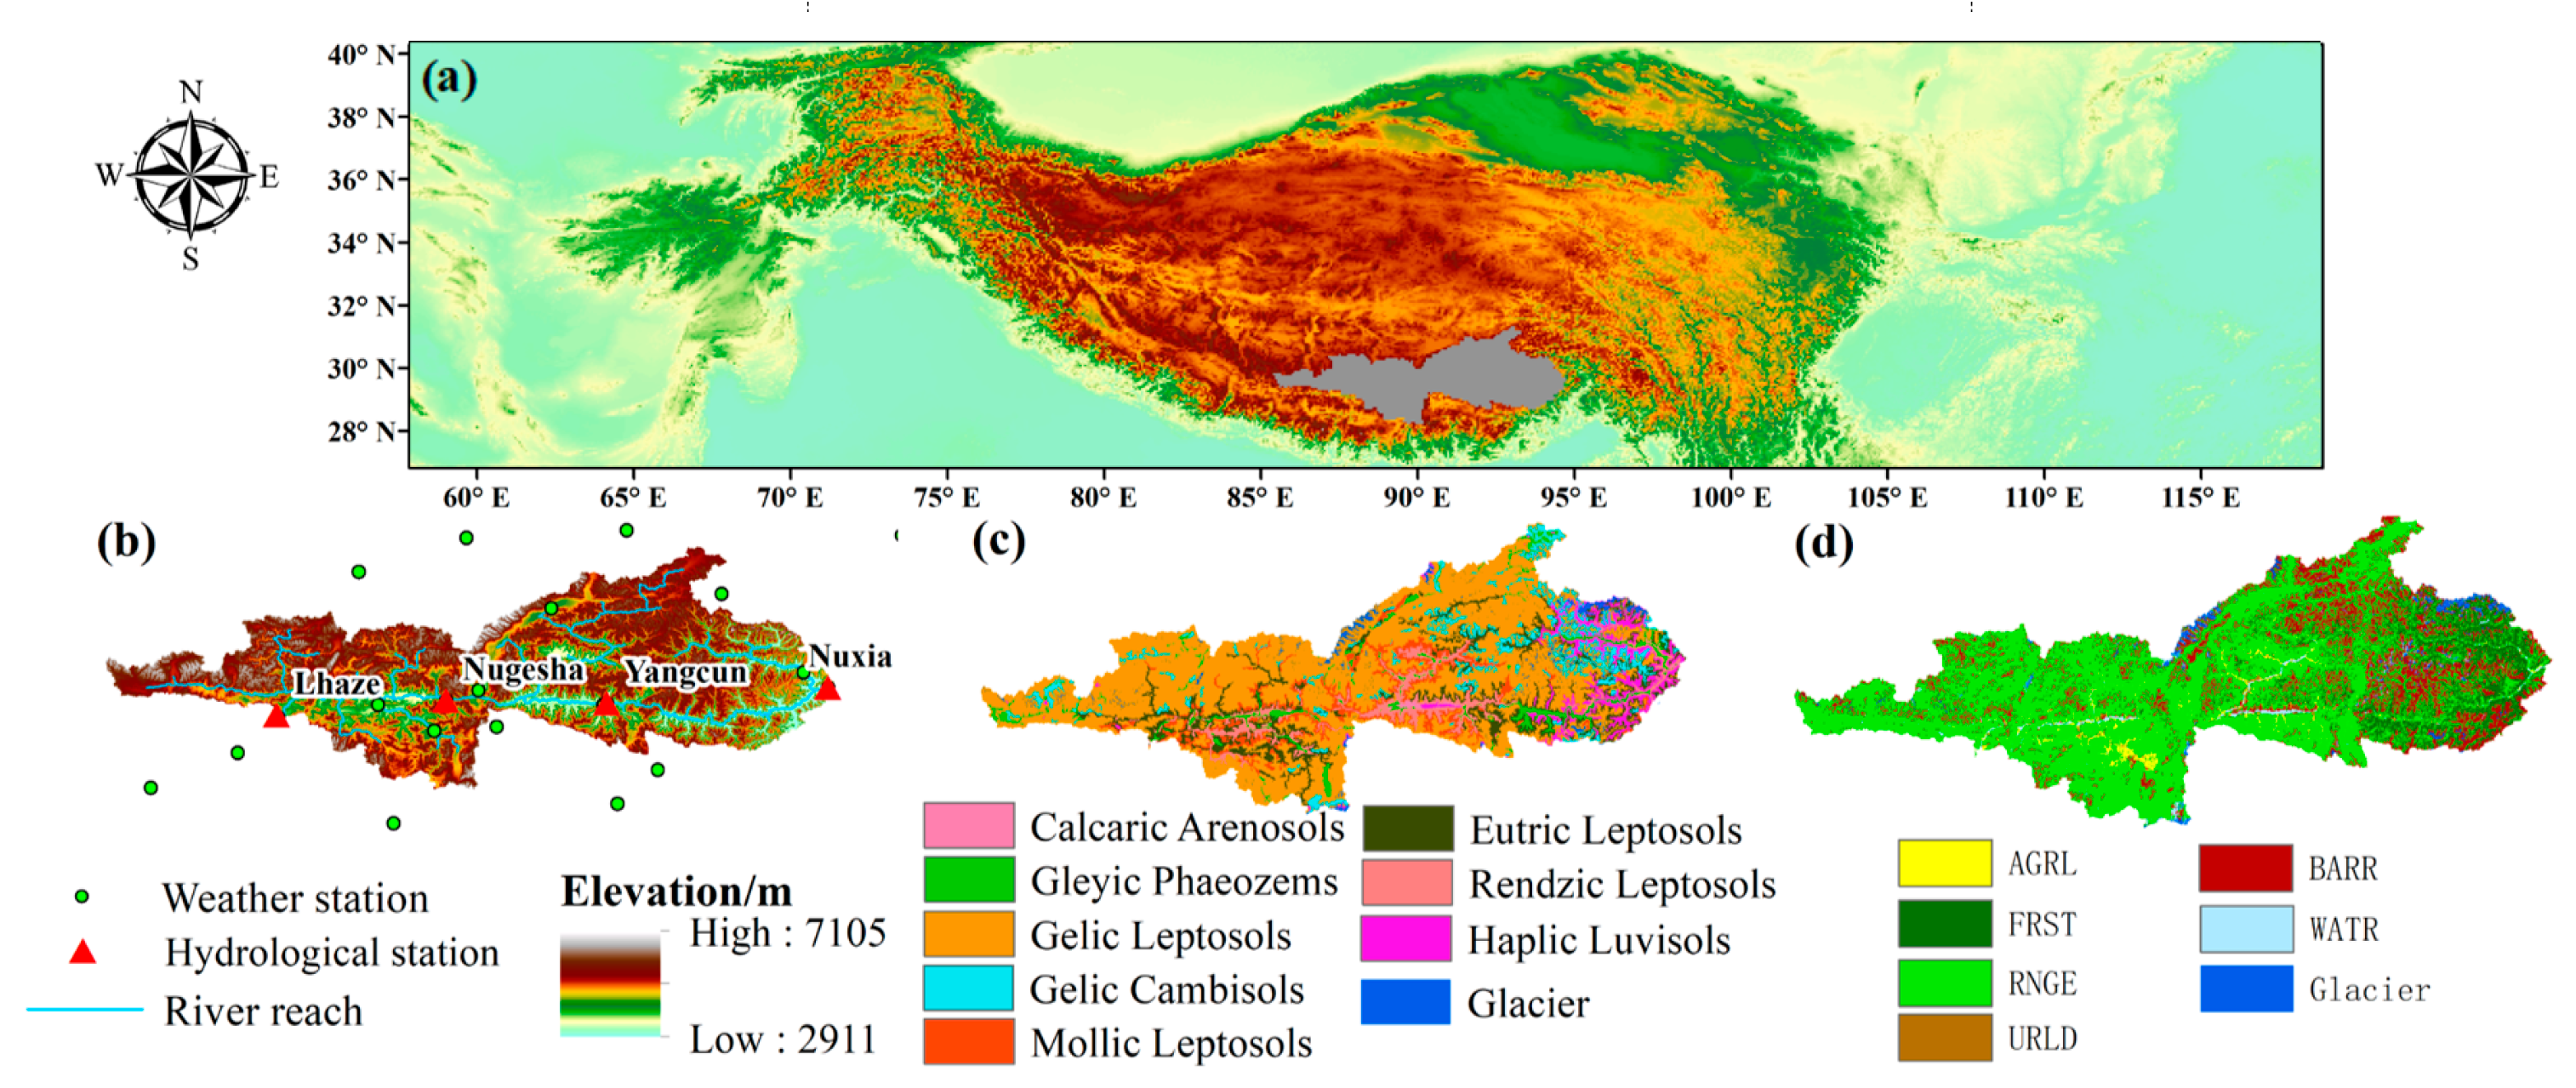
2.1. Study Area

The Yarlung Tsangpo River traverses the southern Tibetan Plateau from west to east. The midstream section (27°26′–31°08′ N to 85°12′–94°39′ E) of the Yarlung Tsangpo River basin has a basin area of 143,412 km2 and a mean elevation of 4790 m (Figure 1). There are four gauging stations along the main stream within the study area: the Lhaze, Nugesha, Yangcun, and Nuxia gauging stations, the last of which is the outlet of the midstream section [34].

2.2. Description of SWAT

SWAT is a physically based model that uses daily time steps for simulations. The model can divide a basin into subbasins and then further delineate subbasins into hydrologic response units (HRUs) based on soil type, land use, and slope class. The hydrological processes covered by the model include precipitation, surface runoff, evapotranspiration, soil water, and groundwater [35,36,37].
SWAT calculates surface runoff using two different techniques, namely the SCS curve number procedure and the Green–Ampt method [38,39]. The degree–day method is used to simulate snowmelt processes in SWAT [40]. The SWAT model can define elevation zones, and snow melting and confluence processes in different elevation zones can be simulated separately. SWAT can set elevation zones in each subbasin, obtain the elevation zones in which the glaciers are located as well as the areas of the glaciers in the elevation zones [41], and then set thick snow in the elevation zones corresponding to the elevations at which the glaciers are located [33]. The same degree–day method that is used for snowmelt processes is used for the simulation of glacial runoff.

2.3. Model Setup and Calibration

In this study, a Digital Elevation Model (DEM) and land-use, soil, and weather data were used as the input data (Table 1). First, DEM data (90 m resolution) were used to delineate the midstream section of the Yarlung Tsangpo River basin into 65 subbasins. Second, land-use data was used to classify land use into five types, and the Harmonized World Soil Database (HWSD) was used to obtain soil property data (Figure 1). Unique combinations of land cover, soil type, and slope were designated as separate HRUs, and a total of 2532 HRUs were thus obtained.
Table 2 provides the glacier characteristics of the study area. Glaciers areas occupy 1.8% of the study area. Glacier coverage in the Lhaze to Nugesha, Nugesha to Yangcun, and Yangcun to Nuxia subbasins is 0.84%, 1.6%, and 3.5%, respectively. The DEM map and the second glacial catalog data set of China (v1.0) (http://www.ncdc.ac.cn, accessed on 6 February 2023) were used to obtain the glacier distribution in the study area, the elevations at which the glaciers were located, and the area of the glaciers in each elevation zone [41]; then, thick snow was set in the elevation zones corresponding to the elevation at which the glacier was located [33].
Daily precipitation, air-temperature, wind-speed, and relative-humidity data for 27 weather stations were obtained from the National Meteorological Information Center. Observed runoff data from the Lhaze station were used as the input for the study area. The percentage snow cover area (SCA) in the research area was calculated using snow cover products from the Moderate Resolution Imaging Spectroradiometer (MODIS). The global monthly MOD10CM data from MODIS from 2001 to 2011 were used to evaluate the modeled snow cover fraction. Runoff data from the Nugesha, Yangcun, and Nuxia gauging stations for the years 1980–2017 (three years for warm-up) were used to calibrate and validate the SWAT model. Percent bias (PBIAS), Nash–Sutcliffe efficiency (NSE), and coefficient of determination (R2) were used to evaluate the effectiveness of the model [42,43], as recommended by Moriasi et al. [44].

2.4. Future Climate Scenarios

The Coupled Model Intercomparison Project (CMIP) is a global climate modeling framework. The sixth phase (CMIP6) of this project consists of models that employ advanced parameterization schemes, flux processing schemes, and coupler technology to provide a reliable scientific basis for predicting future climate change worldwide in the context of global climate change. Information on the 22 global climate models (GCMs) used in this study is presented in Table 3. Future climate was simulated under the SSP1-2.6, SSP2-4.5, SSP3-7.0, and SSP5-8.5 scenarios. The spatial resolution of climate-change information offered by GCMs was relatively coarse, which would result in large deviations when conducting climate research on a regional scale. The GCMs should be downscaled to prevent large deviations. Due to its good transferability and efficient computation, the Delta change method is frequently employed [45,46,47,48]. The fundamental principle of the Delta change method requires modifying the observed daily temperature by adding the difference between monthly temperature projected from the GCMs in CMIP6 during the baseline and future periods. Similarly, precipitation for the future period can be obtained by multiplying the observed daily precipitation and the ratio of monthly precipitation predicted by GCMs in CMIP6 in the future period to that in the baseline period [49,50]. The specific equations of the Delta change method are shown in Equations (1) and (2) [51]. In this study, 1983–2017 was chosen as the baseline period, while 2020–2100 was chosen as the future period.
T f , d a i l y = T o , d a i l y + ( T f , m o n t h l y ¯ T p , m o n t h l y ¯ )
P f , d a i l y = P o , d a i l y P f , m o n t h l y P p , m o n t h l y
where T o , d a i l y is observed daily temperature, P f , d a i l y is observed daily precipitation,   T f , m o n t h l y ¯ is the future-period average monthly temperature of GCMs, P f , m o n t h l y is the future-period average monthly precipitation of GCMs, T p , m o n t h l y ¯ is the historical monthly temperature of GCMs historical, and P f , m o n t h l y is the historical monthly temperature of GCMs historical.

3. Results

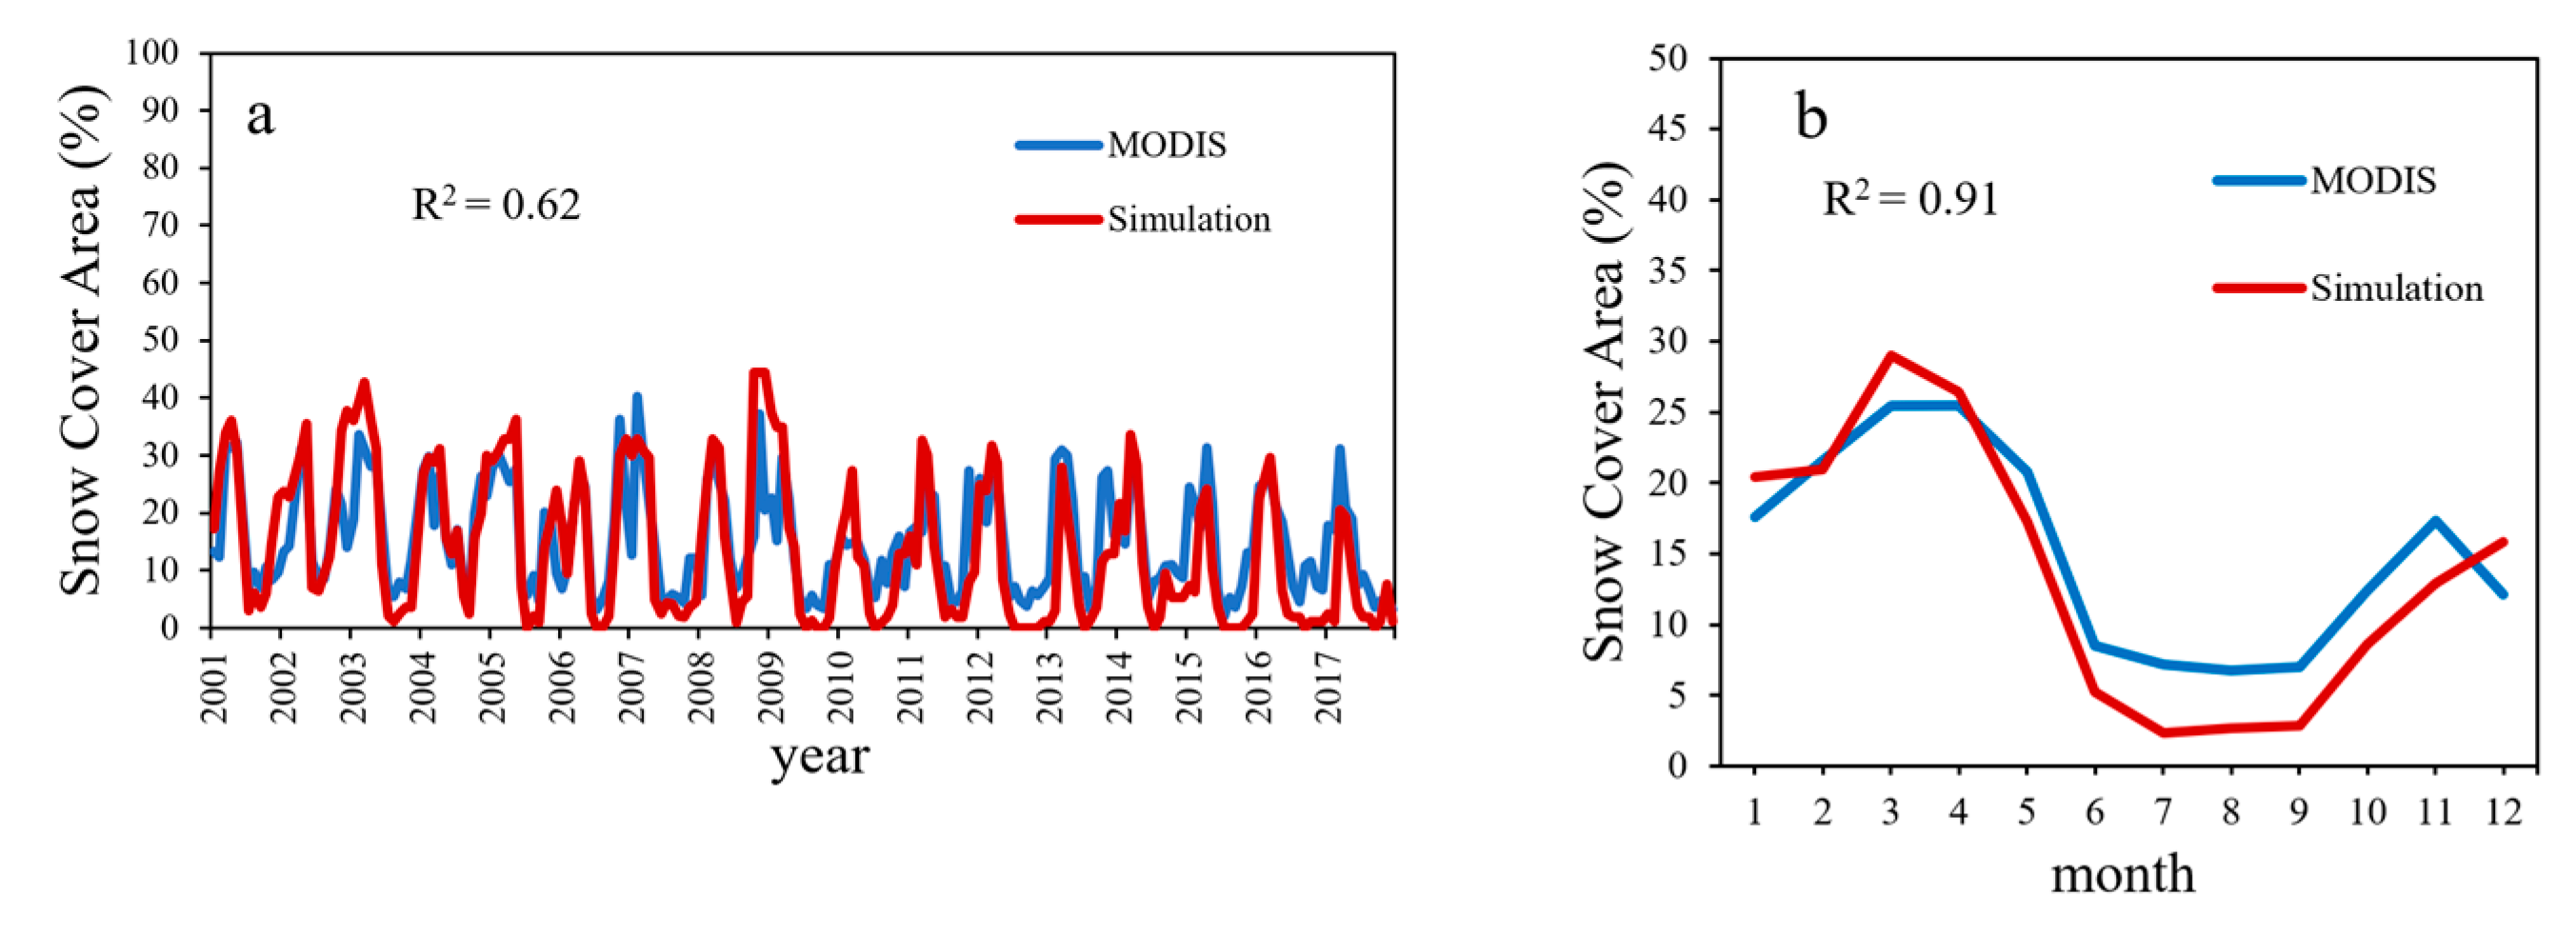
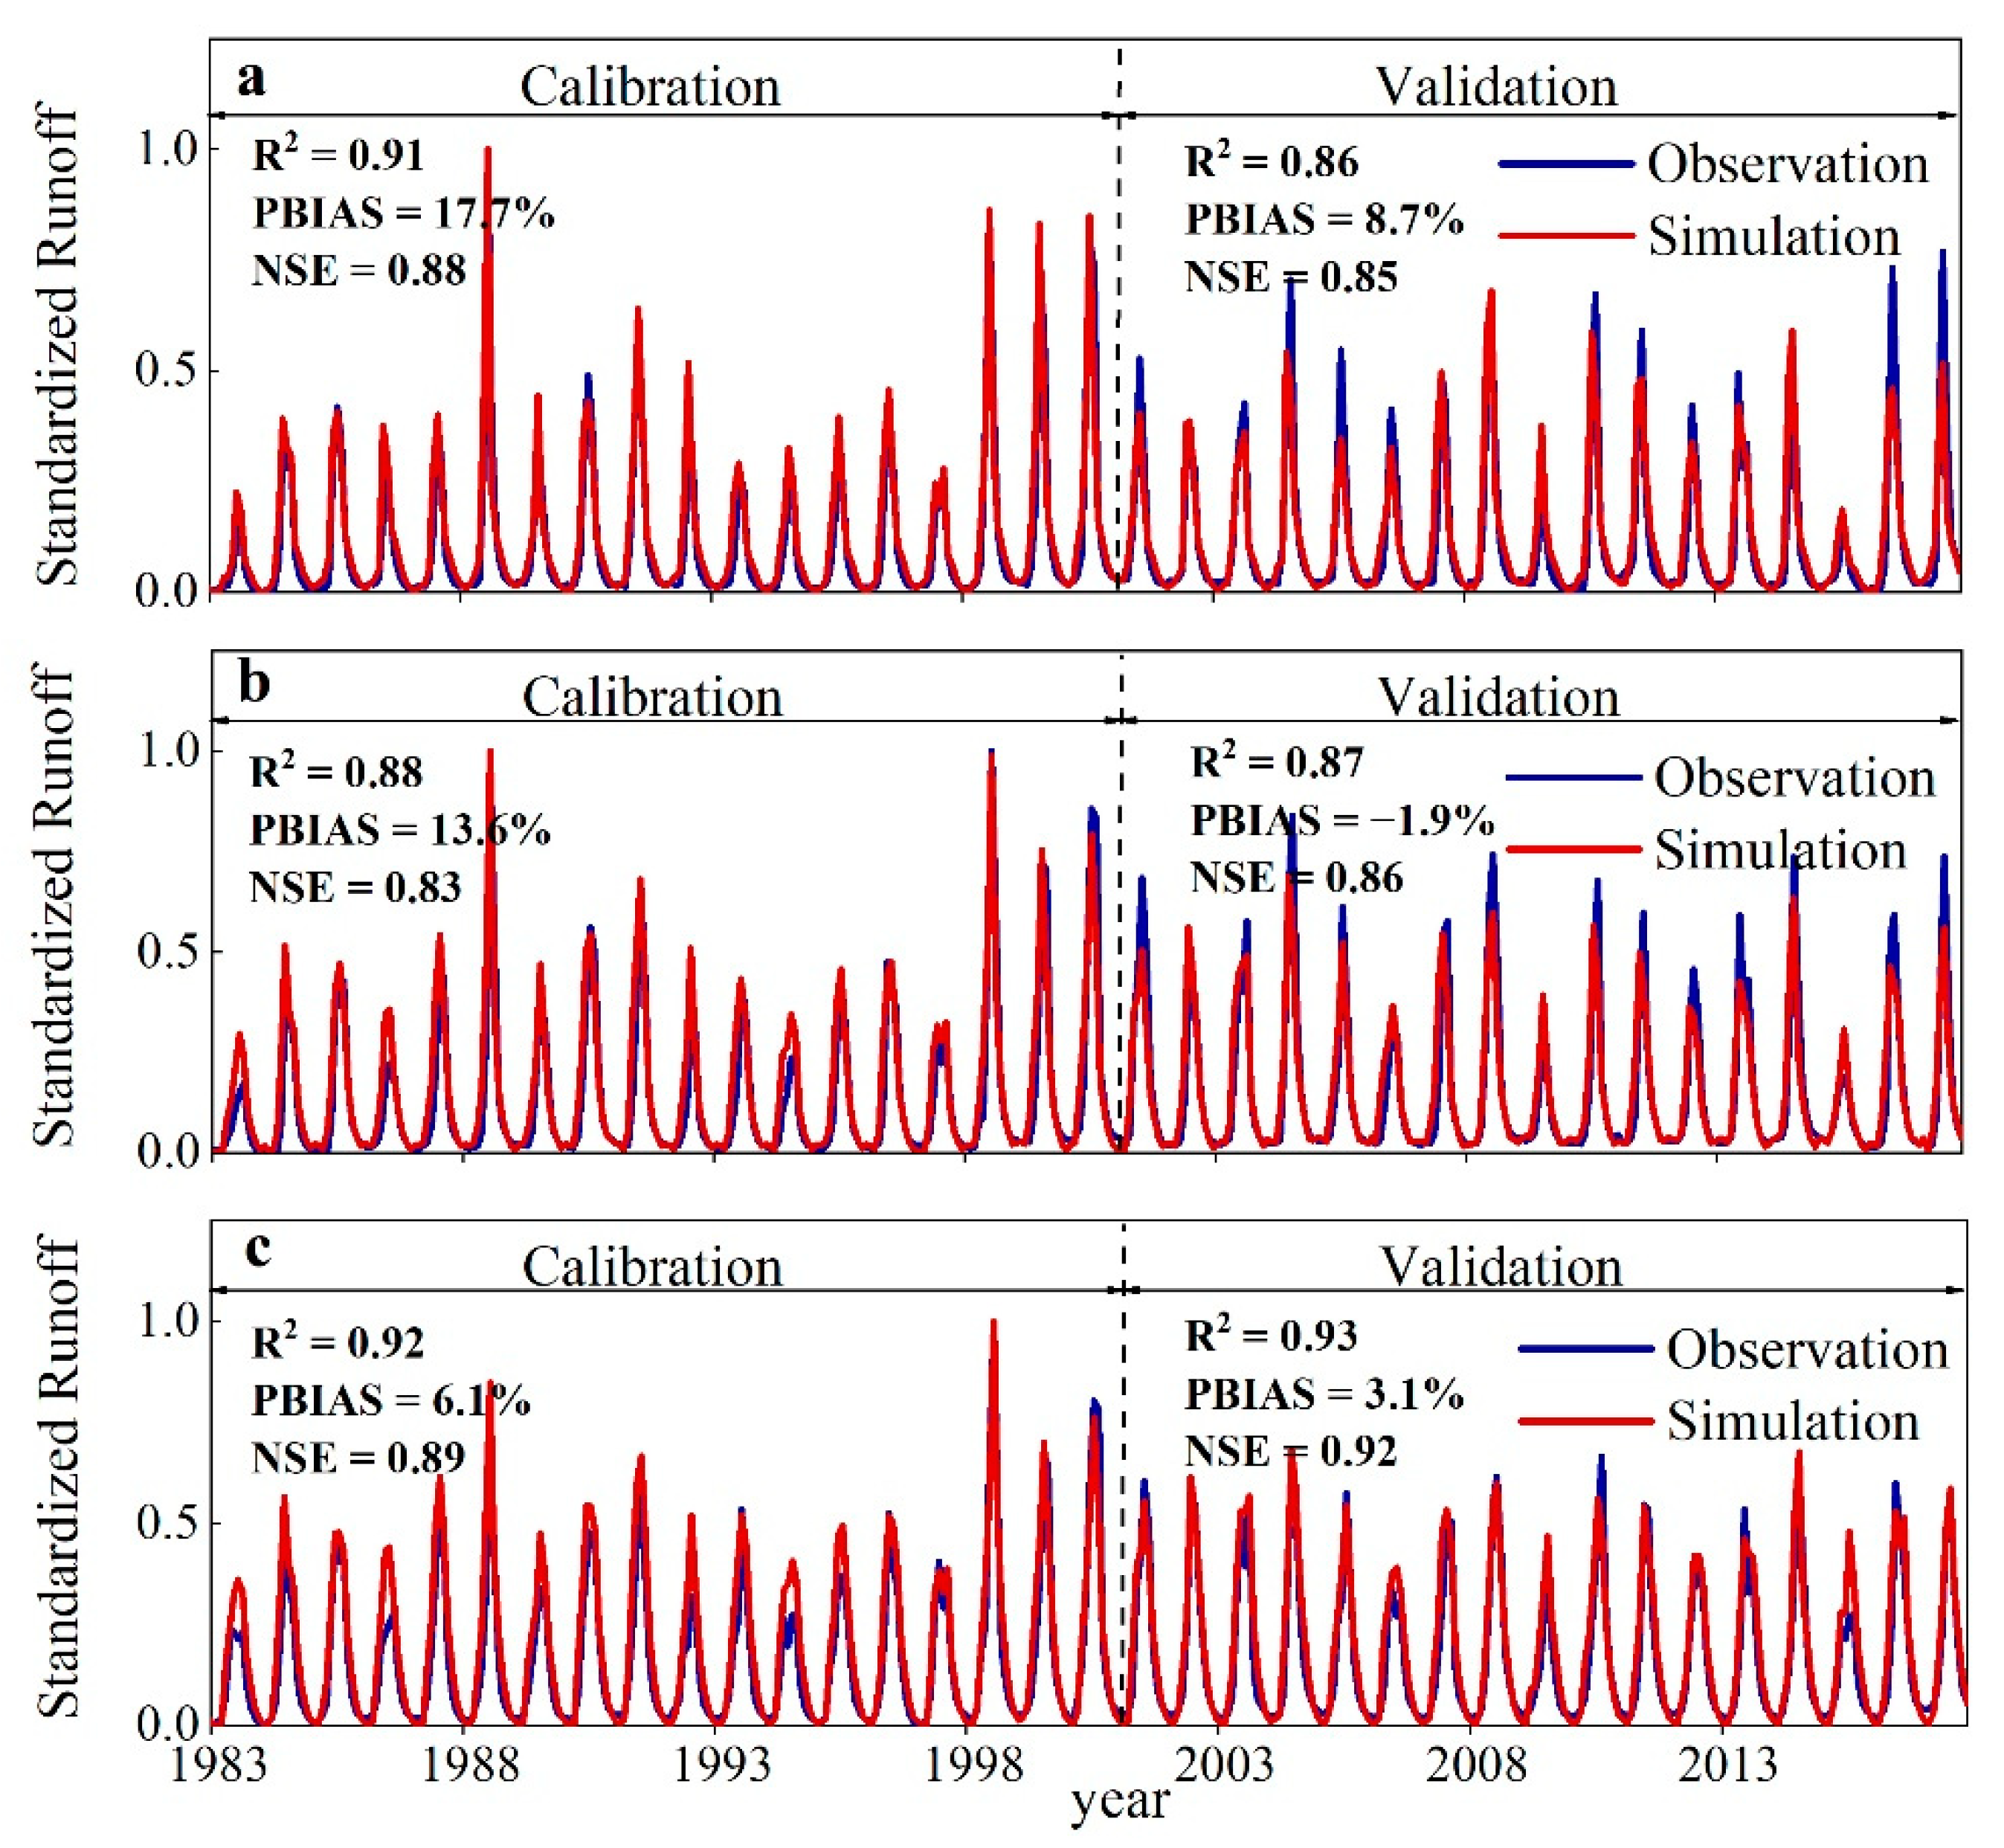
3.1. Model Performance

We chose the years 1980–1982 as the warm-up period, 1983–2000 for model calibration, and 2001–2017 for model validation. The simulated monthly data were compared to the observed values at the outlets of the Nugesha, Yangcun, and Nuxia hydrological stations after sensitivity analysis. After calibration, the parameters influencing runoff were determined and are listed in Table 4. The precipitation lapse rate (PLAPS) and temperature lapse rate (TLAPS) were calculated using the precipitation and temperature data of the meteorological stations in the study area. Snowfall temperature (SFTMP) in the study area was set to 0 °C, following Wang [52]. The main parameters in the SWAT model that influence glacier melt and snowmelt are the degree–day factors of glaciers and snow. The maximum (SMFMX) and minimum degree–day factors (SMFMN) during the year for the elevation zone corresponding to the location of glaciers in the Lhaze to Nugesha subbasins were set to 10 mm°C−1 day−1 based on the Yala Glacier [53,54]. SMFMX and SMFMN values during the year for the elevation zones corresponding to the location of glaciers in the Nugesha to Yangcun subbasins were set to 9.2 mm°C−1 day−1 based on the Zhadang Glacier [55]. SMFMX and SMFMN values during the year for the elevation zones corresponding to the location of glaciers in the Yangcun to Nuxia subbasins were set to 6.2 mm°C−1 day−1 based on the Yanlongba Glacier [56]. SMFMX and SMFMN values during the year for snow for the whole basin were set to 5.5 mm°C−1 day−1 [54].
Figure 2 shows a comparison between the snow cover area (SCA) obtained using model simulation and that obtained from remote sensing data at monthly and multi-year monthly average timescales. The model simulation and remote sensing data are in good agreement. R2 values for monthly and multi-year monthly average snow cover fraction are 0.62 and 0.91, respectively. Previous simulations of monthly snow cover fraction in alpine regions yielded R2 values of 0.53–0.78 [41,57]. The simulated and remote sensing data for snow accumulation area during the year followed the same trend as that for SCA. From October to March, due to the low temperature and low precipitation, the SCA was in the range of 15–30%. From April to May, as the temperature rose continuously, the snow melted, causing the SCA to decrease. In July and August, when temperatures were higher, the SCA decreased even further. Although the simulated SCA was in good agreement with MODIS data, some errors were noted, which was also true in previous studies [5,58]. These errors originated for two main reasons. First, MODIS cannot distinguish between glaciers and snow cover, which can cause errors in SCA simulations. MODIS also misidentifies clouds as snow, which makes the SCA higher than the actual SCA during the summer (June–September), as noted by Zhang et al., [59]. Second, the data used to drive the meteorological models, especially precipitation data, possess large uncertainties in the alpine region, which produces uncertainties in model simulations of snow accumulation and the melting process. In turn, these uncertainties produce errors in the simulated SCA, causing differences between the simulated and actual SCA.
Figure 3 shows a comparison of the monthly average runoff at three stations in the study area. The model performance was considered satisfactory if NSE > 0.50, R2 > 0.50, and PBIAS was within ±25% for runoff [44]. The NSE, R2, and PBIAS values for runoff at the Nugesha station for the calibration period were 0.88, 0.91, and 17.7%, respectively, and those for the validation period were 0.85, 0.86, and 8.7%, respectively. The NSE, R2, and PBIAS values for runoff at the Yangcun station for the calibration period were 0.83, 0.88, and 13.6%, respectively, and those for the validation period were 0.86, 0.87, and −1.9%, respectively. The NSE, R2, and PBIAS values for runoff at the Nuxia station for the calibration period were 0.89, 0.92, and 6.1%, respectively, and those for the validation period were 0.92, 0.93, and 3.1%, respectively. These values were within acceptable thresholds.

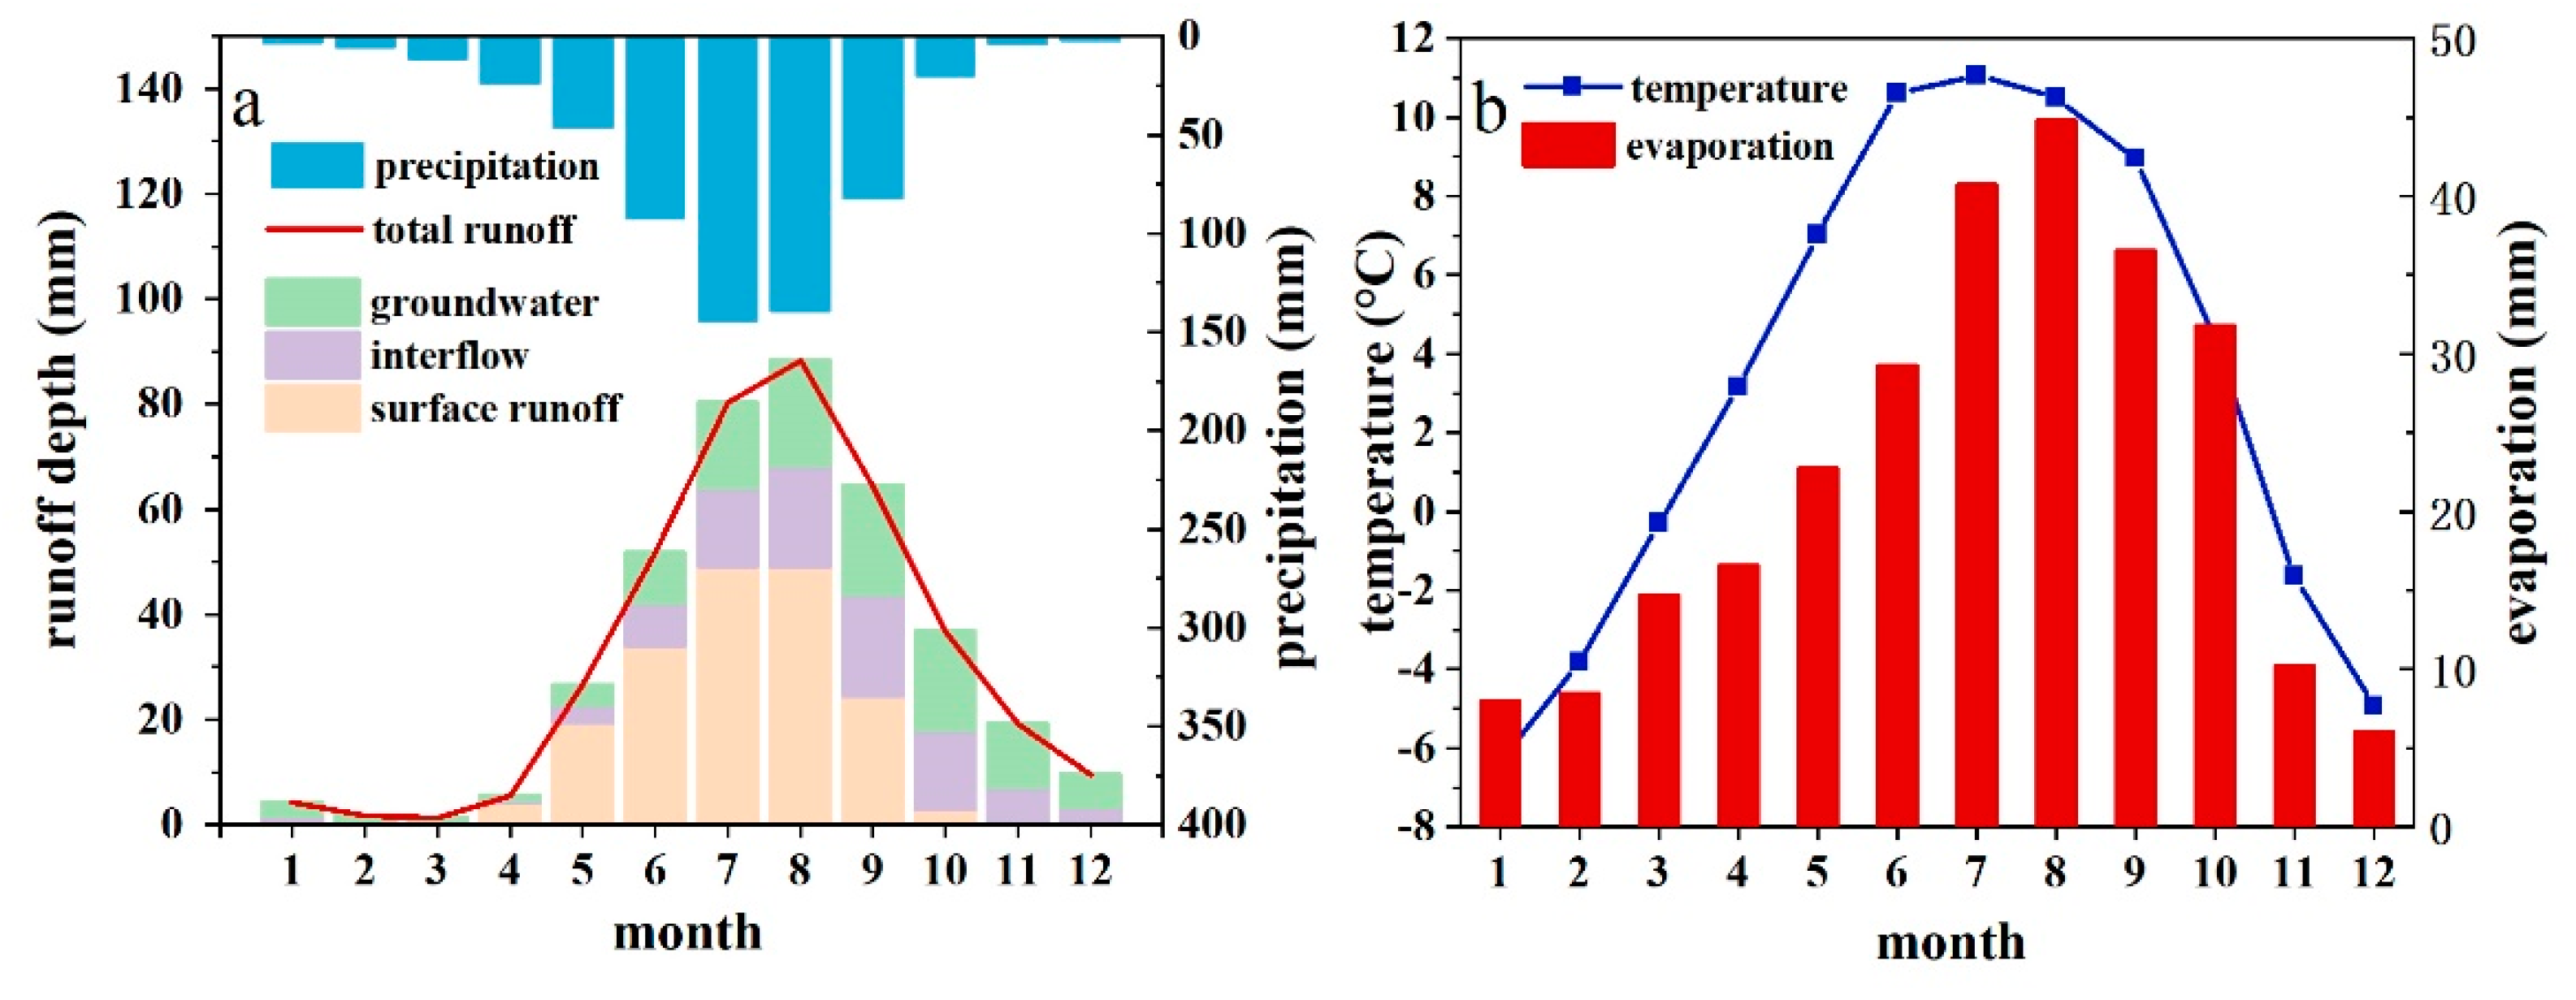
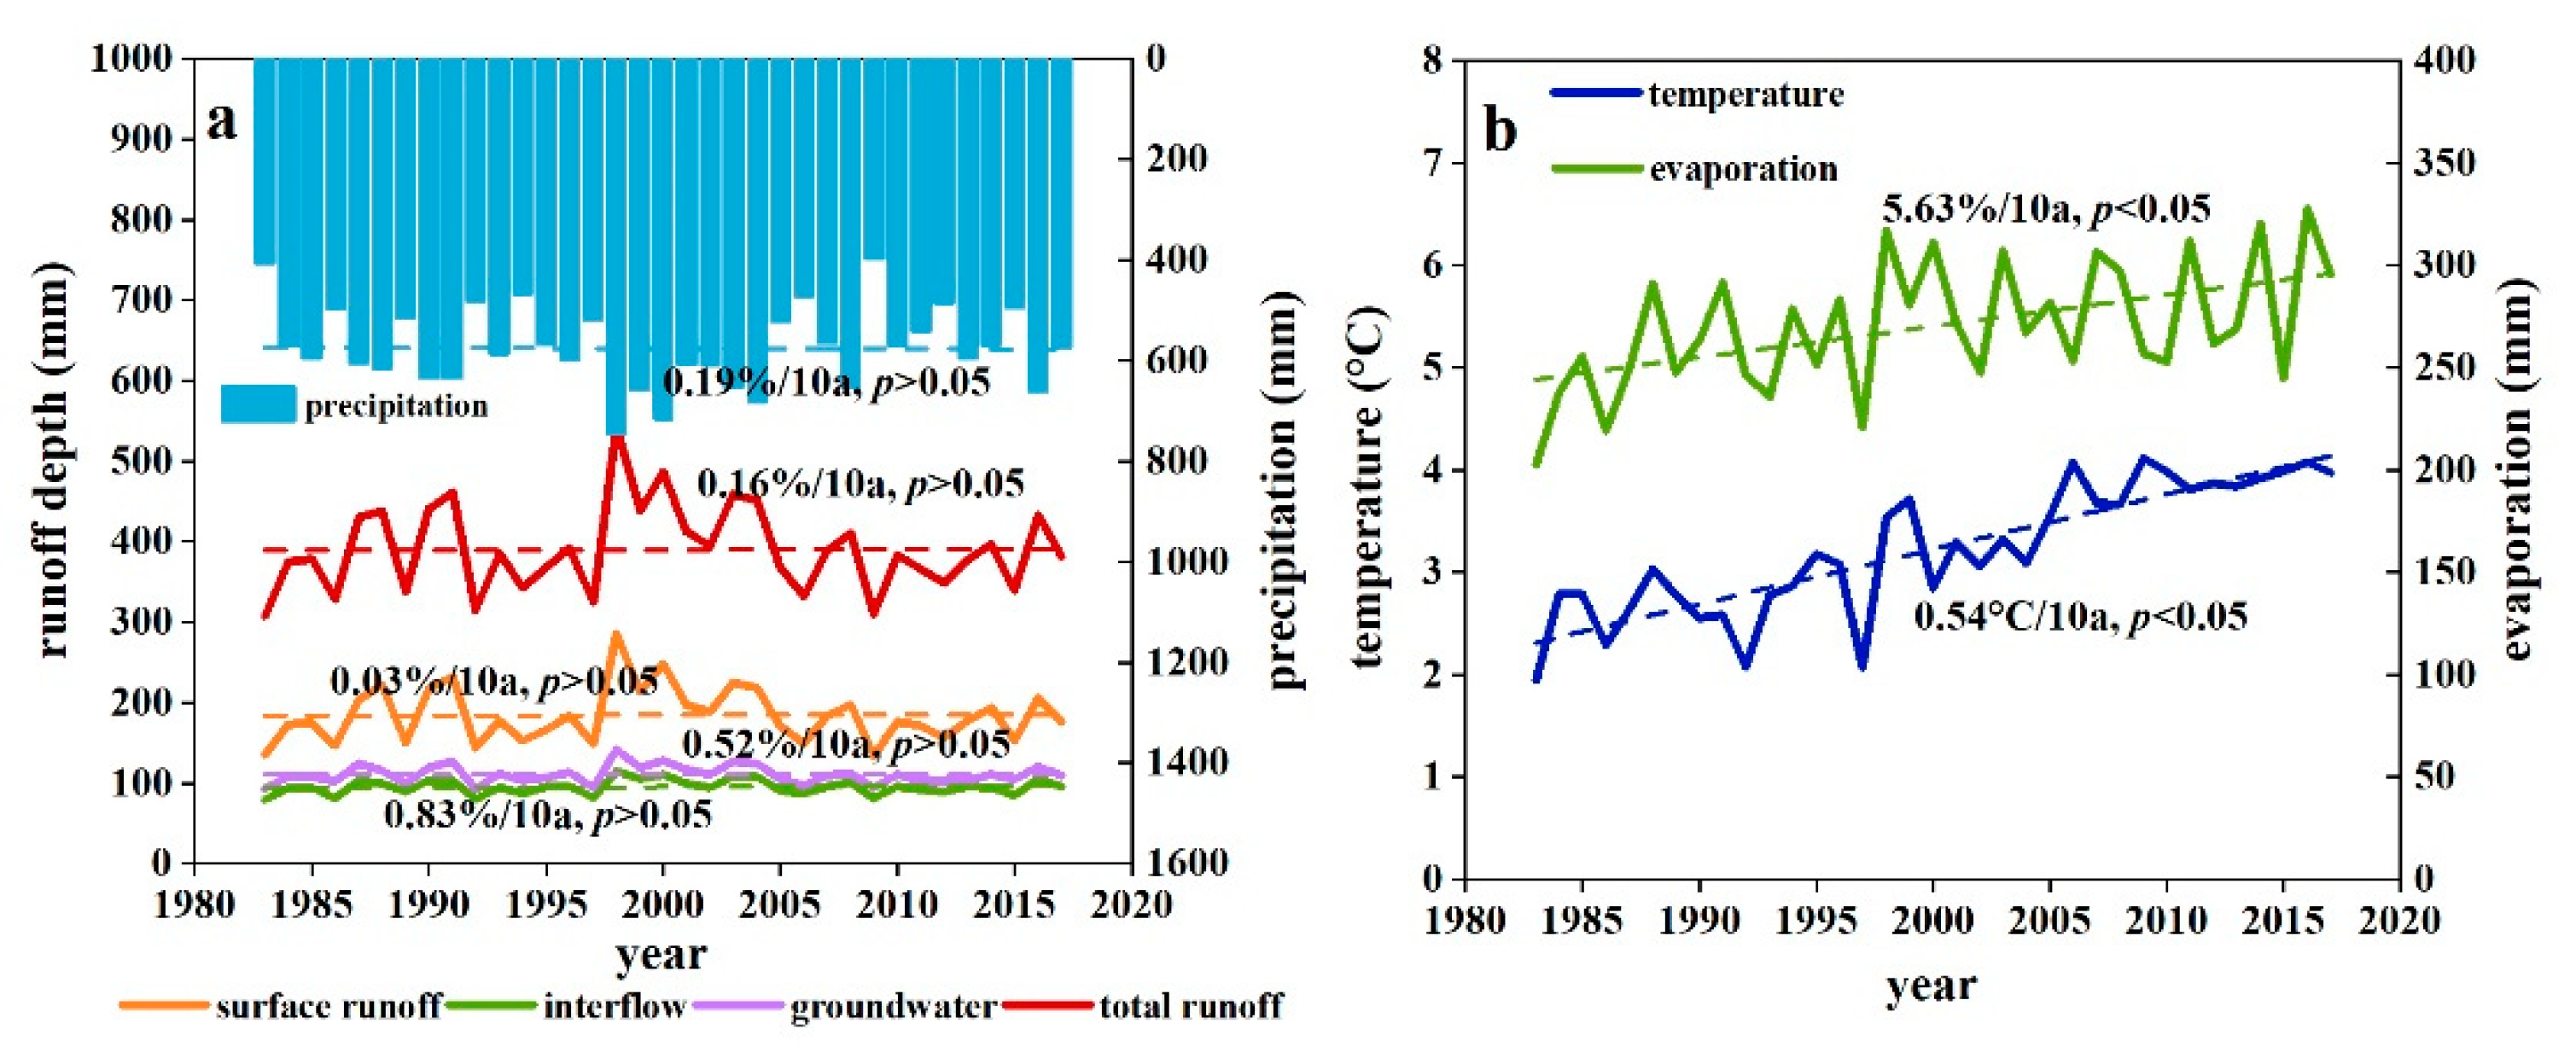
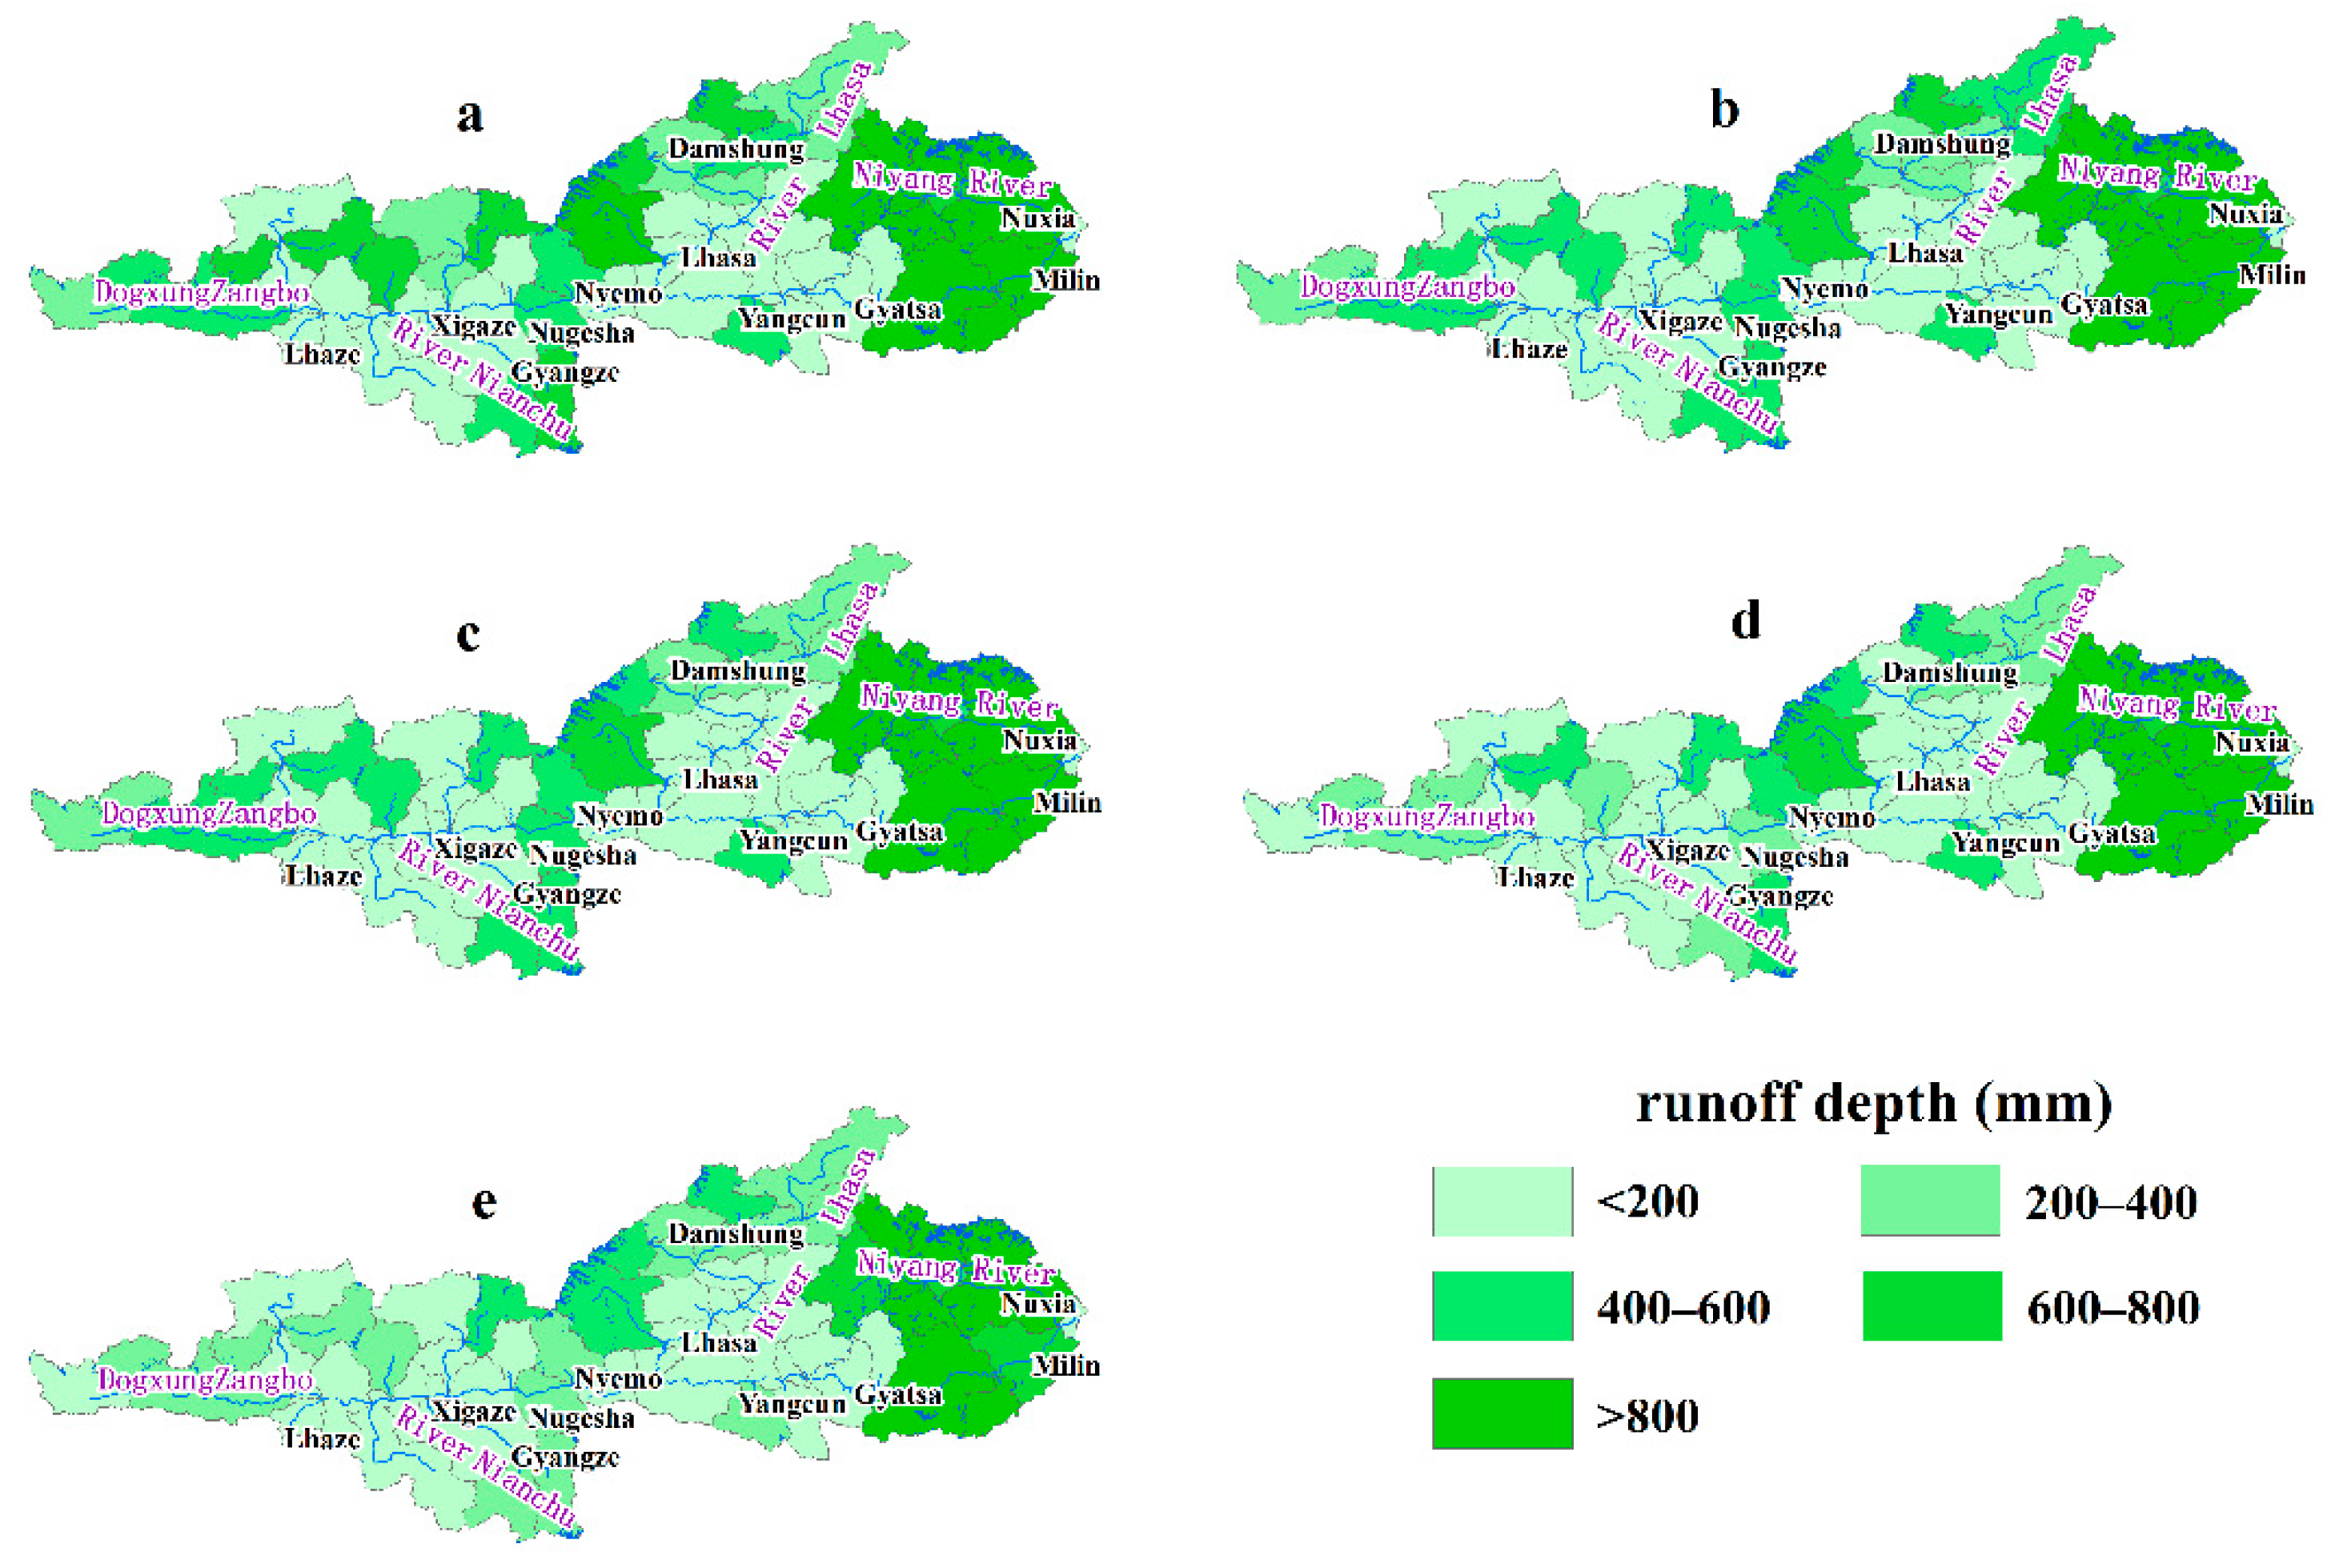
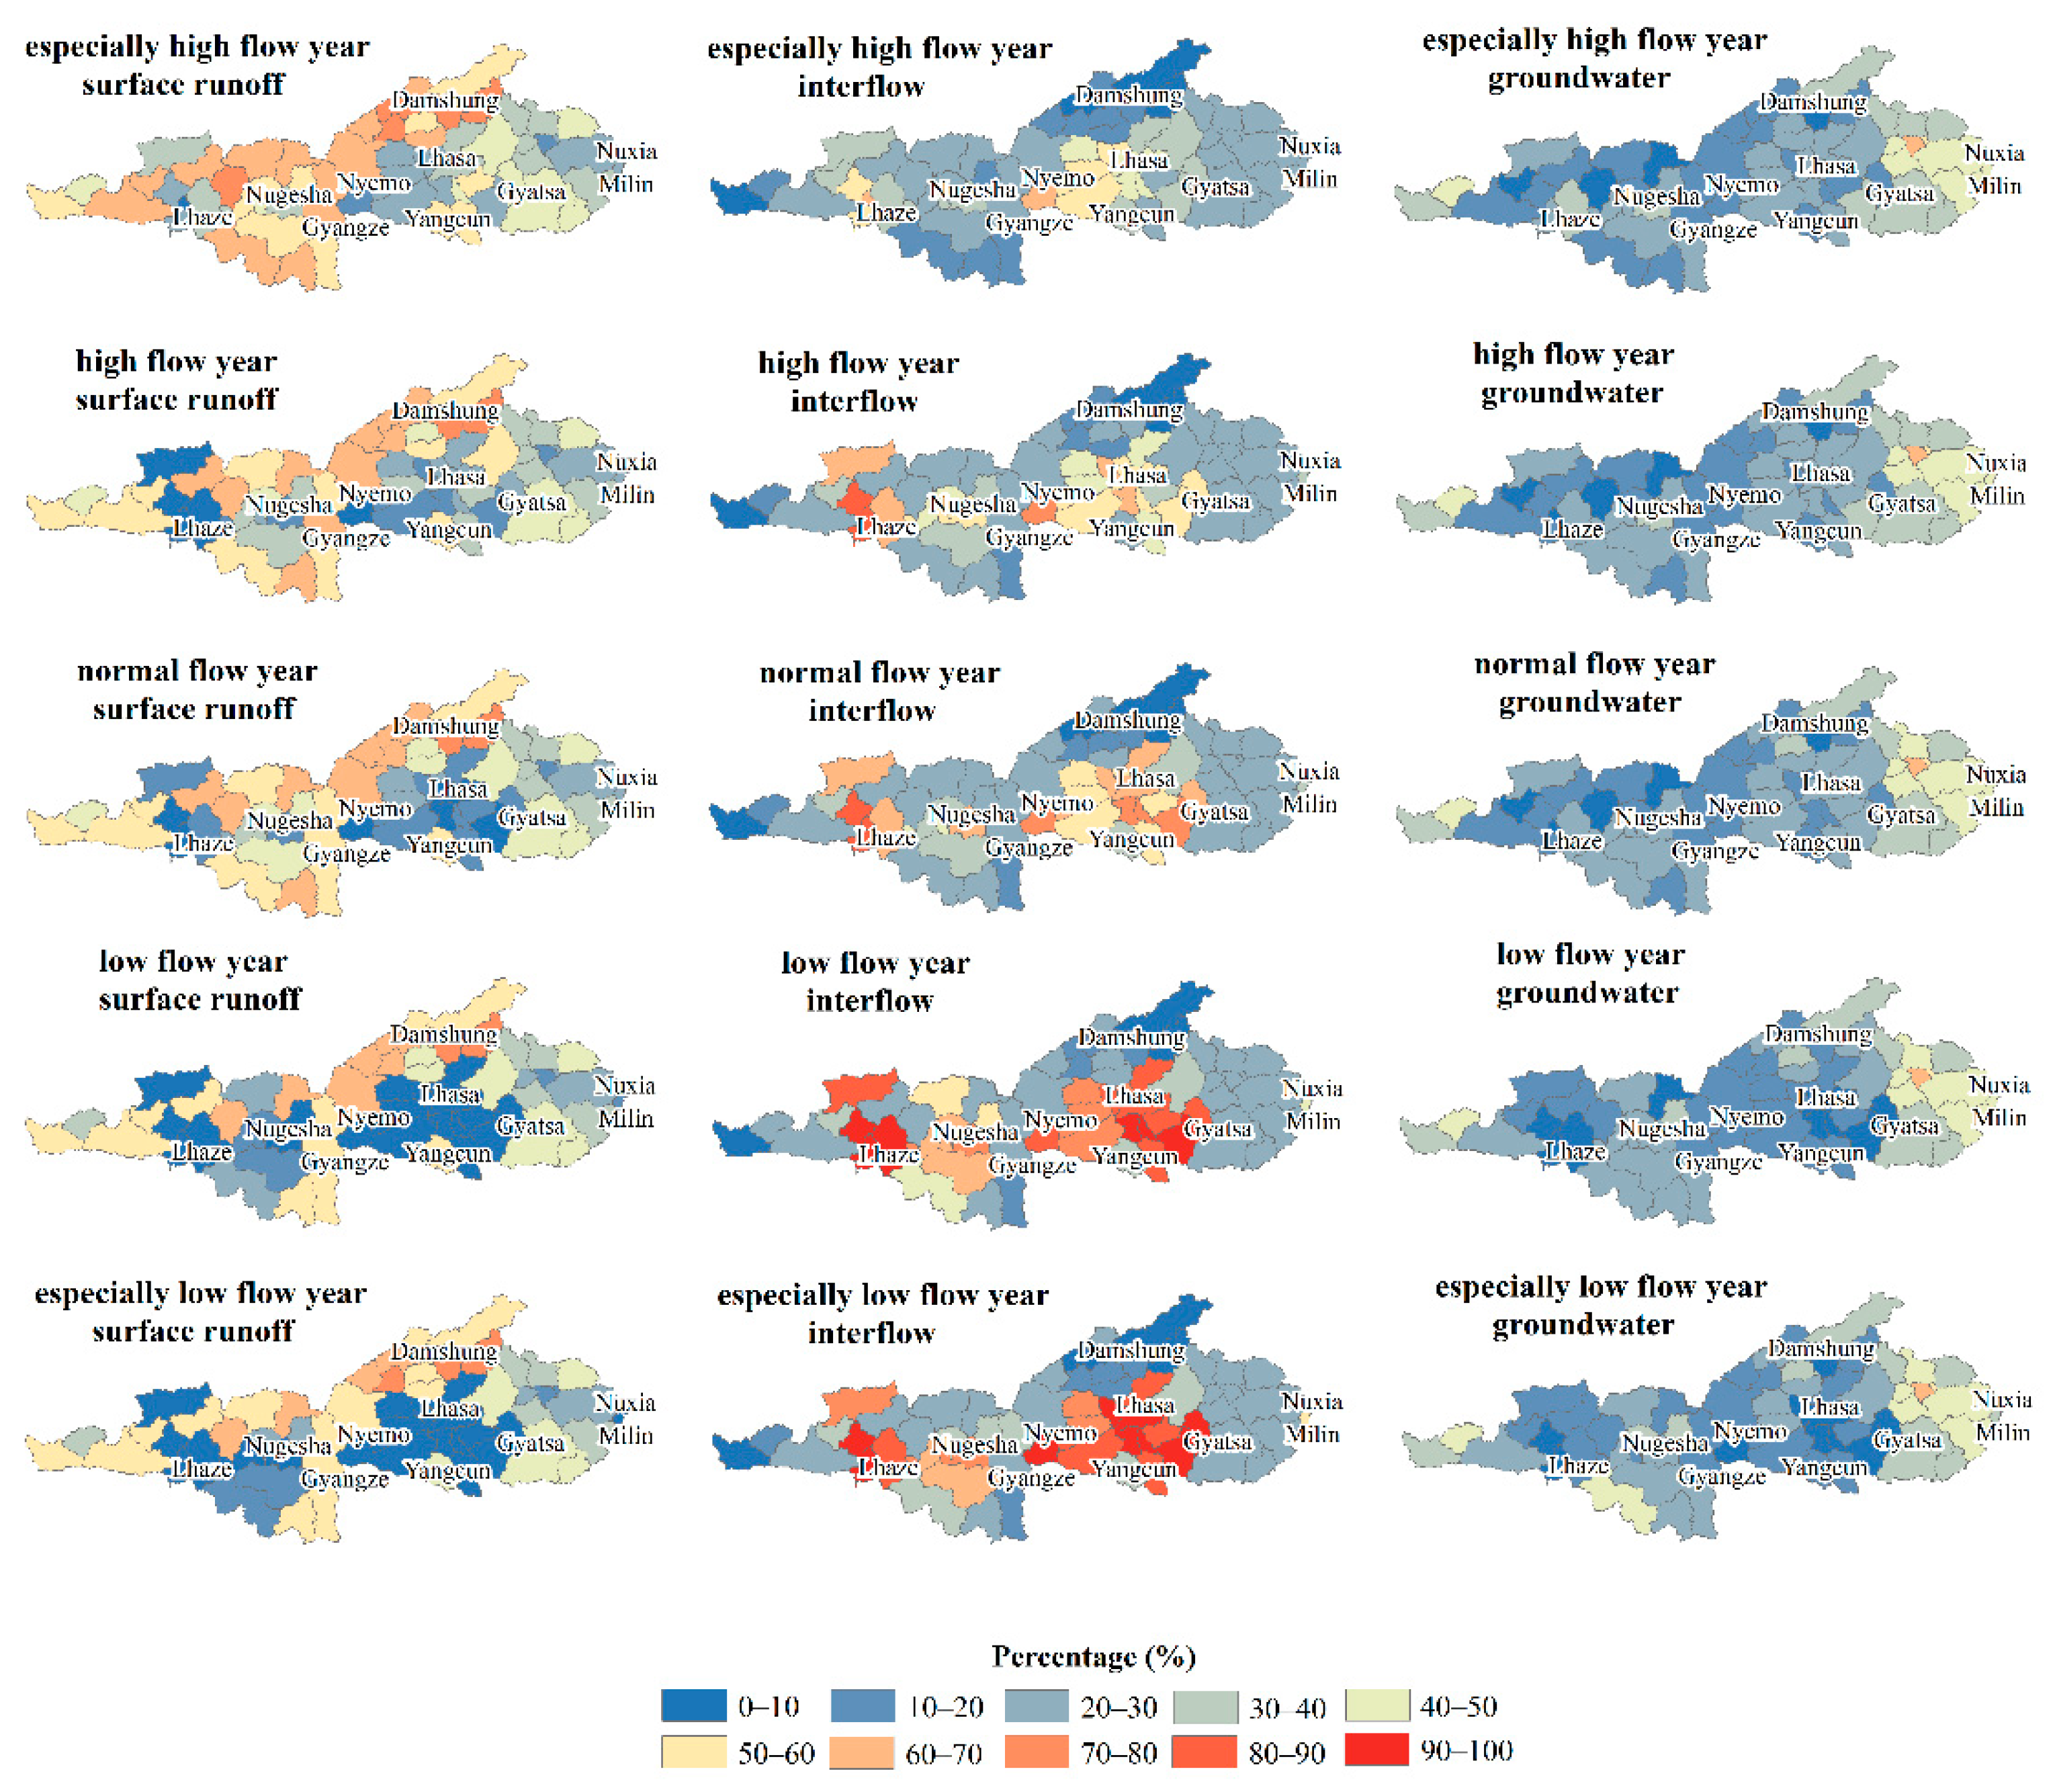
3.2. Variation of Total Runoff and Its Components

The average annual precipitation, total runoff depth, surface runoff depth, interflow depth, groundwater depth, temperature, and evaporation in the study area simulated using SWAT during 1983–2017 were 575.1 mm, 388.8 mm, 183.5 mm, 96.9 mm, 110.4 mm, 3.2 °C, and 269.1 mm, respectively. Surface runoff, interflow, and groundwater accounted for 47.2%, 24.4%, and 28.4%, respectively, of total runoff. The proportion of groundwater in the runoff of the Yarlung Tsangpo River has been assessed numerous times in previous research, and studies based on isotope and model simulation methods have shown that the proportion of groundwater flow is in the range of 27–40% [52,60,61,62]. In the present study, the proportion of groundwater in the Yarlung Tsangpo River was found to be 28.4%, which was similar to the values obtained in the aforementioned studies. Different studies have yielded considerably varying results in terms of the contribution of surface runoff to total runoff (15.6–40%) [52,63]. Liu [60] found that the recharge of runoff occurred in the upper part of the midstream section of the Yarlung Tsangpo River basin and that recharge occurred in the form of rainfall, glacier melt, and snowmelt. Liu [60] found that the river in the storm area below the Grand Canyon was mainly recharged by rainfall, which tended to form hyperosmotic flows. Therefore, surface runoff should have accounted for a considerable proportion of total runoff. In comparison with the above research results, Wang [52] found that surface runoff accounted for 15.6% of total runoff, which was an underestimated value; furthermore, glaciers were not considered, which would have affected the accuracy of the runoff composition. Although the fraction of surface runoff determined in this study was slightly higher, at 47.6%, it was still comparable to that obtained by Zhao [63], who found that surface runoff accounted for approximately 40% of the total runoff.
The temporal variations in the monthly precipitation, monthly total runoff, and monthly runoff components are presented in Figure 4a. From January to March, precipitation was low (only 3.5% of the annual precipitation); total runoff depth, surface runoff depth, interflow depth, and groundwater depth were also low during this period, with groundwater and interflow being the main runoff components. As precipitation gradually increased from April, the total runoff depth and runoff components increased. Peak precipitation occurred in July, peak total runoff depth and surface runoff depth occurred in August, and peak interflow depth and groundwater depth occurred in September, because the convergence of the interflow and groundwater took a long time, resulting in the delay in the peak of the interflow and groundwater.
The temporal variations in the monthly temperature and monthly evaporation are presented in Figure 4b. Temperature gradually increased from January and peaked in July, after which it gradually decreased. The monthly variation in evaporation was influenced by temperature and precipitation. As the temperature rose, evaporation increased from January to July and peaked in August. Although temperature and precipitation were highest in July, evaporation peaked in August, likely because evaporation mainly originated from vegetation and soil moisture, and evaporation from soil was influenced by soil moisture; the peak of soil moisture lagged behind the peak of precipitation and temperature, thus causing evaporation to peak in August.
The temporal variations in the annual precipitation, annual total runoff, and annual runoff components are presented in Figure 5a. Annual precipitation showed an increasing trend at the rate of 0.19%/10 yr (p > 0.05), and annual total runoff depth showed an increasing trend at the rate of 0.16%/10 yr (p > 0.05). Annual surface runoff depth showed an increasing trend at the rate of 0.03%/10 yr, (p > 0.05), annual interflow depth showed an increasing trend at the rate of 0.83%/10 yr (p > 0.05), and annual groundwater depth showed an increasing trend at the rate of 0.52%/10 yr (p > 0.05). Figure 5b shows the temporal variations in annual temperature and evaporation. The annual temperature showed an increasing trend at the rate of 0.54 °C/10 yr (p < 0.05), and the annual evaporation showed an increasing trend at the rate of 5.63%/10 yr (p < 0.05). This also indicated that the total runoff as well as the runoff components in the study area showed an increasing annual trend that was mainly influenced by precipitation. Evaporation was significantly positively correlated with both temperature and precipitation (p < 0.05), because evaporation from the watershed was controlled by both atmospheric moisture supply to the land surface and energy supply conditions [64,65,66,67].
Part of the precipitation in this study area forms runoff and part of it evaporates. Understanding the spatial distribution of precipitation and evaporation in the study area during certain representative years can help further analyze the spatial distribution characteristics and patterns of runoff. Using the runoff frequency at the Nuxia hydrological station, the study period was classified into five types of representative years according to the national standard (GB/T50098-98), namely, especially high flow years (flow curve frequency p ≤ 12.5%), high flow years (flow curve frequency 12.5% < p ≤ 37.5%), normal flow years (flow curve frequency 37.5% < p ≤ 62.5%), low flow years (flow curve frequency 62.5% < p ≤ 87.5%), and especially low flow years (flow curve frequency p > 87.5%). Supplementary Table S1 shows the corresponding years for different categories of runoff. The spatial distribution characteristics of precipitation, evaporation, and runoff were the results of the multi-year average of the corresponding years for the five categories of runoff.
Supplementary Figure S1 shows the spatial distribution of precipitation in the five types of representative years, with the Yarlung Tsangpo River Grand Canyon as the largest water channel transporting gradually less water vapor from east to west in the especially high flow years, high flow years, normal flow years, low flow years, and especially low flow years, resulting in considerable differences in precipitation between representative years [5,60]. The differences in the spatial distribution of evaporation between different representative years were relatively small (Supplementary Figure S2), but overall, evaporation was higher in years with more precipitation during the especially high flow years. Areas with higher evaporation were concentrated in the regions near Xigaze and Lhasa, and evaporation in other areas was relatively small. This was because the temperature in the areas near Xigaze and Lhasa was relatively high [23], which led to greater evaporation.
Total runoff depth in the study area demonstrated a gradually increasing trend from west to east, which was similar to the spatial distribution of precipitation (Figure 6). However, there were some areas in which the spatial distribution of runoff depth differed from that of precipitation, mainly because of the influence of glacier distribution (Figure 6). The spatial distribution of glaciers in the western reaches of the Lhasa River, upper reaches of the Nianchu River, middle reaches of the Dogxung Zangbo River, and upper reaches of the Niyang River coincided with that of high runoff depths because of the influence of glacier distribution. Glaciers have considerable contribution to runoff [54], and total runoff depth in areas with glaciers within the study area was more than 200 mm, even in the low flow years and especially low flow years. In general, runoff depth is mainly related to precipitation and glacier distribution.
Figure 7 shows the spatial distribution of the runoff component. The spatial distribution of surface runoff, interflow, and groundwater in the area near Damxung was similar, and the proportion of surface runoff was basically around 50% in five representative years. The soil-type map of the study area (Figure 1) indicates that Gelic Leptosols, which have low permeability, are widespread in the area near Dangxiong, so precipitation does not readily infiltrate the soil to form interflow and groundwater; rather, it easily collects on the surface to form surface runoff. Even in especially low flow years when precipitation is relatively low, a large amount of precipitation still collects on the surface because of the low permeability.
The spatial distribution of surface runoff, interflow, and groundwater in the areas near Lhaze, Nyrmo, Nugesha, and Yangcun during wet years differed based on the amount of precipitation received. Precipitation gradually decreased from especially high flow years to especially low flow years, and most of the precipitation in these regions infiltrated the soil to form interflow, but the proportion of groundwater did not change much in different representative years. This was because Mollic Leptosols and Rendzic Leptosols were widely distributed in the areas near Lhaze, Nyrmo, Nugesha, and Yangcun, and these two types of soil had high infiltration coefficients, which facilitated the infiltration of precipitation and was conducive to the formation of interflow in these areas.
During years with high precipitation, when the precipitation rate was higher than the infiltration rate, infiltration excess runoff was generated, and when the rainfall rate was lower than the infiltration rate, saturation excess runoff was still dominant. Although the Mollic Leptosols and the Rendzic Leptosols in the areas near Lhaze, Nyrmo, Nugesha, and Yangcun were widely distributed, the proportions of Mollic Leptosols soil and Rendzic Leptosols soil in the areas near Lhaze, Nyrmo, and Yangcun were relatively higher than those in the area near Nugesha. The precipitation rate in the areas near Lhaze, Nyrmo, and Yangcun was lower than the infiltration rate during especially high flow years, and the flow generation mainly occurred via saturation excess runoff, so the proportion of interflow in these areas was about 50% even in especially high flow years. In contrast, the area near Nugesha had infiltration excess runoff when the precipitation rate was higher than the infiltration rate in the especially high flow years, which meant that the surface runoff accounted for about 50% of total runoff in the areas near Nugesha during especially high flow years.

3.3. Future Climate Analysis

Monthly precipitation in the study area from 2020 to 2100 under the SSP1-2.6, SSP2-4.5, SSP3-7.0, and SSP5-8.5 scenarios is shown in Supplementary Figure S3a; precipitation is mainly concentrated during May–September. Precipitation during May–September under these four scenarios accounted for 83.6%, 83.6%, 83.9%, and 84.0% of the annual precipitation, respectively. The monthly variation in precipitation during the future period (2020–2100) compared with the baseline period (1983–2017) under the four scenarios is shown in Supplementary Figure S3b; precipitation increases throughout the year, but the increase is greater during May–September.
Monthly temperature of the study area from 2020 to 2100 under different scenarios is shown in Supplementary Figure S4a. Temperature in the future period under the four scenarios gradually increased from January and peaked in July, followed by a gradual decrease. Monthly temperature was highest under the SSP5-8.5 scenario, and this was followed in decreasing order by SSP3-7.0, SSP2-4.5, and SSP1-2.6. Monthly variations in temperature during the future period (2020–2100) under the four scenarios relative to the baseline period (1983–2017) is shown in Supplementary Figure S4b; a trend of increase in temperature throughout the year is observed under all four scenarios.
The annual trends in precipitation and temperature in the study area under the four scenarios from 2020 to 2100 are shown in Supplementary Figure S5. The climate of the study area generally showed a warming and humidifying trend under the four scenarios, which was consistent with the conclusion that the climate in the Yarlung Tsangpo River basin would experience warming and humidifying [4,5,12,21]. The precipitation in the study area showed a significant increase (p < 0.05) under all four scenarios. The highest rate of increase in precipitation was observed under the SSP5-8.5 scenario (2.74%/10 yr), and this was followed in decreasing order by the SSP3-7.0 (1.81%/10 yr), SSP2-4.5 (0.93%/10 yr), and SSP1-2.6 (0.71%/10 yr) scenarios.
The temperature in the study area also showed an increasing trend under the four scenarios. The highest rate of increase in temperature was observed under the SSP5-8.5 scenario (0.709 °C/10 yr), and this was followed in decreasing order by SSP3-7.0 (0.541 °C/10 yr), SSP2-4.5 (0.293 °C/10 yr), and SSP1-2.6 (0.097 °C/10 yr) scenarios, respectively. Compared with the baseline period (1983–2017), precipitation during the future period (2020–2100) in the study area would increase by 7.39%, 9.84%, 14.43%, and 22.66% for the four scenarios, respectively, whereas temperature would increase by 0.99 °C, 2.40 °C, 4.44 °C, and 5.62 °C, respectively. These findings are in good agreement with those of previous studies on future climate change in the Tibetan Plateau or the Yarlung Tsangpo River basin [5,68,69].

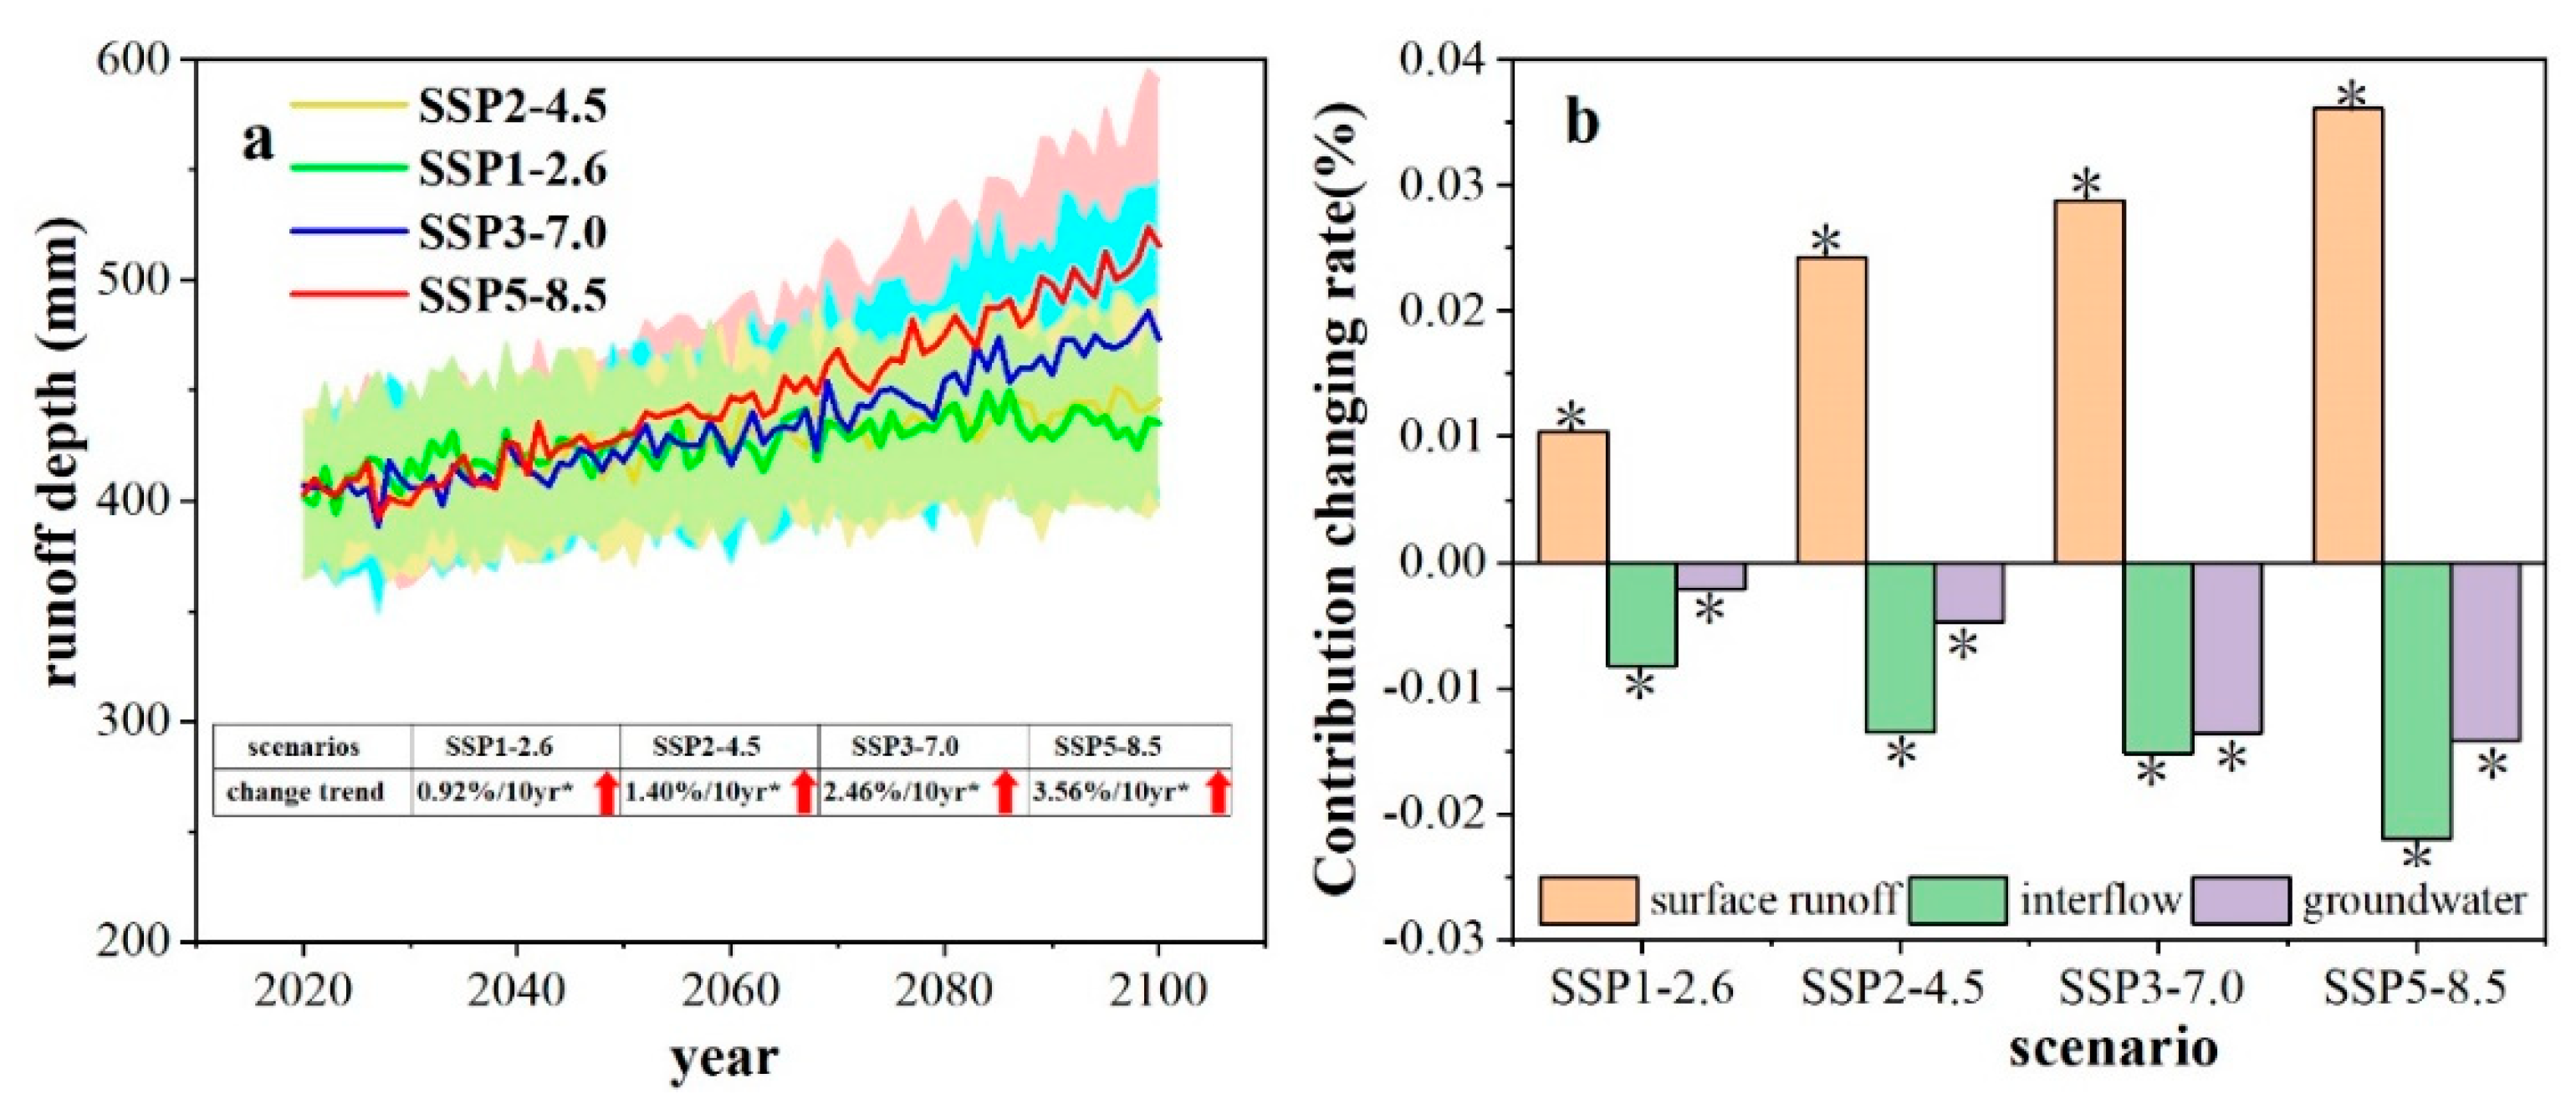
3.4. Variation in Runoff under Future Climate Change

Monthly surface runoff depth, interflow depth, groundwater depth, and total runoff depth of the study area from 2020 to 2100 are shown in Figure 8. Surface runoff was mainly concentrated during May–September, and accounted for 96.8%, 96.4%, 95.5%, and 94.9% of the annual surface runoff under the four scenarios, respectively. Generally, surface runoff was higher in scenarios with more precipitation, because higher precipitation was more likely to generate infiltration excess runoff, thus resulting in higher surface runoff. However, the highest surface runoff depth occurred in May under the SSP1-2.6 scenario with the least precipitation. In this study, the soil thawing area was defined as the area in which the soil temperature (the temperature at the center of the first soil layer) was greater than 0 °C. The proportion of the soil thawing area in May was 88.1%, 90.4%, 93.2%, and 96.2% under the four scenarios, respectively, in the study area. Previous studies have shown that soil freezing and thawing can affect hydrological processes [70,71,72]; when the soil freezes, the permeability of the soil is poor, which may result in the formation of a regional water barrier or weakly permeable layer, and this water barrier in turn increases the runoff in the watershed [73,74,75]. The proportion of soil thawing area in May was the lowest under the SSP1-2.6 scenario, resulting in a relatively high prevalence of permafrost in the study area under this scenario; this resulted in the highest surface runoff production under the SSP1-2.6 scenario.
Monthly interflow depth was consistent in different scenarios and exhibited obvious seasonal differences. Interflow was mainly concentrated during May to September, and surface runoff during these months accounted for 70.0%, 69.3%, 68.6%, and 67.9% of the annual surface runoff under the four scenarios, respectively. Except for August and September, interflow was usually higher in the future scenarios with higher precipitation, because interflow formation increased when saturation excess runoff was produced under higher precipitation. However, interflow in August and September under the SSP1-2.6 scenario (minimum precipitation) was the highest among the four scenarios; this was probably because the temperature in August and September under the SSP1-2.6 scenario was the lowest among the four scenarios, so the soil water loss by evaporation was the lowest in August and September, and the interflow depth was consequently the highest among the four scenarios.
Monthly groundwater depth showed obvious seasonal differences, and groundwater was mainly concentrated during May to September, accounting for 63.6%, 63.0%, 62.3%, and 61.4% of the annual groundwater depth under the four scenarios, respectively. Total runoff was mainly concentrated during May–September, with the four scenarios accounting for 81.2%, 80.4%, 79.6%, and 78.9% of the annual runoff during May to September, respectively. Precipitation under the SSP1-2.6 scenario in May was the lowest among the four scenarios, but the total runoff depth in May under this scenario was the highest. This difference could potentially be attributed to the effect of temperature on the soil freeze–thaw process.
The monthly variation in the surface runoff depth and total runoff depth during the future period (2020–2100) relative to the baseline period (1983–2017) under the four scenarios is shown in Figure 8e and Figure 8h, respectively. In general, monthly surface runoff and total runoff showed an increasing pattern under each scenario, and the increase was relatively high in July and August, probably because the increase in precipitation was greatest in these two months. Monthly interflow and groundwater showed an increasing pattern under all scenarios, and the overall trend of interflow and groundwater was relatively consistent. Both interflow depth and groundwater depth showed a relatively greater increase during June to October, but the difference was that the peak of the change in interflow occurred in July, whereas the peak of the change in groundwater occurred in August, probably because the confluence time of groundwater was longer than that of interflow.
The annual trend of the total runoff depth of the study area from 2020 to 2100 is shown in Figure 9a. The annual variation in total runoff depth exhibited an increasing trend (p < 0.05) in the study area under the future scenarios. The highest rate of increase in the total runoff depth was observed under the SSP5-8.5 scenario (3.56%/10 yr), followed in decreasing order by the SSP3-7.0 (2.46%/10 yr), SSP2-4.5 (1.04%/10 yr), and SSP1-2.6 (0.92%/10 yr) scenarios. Compared with the baseline period (1983–2017), total runoff during the future period (2020–2100) in the study area increased by 11.61%, 14.42%, 21.35%, and 32.32% under the four scenarios, respectively. These results were in agreement with those obtained in previous studies, which indicated that future runoff in the Yarlung Tsangpo River basin demonstrated an increasing trend in [5,21,76,77].
The correlation between annual total runoff and precipitation and temperature was analyzed, and a significant positive correlation between total runoff and precipitation and temperature was found under the four scenarios. The correlation coefficients between total runoff and precipitation were 0.964 (p < 0.05), 0.968 (p < 0.05), 0.987 (p < 0.05), and 0.992 (p < 0.05) for the four scenarios, respectively, whereas those between total runoff and temperature were 0.689 (p < 0.05), 0.894 (p < 0.05), 0.953 (p < 0.05), and 0.978 (p < 0.05), respectively. The correlation between total runoff and precipitation was higher than that between total runoff and temperature under all four scenarios, which indicated to some extent that the influence of precipitation on future total runoff was greater than that of temperature, and that precipitation was the dominant factor influencing future runoff in the study area. Simulations based on CMIP5 or CMIP6 data found that monsoon-dominated source basins, including the Yangtze River, Yellow River, Lancang River, Nujiang River, and Brahmaputra source basins will demonstrate an increasing trend in future runoff due to increasing precipitation [5,76,77].
Changes in the contribution rates of surface runoff, interflow, and groundwater to the total runoff of the study area from 2020 to 2100 under the four scenarios are shown in Figure 9b. Changes in the contribution rates of surface runoff to total runoff showed significant (p < 0.05) increasing trends at rates of 0.010%/10 yr, 0.024%/10 yr, 0.029%/10 yr, and 0.036%/10 yr under the four scenarios, respectively. Change in the contribution rates of interflow to total runoff showed significant (p < 0.05) increasing trends at rates of 0.001%/10 yr, 0.010%/10 yr, 0.020%/10 yr, and 0.035%/10 yr under the four scenarios, respectively. Changes in the contribution rates of groundwater to total runoff showed significant (p < 0.05) decreasing trends at rates of −0.002%/10 yr, −0.005%/10 yr, −0.013%/10 yr, and −0.014%/10 yr under the four scenarios, respectively. These results indicated that the future trend in total runoff showed an increase, which was mainly due to the increase in surface runoff.

4. Discussion

4.1. Influences of Climate Change on Runoff Processes

In this study, the runoff trends in the study area were investigated under four future scenarios, and the total runoff in the study area was found to demonstrate a significantly increasing trend under all scenarios, and that changes in precipitation had the most pronounced effect on changes in future runoff in the study area among all climate factors. Tang et al. [21] used the SWAT model to simulate the changes in runoff in the Yarlung Tsangpo River basin above Lhaze for the 2020–2049 period and found that the runoff in this basin will exhibit an increasing trend in the future. Using the VIC–-Glacier model and 10 GCMs from CMIP6, Sun [5] predicted that the total runoff in the Yarlung Tsangpo River basin would show a significant increasing trend during the 2021–2100 period and that the significant increasing trend in total runoff would be attributable to increased precipitation. Lutz et al. [77] and Tang et al. [78] found that monsoon-dominated source basins, including the Yangtze River, Yellow River, Lancang River, Nujiang River, and Brahmaputra source basins would show an upward trend in future runoff due to increasing precipitation. Wang et al. [72] also found that the trend of variation in river runoff in the Tibetan Plateau would mainly be affected by precipitation, followed by glacier melt and snowmelt; in some regions, changes in runoff would also be related to changes in evapotranspiration and soil water storage.
Runoff in the study area will increase in the future, and the continued increase in temperature will also lead to an increase in the rate of melting of glaciers and snow in the study area, which poses new challenges to the sustainable use of water resources and flood control in the study area and in regions farther downstream [79].

4.2. Uncertainties and Prospects

The scarcity of hydro-meteorological observations in the source areas of rivers on the Tibetan Plateau is a major challenge in the study of changes in river runoff and their impacts [78]. For this study, only a few meteorological stations were present in the target area, which will impact the climate and runoff change assessments, as well as the accuracy of runoff simulations. The lack of meteorological stations in the study area, especially along the elevation gradient, needs to be addressed, and runoff observations at the small watershed scale need to be strengthened, so as to lay a more solid foundation for future hydrological and water resource research in the watershed.
The future climate-change data employed in this study were obtained from 22 GCMs in CMIP6, and therefore the GCM prediction results and their downscaling methods are important sources of uncertainty in runoff prediction. Although the climate simulation capability of CMIP6 for the Tibetan Plateau is better than that of the previous generation [61], the prediction results possess large uncertainties in the Tibetan Plateau region due to limitations in the spatial resolution and insufficient consideration of the complex topography of the Tibetan Plateau [68,80]. One of the main goals of future research will be to combine various evaluation techniques with various downscaling techniques to improve the accuracy of climate-change predictions [68].
Permafrost is widespread in the study area, and the impacts of climate change–induced alterations in the permafrost layer on runoff cannot be ignored. The SWAT model deals with permafrost by first calculating the soil temperature through parameters such as air temperature and soil thickness and then correcting the stagnation parameter using an equation when the soil surface layer freezes; this stagnation parameter affects runoff calculations. The SWAT model takes into account the influence of permafrost on the hydrological cycle in its structure and is more applicable to the cold region of northwest China [36], but the consideration of permafrost is relatively simplistic and does not take into account changes in permafrost area.

5. Conclusions

This study used the SWAT model to simulate the effects of climate change on total runoff and runoff components, including surface runoff, interflow, and groundwater, in the midstream section of the Yarlung Tsangpo River basin. The results showed the following: (1) Runoff components contributed to total runoff in the following order: surface runoff (47.2%) > groundwater (24.4%) > interflow (28.4%). (2) Spatial heterogeneity in precipitation, glacier distribution, and soil properties resulted in distinct differences in the spatial distribution of runoff and its components. (3) The peak of surface runoff occurred in August, whereas the peak of interflow and groundwater occurred in September. Moreover, total runoff, surface runoff, interflow, and groundwater all showed increasing trends at rates of 0.16%/10 yr, 0.03%/10 yr, 0.83%/10 yr, and 0.52%/10 yr (p > 0.05), respectively, which was attributed to increasing precipitation. (4) The study area was predicted to undergo wetting and warming in the future under four scenarios. As a result, total runoff depth would increase by 11.61–32.32% during 2020–2100 compared with runoff depth during the baseline period of 1983–2017. (5) Precipitation was the most significant factor influencing changes in runoff. Additionally, changes in the total runoff were mainly affected by changes in surface runoff. (6) Temperature could influence hydrological processes by affecting freeze–thaw processes. Both total runoff and surface runoff in May were highest under the SSP1-2.6 scenario with the least precipitation. This was likely because the temperature was relatively low under the SSP1-2.6 scenario, the soil thawing area was relatively small, and the water-barrier effect of frozen soil reduced its infiltration capacity and aided the formation of surface runoff.
Accurate runoff simulations are strongly dependent on the acquisition of adequate meteorological data. It is hoped that the number of stations along the elevation gradient can be increased in the future, because the number of meteorological stations in the study area will have an impact on the climate and runoff change assessments, as well as on the accuracy of runoff simulations. Although permafrost is considered, the consideration of permafrost is only corrected for retention parameters when the soil surface is frozen by using an equation, and it is hoped that subsequent studies will consider changes in permafrost area as well. This study predicted an increasing trend of runoff for the midstream section of the Yarlung Tsangpo River in the future. The continuous increase in temperature in the future will accelerate the melting of glaciers and snow in the study area, and this trend has implications for the sustainable management of water resources and hydrological disaster warnings in the study area and in regions farther downstream.

Supplementary Materials

The following supporting information can be downloaded at: https://www.mdpi.com/article/10.3390/w15040685/s1: Table S1: Corresponding years for different categories of runoff. Figure S1: Spatial variations in annual precipitation (mm) in (a) especially high flow years; (b) high flow years; (c) normal flow years; (d) low flow years; and (e) especially high flow years. Figure S2: Spatial variations in annual evaporation (mm) in (a) especially high flow years; (b) high flow years; (c) normal flow years; (d) low flow years; and (e) especially high flow years. Figure S3: (a) Monthly precipitation for the 2020–2100 period; and (b) monthly precipitation variation compared with the baseline period (1983–2017) in the study area under different scenarios. Figure S4: (a) Monthly temperature for the 2020–2100 period; and (b) monthly temperature variation compared with the baseline period (1983–2017) in the study area under different scenarios. Figure S5: Annual (a) precipitation; and (b) temperature in the study area for the 2020–2100 period under different scenarios.

Author Contributions

Software, Y.C.; resources, C.Q., C.Y., Z.S. and O.R.; data curation, Y.C. and L.W.; writing—original draft, Y.C.; writing—review and editing, L.W., X.S., C.Z., Y.W., G.W. and F.Z.; supervision, F.Z.; funding acquisition, C.Z.; project administration, C.Z. All authors have read and agreed to the published version of the manuscript.

Funding

This research was financially supported by the National Key Research and Development Program of China (2022YFF1302901-05) and Second Tibetan Plateau Scientific Expedition and Research Program (2019QZKK0203).

Data Availability Statement

Not applicable.

Conflicts of Interest

The authors declare that they have no known competing financial interest or personal relationship that could have influence the work reported in this paper.

References

  1. Bekele, E.G.; Knapp, H.V. Watershed modeling to assessing impacts of potential climate change on water supply availability. Water Resour. Manag. 2010, 24, 3299–3320. [Google Scholar]
  2. Zhang, R.H.; Su, F.G.; Jiang, Z.H.; Gao, X.J.; Guo, D.L.; Ni, J.; You, Q.L.; Lan, C.; Zhou, B.T. Advances in climate and environmental change prediction on the Tibetan Plateau in the 21st century. Sci. Bull. 2015, 60, 3036–3047. (In Chinese) [Google Scholar]
  3. Rabezanahary, T.M.F.; Rahaman, M.; Zhai, J. Assessment of the future impact of climate change on the hydrology of the mangoky river, madagascar using ANN and SWAT. Water 2021, 13, 1239. [Google Scholar]
  4. Masson-Delmotte, V.; Zhai, P.; Pirani, A.; Connors, S.L.; Péan, C.; Berger, S.; Caud, N.; Chen, Y.; Goldfarb, L.; Gomis, M.I.; et al. Climate change 2021: The physical science basis. In Contribution of Working Group I to the Sixth Assessment Report of the Intergovernmental Panel on Climate Change; Cambridge University Press: Cambridge, UK; New York, NY, USA, 2021; Volume 2. [Google Scholar]
  5. Sun, H. Response of Runoff to Climate Change in Different Sub-Basins of the Yarlung Tsangpo River. Doctor Thesis, University of Chinese Academy of Sciences, Beijing, China, 2021. (In Chinese). [Google Scholar]
  6. Barry, R.G. Mountain climate change and cryospheric responses: A review. World Mt. Symp. 2001. Available online: https://lib.icimod.org/record/10655/files/930.pdf (accessed on 10 February 2020).
  7. Bürki, R.; Elsasser, H.; Abegg, B. Climate change-impacts on the tourism industry in mountain areas. In Proceedings of the 1st International Conference on Climate Change and Tourism, Djerba, Tunisia, 9–11 April 2003. [Google Scholar]
  8. Kuang, X.; Jiao, J.J. Review on climate change on the Tibetan Plateau during the last half century. J. Geophys. Res. Atmos. 2016, 121, 3979–4007. [Google Scholar]
  9. Liu, X.; Chen, B. Climatic warming in the Tibetan Plateau during recent decades. Int. J. Climatol. 2000, 20, 1729–1742. [Google Scholar] [CrossRef]
  10. Li, L.; Yang, S.; Wang, Z.; Zhu, X.; Tang, H. Evidence of warming and wetting climate over the Qinghai-Tibet Plateau. Arct. Antarc. Alp. Res. 2010, 42, 449–457. [Google Scholar] [CrossRef]
  11. Wang, B.; Bao, Q.; Hoskins, B.; Wu, G.; Liu, Y. Tibetan Plateau warming and precipitation changes in East Asia. Geophys. Res. Lett. 2008, 35, L14702. [Google Scholar] [CrossRef]
  12. Jiang, K. Runoff Composition of the Yarlung Tsangpo River Basin and Its Response to Climate Change. Master’s Thesis, Harbin Institute of Technology, Harbin, China, 2020. (In Chinese). [Google Scholar]
  13. Gao, H.; He, X.; Ye, B.; Pu, J. Modeling the runoff and glacier mass balance in a small watershed on the Central Tibetan Plateau, China, from 1955 to 2008. Hydrol. Process. 2012, 26, 1593–1603. [Google Scholar] [CrossRef]
  14. Li, F.; Zhang, Y.; Xu, Z.; Teng, J.; Liu, C.; Liu, W.; Mpelasoka, F. The impact of climate change on runoff in the southeastern Tibetan Plateau. J. Hydrol. 2013, 505, 188–201. [Google Scholar] [CrossRef]
  15. Zhang, L.; Su, F.; Yang, D.; Hao, Z.; Tong, K. Discharge regime and simulation for the upstream of major rivers over Tibetan Plateau. J. Geophys. Res. Atmos. 2013, 118, 8500–8518. [Google Scholar]
  16. Jin, H.; Ju, Q.; Yu, Z.; Hao, J.; Gu, H.; Gu, H.; Li, W. Simulation of snowmelt runoff and sensitivity analysis in the Nyang River Basin, southeastern Qinghai-Tibetan Plateau, China. Nat. Hazards 2019, 99, 931–950. [Google Scholar]
  17. Wang, X.; He, K.; Dong, Z. Effects of climate change and human activities on runoff in the Beichuan River Basin in the northeastern Tibetan Plateau, China. Catena 2019, 176, 81–93. [Google Scholar] [CrossRef]
  18. Zhang, F.; Shi, X.; Zeng, C.; Wang, L.; Xiao, X.; Wang, G.; Chen, Y.; Zhang, H.; Lu, X.; Immerzeel, W. Recent stepwise sediment flux increase with climate change in the Tuotuo River in the central Tibetan Plateau. Sci. Bull. 2020, 65, 410–418. [Google Scholar] [CrossRef]
  19. Pant, R.R.; Zhang, F.; Rehman, F.U.; Wang, G.; Ye, M.; Zeng, C.; Tang, H. Spatiotemporal variations of hydrogeochemistry and its controlling factors in the Gandaki River Basin, Central Himalaya Nepal. Sci. Total Environ. 2018, 622–623, 770–782. [Google Scholar] [CrossRef]
  20. Huang, X. A Study on the Carrying Capacity of Water Resources in the Yarlung Tsangpo River Basin Based on Water Cycle Processes. Master’s Thesis, University of Chinese Academy of Sciences, Beijing, China, 2016. (In Chinese). [Google Scholar]
  21. Tang, X.P.; Liu, Y.L.; Zhang, J.Y.; Wang, G.Q.; Li, X.G.; Jin, J.L.; Bao, Z.X.; Liu, C.S.; Wang, G.X. Simulation and prediction of runoff processes in the watershed above Lhaze of the Yarlung Tsangpo River under climate change. Hydrology 2018, 6, 24–30. (In Chinese) [Google Scholar]
  22. Liu, W.F.; Xu, Z.X.; Li, F.P.; Su, L.Q. Climate change scenarios in the Yarlung Zangbo River basin based on ASD model. Plateau Meteorol. 2014, 33, 26–36. (In Chinese) [Google Scholar]
  23. Nie, N.; Zhang, W.C.; Deng, C. Spatial and temporal climate changes and future trends in the Yarlung Tsangpo River basin from 1978 to 2009. J. Glacial Permafr. 2012, 34, 64–71. (In Chinese) [Google Scholar]
  24. Gao, B.; Yang, D.W.; Liu, Z.Y.; Zhu, C.B. Distributed hydrological simulation and runoff variability analysis in the Yarlung Tsangpo River basin. Hydrology 2008, 28, 40–44. (In Chinese) [Google Scholar]
  25. Wang, L.; Chen, X.W. Advances in SWAT model watershed runoff simulation. J. Huaqiao Univ. (Nat. Sci. Ed.) 2008, 29, 6–10. (In Chinese) [Google Scholar]
  26. Wang, X.; Shang, S.; Yang, W.; Clary, C.R.; Yang, D. Simulation of land use–soil interactive effects on water and sediment yields at watershed scale. Ecol. Eng. 2010, 36, 328–344. [Google Scholar]
  27. Ouyang, W.; Huang, H.; Hao, F.; Guo, B. Synergistic impacts of land-use change and soil property variation on non-point source nitrogen pollution in a freeze–Thaw area. J. Hydrol. 2013, 495, 126–134. [Google Scholar]
  28. Yu, Z.L.; Mu, X.L. Progress of domestic runoff simulation by SWAT model. Zhihuai 2014, 4, 21–22. (In Chinese) [Google Scholar]
  29. Zuo, D.; Xu, Z.; Yao, W.; Jin, S.; Xiao, P.; Ran, D. Assessing the effects of changes in land use and climate on runoff and sediment yields from a watershed in the Loess Plateau of China. Sci. Total Environ. 2016, 544, 238–250. [Google Scholar] [CrossRef]
  30. Dou, X.D.; Huang, W.; Yi, Q.; Liu, X.Z.; Zuo, H.T.; Li, M.; Li, Z.L. Impacts of LUCC and climate change on runoff in the Lancang River basin. Acta Ecol. Sin. 2019, 39, 4687–4696. (In Chinese) [Google Scholar]
  31. Zhang, X.Y.; Li, J.; Yang, Y.Z.; You, Z. Simulation of runoff in the Yangtze River source area based on SWAT model. J. Northwest For. Acad. 2012, 27, 38–44. (In Chinese) [Google Scholar]
  32. Wang, J.Q.; Zheng, Y.F. Preliminary analysis of the applicability of SWAT model in the three river source region. Meteorol. Environ. Sci. 2014, 37, 102–107. (In Chinese) [Google Scholar]
  33. Zhou, J.; Wang, L.; Zhang, Y.; Guo, Y.; Li, X.; Liu, W. Exploring the water storage changes in the largest lake (Selin Co) over the Tibetan Plateau during 2003–2012 from a basin-wide hydrological modeling. Water Resour. Res. 2015, 51, 8060–8086. [Google Scholar]
  34. Shi, X.N.; Zhang, F.; Lu, X.X.; Wang, Z.Y.; Gong, T.L.; Wang, G.X.; Zhang, H.B. Spatiotemporal variations of suspended sediment transport in the upstream and midstream of the Yarlung Tsangpo River (the upper Brahmaputra), China. Earth Surf. Process. Landf. 2018, 43, 432–443. [Google Scholar] [CrossRef]
  35. Arnold, J.G.; Srinivasan, R.; Muttiah, R.S.; Williams, J.R. Large area hydrologic modeling and assessment part I: Model development. J. Am. Water Resour. Assoc. 1998, 34, 73–89. [Google Scholar]
  36. Wang, Z.G.; Liu, C.M.; Huang, Y.B. Research on the principle, structure and application of SWAT model. Adv. Geogr. Sci. 2003, 22, 79–86. (In Chinese) [Google Scholar]
  37. Abbaspour, K.C.; Yang, J.; Maximov, I.; Siber, R.; Bogner, K.; Mieleitner, J.; Zobrist, J.; Srinivasan, R. Modelling hydrology and water quality in the pre-ailpine/alpine Thur watershed using SWAT. J. Hydrol. 2007, 333, 413–430. [Google Scholar] [CrossRef]
  38. USDA-SCS. National Engineering Handbook: Section 4 Hydrology; U.S. Department of Agriculture, Soil Conservation Service: Washington, DC, USA, 1972.
  39. Green, W.H.; Ampt, G.A. Studies on soil physics. The flow of air and water through soils. J. Agric. Sci. 1911, 4, 11–24. [Google Scholar]
  40. Fontaine, T.A.; Cruickshank, T.S.; Arnold, J.G.; Hotchkiss, R.H. Development of a snowfall–snowmelt routine for mountainous terrain for the soil water assessment tool (SWAT). J. Hydrol. 2002, 262, 209–223. [Google Scholar] [CrossRef]
  41. Zhang, F.; Zhang, H.B.; Hagen, S.C.; Ye, M.; Wang, D.; Gui, D.; Zeng, C.; Tian, L.; Liu, J. Snow cover and runoff modelling in a high mountain catchment with scarce data: Effects of temperature and precipitation parameters. Hydrol. Process. 2015, 29, 52–65. [Google Scholar]
  42. Nash, J.E.; Sutcliffe, J.V. River flow forecasting through conceptual models part I-A discussion of principles. J. Hydrol. 1970, 10, 282–290. [Google Scholar] [CrossRef]
  43. Gupta, H.; Sorooshian, S.; Yapo, P. Status of automatic calibration for hydrologic models: Comparison with multilevel expert calibration. J. Hydrol. Eng. 1999, 4, 135–143. [Google Scholar] [CrossRef]
  44. Moriasi, D.N.; Arnold, J.G.; Van Liew, M.W.; Bingner, R.L.; Harmel, R.D.; Veith, T.L. Model evaluation guidelines for systematic quantification of accuracy in watershed simulations. Transations ASABE 2007, 50, 885–900. [Google Scholar] [CrossRef]
  45. Wang, X.L. Study on the impact of climate change on water circulation processes in the Pamir Plateau-Karakorum-Kunlun Mountains snow-ice basin. Doctor Thesis, University of Chinese Academy of Sciences, Beijing, China, 2016. [Google Scholar]
  46. Kudo, R.; Yoshida, T.; Masumoto, T. Uncertainty analysis of impacts of climate change on snow processes: Case study of interactions of GCM uncertainty and an impact model. J. Hydrol. 2017, 548, 196–207. [Google Scholar] [CrossRef]
  47. Zhang, Q.; Shen, Z.; Xu, C.; Sun, P.; Hu, P.; He, C. A new statistical downscaling approach for global evaluation of the CMIP5 precipitation outputs: Model development and application. Sci. Total Environ. 2019, 690, 1048–1067. [Google Scholar]
  48. Li, Z.; Li, Q.; Wang, J.; Feng, Y.R.; Shao, Q.X. Impacts of projected climate change on runoff in upper reach of Heihe River basin using climate elasticity method and GCMs. Sci. Total Environ. 2020, 716, 137072. [Google Scholar] [CrossRef] [PubMed]
  49. Chen, J.; Brissette, F.P.; Leconte, R. Uncertainty of downscaling method in quantifying the impact of climate change on hydrology. J. Hydrol. 2011, 401, 190–202. [Google Scholar]
  50. Van, R.L.; Christensen, J.H.; Butts, M.B.; Jensen, K.H.; Refsgaard, J.C. An intercomparison of regional climate model data for hydrological impact studies in Denmark. J. Hydrol. 2010, 380, 406–419. [Google Scholar]
  51. Hay, L.E.; Wilby, R.L.; Leavesley, G.H. A comparison of Delta change and downscaled GCM scenarios for three mountainous basins in the United States. J. Am. Water Resour. Assoc. 2000, 36, 387–397. [Google Scholar] [CrossRef]
  52. Wang, R. Effects of Climate and Subsurface Changes on Runoff in the Middle Reaches of the Yarlung Tsangpo River Basin. Doctor Thesis, University of Chinese Academy of Sciences, Beijing, China, 2015. [Google Scholar]
  53. Kayastha, R.B. Study of Glacier Ablation in the Nepalese Himalayas by the Energy Balance Model and Positive Degree-Day Method. Doctor Thesis, Nagoya University, Nagoya, Japan, 2001. [Google Scholar]
  54. Sun, H.; Su, F.G. Precipitation correction and reconstruction for streamflow simulation based on 262 rain gauges in the upper Brahmaputra of southern Tibetan Plateau. J. Hydrol. 2020, 590, 125484. [Google Scholar]
  55. Wu, Q.; Kang, S.; Gao, T.; Zhang, Y. The characteristics of the positive degree-day factors of the Zhadang glacier on the Nyainqentanglha range of Tibetan Plateau, and its application. J. Glaciol. Geocryol. 2010, 32, 891–897. (In Chinese) [Google Scholar]
  56. Liu, J.; Zhang, W. Reconstructed glacier mass balance in the past few decades with the latest GRACE and GLDAS products over the Yarlung Zangbo River Basin, China. In Fifth Recent Advances in Quantitative Remote Sensing; Sobrino Rodríguez, J.A., Ed.; Universitat de València: Valencia, Spain, 2018. [Google Scholar]
  57. Singh, V.; Jain, S.K.; Shukla, S. Glacier change and glacier runoff variation in the Himalayan Baspa river basin. J. Hydrol. 2021, 593, 125918. [Google Scholar] [CrossRef]
  58. Qi, W.; Feng, L.; Liu, J.G.; Yang, H. Snow as an Important Natural Reservoir for Runoff and Soil Moisture in Northeast China. Journal of Geophysical Research. Atmospheres 2020, 125, e2020JD033086. [Google Scholar]
  59. Zhang, Y.; Luo, Y.; Sun, L.; Liu, S.; Chen, X.; Wang, X. Using glacier area ratio to quantify effects of melt water on runoff. J. Hydrol. 2016, 538, 269–277. [Google Scholar]
  60. Liu, T.Q. Hydrological characteristics of the Yarlung Tsangpo River. J. Geogr. 1999, 54, 157–164. (In Chinese) [Google Scholar]
  61. Yao, Y.; Zheng, C.; Andrews, C.B.; Scanlon, B.R.; Kuang, X.; Zeng, Z.; Jeong, S.J.; Lancia, M.; Wu, Y.; Li, G. Role of groundwater in sustaining northern Himalayan rivers. Geophys. Res. Lett. 2021, 48, e2020GL092354. [Google Scholar]
  62. Tan, H.; Chen, X.; Shi, D.; Rao, W.; Liu, J.; Liu, J.; Eastoe, C.J.; Wang, J. Base flow in the Yarlungzangbo River, Tibet, maintained by the isotopically-depleted precipitation and groundwater discharge. Sci. Total Environ. 2021, 759, 143510. [Google Scholar] [CrossRef]
  63. Zhao, Z.C.; Fu, Q.; Gao, C.; Zhang, X.J.; Xu, Y.P. Simulation of monthly runoff in Yarlung Tsangpo River considering runoff components. Hydrology 2017, 37, 26–30. (In Chinese) [Google Scholar]
  64. Budyko, M.I. Climate and Life; Academic Press: Salt Lake City, UT, USA, 1974. [Google Scholar]
  65. Liu, M.L.; Wang, Z.J.; Zhu, L.L.; Lv, J.P. Gray correlation analysis between evapotranspiration and meteorological factors in Qiqihar region. Northeast Water Conserv. Hydropower 2018, 36, 12–16. (In Chinese) [Google Scholar]
  66. Wang, H.; Mei, Z.M. Spatial and temporal variation of surface evapotranspiration in Guizhou Province and its relationship with climate factors. Soil Water Conserv. Res. 2020, 27, 221–229. (In Chinese) [Google Scholar]
  67. Chen, L.L.; Mo, S.H.; Gong, Y. Identification of attribution of runoff changes in the Jialu River basin based on Budyko's elasticity coefficient method. J. Water Resour. Water Eng. 2021, 32, 110–116. (In Chinese) [Google Scholar]
  68. Zhang, J.Y.; Lun, Y.R.; Liu, L.; Liu, Y.X.; Li, X.; Xu, Z.X. Adaptation assessment of CMIP6 multi-model on the Tibetan Plateau and prediction of future climate change. J. Beijing Norm. Univ. 2022, 58, 77–89. (In Chinese) [Google Scholar]
  69. Meng, Y.L.; Duan, K.Q.; Shang, D.; Li, S.S.; Xing, L.; Shi, P.H. Analysis of spatial and temporal variation of surface air temperature on the Tibetan Plateau from 1961 to 2100 based on CMIP6 data. Glacial Permafr. 2022, 44, 1–10. (In Chinese) [Google Scholar]
  70. Cao, H.Y. Remote Sensing-Based Inversion of Permafrost in the Yellow River Source Area and the Influence of Permafrost Changes on Runoff. Master’s Thesis, China University of Geosciences, Beijing, China, 2021. (In Chinese). [Google Scholar]
  71. Chang, Q.X. Water Sources of River Runoff and Their Seasonal Variation Patterns in Alpine Mountainous Areas. Doctor Thesis, China University of Geosciences, Beijing, China, 2019. [Google Scholar]
  72. Wang, Y.; Zhang, Y.; Chiew, F.H.S.; McVicar, T.R.; Zhang, L.; Li, H.; Qin, G. Contrasting runoff trends between dry and wet parts of eastern Tibetan Plateau. Sci. Rep. 2017, 7, 15458. [Google Scholar] [PubMed]
  73. Zhao, L.; Hu, G.J.; Zou, D.F.; Wu, X.D.; Ma, L.; Sun, Z.; Yuan, L.M.; Zhou, H.Y.; Liu, S.B. Impact of multi-year permafrost changes on hydrological processes on the Tibetan Plateau. Proc. Chin. Acad. Sci. 2019, 34, 1233–1246. (In Chinese) [Google Scholar]
  74. Kurylyk, B.L.; MacQuarrie, K.T.B.; Mckenzie, J.M. Climate change impacts on groundwater and soil temperatures in cold and temperate regions: Implications, mathematical theory, and emerging simulation tools. Earth Sci. Rev. 2014, 138, 313–334. [Google Scholar] [CrossRef]
  75. Evans, S.G.; Ge, S.; Liang, S. Analysis of groundwater flow in mountainous, headwater catchments with permafrost. Water Resour. Res. 2015, 51, 9564–9576. [Google Scholar]
  76. Su, F.; Zhang, L.; Ou, T.; Chen, D.; Yao, T.; Tong, K.; Qi, Y. Hydrological response to future climate changes for the major upstream river basins in the Tibetan Plateau. Glob. Planet. Change 2016, 136, 82–95. [Google Scholar]
  77. Lutz, A.F.; Immerzeel, W.W.; Shrestha, A.B.; Bierkens, M.F.P. Consistent increase in High Asia’s runoff due to increasing glacier melt and precipitation. Nat. Clim. Change 2014, 4, 587–592. [Google Scholar]
  78. Tang, Q.H.; Lan, C.; Su, F.G.; Liu, X.C.; Sun, H.; Ding, J.; Wang, L.; Len, G.Y.; Zhang, Y.Q.; Sang, Y.F.; et al. Streamflow change on the Qinghai-Tibet Plateau and its impacts. Chin. Sci. Bull. 2019, 64, 2807–2821. (In Chinese) [Google Scholar]
  79. Nepal, S.; Shrestha, A.B. Impact of climate change on the hydrological regime of the Indus, Ganges and Brahmaputra river basins: A review of the literature. Int. J. Water Resour. Dev. 2015, 31, 201–218. [Google Scholar] [CrossRef] [Green Version]
  80. Qin, D.H.; Ding, Y.H.; Su, J.L.; Ren, J.W.; Wang, S.W.; Wu, R.S.; Yang, X.Q.; Wang, S.M.; Liu, S.Y.; Dong, G.R.; et al. Assessment of climate and evironment changes in China (I): Climate and evnironment changes in China and their projection. Adv. Clim. Chang. Res. 2005, 1, 4–9. (In Chinese) [Google Scholar]
Figure 1. (a) Location; (b) topography, weather stations, and hydrological stations; (c) land-use map; and (d) soil-type map of the midstream section of the Yarlung Tsangpo River.
Water 15 00685 g001
Figure 2. Simulated and observed (MODIS) for (a) monthly and (b) multi-year monthly average snow cover area of the study area during 2001–2017.
Water 15 00685 g002
Figure 3. Comparison between simulated and observed monthly runoff of (a) Nugesha station; (b) Yangcun station; and (c) Nuxia station during calibration and validation periods.
Water 15 00685 g003
Figure 4. Temporal variation in (a) the monthly precipitation and total runoff and runoff component; and (b) temperature and evaporation.
Water 15 00685 g004
Figure 5. Temporal variations in (a) annual precipitation and total runoff and runoff components; and (b) and temperature and evaporation.
Water 15 00685 g005
Figure 6. Spatial variation in total runoff depth in (a) especially high flow years; (b) high flow years; (c) normal flow years; (d) low flow years; and (e) especially high flow years.
Water 15 00685 g006
Figure 7. Spatial distribution of different runoff components in the subbasins.
Water 15 00685 g007
Figure 8. Monthly (a) surface runoff depth; (b) interflow depth; (c) groundwater depth; and (d) total runoff depth for 2020–2100. Monthly (e) surface runoff depth variation; (f) interflow depth variation; (g) groundwater depth variation; and (h) total runoff depth compared to the baseline period of 1983–2017 in the study area under the four scenarios.
Water 15 00685 g008
Figure 9. (a) Annual total runoff depth; and (b) rates of change in the contributions of surface runoff, interflow, and groundwater to total runoff during the 2020–2100 period in the study area under the four scenarios. * represents the significance at 0.05 level.
Water 15 00685 g009
Table 1. Data used and corresponding sources.
Data TypeNameResolutionSource
Spatial dataDEM90 mhttps://www.gscloud.cn/sources/accessdata/305?pid=302 (accessed on 1 February 2020)
Land use1 kmhttps://www.resdc.cn/DOI/DOI.aspx?DOIID=54 (accessed on 10 February 2020)
Soil type1 kmhttps://www.fao.org/soils-portal/soil-survey/soil-maps-and-databases/harmonized-world-soil-database-v12/en/ (accessed on 10 February 2020)
Meteorological dataPrecipitation, temperature, wind
speed, relative humidity
Dailyhttps://www.resdc.cn/data.aspx?DATAID=230 (accessed on 20 February 2020)
Hydrological dataRunoffMonthlyHydrological and Water Resources Survey Bureau of Tibet (Lhaze, Nugesha, Yangcun, Nuxia Hydrological stations)
Snow coverMOD10CMMonthlyhttps://search.earthdata.nasa.gov/search/granules?p=C1646609754-NSIDC_ECS&pg (accessed on 20 October 2020)
Table 2. Glacier characteristics of the study area.
Lhaze to NugeshaNugesha to YangcunYangcun to Nuxia
Glacier area (km2)493.35768.241409.13
Glacier coverage (%)0.841.63.5
Table 3. Basic information of the Earth–climate system models in CMIP6.
No.Model NameCountry/RegionAbbreviation of R&D OrganizationResolution
1ACCESS-CM2AustraliaCSIRO-ARCCSS1.25° × 1.875°
2ACCESS-ESM1-5AustraliaCSIRO1.25° × 1.875°
3AWI-CM-1-1-MRGermanyAWI0.93° × 0.94°
4BCC-CSM2-MRChinaBCC1.12° × 1.12°
5CanESM5-CanOECanadaCCCMA0.9° × 1.25°
6CAMS-CSM1-0ChinaCAMS1.12° × 1.12°
7CESM2USANCAR0.9° × 1.25°
8CESM2-WACCMUSANCAR0.9° × 1.25°
9CNRM-CM6-1FranceCNRM-CERFACS1.4° × 1.4°
10FGOALS-f3-LChinaCAS1° × 1.25°
11FIO-ESM-2-0ChinaCAS0.9424° × 1.25°
12GFDL-ESM4USAGFDL2.0° × 2.5°
13GISS-E2-1-GUSAGISS2.0° × 2.5°
14HadGEM3.GC31.LLUKHC1.3° × 1.9°
15HadGEM3.GC31.MMUKHC1.3° × 1.9°
16IPSL.CM6A.LRFranceIPSL1.9° × 3.8°
17KACE.1.0.GKoreaNIMS-KMA1.25° × 1.875°
18MIROC-ES2LJapanAORI-NIES-JAMATEC2.8° × 2.8°
19MPI-ESM1-2-HRGermanyMPI-M1.9° × 1.9°
20MRI-ESM2-0JapanMRI0.6° × 0.6°
21NESM3ChinaNUIST1.865° × 1.875°
22NorESM2.LMNorwayNCC1.895° × 2.5°
Table 4. Sensitive parameters for runoff simulation and calibration in SWAT.
Sensitive ParametersParameter DefinitionRangeCalibrated Value
v_PLAPS.subPrecipitation gradient (mm/km)−1000–1000160
v_TLAPS.subTemperature lapse rate (°C/km)−10–10−5.5
r_CN2.mgtSCS runoff curve number35–9835–85
v_ESCO.hruSoil evaporation compensation factor0–10.5
v_ALPHA_BF.gwBaseflow alpha factor (days)0–10.7
r_SOL_K.solSaturated hydraulic conductivity0–20001–40
v_SURLAG.bsnSurface runoff lag time0.05–2411
v_GW_DELAY.gwGroundwater delay (days)0–500350
v_SFTMP.bsnSnowfall temperature (°C)−10–100
v_SMFMX.bsnMaximum degree–day factor for snowmelt during year (mm°C−1 day−1)0–105.5
v_SMFMN.bsnMaximum degree–day factor for snowmelt during year (mm°C−1 day−1)0–105.5
v_SMFMX.subMaximum degree–day factor for glacier during year (mm°C−1 day−1)0–106.2–10
v_SMFMN.subMaximum degree–day factor for glacier during year (mm°C−1 day−1)0–106.2–10
Note: “v_” indicates a replacement of the original parameter value; “r_” indicates a relative change from the original parameter value; and “a_” indicates an addition of the original parameter value.
Disclaimer/Publisher’s Note: The statements, opinions and data contained in all publications are solely those of the individual author(s) and contributor(s) and not of MDPI and/or the editor(s). MDPI and/or the editor(s) disclaim responsibility for any injury to people or property resulting from any ideas, methods, instructions or products referred to in the content.

