1. Introduction
The sensitivity of stream discharge extremes to changing temperature is an important metric in assessing the effects of climate change on hydrology and water supply [
1]. In fact, extreme discharge events are linked to levels of endorheic saline lakes such as the Great Salt Lake in Utah, which can have widespread impacts on human and ecosystem health [
2]. However, understanding the sensitivity of discharge to temperature within Utah and other areas of the semi-arid southwestern United States (US) is challenging given the varied topography, the seasonality of winter snowpack accumulation, and the diverse climatological characteristics of the region. Specifically, as the footprint of the North American Monsoon (NASM) (which causes peak annual precipitation in summer) is largely restricted to the southwestern US and southern Utah, temperature may play a different role in modulating streamflow extremes than other regions which receive predominantly winter and spring precipitation in the form of extratropical cyclones and atmospheric rivers [
3,
4,
5,
6]. Due to these heterogeneities and the importance of understanding stream discharge sensitivity to temperature in a region with growing water demand [
1,
7], this study will explore the relationship between temperature and stream discharge extremes in Utah—a region which encapsulates much of the heterogeneities of the western United States.
Current water management in Utah, like other states in the West, relies heavily on the storage of spring snowmelt runoff largely controlled by winter snowpack accumulation and the timing and intensity of snowmelt [
3]. Research indicates that climate change affects stream discharge base flows, extremes, and seasonality in diverse ways. For example, warmer and drier winters result in reduced snow accumulation and less runoff and reservoir storage. In addition, warming in the spring and summer can lead to earlier and larger peak snowmelt discharge, which can result in greater evaporative loss and demand [
1,
8,
9]. Studies have also explored, with varying methodologies, the effects seasonally in western North America, including discharge sensitivity and precipitation elasticity to changing temperature in the Colorado River basin [
10] and the Pacific Northwest [
11], and drainage basin sensitivity to seasonal changes in Alaska [
12] and the western US [
13].
Different methods have been employed to assess streamflow sensitivity to temperature [
1]. Hydrological modeling, albeit well-established, can be limited due to internal feedbacks and scenarios being under-represented due to the multitude of multiple complex variables [
14]. Other methods, with heavier reliance on historic streamflow and climate data such as multivariate regression and the Budyko framework, have sound statistical foundations [
1]; however, they are at the mercy of reliability and representativeness of observational data. Regardless, historic streamflow and climate data are key for the calibration and validation of both hydrologic and climate modeling schemes [
1,
15]. To characterize the impacts of a warming climate on the hydrologic cycle, the scaling sensitivity of precipitation and stream discharge extremes to temperature has been widely tied to the Clausius–Clapeyron (CC) relationship, which states that the atmospheric holding capacity for water vapor increases approximately 7% for every 1°C temperature increase [
16,
17,
18,
19,
20,
21,
22,
23]. However, there are significant regional and seasonal deviations from this generalization, as well as large differences in scaling between temperature and humidity or dewpoint temperature [
17,
24,
25,
26].
Addressing these deviations by scaling with both temperature and dewpoint temperature can reveal the response of the hydrological cycle to changes in both relative humidity and surface-air temperature [
20,
27,
28]. At higher surface-air temperatures, relative humidity is already limited, and results have shown declining scaling after a certain temperature threshold [
29] in regions such as the western US [
26]. However, by using dewpoint temperature, the atmosphere can reflect changes in both relative humidity and surface-air temperature [
20,
28]. This relationship and the influence on precipitation is well-described by thermodynamics and with more recent theoretical developments in microphysics and atmospheric dynamics [
18]. However, temperature and dewpoint also vary seasonally, necessitating the inclusion of, or accounting for, seasonality in studies, which have had some success in resolving some deviations [
26,
30,
31]. For instance, deviations in the western US have included a declined scaling of discharge beyond a certain temperature threshold [
26], which is explained by the limiting factor of relative humidity at higher temperatures. In addition, deviations between precipitation and discharge scaling lie in snowmelt and create a more stable scaling with temperature [
3,
26]. However, little is known about the mechanisms behind the scaling rate of discharge to surface-air and dewpoint temperatures.
Here, we will focus on extreme discharge scaling with surface-air and dewpoint temperatures across Utah to infer what role climate change may have in shaping water supply in the future climate. Additionally, we will identify some mechanisms involved in surface-air and dewpoint relationships with extreme stream discharge over the diverse climatological characteristics of Utah. While our analysis is restricted to a relatively small geographic domain, we aim to provide a framework for exploring stream discharge and temperature/dewpoint scaling over larger regions and watersheds.
2. Site Description, Materials and Methods
Utah is characterized by highly complex terrain and spatial heterogeneity in the seasonality of precipitation and snowmelt. This state is comprised of large valleys and basins from 700 m to 1500 m in elevation interspersed with mountain ranges containing a spectrum of montane climates up to 4000 m. Winters are cold with most precipitation above 1500 m in the form of snow [
3]. Spring is characterized by initial continued mountain snow accumulation then eventual snowmelt and runoff, with this timing varying between years [
3,
8]. Summers are dry except during the moist summer Southwest Monsoon, which disproportionately impacts southern Utah and high elevations and can continue into early fall. Otherwise, fall typically has the lowest stream discharge rates due to low soil moisture after low precipitation and high evapotranspiration rates of the summer [
3], and therefore, the cutoff between water years (1 October to 30 September) is chosen in this season. High-elevation snowpack begins to accumulate during late fall as temperatures cool but varies between years [
3]. A warming climate is expected to alter the amount of winter precipitation, snowpack, the intensity and timing of spring runoff [
10,
13], and the strength of the NASM [
5]. Most of the peak discharge in Utah occurs during peak spring snowmelt associated with rain on snow and the NASM rainfall during warm season [
3].
Daily river discharge data were obtained from the United States Geological Survey (USGS). We analyzed all gauges in the state, including watersheds connected to the Great Salt Lake basin, with a consistent record of river discharge from 1980 to 2021 (
Figure A1). Gauges were excluded if they met any of the following conditions: (1) insufficient data for scaling analysis (see below), (2) significant flow alteration in the upstream watershed (i.e., flood control projects, dams, and irrigation diversion); and (3) base flow is insufficient to produce nearly continuous discharge data at a gauge location.
Since climate data are not consistently measured at river gauge locations, daily mean air and mean dewpoint temperature and precipitation were obtained from the Parameter-elevation Regressions on Independent Slopes Model (PRISM,
https://prism.oregonstate.edu (accessed on 17 March 2022)) [
32,
33]. Studies found that this interpolation model has less climatological error in terms of temperature in complicated terrains such as the western United States when compared to other models such as DAYMET and WorldClim and is superior to many other methods to interpolate point station data [
32,
34]. Data from grid points closest to the geographical coordinates of the USGS gauge stations (
Figure 1) in the discharge data were selected for scaling with the USGS gauge data.
Scaling analysis was used to evaluate the meteorological conditions associated with extremes in daily mean stream discharge values [
20]. These extremes are analyzed in association with daily mean (TMean) and dewpoint (TDMean) temperatures. First, we computed the 95th percentile of daily discharge (Q) at each gauge for 0.5 K (for TMean and TDMean) bins. For the days exceeding this threshold, the median of the meteorological variable is calculated (M). To ensure an appropriate sample size, a minimum of 50 data points is required in each 0.5 K bin. The scaling of extreme discharge, Q, is then estimated by Equation (1)
where
β1 is estimated through regression analysis and the scaling of Q is obtained through an exponential transformation of the regression coefficients, as shown in Equation (2) [
20].
This process was applied to daily discharge for all days (total scaling) for the period of 1981–2021 and we also compare these results with scaling analysis which is confined to days from March to June (runoff season scaling). We then calculated scaling based on 3- and 5-day running-mean meteorological variables to account for thermal loading of deeper snowpacks. Stream discharge in Utah is mainly driven by runoff from spring melt of mountain snowpack [
3,
35]. Hence, to highlight seasonal effects and biases in our results, we broke down scaling by month and focused on the runoff season (i.e., March to June). For instance, the low temperature bins, especially those below the freezing point, were mostly sampled from winter months since most gauge locations were at higher elevations (above 1500 m) and experienced long periods below freezing every year. Thus, river discharge was reduced to baseflow, and the estimated scaling relationship may be biased from pervasive low-flow conditions associated with cold temperatures and frozen precipitation during winter. We also calculated long-term trends in annualized discharge tied to the water year (October 1 to September 30) for comparison to scaling.
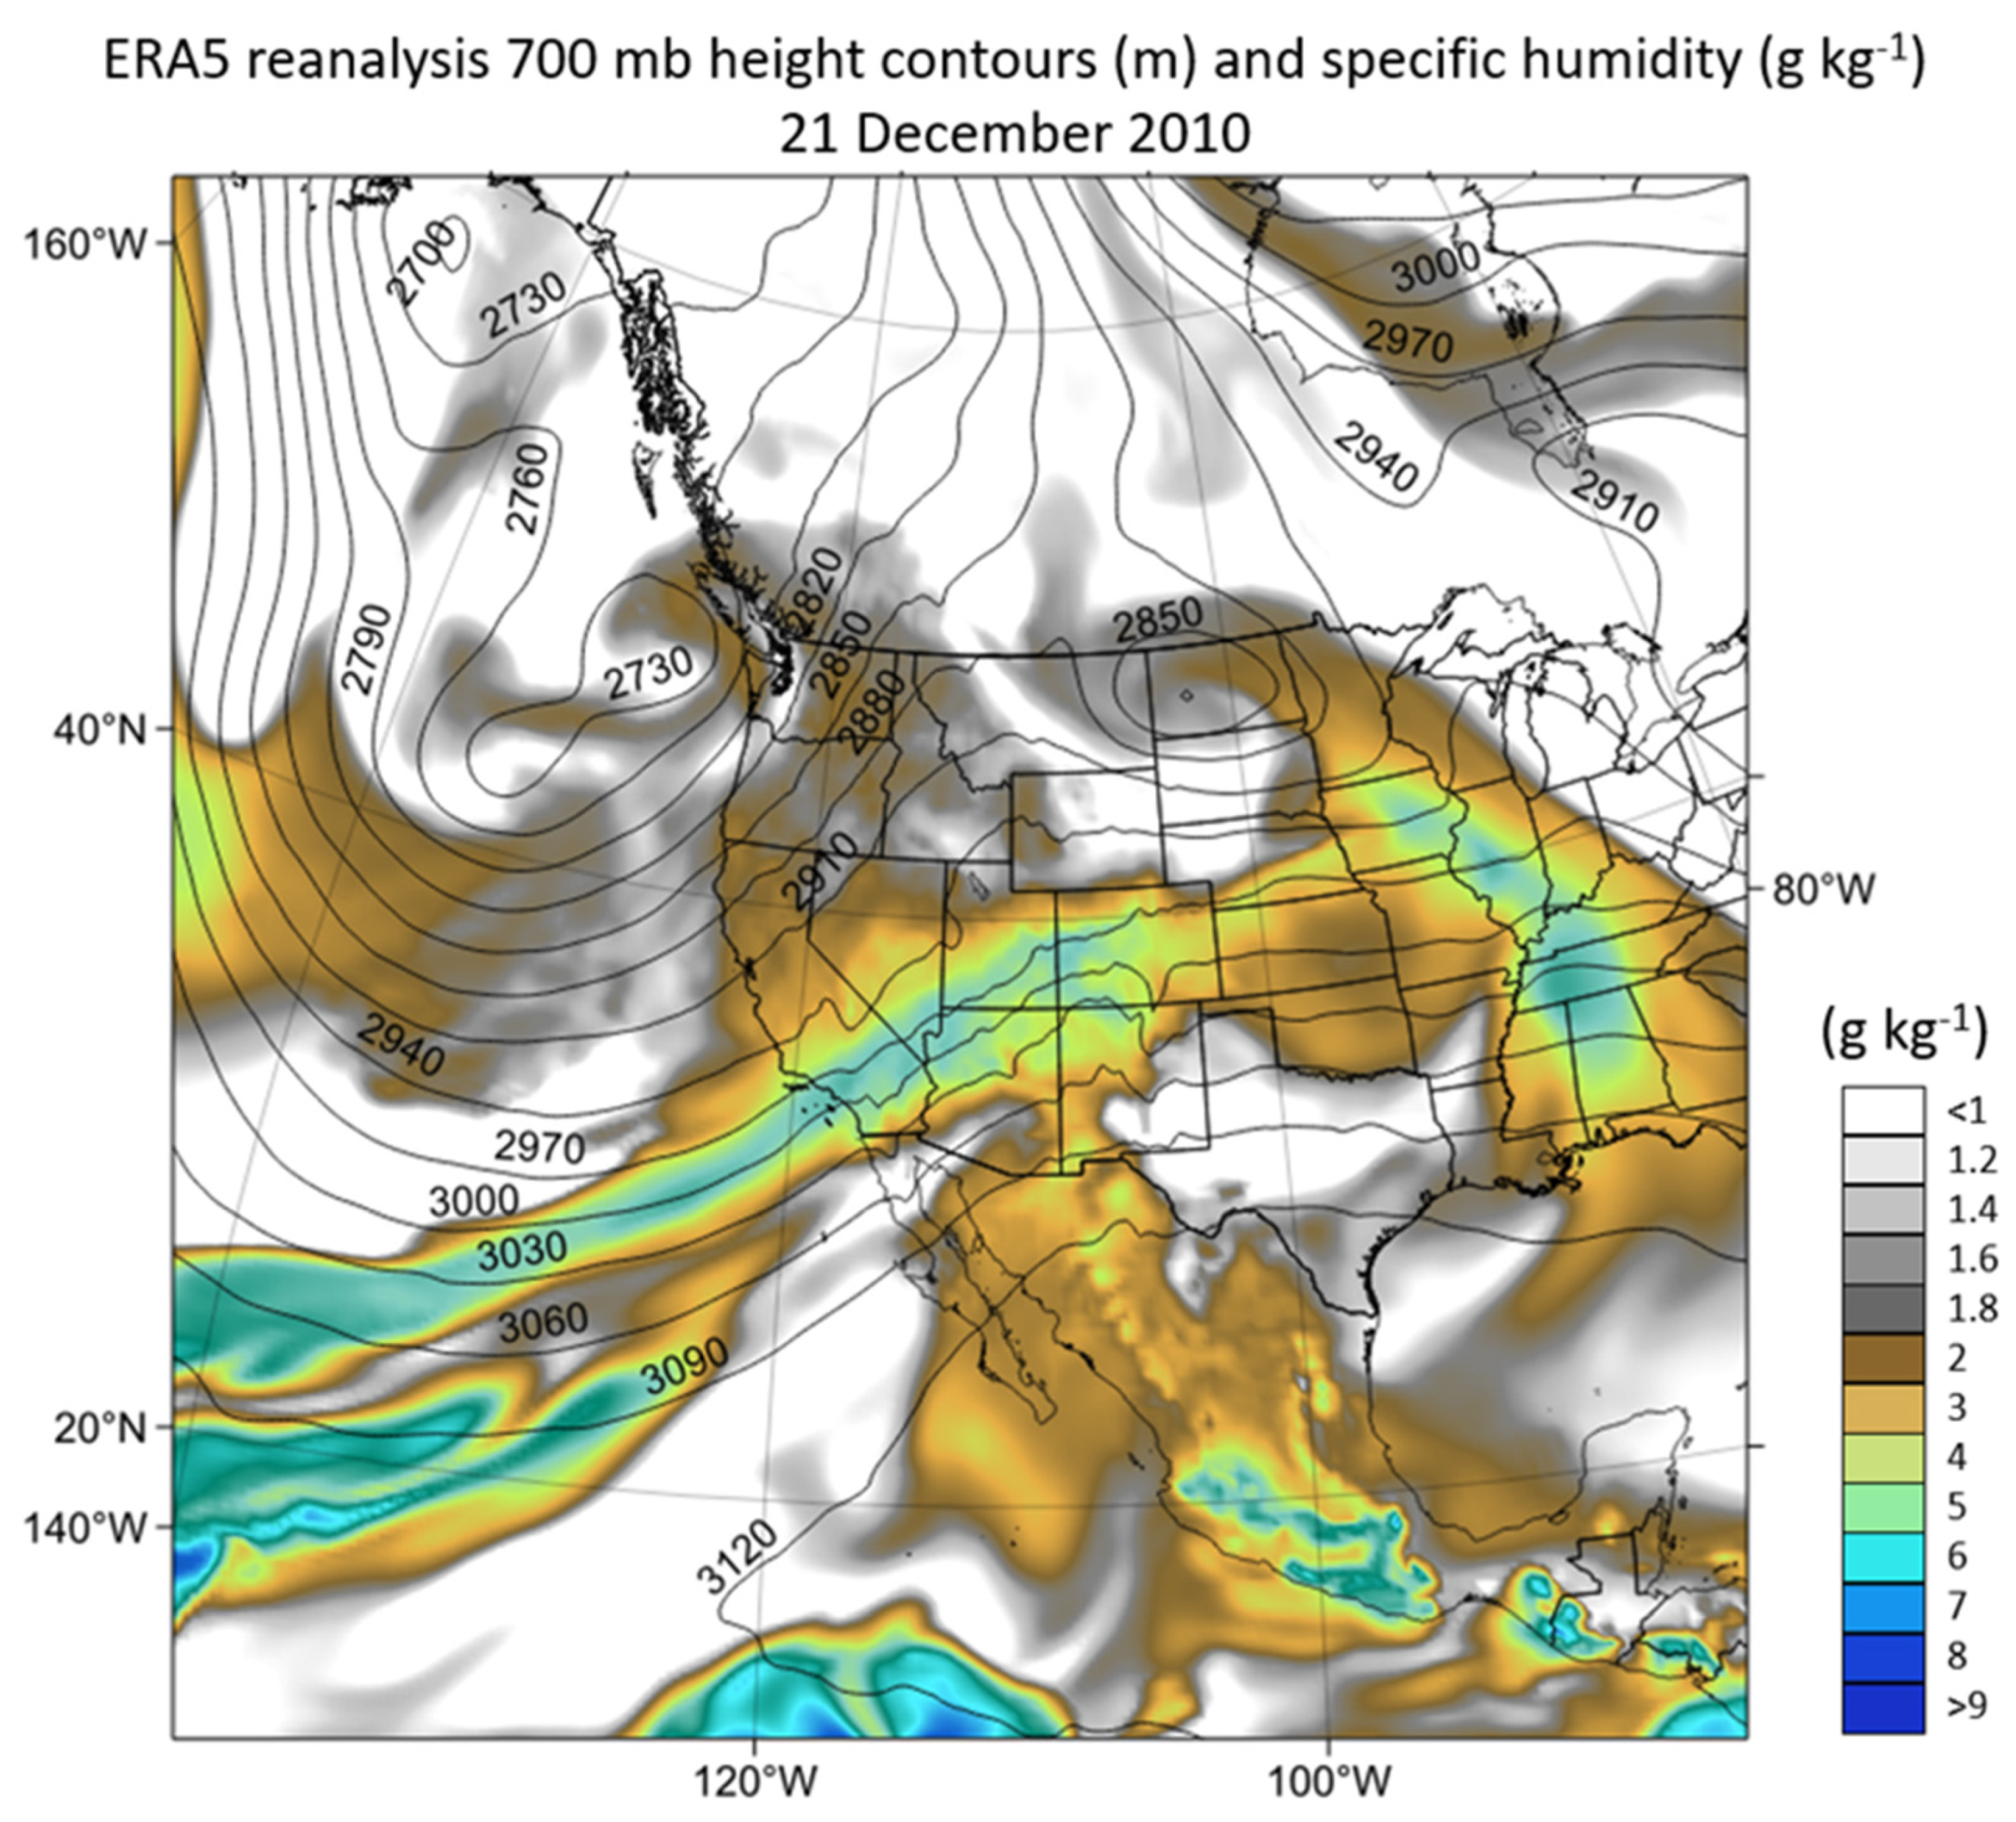
Individual extreme events were evaluated for further comparison with the scaling of extremes to diagnose the seasonality and geographical distribution of the main drivers of extreme discharge. PRISM precipitation data, along with temperature and dewpoint temperature, were compared. The fifth-generation ECMWF reanalysis (ERA5) data were also used to determine the synoptic pattern associated with each event [
36].
3. Results
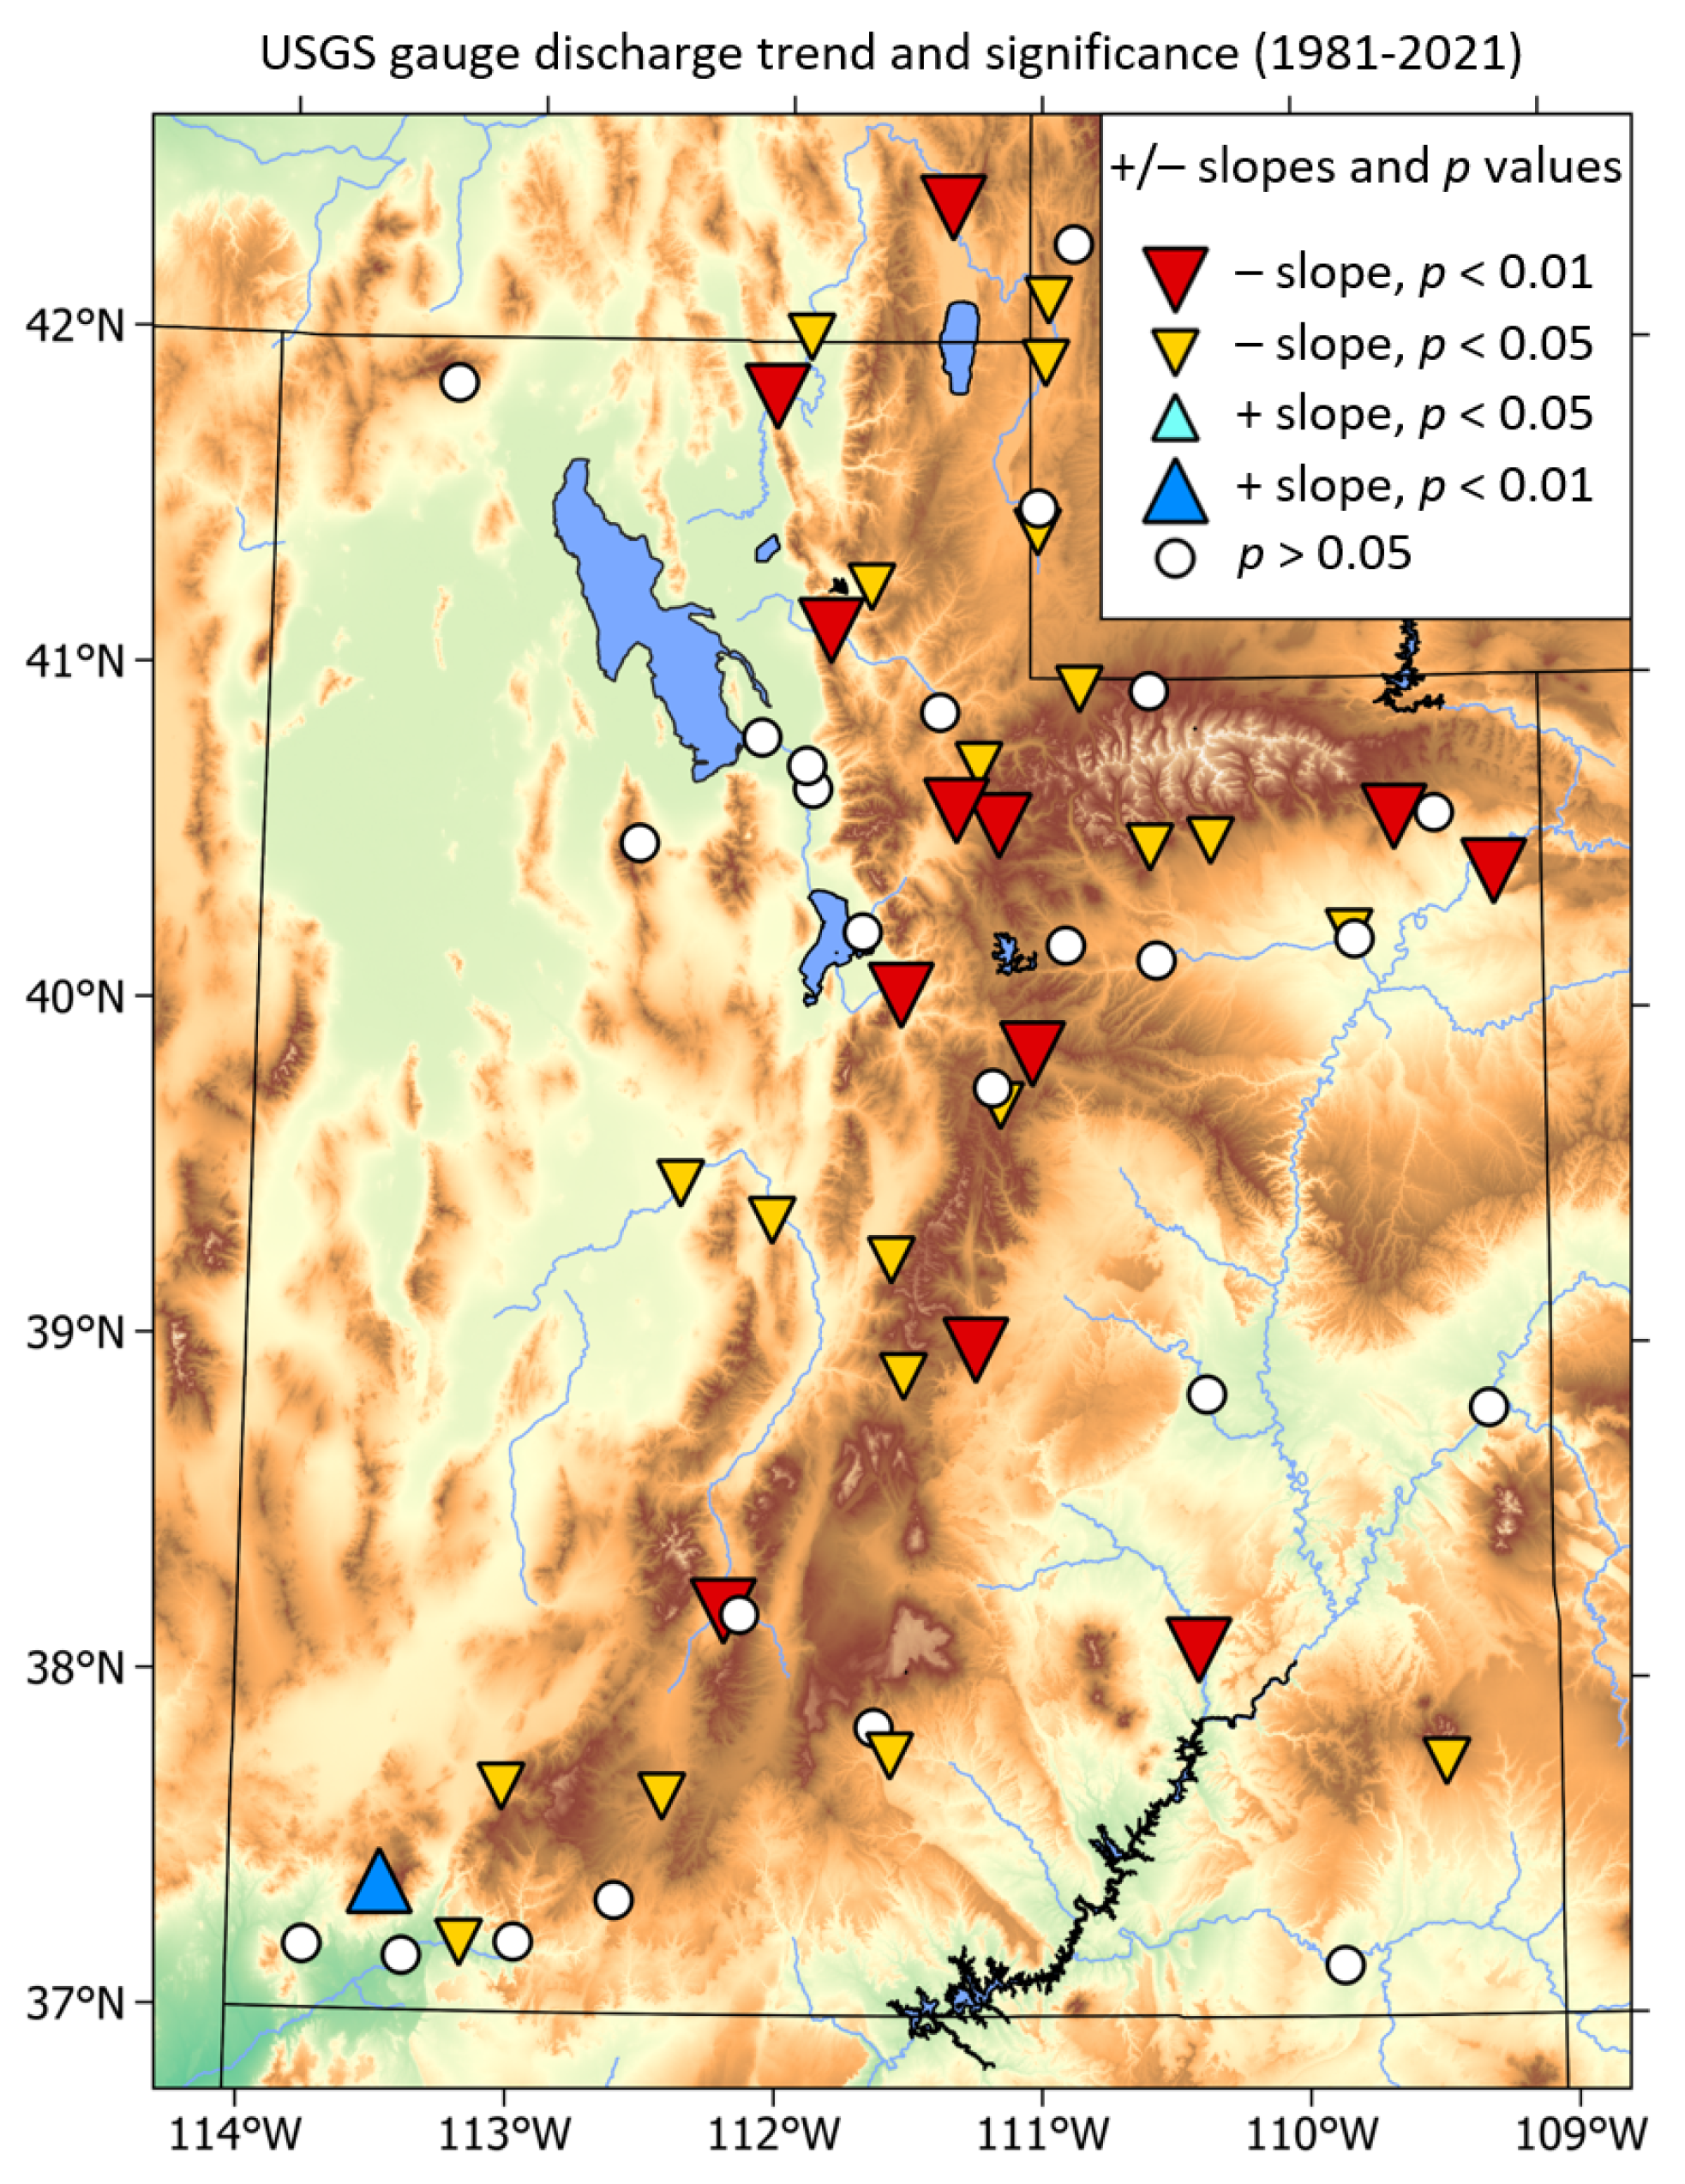
The long-term trend of water-year discharge during 1981-2021 exhibits a general decline at most of the USGS gauges (
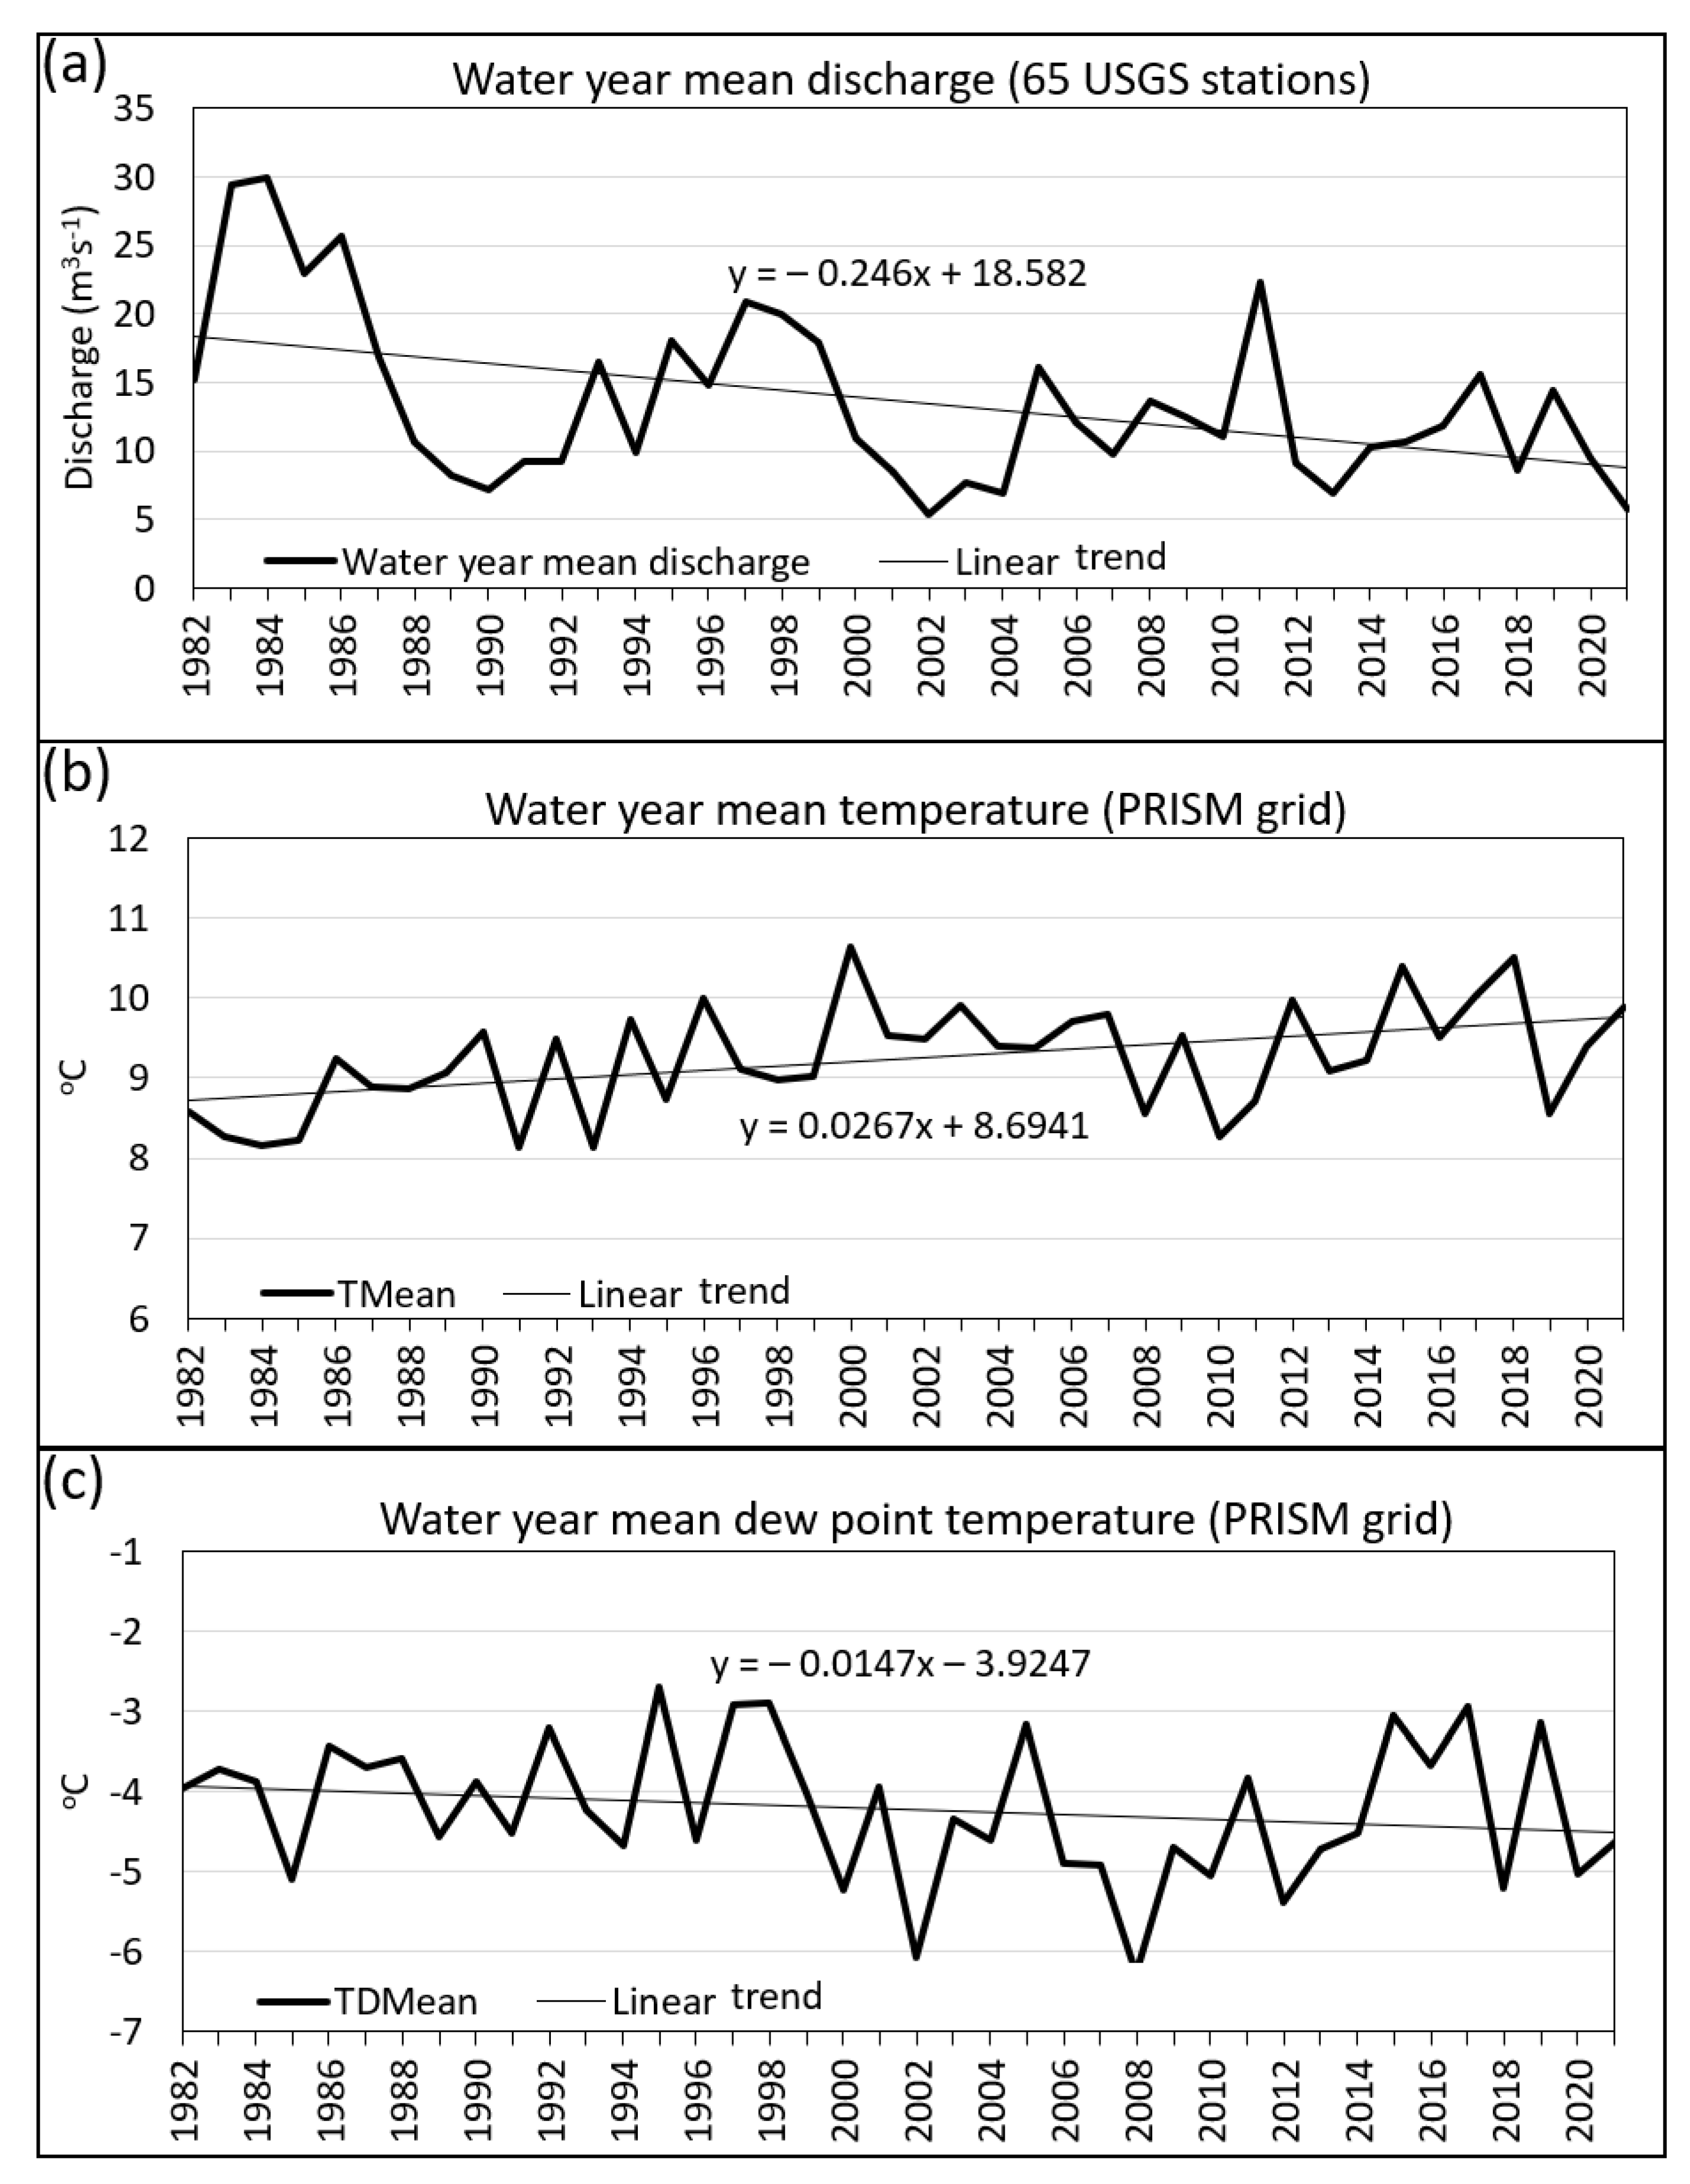
Figure 1). In terms of time scale, the overall trend is significantly declining during the study period, but with multi-year to decadal variability (
Figure 2a) which is also seen in surface-air and dewpoint temperatures (
Figure 2b,c). The greatest discharge values are in the early 1980s during the anomalous wet years during that time with a prominent decline thereafter. Even discounting the early 1980s, there is still an overall decline since 1986, which has been noted in other studies, and has generally followed the declining trend of the Great Salt Lake [
2,
29].
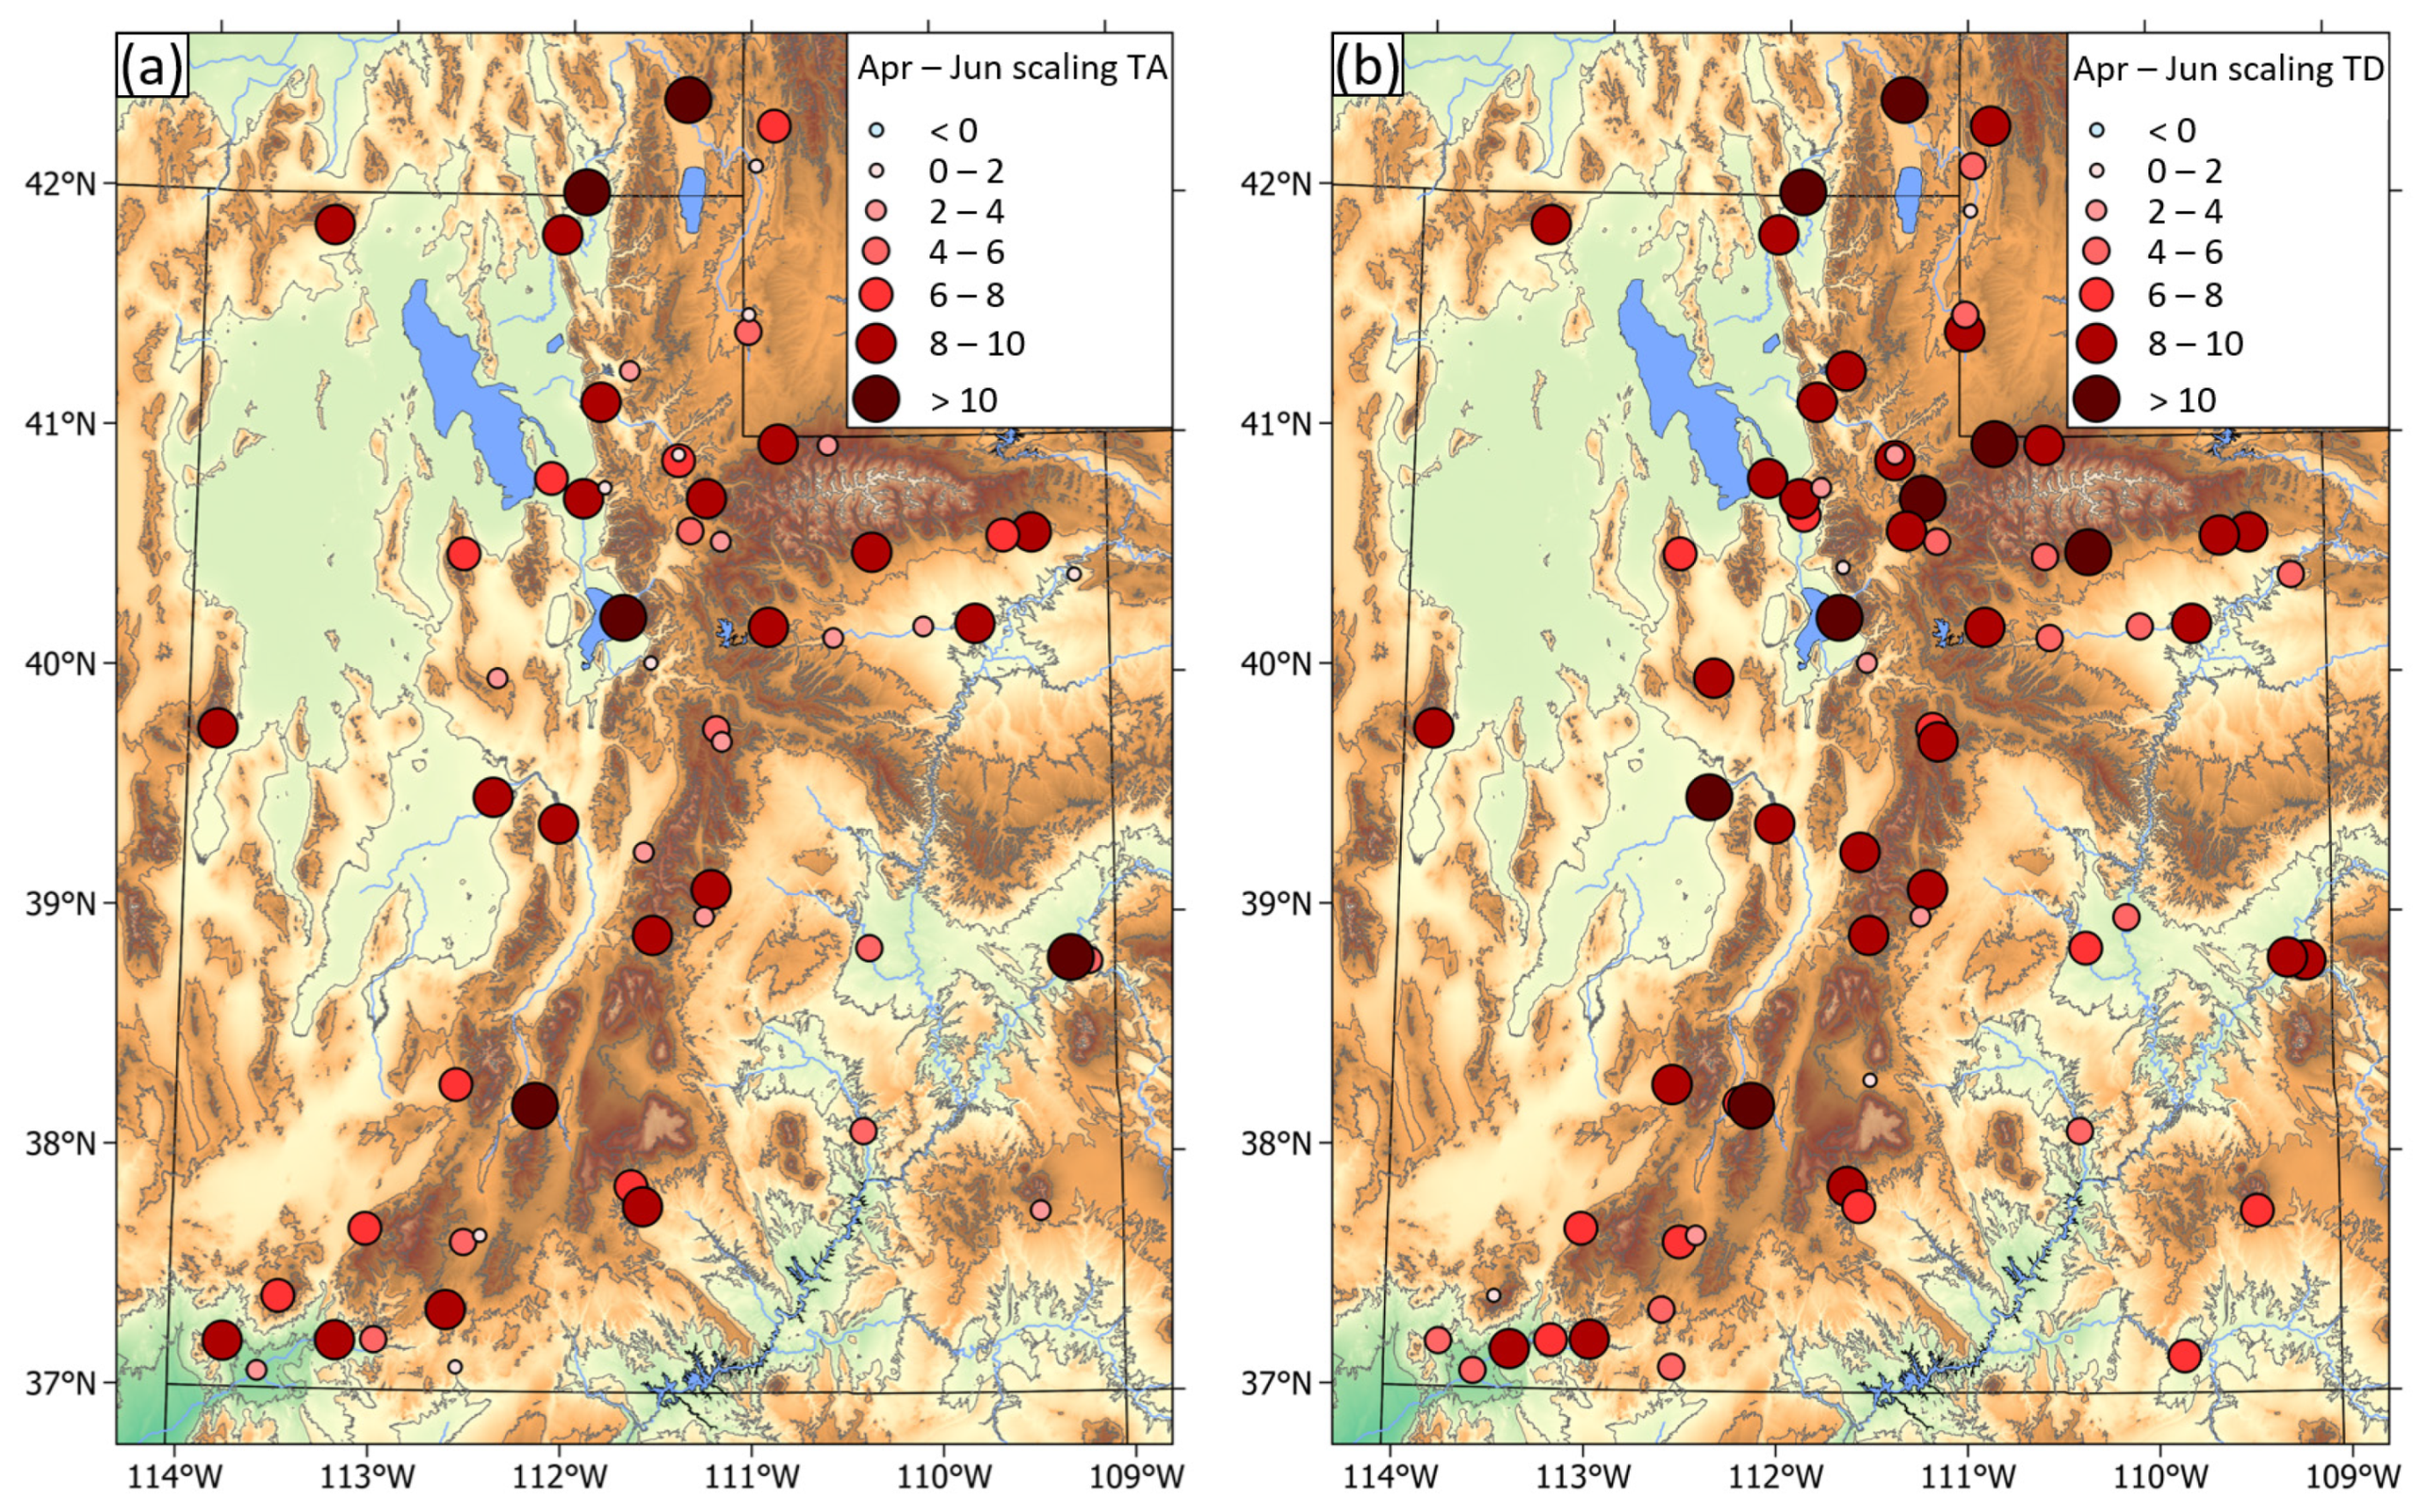
Despite a declining trend in discharge, positive scaling rates of discharge extremes with surface-air temperature and dewpoint temperature are identified across almost all the USGS stations in Utah (
Figure 3). Meanwhile, the scaling rates of discharge extremes with respect to dewpoint temperature (
Figure 3b) tend to be slightly higher than those with respect to air temperature (
Figure 3a). This echoes previous studies that suggest the scaling of extreme precipitation corresponding to dewpoint temperatures are closer to the CC scaling than the scaling using air temperature [
20,
25].
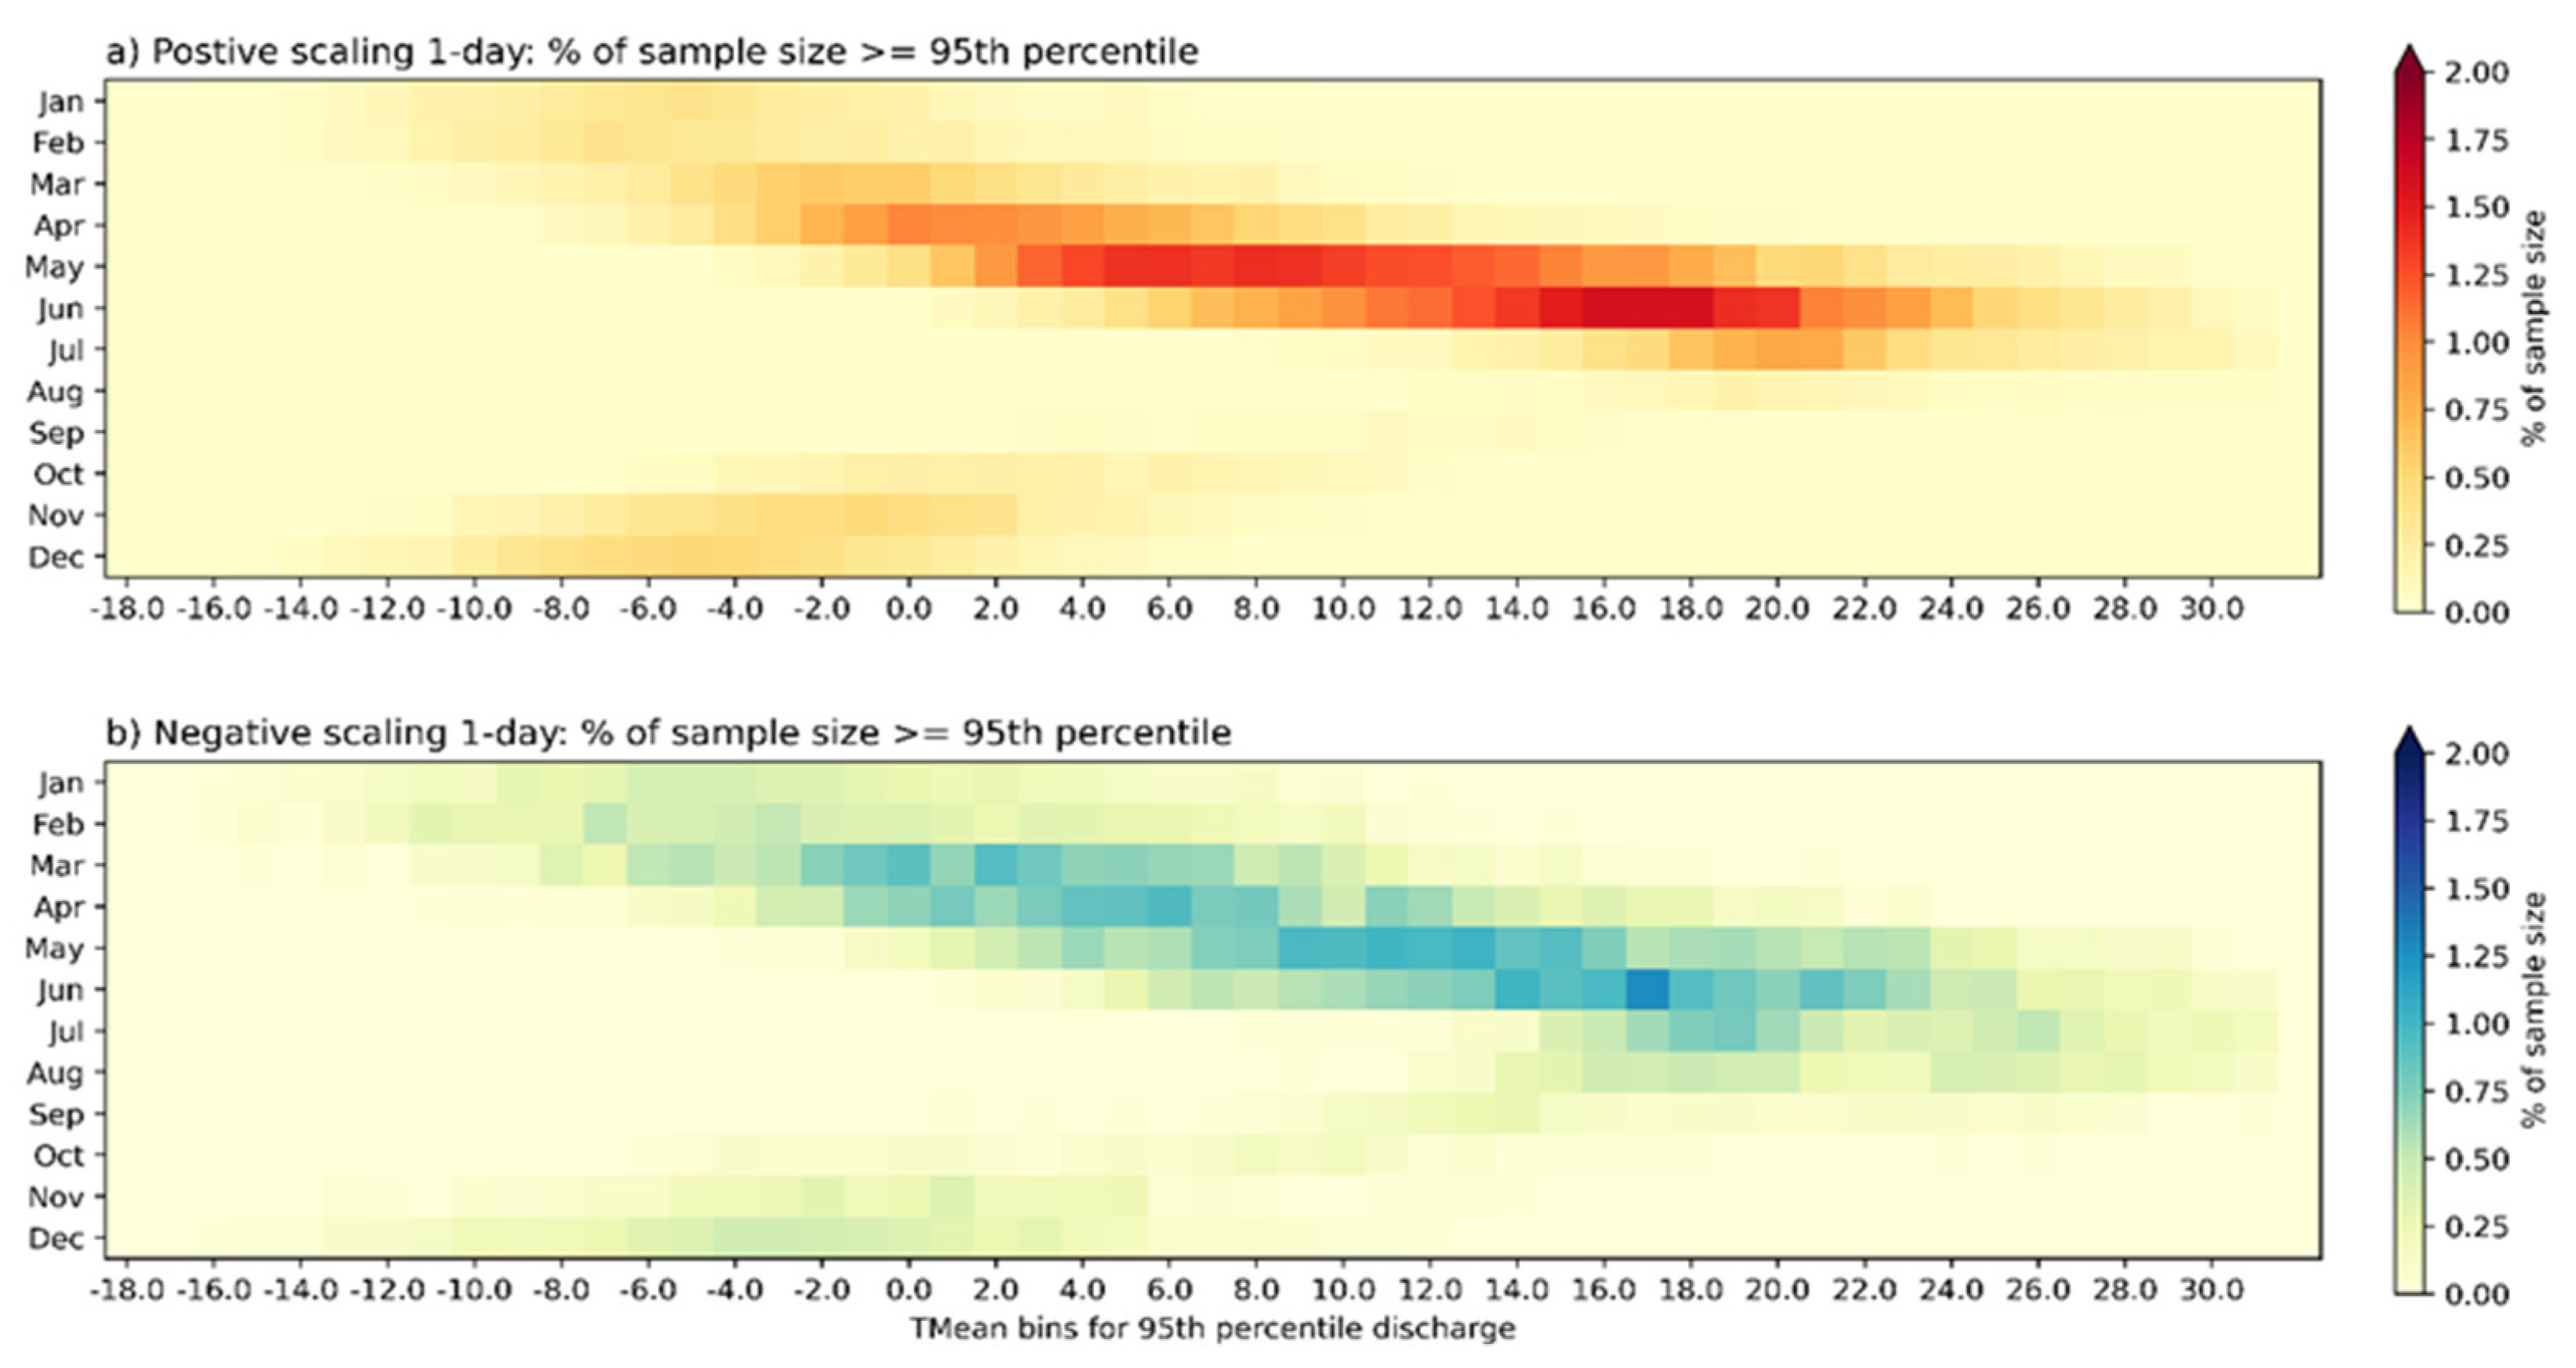
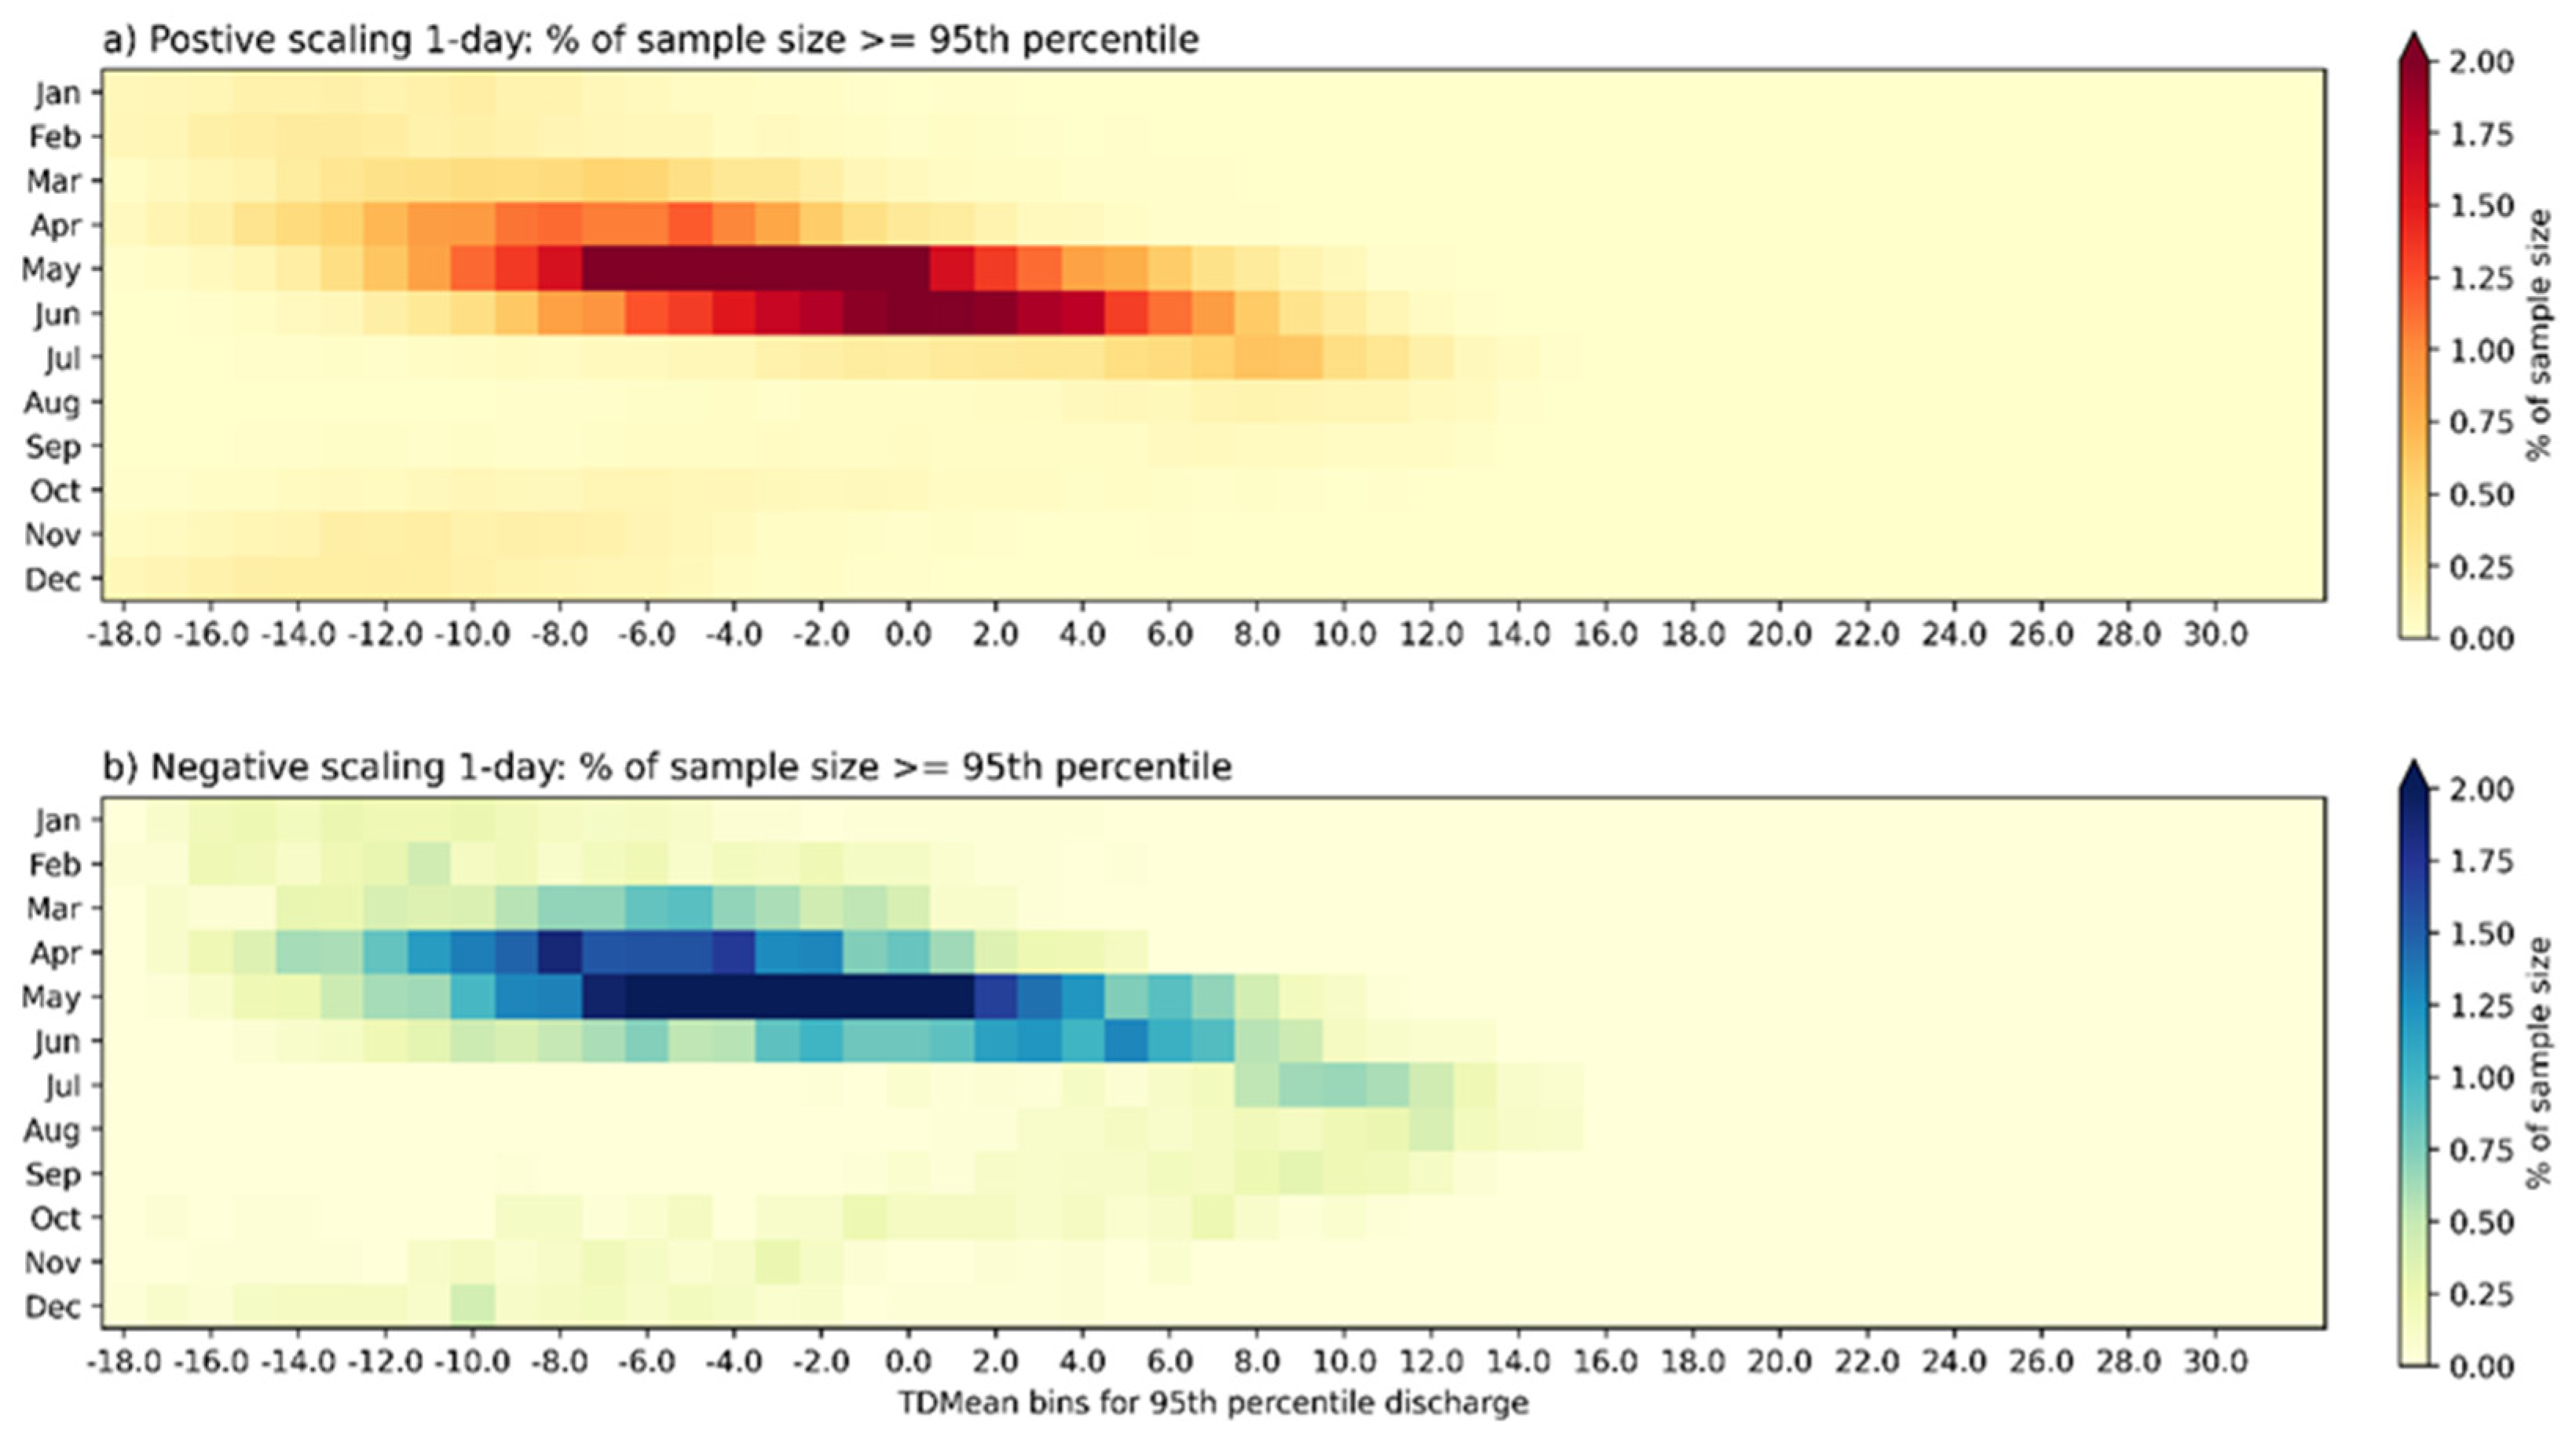
When aggregated by month, the scaling rate of extreme discharge shows a clear seasonality with a strong preference to the April to June timeframe, matching that of the snowmelt season with greatest sample size occurrence in May and June, coincident with the climatological peak of snowmelt (
Figure 4a). Much smaller secondary maxima appear in the late fall and winter, tied to monsoonal precipitation and atmospheric river events (
Figure 4a).
When comparing TMean and TDMean (
Figure 4 and
Figure 5), the distribution across temperature bins is much smaller for TDMean than TMean, with the greatest sampling again ranging in the spring snowmelt season with maxes in May to June. As with TMean, secondary elevated occurrence lies in fall (monsoon) and winter, probably associated with NASM and atmospheric river, respectively.
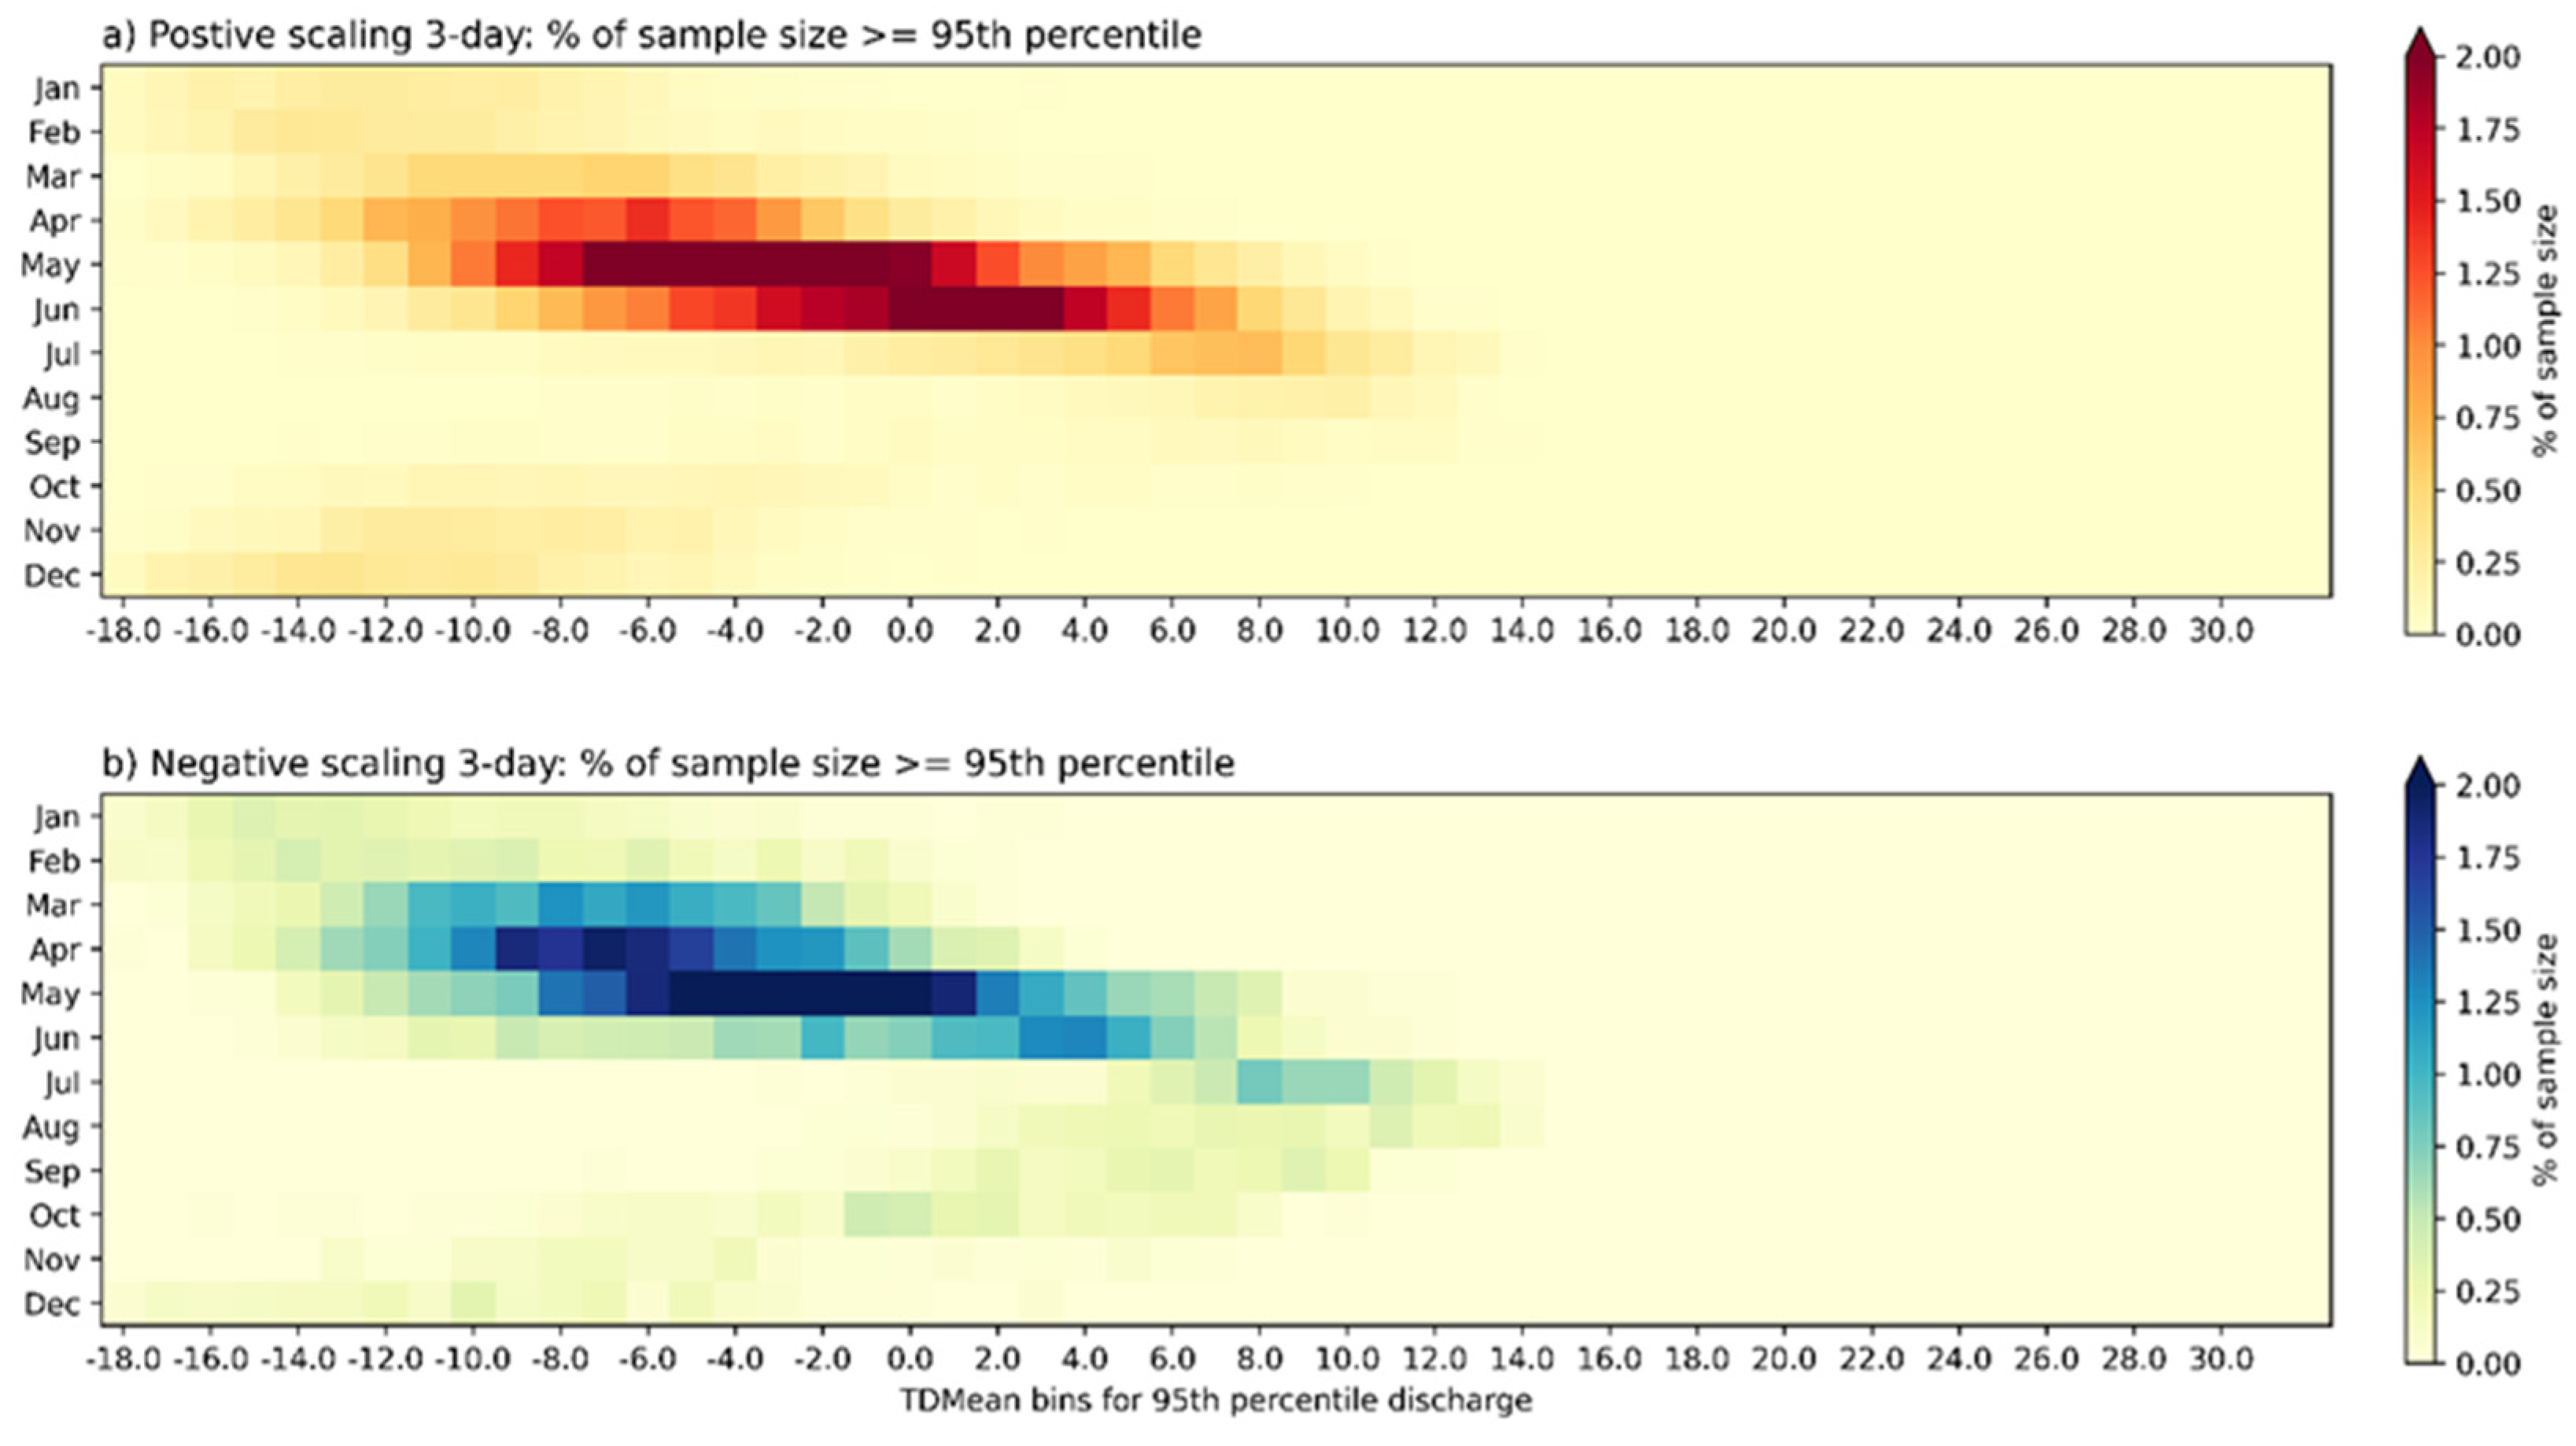
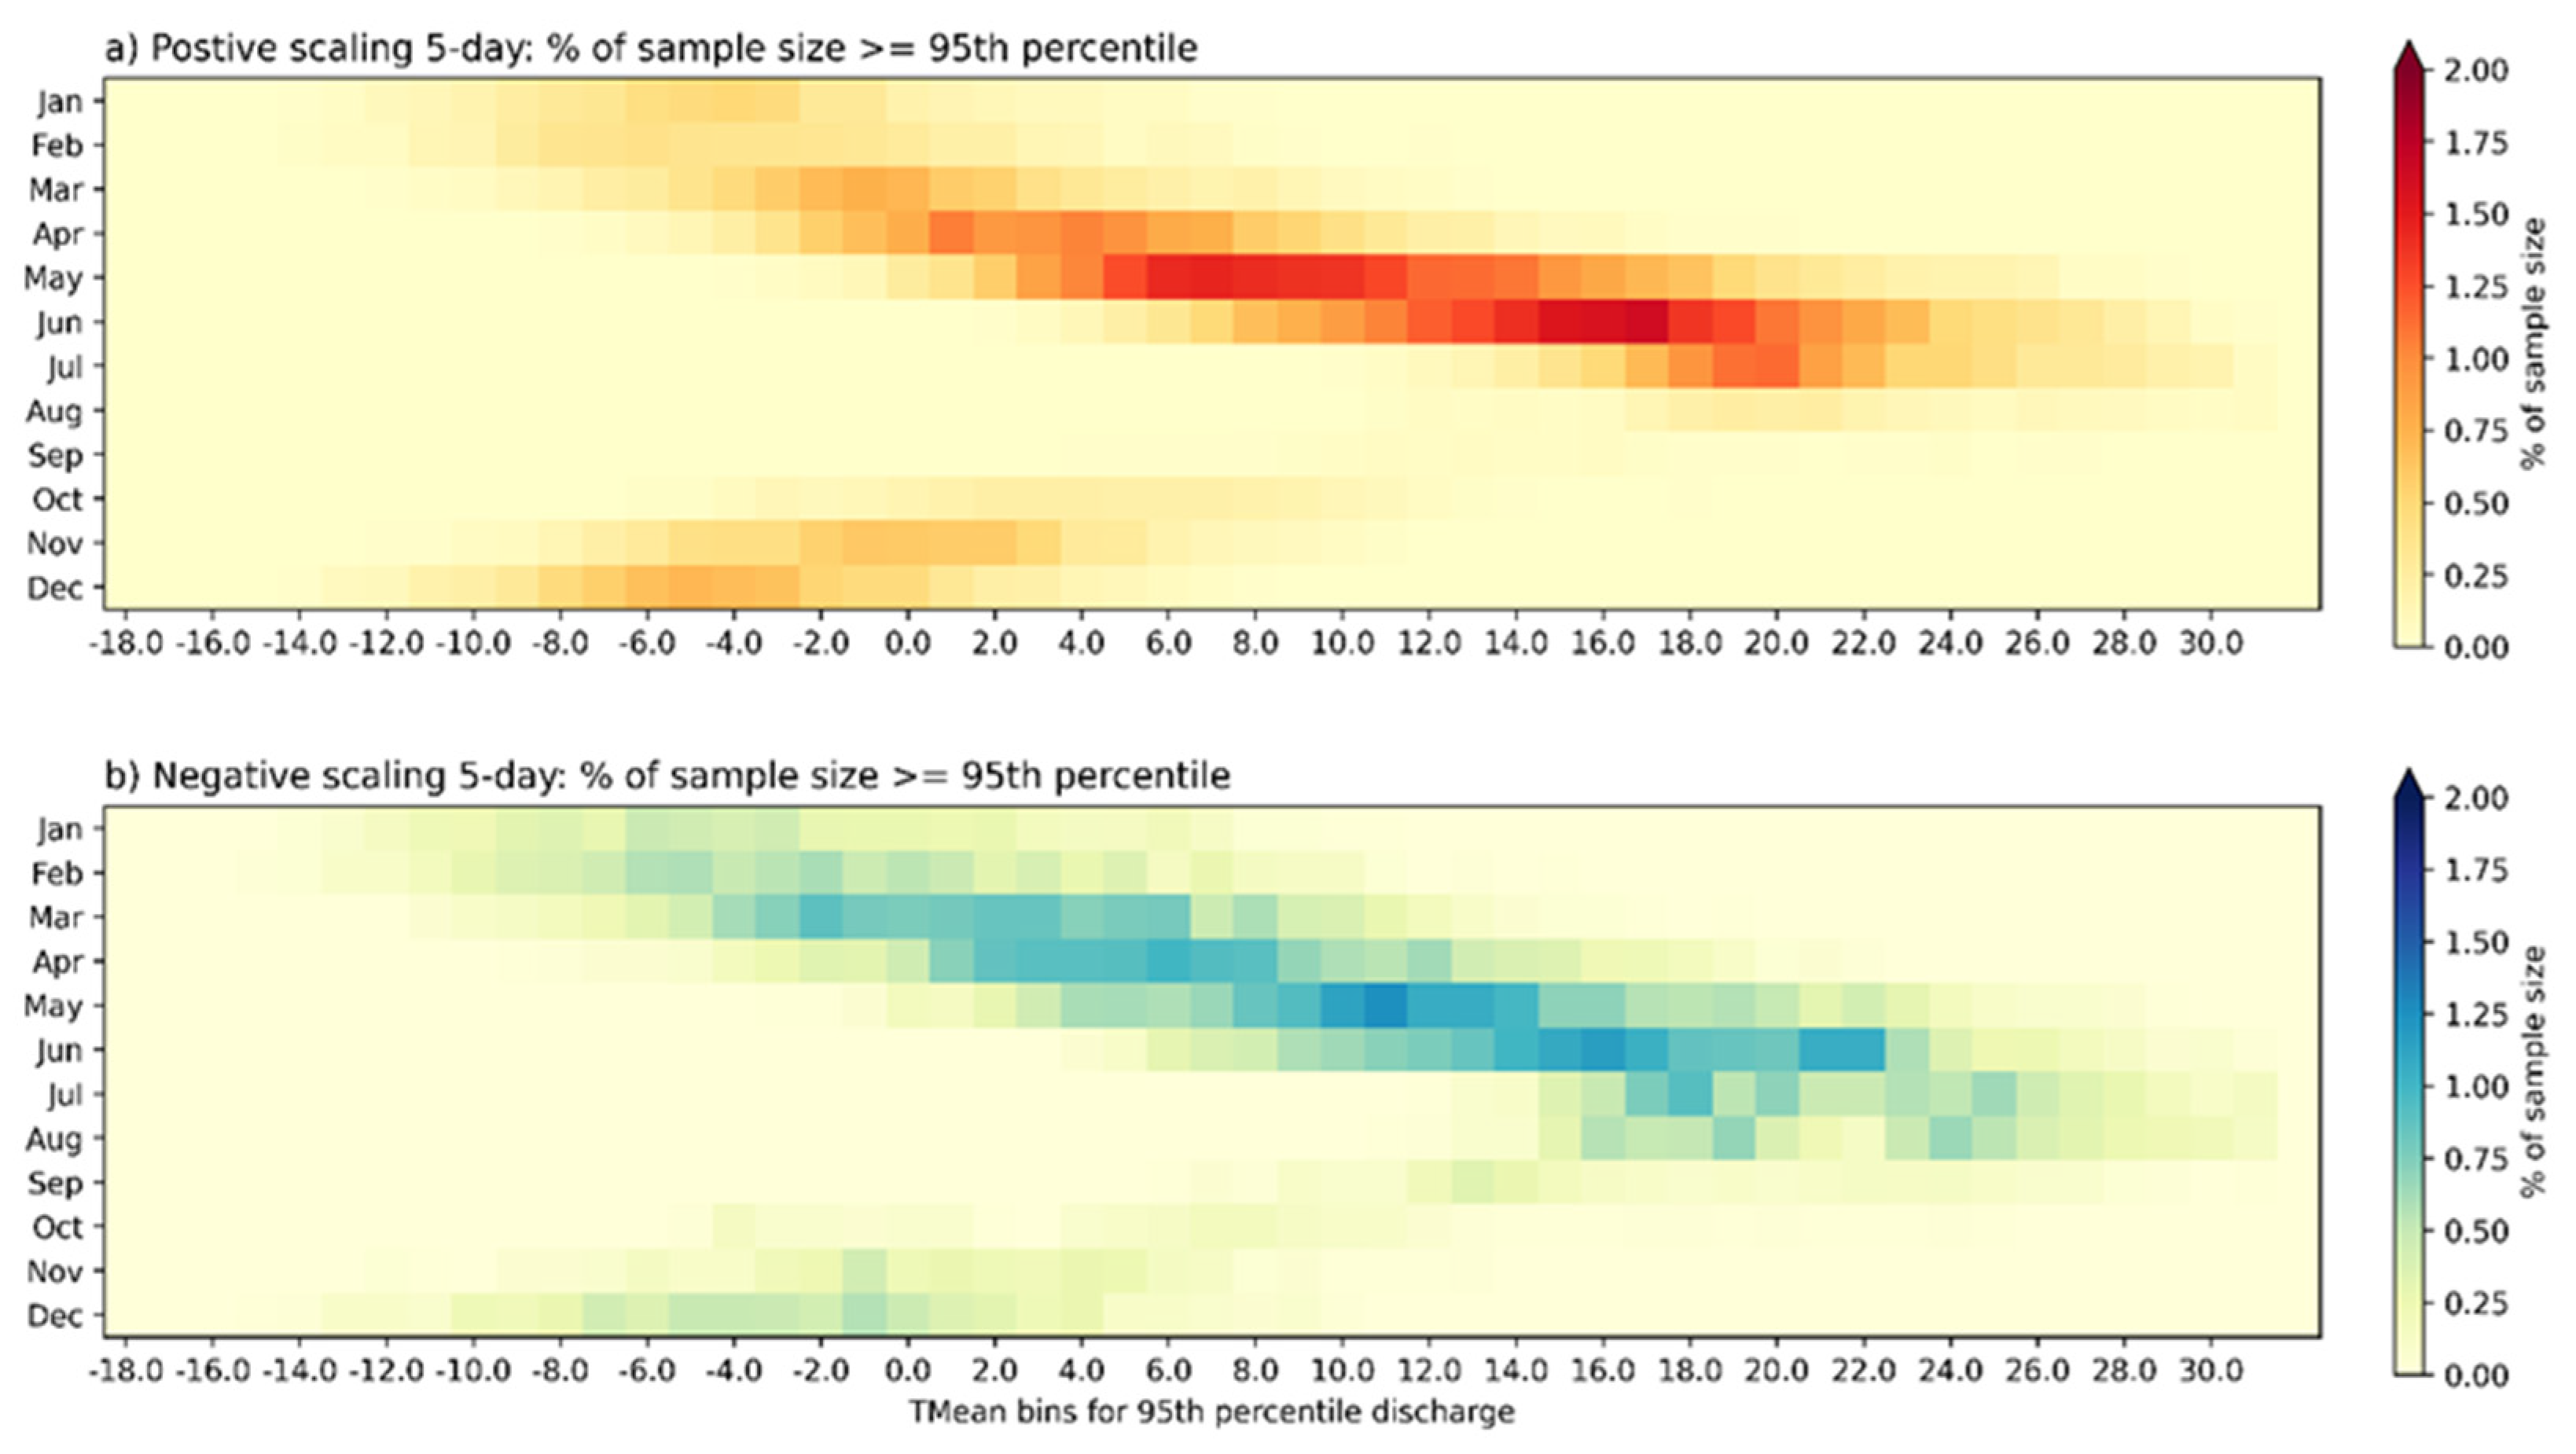
Daily discharge data are scaled with 3-day running mean (
Figure A2 and
Figure A3) and 5-day running mean (
Figure A4 and
Figure A5) to assess sensitivity to multi-day events to account for snowpack thermal inertia and lag time of melting. Some differences are noted between scaling using 1-day and the 3-day and 5-day aggregations.
With an increased number of aggregated days, the spread of higher incidence across temperature bins is narrowed and focused mainly for the spring melt season, but to a lesser extent for the late fall and winter. There is a noted increase in October negative TDMean scaling near the −1 °C to 0 °C bin from the 1-day to 3-day to 5-day aggregation. This is during the latter monsoon season.
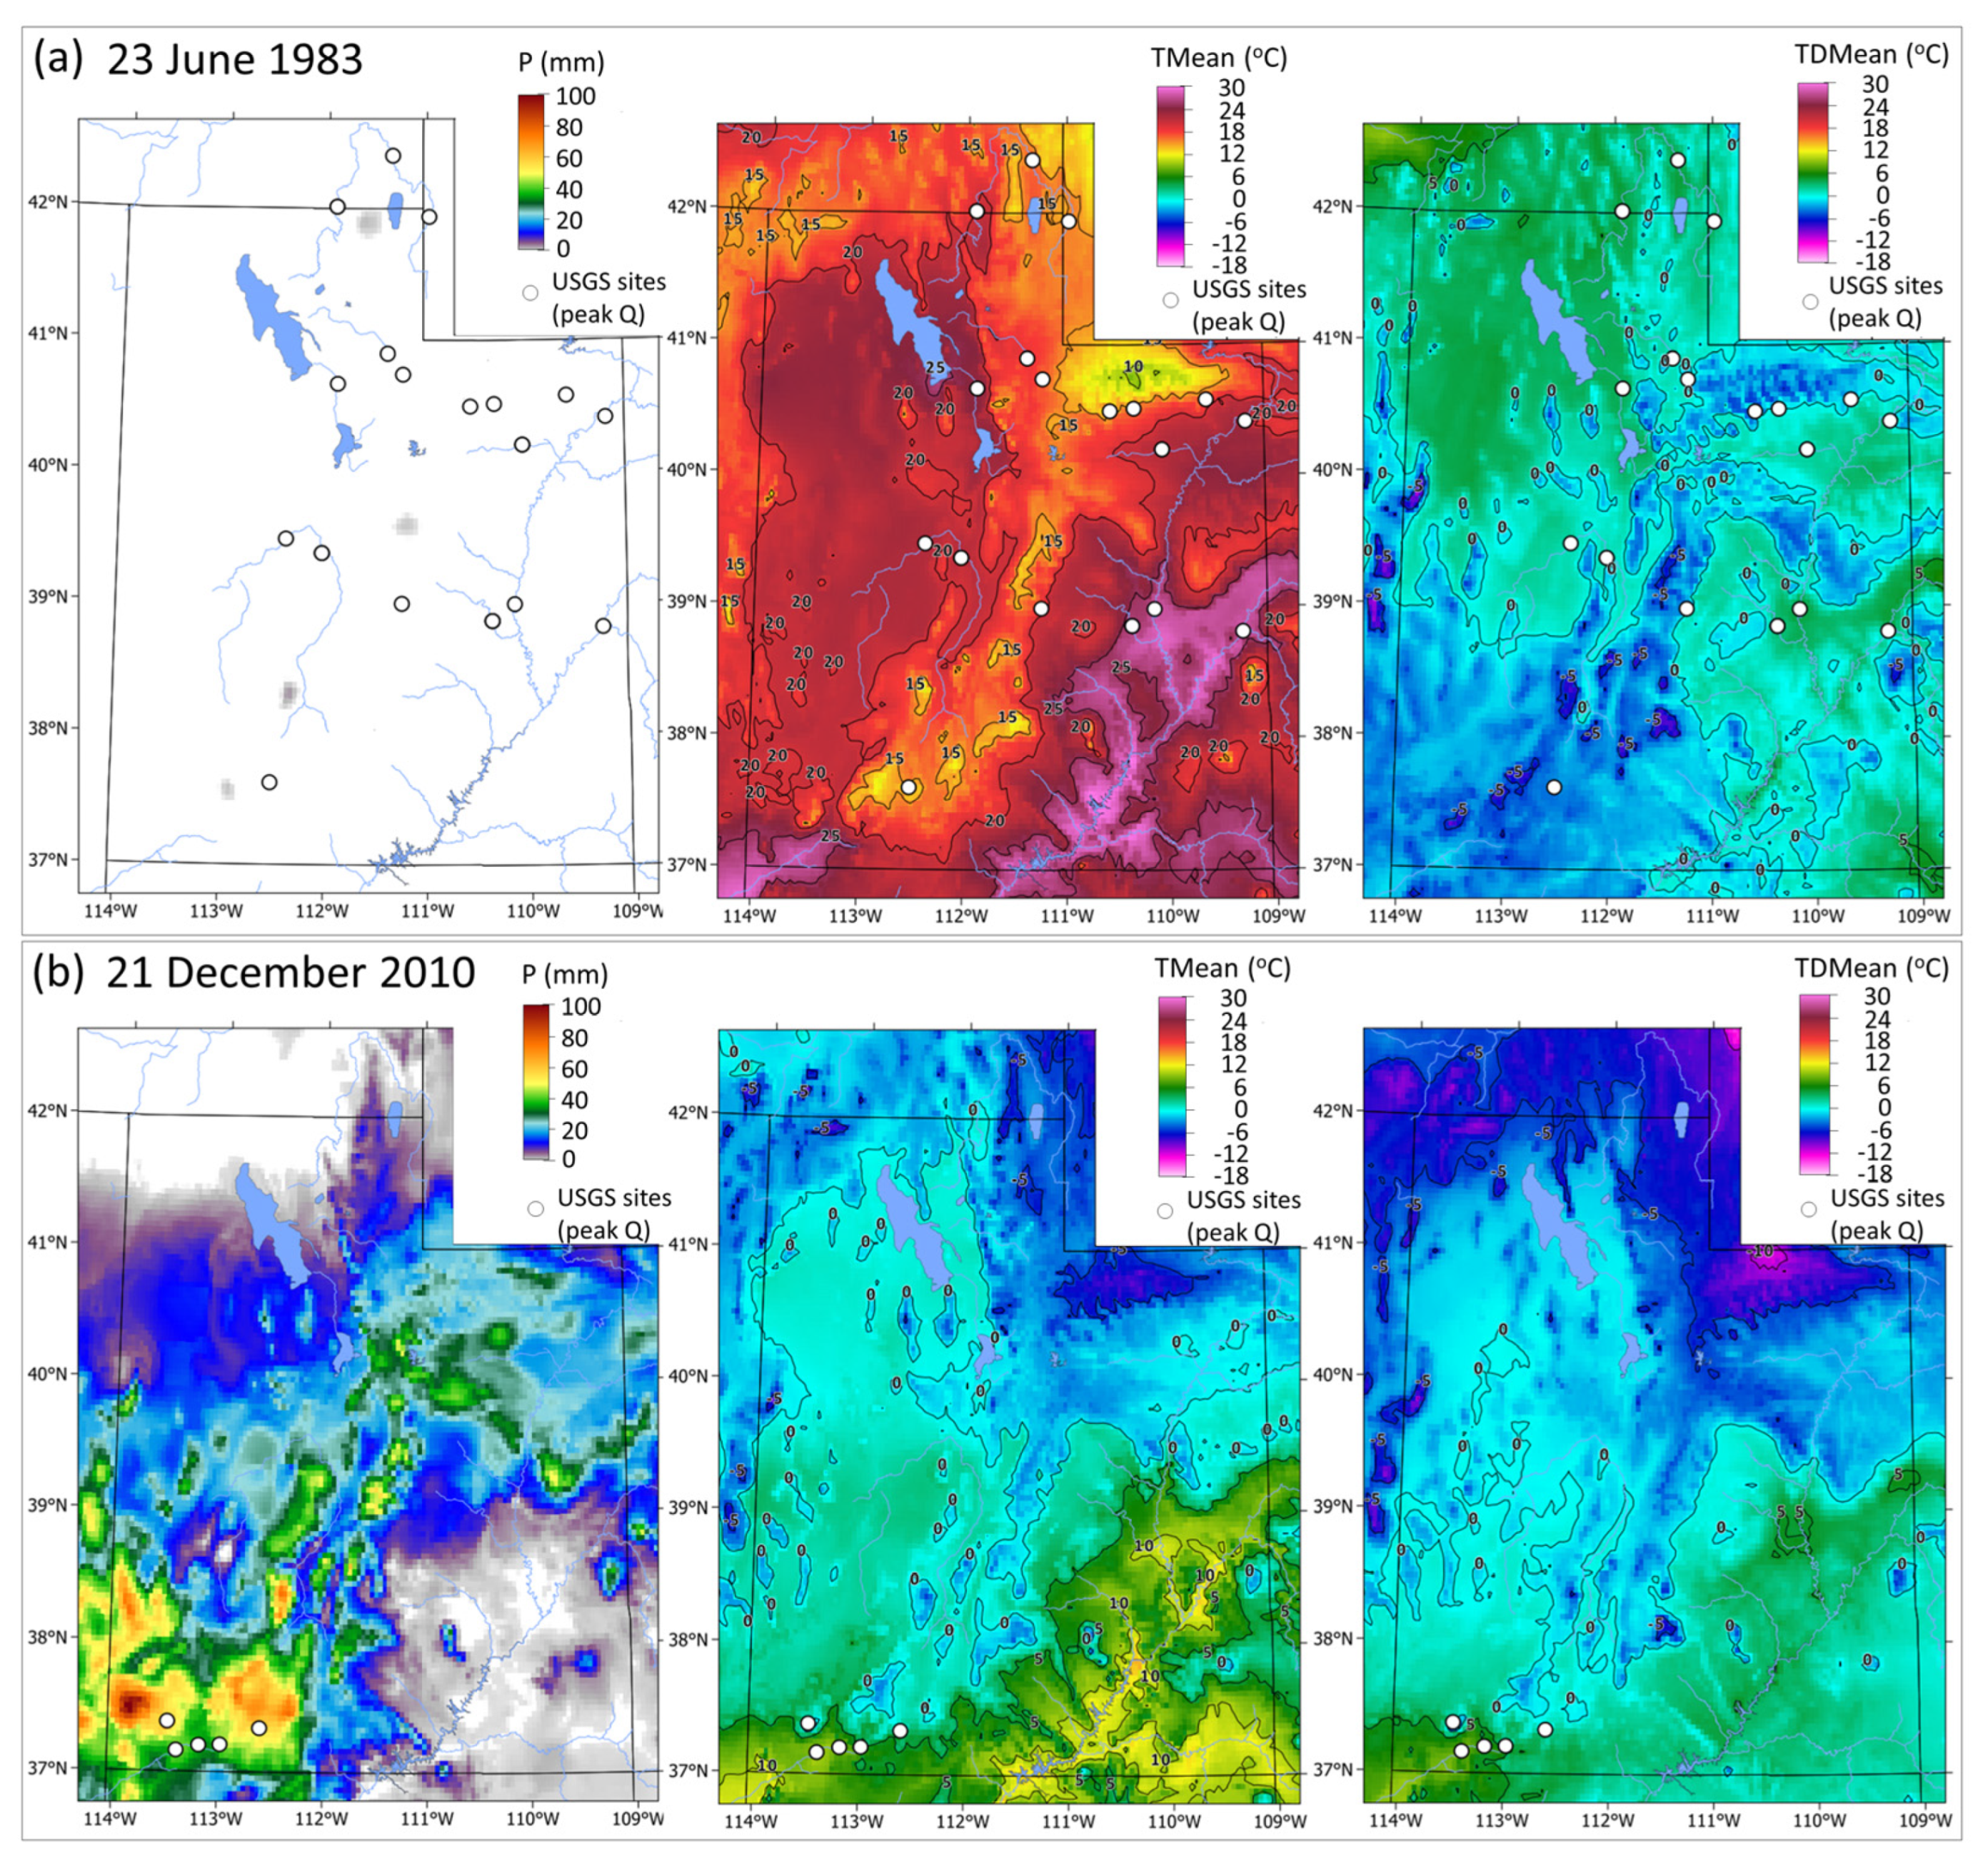
To illustrate the scaling rates corresponding to air temperature and dewpoint temperature, we examined two high-discharge events during 23 June 1983, and 21 December 2010. The first event occurred in the monsoon season, while the second event is a winter precipitation event. For the warm season event, we can notice the marked difference between air temperature and dewpoint temperature (
Figure 6a). In contrast, the difference between air temperature and dewpoint temperature is much smaller for the winter event (
Figure 6b). These results align with the scaling rates at different air temperature and dewpoint temperatures (
Figure 4a and
Figure 5a), particularly during the warm season.
Some of these seasonal peak discharge occurrences were examined. Considering specific dates of maximum discharge, the high flows of the 1980s are prevalent, but a few from the 1990s and 2000s also stand out. The exceptions are the Virgin River and its tributaries, which show the greatest discharge events during wintertime rain-on-snow events brought on by atmospheric rivers (
Figure 7).
4. Discussion and Conclusions
Quantifying the responses of discharge extremes to temperature increase plays a central role in understanding the future changes to the hydrological cycle under a warmer climate. Here, we performed a scaling analysis for discharge with respect to temperature across Utah. Consistent with earlier studies, the long-term trend in discharge for Utah streams is declining, but with a multi-year to decadal variability that, as expected, is also trending with the levels of the Great Salt Lake [
2,
3]. This matches the general decline in overall precipitation noted for the region.
In contrast to a general decrease in average discharge, we found an overall positive scaling of discharge extremes with respect to air temperature or dewpoint temperature. The wide range of scaling results from negative to largely positive, and also speaks to regionality and the heterogeneous landscape and varied topography in Utah. Most locations have scaling rates less than the CC 7% baseline with an average of all 65 sites being just under 5% per °C. This result echoes previous findings in the nearby Rocky Mountain region [
26].
We also explored seasonal variability of scaling rates. Results of the monthly distribution of sample size by temperature bin (
Figure 4 and
Figure 5) clearly show the seasonality and dominance of the snowmelt regime in extreme discharge scenarios, with May and June having the greatest frequency of extreme discharge events. The top discharge events were found to be dominated by May–June peaks, matching the extreme discharge timing for the region in prior studies [
26]. The monthly breakdown also shows the temperature bins of highest frequency increase between April and June. Climatologically, temperatures increase throughout this period, but spring snowmelt and peak runoff can vary from April to June, due to a combination of elevation, anomalous spring warmth, and/or spring rain on snow [
37].
Assessing 3- and 5-day running-average temperatures can capture multi-day heat waves during runoff season that contribute to a large portion of runoff [
37]. Since the thermal inertia required to bring a deep snowpack to isothermal melting conditions is quite large, multiple days were considered. The spread of sample size across temperature bins was narrowed when introducing 3-day and further with 5-day running mean temperatures (
Appendix A Figure A1,
Figure A2,
Figure A3 and
Figure A4). The peak percentages during the snowmelt season centered around 12 °C. A similar effect was seen with TDMean with a narrowing of the sample spread around a dewpoint temperature of −2 °C. However, the smaller secondary maxima in the late fall and early winter in TMean and TDMean hint at other processes. Upon inspection of peak discharge dates at a few select stations in far southwestern Utah, the peak discharge events occur in the latter half of fall and the winter months. This regional dichotomy may be a unique finding, at least for the region.
Although sites near large dams and diversion projects were omitted, some of the larger streams in the study group have reservoirs upstream that may play a role in the interannual discharge trends. In addition, the background of increasing demand for water and higher evaporative loss from increasing temperatures could also contribute to downstream discharge declines. The geography and topography of southwestern Utah combine to increase the chances of rain-on-snow events and high-impact atmospheric river events. The location being further south allows for moisture transport through atmospheric rivers from the southwest, which can largely avoid the Sierra Nevada mountains and retain large amounts of moisture [
38]. In addition, the topography in southwestern Utah is characterized by extensive south to southwest-facing slopes with elevation ranges from 700 m to over 3000 m, which through orographic processes would greatly enhance precipitation from moisture-laden air approaching from either the southwest or south. This would give it some of the West Coast hydrologic characteristics of timing for extreme discharge [
26], since it is the first high-elevation terrain encountered in a southwesterly flow regime. Although atmospheric rivers do penetrate further north into Utah, the long path over higher elevations and initial loss of moisture from either the Sierra Nevada or the mountains in southern Utah would severely limit rain-on-snow and overall event-accumulated precipitation potential.
The consistency of the river discharge and temperature scaling relationships throughout the diverse climatological and hydrological characteristics of Utah suggest that these relationships may hold throughout western North America and elsewhere. While large heterogeneity in watershed characteristics, management practices, and local climate characteristics are present in relatively small spatial scales (sub-continental), our analysis shows that positive scaling between temperature and river discharge extremes occurs through different meteorological and hydrological mechanisms. This work, while focusing on extreme discharge scaling with temperature and dewpoint temperature in a changing climate, enhances the understanding of the effects of climate change on water supply, and could be applied to risk analysis and adaptation, especially in water management. Future work will seek to explore relationships between temperature and river discharge extremes on larger spatial scales and in other regions.

 ,
, 


