Article

Effect of Artificial (Pond) Recharge on the Salinity and Groundwater Level in Al-Dibdibba Aquifer in Iraq Using Treated Wastewater

1
College of Engineering, University of Warith Al-Anbiyaa, Kerbala 56001, Iraq
2
College of Engineering, University of Kerbala, Kerbala 56001, Iraq
3
Department of Civil Engineering, College of Engineering, Najran University, Najran 61441, Saudi Arabia
4
Soil Physics and Land Management Group, Wageningen University & Research, 6708 PB Wageningen, The Netherlands
5
College of Engineering, University of Anbar, Ramadi 21450, Iraq
*
Author to whom correspondence should be addressed.
Water 2023, 15(4), 695; https://doi.org/10.3390/w15040695
Submission received: 6 January 2023 / Revised: 20 January 2023 / Accepted: 9 February 2023 / Published: 10 February 2023
(This article belongs to the Special Issue Water Management for Climate Smart Agriculture)

Abstract

:
Groundwater is one of the most important water resources in Iraq, so efficient management of storage, recharge, and consumption rates is required, for maintaining the sustainability of groundwater supplies. Some of the most valuable methods for ensuring the long-term sustainability of groundwater aquifers are those that provide artificial recharge. This study was conducted to determine the effect of artificial recharge on groundwater levels and quality in Iraq’s Dibdibba unconfined aquifer, utilizing groundwater modeling system software (GMS). Reclaimed water (tertiary treatment) from Kerbala’s central wastewater treatment plant (WWTP) was used as raw water to recharge the aquifer. The effects of this artificial recharge were determined using built-up groundwater flow (MODFLOW) and dissolved transport (MT3DMS) simulation models. Model calibration and validation were implemented based on groundwater monitoring data from 2016 to 2017. The model matched observed elevations at R2 = 0.96 for steady state and R2 = 0.92 in transient state simulations. After the 3D numerical model was calibrated and validated, two scenarios were explored based on the daily production of 5000 and 10,000 m3/d from Karbala’s WWTP. The results indicated that the pumping of the treated wastewater through the pond would increase water levels by more than 20 cm for more than 78.2 and 110 km2 for pumping rates of 5000 and 10,000 m3/day, respectively. More than 40 km2 would be added (reclaimed) to the agricultural areas in the region as a result of the use of artificial recharge using a pond. Groundwater quality was also improved, as the TDS decreased by more than 55%, down to 1900 ppm, and the EC decreased by more than 68%, down to 1500 µ.S/cm. The findings of this study can assist decision-makers in developing strategies to reduce water scarcity and adapt to climate change.

1. Introduction

Water is an essential natural resource for food production and life in general. Increasing demands for water have resulted in scarcity in several countries around the world. This has driven investigation of the use of groundwater as an alternate water source, to compensate for a lack of surface water. In areas with dry and semiarid climates, groundwater has been the main water source of irrigation, and in the Middle East, groundwater is the primary supply of domestic water [1,2].
Iraq is experiencing an enormous increase in water demand, due to a growth in population and economic development. Currently, there are limited supplies of water, caused primarily by the significant reduction in the quantities of surface water supply coming from Iraq’s neighbors Turkey, Iran, and Syria, and the lack of a long-term agreement with these countries to improve water quotas [3]. Therefore, groundwater is becoming an alternate source, to compensate for the lack of surface water. However, groundwater is facing its maximum drawdown, caused by excessive use of groundwater due to climate change and the mismanagement of water resources [4,5]. In Iraq, natural groundwater recharge of unconfined aquifers has been greatly affected in the last twenty years by uncontrolled extraction, higher temperatures, and less rain [6,7]. In addition, variations in vegetation and evapotranspiration, both indicators of soil dryness, lead to greater losses of moisture in the soil and less underground water recharge [8].
One method to sustainably control the reduction of groundwater levels in arid-region countries such as Iraq is to use artificial water recharge [9,10,11,12]. Generally, artificial recharge can be performed in two ways: pumping using wells or water filtering using ponds. Pumping using wells is relatively expensive and requires continuous energy to maintain the pumping operation, while recharging water using ponds is less expensive. In addition, ponds and other open water bodies contribute to improving the environment and reducing temperatures, as well as being used as tourist attractions. On the other hand, the evaporation losses are greater in these surface water ponds compared to wells, but this loss can be minimized and compensated for with the availability of large amounts of raw water. According to previous research [13,14,15], both the amount and quality of groundwater can be improved by using treated wastewater (TWW), which is viable when traditional sources of freshwater are severely limited. Treated wastewater can be used as an alternative supply source in a number of ways, including irrigation to satisfy agricultural supplies and artificial recharge to aquifers to limit the reduction in groundwater. These are common applications in countries including the United States, Canada, the Netherlands, Mexico, France, Brazil, Qatar, Egypt, Saudi Arabia, China, Cyprus, and India [16,17,18]. Using the artificial recharge method has many benefits, such as being able to keep treated wastewater outflow and excess storm water for future use. Moreover, groundwater can be artificially recharged to prevent, or reduce the amount of, saltwater getting into coastal aquifers. In some aquifers in Tunisia, artificial recharge using ordinary water has been shown to raise the water table and enhance the quality of water. Following the artificial recharge of wells and over a six-year period, the Teboulba coast aquifer (Tunisia) saw an increase in groundwater of up to 30 m [19]. Kareem [20] confirmed the positive influence of the artificial recharge in the Jolak basin in Karkuk, Iraq, indicating an increase in the groundwater level. Ali et al. [21] experimentally investigated the susceptibility and efficiency of some aquifers in Salahaddin, Iraq, to artificial recharge, to raise the groundwater table. The study revealed that all of the aquifers studied were reasonably efficient in their reaction to injections, with small variations due to porous media heterogeneity and the depth of unsaturated regions, which created a varying permeability between the strata and different hydraulic characteristics of the aquifers.
Many studies have used numerical modeling and hydro-geochemical investigations to predict aquifer storage or recover groundwater based on exploratory simulations and scenario building [2,8,22,23]. Models of groundwater flow (MODFLOW) and solute transport (MT3DMS) have been used to anticipate and measure the effects on regional groundwater and to reveal how geochemical processes work and how much water they produce [24].
The Dibdibba aquifer in southeast Iraq was the focus of the current study. The increasing use of groundwater in agriculture over the last twenty years has caused a significant drop in the groundwater table and the quality of water [25]. In 2020, Kerbala’s initial wastewater treatment plant (WWTP), located within the border of the aquifer, became operational. To raise the level of the groundwater, improve water quality, and utilize the huge outlet flow of treated water of the WWTP (more than 100,000 m3/day), an artificial recharge pond using treated wastewater was suggested. In this paper, the effect of the artificial recharge pond on groundwater levels and water quality in the unconfined aquifer was evaluated. During the artificial recharge period from 2022 to 2030, three-dimensional validated numerical models created using MODFLOW and MT3DMS with GMS were used to consider different scenarios. The main goal of this study was to evaluate how much artificial recharge using a pond near the Kerbala wastewater treatment plant (WWTP) would raise water levels and improve water quality, as well as how large an area would be affected, as well as obtaining the values for the agricultural areas that would be added and made sustainable, resulting in an increase in the number of useful farmers and productive yields in Karbala Province, Iraq. This province has recently faced an increase in water consumption due to the rapid increase in population and climate changes.

2. Materials and Methods
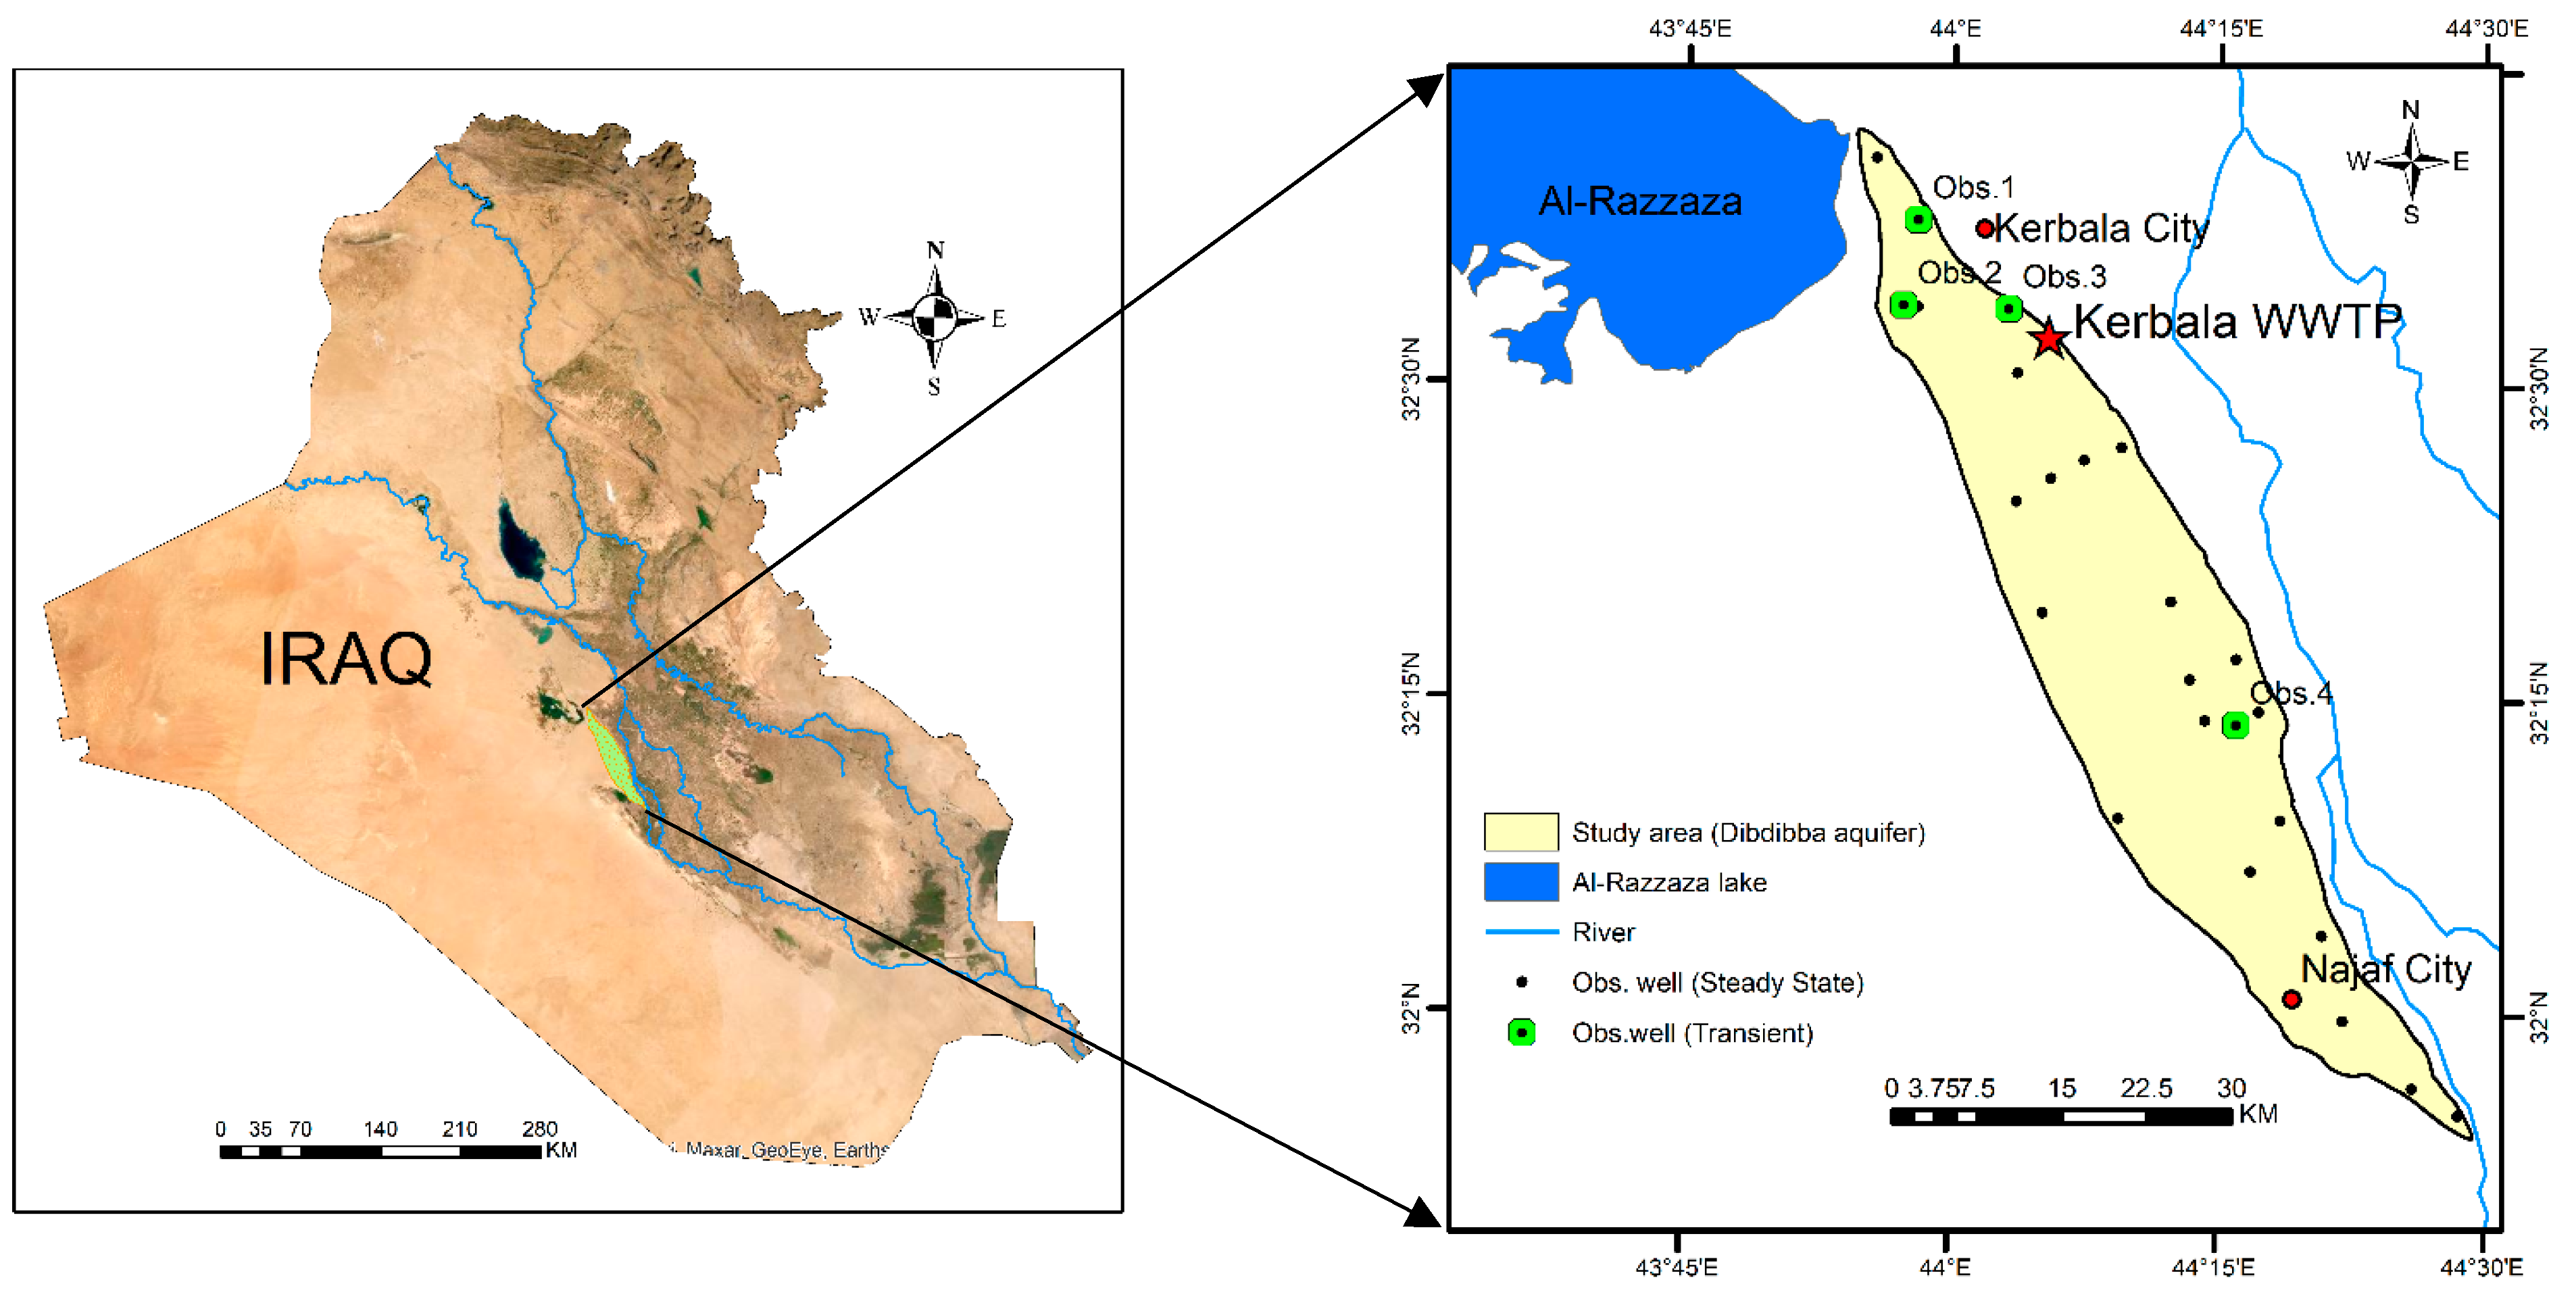
2.1. Study Area

Figure 1 locates the study area in the middle of Iraq, between the cities of Karbala and Najaf. It is between latitudes 31°55′ and 32°45′ and longitudes 43°30′ and 44°30′. The Dibdibba aquifer is a shallow, unconfined groundwater aquifer with a homogeneous soil profile and is entirely recharged by rainfall. It has an area of 1100 km2 and is surrounded by two ledges: Tar Al-Sayyed, which is inside the city limits of Kerbala, and Tar Al-Najaf, which is inside the city limits of Najaf province. The northern limit of the aquifer is close to Al-Razaza Lake, which is an open-surface reservoir. Quaternary sediments define the aquifer’s eastern boundary. The topography shows elevations between 10 and 90 m above sea level. The primary direction of the flow of groundwater is typically from southwest to northeast, with hydrologic gradients varying between 0.0011 and 0.0005. The average temperature varies from 11 °C in winter to 37.6 °C in summer. The average rainfall varies between 90 mm, as recorded at the weather station in Karbala, and 112 mm at the weather station in Najaf. In addition, 80% of annual precipitation falls between November and March, which are the wettest months of the year. In this aquifer, water levels have dropped significantly since 2003, negatively impacting the quality of the available water. The withdrawal of water through overexploitation has also had a significant impact. According to previous research [26,27], salinization of groundwater is an indication of increased irrigation water use in agriculture, which also results in land degradation and the movement of pollutants to unconfined aquifers. More details about the area were given in a previous paper [3].

2.2. Hydrogeological Characterization

The conceptual groundwater flow model and the subsequent progress of the calibrated model required an adequate explanation of the hydrologic conditions at the study site as a starting point. It is also difficult to choose an appropriate model or create an authoritative calibrated model without a clear description of the site. Only a few areas of the study site had hydrogeological properties available, such as the aquifer’s characteristics. As a consequence, the Kriging approach was utilized to estimate information for the entire region, in order to create an approximation of the information required. Figure 1 depicts the sites of the wells chosen to estimate the properties of the aquifer. The accuracy of the calculation used to determine the artificial recharge of the aquifer was significantly impacted by these parameters. The Dibdibba formation is composed primarily of pebbly sandstone, sandstone, siltstone, and lime. Secondary gypsum is also present. The formation is between 45 and 60 m thick.

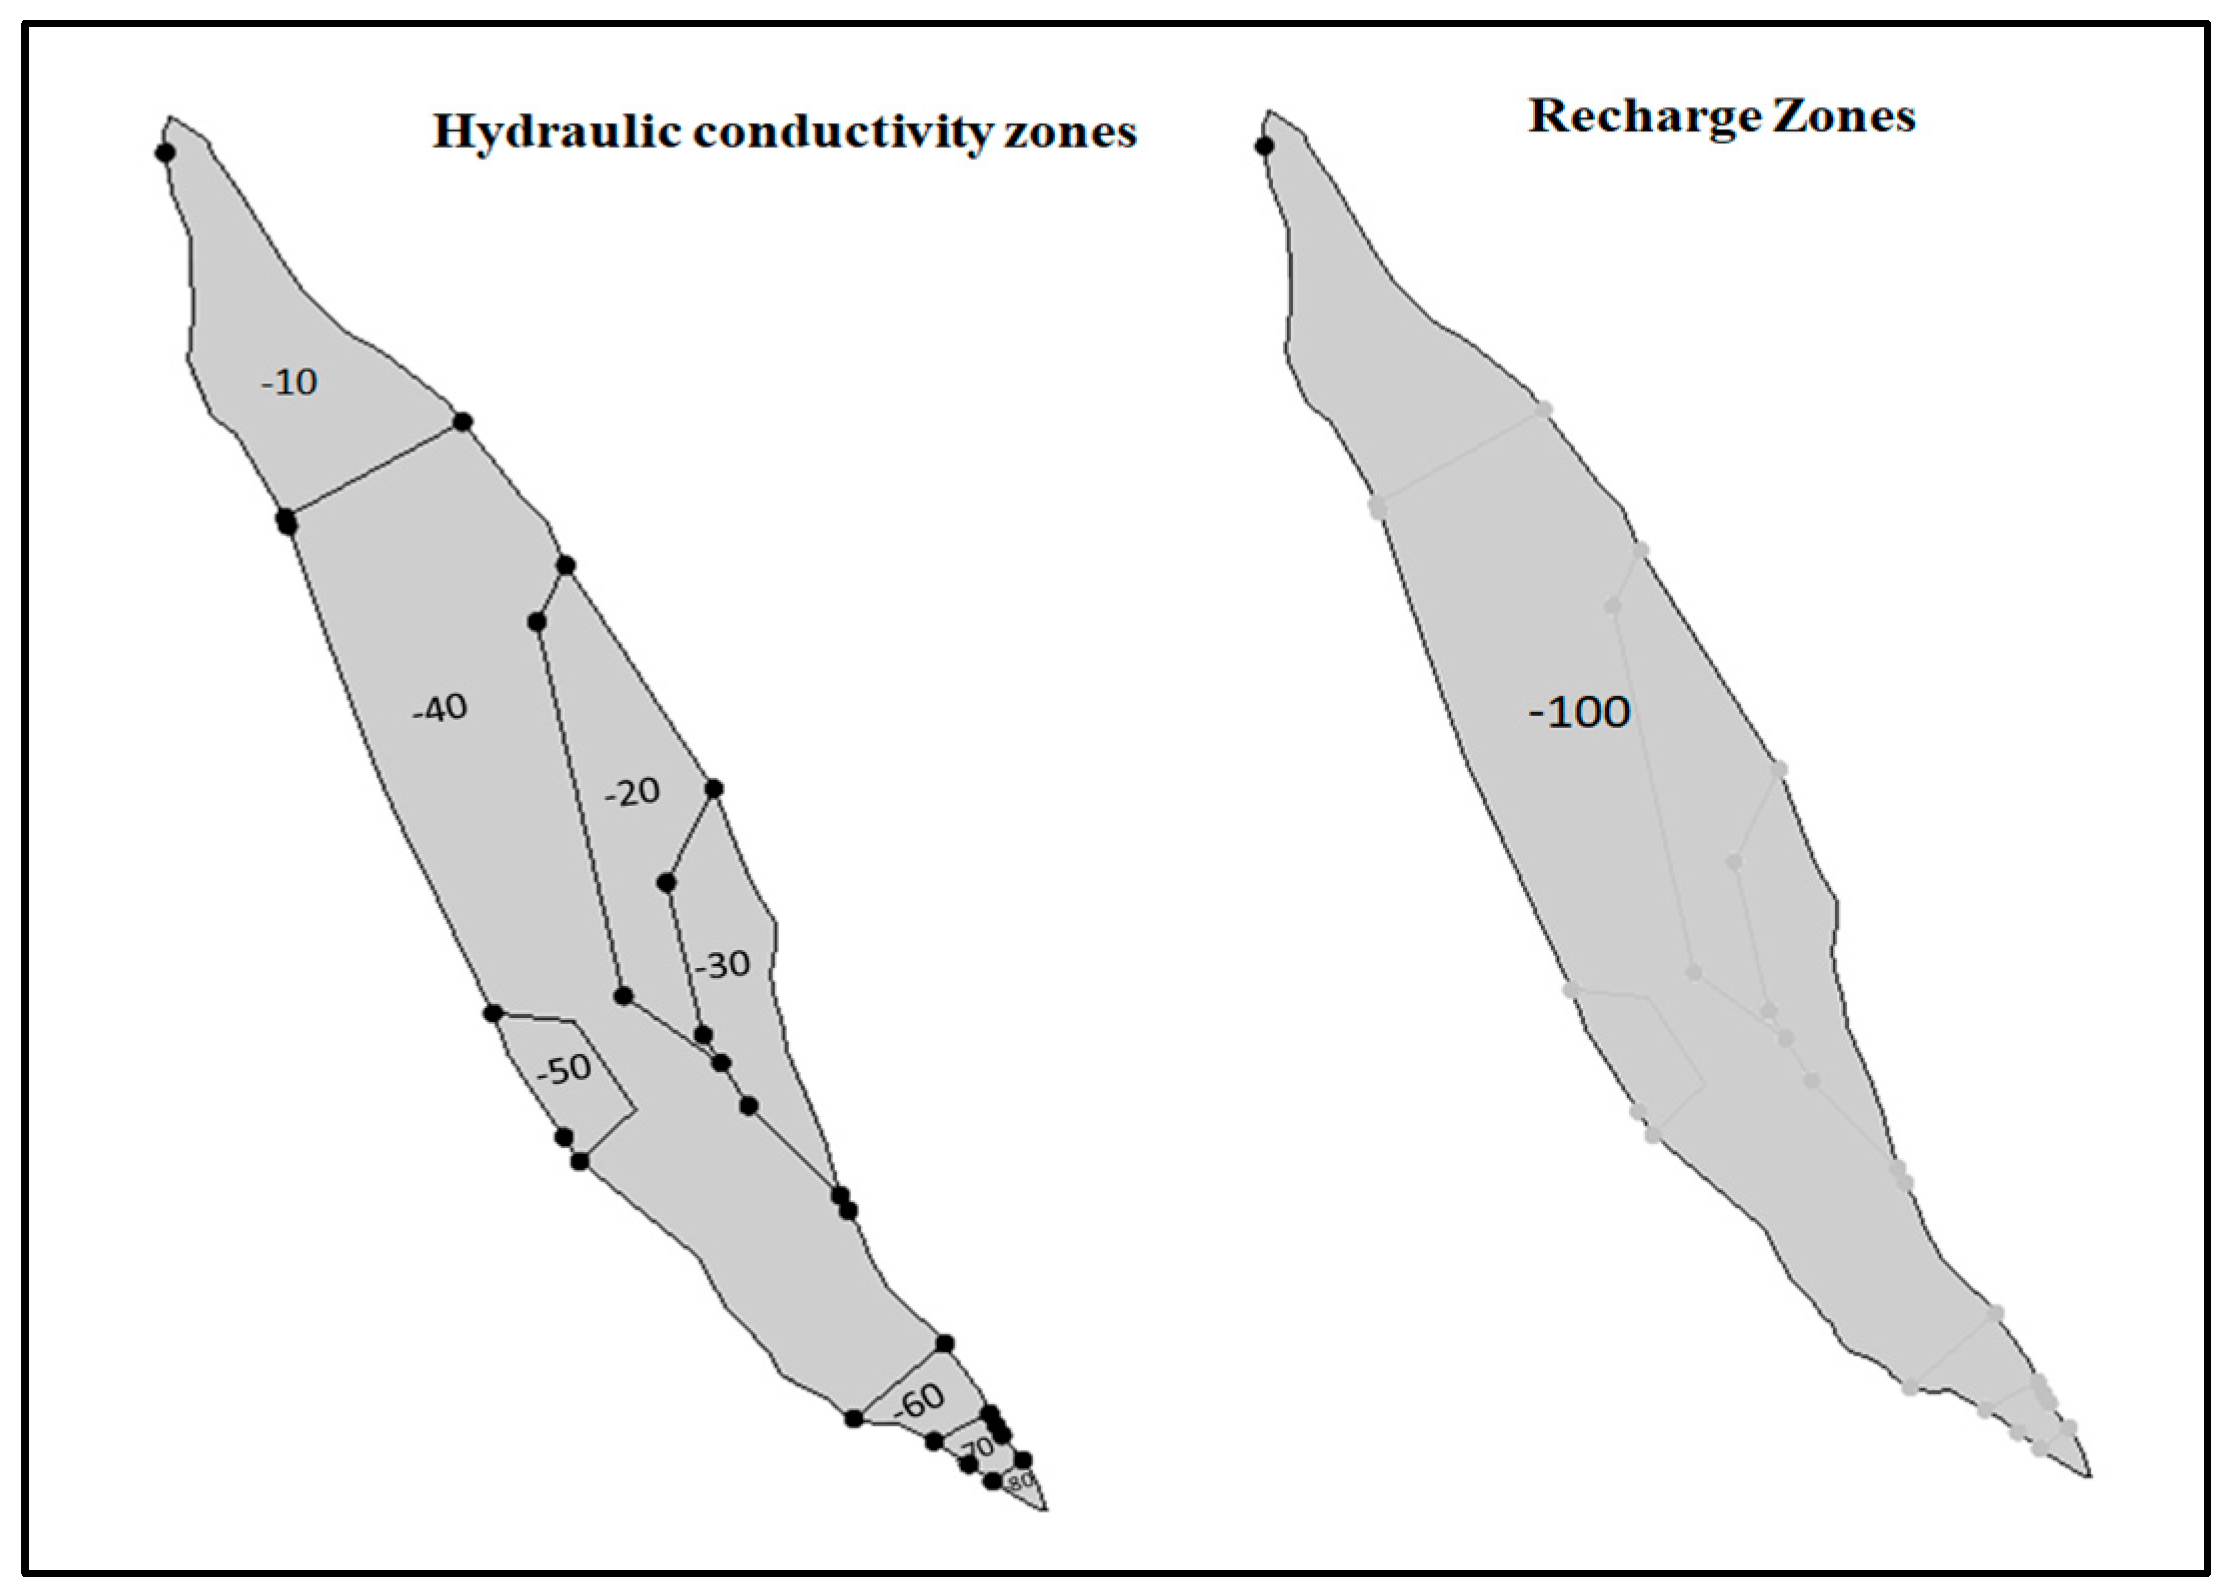
2.3. Modeling Approach

A conceptual numerical model was built using the Processing MODFLOW package. A proper representation of the hydrogeological characteristics in the research area was necessary for the development of both the conceptual groundwater movement simulation and for an accurately calibrated model. The model was calibrated in steady and transient modes, based on historical data observed from 2016 to 2017. The steady state calibration was necessary to understand the transient situation, thereby serving as the basis for the transient models. The steady state simulation model was validated utilizing fifteen wells with two adjustable elements. The well depths varied from 20 to 50 m, and the pump rate was approximately 25 to 30 m3/h. The study area was divided into seven regions, using hydraulic conductivity parameters predicted as a result of the pumping tests for 20 wells [28], and three sub-catchment regions that were naturally recharged based on the parameters of the aquifer (Figure 2). Hydraulic conductivity and natural recharge were considered separately for each homogeneous area in the study area. This was done to reduce the uncertainty caused by the projected variation over the wide area studied. The GMS program’s PEST (parameter estimation) calibration software was used to automatically complete the parameter estimation process. In this study, the spatial statistical method (Kriging) was utilized to interpolate groundwater table values, as well as all other aquifer properties, including the hydraulic conductivity and the top and bottom of the aquifer bounds. Kriging is a method for obtaining optimal and impartial estimates of geographic characteristics at non-sampled locations, by utilizing structural features of a semivariogram and initial group data values. It takes the spatial structure of the variable into account, so it was chosen over the nearest neighbor approach, the arithmetic average technique, the polynomial approximation, and the inverse distance-weighted approach. Kriging can also provide variance distribution estimates for each estimated location, which can serve as a primary indicator of estimated value precision or uncertainty. The conventional Kriging method was employed in this work, to generate expected values for various beginning input data at every unsampled position in the region. It is recommended that the input parameters are regularly distributed for optimal performance of the Kriging interpolation method (bell curve). To determine the degree to which the input variables (aquifer characteristics) matched the bell curve, two testing procedures were used: the first was drawing data histograms, and the other was a normal likelihood chart. A standard normal likelihood chart was produced by graphing the input values of the information versus the standard normal distribution at the point where their summed distributions were similar. The data distribution was normal if the points clustered around a straight line.
Using trial and error, the best grid size for the models was determined, and the grid subsequently used was composed of 3600 active cells. The width of each cell in both the x and y directions (rows and columns) was 500 m. The model area was developed in a 3D grid on the horizontal axis, with single unbounded layers on the vertical axis. Groundwater flow patterns in the Dibdibba aquifer were used to establish boundary conditions. A constant-head boundary was applied along the study area’s eastern and western edges, with values of 5 and 35 m provided by measurements taken from various observation wells. Tar Al Sayyed and Tar Al Najaf are specified no-flow borders, located on the northwestern and southwestern boundaries of the study region. For the predicted values of the precipitation for the future period (2022–2030) in the study area, the results of expected precipitation [29] were used in this study in the conceptual model.
Using the calibrated models, the effects of artificial recharge on the groundwater table and the quality of the water in the aquifer, especially in the surrounding area, were estimated. This was done by adding a hypothetical pond with several scenarios of pumping rates close to the WWTP. Different scenarios were considered based on the idea that groundwater pump rates and both artificial and natural recharge will increase between 2022 and 2030. Observations of actual groundwater levels were used to check the results of the model for the time period 2016–2017. In this study, treated wastewater was used as an artificial source of recharge, because there is high output of treated water (100,000 m3/day) and it is close to a wastewater treatment plant.

3. Results and Discussion

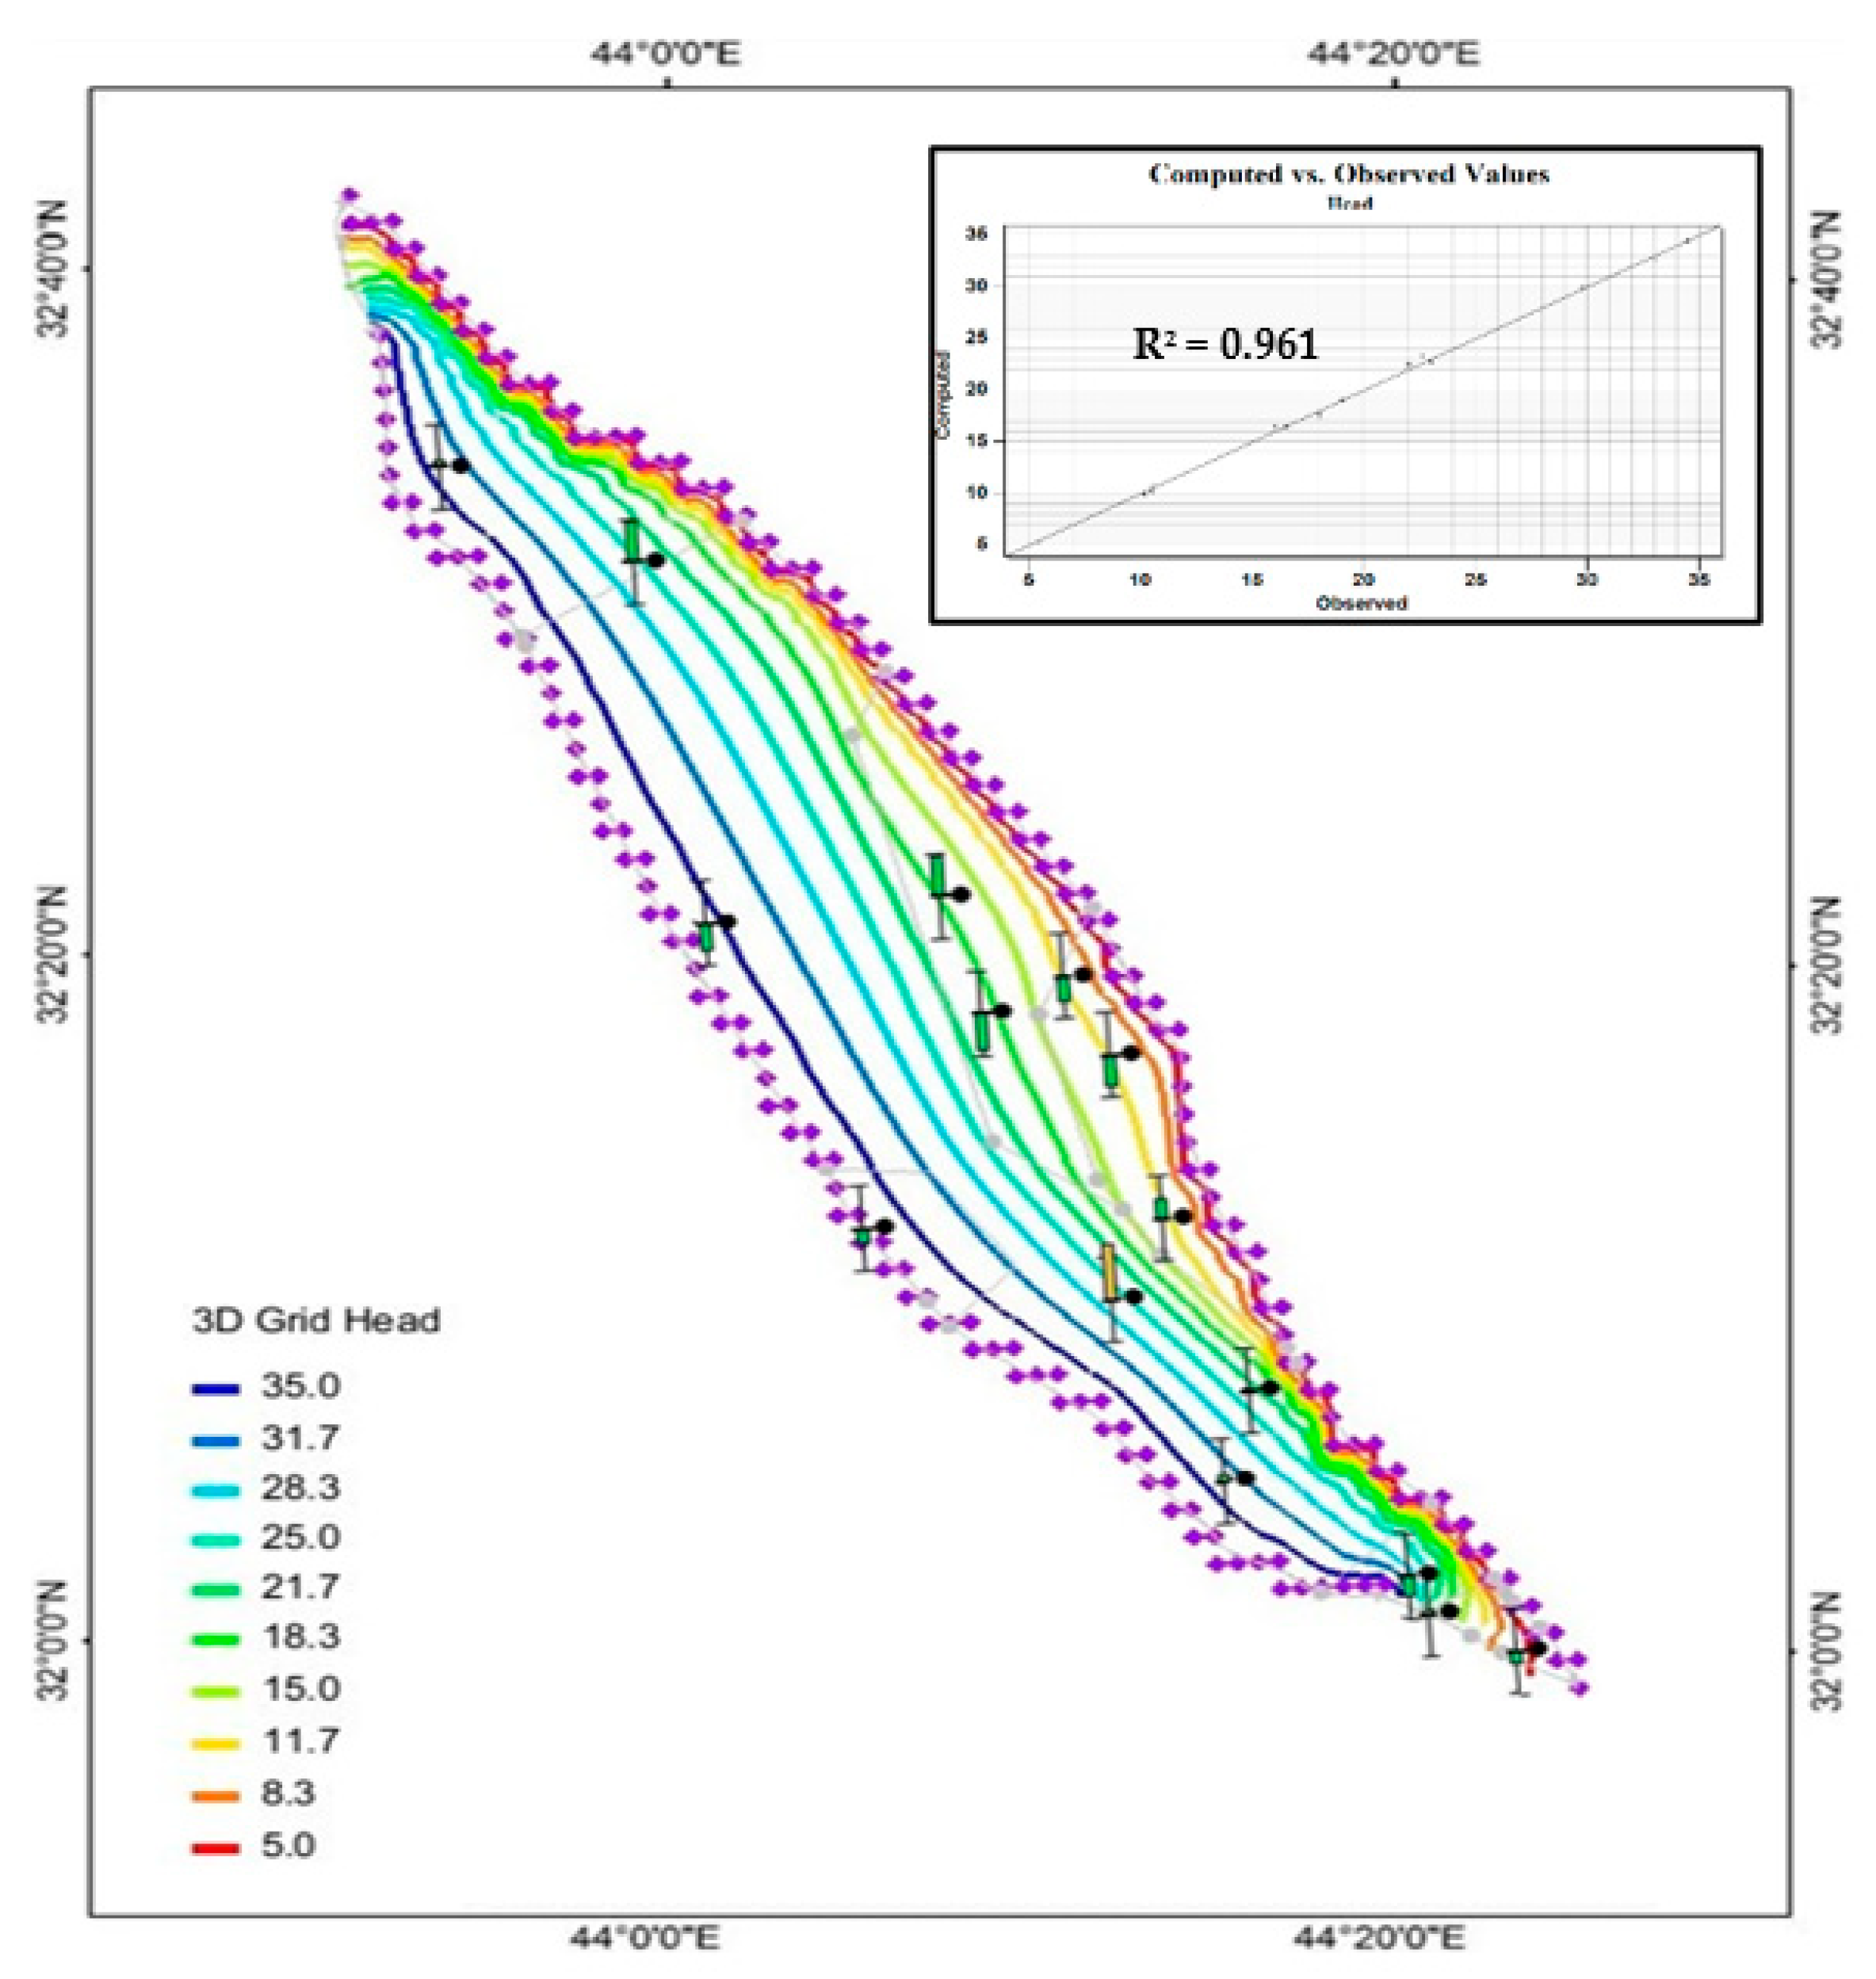
3.1. Calibration and Validation Model

The steady state calibration of the flow model allowed for the estimation of natural groundwater recharge varying from 9 to 12 percent of the mean annual precipitation for the Dibdibba aquifer. These ratios were similar to those employed in earlier research [3,28]. For the steady state, the results of the calibrated model were acceptable and matched the observed data with projected groundwater table, and the determination coefficient (R2) was around 0.96 (Figure 3). Figure 3 illustrates the calibration results of the model with observation ground water levels in the selected wells. A scatter diagram of these results was plotted and is shown in Figure 3. The observed value is shown by the center line. The whiskers on the top and bottom edges represent the measured data plus the period and the measured values minus the period, respectively. The full line displays the error, where a green line signifies that the error is contained inside the designated range (lower than 0.5 m). Red lines indicate errors greater than 1 m, while yellow bars indicate errors between 0.5 and 1 m. The Parameter ESTimation (PEST) tool within the GMS software was used to obtain the optimal solution mode compatible with the minimum errors during the calibration process. Groundwater levels from 15 wells were used for the numerical model calibration and validation under steady-state conditions. These wells were selected in order to cover the entire research area and reduce the length of the simulation run during the calibration period. In order to achieve an acceptable degree of accuracy, 15 calibrating targets were used to simulate levels of water in the models; 14 of the lines were green (error below 0.5 m), but one line was yellow (error over 0.5 but lower than 1.0 m). During the conceptual model’s calibration procedure, the research area was separated into a number of zones by hydraulic conductivity and expected natural recharge rates.
At the end of the simulation, the numerical model produced calibrated values of these two crucial characteristics for all the study areas. These results were an indication of high confidence in the simulation model’s estimates, meaning that this data could be used as the initial condition when calibrating the transient model. It was not possible to calibrate the salinity, partly because there were not enough measurements and mostly because the processes were too complicated [30].

3.2. Validation of the Transient Model

In order to investigate the validity of the numerical model results for the future time period, the transient numerical model results were examined with historically observed groundwater levels from four monitoring wells during the period 2016–2017. Building a transient simulation mode requires the handling of a huge quantity of transitory information from various sources, such as data on the depth of water in observation wells and on recharging and pumping wells. The transient state was simulated by initiating a simulated steady-state groundwater table. The aim of this operation was to measure the groundwater table. The Dibdibba unconfined aquifer’s specific yield (Sy-value) was determined using transient models as preliminary projections. Previous studies’ pumping experiments gave Sy values ranging from 0.001 to 0.05 [28]. According to the agricultural needs in the research region, different monthly pumping rates were used. Designing a transient model requires careful consideration of the simulation time step used, because this has a significant impact on the results of the numerical model [31]. The time period was split into 20 time periods and four control wells, with a start time of 1 January 2016, and an end time of 1 December 2017. The selected wells were close to the Karbala treatment plant, especially Obs1 and Obs3 (Figure 1). Specific yield factors were chosen to serve as the simulated results in the PEST operations during the calibration of the transient state. This parameter varied continuously, until a satisfactorily acceptable difference between the measured and simulated water depth was obtained from January 2016 to December 2017. The four calibration objectives in this model are indicated by the color green (Figure 4). The transient numerical model was also examined using a transient scatter plot, which compared the groundwater levels against the simulations. These comparisons are displayed in Figure 4, and the models accurately predicted the measured levels with a determination coefficient (R2) of 0.923.
The groundwater flow simulation model was validated from January 2016 to December 2017. Figure 5 shows how it nearly recreated the groundwater table fluctuations of various earlier observation readings. Figure 5 compares the observed and estimated fluctuations in the groundwater table in the observation wells. The transient simulation of the conformity between the predicted and observed groundwater tables in the monitoring wells demonstrated the simulation’s excellent performance. During the monitoring periods, all of the figures show a decreasing trend in groundwater levels. According to these assessments, the model was adequately calibrated. Figure 5 shows that the simulation model outputs for observation well No. 1 (Obs.1) were always lower than the measured groundwater levels, while well No. 2 (Obs.2) always exceeded the measured groundwater table throughout the validation time period but was still within agreeable limits. The projected values for the other wells measured, both overestimated and underestimated the value for the various observation periods. These patterns could be explained by the varying prediction values for the hydrogeology characteristics of the steady area, as well as the impact of the well’s distance from the study area’s hydraulic boundaries.
The validated numerical models were applied to project the effect of the proposed groundwater artificial recharge using a pond on the level and quality of groundwater, with a focus on the Kerbala WWTP zone. The amount of groundwater extraction by pumps between 2016 and 2030, as well as both natural and artificial recharge, were taken into account in the various scenarios.

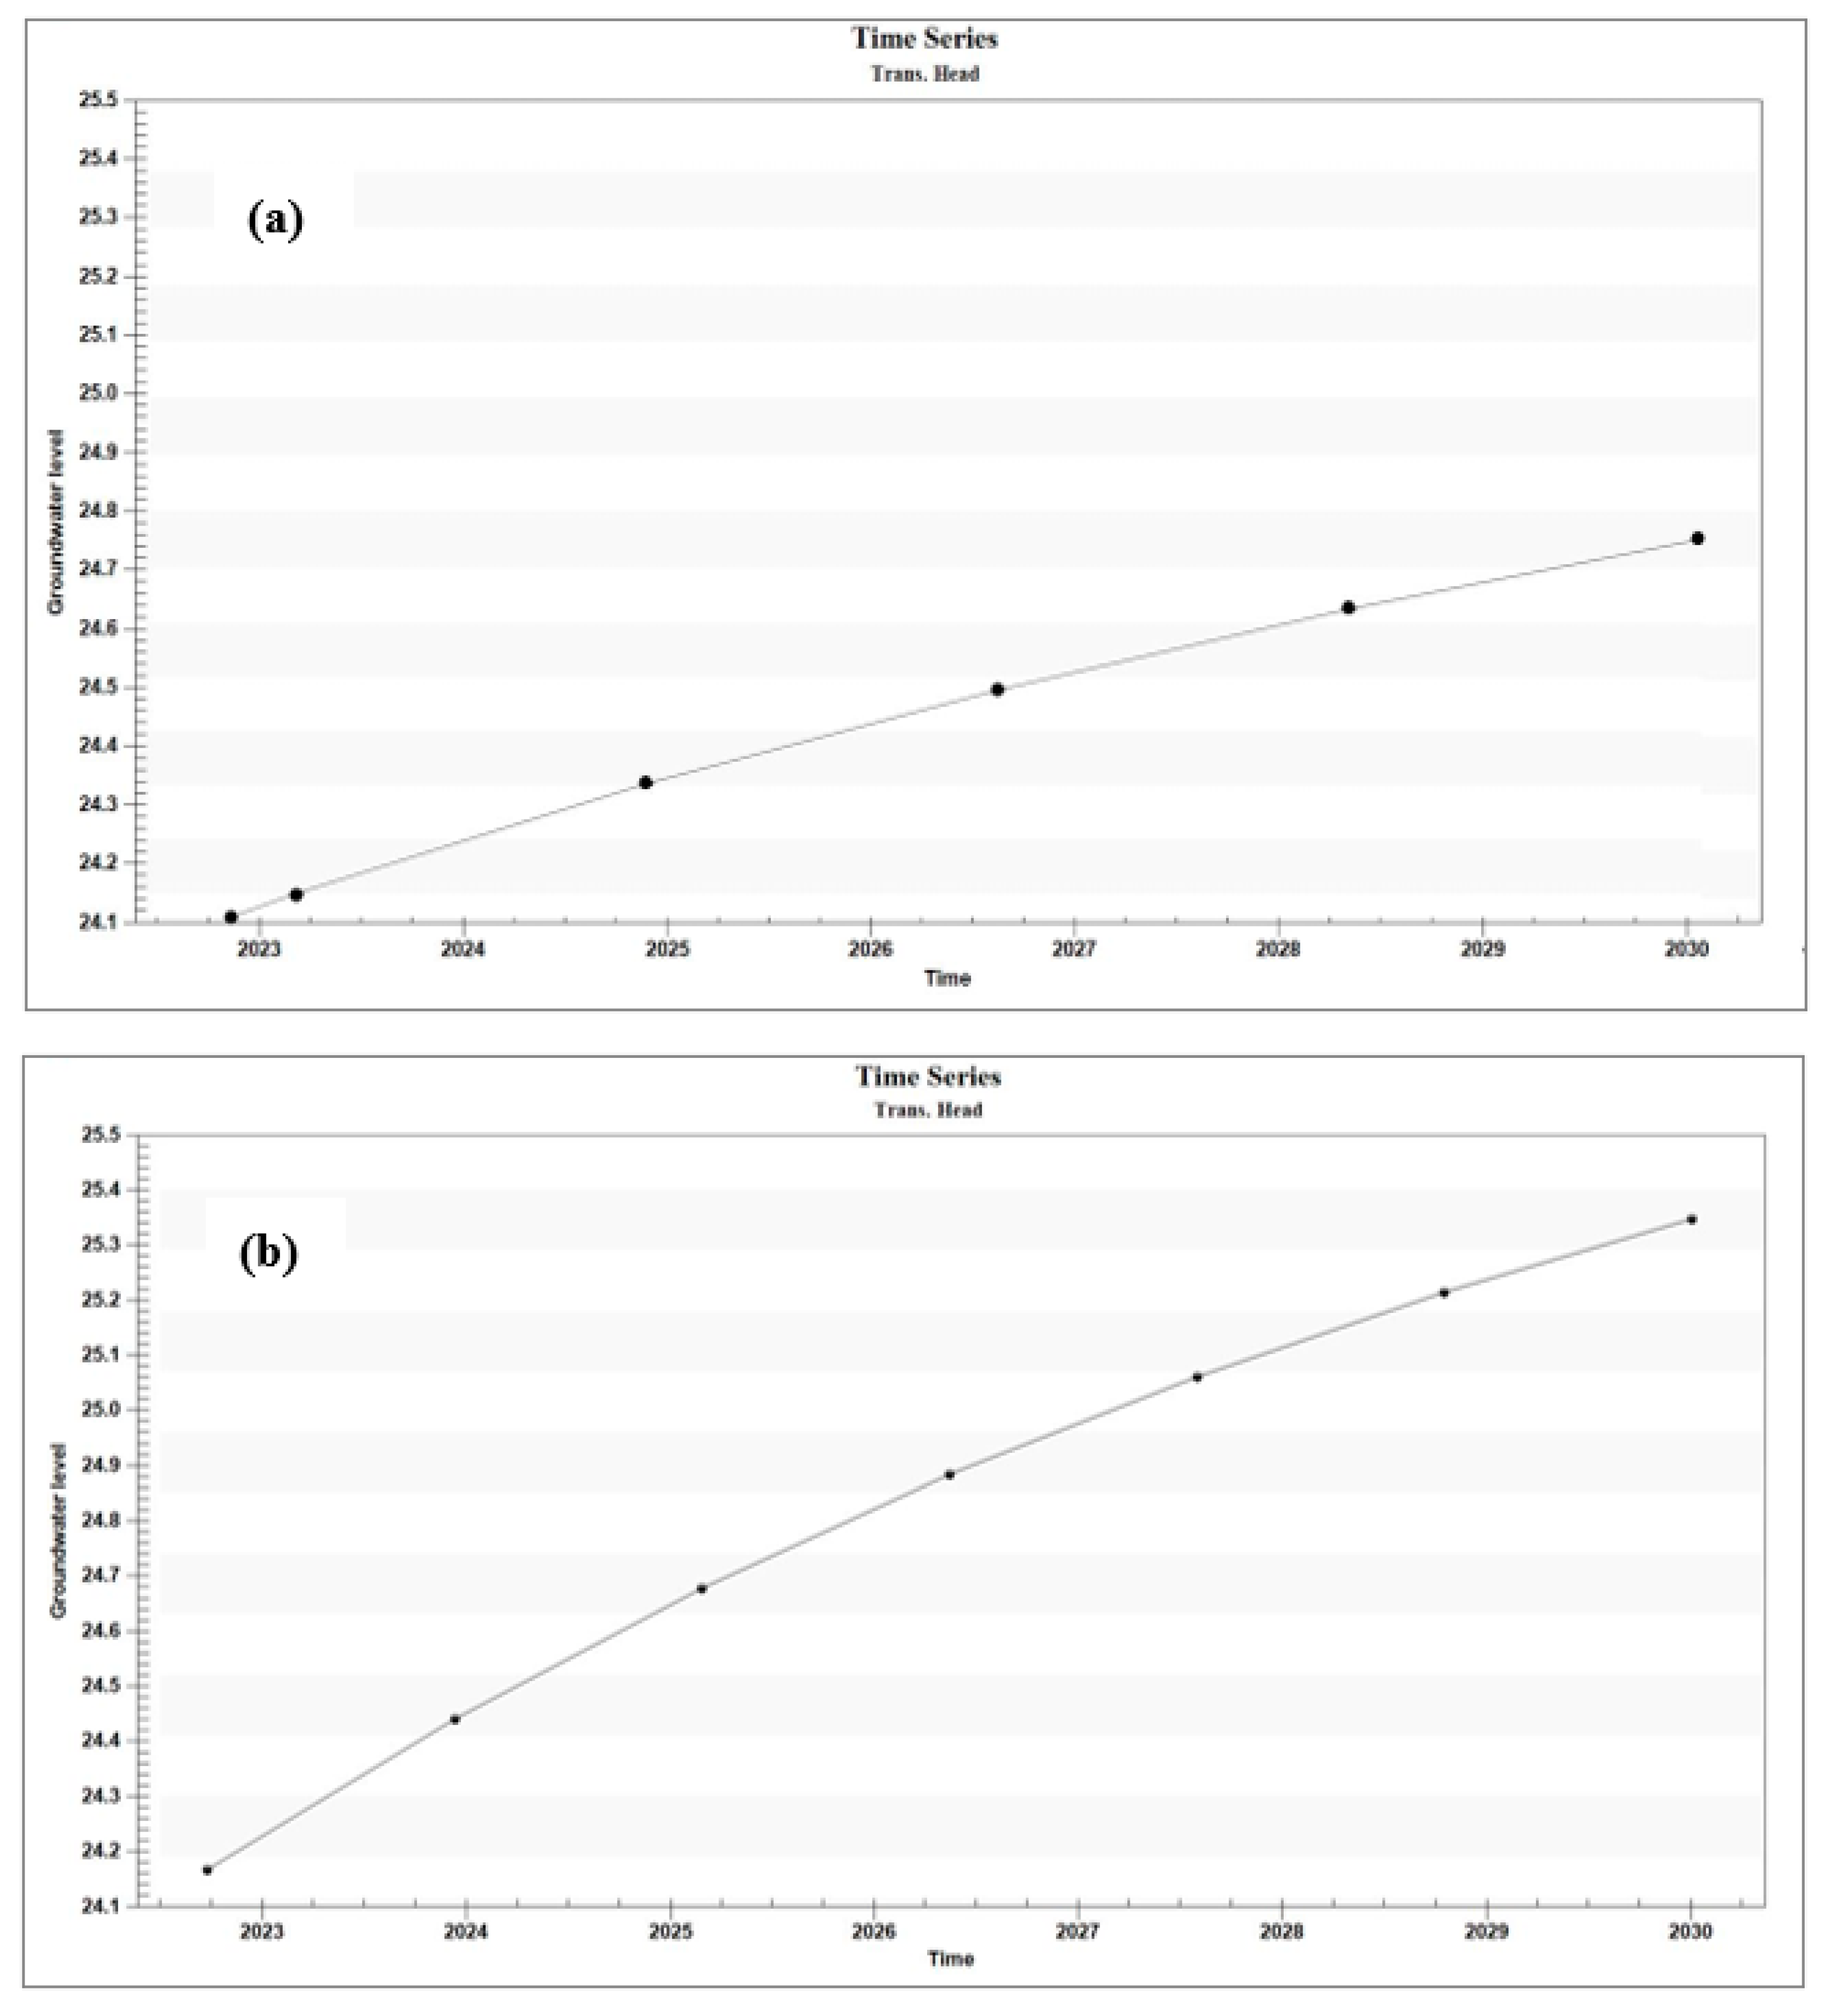
3.2.1. Quantitative Evaluation

In this study, three different simulation scenarios (SIM1, SIM2, and SIM3) were applied to the prediction period 2016–2030. SIM1 used the same initial conditions, making the assumption that the existing recharge and extraction rates would stay the same as during 2016, excluding the additional rate of artificial recharge from treated water. Based on this first scenario (SIM1), the simulation model projected that the groundwater level would drop by more than 1 m near the Kerbala WWTP location by 2030, and the water quality would become worse. According to this scenario, there would be a loss of more than 2 m of groundwater in the vicinity of the Kerbala WWTP by 2030 (Figure 6). This decline was justified as a result of the excessive use of ground water, the decrease in natural recharge due to the lack of precipitation, and the increased temperatures in the past few years due to climatic changes in the region. Many agricultural areas have suffered in the last few years due to this decline in groundwater levels, which increased withdrawal costs and degraded water quality. Most climate studies have shown that the effects of climate change in the region could become worse at a fairly high rate [32]. Due to this, it is expected that this drop in water level and quality will have a greater effect on farmers and the region’s ecosystem in the near future.
As a result of its closeness to the treatment plant, the significant effects of extraction processes in this region, and the lack of natural recharge, this site is regarded as one of the best for establishing an artificial recharge pond. These estimates of the predicted drop in groundwater levels are sensitive to the assumptions made regarding extraction values (11,000 m3/day), which depend on a number of other assumptions, because there have not been enough observations in the field.
In SIM2 and SIM3, the same initial conditions as in SIM1 were implemented, with only the addition of an artificial recharge flow that was pumped into the recharge pond at a rate of 5000 and 10,000 m3/day, respectively. In the simulation model, the recharge pond was represented by one cell. For operational and economic reasons, the site selected for the recharge pond was near the WWTP. When the projected groundwater levels in 2030 for SIM1 and SIM2 were compared, it was found that an increase of up to 0.8 and 1.4 m would be possible with an artificial recharge rate of 5000 and 10,000 m3/day, respectively (Figure 7a,b). Taking into account a minimum rise of 0.2 m, the impacted region around the Kerbala WWTP would be about 78.2 km2 for SIM2 and 110 km2 for SIM3. During the study period, this expected increase would potentially be very important for lowering withdrawal costs and adding more farmland to the region.
The results related to the monitoring well (Obs.3) situated close to the artificial recharge zone were used to assess the temporal variation of the groundwater elevation, as illustrated in Figure 8. As shown in Figure 8a,b, groundwater levels rose over the eight years of the simulation by 7.5 cm and 12.3 cm each year for the SIM2 and SIM3 artificial recharge modeling scenarios, respectively. It is important to note that the rate of rise differed between the two scenarios because of the different pumping rates of the recharge pond. At the end of the time simulation period (2030), the groundwater table in the observation well (Obs.3) had increased by more than 0.67 m and 1.2 m under SIM2 and SIM3, respectively.
The prediction of the water requirements in the study region is dependent on two important aspects. The first is the weather, which includes precipitation, temperature, sunlight, wind velocity, and moisture. The second component is cultivation type, which impacts the irrigation water demand and represents the plant’s modulus [33]. According to the Iraqi Ministry of Water Resources and the Ministry of Agriculture, the maximum irrigation water requirement for an agricultural plan is 3 m3/donum/day (one donum is 2500 m2). According to the modeling findings for the coming eight years, a new agricultural region of more than 8950 donum (22.4 km2) could be added to the area if 5% of the reclaimed wastewater output from the WWTP was utilized for the artificial recharge operation with a pond. Moreover, when 10% of the treated wastewater output is used, the additional area might be increased to 16,200 donum. This anticipated increase in farmed area would be extremely beneficial in combating desertification, global climate change, and enhancing the ecosystem in the study region.

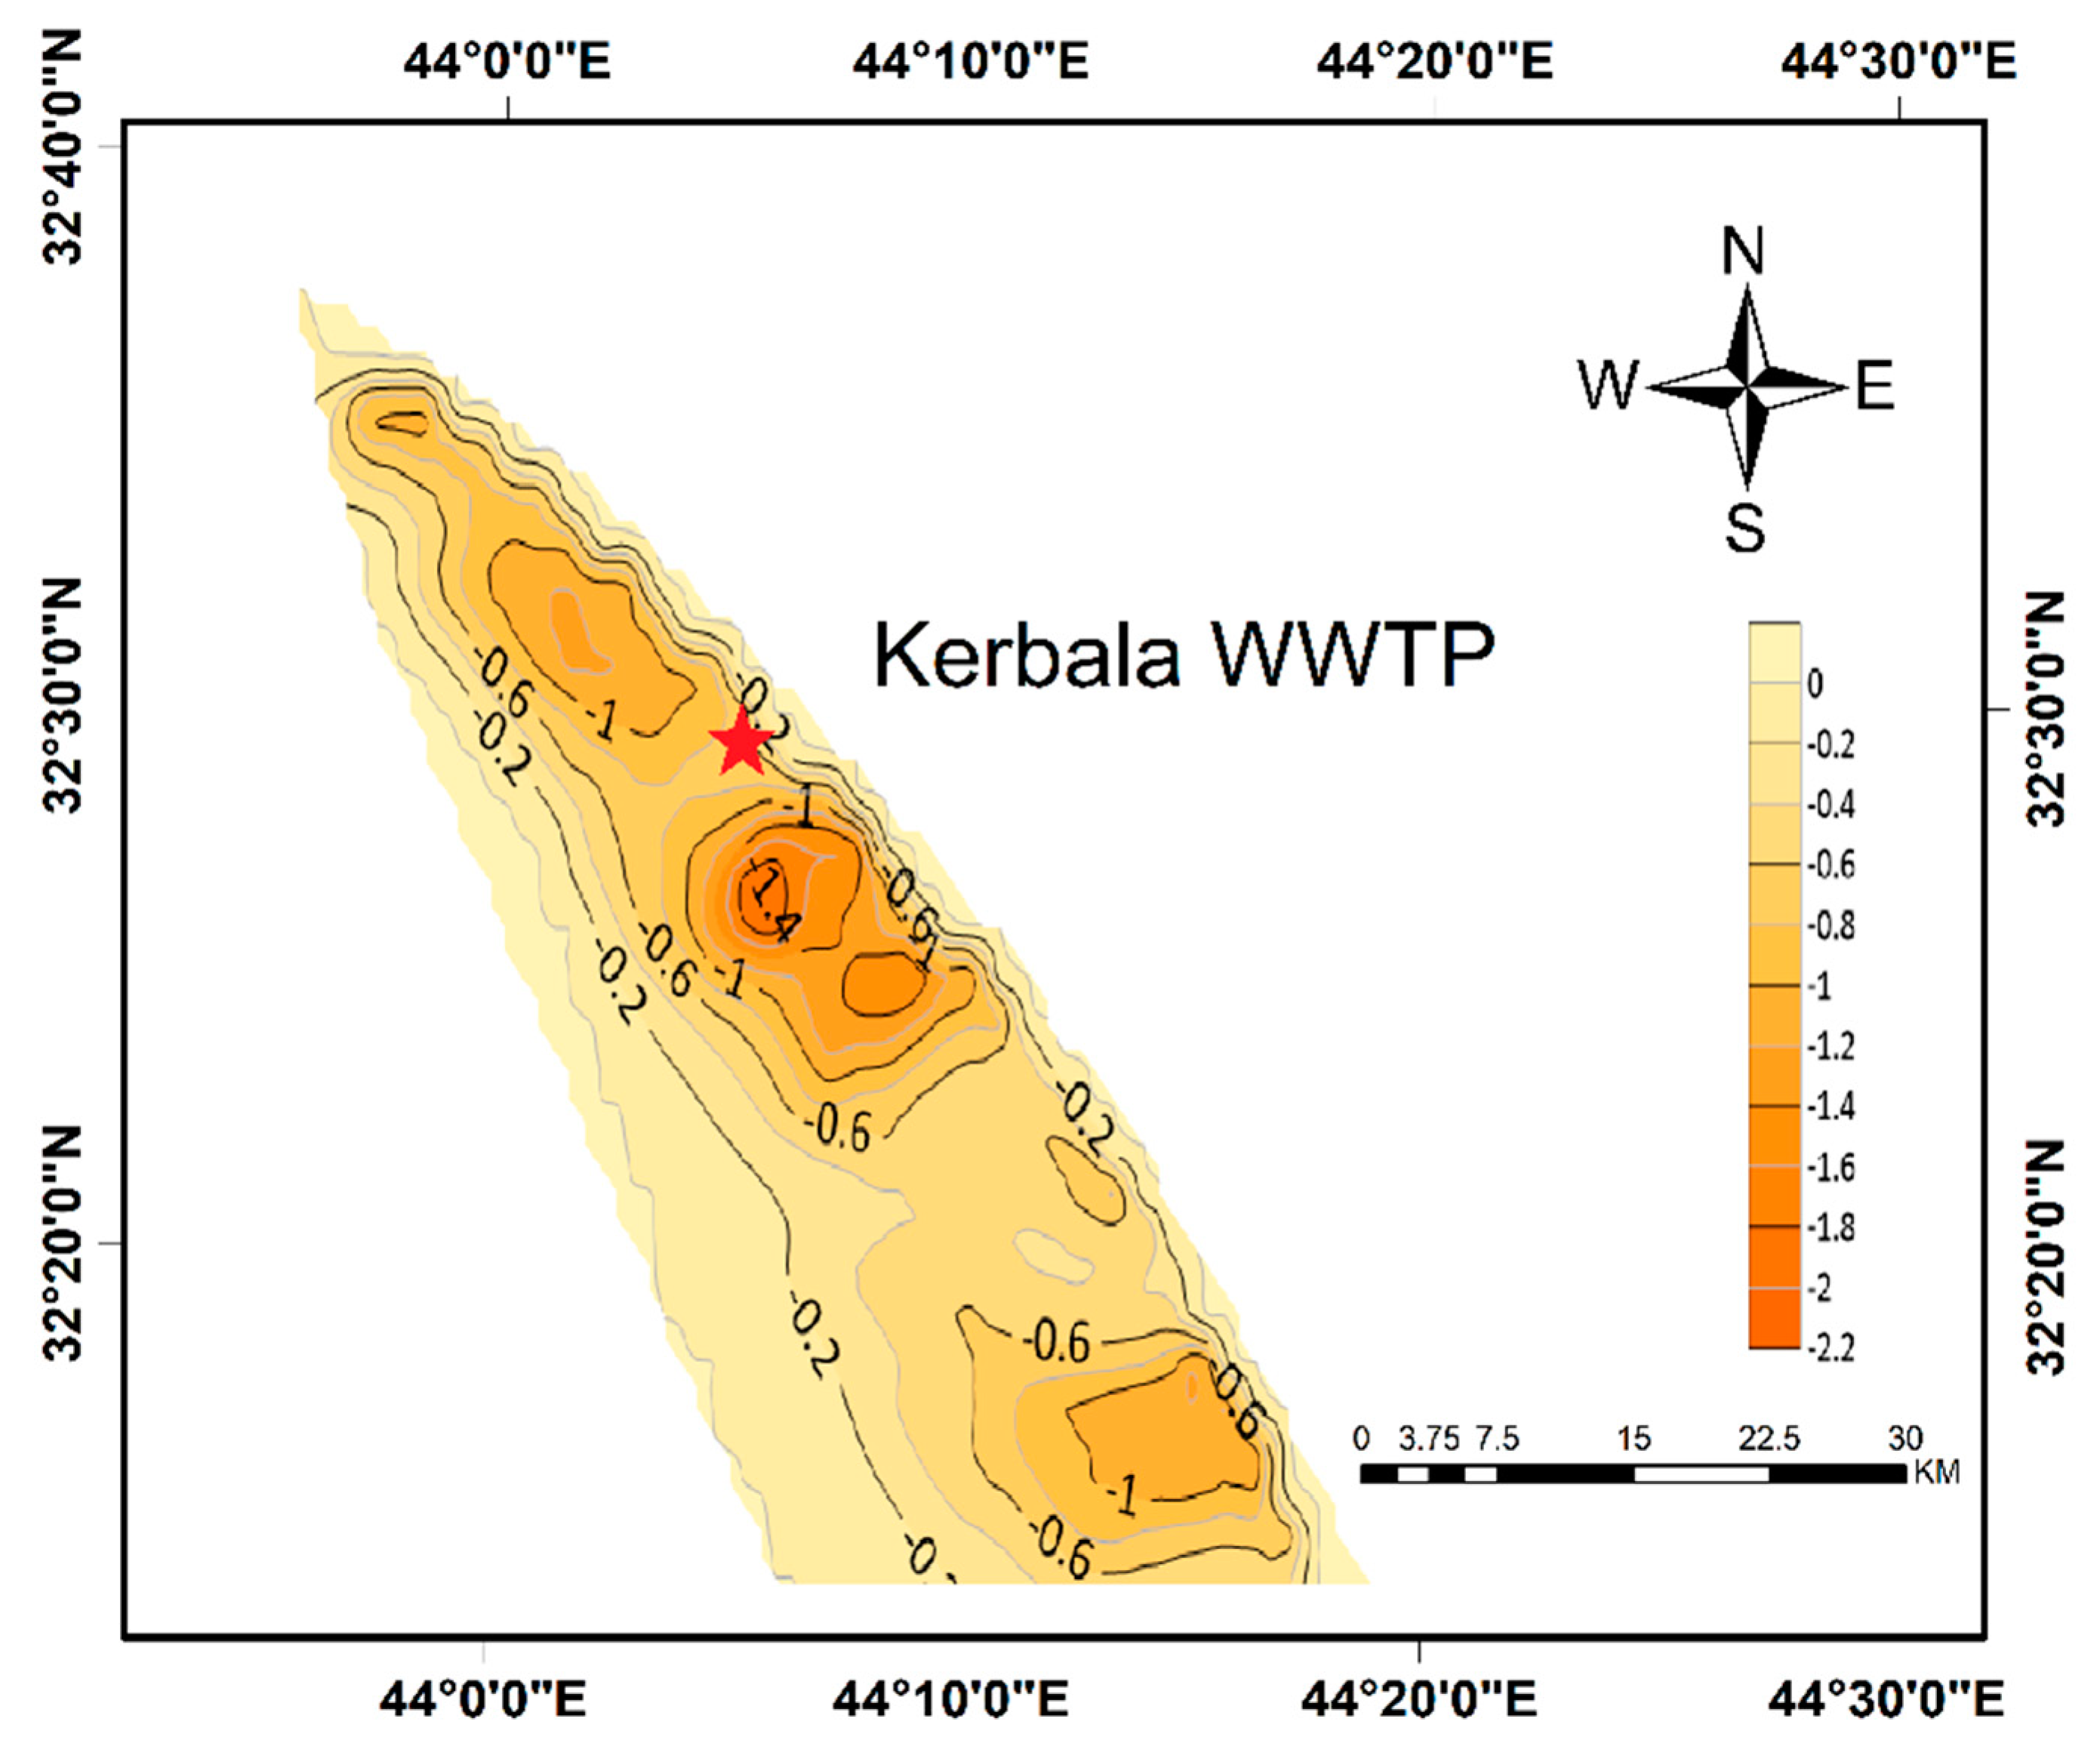
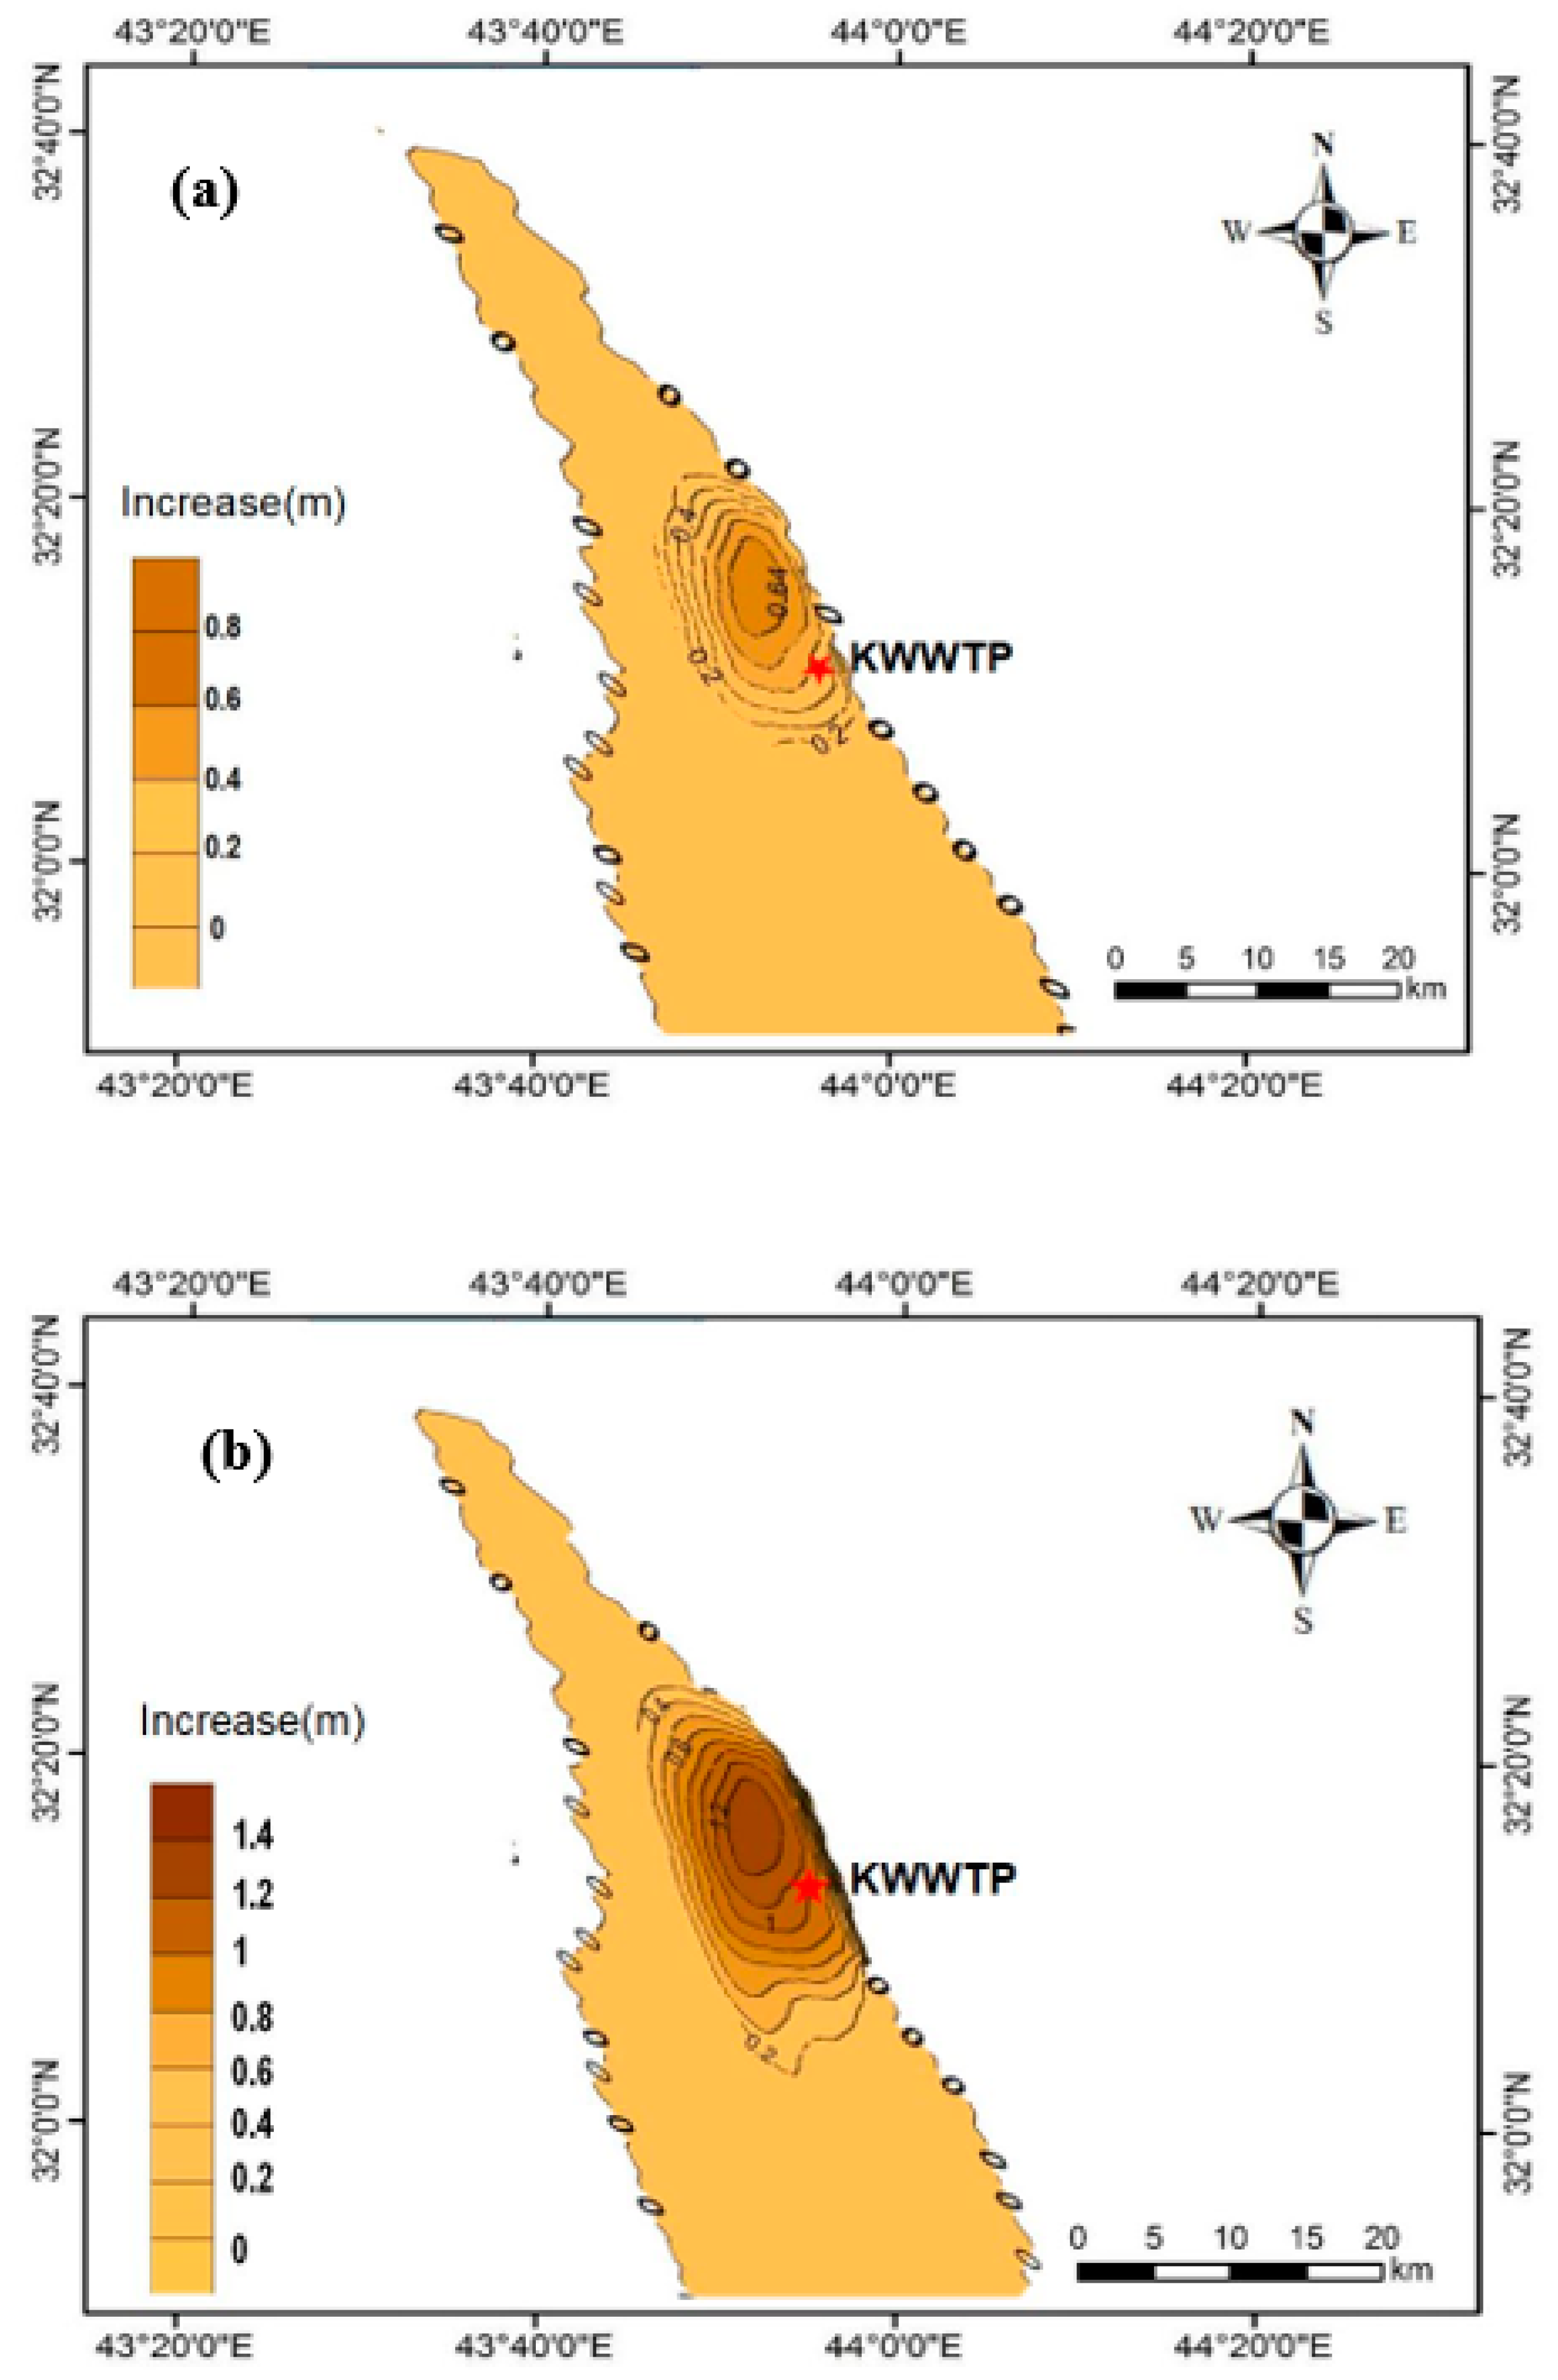
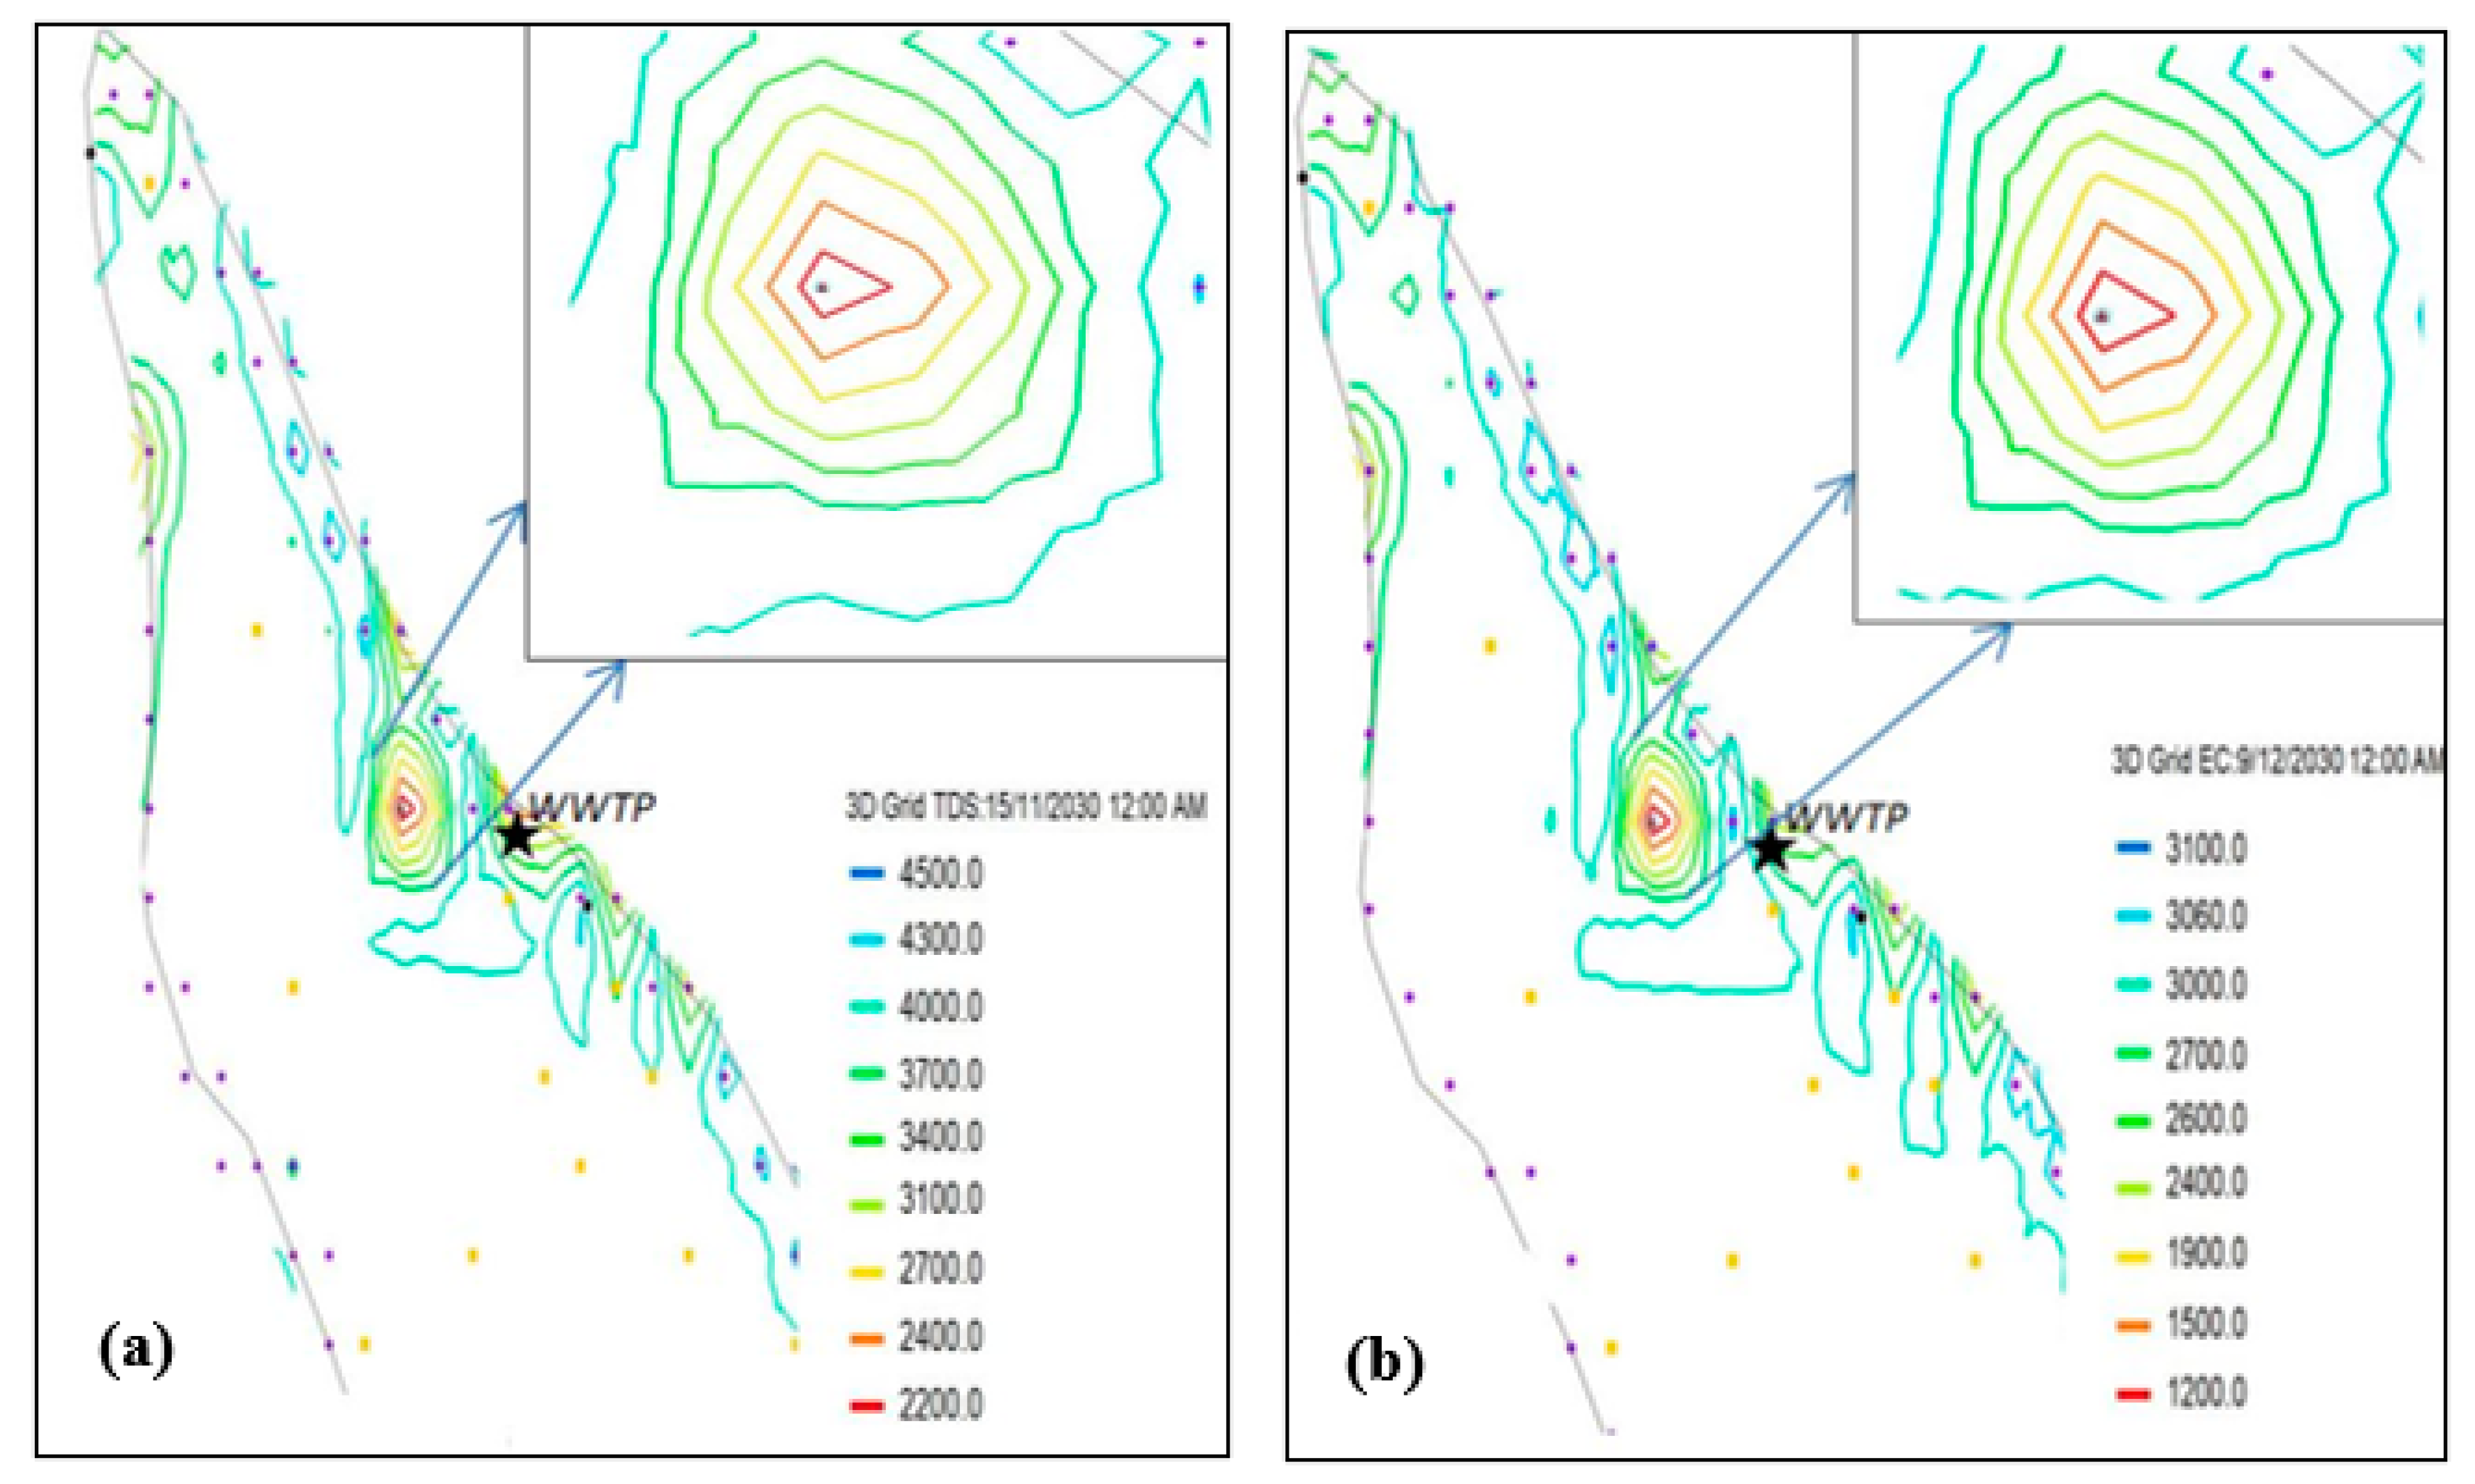
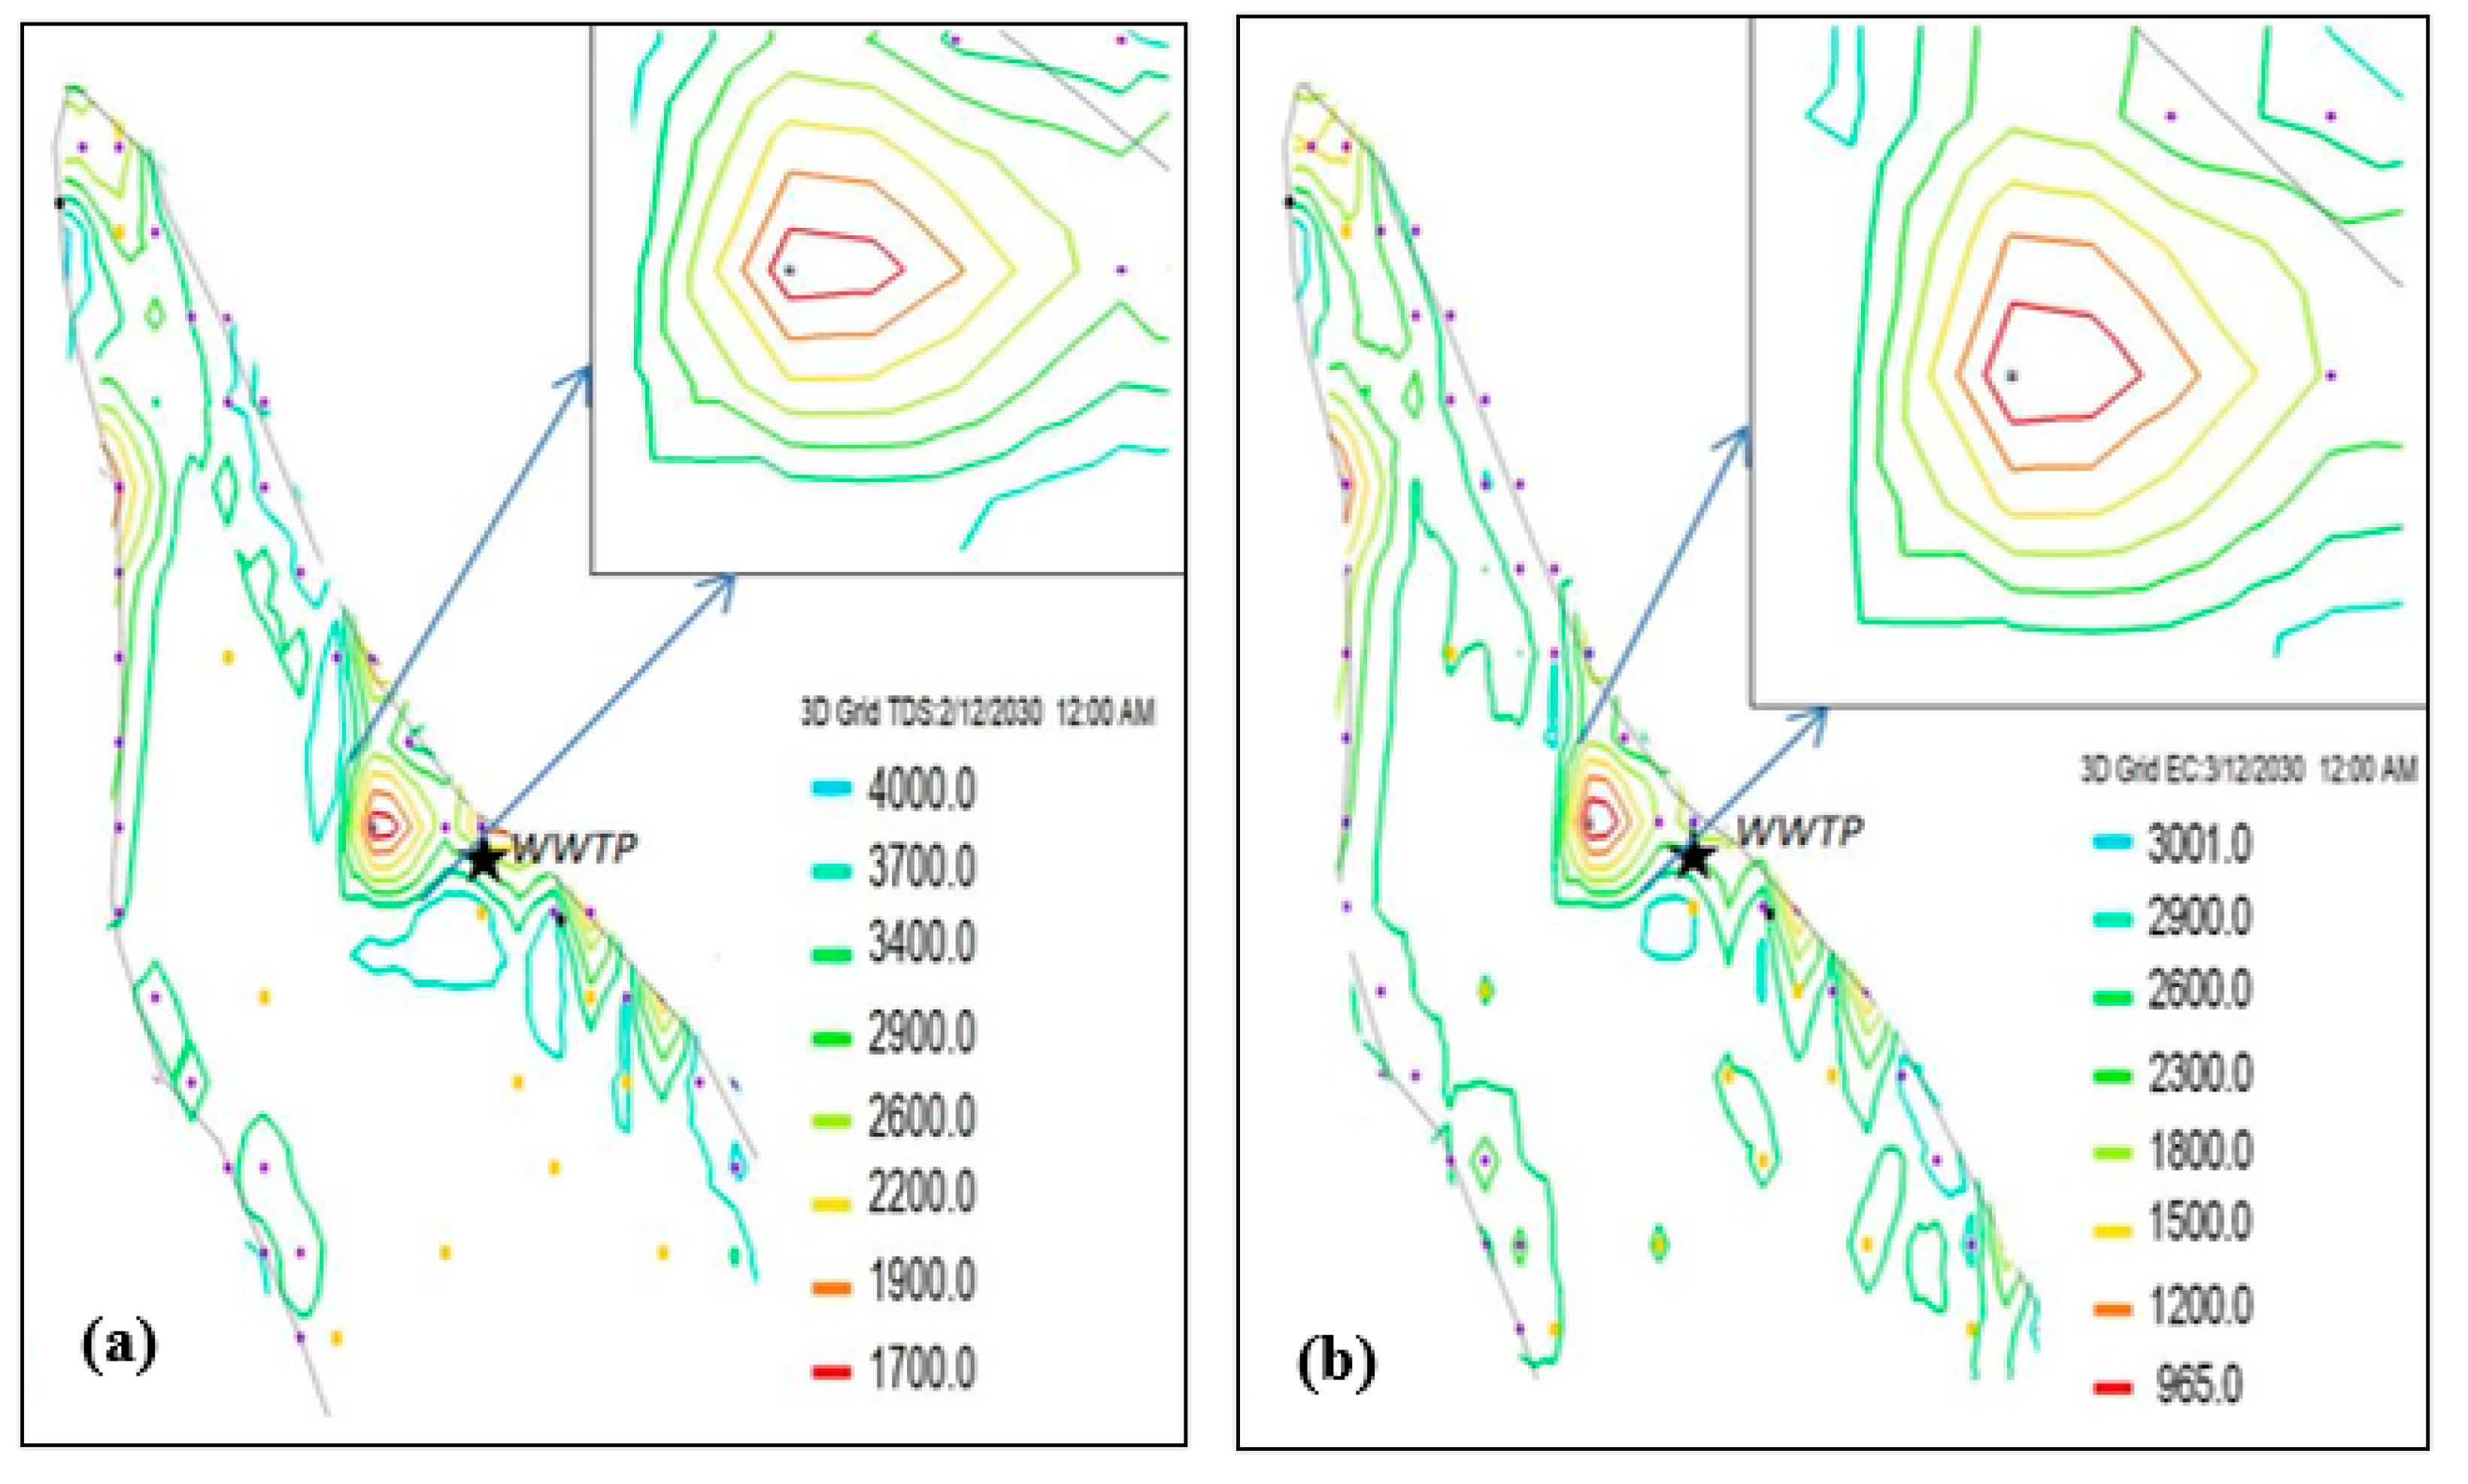
3.2.2. Improving Groundwater Quality

The MT3DMS model within GMS Software was used to predict groundwater quality based on the TDS and EC values of groundwater and treated water. The results of the first scenario in this study indicated that the water quality in the aquifer will continue to deteriorate during the coming years, as a result of the excessive withdrawal of groundwater. Artificial recharge may be the best and most practical way to improve the quality of water and reduce salinity. According to the laboratory results of the field samples of groundwater taken from the operation wells near the site of the Kerbala WWTP, the groundwater was salty, with a TDS of more than 4320 ppm and an EC of more than 4780 ppm, while the salinity of the treated wastewater that would be injected in the artificial pond reached a TDS of less than 1100 ppm and an EC of less than 1185 µ.S/cm.
Under the artificial recharge situation of SIM2, with a daily pumping rate of 5000 m3/d, groundwater salinity could be lowered by up to 2400 ppm TDS close to the pond site, with a reclaimed area of approximately 32 km2 (Figure 9a). This would extend to a 51 km2 recovery region with a TDS change of less than 3000 ppm. For the EC, the artificial recharge pond could decrease the concentration from 4779 µ.S/cm to less than 1600 µ.S/cm near the recharge pond. With a decreasing ratio close to 50%, the recovery area reached 68.4 km2 (Figure 9b).
For the third scenario, SIM3, with an increased pumping rate of 10,000 m3/d, as a consequence of this increase, a greater effect was obtained on the quality of groundwater (Figure 10). In fact, the reclaimed area was increased to 62.7 km2 with a TDS of 2600 ppm, and the maximum reduction in TDS reached 1900 ppm near the pond (Figure 10a). For the EC, the region influenced was t increased to almost 77.4 km2 with an EC of 1800 µ.S/cm and a maximum reduction of 1200 µ.S/cm near the recharge pond, as illustrate in Figure 10b.

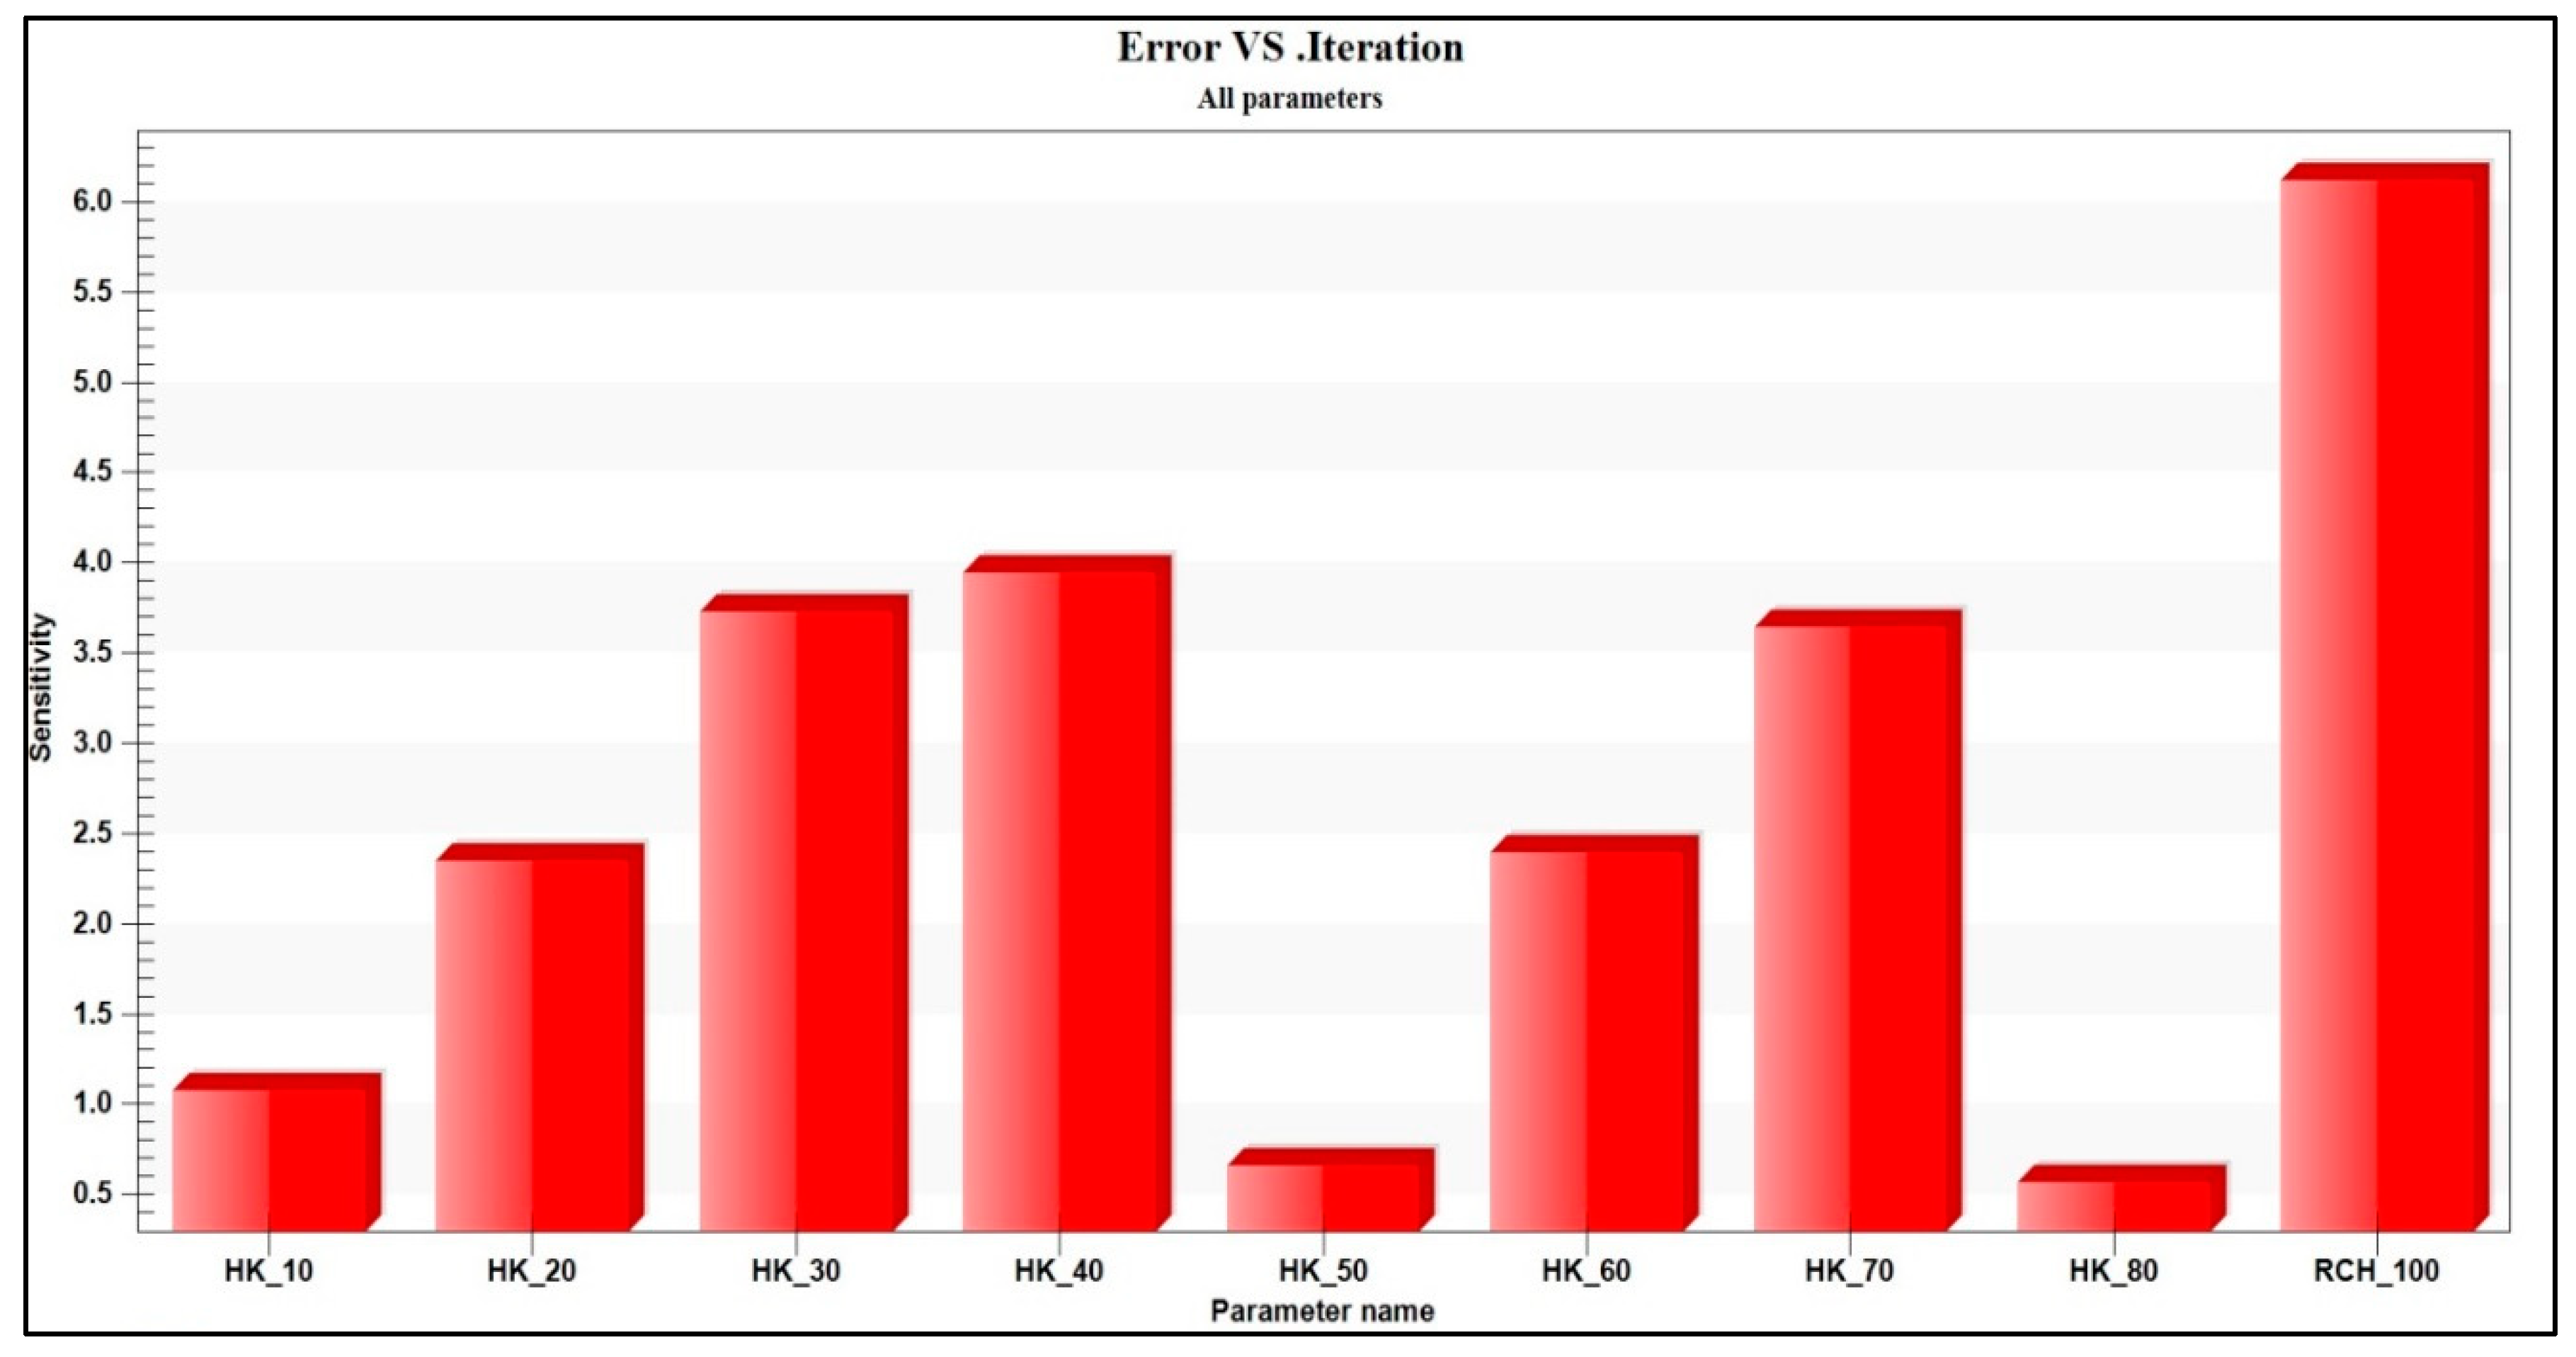
3.3. Sensitivity Analysis

Sensitivity analysis is the method used to quantify the degree of uncertainty in a calibrated model as a result of unknown aquifer characteristics. The aim of sensitivity analysis was to comprehend how different model variables and hydrogeological stressors affect the aquifer and to identify the parameters which were most sensitive, thereby requiring special attention in future investigations. At the conclusion of the PEST iteration, sensitivity analyses for each of the parameters were carried out. As shown in Figure 11, hydraulic conductivity and natural recharging values at each site were examined for the steady state. In comparison to changes in hydraulic conductivity, the model was much more sensitive to variations in natural recharge. Compared to the other input characteristics, the largest zone (RECH-1) natural recharge had the greatest influence on groundwater levels. The simulation model results were significantly influenced by hydraulic conductivity parameters for the regions HK-30, HK-40, and HK-70. In comparison with other regions, the relatively small regions (HK-10, HK-20, HK-50, and HK-80) were less sensitive.

4. Conclusions

The artificial recharge of groundwater is an effective way to alleviate the current water resource crises and to improve the quality of water supplies. The effect of artificial recharge on groundwater levels in the Dibdibba unconfined aquifer, Iraq, was investigated using treated wastewater (tertiary treatment) from the WWTP in Kerbala. Groundwater flow and solute transport were simulated using a 3D numerical model (MODFLOW and MT3DMS) with GMS 10.6 software. The PEST tool was used for the automatic calibration of the created models. The steady-state and transient groundwater levels simulated for 2016–2017 were in agreement with the observed groundwater levels. Three scenarios were simulated using calibrated models. The first scenario applied the current situation circumstances without an artificial recharge, while the other scenarios applied artificial recharge (5000 and 10,000 m3/day) injected into a pond with an area of 0.25 km2, to demonstrate how the aquifer would perform between 2022 and 2030. The results revealed that during this time, a pond that was artificially recharged at rates of 5000 and 10,000 m3/day would result in annual increases in groundwater levels of more than 12.3 cm. This increase would result in the recovery of groundwater levels of up to 40 km2 for the new agricultural area. Consequently, a decrease in TDS and EC concentrations in groundwater could also be observed at approximately 1900 ppm for TDS and 1500 µ.S/cm for EC near the pond. The reclaimed area increased by 62.7 km2 for TDS and 77.4 km2 for EC. These results indicated that eight years of artificial recharge would result in a minimum recovery of groundwater levels of 20 cm, over a recovery area measuring 110 km2. Therefore, the application of the artificial recharge site should increase groundwater reserves and enhance water quality; the numerical modeling used here is indicative of artificial recharge being an effective approach for the conservation of groundwater. Furthermore, the artificial recharge had a considerable impact on salinity. The main limitations of this study were the hydrogeological features of the aquifer and the future estimates of the natural recharge and discharge that were used. In addition, in this study, only salinity was considered in the water quality assessment.
The findings of this study can assist decision-makers in developing strategies to reduce water scarcity and adapt to climate change. Moreover, other researchers can use it at full scale and implement further field tests to decrease the uncertainty of the study, as well as increase the number of water quality parameters, such as for heavy metals.

Author Contributions

Conceptualization, W.H.H. and B.K.N.; methodology, K.M.; software, W.H.H. and F.A.M.; validation, M.R., C.R. and A.A.J.G.; formal analysis, A.A.; investigation, W.H.H.; resources, B.K.N.; data curation, F.A.M.; writing—original draft preparation, F.A.M.; writing—review and editing, W.H.H., K.M. and C.R.; visualization, M.R.; supervision, W.H.H.; project administration, K.M. and B.K.N.; funding acquisition, K.M., M.R. and C.R. All authors have read and agreed to the published version of the manuscript.

Funding

This research received no external funding.

Data Availability Statement

All data are contained within the article.

Acknowledgments

This study has been funded by NUFFIC’s Orange Knowledge Programme, through the OKP-IRA-104278 project entitled “Efficient water management in Iraq switching to climate smart agriculture: capacity building and knowledge development” coordinated by Wageningen University & Research, the Netherlands. The authors extend their thanks to University of Warith Al-Anbiyaa, Iraq for financial support for this study.

Conflicts of Interest

The authors declare no conflict of interest.

References

  1. Shahid, S.; Alamgir, M.; Wang, X.J.; Eslamian, S. Climate change impacts on and adaptation to groundwater. In Handbook of Drought and Water Scarcity; CRC Press: Boca Raton, FL, USA, 2017; pp. 107–124. [Google Scholar]
  2. Hassan, W.H.; Hussein, H.H.; Nile, B.K. The effect of climate change on groundwater recharge in unconfined aquifers in the western desert of Iraq. Groundw. Sustain. Dev. 2022, 16, 100700. [Google Scholar] [CrossRef]
  3. Hassan, W.H.; Nile, B.K.; Mahdi, K.; Wesseling, J.; Ritsema, C. A feasibility assessment of potential artificial recharge for increasing agricultural areas in the Kerbala desert in Iraq using numerical groundwater modeling. Water 2021, 13, 3167. [Google Scholar] [CrossRef]
  4. Seeyan, S.; Akrawi, H.; Alobaidi, M.; Mahdi, K.; Riksen, M.; Ritsema, C. Groundwater Quality Evaluation and the Validity for Agriculture Exploitation in the Erbil Plain in the Kurdistan Region of Iraq. Water 2022, 14, 2783. [Google Scholar] [CrossRef]
  5. Baaloudj, O.; Badawi, A.K.; Kenfoud, H.; Benrighi, Y.; Hassan, R.; Nasrallah, N.; Assadi, A.A. Techno-economic studies for a pilot-scale Bi12TiO20 based photocatalytic system for pharmaceutical wastewater treatment: From laboratory studies to commercial-scale applications. J. Water Process Eng. 2022, 48, 102847. [Google Scholar] [CrossRef]
  6. Hassan, W.H.; Hashim, F.S. The effect of climate change on the maximum temperature in Southwest Iraq using HadCM3 and CanESM2 modelling. SN Appl. Sci. 2020, 2, 1494. [Google Scholar] [CrossRef]
  7. Gaznayee, H.A.A.; Al-Quraishi, A.M.F.; Mahdi, K.; Messina, J.P.; Zaki, S.H.; Razvanchy, H.A.S.; Hakzi, K.; Huebner, L.; Ababakr, S.H.; Riksen, M.; et al. Drought Severity and Frequency Analysis Aided by Spectral and Meteorological Indices in the Kurdistan Region of Iraq. Water 2022, 14, 3024. [Google Scholar] [CrossRef]
  8. Hassan, W.H. Climate change impact on groundwater recharge of Umm er Radhuma unconfined aquifer Western Desert, Iraq. Int. J. Hydrol. Sci. Technol. 2020, 10, 392–412. [Google Scholar] [CrossRef]
  9. Jarraya Horriche, F.; Benabdallah, S. Assessing aquifer water level and salinity for a managed artificial recharge site using reclaimed water. Water 2020, 12, 341. [Google Scholar] [CrossRef]
  10. Abraham, M.; Mathew, R.A.; Jayapriya, J. Numerical Modeling as an Effective tool for Artificial Groundwater Recharge Assessment. J. Phys. Conf. Ser. 2021, 1770, 012097. [Google Scholar]
  11. Ranganathan, P.C.; Chuluke, D.; Chena, D.; Senapathi, V. Artificial recharge techniques in coastal aquifers. In Groundwater Contamination in Coastal Aquifers; Elsevier: Amsterdam, The Netherlands, 2022; pp. 279–283. [Google Scholar]
  12. Islam, H.; Abbasi, H.; Karam, A.; Chughtai, A.H.; Ahmed Jiskani, M. Geospatial analysis of wetlands based on land use/land cover dynamics using remote sensing and GIS in Sindh, Pakistan. Sci. Prog. 2021, 104, 00368504211026143. [Google Scholar] [CrossRef]
  13. Bouwer, H. Artificial recharge of groundwater: Hydrogeology and engineering. Hydrogeol. J. 2002, 10, 121–142. [Google Scholar] [CrossRef] [Green Version]
  14. Al-Assa’d, T.A.; Abdulla, F.A. Artificial groundwater recharge to a semi-arid basin: Case study of Mujib aquifer, Jordan. Environ. Earth Sci. 2010, 60, 845–859. [Google Scholar] [CrossRef]
  15. Mohammed, M.H.; Zwain, H.M.; Hassan, W.H. Modeling the impacts of climate change and flooding on sanitary sewage system using SWMM simulation: A case study. Results Eng. 2021, 12, 100307. [Google Scholar] [CrossRef]
  16. Voudouris, K.; Diamantopoulou, P.; Giannatos, G.; Zannis, P. Groundwater recharge via deep boreholes in the Patras Industrial Area aquifer system (NW Peloponnesus, Greece). Bull. Eng. Geol. Environ. 2006, 65, 297–308. [Google Scholar] [CrossRef]
  17. Rambags, F.; Raat, K.J.; Zuurbier, K.G.; van den Berg, G.A.; Hartog, N. Aquifer Storage and Recovery (ASR): Design and Operational Experiences for Water Storage through Wells; PREPARED 2012.016, the Seventh Framework Programme; European Union/European Commission: Amsterdam, The Netherlands, 2013; 40p.
  18. Arya, S.; Subramani, T.; Karunanidhi, D. Delineation of groundwater potential zones and recommendation of artificial recharge structures for augmentation of groundwater resources in Vattamalaikarai Basin, South India. Environ. Earth Sci. 2020, 79, 102. [Google Scholar] [CrossRef]
  19. Bouri, S.; Dhia, H.B. A thirty-year artificial recharge experiment in a coastal aquifer in an arid zone: The Teboulba aquifer system (Tunisian Sahel). Comptes Rendus Geosci. 2010, 342, 60–74. [Google Scholar] [CrossRef]
  20. Kareem, I.R. Artificial groundwater recharge in Iraq through rainwater harvesting (Case Study). Eng. Tech. J 2012, 31, 1069–1080. [Google Scholar]
  21. Ali, M.T.; Saleh, S.A.; Gweer, A.N. Experimental Study of Artificial Recharge of Unconfined Groundwater Aquifer for Elected Sites in Salahaddin, Iraq. Iraqi Geol. J. 2022, 55, 162–175. [Google Scholar] [CrossRef]
  22. Vandenbohede, A.; Van Houtte, E.; Lebbe, L. Groundwater flow in the vicinity of two artificial recharge ponds in the Belgian coastal dunes. Hydrogeol. J. 2008, 16, 1669–1681. [Google Scholar] [CrossRef]
  23. Zhang, H.; Xu, Y.; Kanyerere, T. Site assessment for MAR through GIS and modeling in West Coast, South Africa. Water 2019, 11, 1646. [Google Scholar] [CrossRef]
  24. El Ayni, F.; Manoli, E.; Cherif, S.; Jrad, A.; Assimacopoulos, D.; Trabelsi-Ayadi, M. Deterioration of a Tunisian coastal aquifer due to agricultural activities and possible approaches for better water management. Water Environ. J. 2013, 27, 348–361. [Google Scholar] [CrossRef]
  25. Hassan, W.H.; Khalaf, R.M. November. Optimum Groundwater use Management Models by Genetic Algorithms in Karbala Desert, Iraq. In IOP Conference Series: Materials Science and Engineering; IOP Publishing: Bristol, UK, 2020; Volume 928, p. 022141. [Google Scholar]
  26. Al-Sudani, H.I.Z. Groundwater system of Dibdibba sandstone aquifer in south of Iraq. Appl. Water Sci. 2019, 9, 72. [Google Scholar] [CrossRef] [Green Version]
  27. Abdulameer, A.; Thabit, J.M.; Kanoua, W.; Wiche, O.; Merkel, B. Possible Sources of Salinity in the Upper Dibdibba Aquifer, Basrah, Iraq. Water 2021, 13, 578. [Google Scholar] [CrossRef]
  28. Al-Ghanimy, M.A. Assessment of Hydrogeological Condition in Karbala—Najaf Plateau, Iraq. Ph.D. Thesis, University of Baghdad, Baghdad, Iraq, 2018, unpublished. [Google Scholar]
  29. Nile, B.K.; Hassan, W.H.; Alshama, G.A. Analysis of the effect of climate change on rainfall intensity and expected flooding by using ANN and SWMM programs. ARPN J. Eng. Appl. Sci. 2019, 14, 974–984. [Google Scholar]
  30. Konikow, L.F. The secret to successful solute-transport modeling. Groundwater 2011, 49, 144–159. [Google Scholar] [CrossRef] [PubMed]
  31. Anderson, M.P.; Woessner, W.W.; Hunt, R.J. Applied Groundwater Modeling: Simulation of Flow and Advective Transport; Academic Press: Cambridge, MA, USA, 2015. [Google Scholar]
  32. Hassan, W.H. Climate change projections of maximum temperatures for southwest Iraq using statistical downscaling. Clim. Res. 2021, 83, 187–200. [Google Scholar] [CrossRef]
  33. FAO. The State of World Fisheries and Aquaculture, 1998; Food and Agriculture Organization, Fisheries Department: Rome, Italy, 1999. [Google Scholar]
Figure 1. The study location with the Karbala WWTP.
Water 15 00695 g001
Figure 2. Recharge and hydraulic conductivity zones of Dibdibba aquifer.
Water 15 00695 g002
Figure 3. Simulated heads after calibration of the study aquifer under steady state.
Water 15 00695 g003
Figure 4. Calibration simulated heads of the steady area during the transient simulation (19-Oct.-2017).
Water 15 00695 g004
Figure 5. Validation in four observation wells throughout the transient duration 2016 and 2017, (a) validation in observation wells 1 and 2, (b) validation in observation wells 3 and 4.
Water 15 00695 g005
Figure 6. The predicted groundwater elevation drops in 2030 over the study area without the use of artificial recharge.
Water 15 00695 g006
Figure 7. The impact of artificial recharge using a pond in 2030: increases in groundwater levels (a) between SIM2 and SIM1 and (b) between SIM3 and SIM1.
Water 15 00695 g007
Figure 8. Changes in groundwater table (m.a.s.l) at the observation well No.3 (a) for SIM2 and (b) for SIM3 during the simulation period.
Water 15 00695 g008
Figure 9. Effect of the artificial recharge on water quality under SIM2 simulation model (a) TDS and (b) EC for the period 2022–2030.
Water 15 00695 g009
Figure 10. Effect of the artificial recharge on water quality under SIM3 simulation model (a) TDS and (b) EC for the period 2022–2030.
Water 15 00695 g010
Figure 11. Model parameter sensitivity analysis.
Water 15 00695 g011
Disclaimer/Publisher’s Note: The statements, opinions and data contained in all publications are solely those of the individual author(s) and contributor(s) and not of MDPI and/or the editor(s). MDPI and/or the editor(s) disclaim responsibility for any injury to people or property resulting from any ideas, methods, instructions or products referred to in the content.

