
Experimental Study on the Purification Mechanism of Mine Water by Coal Gangue

1
Key Laboratory of Deep Coal Resource Mining (CUMT), Ministry of Education, Xuzhou 221008, China
2
School of Mines, China University of Mining & Technology, Xuzhou 221116, China
*
Author to whom correspondence should be addressed.
Water 2023, 15(4), 697; https://doi.org/10.3390/w15040697
Submission received: 9 January 2023
/
Revised: 7 February 2023
/
Accepted: 9 February 2023
/
Published: 10 February 2023
(This article belongs to the Section Wastewater Treatment and Reuse)
Abstract
:Coal mining has caused groundwater pollution and loss. Using a mined area as a water storage space for storing and purifying mine water is a low-cost environmentally friendly mining method. In this study, static and dynamic adsorption experiments on the ions in mine water were carried out using the roof rocks from the Lingxin coal mine. The sample analysis results show that the main chemical composition of the roof is mainly SiO2 and Al2O3. The water chemistry type of the mine water is SO4-HCO3-Cl-Na type, with an average mineralization of about 4000 mg/L. The experimental results show that gangue can stabilize the pH value of mine water with different pH values between 7.5 and 8.5. In the acidic and alkaline environment, the degree of void space increases the adsorption capacity of the gangue, in which the adsorption rate of gangue is between 3% and 5%. The calcium ion reduction rate reaches 75% in static leaching and 70% in dynamic leaching conditions. Medium-grained coarse sandstone has a stronger adsorption capacity than muddy siltstone. The results from this study can support further research on using gangue for water purification purposes in mines, simultaneously reducing the harmful accumulation of gangue and promoting the recycling of highly mineralized water.
1. Introduction
An average of 1.87 m3 of mine water is produced for every t of raw coal mined, generating approximately 6.8 × 10⁹ m3 of mine water per year. The average utilization rate of mine water in coal mines is approximately 35%, resulting in plenty of water wastage [1]. Coal mine water can be divided into five types: clean mine water, mine water with suspended matter, highly mineralized mine water, acidic mine water, and especially polluted mine water [2]. For a long time in the past, excess mine water from coal mine production was considered a disaster that needed to be prevented and controlled. Most coal mine water was discharged directly to surface reservoirs and treated by coagulation, sedimentation, and filtration to meet water quality standards before being returned for underground use; this was a costly and inconvenient treatment method [3,4,5]. Presently, some scholars have proposed employing the concepts of underground coal mine reservoirs and the underground storage and utilization of mine water [6]. This involves using the storage holes in rock voids formed by coal mining; connecting stable coal pillars with artificial dams to form reservoir dams; simultaneously constructing entry and extraction facilities for mine water, which completely exploits the natural purification effect of the rocks in the mining area on the mine water; constructing underground coal mine reservoir projects [7,8,9]. These concepts are original technological breakthroughs in that they use blocking for water preservation and employ the idea of guided storage to channel mine water to an underground mining area for storage and use, avoiding problems such as evaporation losses from external discharges and high construction and the running costs of surface water treatment plants [10,11,12].
Plenty of coal gangue is generated during coal mining [13,14,15]. The long-term stockpiling of coal gangue wastes a lot of land resources and affects the ecological environment, while the water pollution of the surrounding soil and groundwater produced by the chemical reactions of gangue during leaching create a greater environmental harm [16,17,18,19,20]. Scholars have proposed many strategies to improve the treatment of gangue to deal with the hazards resulting from it [21,22,23,24,25,26]. Technology for the treatment of coal gangue is divided into surface treatment and underground treatment technologies. Surface treatment technology is mature; the coal gangue is used for industrial and agricultural purposes [27,28,29,30,31,32]. Underground treatment aims to eliminate or reduce the amount of gangue. The main methods include infill mining and digging more coal tunnels [33,34,35,36,37,38]. There are many clay minerals in the gangue with good porosity and adsorption properties [37,39]. Mine water can be reused through purification with rock–water interactions [40,41,42,43]
The Lingxin coal mine in the Ningdong mining area of China is a highly mineralized mine water producing mine, which is characterized by high salinity, high hardness, and weak alkalinity. Water discharge directly to the surface can damage the groundwater environment and affect the growth of surface vegetation. Mine water needs to be purified before it can be discharged into surface reservoirs. At present, the main method of treating highly mineralized mine water is a combination of up- and down-hole phase separation, with long reverse osmosis treatment processes, unstable process operation, and high system operating costs. The mineral composition and void structure in coal gangue afford a natural adsorption capacity. Mine water can be stored in the coal mining area, using the adsorption effect of coal gangue to purify the highly mineralized mine water. However, the current static and static adsorption process and the adsorption efficiency of gangue on soluble solids in mine water are not sufficiently understood. Gangue purification conditions and purification capacity are important parameters in the design of underground water reservoirs. To reveal the mechanism of purifying highly mineralized mine water, reduce the cost of the membrane separation method for deep treatment of highly mineralized mine water, backfill the coal gangue in situ in the mining area, and explore the feasibility of construction of an underground water reservoir in Lingxin coal mine, static adsorption and dynamic adsorption experiments of mine water ions were conducted using the roof rock layer of the main mining seam of Lingxin coal mine. A new mine water dynamic drenching device was designed based on existing studies [8] to allow adequate mixing of the liquid and rock samples and to prevent clogging. It also changed the flow direction of the liquid and added a secondary drenching, eliminating interference with sample testing. It ensures that the water and gangue are well mixed and do not easily block the outlet. Using test and analytical instruments, the sorption characteristics of calcium ions in mine water were investigated for different acidity and alkalinity values and calcium ion concentrations in the roof rock layer. The purification mechanism of gangue on mine water was revealed from a microscopic perspective, providing an important basis for the design of underground water reservoirs in coal mines.
2. Materials and Methods
2.1. Samples
2.1.1. Coal Gangue
The roof rocks of the main coal seams in the Lingxin coal mine, namely coal seam Nos. 14, 15, and 16, were selected for this test. A simple stratigraphic survey report of the mine contained details on the coal seams. The average thickness of coal seam No. 14 was 2.8 m, the immediate roof of this seam comprised slabbed muddy siltstone (MS14) with charcoal bands, and it was dark grey and thickly-laminated; coal seam No. 15 was medium-thick with an immediate roof of slabbed muddy siltstone (MS15); the average thickness of coal seam No. 16 was 3.32 m, and the immediate roof of the coal seam was medium-grained coarse sandstone (MCS16) with charcoal bands and long blocks, which were relatively hard. The gangue in the goaf was mainly composed of coal seam roof. After sampling from the roof of coal seam Nos. 14, 15, and 16, the samples were packed with plastic wrap and transported to the laboratory. Rock samples from the roof of these coal seams were sampled with attention to multiple point selection, and the sampling locations were identified at uncontaminated locations. The samples were broken by a crusher. Using different particle-size sieves, the rock samples were ground to a 200-mesh powder with a particle size of 20–30.
2.1.2. Mine Water
Different locations in the coal mine were selected for groundwater collection and tested for ion concentration. Based on the test results of the quality of the mine water, similar mine water solutions were prepared. It was used for both static leaching experiments and dynamic leaching experiments. The configured mine water solution had sodium, calcium, magnesium, bicarbonate, sulphate, and chloride ion concentrations of 1200, 200, 200, 600, 1000, and 1500 mg/L, respectively.
2.2. Methods
2.2.1. Microscopic Observation of Thin Sections of Rock
The roofs of the three coal seams were ground into rock flakes. Then, a Nikon LV100 trans-reflective polarizing microscope was used to identify the composition and distribution of the minerals of the ore in these flakes.
2.2.2. X-ray Powder Diffraction (XRD) Analysis
The gangue samples were ground into a 325-mesh powder with a sample mass not below 1.0 g. A D8 ADVANCE-type X-ray diffractometer was used for mineral composition testing; a Cu target with Kα rays at a wavelength of 0.154 nm was the excitation source, and a sweep speed of 4°/min in the range of 10–80° was used. The X-ray powder diffraction (XRD) data were analyzed and processed using JADE 9.0 software, and the mineralogical compositions of the three roof rock samples were identified through comparison with data in the Powder Diffraction File (PDF) of the International Centre for Diffraction Data.
2.2.3. X-ray Fluorescence (XRF) Spectroscopy
The elemental spectra of the rock samples were characterized by X-ray fluorescence (XRF) spectrometry, which was used to obtain the elemental composition and content of the rock samples. The three top slab samples were ground to a powder form below 200 mesh and quantified using an XRF spectrometer—from Bruker AXS GmbH, Germany—with the following specifications: elemental range: 48e-92U; elemental quantification range: ppm to 100%; maximum power/current: 4 kW/170 mA.
2.2.4. Scanning Electron Microscopy (SEM) and Energy-Dispersive X-ray Spectroscopy (EDS)
The gangue specimens of the three coal seam Nos. 14, 15, and 16 with the different lithologies: coal-roof muddy siltstone, coal-roof muddy siltstone, and coal-roof medium-grained coarse sandstone, respectively, were ground into a 200-mesh powder and subjected to SEM experiments using a Japanese Hitachi 10 kV test voltage SEU8010 scanning electron microscope; the surfaces of the specimens were gold-sprayed for 120 s to enhance their electrical conductivity before the experiments.
2.2.5. Ion Concentration Test
During the experiments, the collected ion concentrations of the solutions were tested by the 7900 inductively coupled plasma–mass spectrometry (ICP-MS).
2.2.6. Static Leaching of Gangue
To investigate the adsorption characteristics of the top slab in different acidic and alkaline solutions, static immersion experiments were carried out on the rock samples. In the experiment, 100 g of rock sample with a 200-mesh sieve was weighed in a plastic basin, and 1000 mL of prepared soaking solution was added. The soaking solution was prepared according to the composition of each ion in the mine water. Then, the basin was sealed with a lid, the solid-to-liquid ratio was set at 1:10, and the mixture was stirred and tested regularly. As the roof layers of the coal seam Nos. 14 and 15 were lithologically similar, the siltstone of the roof of coal seam No. 15 and the medium-grained coarse sandstone of the roof of coal seam No. 16 were taken as the experimental objects, and the potential of hydrogen (pH) was set at 4, 6, 8, and 10. Deionized water was used instead of the prepared mine water solution to protect the experimental results from the influence of the experimental operating environment and operating procedures. The experimental details are shown in Table 1.
2.2.7. Dynamic Leaching of Gangue
We used a self-developed leaching and filtration experiment to simulate the permeation and migration of mine water in underground rock formations. The leaching unit was divided into three main parts: the leaching, filtration, and testing sections. The filtration section controlled the filtration rate by modifying the height of the tank containing the prepared mine water solution; the mine water flowed from the bottom upwards to ensure that the mine water mixed well with the rock sample, while facilitating the discharge of air from the acrylic tube. The rock sample was placed evenly in the filtration tube and compacted; a nylon mesh was added to the filtration tube to prevent the rock sample from flowing into the rubber tube and blocking the pipeline. The filtration section was mainly used to filter the mine water samples. After the mine water was drained by the rock samples, there were many solid impurities in the water. Thus, first, the length of the water flow path was increased to precipitate a lot of impurities and, simultaneously, a filtering cotton cloth and filter paper were used to filter the water solution. The test section employed a precision pH meter, calcium ion electrode, and total dissolved solids (TDS) meter to monitor the parameters of the dripping solution, and the samples were retained for later testing. The drip filtration experimental setup is shown in Figure 1; the setup includes an acrylic tube with an inner diameter of 4 cm and a height of 30 cm.
The experimental steps were as follows. (1) Before beginning the experiment, the leaching experimental device was cleaned once with tap water and then once with deionized water. The experiment was started after the water in the leaching tube had evaporated and left to stand for some time. (2) An amount of 100 g of rock samples of different particle sizes was placed in the dripping column, the prepared chemical solution containing the mine water was placed in the water tank, and the first reading of the solution was recorded. Then, all the parts of the dripping device were connected using rubber pipes and polyvinyl chloride (PVC) pipes, and each test probe was placed in the beaker for collecting the dripping solution. (3) The experiment was started after the tank containing the mine water was placed at the same height. The leaching column was fed from the bottom, and the water was discharged from the top. The water started to come out of the end of the experiment; this time was noted. A beaker at the outlet was used to take a sample of the leached liquid, and the leaching solution was tested for calcium ion concentration, pH, TDS, and other parameters at 5 min intervals. After the experiment, the dewatered rock samples were taken out and dried in a drying oven at 105 °C for 9 h; then, they were placed in sealed bags. Samples were sent to the analysis center for testing. The details of the dynamic leaching experiment are shown in Table 2, where DL means dynamically leached, MS means muddy siltstone, and MCS means medium-grained coarse sandstone; PS-4 means that the muddy siltstone was dynamically leached from a solution with pH = 4, and DL-PS-200 means that the muddy siltstone was dynamically leached from a solution with a calcium ion concentration of 200 mg/L.
3. Experimental Results and Discussion
3.1. Ions in Mine Water
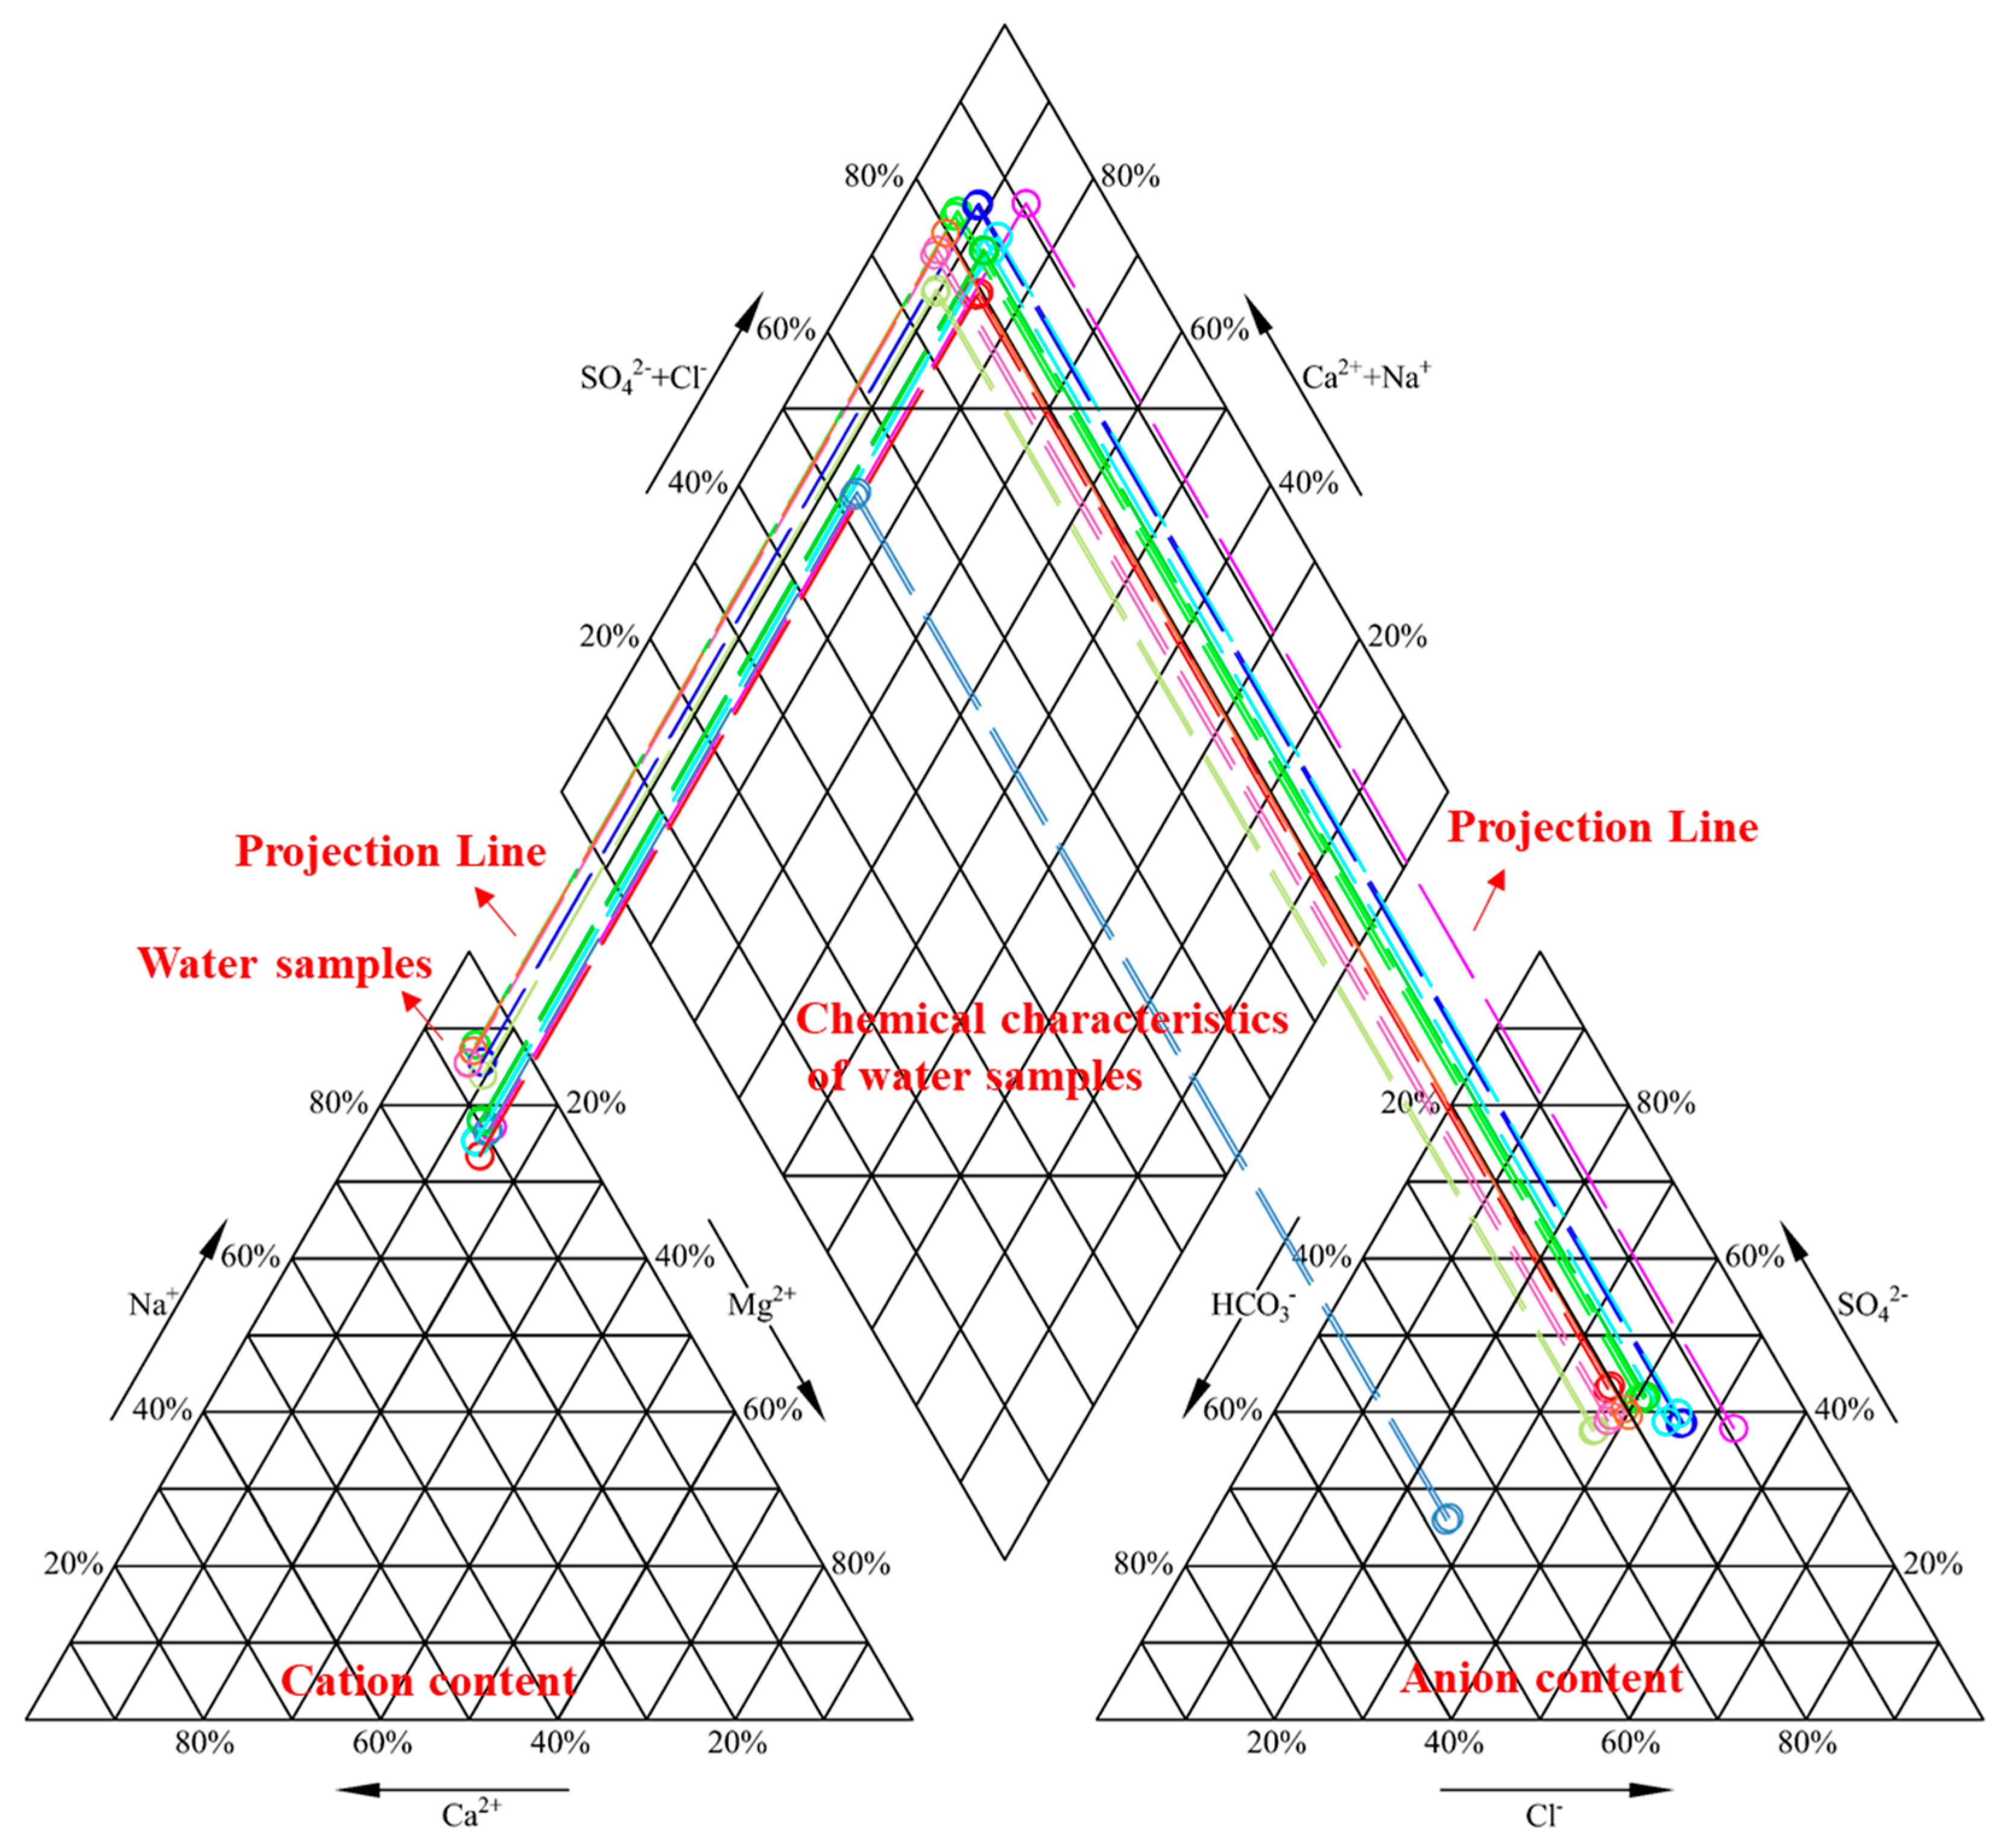
The AquaChem water quality analysis software was used to draw the piper trilinear diagram based on the test results for the ion concentration of the mine water. As shown in Figure 2, the mine water from the Lingxin coal mine was mainly dominated by cations such as Na+, Mg2+, Ca2+, and K+ and anions such as SO42−, Cl−, and HCO3−; the water chemistry type of the water was SO4·HCO3·Cl-Na; the solution was alkaline. According to the environmental quality standards for groundwater, the mine water in the Lingxin coal mine water belonged to class V, indicating that the water quality was poor.
3.2. Microscopic Characteristics of Gangue
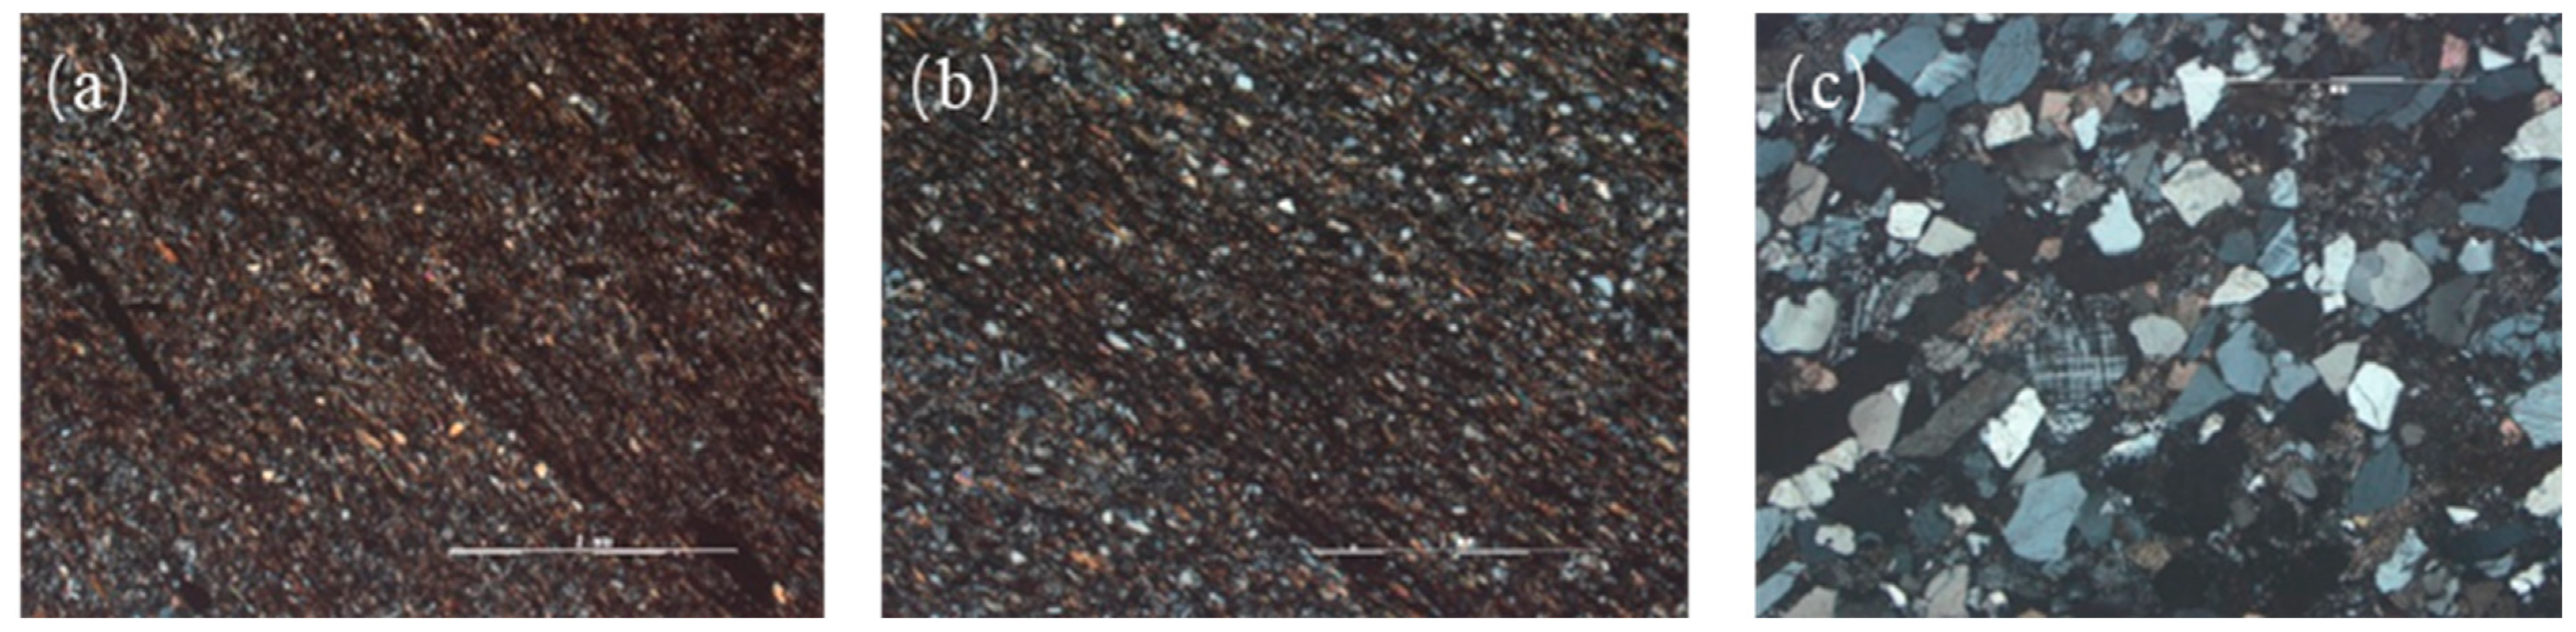
The roofs of coal seam Nos. 14 and 15 were lithologically similar and were both muddy siltstones; their surface microscopic features are shown in Figure 3a,b. The rocks mainly comprised a lot of siltstone, mixed with small amounts of Fe-mudstone, dolomite-sericitic mica, black mica, and chlorite. The chalky sandy material, mostly seen in the angular-sub-angular form, varied in size up to 0.05 mm, with an overall more uniform distribution of content and little differences in the grain sizes; the content was approximately 67%, mainly comprising quartz grains, with feldspars and rock chips in rare amounts. The quartz was colorless; the refractive index was in the range of 1.54–1.60, and the interference color was first-grade grey-yellowish white; the feldspar had a cloudier surface than that of the quartz due to alterations in the development; the rock chips were siliceous. The Fe-mudstone content was approximately 21%; these two components were intermixed and distributed between the chalky grains in a filled form that was mostly reddish-brown, with some of the mud forming fine white sericite mica, black mica, and chlorite through metamorphic recrystallization. The white sericite and black mica were scale-like and flaky, mostly appearing as mud formed due to the metamorphic crystallization; their particle sizes mostly varied below 0.15 mm, and they were approximately 10% in content. The chlorite was similar in morphology and grain size to those of the mica; it was pale yellow-green, had an anomalous or low-interference color, and was approximately 2% in content.
The roof of coal seam No. 16 comprised mostly debris, mixed with a small amount of gap fillers. The fragments were angular/sub-angular in shape, had grain sizes mostly between 0.5 and 1.4 mm—rarely between 0.25 and 0.5 mm—and were poorly rounded and sorted. The particles were mostly in non-contact or punctiform contact with one another, and they were basally colloidal. The flakes and gap-fillers were approximately 83 and 17% in content, respectively. The clasts ware mainly quartz, with rare amounts of feldspar and rock chips, and occasional amounts of black mica, white mica, and tourmaline. The quartz, feldspar, and rock chip contents were approximately 54, 25, and 3%, respectively; the black mica, white mica, and tourmaline contents were <1%. The quartz was colorless; it had a clean surface, positive low prominence, and first-class gray interference color. The feldspar mainly comprised alkali feldspar and plagioclase. It had developed bicrystalline features, and some of its surfaces were cloudy compared to those of the quartz due to weak alterations. The rock chips were mainly siliceous. The black and white mica were flakish, yellowish-brown, and colorless; they formed a group of very complete décollements, with a secondary-tertiary vivid interference color. The tourmaline was mesoscopic and had a primary orange-yellow and secondary vivid interference color. The interstitial fillings were distributed between the debris particles in a filled form; the composition was mainly mud, chalky, and sandy with rare amounts of opaque minerals such as calcium and iron. The mud and silt contents were each approximately 8%, and the content of opaque minerals such as calcium and iron was <1%. The mud and silt, both of which were mixed in multiple phases, were locally agglomerated. The mud was pale yellowish-brown and weakly luminous; the silt mainly consisted of quartz grains that were calcareous with a high white interference color and opaque minerals that were ferrous, granular, dusty or colluvial, and black or blackish brown.
The SEM observation test results show that there were many holes and fissures on the surfaces of the gangues of the MS14, MS15, and MCS16 specimens. The muddy siltstone had longer and pore-like fissures and laminated clay minerals on the surface. These specimens were physically adsorbed owing to the water chemistry of the leaching solution, and the numerous fissures on their surfaces made it easier for them to form fissures under the action of the leaching solution, causing many soluble components to dissolve in the leaching solution. The medium-grained coarse sandstone had many randomly distributed pores that had not been penetrated to form obvious fissures. The surface was relatively poorly leveled, with many small grains.
3.3. Chemical Composition of Gangue
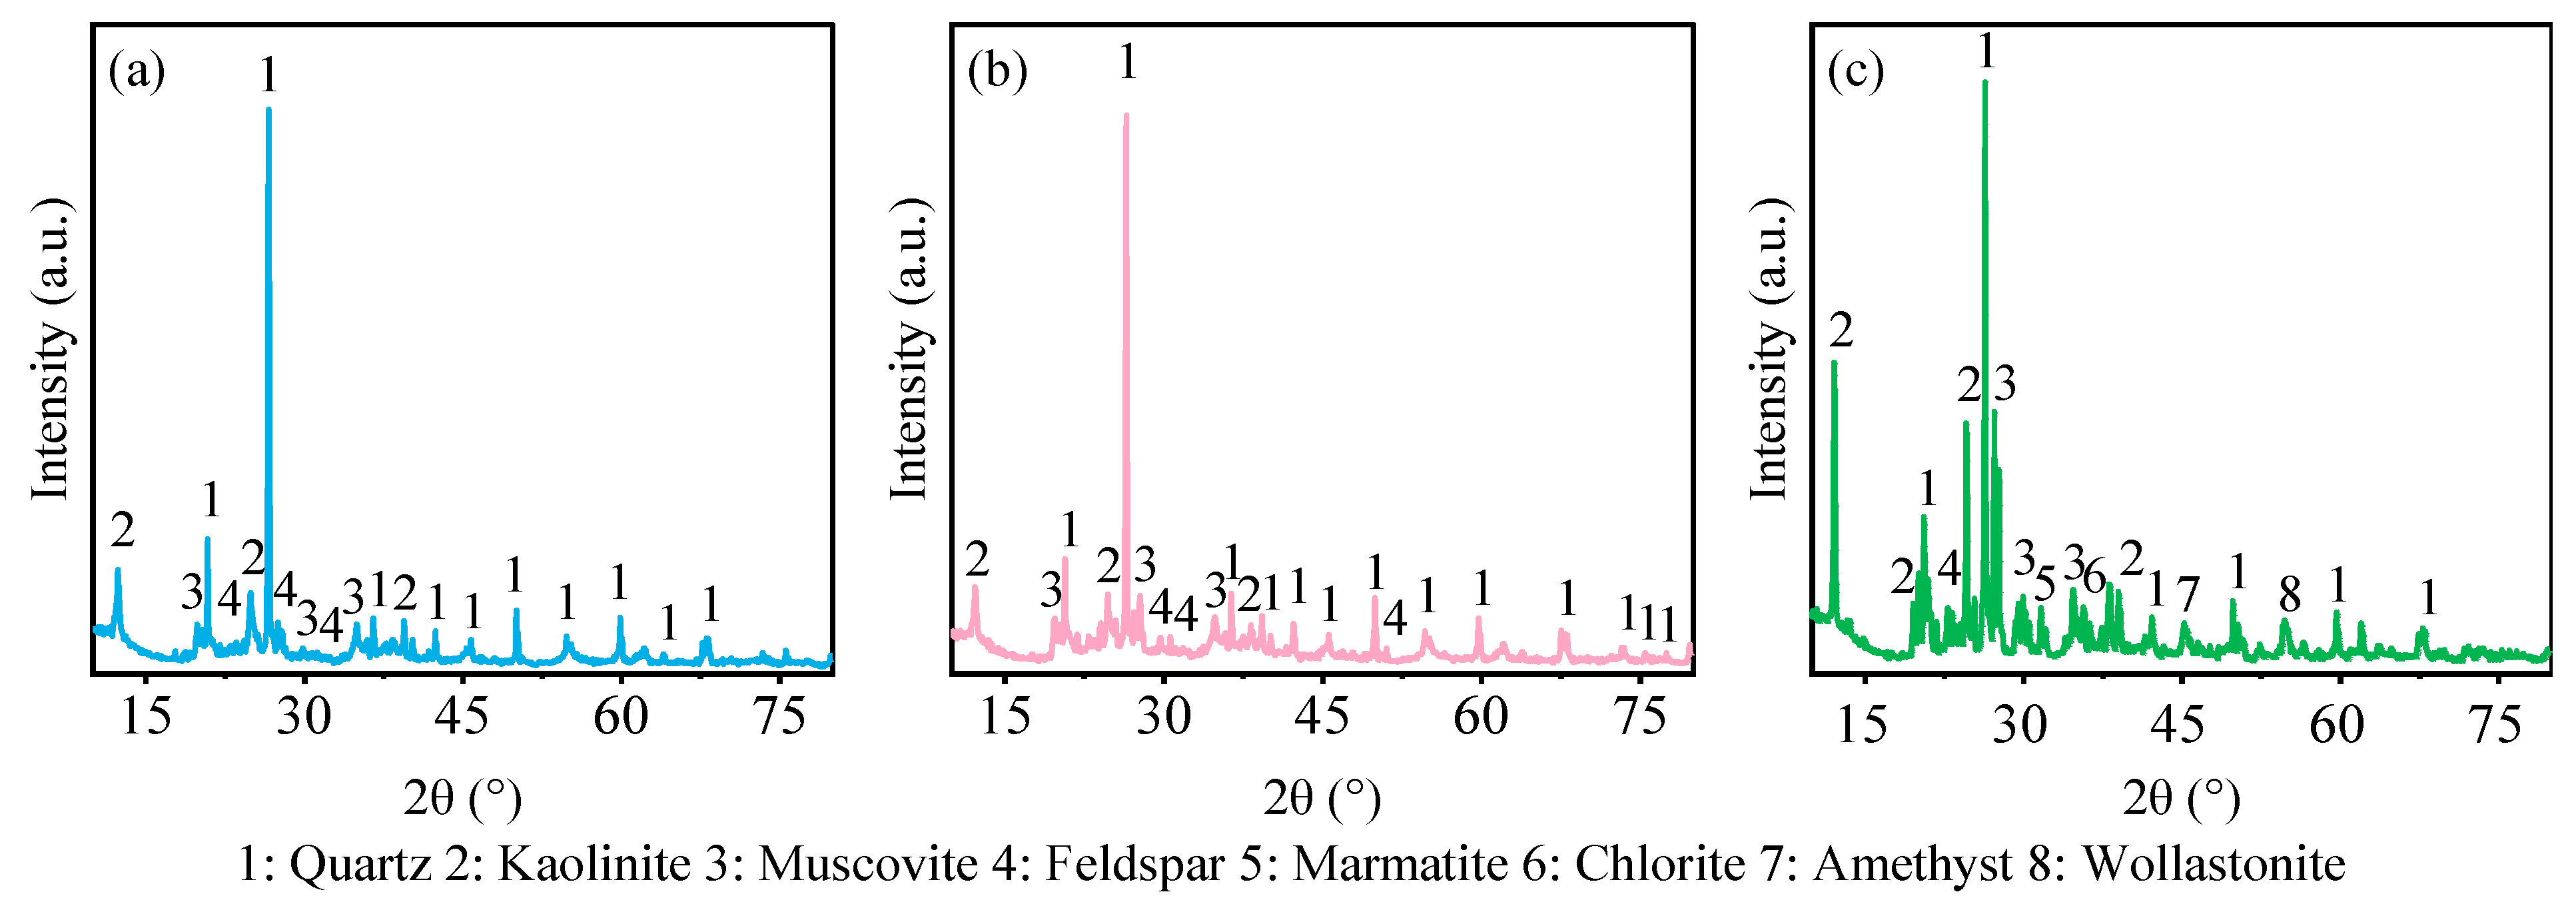
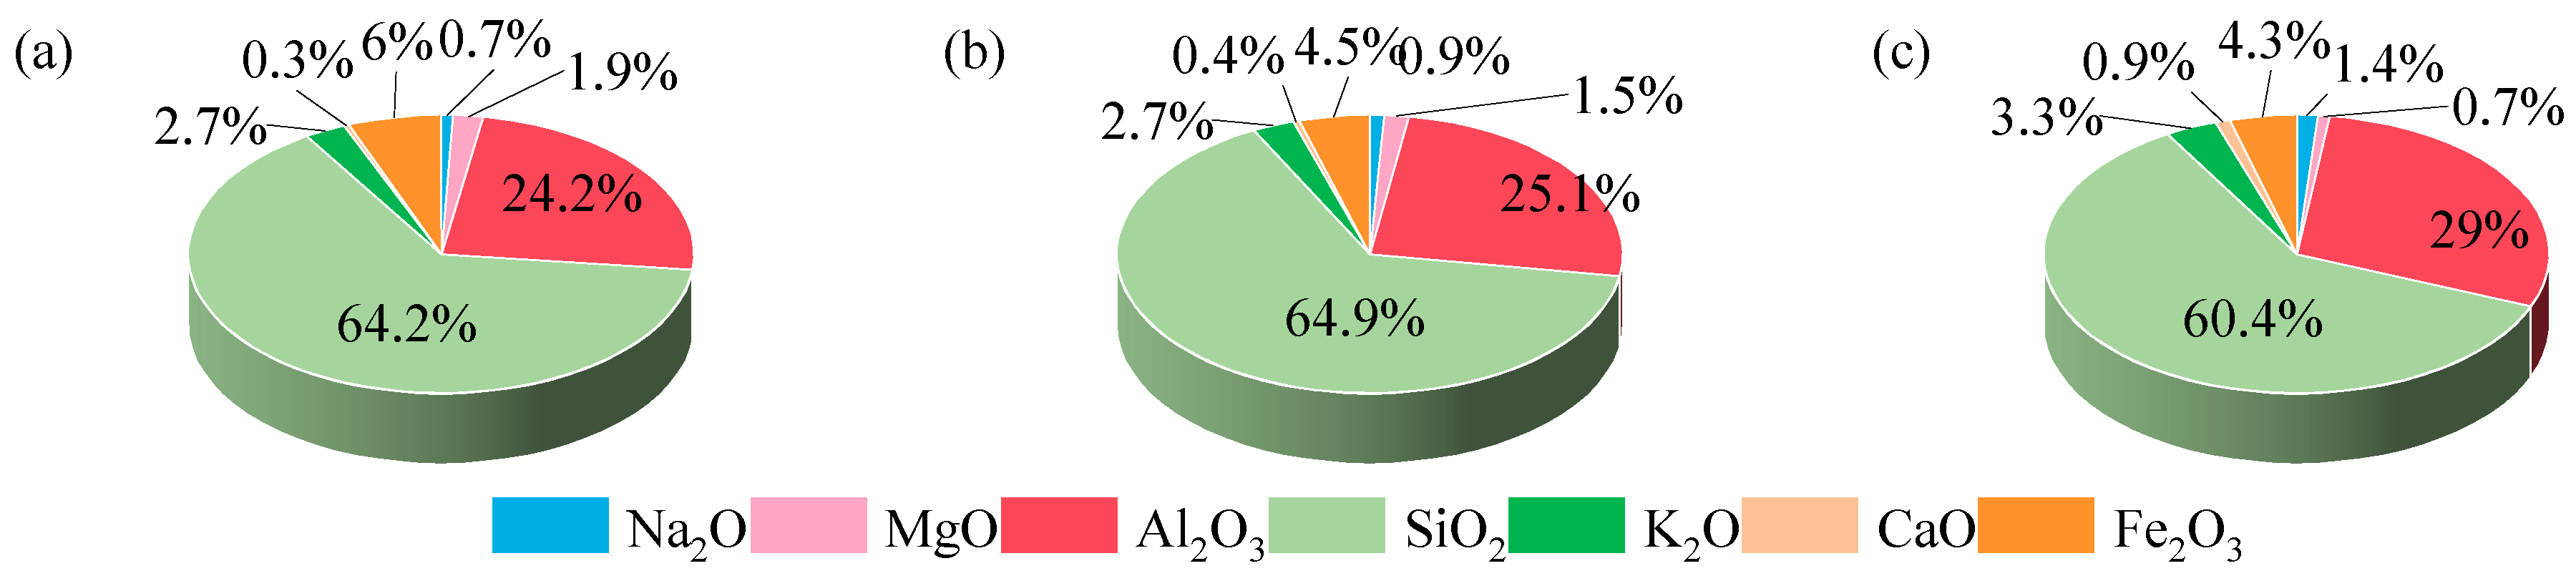
Figure 4 and Figure 5 show the mineral compositions of the three rock samples, MS14, MS15, and MCS16; they mainly comprised quartz, kaolinite, muscovite, and feldspar. Quartz was the predominant mineral component of the three samples, and the kaolinite content of MCS16 was higher than those of MS14 and MS15. MCS16 contained small amounts of calcium-iron sphalerite, serpentine, purple silica-aluminum-magnesite, and silica-calcite. All three rock samples contained more than 50% quartz and more than 20% kaolinite, which is a clay mineral with a laminated structure and a certain degree of water absorption; it can adsorb more ions in mine water and purify mine water resources. Figure 6 shows that the rock samples from the roofs of coal seam Nos. 14, 15, and 16 were all siliceous rocks, with the SiO2 content exceeding 50%, Al2O3 content exceeding 20%, MgO and CaO content combined at approximately 1–2%, and the Fe2O3 content at approximately 4–5%. The presence of more silicate minerals in the rock samples resulted in a higher SiO2 content in them.
3.4. Static Adsorption Characteristics of Gangue
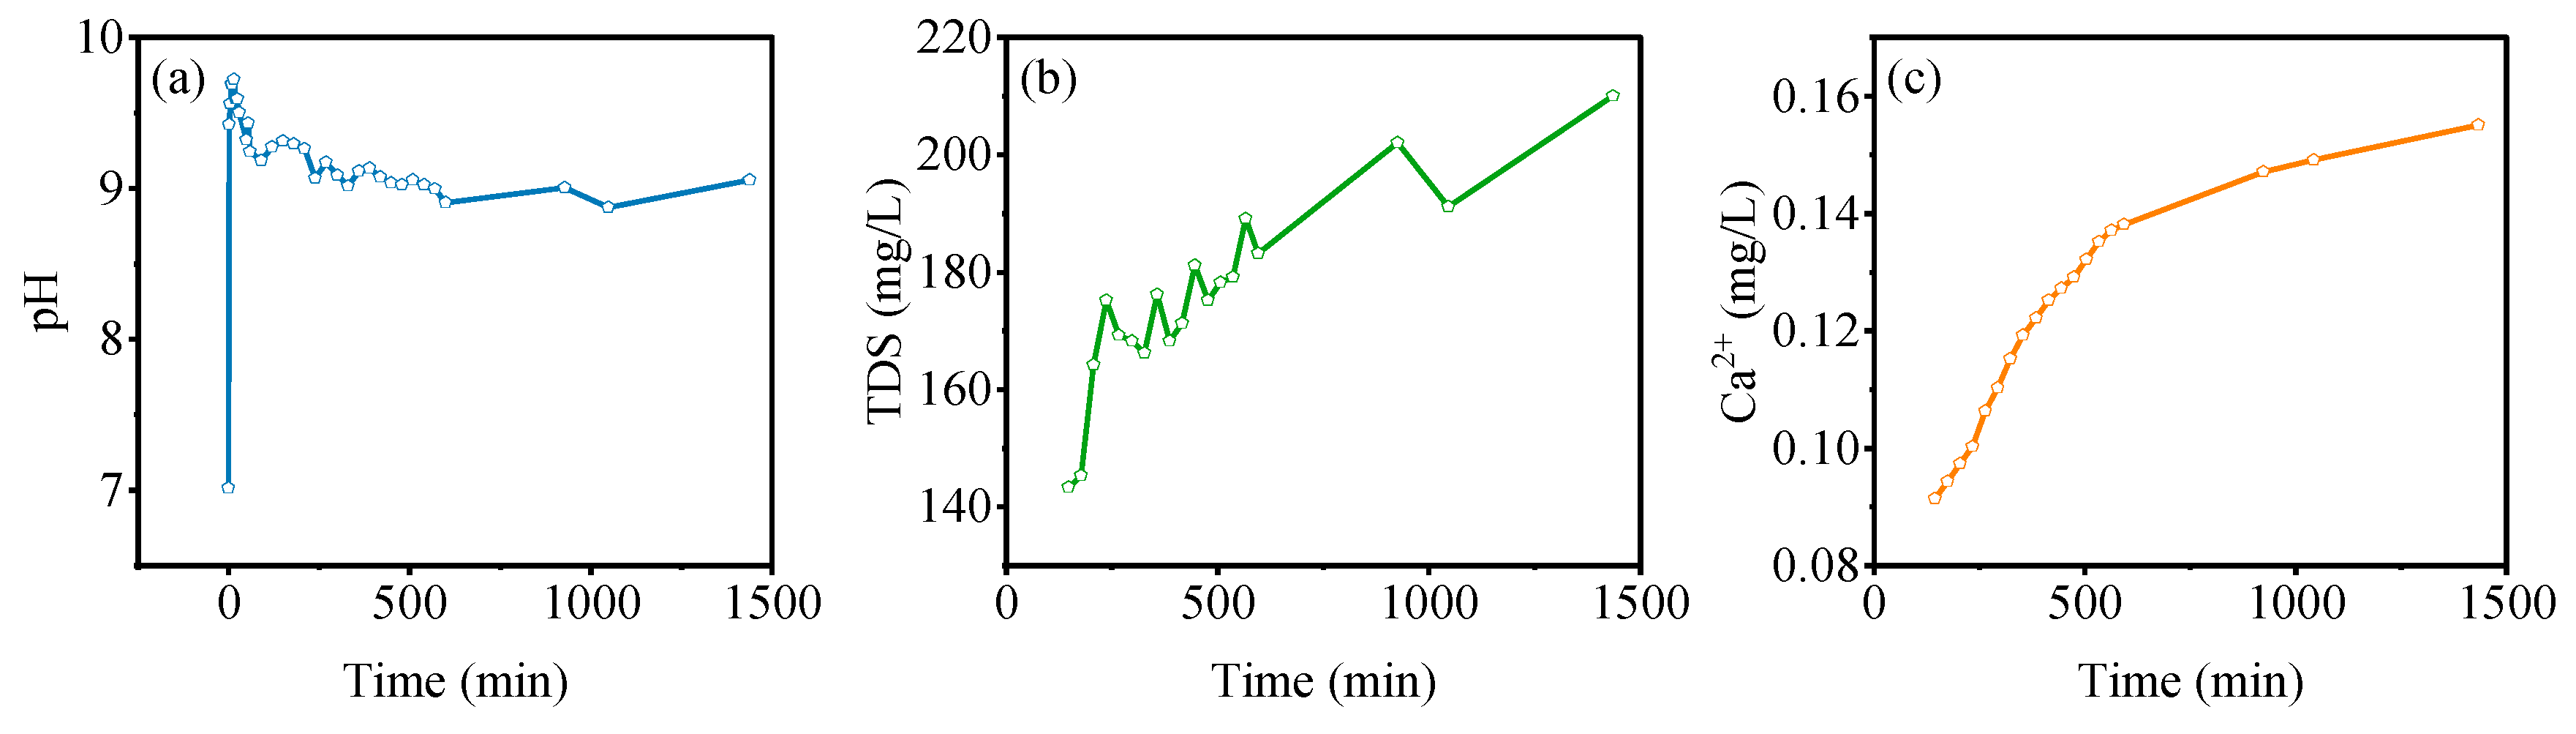
The muddy siltstone was soaked in deionized water, and some of the soluble components in the gangue were dissolved. Figure 7a shows the results; there was a rapid increase in the pH of the aqueous solution, followed by a slow decrease, with it remaining stable after 600 min, and finally stabilizing at around 9.0, showing a weak alkalinity. The rock sample can be adjusted to a weak alkalinity in the aqueous solution. Figure 8a shows that the different pH values of mine water solutions eventually tended to be between 7.5 and 8.5 with an increase in the soaking time, with all the solutions presenting a weak alkalinity; the pH value of the soaking solution changed faster in the early stage and less in the later stage. The acidic mine water solution had a large concentration of H+, which reacted with HCO3− ions in the aqueous solution to produce H2O and CO2 and reacted with metal oxides in the rock sample to produce metal ions and water; these two reaction processes caused the pH value to increase. The reaction equations are as follows:
The alkaline mine water solution with pH=10 had a large concentration of OH- ions, which reacted with the HCO3− ions in the mine water to produce H2O and CO32−; then, the pH value dropped rapidly. The reaction equation is as follows:
The muddy siltstone was soaked by deionized water and some of the soluble components in the gangue were dissolved, resulting in a weak alkaline aqueous solution. When the pH value of the mine water solution changed and stabilized, the ions in the mine water reached a dynamic equilibrium, and the pH value remained stable.
The muddy siltstone was soaked in deionized water, and the dissolution of some of the ions in the rock sample resulted in an increase in the TDS of the aqueous solution from 143 to 210 mg/L, as shown in Figure 7b. The TDS values of the mine water solutions of different pH values gradually decreased with the increase in soaking time, as shown in Figure 8b. When the mine water solution soaked the rock sample, the rock sample adsorbed the ions in the aqueous solution. Due to the ions in the aqueous solution, mineral precipitation occurred due to the ions in the aqueous solution, resulting in a decrease in the TDS value of the mine water solution.
As shown in Figure 7c, the muddy siltstone was soaked by deionized water, the calcium-containing minerals in the rock sample were dissolved, and the calcium ion concentration in the aqueous solution rose from 0.091 to 0.15 mg/L, and stabilized after 800 min. As shown in Figure 8c, the calcium ion concentration of the muddy siltstone fluctuated and decreased after soaking in different pH mine water solutions, reflecting the dynamic process of gangue adsorption and dissolution. A period of 800 min later, it finally stabilized. The calcium ion concentration in the solution decreased due to precipitation and adsorption when immersed in different pH mine water solutions. In this case, the calcium ion concentration finally decreased to 25 mg/L, with a removal rate of 87.5%. The rate of reduction of calcium ion concentration was significantly slower under acidic or neutral conditions than under alkaline conditions. Under acidic conditions, the calcium oxide present in the rock sample reacted with hydrogen ions to form calcium ions, the calcium ions in aqueous solution reacted with carbonate ions to form calcium carbonate precipitates, and the calcium ion concentration decreased, indicating that the sum of the precipitation of calcium ion minerals and the adsorption of calcium ions was greater than the dissolution of calcium-containing minerals. Under alkaline conditions, the calcium ion concentration decreased faster, first due to the difficulty of dissolving calcium-containing minerals and secondly due to the presence of CO32− and the formation of CaCO3 precipitation.
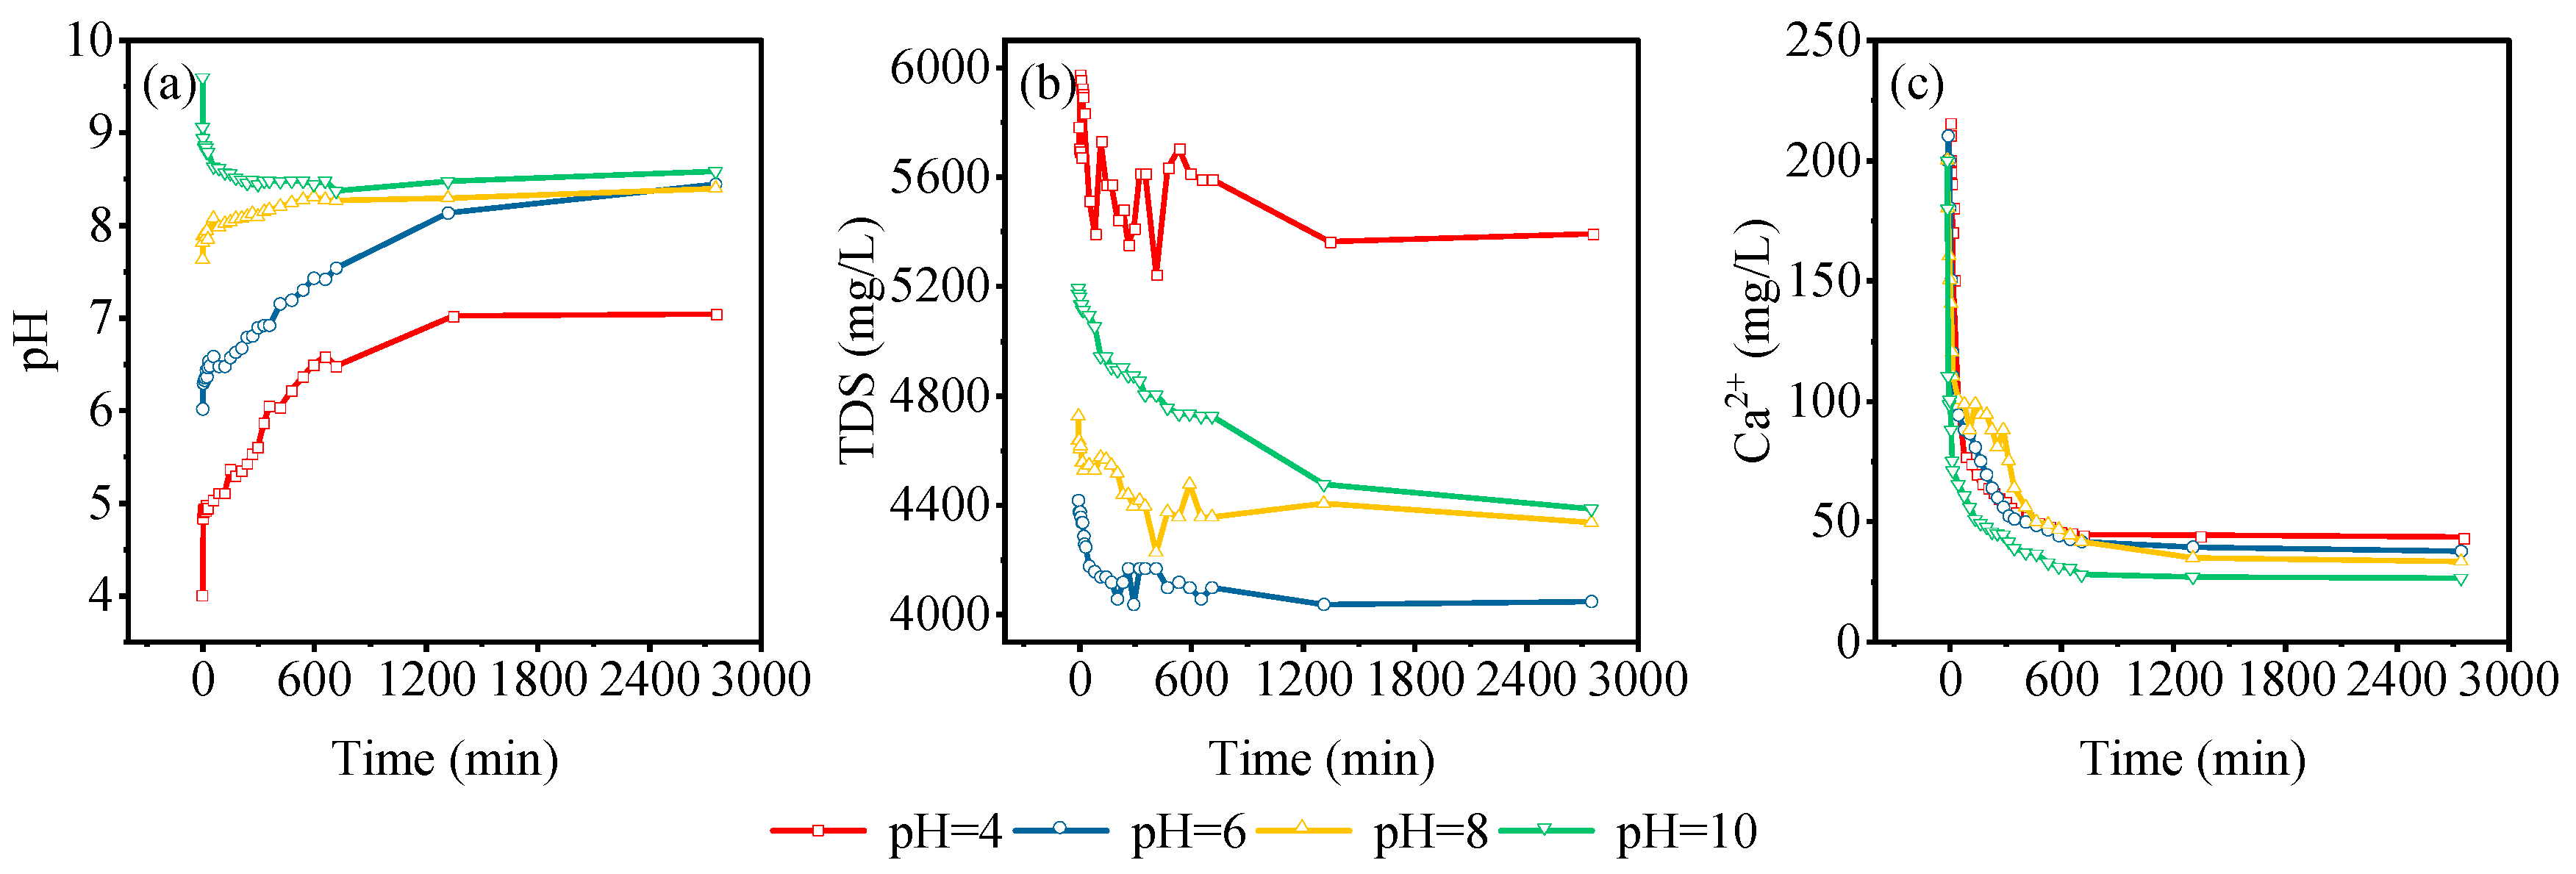
As shown in Figure 9a, after the deionized water was soaked through the medium-grained coarse sandstone, the pH value of the aqueous solution increased rapidly and decreased slowly to finally stabilize at around 8.5, showing a weak alkalinity. As shown in Figure 10a, the pH value of the mine water solution with different pH values eventually stabilized before 7.5–8.5 with the increase in soaking time, and the aqueous solution appeared weakly alkaline; the pH value of the mine water solution changed at a larger rate in the early stage of soaking, indicating that the acid–base balance of the aqueous solution was adjusted very quickly by the medium-grained coarse sandstone. The change in pH of the mine water solution after immersion in the medium-grained coarse sandstone was similar to that of the mine water solution after immersion in the clayey siltstone. Both rock samples can adjust the acidity and alkalinity of the mine water solution to a weak alkalinity. Under acidic conditions, hydrogen ions in the aqueous solution reacted with metal compounds to form metal ions and water, reducing the acidity of the mine water solution; under alkaline conditions, hydroxide ions in the aqueous solution reacted with bicarbonate in the water and CO2 in the air to form carbonate, which eventually combined with metal ions in the mine water to form a precipitate. At the same time, in the aqueous solution, some of the ions of the rock sample were easily dissolved in the water, promoting a weak alkalinity of the aqueous solution ions. The possible reaction equations are as follows. When the solution is acidic:
When the solution is alkaline:
When the pH of the mine water solution reached a stable value, the ion exchange between the aqueous solution and the rock sample reached a dynamic equilibrium, the aqueous solution reached stability, and the pH fluctuated within a range of 0.1.
As shown in Figure 9b, the medium-grained coarse sandstone was soaked in deionized water and the aqueous solution TDS value increased rapidly from 0 to a value of 120 mg/L within 800 min and then remained stable. As shown in Figure 10b, a significant decrease in the aqueous TDS value of the mine water solution was observed during the soaking process with different pH values of mine water. The rate of change in the aqueous solution TDS value was large within 700 min, and with the increase in soaking time, the rate of change became slower and eventually stabilized, with the adsorption rate reaching about 4%.
Rock–water interactions mainly include dissolution, precipitation, and adsorption. The deionized water solution gradually increased and stabilized the TDS value with immersion, indicating that some of the dissolved material in the rock sample was dissolved in the aqueous solution, resulting in an increase in the TDS value. A significant decrease in the TDS values was observed in the mine water at different pH values, indicating the precipitation of ions in the aqueous solution and adsorption of ions in the aqueous solution due to the presence of clay minerals in the rock samples. The lowering effect of the precipitation and adsorption on the ions in the aqueous solution was greater than the raising effect of the dissolution on the ions in the aqueous solution, which ultimately led to a gradual decrease in the TDS value in the aqueous solution.
After the medium-grained coarse sandstone was soaked in deionized water, the calcium-containing minerals in the rock sample dissolved, resulting in a gradual increase in the calcium ion concentration, which eventually rose to 0.32 mg/L, as shown in Figure 9c. Figure 10c shows the calcium ion concentration of different mine water solutions with different PH values gradually decreasing with an increase in the soaking time. The calcium ion concentration of the mine water solution varied greatly in the early stage, changing less in the later stage and eventually stabilizing. The calcium ion concentration removal rate reached 85%. The calcium ion concentration in the acidic mine water was greater than that in the alkaline mine water. The process was like the static leaching of the muddy siltstone. During the leaching in deionized water, the calcium ion concentration in the aqueous solution gradually increased and eventually reached equilibrium, stabilizing due to the dissolution of calcium-containing minerals. During the leaching of the mine water, there were a dissolution and precipitation of the minerals and adsorption of the clay minerals between the mine water and rock. As the combined effect of the adsorption and precipitation of calcium ions was greater than the effect produced by the dissolution of the calcium-containing minerals, the calcium ion concentration decreased.
3.5. Adsorption Characteristics of Dynamic Leaching of Gangue
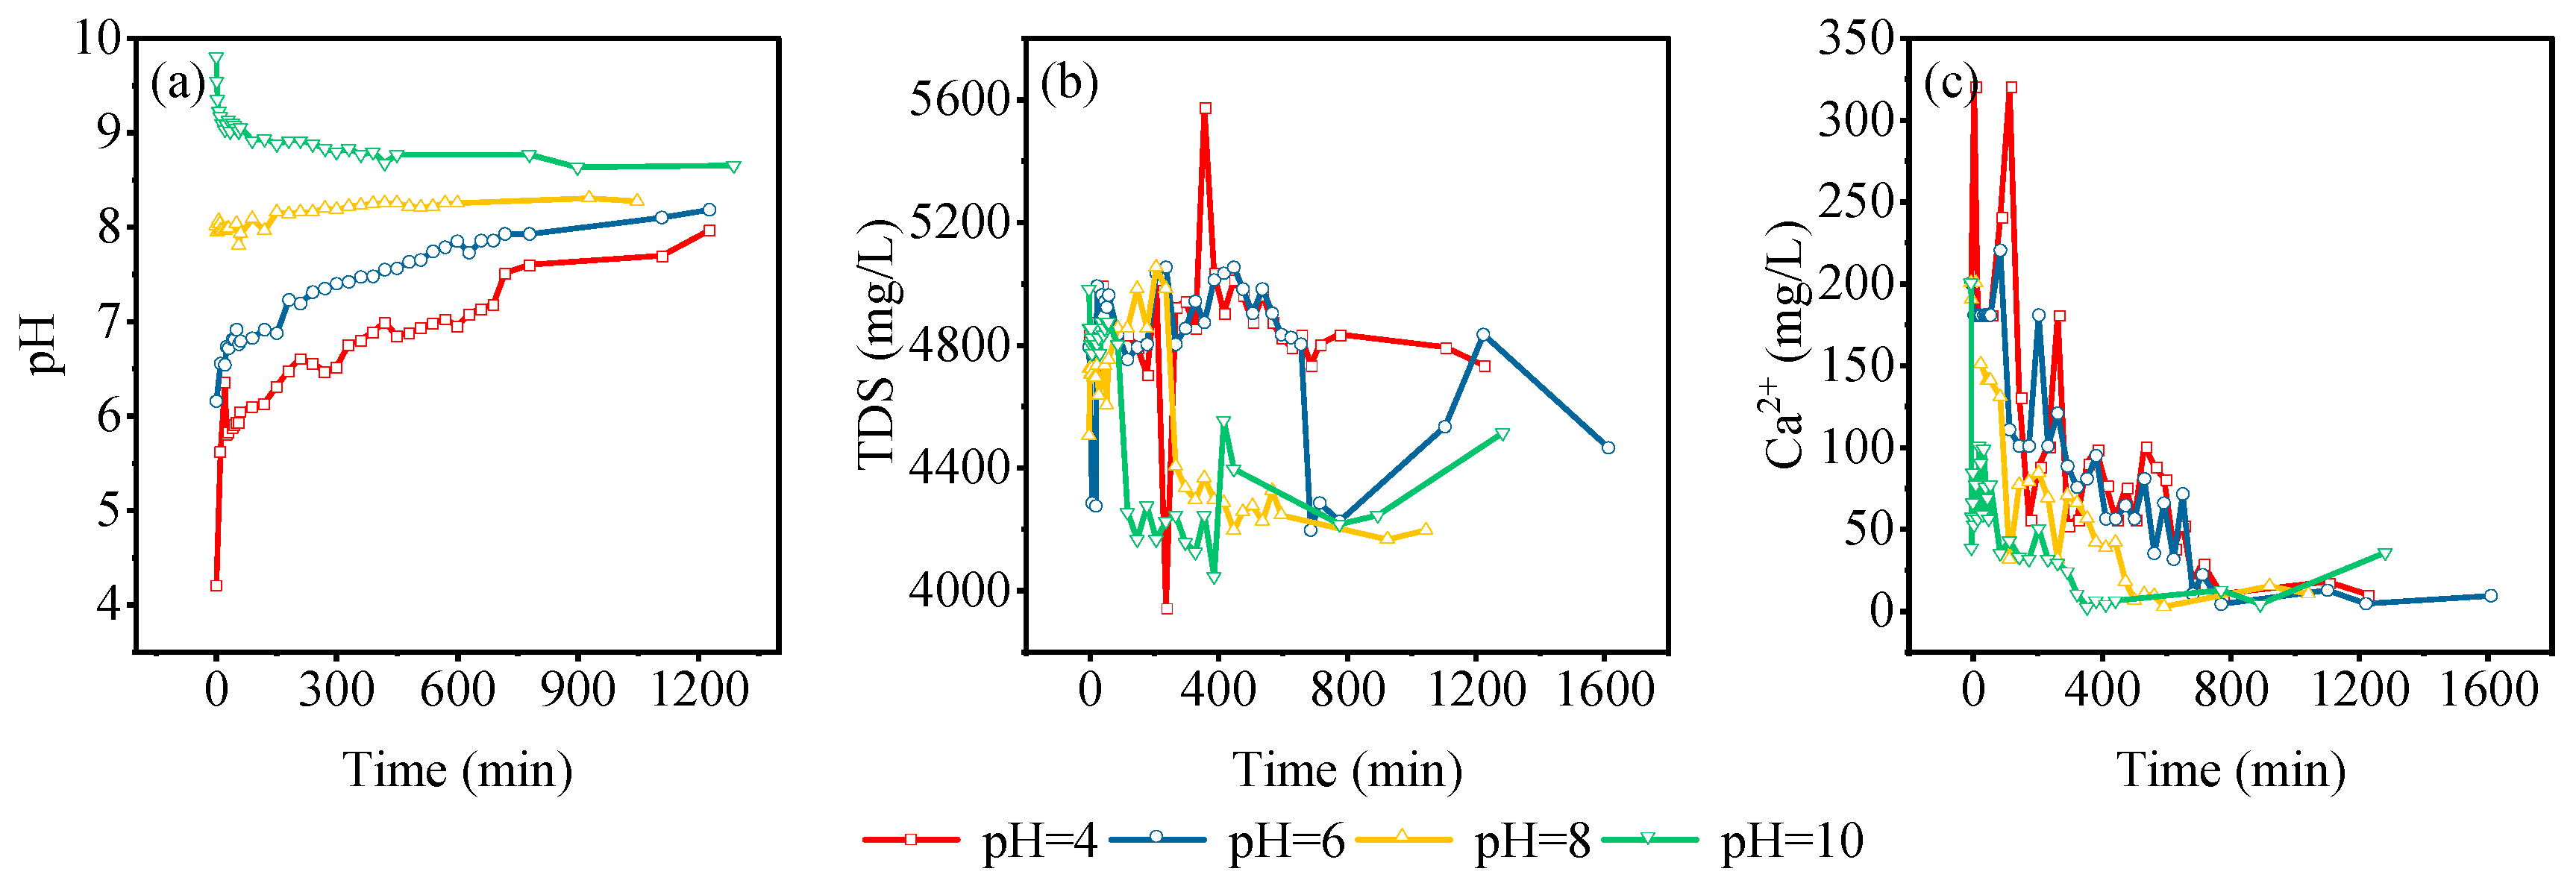
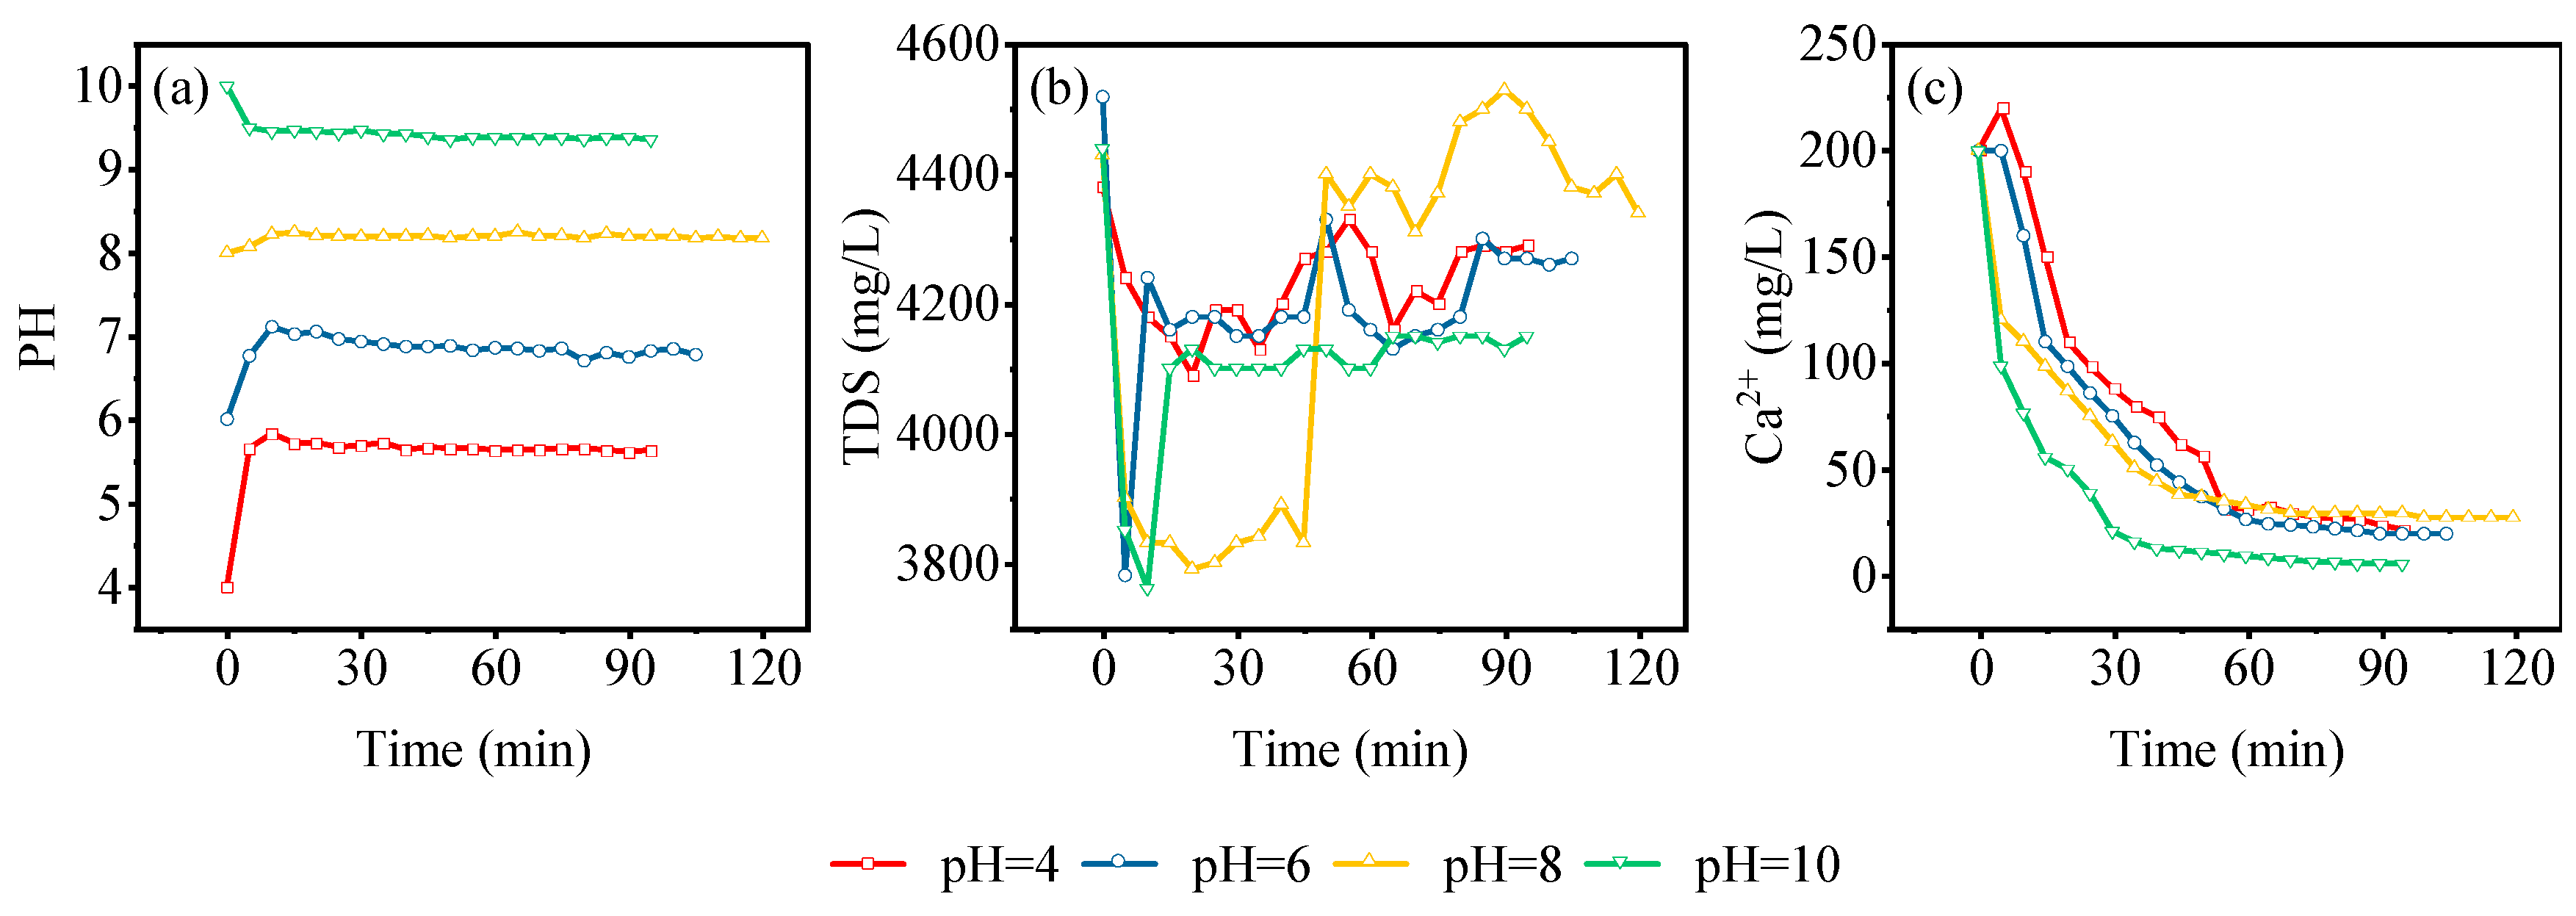
Figure 11a and Figure 12a show that the pH of the dewatering solution of the muddy siltstone and medium-grained coarse sandstone changed rapidly and eventually stabilized after dewatering with mine water of different pH values. The pH values of the dewatering solution of the muddy siltstone were stabilized at 6.25, 6.5, 8.2, and 8.5 after dewatering with mine water with pH values ranging from 4 to 10. The pH values of the dewatering solution of the medium-grained coarse sandstone were stabilized at 5.6, 6.8, 8.2, and 9.5 after dewatering with mine water with pH values ranging from 4 to 10. The pH values of the leachate were stabilized at 5.6, 6.8, 8.2, and 9.5; the rock samples were adjusted toward a weak base by depleting the solution of the hydrogen or hydroxide ions. In the dynamic leaching experiments, the contact time between the rock sample and solution was not as long as it was in the static leaching experiments, and the change in pH was less than under static leaching.
After the muddy siltstone and medium-grained coarse sandstone were leached by mine water solutions of different pH values, the TDS values of the leached solution decreased at 0–20 min and increased at 20–30 min, and finally stabilized, with the stabilized value being less than the initial one when pH = 4, 8, 10, as shown in Figure 11b and Figure 12b. However, when pH = 6, the TDS value of the solution showed different characteristics, decreasing at 0–20 min, then increasing to the initial value at 60 min, and decreasing to the initial value after 90 min. When the mine water solution was acidic or alkaline, the TDS value of the dripping fluid decreased more, and when the mine water solution was neutral, the TDS value of the dripping fluid decreased less. The leachate led to dissolution of the rock sample surface, increased void space, and enhanced adsorption. The TDS value of the leaching solution decreased gradually due to ion precipitation and adsorption in the mine water. The following chemical equations may be present in the solution.
As shown in Figure 11c and Figure 12c, the calcium ion concentrations in the dewatering solution decreased rapidly and eventually stabilized after the leaching of mine water at different pH values. During acidic mine water leaching, the calcium ion concentration first increased slightly or remained stable, and then decreased rapidly. Under acidic conditions, hydrogen ions in the mine water reacted with the calcium-containing minerals in the rock samples, which dissolved in the dewatering solution, while a small increase in calcium ion concentration occurred due to the adsorption of calcium ions by the rock samples and precipitation, followed by a rapid decrease and stabilization of calcium ion concentration due to the lowering effect of precipitation and adsorption on calcium ion concentration than dissolution. Alkaline conditions accelerated the precipitation of calcium ions, eventually leading to a rapid decrease in calcium ion concentration.
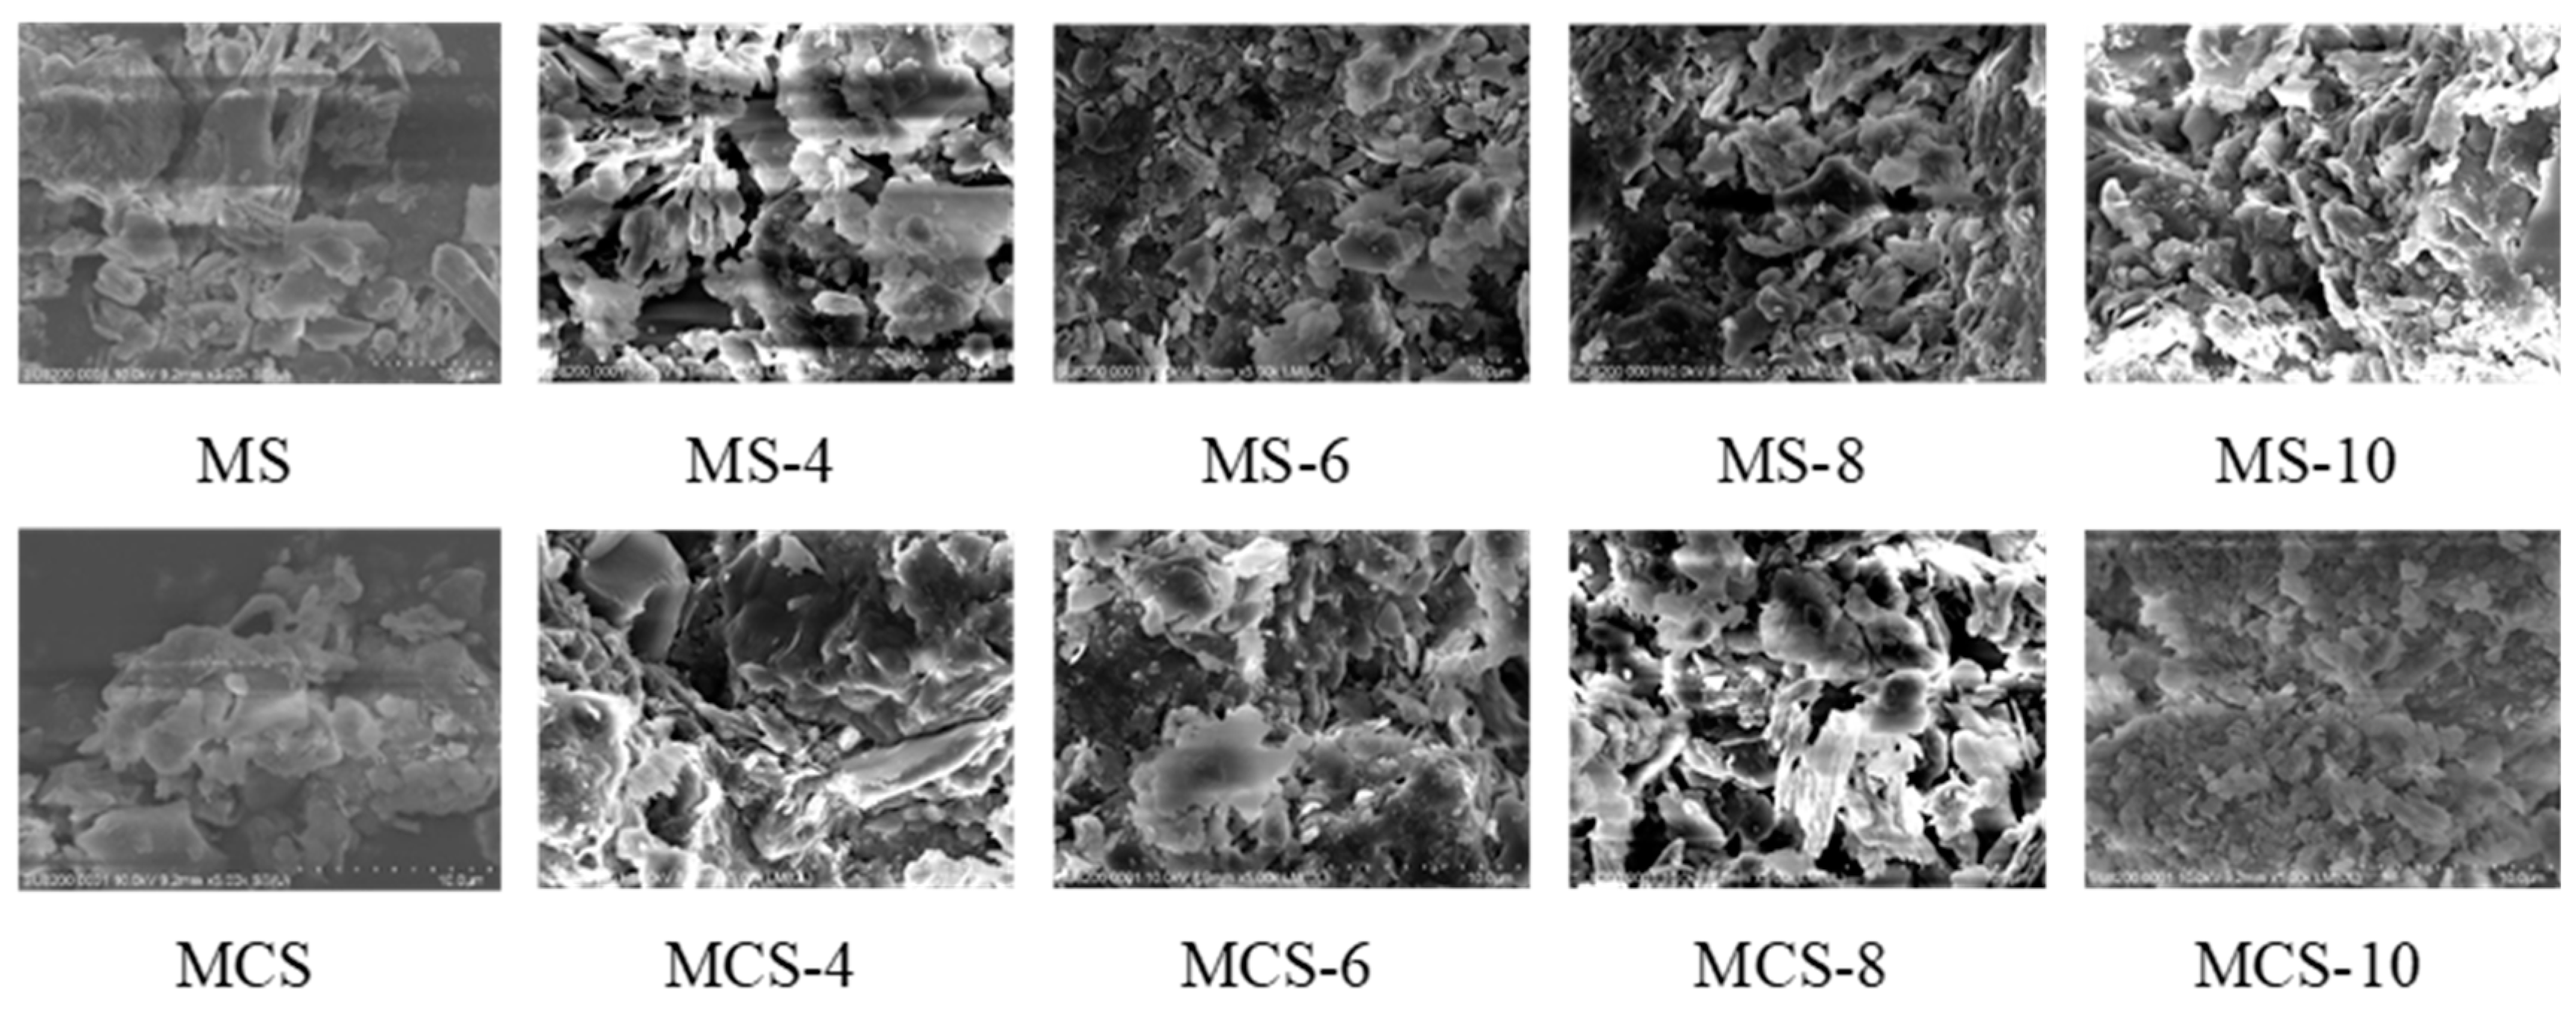
Figure 13 shows the SEM microscopic images of the muddy siltstone and medium-grained coarse sandstone at 5000 magnification after leaching by mine water at different pH values, with a scale of 10 μm. The exfoliation and dissolution of the gangue in the mine water occurred simultaneously with the adsorption and precipitation. The surface of the rock samples after leaching by mine water was rougher and more pores appeared. The surface area and pore volume of the mine water leached rock samples were larger than those of the non-leached samples. The surface area and pore size of the samples were proportional to the acid–base strength of the mine water solution. The higher the acid–base strength, the larger the surface area and pore volume of the sample; the lower the acid-base strength, the smaller the surface area and pore volume of the sample.
The relative concentration of calcium ions on the surface of the rock samples was determined by spot sweeping and energy-dispersive spectroscopy of calcium elements on the surfaces of muddy siltstone and medium-grained coarse sandstone that had not been leached, had been leached with deionized water, and had been leached with mine water of different pH values. As can be seen from Figure 14, when comparing the non-leached rock samples, the surface calcium ion concentration was higher after the acidic and alkaline mine water leaching. After deionization, the calcium-containing minerals were dissolved in the aqueous solution, resulting in a lower concentration of calcium ions on the surface of the rock samples than in the non-drained samples. After mine water leaching, the calcium ions in the mine water solution were reduced and the calcium ions pool in the rock sample was reduced due to precipitation and adsorption, resulting in an increase in the surface calcium ion concentration of the rock sample. Alkaline conditions promoted the precipitation of calcium ion concentration. The relative content of calcium ions on the surface of rock samples was more under alkaline solution leaching than under acidic solution leaching.
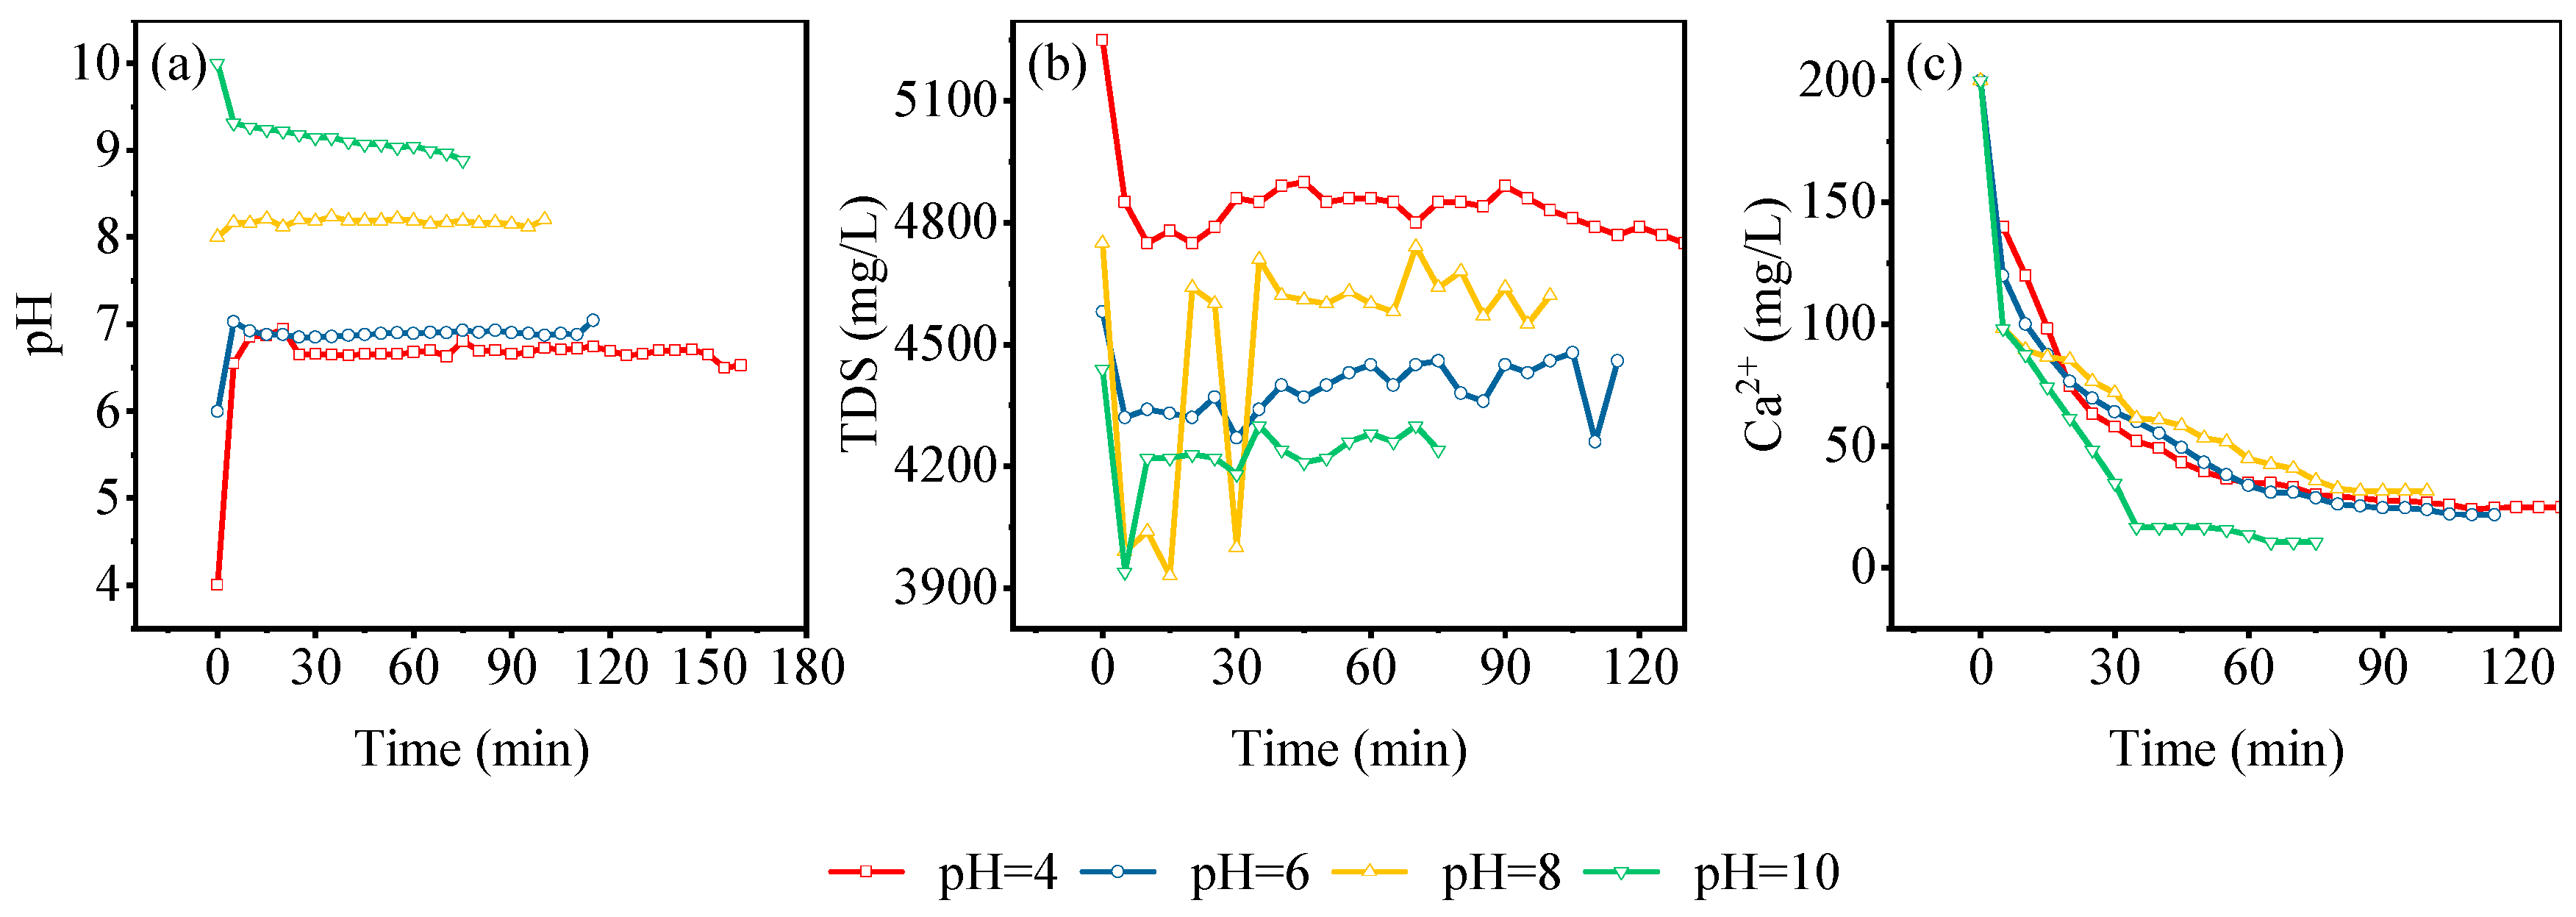
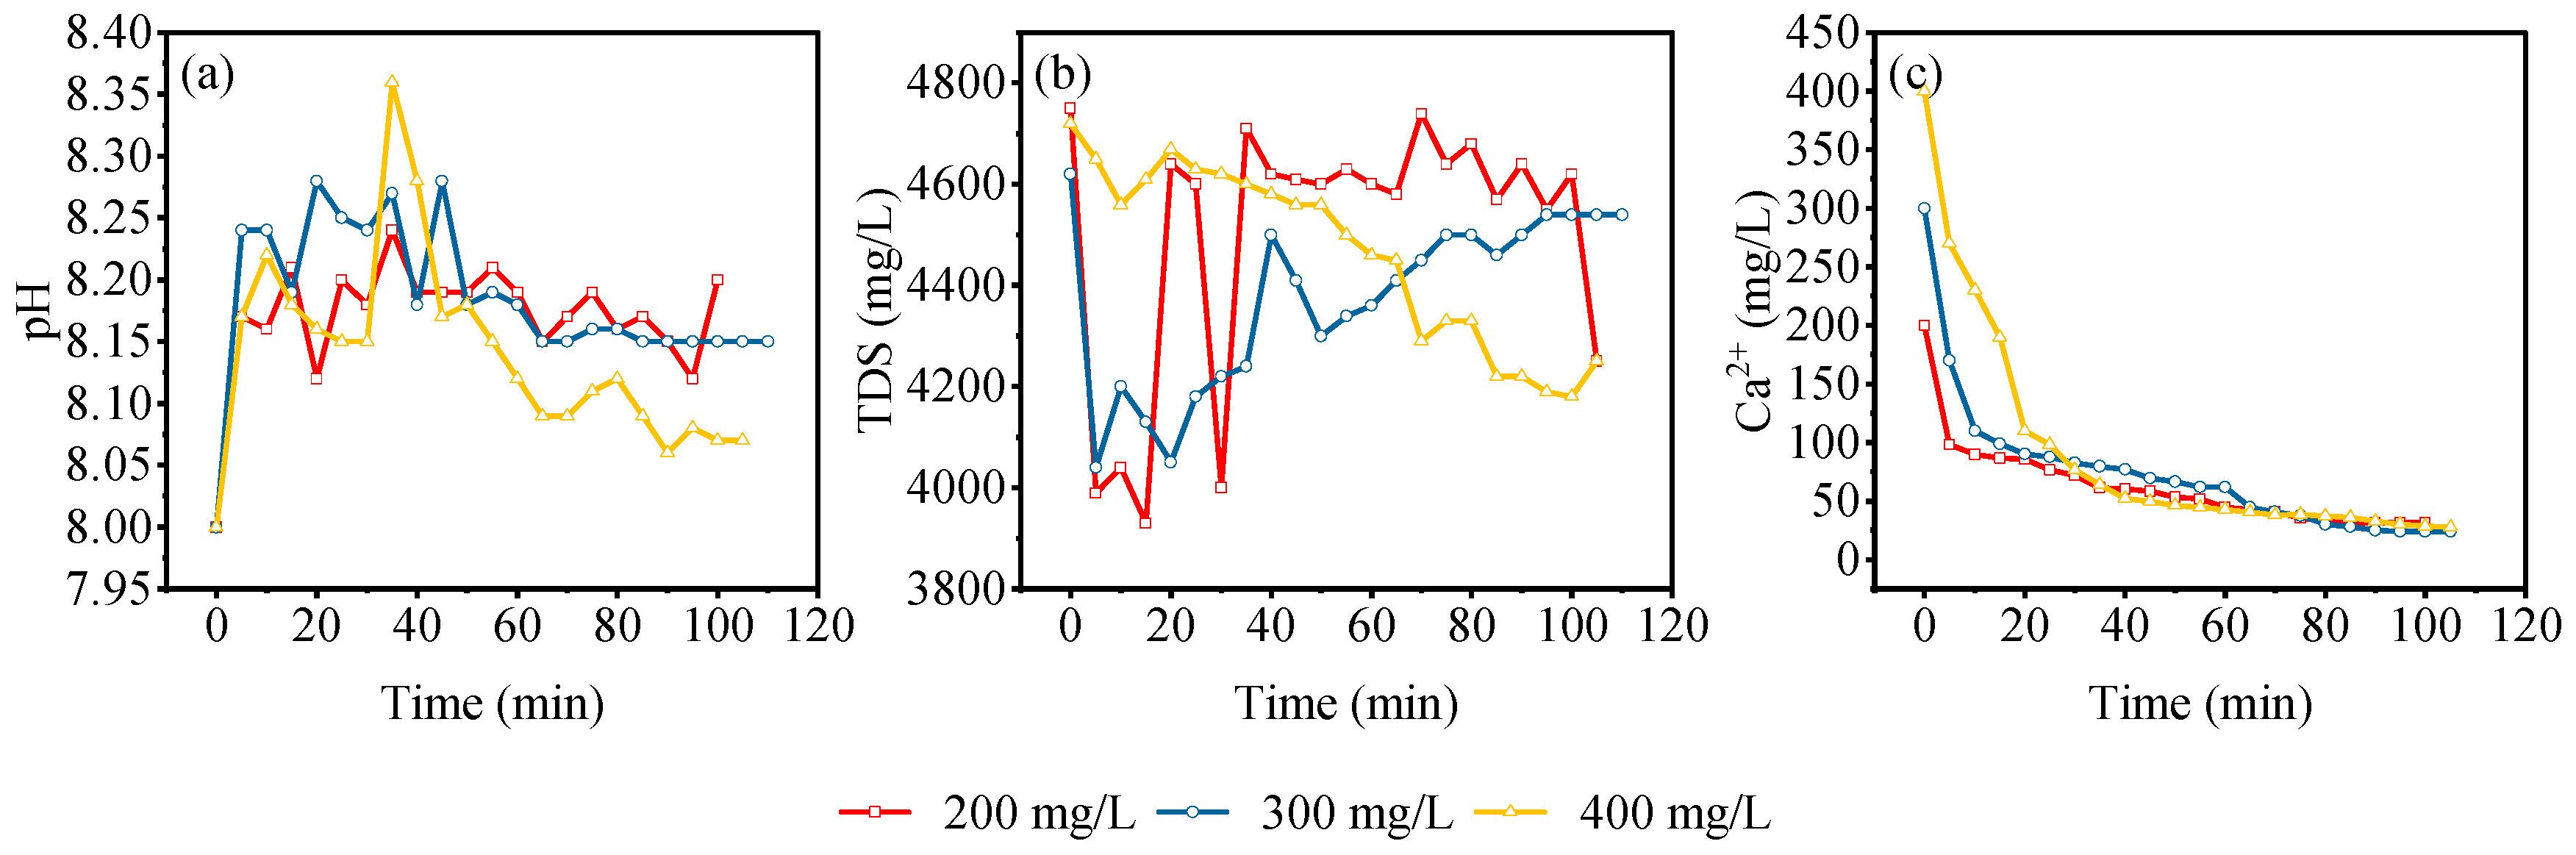
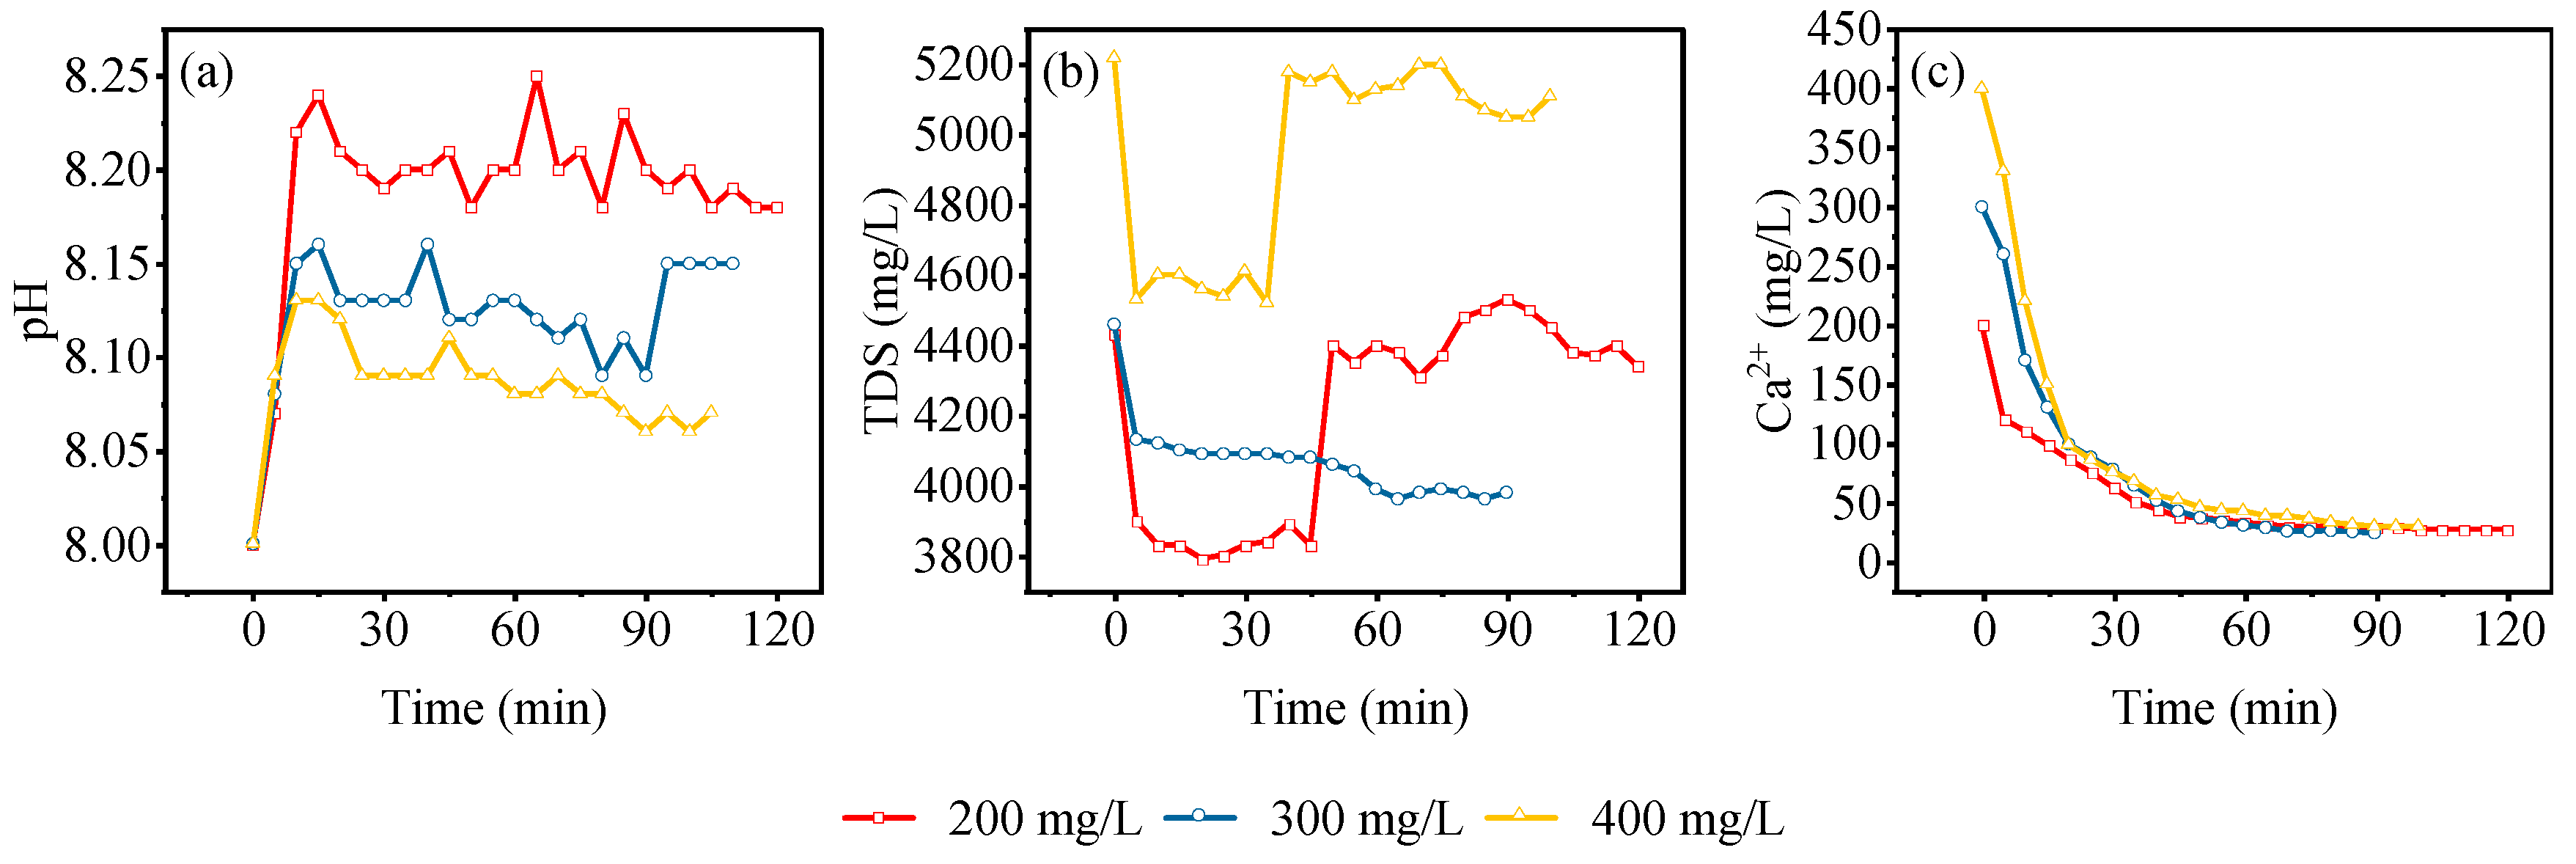
As shown in Figure 15a and Figure 16a, the pH value of the dewatering solution increased rapidly after leaching with different calcium ion concentrations and eventually stabilized. The pH value of the dewatering solution stabilized at 8.2, 8.15, and 8.05 for calcium ion concentrations of 200 mg/L, 300 mg/L, and 400 mg/L, respectively. The calcium ion concentration was inversely proportional to the pH value of the dewatering solution; the higher the calcium ion concentration in the mine water, the higher the pH value of the dewatering solution; the lower the calcium ion concentration in the mine water, the lower the pH value of the dewatering solution.
As shown in Figure 15b and Figure 16b, the adsorption energy of the TDS differed between the muddy siltstone and medium-grained coarse sandstone. When the inlet calcium ion concentration was 200 mg/L, the TDS in the leaching liquid of the muddy siltstone first decreased, rising to the inlet concentration after 40 min and decreasing to the outlet concentration after 100 min. The TDS in the leaching liquid of the medium-grained coarse sandstone first decreased rapidly, stabilized for 30 min, and then rose to the inlet concentration. When the inlet calcium ion concentration was 300 mg/L, the TDS concentration of the leachate from the muddy siltstone first decreased rapidly and then rose slowly; after temperature stabilization, it was lower than the inlet concentration. The TDS concentration of the leachate from the medium-grained coarse sandstone continued to decrease. When the inlet calcium ion concentration was 400 mg/L, the TDS in the leachate from the muddy siltstone decreased continuously. The TDS of the leachate from the medium-grained coarse sandstone first decreased rapidly, stabilized for 30 min, and then rose to the inlet concentration. This decrease in the TDS of the leachate indicated that the adsorption of gangue was greater than the dissolution, the TDS content in the leachate and export liquid was the same, and the adsorption and dissolution effect of the gangue remained the same. The rise in the TDS of the leachate indicated that the gangue dissolution was less than the adsorption. The muddy siltstone and medium-grained coarse sandstone had a good adsorption capacity of TDS; this capacity would weaken with time.
Figure 15c and Figure 16c show the gangue after leaching through mine water solutions of different calcium ion concentrations; the calcium ion concentration rapidly decreased and eventually stabilized. The calcium ion concentration of the inlet solution varied, but that of the leachate eventually stabilized at the same value, eventually reducing to around 25 mg/L. The higher the concentration of the calcium ions in the mine water, the faster the positive reaction between the calcium and bicarbonate ions, which promoted the reduction in the calcium ion concentration. Simultaneously, the higher calcium ion concentration in the mine water accelerated the exchange of calcium ions with the potassium ions of the rock sample, leading to a further decrease in the calcium ion concentration. The experimental results showed that both the muddy siltstone and medium-grained coarse sandstone had a good adsorption effect on the calcium ions.
The metallic-element content of the dynamic leachate is shown in Table 3. Among the ions, the gangue mainly adsorbed the calcium ions. The gangue also had an adsorption effect on the magnesium ions under alkaline conditions, but the adsorption amount was very small. The results of existing studies show that the difficulty of adsorption of three ions by the gangue leaching column is K+, Ca2+, and Mg2+ in ascending order [8]. The different composition of the gangue leads to different adsorption properties. The potassium ions in the solution underwent cation exchange reactions with calcium-containing minerals, resulting in more potassium ions and fewer calcium ions in the solution. The amount of dissolved iron and aluminum in the solution was relatively small and changing the pH and calcium ion concentration of the solution did not significantly alter the amount of iron and aluminum.
4. Conclusions
The adsorption and dissolution properties of the gangue functioned for mine water at different pH values. Acidic and alkaline solutions improved the solubility of gangue, increased the gangue surface void degree and void size, and enhanced the adsorption capacity of gangue. The adsorption capacity of gangue for calcium ions was higher under alkaline conditions than under acidic conditions. The medium-grained coarse sandstone had a greater TDS adsorption capacity than the muddy siltstone did. The adsorption of TDS by gangue decreased with time in dynamic leaching.
The goaf is filled with gangue after the coal seam is mined. The coal pillar at the boundary of the goaf is connected by building an artificial dam. The water from the overlying roof of the coal seam is introduced into the goaf, and the groundwater is stored in the gap of the gangue in the goaf. This study demonstrated that gangue from the roof of the main mining seam of the Lingxin coal mine can reduce the TDS and calcium-ion concentrations in water and treat mine water in situ underground, enabling the recycling of gangue and reducing the cost of water purification and potential damage to surface vegetation.
The research has improved the understanding of human gangue purification of mine water and provided a basis for the design of underground water reservoirs. In the future, the effect on water purification under in situ conditions and the temporal effect of the gangue’s ability to purify water must be investigated. Moreover, long-term monitoring of water quality changes is also required for future applications.
Author Contributions
Writing—review and editing, L.Z.; conceptualization, Q.Y.; methodology, Q.X.; data curation, Y.L.; funding, X.L. All authors have read and agreed to the published version of the manuscript.
Funding
This research was funded by the National Natural Science Foundation of China (No. 51874283, No. 51874285).
Data Availability Statement
Data sharing not applicable.
Acknowledgments
We would like to thank Advanced Analysis & Computation Center of China University of Mining and Technology (www.aacc.cumt.edu.cn) for test and analysis service.
Conflicts of Interest
The authors declare no conflict of interest.
References
- Gu, D.Z.; Li, J.F.; Cao, Z.G.; Wu, B.Y.; Jiang, B.B.; Yang, Y.; Yang, J.; Chen, Y.P. Technology and engineering development strategy of water protection and utilization of coal mine in China. J. China Coal Soc. 2021, 46, 3079–3089. [Google Scholar]
- Acharya, B.S.; Kharel, G. Acid mine drainage from coal mining in the United States—An overview. J. Hydrol. 2020, 588, 125061. [Google Scholar] [CrossRef]
- Bi, Y.; Wu, J.; Tang, L.; Zhai, X.; Huang, K.; Liu, W. Water Abundance Comprehensive Evaluation of Coal Mine Aquifer Based on Projection Pursuit Model. Lithosphere 2022, 2021, 3259214. [Google Scholar] [CrossRef]
- Dong, S.; Wang, H.; Guo, X.; Zhou, Z. Characteristics of Water Hazards in China’s Coal Mines: A Review. Mine Water Environ. 2021, 40, 325–333. [Google Scholar] [CrossRef]
- Gao, R.; Yan, H.; Ju, F.; Mei, X.; Wang, X. Influential factors and control of water inrush in a coal seam as the main aquifer. Int. J. Min. Sci. Technol. 2018, 28, 187–193. [Google Scholar] [CrossRef]
- Chen, Y.; Zhang, Y.; Xia, F.; Xing, Z.; Wang, L. Impacts of Underground Reservoir Site Selection and Water Storage on the Groundwater Flow System in a Mining Area—A Case Study of Daliuta Mine. Water 2022, 14, 3282. [Google Scholar] [CrossRef]
- Huang, Y.; Li, J.; Ma, D.; Gao, H.; Guo, Y.; Ouyang, S. Triaxial compression behaviour of gangue solid wastes under effects of particle size and confining pressure. Sci. Total Environ. 2019, 693, 133607. [Google Scholar] [CrossRef]
- Li, J.; Huang, Y.; Li, W.; Guo, Y.; Ouyang, S.; Cao, G. Study on dynamic adsorption characteristics of broken coal gangue to heavy metal ions under leaching condition and its cleaner mechanism to mine water. J. Clean. Prod. 2021, 329, 129756. [Google Scholar] [CrossRef]
- Yao, Q.; Tang, C.; Xia, Z.; Liu, X.; Zhu, L.; Chong, Z.; Hui, X. Mechanisms of failure in coal samples from underground water reservoir. Eng. Geol. 2020, 267, 105494. [Google Scholar] [CrossRef]
- Madlener, R.; Specht, J. An Exploratory Economic Analysis of Underground Pumped-Storage Hydro Power Plants in Abandoned Deep Coal Mines. Energies 2020, 13, 5634. [Google Scholar] [CrossRef]
- Menéndez, J.; Loredo, J.; Galdo, M.; Fernández-Oro, J.M. Energy storage in underground coal mines in NW Spain: Assessment of an underground lower water reservoir and preliminary energy balance. Renew. Energy 2019, 134, 1381–1391. [Google Scholar] [CrossRef]
- Song, H.; Xu, J.; Fang, J.; Cao, Z.; Yang, L.; Li, T. Potential for mine water disposal in coal seam goaf: Investigation of storage coefficients in the Shendong mining area. J. Clean. Prod. 2019, 244, 118646. [Google Scholar] [CrossRef]
- Fan, G.; Zhang, D.; Wang, X. Reduction and utilization of coal mine waste rock in China: A case study in Tiefa coalfield. Resour. Conserv. Recycl. 2014, 83, 24–33. [Google Scholar] [CrossRef]
- Kalisz, S.; Kibort, K.; Mioduska, J.; Lieder, M.; Małachowska, A. Waste management in the mining industry of metals ores, coal, oil and natural gas—A review. J. Environ. Manag. 2021, 304, 114239. [Google Scholar] [CrossRef]
- Vriens, B.; Plante, B.; Seigneur, N.; Jamieson, H. Mine Waste Rock: Insights for Sustainable Hydrogeochemical Management. Minerals 2020, 10, 728. [Google Scholar] [CrossRef]
- Adibee, N.; Osanloo, M.; Rahmanpour, M. Adverse effects of coal mine waste dumps on the environment and their management. Environ. Earth Sci. 2013, 70, 1581–1592. [Google Scholar] [CrossRef]
- Li, J.; Yin, Z.Q.; Li, C.M. Waste rock filling in fully mechanized coal mining for goaf-side entry retaining in thin coal seam. Arab. J. Geosci. 2019, 12, 509. [Google Scholar] [CrossRef]
- Li, M.; Meng, G.; Zhang, J.; Huang, P.; Germain, D.M. Sensitivity analysis of key factors influencing compression-induced deformation of waste rocks for backfilling to reduce environmental pollution. Environ. Sci. Pollut. Res. 2020, 27, 16707–16717. [Google Scholar] [CrossRef]
- Stracher, G.B.; Taylor, T.P. Coal fires burning out of control around the world: Thermodynamic recipe for environmental catastrophe. Int. J. Coal Geol. 2004, 59, 7–17. [Google Scholar] [CrossRef]
- Zhang, Y.; Ling, T.-C. Reactivity activation of waste coal gangue and its impact on the properties of cement-based materials—A review. Constr. Build. Mater. 2019, 234, 117424. [Google Scholar] [CrossRef]
- Gao, S.; Zhao, G.; Guo, L.; Zhou, L.; Yuan, K. Utilization of coal gangue as coarse aggregates in structural concrete. Constr. Build. Mater. 2020, 268, 121212. [Google Scholar] [CrossRef]
- Han, R.; Guo, X.; Guan, J.; Yao, X.; Hao, Y. Activation Mechanism of Coal Gangue and Its Impact on the Properties of Geopolymers: A Review. Polymers 2022, 14, 3861. [Google Scholar] [CrossRef]
- Hao, Y.; Guo, X.; Yao, X.; Han, R.; Li, L.; Zhang, M. Using Chinese Coal Gangue as an Ecological Aggregate and Its Modification: A Review. Materials 2022, 15, 4495. [Google Scholar] [CrossRef] [PubMed]
- Li, J.; Wang, J. Comprehensive utilization and environmental risks of coal gangue: A review. J. Clean. Prod. 2019, 239, 117946. [Google Scholar] [CrossRef]
- Moghadam, M.J.; Ajalloeian, R.; Hajiannia, A. Preparation and application of alkali-activated materials based on waste glass and coal gangue: A review. Constr. Build. Mater. 2019, 221, 84–98. [Google Scholar] [CrossRef]
- Welch, C.; Barbour, S.L.; Hendry, M.J. The geochemistry and hydrology of coal waste rock dumps: A systematic global review. Sci. Total Environ. 2021, 795, 148798. [Google Scholar] [CrossRef]
- Mansilha, C.; Melo, A.; Flores, D.; Ribeiro, J.; Rocha, J.R.; Martins, V.; Santos, P.; Marques, J.E. Irrigation with Coal Mining Effluents: Sustainability and Water Quality Considerations (São Pedro da Cova, North Portugal). Water 2021, 13, 2157. [Google Scholar] [CrossRef]
- Dang, W.; He, H.-Y. Glass-ceramics fabricated by efficiently utilizing coal gangue. J. Asian Ceram. Soc. 2020, 8, 365–372. [Google Scholar] [CrossRef]
- Gao, S.; Zhang, S.; Guo, L. Application of Coal Gangue as a Coarse Aggregate in Green Concrete Production: A Review. Materials 2021, 14, 6803. [Google Scholar] [CrossRef]
- Li, Z.; Guo, T.; Chen, Y.; Zhao, X.; Chen, Y.; Yang, X.; Wang, J. Road performance analysis of cement stabilized coal gangue mixture. Mater. Res. Express 2021, 8, 125502. [Google Scholar] [CrossRef]
- Stanovych, A.; Balloy, M.; Olszewski, T.K.; Petit, E.; Grison, C. Depollution of mining effluents: Innovative mobilization of plant resources. Environ. Sci. Pollut. Res. 2019, 26, 19327–19334. [Google Scholar] [CrossRef]
- Zhu, X.; Guo, Z.; Yang, W.; Song, W. Durability of Concrete With Coal Gasification Slag and Coal Gangue Powder. Front. Mater. 2022, 8, 791178. [Google Scholar] [CrossRef]
- Ju, F.; Li, B.; Guo, S.; Xiao, M. Dynamic characteristics of gangues during vertical feeding in solid backfill mining: A case study of the Wugou coal mine in China. Environ. Earth Sci. 2016, 75, 1389. [Google Scholar] [CrossRef]
- Li, J.; Huang, Y.; Qiao, M.; Chen, Z.; Song, T.; Kong, G.; Gao, H.; Guo, L. Effects of Water Soaked Height on the Deformation and Crushing Characteristics of Loose Gangue Backfill Material in Solid Backfill Coal Mining. Processes 2018, 6, 64. [Google Scholar] [CrossRef]
- Li, M.; Zhang, J.; Li, A.; Zhou, N. Reutilisation of coal gangue and fly ash as underground backfill materials for surface subsidence control. J. Clean. Prod. 2020, 254, 120113. [Google Scholar] [CrossRef]
- Wang, Y.; Huang, Y.; Hao, Y. Experimental Study and Application of Rheological Properties of Coal Gangue-Fly Ash Backfill Slurry. Processes 2020, 8, 284. [Google Scholar] [CrossRef]
- Zhang, Q.L.; Wang, X.M. Performance of cemented coal gangue backfill. J. Cent. South Univ. Technol. 2007, 14, 216–219. [Google Scholar] [CrossRef]
- Zhang, X.; Lin, J.; Liu, J.; Li, F.; Pang, Z. Investigation of Hydraulic-Mechanical Properties of Paste Backfill Containing Coal Gangue-Fly Ash and Its Application in an Underground Coal Mine. Energies 2017, 10, 1309. [Google Scholar] [CrossRef]
- Letina, D.; Letshwenyo, W. Investigating waste rock, tailings, slag and coal ash clinker as adsorbents for heavy metals: Batch and column studies. Phys. Chem. Earth Parts A/B/C 2018, 105, 184–190. [Google Scholar] [CrossRef]
- Jiang, C.; Gao, X.; Hou, B.; Zhang, S.; Zhang, J.; Li, C.; Wang, W. Occurrence and environmental impact of coal mine goaf water in karst areas in China. J. Clean. Prod. 2020, 275, 123813. [Google Scholar] [CrossRef]
- Jiang, B.; Gao, J.; Du, K.; Deng, X.; Zhang, K. Insight into the water–rock interaction process and purification mechanism of mine water in underground reservoir of Daliuta coal mine in China. Environ. Sci. Pollut. Res. 2022, 29, 28538–28551. [Google Scholar] [CrossRef] [PubMed]
- Xu, R.; Zou, W.; Wang, T.; Huang, J.; Zhang, Z.; Xu, C. Adsorption and interaction mechanisms of Chi-g-P(AM-DMDAAC) assisted settling of kaolinite in a two-step flocculation process. Sci. Total Environ. 2021, 816, 151576. [Google Scholar] [CrossRef] [PubMed]
- Wan, H.; Wang, C.; Gong, L.; Zhu, X.; Yan, J.; Lu, J.; Zhang, W. Potential Application of Discarded Natural Coal Gangue for the Removal of Tetracycline Hydrochloride (TC) from an Aqueous Solution. Toxics 2023, 11, 20. [Google Scholar] [CrossRef] [PubMed]
Figure 1.
Dynamic leaching experiment.

Figure 2.
Piper diagram of groundwater samples from Lingxin mine.

Figure 3.
Characteristics of gangue under transverse polarized light microscopy (a) MS14; (b) MS15; (c) MCS16.
Figure 3.
Characteristics of gangue under transverse polarized light microscopy (a) MS14; (b) MS15; (c) MCS16.

Figure 4.
X-ray diffraction pattern of the roof samples: (a) MS14; (b) MS15; (c) MCS16.

Figure 5.
Mineral composition of the roof samples: (a) MS14; (b) MS15; (c) MCS16.

Figure 6.
Chemical composition of the roof samples: (a) MS14; (b) MS15; (c) MCS16.

Figure 7.
Solution characteristics of the muddy siltstone after leaching with deionized water: (a) pH value; (b) TDS concentration; (c) Ca2+ concentration.
Figure 7.
Solution characteristics of the muddy siltstone after leaching with deionized water: (a) pH value; (b) TDS concentration; (c) Ca2+ concentration.

Figure 8.
Solution characteristics of muddy siltstone leached by mine water at different pH values: (a) pH value; (b) TDS concentration; (c) Ca2+ concentration.
Figure 8.
Solution characteristics of muddy siltstone leached by mine water at different pH values: (a) pH value; (b) TDS concentration; (c) Ca2+ concentration.

Figure 9.
Solution characteristics of medium-grained coarse sandstone after leaching with deionized water: (a) pH value; (b) TDS concentration; (c) Ca2+ concentration.
Figure 9.
Solution characteristics of medium-grained coarse sandstone after leaching with deionized water: (a) pH value; (b) TDS concentration; (c) Ca2+ concentration.

Figure 10.
Medium-grained coarse sandstone soaked by mine water at different pH values: (a) pH value; (b) TDS concentration; (c) Ca2+ concentration.
Figure 10.
Medium-grained coarse sandstone soaked by mine water at different pH values: (a) pH value; (b) TDS concentration; (c) Ca2+ concentration.

Figure 11.
Solution characteristics of muddy siltstone subjected to dynamic leaching by mine water at different pH values: (a) pH value; (b) TDS concentration; (c) Ca2+ concentration.
Figure 11.
Solution characteristics of muddy siltstone subjected to dynamic leaching by mine water at different pH values: (a) pH value; (b) TDS concentration; (c) Ca2+ concentration.

Figure 12.
Solution characteristics of medium-grained coarse sandstone subjected to dynamic leaching by mine water at different pH values: (a) pH value; (b) TDS concentration; (c) Ca2+ concentration.
Figure 12.
Solution characteristics of medium-grained coarse sandstone subjected to dynamic leaching by mine water at different pH values: (a) pH value; (b) TDS concentration; (c) Ca2+ concentration.

Figure 13.
SEM images of gangue after leaching with mine water at different pH values.

Figure 14.
Calcium ion concentration on the surface of the rock sample: (a) Solutions with different PH values; (b) Solutions with different Ca2+ concentrations.
Figure 14.
Calcium ion concentration on the surface of the rock sample: (a) Solutions with different PH values; (b) Solutions with different Ca2+ concentrations.

Figure 15.
Solution characteristics of muddy siltstone leached by mine water with different concentrations of calcium ions: (a) pH value; (b) TDS concentration; (c) Ca2+ concentration.
Figure 15.
Solution characteristics of muddy siltstone leached by mine water with different concentrations of calcium ions: (a) pH value; (b) TDS concentration; (c) Ca2+ concentration.

Figure 16.
Solution characteristics of medium-grained coarse sandstone leached by mine water with different concentrations of calcium ions: (a) pH value; (b) TDS concentration; (c) Ca2+ concentration.
Figure 16.
Solution characteristics of medium-grained coarse sandstone leached by mine water with different concentrations of calcium ions: (a) pH value; (b) TDS concentration; (c) Ca2+ concentration.


Table 1.
Static leaching test scheme.
| Experiment Number | Lithology | pH | Grain Size (mesh) | Solid-to-Liquid Ratio |
|---|---|---|---|---|
| SL-MS-pH-4 | Muddy siltstone | 4 | 200 | 1:10 |
| SL-MS-pH-6 | 6 | |||
| SL-MS-pH-8 | 8 | |||
| SL-MS-pH-10 | 10 | |||
| SL-MS-pH-7 | Deionized water | |||
| SL-MCS-pH-4 | Medium-grained coarse sandstone | 4 | 200 | 1:10 |
| SL-MCS-pH-6 | 6 | |||
| SL-MCS-pH-8 | 8 | |||
| SL-MCS-pH-10 | 10 | |||
| SL-MCS-pH-7 | Deionized water |
pH—potential of hydrogen.
Table 2.
Dynamic leaching test scheme.
| Experiment Number | Lithology | Grain Size (mesh) | pH | Ca2+ (mg/L) |
|---|---|---|---|---|
| DL-MS-4 | Muddy siltstone | 20–30 | 4.0 | 200 |
| DL-MS-6 | 6.0 | |||
| DL-MS-8 | 8.0 | |||
| DL-MS-10 | 10.0 | |||
| DL-MCS-4 | Medium-grained coarse sandstone | 20–30 | 4.0 | 200 |
| DL-MCS-6 | 6.0 | |||
| DL-MCS-8 | 8.0 | |||
| DL-MCS-10 | 10.0 | |||
| DL-MS-200 | Muddy siltstone | 20–30 | 8.0 | 200 |
| DL-MS-300 | 300 | |||
| DL-MS-400 | 400 | |||
| DL-MCS-200 | Medium-grained coarse sandstone | 20–30 | 8.0 | 200 |
| DL-MCS-300 | 300 | |||
| DL-MCS-400 | 400 |
pH—potential of hydrogen.
Table 3.
Metallic-element content in dynamic leachate.
| Experiment Number | Ca/mg/L | Mg/mg/L | K/mg/L | Fe/mg/L | Al/mg/L |
|---|---|---|---|---|---|
| DL-PS-4 | 22.78 | 192.4 | 23.11 | 0.174 | 1.049 |
| DL-PS-6 | 21.9 | 193 | 19.27 | 0.164 | 1.047 |
| DL-PS-8 | 31.5 | 279.7 | 40.1 | 1.056 | 2.037 |
| DL-PS-10 | 10.53 | 161.3 | 19.15 | 0.16 | 1.103 |
| DL-MCS-4 | 21.21 | 202.7 | 7.992 | 0.166 | 1.099 |
| DL-MCS-6 | 19.08 | 203 | 7.451 | 0.163 | 1.88 |
| DL-MCS-8 | 26.67 | 276.7 | 11.06 | 0.506 | 1.638 |
| DL-MCS-10 | 0.97 | 188.7 | 7.078 | 0.208 | 1.006 |
| DL-PS-200 | 31.5 | 279.7 | 40.1 | 1.056 | 2.037 |
| DL-PS-200 | 24.18 | 195.1 | 19.33 | 0.221 | 1.221 |
| DL-PS-200 | 27.48 | 208.6 | 19.02 | 0.143 | 1.112 |
| DL-MCS-200 | 26.67 | 276.7 | 11.06 | 0.506 | 1.638 |
| DL-MCS-300 | 23.56 | 201.3 | 7.669 | 0.411 | 1.279 |
| DL-MCS-400 | 29.29 | 197.4 | 7.716 | 0.284 | 1.412 |
Disclaimer/Publisher’s Note: The statements, opinions and data contained in all publications are solely those of the individual author(s) and contributor(s) and not of MDPI and/or the editor(s). MDPI and/or the editor(s) disclaim responsibility for any injury to people or property resulting from any ideas, methods, instructions or products referred to in the content. |
© 2023 by the authors. Licensee MDPI, Basel, Switzerland. This article is an open access article distributed under the terms and conditions of the Creative Commons Attribution (CC BY) license (https://creativecommons.org/licenses/by/4.0/).
Share and Cite
MDPI and ACS Style
Zhu, L.; Yao, Q.; Xu, Q.; Li, Y.; Li, X. Experimental Study on the Purification Mechanism of Mine Water by Coal Gangue. Water 2023, 15, 697. https://doi.org/10.3390/w15040697
AMA Style
Zhu L, Yao Q, Xu Q, Li Y, Li X. Experimental Study on the Purification Mechanism of Mine Water by Coal Gangue. Water. 2023; 15(4):697. https://doi.org/10.3390/w15040697
Chicago/Turabian StyleZhu, Liu, Qiangling Yao, Qiang Xu, Yinghu Li, and Xuehua Li. 2023. "Experimental Study on the Purification Mechanism of Mine Water by Coal Gangue" Water 15, no. 4: 697. https://doi.org/10.3390/w15040697
Note that from the first issue of 2016, this journal uses article numbers instead of page numbers. See further details here.