
Characteristics of Debris Flow Activities at Different Scales after the Disturbance of Strong Earthquakes—A Case Study of the Wenchuan Earthquake-Affected Area
Abstract
:1. Introduction
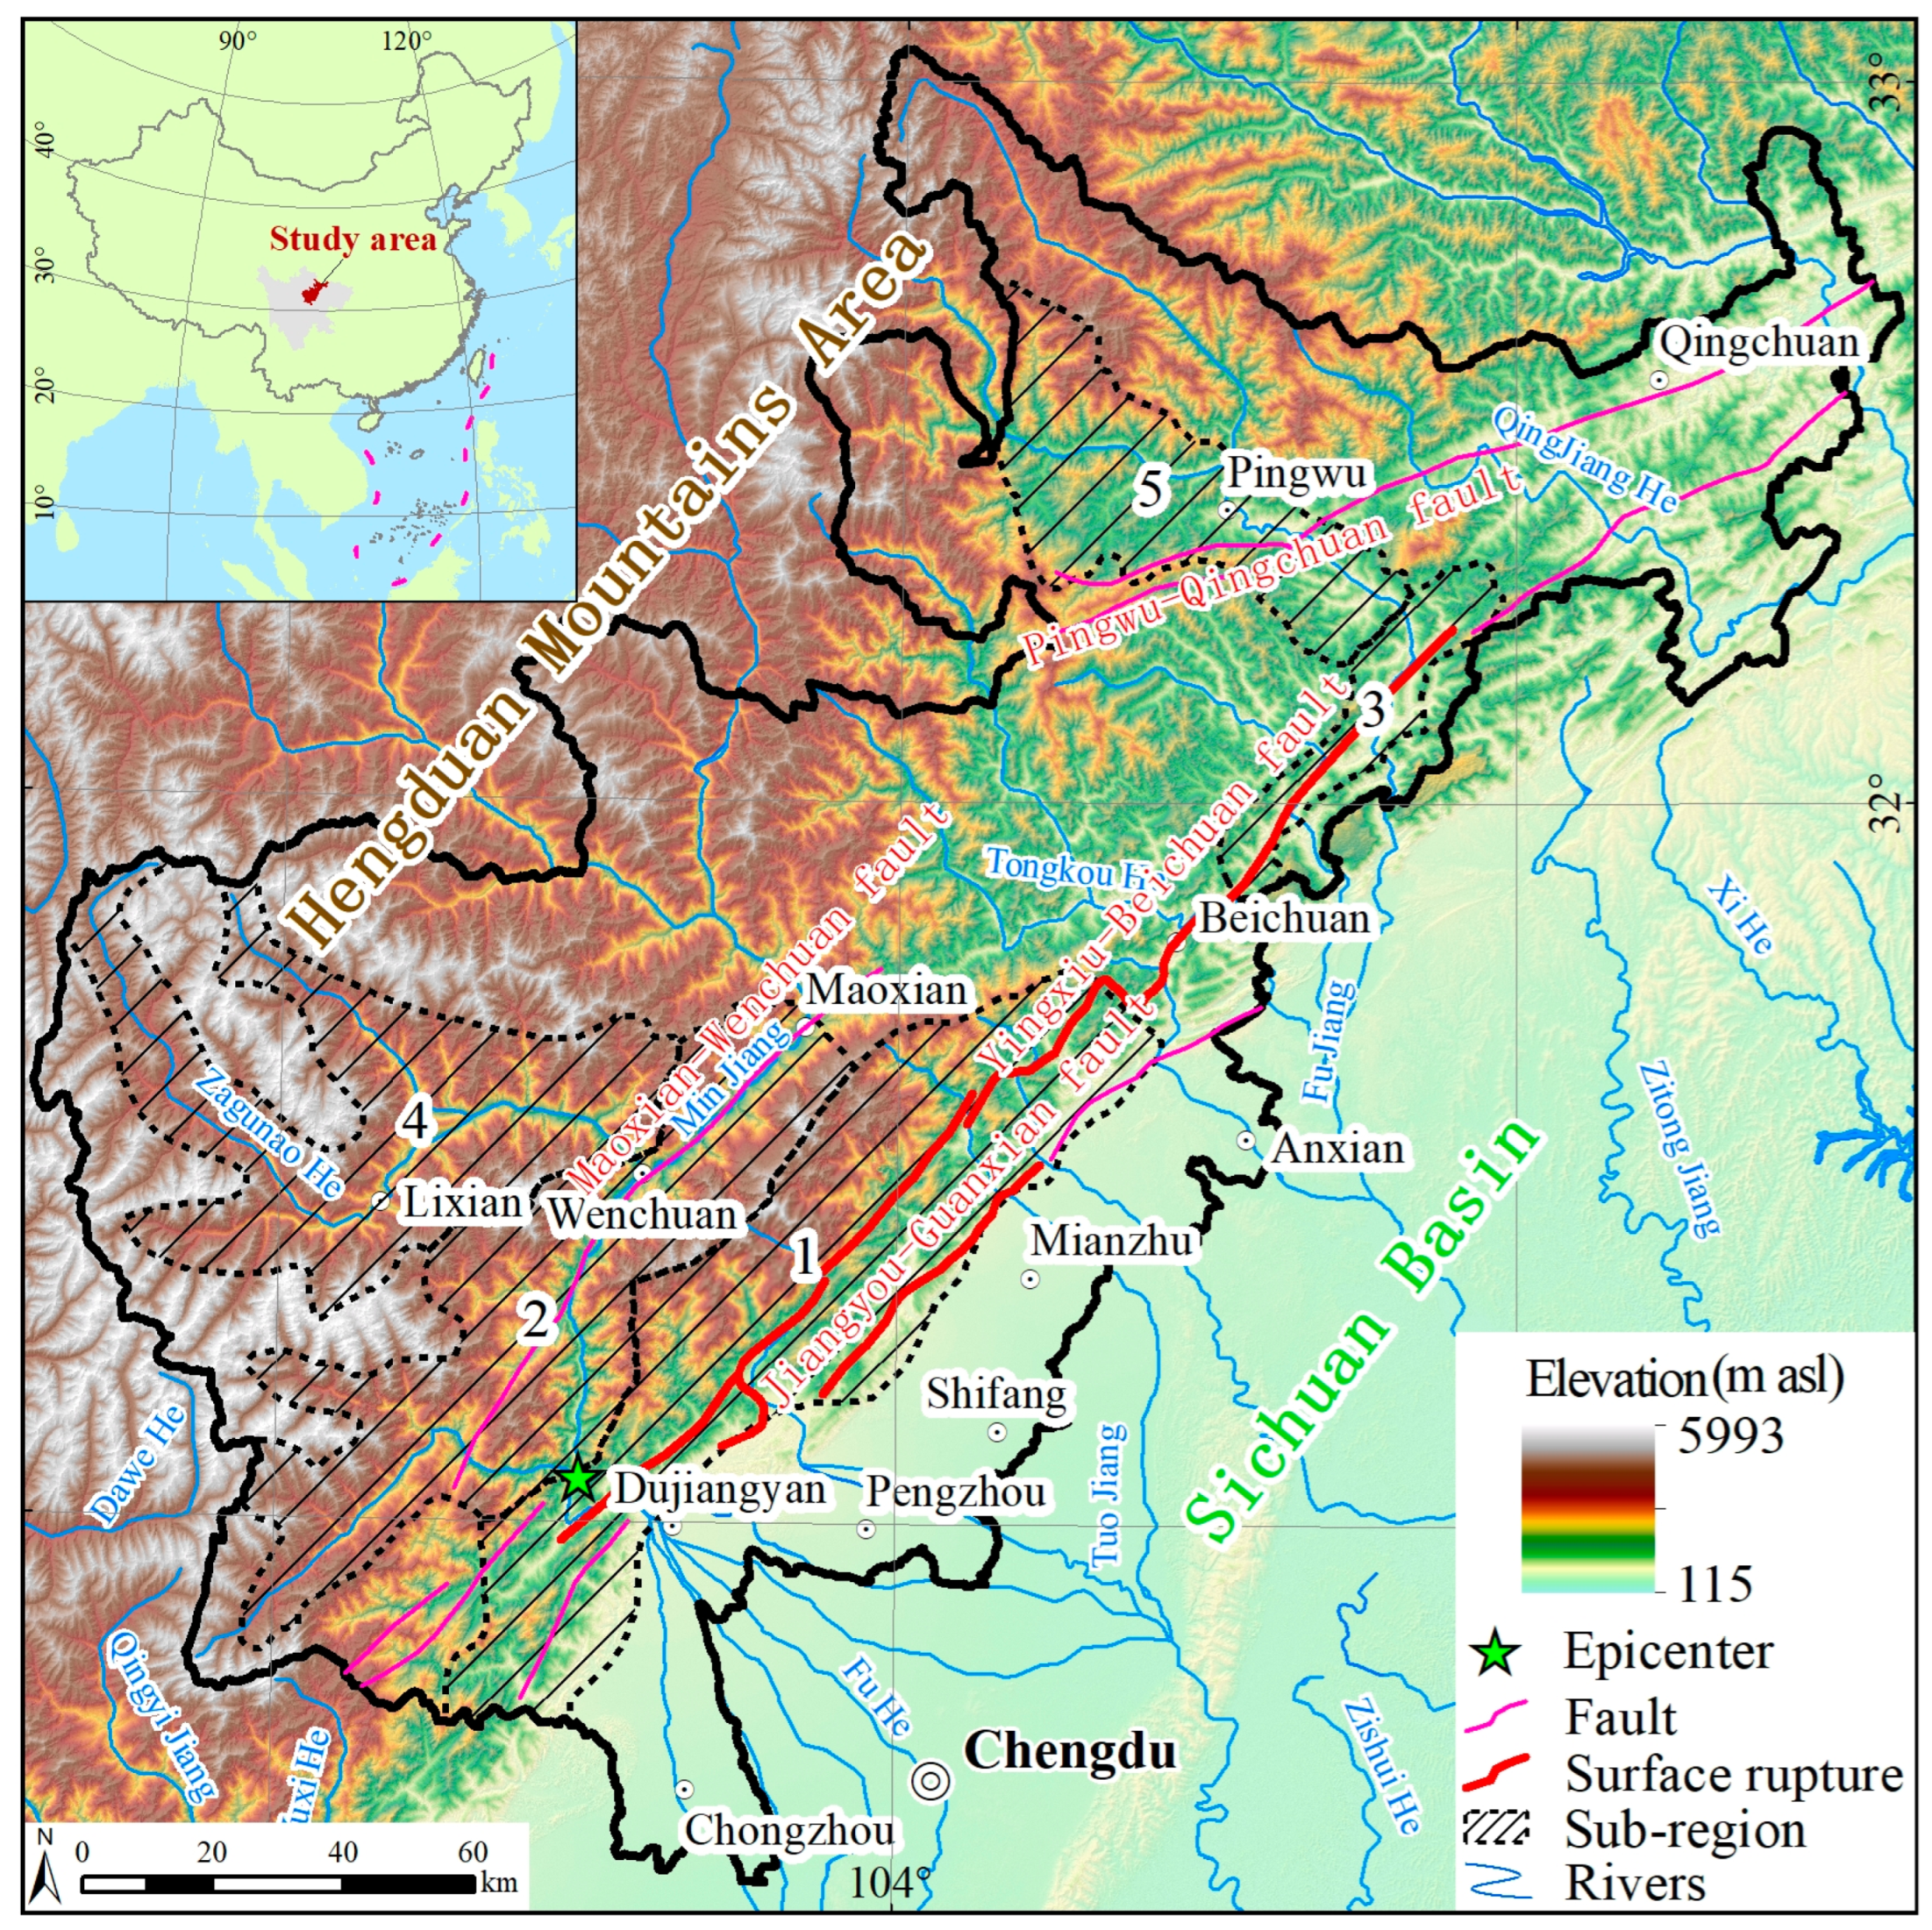
2. Study Area
3. Data and Method
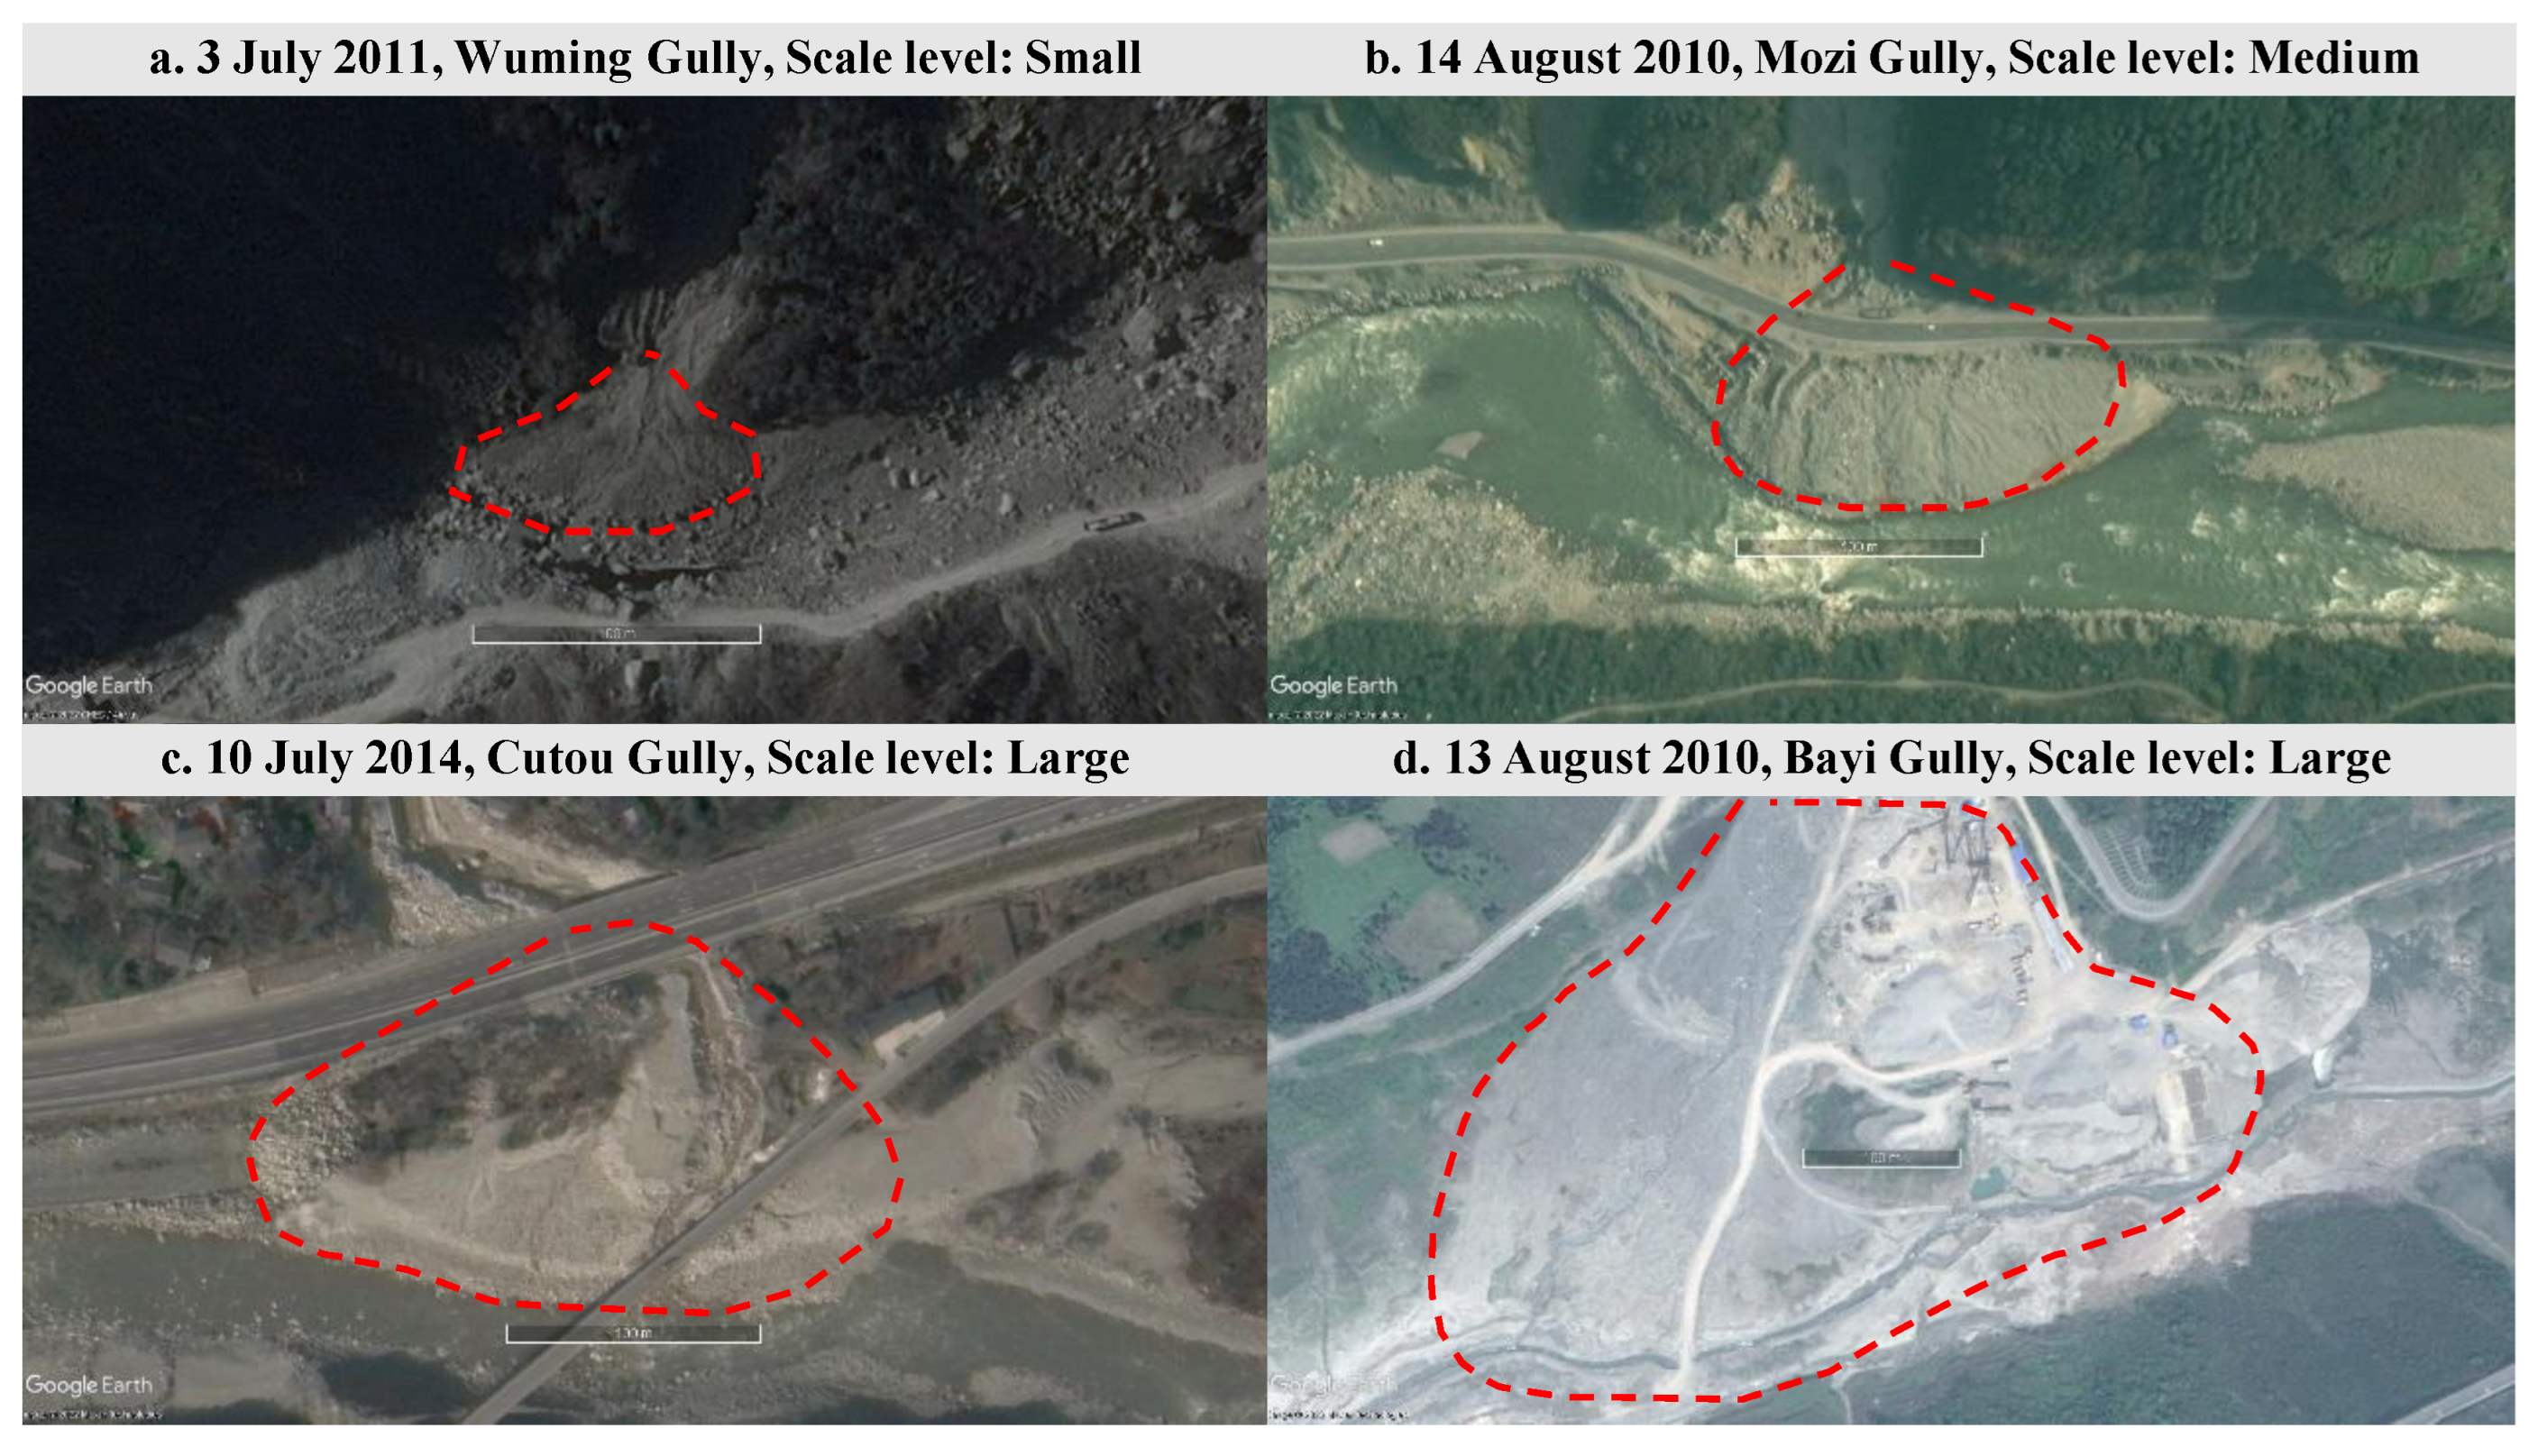
3.1. Debris Flow Events
3.2. Controlling Factors
3.3. Certainty Factor
3.4. Spearman’s Rank Correlation Coefficient
4. Results
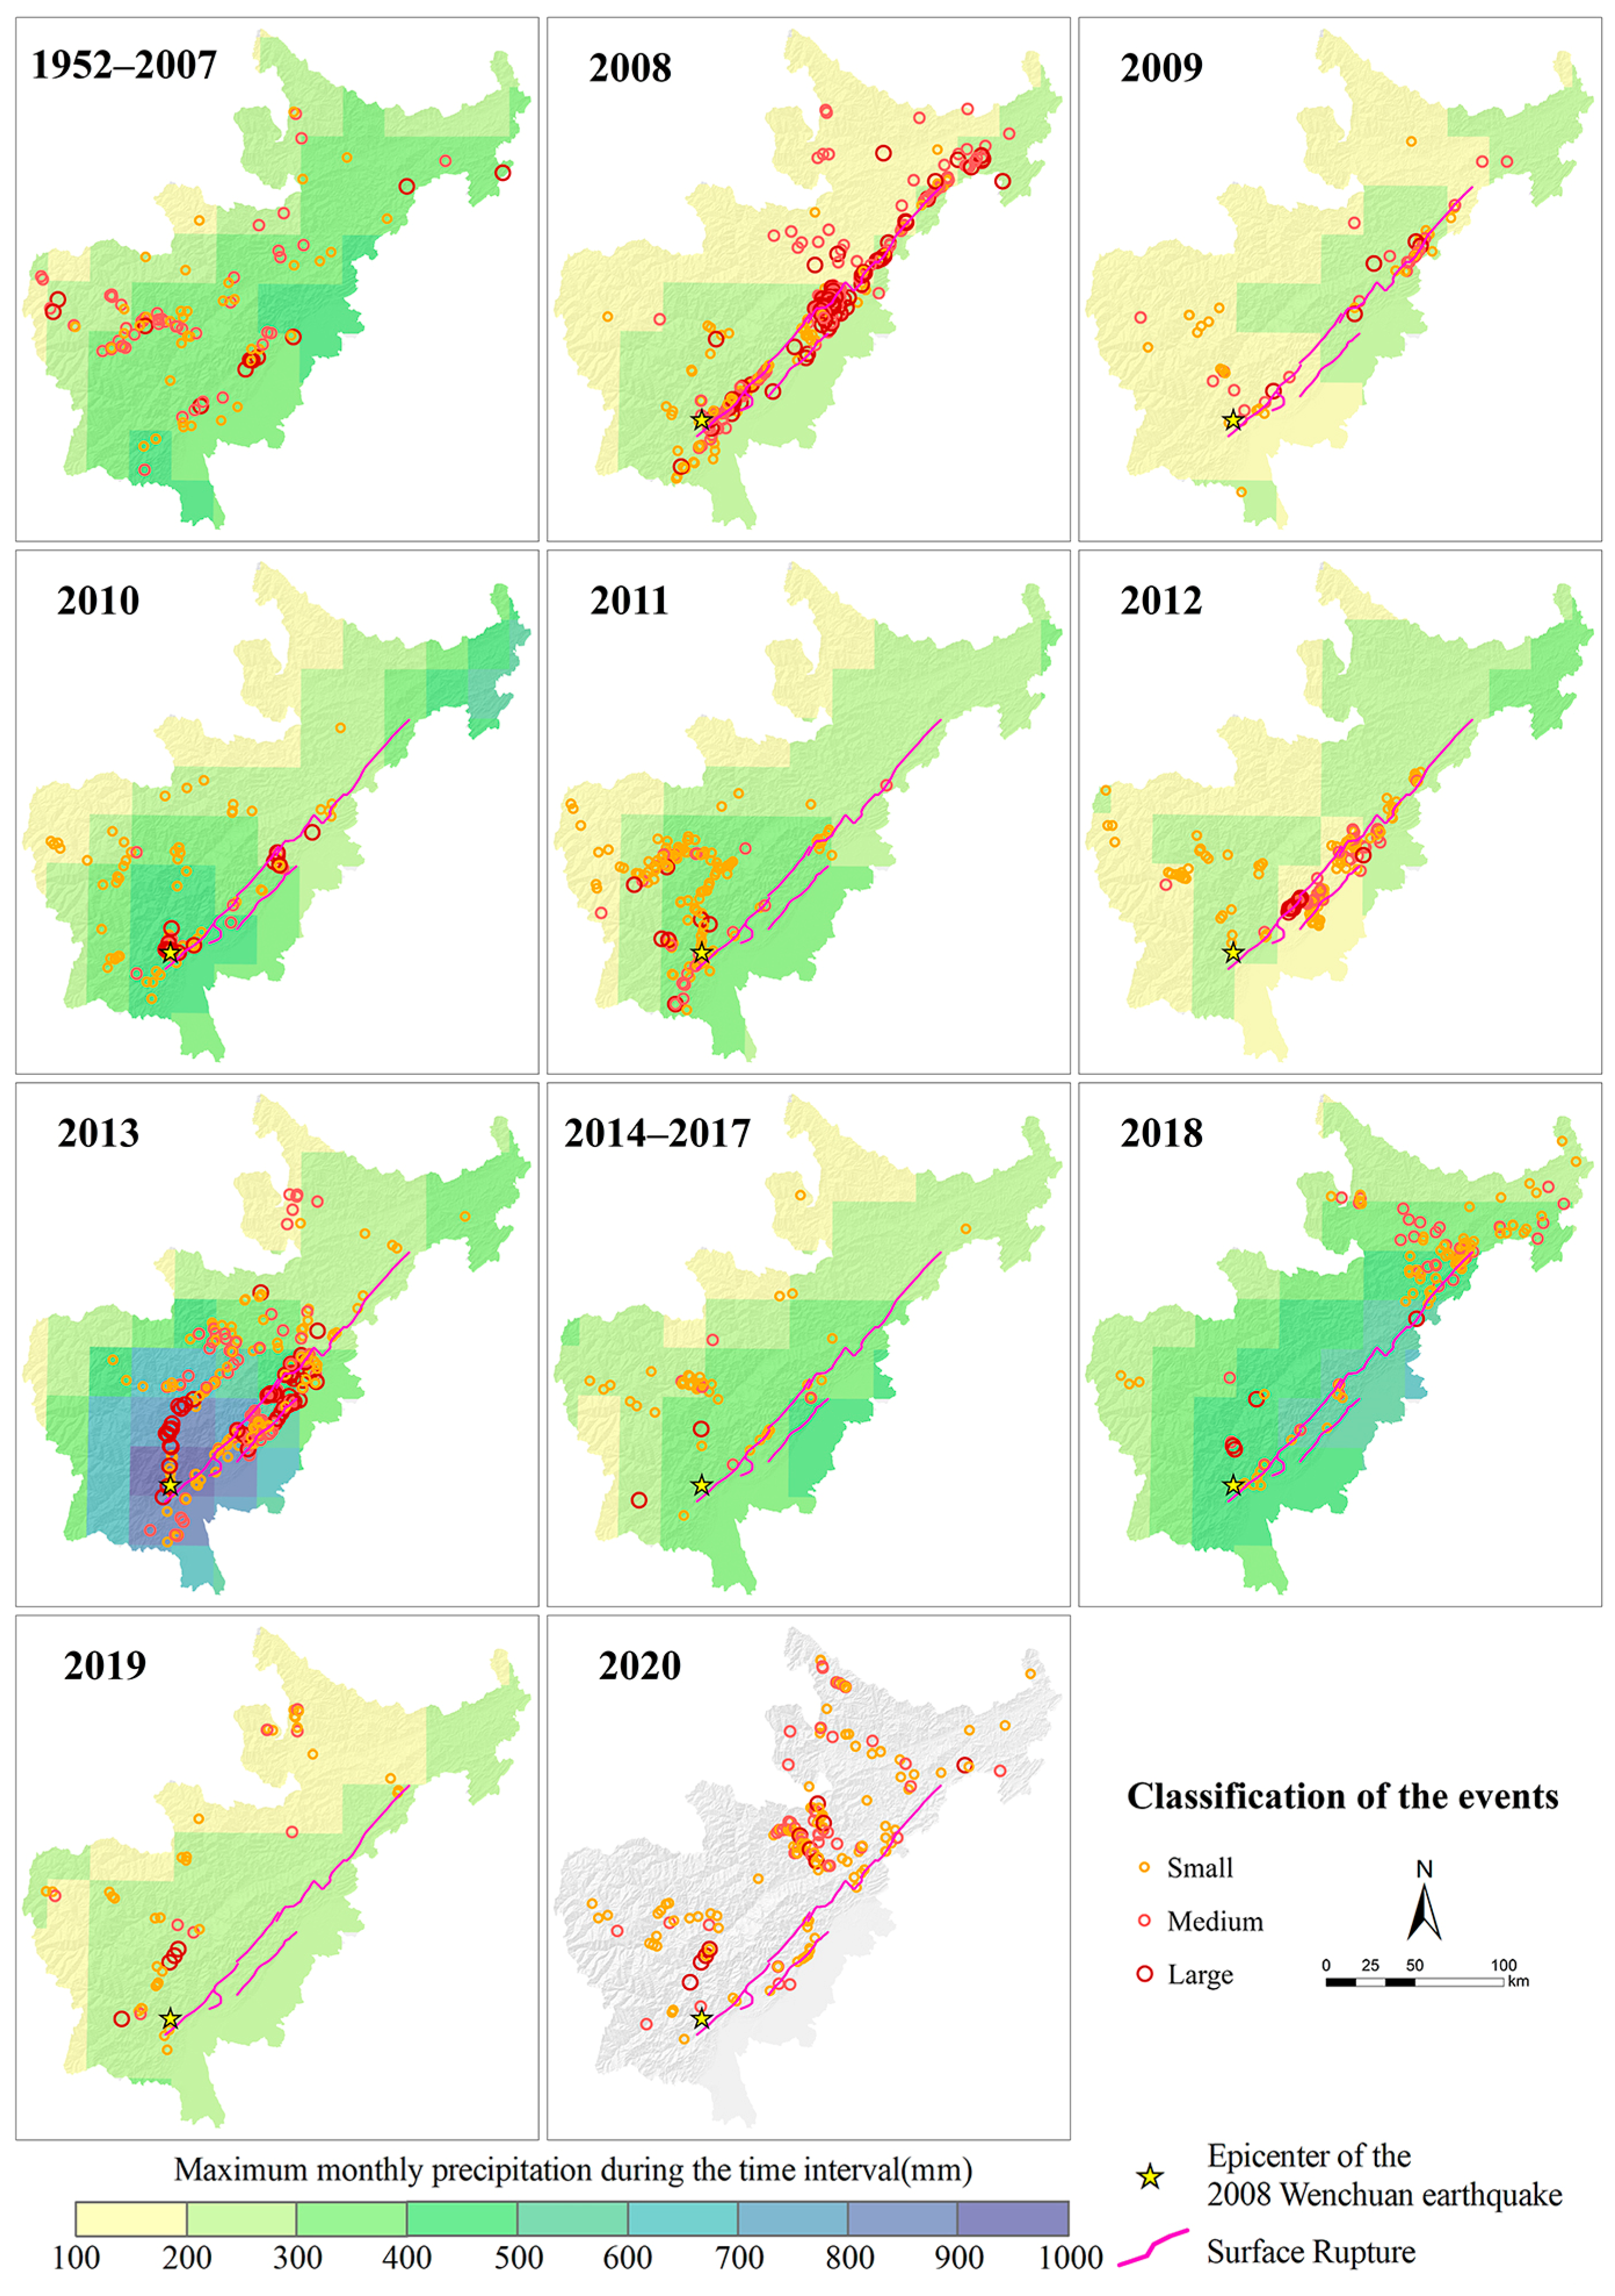
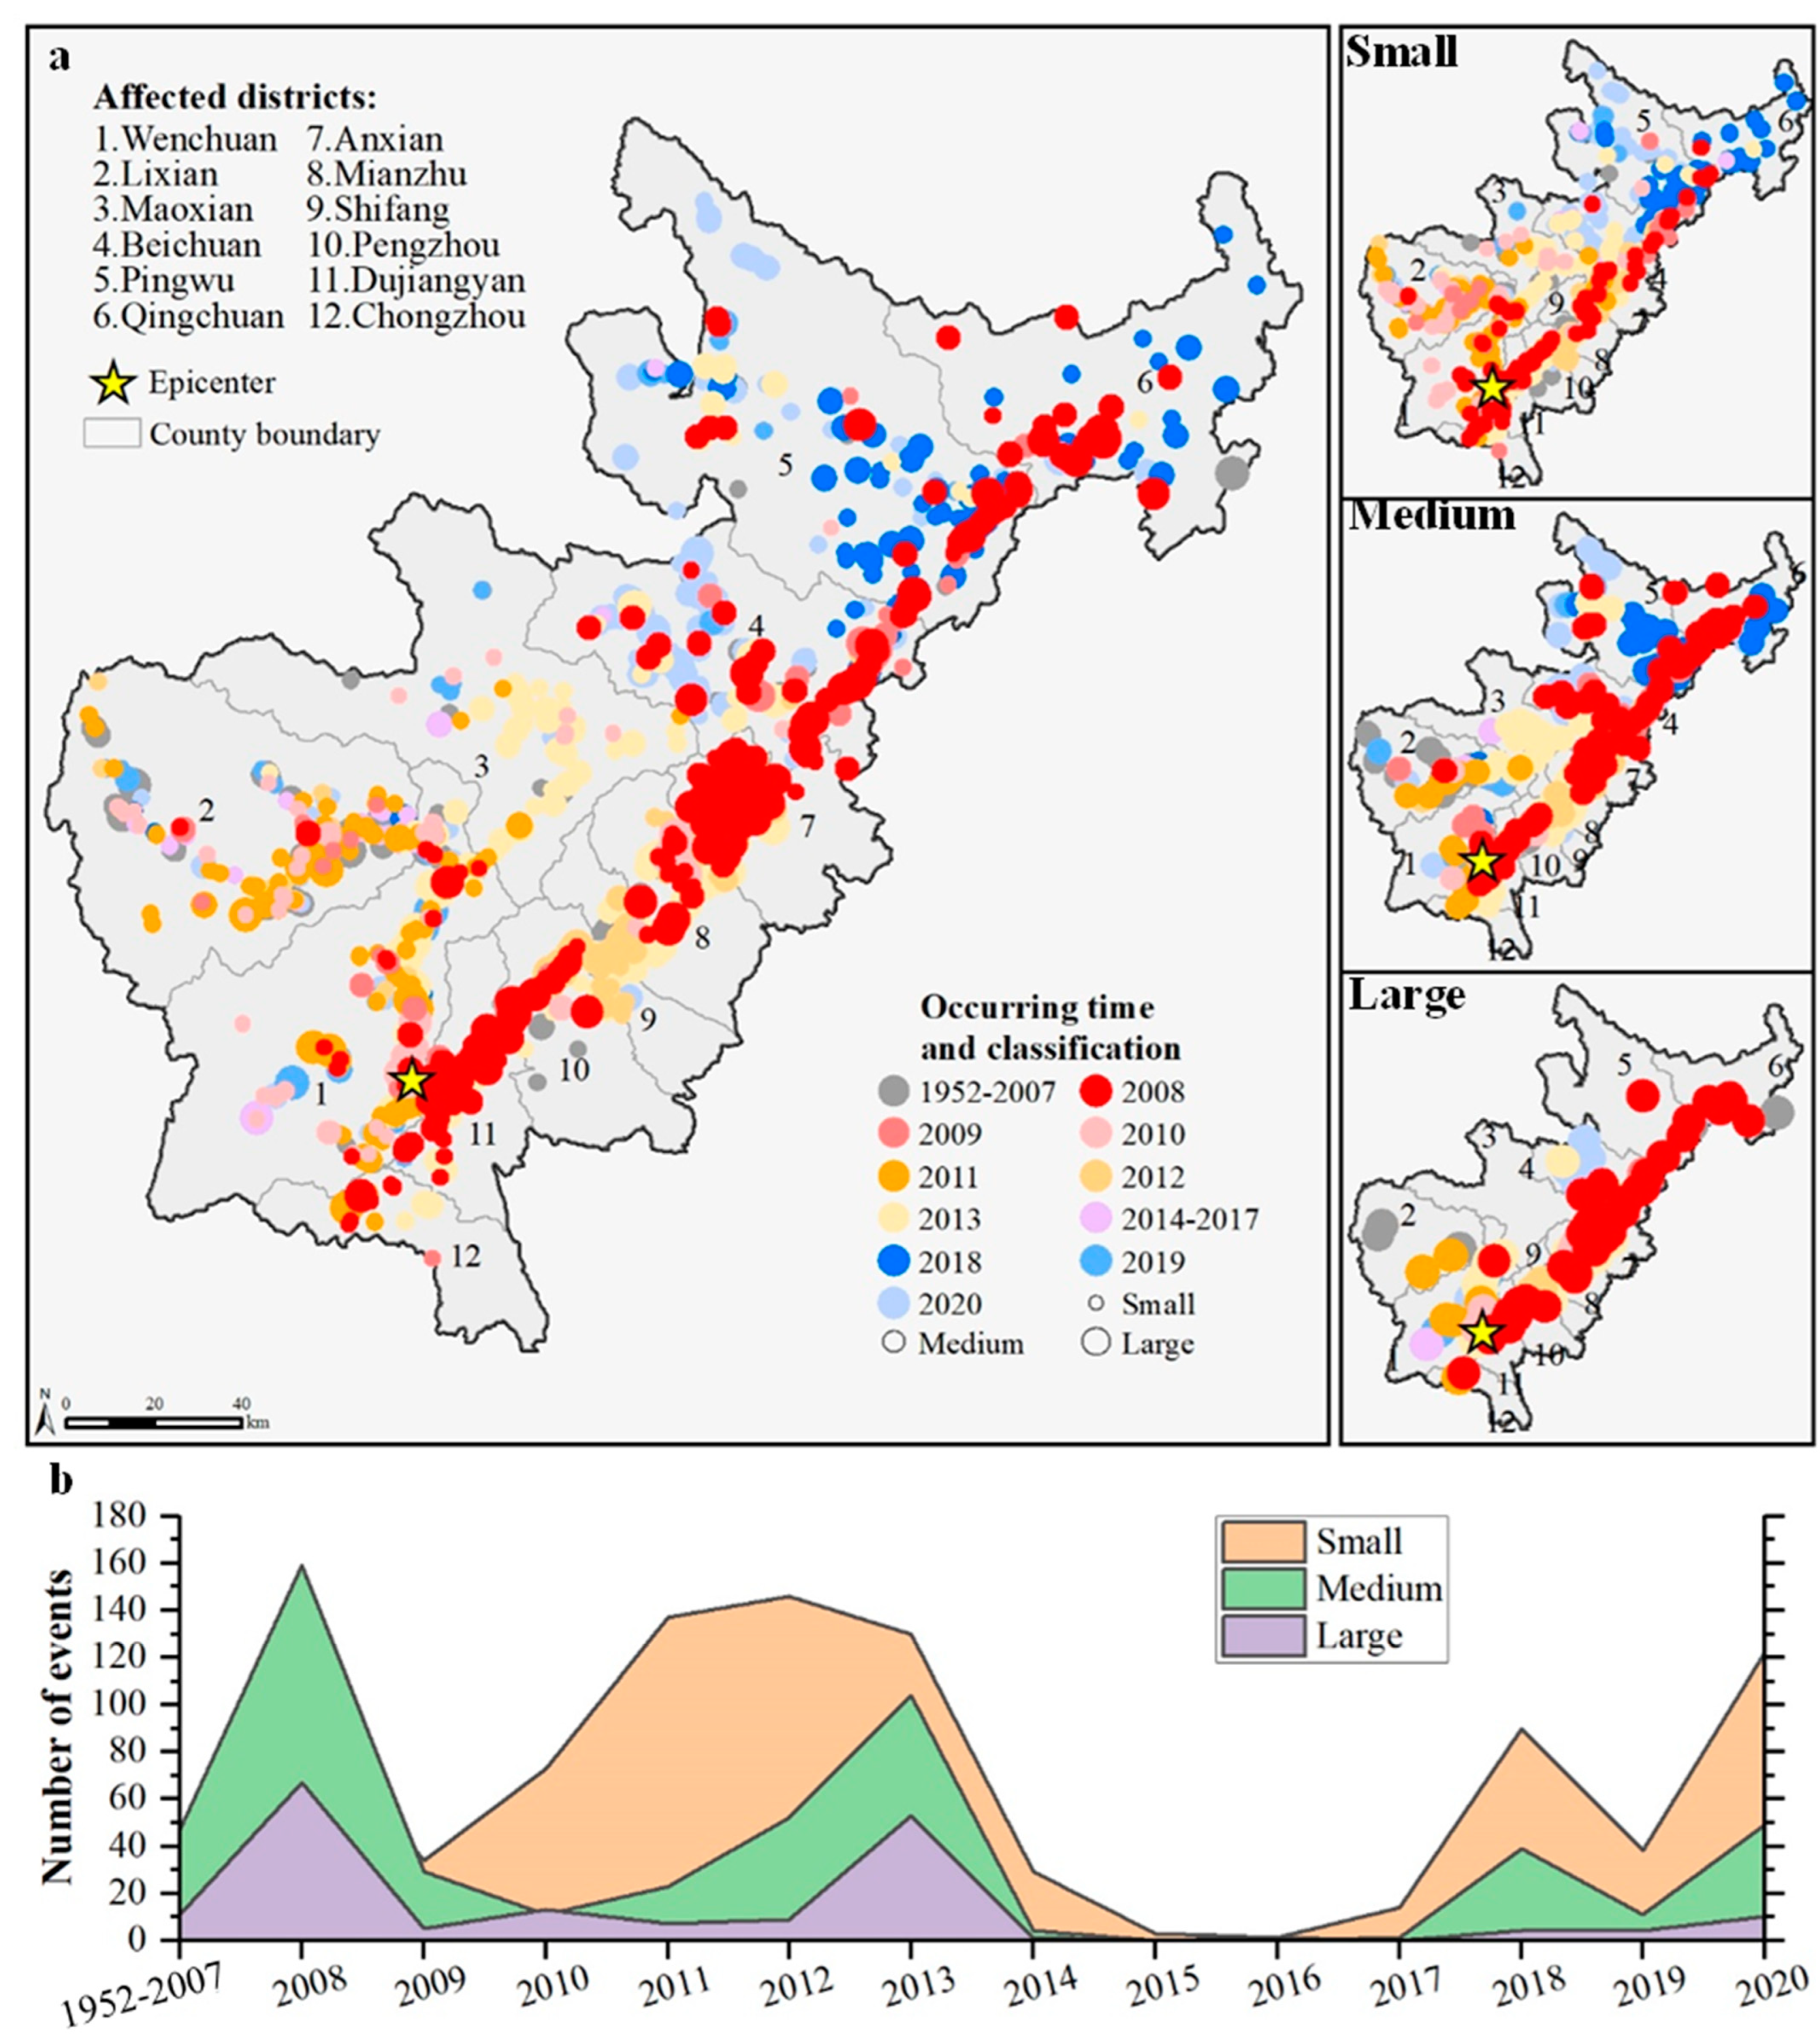
4.1. Evolution of Debris Flow Activity
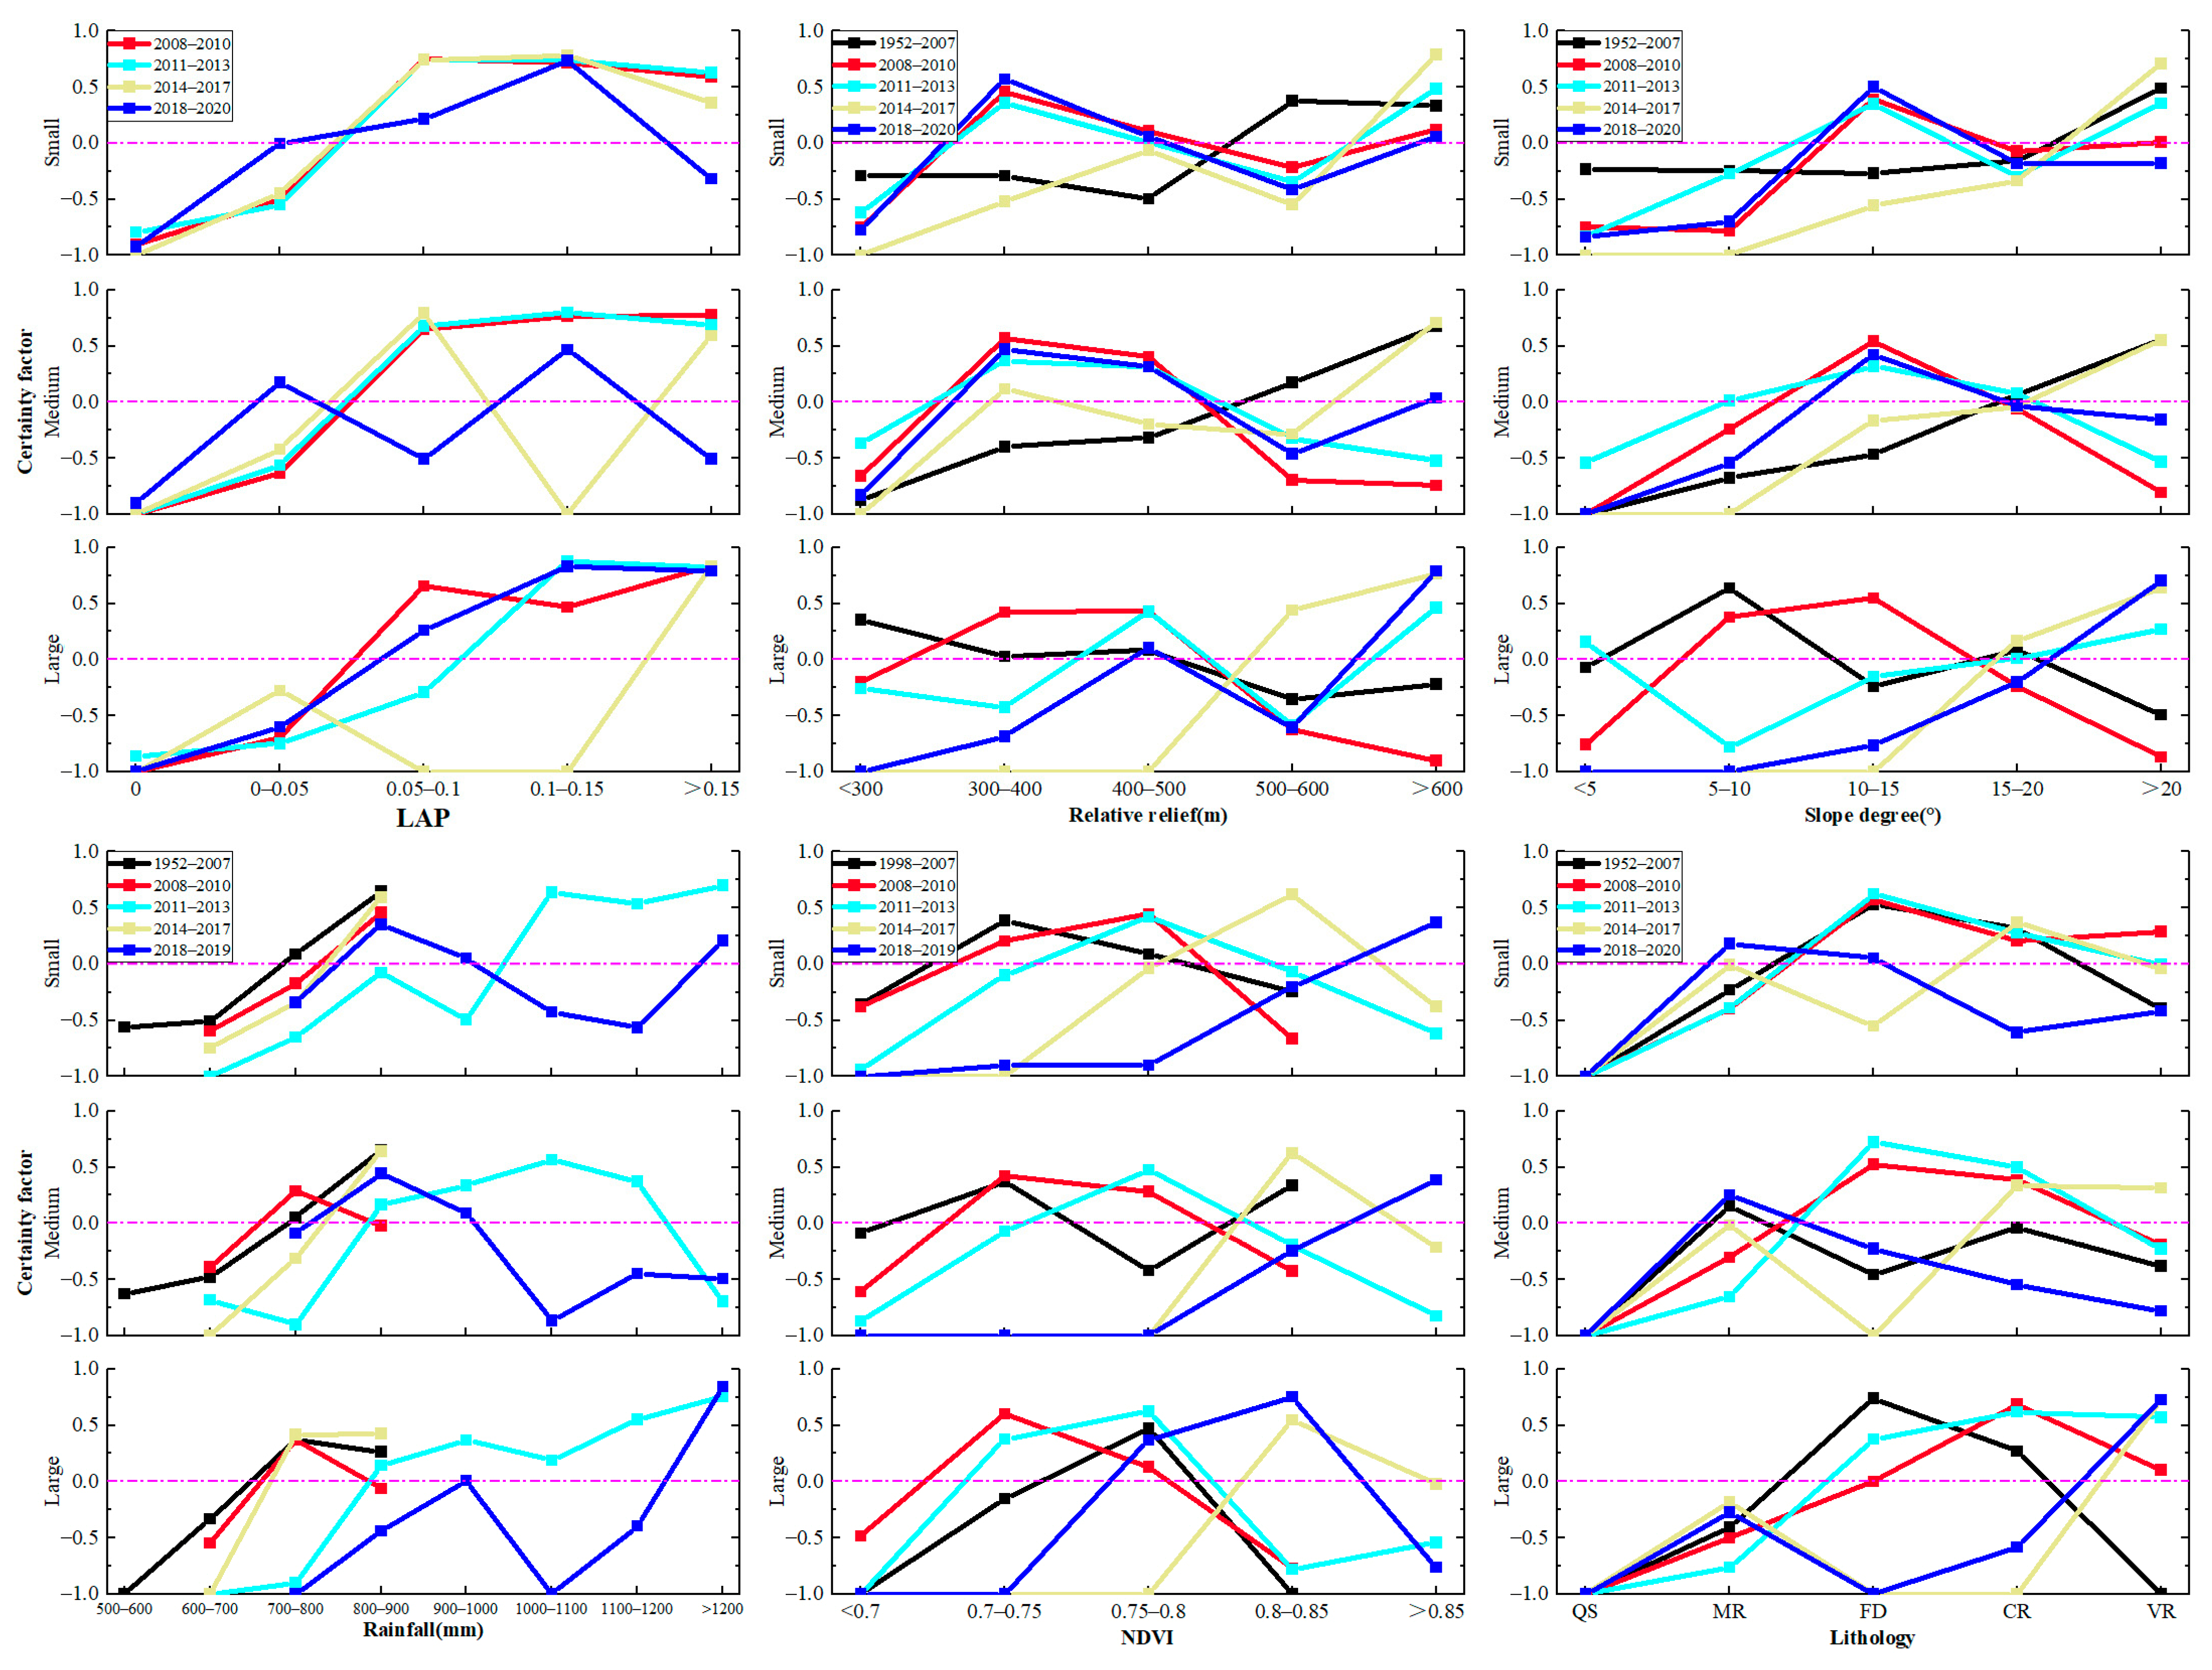
4.2. Relationship between Debris Flow Activity and Controlling Factors
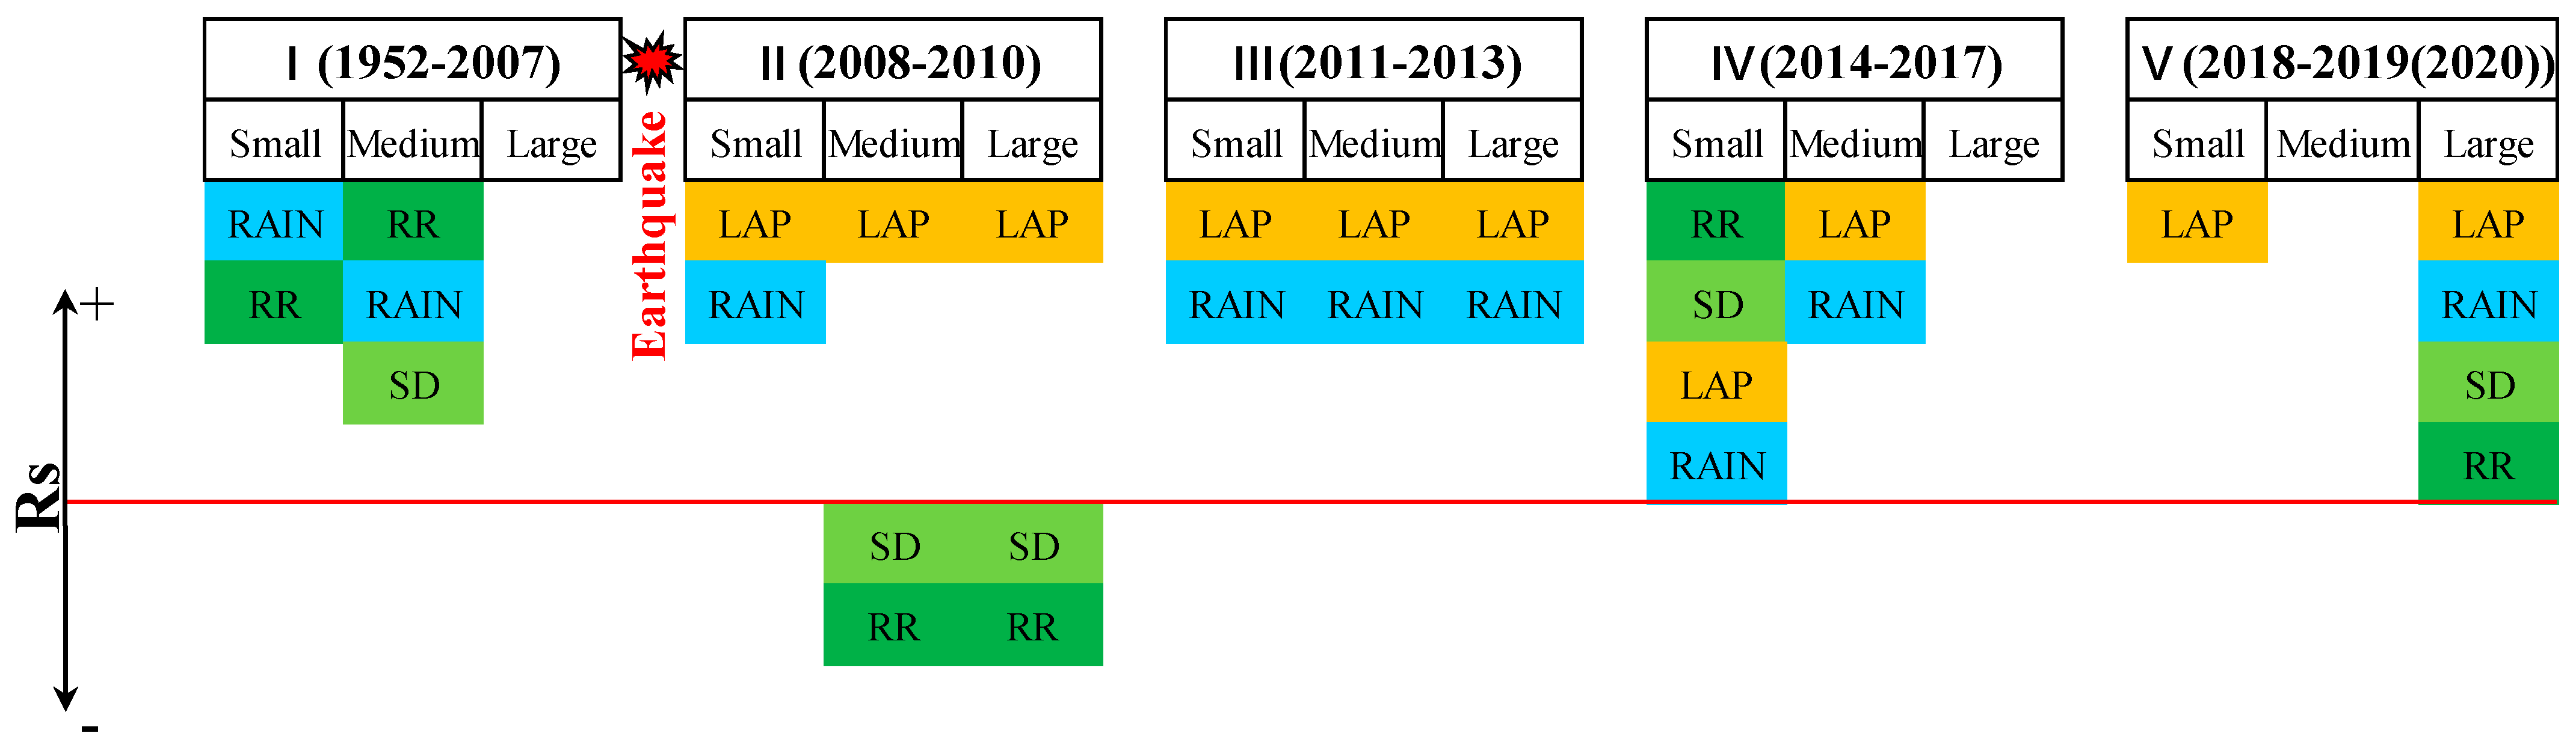
4.3. Evolving Controls
5. Discussion
6. Conclusions
- (1)
- Debris flow activity intensified rapidly after the Wenchuan earthquake, followed by a fluctuating downward trend in the number and scale of events. As of 2020, debris flow activity in the earthquake-affected area had not returned to the pre-earthquake level;
- (2)
- Post-earthquake debris flows were mainly concentrated in areas with abundant co-seismic landslides, and the requirements for topography and rainfall were reduced compared to those before the earthquake. Over time, the larger the debris flow events, the higher their requirements for topography and rainfall. The large debris flows became more concentrated in volcanic rock areas with time, and vegetation recovery in these areas was slower;
- (3)
- Pre-earthquake debris flows were mainly controlled by rainfall and topography. From 2008 to 2013, the debris flow activity was most closely related to the co-seismic landslides, followed by rainfall, while topography was not important. After 2014, the importance of the co-seismic landslides diminished significantly, and the importance of topography became apparent at this time;
- (4)
- The Wenchuan district has been a hotspot for large debris flows that have continued to occur after the earthquake due to the abundance of co-seismic landslides, superior topographic conditions, and sufficient rainfall during the monsoon season in this region.
Author Contributions
Funding
Institutional Review Board Statement
Informed Consent Statement
Data Availability Statement
Acknowledgments
Conflicts of Interest
References
- Iverson, R.M. Debris flows: Behaviour and hazard assessment. Geol. Today 2014, 30, 15–20. [Google Scholar] [CrossRef]
- Iverson, R.M. The physics of debris flows. Rev. Geophys. 1997, 35, 245–296. [Google Scholar] [CrossRef]
- Jakob, M.; Hungr, O.; Jakob, D.M. Debris-Flow Hazards and Related Phenomena; Springer: Berlin/Heidelberg, Germany, 2005. [Google Scholar]
- Lin, C.-W.; Shieh, C.-L.; Yuan, B.-D.; Shieh, Y.-C.; Liu, S.-H.; Lee, S.-Y. Impact of Chi-Chi earthquake on the occurrence of landslides and debris flows: Example from the Chenyulan River watershed, Nantou, Taiwan. Eng. Geol. 2004, 71, 49–61. [Google Scholar] [CrossRef]
- Xu, Q.; Zhang, S.; Li, W.L.; van Asch, T.W. The 13 August 2010 catastrophic debris flows after the 2008 Wenchuan earthquake, China. Nat. Hazards Earth Syst. Sci. 2012, 12, 201–216. [Google Scholar] [CrossRef]
- Tang, C.; van Asch, T.W.; Chang, M.; Chen, G.Q.; Zhao, X.H.; Huang, X.C. Catastrophic debris flows on 13 August 2010 in the Qingping area, southwestern China: The combined effects of a strong earthquake and subsequent rainstorms. Geomorphology 2012, 139–140, 559–576. [Google Scholar] [CrossRef]
- Cotecchia, F.; Santaloia, F.; Tagarelli, V. Towards A Geo-Hydro-Mechanical Characterization of Landslide Classes: Preliminary Results. Appl. Sci. 2020, 10, 7960. [Google Scholar] [CrossRef]
- Yu, B.; Wu, Y.; Chu, S. Preliminary study of the effect of earthquakes on the rainfall threshold of debris flows. Eng. Geol. 2014, 182, 130–135. [Google Scholar] [CrossRef]
- Zhou, W.; Tang, C. Rainfall thresholds for debris flow initiation in the Wenchuan earthquake-stricken area, southwestern China. Landslides 2014, 11, 877–887. [Google Scholar] [CrossRef]
- Tang, C.; Zhu, J.; Li, W.L.; Liang, J.T. Rainfall-triggered debris flows following the Wenchuan earthquake. Bull. Eng. Geol. Environ. 2009, 68, 187–194. [Google Scholar] [CrossRef]
- Zhang, S.; Zhang, L.M. Impact of the 2008 Wenchuan earthquake in China on subsequent long-term debris flow activities in the epicentral area. Geomorphology 2017, 276, 86–103. [Google Scholar] [CrossRef]
- Nakamura, F.; Swanson, F.J.; Wondzell, S.M. Disturbance regimes of stream and riparian systems—A disturbance-cascade perspective. Hydrol. Process. 2000, 14, 2849–2860. [Google Scholar] [CrossRef]
- Chiou, S.-J.; Cheng, C.-T.; Hsu, S.-M.; Lin, Y.-H.; Chi, S.-Y. Evaluating landslides and sediment yields induced by the Chi-Chi Earthquake and followed heavy rainfalls along the Ta-Chia River. J. GeoEngineering 2007, 2, 73–82. [Google Scholar]
- Lin, G.-W.; Chen, H.; Chen, Y.-H.; Horng, M.-J. Influence of typhoons and earthquakes on rainfall-induced landslides and suspended sediments discharge. Eng. Geol. 2008, 97, 32–41. [Google Scholar] [CrossRef]
- Saba, S.B.; van der Meijde, M.; van der Werff, H. Spatiotemporal landslide detection for the 2005 Kashmir earthquake region. Geomorphology 2010, 124, 17–25. [Google Scholar] [CrossRef]
- Shafique, M. Spatial and temporal evolution of co-seismic landslides after the 2005 Kashmir earthquake. Geomorphology 2020, 362, 107228. [Google Scholar] [CrossRef]
- Huang, R.; Fan, X. The landslide story. Nat. Geosci. 2013, 6, 325–326. [Google Scholar] [CrossRef]
- Tang, C.; Zhu, J.; Liang, J. Emergency assessment of seismic landslide susceptibility: A case study of the 2008 Wenchuan earthquake affected area. Earthq. Eng. Eng. Vib. 2009, 8, 207–217. [Google Scholar] [CrossRef]
- Yin, Y.; Wang, F.; Sun, P. Landslide hazards triggered by the 2008 Wenchuan earthquake, Sichuan, China. Landslides 2009, 6, 139–152. [Google Scholar] [CrossRef]
- Dahlquist, M.P.; West, A.J. Initiation and runout of post-seismic debris flows: Insights from the 2015 Gorkha earthquake. Geophys. Res. Lett. 2019, 46, 9658–9668. [Google Scholar] [CrossRef]
- Massey, C.; Townsend, D.; Lukovic, B.; Morgenstern, R.; Jones, K.; Rosser, B.; de Vilder, S. Landslides triggered by the MW7. 8 14 November 2016 Kaikōura earthquake: An update. Landslides 2020, 17, 2401–2408. [Google Scholar] [CrossRef]
- Qi, S.; Xu, Q.; Lan, H.; Zhang, B.; Liu, J. Spatial distribution analysis of landslides triggered by 2008.5. 12 Wenchuan Earthquake, China. Eng. Geol. 2010, 116, 95–108. [Google Scholar] [CrossRef]
- Zhao, B.; Taucer, F.; Rossetto, T. Field investigation on the performance of building structures during the 12 May 2008 Wenchuan earthquake in China. Eng. Struct. 2009, 31, 1707–1723. [Google Scholar] [CrossRef]
- Zhang, L.; Liu, X.; Li, Y.; Liu, Y.; Liu, Z.; Lin, J.; Shen, J.; Tang, X.; Zhang, Y.; Liang, W. Emergency medical rescue efforts after a major earthquake: Lessons from the 2008 Wenchuan earthquake. Lancet 2012, 379, 853–861. [Google Scholar] [CrossRef] [PubMed]
- Xu, C.; Xu, X.; Yao, X.; Dai, F. Three (nearly) complete inventories of landslides triggered by the May 12, 2008 Wenchuan Mw 7.9 earthquake of China and their spatial distribution statistical analysis. Landslides 2014, 11, 441–461. [Google Scholar] [CrossRef]
- Fan, X.; Domènech, G.; Scaringi, G.; Huang, R.; Xu, Q.; Hales, T.C.; Dai, L.; Yang, Q.; Francis, O. Spatio-temporal evolution of mass wasting after the 2008 Mw 7.9 Wenchuan earthquake revealed by a detailed multi-temporal inventory. Landslides 2018, 15, 2325–2341. [Google Scholar] [CrossRef]
- Huang, R. After effect of geohazards induced by the Wenchuan earthquake. J. Eng. Geol. 2011, 19, 145–151. [Google Scholar]
- Guo, X.; Cui, P.; Li, Y.; Zhang, J.; Ma, L.; Mahoney, W.B. Spatial features of debris flows and their rainfall thresholds in the Wenchuan earthquake-affected area. Landslides 2015, 13, 1215–1229. [Google Scholar] [CrossRef]
- Fan, X.; Scaringi, G.; Domènech, G.; Yang, F.; Guo, X.; Dai, L.; He, C.; Xu, Q.; Huang, R. Two multi-temporal datasets that track the enhanced landsliding after the 2008 Wenchuan earthquake. Earth Syst. Sci. Data 2019, 11, 35–55. [Google Scholar] [CrossRef]
- Yang, F.; Fan, X.; Siva Subramanian, S.; Dou, X.; Xiong, J.; Xia, B.; Yu, Z.; Xu, Q. Catastrophic debris flows triggered by the 20 August 2019 rainfall, a decade since the Wenchuan earthquake, China. Landslides 2021, 18, 3197–3212. [Google Scholar] [CrossRef]
- Xiong, J.; Tang, C.; Chen, M.; Zhang, X.; Shi, Q.; Gong, L. Activity characteristics and enlightenment of the debris flow triggered by the rainstorm on 20 August 2019 in Wenchuan County, China. Bull. Eng. Geol. Environ. 2020, 80, 873–888. [Google Scholar] [CrossRef]
- Zhang, X.; Tang, C.; Li, N.; Xiong, J.; Chen, M.; Li, M.; Tang, C.J.L. Investigation of the 2019 Wenchuan County debris flow disaster suggests nonuniform spatial and temporal post-seismic debris flow evolution patterns. Landslides 2022, 19, 1935–1956. [Google Scholar] [CrossRef]
- Fu, B.H.; Wang, P.; Kong, P.; Shi, P.L.; Zheng, G.D. Atlas of Seismological and Geological Disasters Associated with the 12 May 2008 Ms 8.0 Wenchuan Great Earthquake, Sichuan, China; Seismological Press: Beijing, China, 2009. [Google Scholar]
- Zhang, S.; Zhang, L.; Peng, M.; Zhang, L.; Zhao, H.; Chen, H.X. Assessment of risks of loose landslide deposits formed by the 2008 Wenchuan earthquake. Hazards Earth Syst. Sci. 2012, 12, 1381–1392. [Google Scholar] [CrossRef] [Green Version]
- Li, P. Spatio-Temporal Dynamic Evolution Research of Eco-Geological Security in Geological Disaster-Striken Areas. PhD Thesis, Chengdu University of Technology, Chengdu, China, June 2020. [Google Scholar]
- Tang, C.; Wei-le, L.; Jun, D.; Xiang-chao, H. Field Investigation and Research on Giant Debris Flow on August 14, 2010 in Yingxiu Town, Epicenter of Wenchuan Earthquake. Earth Sci. 2011, 36, 172–180. [Google Scholar]
- Guo, X.; Cui, P.; Li, Y.; Ma, L.; Ge, Y.; Mahoney, W.B. Intensity–duration threshold of rainfall-triggered debris flows in the Wenchuan earthquake affected area, China. Geomorphology 2016, 253, 208–216. [Google Scholar] [CrossRef]
- Tang, C.; Westen, C.J. Atlas of Wenchuan-Earthquake Geohazards: Analysis of Co-Seismic and Post-Seismic Geohazards in the Area Affected by the 2008 Wenchuan Earthquake; Science Press: Beijing, China, 2018. [Google Scholar]
- Shortliffe, E.H.; Buchanan, B.G. A model of inexact reasoning in medicine. Math. Biosci. 1975, 23, 351–379. [Google Scholar] [CrossRef]
- Heckerman, D. Probabilistic Interpretations for Mycin’s Certainty Factors. In Machine Intelligence and Pattern Recognition; Kanal, L.N., Lemmer, J.F., Eds.; Elsevier: Amsterdam, The Netherlands, 1986; Volume 4, pp. 167–196. [Google Scholar]
- Chen, M.; Tang, C.; Xiong, J.; Shi, Q.; Li, N.; Gong, L.; Wang, X.; Tie, Y. The long-term evolution of landslide activity near the epicentral area of the 2008 Wenchuan earthquake in China. Geomorphology 2020, 367, 107317. [Google Scholar] [CrossRef]
- Lan, H.X.; Zhou, C.H.; Wang, L.J.; Zhang, H.Y.; Li, R.H. Landslide hazard spatial analysis and prediction using GIS in the Xiaojiang watershed, Yunnan, China. Eng. Geol. 2004, 76, 109–128. [Google Scholar] [CrossRef]
- Gauthier, T.D. Detecting trends using Spearman’s rank correlation coefficient. Environ. Forensics 2001, 2, 359–362. [Google Scholar] [CrossRef]
- Sedgwick, P. Spearman’s rank correlation coefficient. BMJ 2014, 349, g7327. [Google Scholar] [CrossRef] [PubMed]
- Rebekić, A.; Lončarić, Z.; Petrović, S.; Marić, S. Pearson’s or Spearman’s correlation coefficient-which one to use? Poljoprivreda 2015, 21, 47–54. [Google Scholar] [CrossRef]
- Huang, R.Q.; Li, W.L. Analysis of the geo-hazards triggered by the 12 May 2008 Wenchuan Earthquake, China. Bull. Eng. Geol. Environ. 2009, 68, 363–371. [Google Scholar] [CrossRef]
- Chen, M.; Tang, C.; Wang, X.; Xiong, J.; Shi, Q.; Zhang, X.; Li, M.; Luo, Y.; Tie, Y.; Feng, Q. Temporal and spatial differentiation in the surface recovery of post-seismic landslides in Wenchuan earthquake-affected areas. Ecol. Inform. 2021, 64, 101356. [Google Scholar] [CrossRef]
- Xiong, J.; Tang, C.; Chen, M.; Gong, L.; Li, N.; Zhang, X.; Shi, Q. Long-term changes in the landslide sediment supply capacity for debris flow occurrence in Wenchuan County, China. Catena 2021, 203, 105340. [Google Scholar] [CrossRef]


| Source | Time Span | Quantity | Total Number of Events | ||
|---|---|---|---|---|---|
| Time of Occurrence | GPS Coordinates | Scale Level | |||
| Field surveys and the literature | 2008–2020 | 568 | 1668 | ||
| Natural Resources Department | 2000–2020 | 691 | |||
| Geological Disaster Database of the Southwest Topographic Abrupt Change Zone | 1952–2009 | 409 | |||
| Classification Indicator | Level | Criteria (×104 m3) |
|---|---|---|
| Volume of event washout (V) | Small | V < 2 |
| Medium | 2 ≤ V < 20 | |
| Large | V ≥ 20 |
| Controlling Factors | Resolution | Time Coverage | Source | Factor Grading Criteria Based on a 10 × 10 km Grid |
|---|---|---|---|---|
| Landslide area percentage (LAP) | 1 × 1 km | / | Xu et al., 2014 | 1. 0 2. 0–0.05 3. 0.05–0.1 4. 0.1–0.15 5. >0.15 |
| Relative relief (RR) | 30 × 30 m | / | ALOS | 1. <300 m 2. 300–400 m 3. 400–500 m 4. 500–600 m 5. >600 m |
| Slope degree (SD) | 30 × 30 m | / | 1. <5° 2. 5–10° 3. 10–15° 4. 15–20° 5. >20° | |
| Rainfall (RAIN) | 25 × 25 km | 1952–2019 | Global Precipitation Climatology Centre dataset (GPCC) | 1. 500–600 mm 2. 600–700 mm 3. 700–800 mm 4. 800–900 mm 5. 900–1000 mm 6. 1000–1100 mm 7. 1100–1200 mm 8. >1200 mm |
| Normalized vegetation index(NDVI) | 1 × 1 km | 1998–2019 | Research and Environment Science and Data Center | 1. <0.7 2. 0.7–0.75 3. 0.75–0.8 4. 0.8–0.85 5. >0.85 |
| Lithology (LITH) | 1:500,000 | / | China Geological Survey (CGS) | 1. Quaternary Sediments (QS): gravel, sand, and clay. 2. Metamorphic Rocks (MR): fragmentized phyllite and metamorphosed slate. 3. Flysch Deposits (FD): marl, sandy shale, mud interbedded with greywacke, coarse and fine sandstone, and sandy conglomerates. 4. Carbonate Rocks (CR): limestone, dolomite, and marl 5. Volcanic Rocks (VR): granite, andesite, basalt, and pyroclastic deposits. |
| Temporal Interval | Number of Debris Flow Events | Major Debris Flows | ||||
|---|---|---|---|---|---|---|
| Subtotal | Small | Medium | Large | Date | Affected Districts | |
| 1952–2007 | 98 | 40 | 47 | 11 | ||
| 2008 | 323 | 97 | 159 | 67 | 9.24 | Beichuan |
| 2009 | 68 | 34 | 29 | 5 | ||
| 2010 | 97 | 73 | 11 | 13 | 8.13 | Mianzhu/Dujiangyan/Wenchuan |
| 2011 | 167 | 137 | 23 | 7 | 7.3/7.28/8.20 | Wenchuan/Maoxian/Anxian/Lixian |
| 2012 | 207 | 146 | 52 | 9 | 8.17 | Pengzhou/Shifang/Mianzhu/Anxian/Beichuan |
| 2013 | 287 | 130 | 104 | 53 | 7.10 | Pengzhou/Anxian/Mianzhu/Beichuan/Maoxian/Wenchuan |
| 2014 | 34 | 29 | 4 | 1 | 7.9 | Lixian/Wenchuan |
| 2015 | 3 | 3 | 0 | 0 | ||
| 2016 | 2 | 1 | 0 | 1 | ||
| 2017 | 15 | 14 | 1 | 0 | ||
| 2018 | 133 | 90 | 39 | 4 | 6.25/7.10 | Beichuan/Pingwu |
| 2019 | 53 | 38 | 11 | 4 | 8.20 | Wenchuan |
| 2020 | 181 | 122 | 49 | 10 | 8.17 | Beichuan/Pingwu/Mianzhu/Wenchuan |
| Total | 1668 | 954 | 529 | 185 | ||
| Level | Period (Ⅰ–Ⅴ) | Spearman Correlation Coefficient (RS) | |||
|---|---|---|---|---|---|
| LAP | Rainfall | Relative Relief | Slope Degree | ||
| Small | Ⅰ: 1952–2007 | / | 0.20 | 0.12 | 0.10 |
| Ⅱ: 2008–2010 | 0.34 | 0.19 | 0.07 | 0.05 | |
| Ⅲ: 2011–2013 | 0.34 | 0.30 | 0.07 | 0.07 | |
| Ⅳ: 2014–2017 | 0.16 | 0.15 | 0.21 | 0.21 | |
| Ⅴ: 2018–2019 (2020) | 0.19 | −0.05 | 0.00 | 0.00 | |
| Medium | Ⅰ: 1952–2007 | / | 0.15 | 0.17 | 0.14 |
| Ⅱ: 2008–2010 | 0.31 | 0.02 | −0.16 | −0.13 | |
| Ⅲ: 2011–2013 | 0.34 | 0.27 | −0.01 | 0.00 | |
| Ⅳ: 2014–2017 | 0.11 | 0.11 | 0.08 | 0.08 | |
| Ⅴ: 2018–2019 (2020) | 0.07 | −0.09 | 0.00 | 0.01 | |
| Large | Ⅰ: 1952–2007 | / | 0.06 | −0.05 | −0.06 |
| Ⅱ: 2008–2010 | 0.36 | 0.09 | −0.17 | −0.15 | |
| Ⅲ: 2011–2013 | 0.37 | 0.22 | 0.04 | 0.05 | |
| Ⅳ: 2014–2017 | 0.07 | 0.06 | 0.10 | 0.08 | |
| Ⅴ: 2018–2019 (2020) | 0.22 | 0.18 | 0.14 | 0.17 | |
| ID | Restricts Involved | LAP | Relative Relief (m) | Slope Degree (°) | Rainfall (mm) | Event Density (/km2) | Percentage of Large Events |
|---|---|---|---|---|---|---|---|
| 1 | Anxian/Mianzhu/Shifang/Pengzhou/Dujiangyan | 13.81% | 419.67 | 14.53 | 936.85 | 0.19 | 16% |
| 2 | Wenchuan/Maoxian | 11.53% | 582.47 | 20.32 | 1021.23 | 0.05 | 18% |
| 3 | Old Beichuan/East Pingwu | 8.14% | 394.13 | 13.86 | 751.23 | 0.24 | 8% |
| 4 | Lixian | 0.99% | 586.84 | 20.36 | 887.66 | 0.09 | 2% |
| 5 | West Pingwu | 0.26% | 391.77 | 13.93 | 753.3 | 0.05 | 1% |
Disclaimer/Publisher’s Note: The statements, opinions and data contained in all publications are solely those of the individual author(s) and contributor(s) and not of MDPI and/or the editor(s). MDPI and/or the editor(s) disclaim responsibility for any injury to people or property resulting from any ideas, methods, instructions or products referred to in the content. |
© 2023 by the authors. Licensee MDPI, Basel, Switzerland. This article is an open access article distributed under the terms and conditions of the Creative Commons Attribution (CC BY) license (https://creativecommons.org/licenses/by/4.0/).
Share and Cite
Yang, Y.; Tang, C.; Cai, Y.; Tang, C.; Chen, M.; Huang, W.; Liu, C. Characteristics of Debris Flow Activities at Different Scales after the Disturbance of Strong Earthquakes—A Case Study of the Wenchuan Earthquake-Affected Area. Water 2023, 15, 698. https://doi.org/10.3390/w15040698
Yang Y, Tang C, Cai Y, Tang C, Chen M, Huang W, Liu C. Characteristics of Debris Flow Activities at Different Scales after the Disturbance of Strong Earthquakes—A Case Study of the Wenchuan Earthquake-Affected Area. Water. 2023; 15(4):698. https://doi.org/10.3390/w15040698
Chicago/Turabian StyleYang, Yu, Chenxiao Tang, Yinghua Cai, Chuan Tang, Ming Chen, Wenli Huang, and Chang Liu. 2023. "Characteristics of Debris Flow Activities at Different Scales after the Disturbance of Strong Earthquakes—A Case Study of the Wenchuan Earthquake-Affected Area" Water 15, no. 4: 698. https://doi.org/10.3390/w15040698