
Experimental Analysis of 3D Flow Structures around a Floating Dike

1
Changjiang River Scientific Research Institute, Wuhan 430010, China
2
James Watt School of Engineering, University of Glasgow, Glasgow G12 8QQ, UK
3
School of Water Resources and Hydropower Engineering, Wuhan University, Wuhan 430072, China
*
Author to whom correspondence should be addressed.
Water 2023, 15(4), 703; https://doi.org/10.3390/w15040703
Submission received: 16 December 2022
/
Revised: 6 February 2023
/
Accepted: 6 February 2023
/
Published: 10 February 2023
(This article belongs to the Section Hydraulics and Hydrodynamics)
Abstract
:Floating dikes have several advantages over spur dikes including less influence on riverine sediment transport, bed topography, and ecosystems, and a good adaptability to fluvial conditions. Despite these advantages, floating dikes have not been used in many river regulation schemes due to the limited understanding of the 3D flow structures around floating dikes. In this study, a series of experiments were conducted to investigate the 3D flow structures around floating dikes. Results show that, after installing a floating dike on one side of a flume, the surface water flow is deflected to the opposite side of the flume, and a backflow develops around the outer and downstream side of the dike, where both the vertical turbulent intensity and the absolute magnitude of the Reynolds stress are relatively large. Due to the blocking effect of the dike, the cross-sectional area decreases, causing an increase in velocities below and alongside the dike, as well as a decrease in velocities upstream of the dike. Increasing the submerged depth or length of the dike results in an increase in flow velocity adjacent to the dike, as well as an increase in the vertical or lateral scale of the backflow. On the contrary, increasing the dike thickness leads to a weakening or disappearance of the backflow, along with a decrease in the acceleration rate of flow adjacent to the dike.
1. Introduction
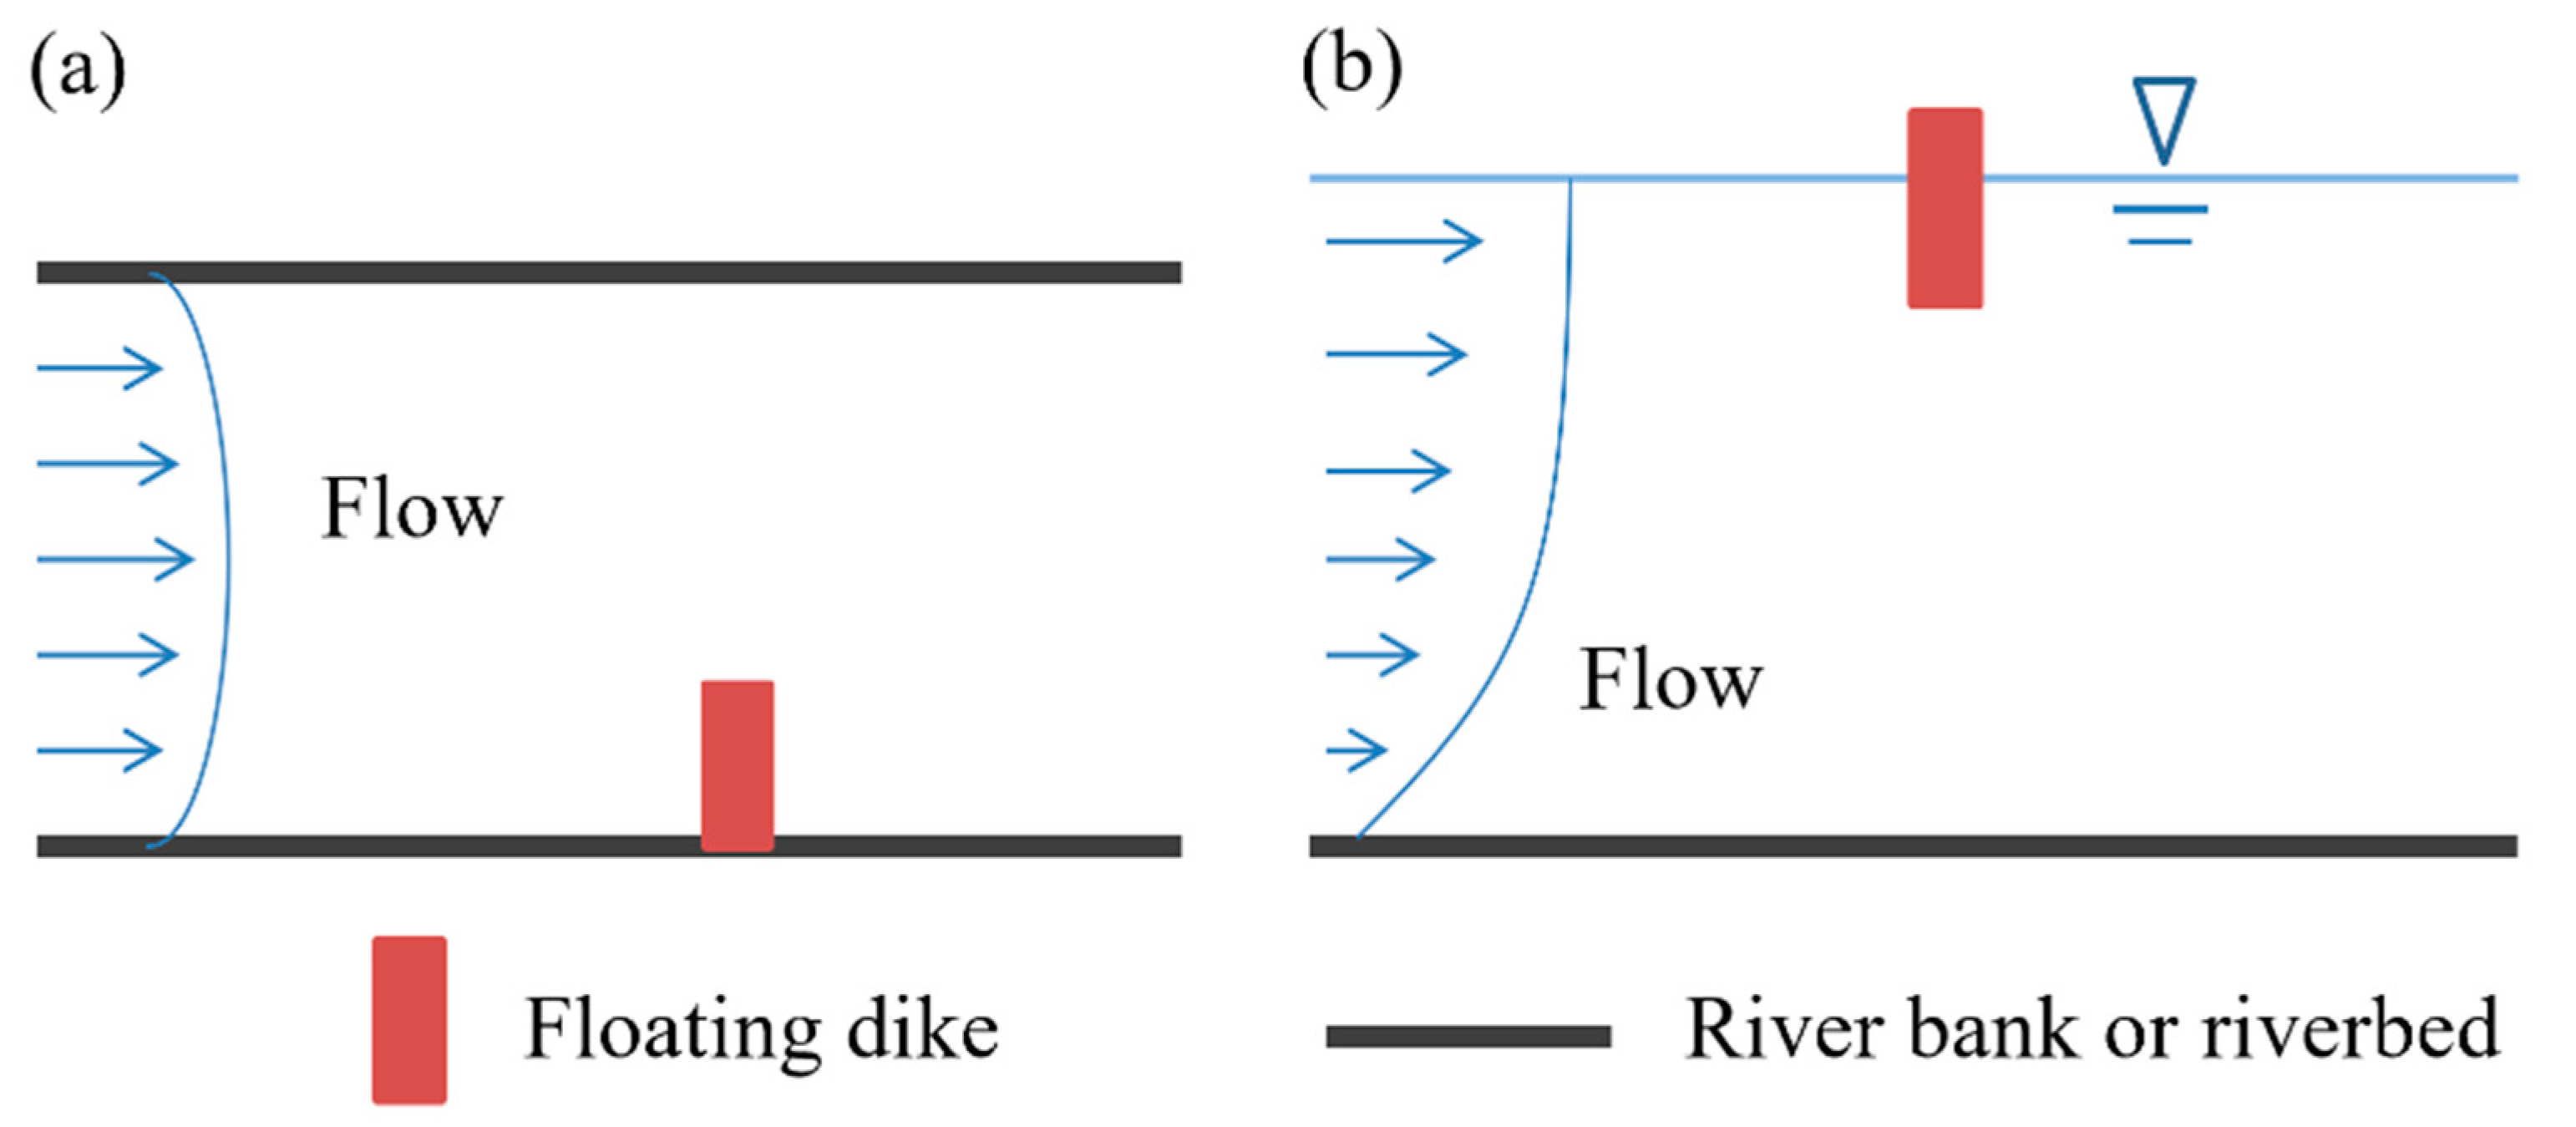
Hydraulic structures are either fixed on the riverbed, such as spur dikes and submerged dikes, or float on the water surface, such as floating dikes and floating rafts. Floating dikes (Figure 1) are used in hydropower engineering to redirect floating debris [1,2,3] and to disturb harmful flow structures at the intakes [4]. They are also used in water diversion projects to avoid floating debris entering into diversion channel [5]. Compared to fixed dikes, floating dikes have the following advantages:
- (i)
- Floating dikes impose a marginal effect on sediment transport in rivers. Flow velocities are usually smaller at the riverbed than close to the water surface, while the opposite is true for sediment concentration which is high near the riverbed. In braided rivers, adopting fixed dikes such as spur dikes can change not only the discharge ratio but also the rate of sediment loading and transport. Because the influence of floating dikes on the fluvial processes is stronger in the upper part rather than the lower part of the water column, floating dikes have less impact on sediment transport than fixed dikes.
- (ii)
- Since floating dikes are located near the water surface, they are not significantly affected by bed deformation; thus, they easily adapt to diverse flow and sediment conditions and bed morphology. On the other hand, fixed dikes are usually permanent structures and difficult to remove after construction, even if they are found to modify the fluvial or sediment processes in a negative way under certain conditions.
- (iii)
- Floating dikes have little effect on the local riverbed and ecology. Construction of fixed dikes can change the riverbed substrates significantly [6] and, hence, the habitats of aquatic organisms. For example, some fixed dikes in the Yangtze River are about 100 m long, and the soft mattresses which are used to prevent local scouring are tens of thousands of square meters. Both the fixed dikes and corresponding soft mattresses lie directly on the riverbed, preventing material exchange between the riverbed and river flow, which can alter the riverbed substrates and the aquatic environment [7,8].
Considering all of the above, floating dikes should be considered more widely in river regulation schemes. However, the understanding of the effects of floating dikes on local flow structures is limited. More research is required before floating dikes can be widely accepted in river engineering practice.
In the literature, several studies have investigated the three-dimensional flow structures caused by the presence of fixed dikes. However, for floating dikes, previous research has examined the impact of the dikes on surface flow velocities, but has not been extended to look at the effect on three-dimensional flow structures [9,10,11,12,13,14,15,16]. In the hydropower industry, where floating dikes are used as guide-floating structures, Tong et al. showed that there are still many problems with the design and actual operation of guide-floating rows, particularly in relation to the 3D flow structures [17]. Physical model tests have demonstrated that the vertical vortex caused by unfavorable flow patterns such as plane reflux, asymmetric flow, and lateral flow is diminished by using floating dikes [4]. In order to prevent the spread of water snails attached to the floating debris through large-scale water diversion projects, floating dikes can be used to guide the surface flow directions, such that floating objects do not enter the water diversion channel. Huang et al. carried out preliminary investigations on the influence of the layout of the floating dikes and of incoming and diversion discharges on the surface flow field [5].
In the present paper, a series of experiments are carried out to investigate the local 3D flow structure characteristics around floating dikes with different geometries.
2. Method
2.1. Experimental Equipment
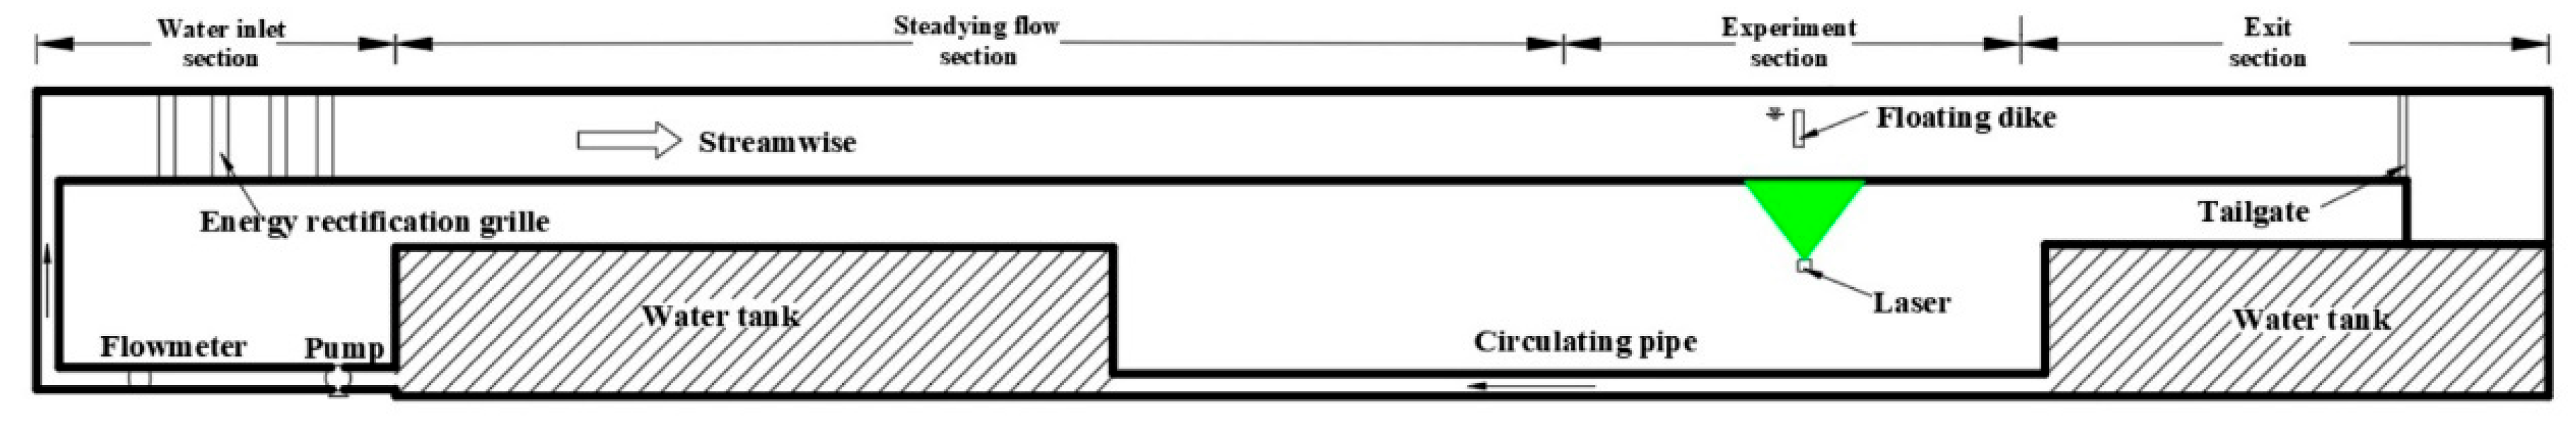
The experiments in this study were carried out in an integral variable slope flume that was 1.4 m long (experimental section), 0.3 m wide, and 0.25 m high. The longitudinal bottom slope was set at 0.001. A rectifying grille was placed at the entrance to eliminate the influence of large-scale coherent structures. A hinged tailgate was installed at the flume exit (Figure 2). The wall and bottom plates were made of 3.6 mm thick transparent glass, which can be used for experiments of steady and unsteady flows. Gridded graph paper with 1 mm spacing was stuck on the side wall to accurately measure the water level upstream and downstream of the floating dike.
The experimental flow velocity was measured using a high temporal and spatial resolution particle image velocimetry (PIV) system. This system was mainly made of an image acquisition system and a velocity field calculation system. According to the experiment layout, the flow field acquisition window in the experiment section was 9 m away from the inlet cross-section of the flume (Figure 2). A high-frequency and high-resolution PIV developed by Tsinghua University was employed. The rated power of the dual-pulse laser was 20 W, and the thickness of the sheet light source was about 1 mm. Images of the flow field in the streamwise direction were taken. JFM 2019 version software developed by Tsinghua University was applied to calculate the two-dimensional flow field. The camera had a maximum resolution of 2560 × 1920, a maximum sampling frequency of 2500 Hz, and a Canon f1.0/50 mm lens. The exposure time δt of each image was set to 100 μs, which ensured brightness and avoided tailing. A 16 × 16 pixel interpretation window was used for the PIV data postprocessing, and the overlap rate was 50% to obtain a grid with a vertical spacing of 8 pixels. The uncertainties of PIV measurement mainly arose from the resolution of the high-speed camera and other equipment.
2.2. Experiment Cases
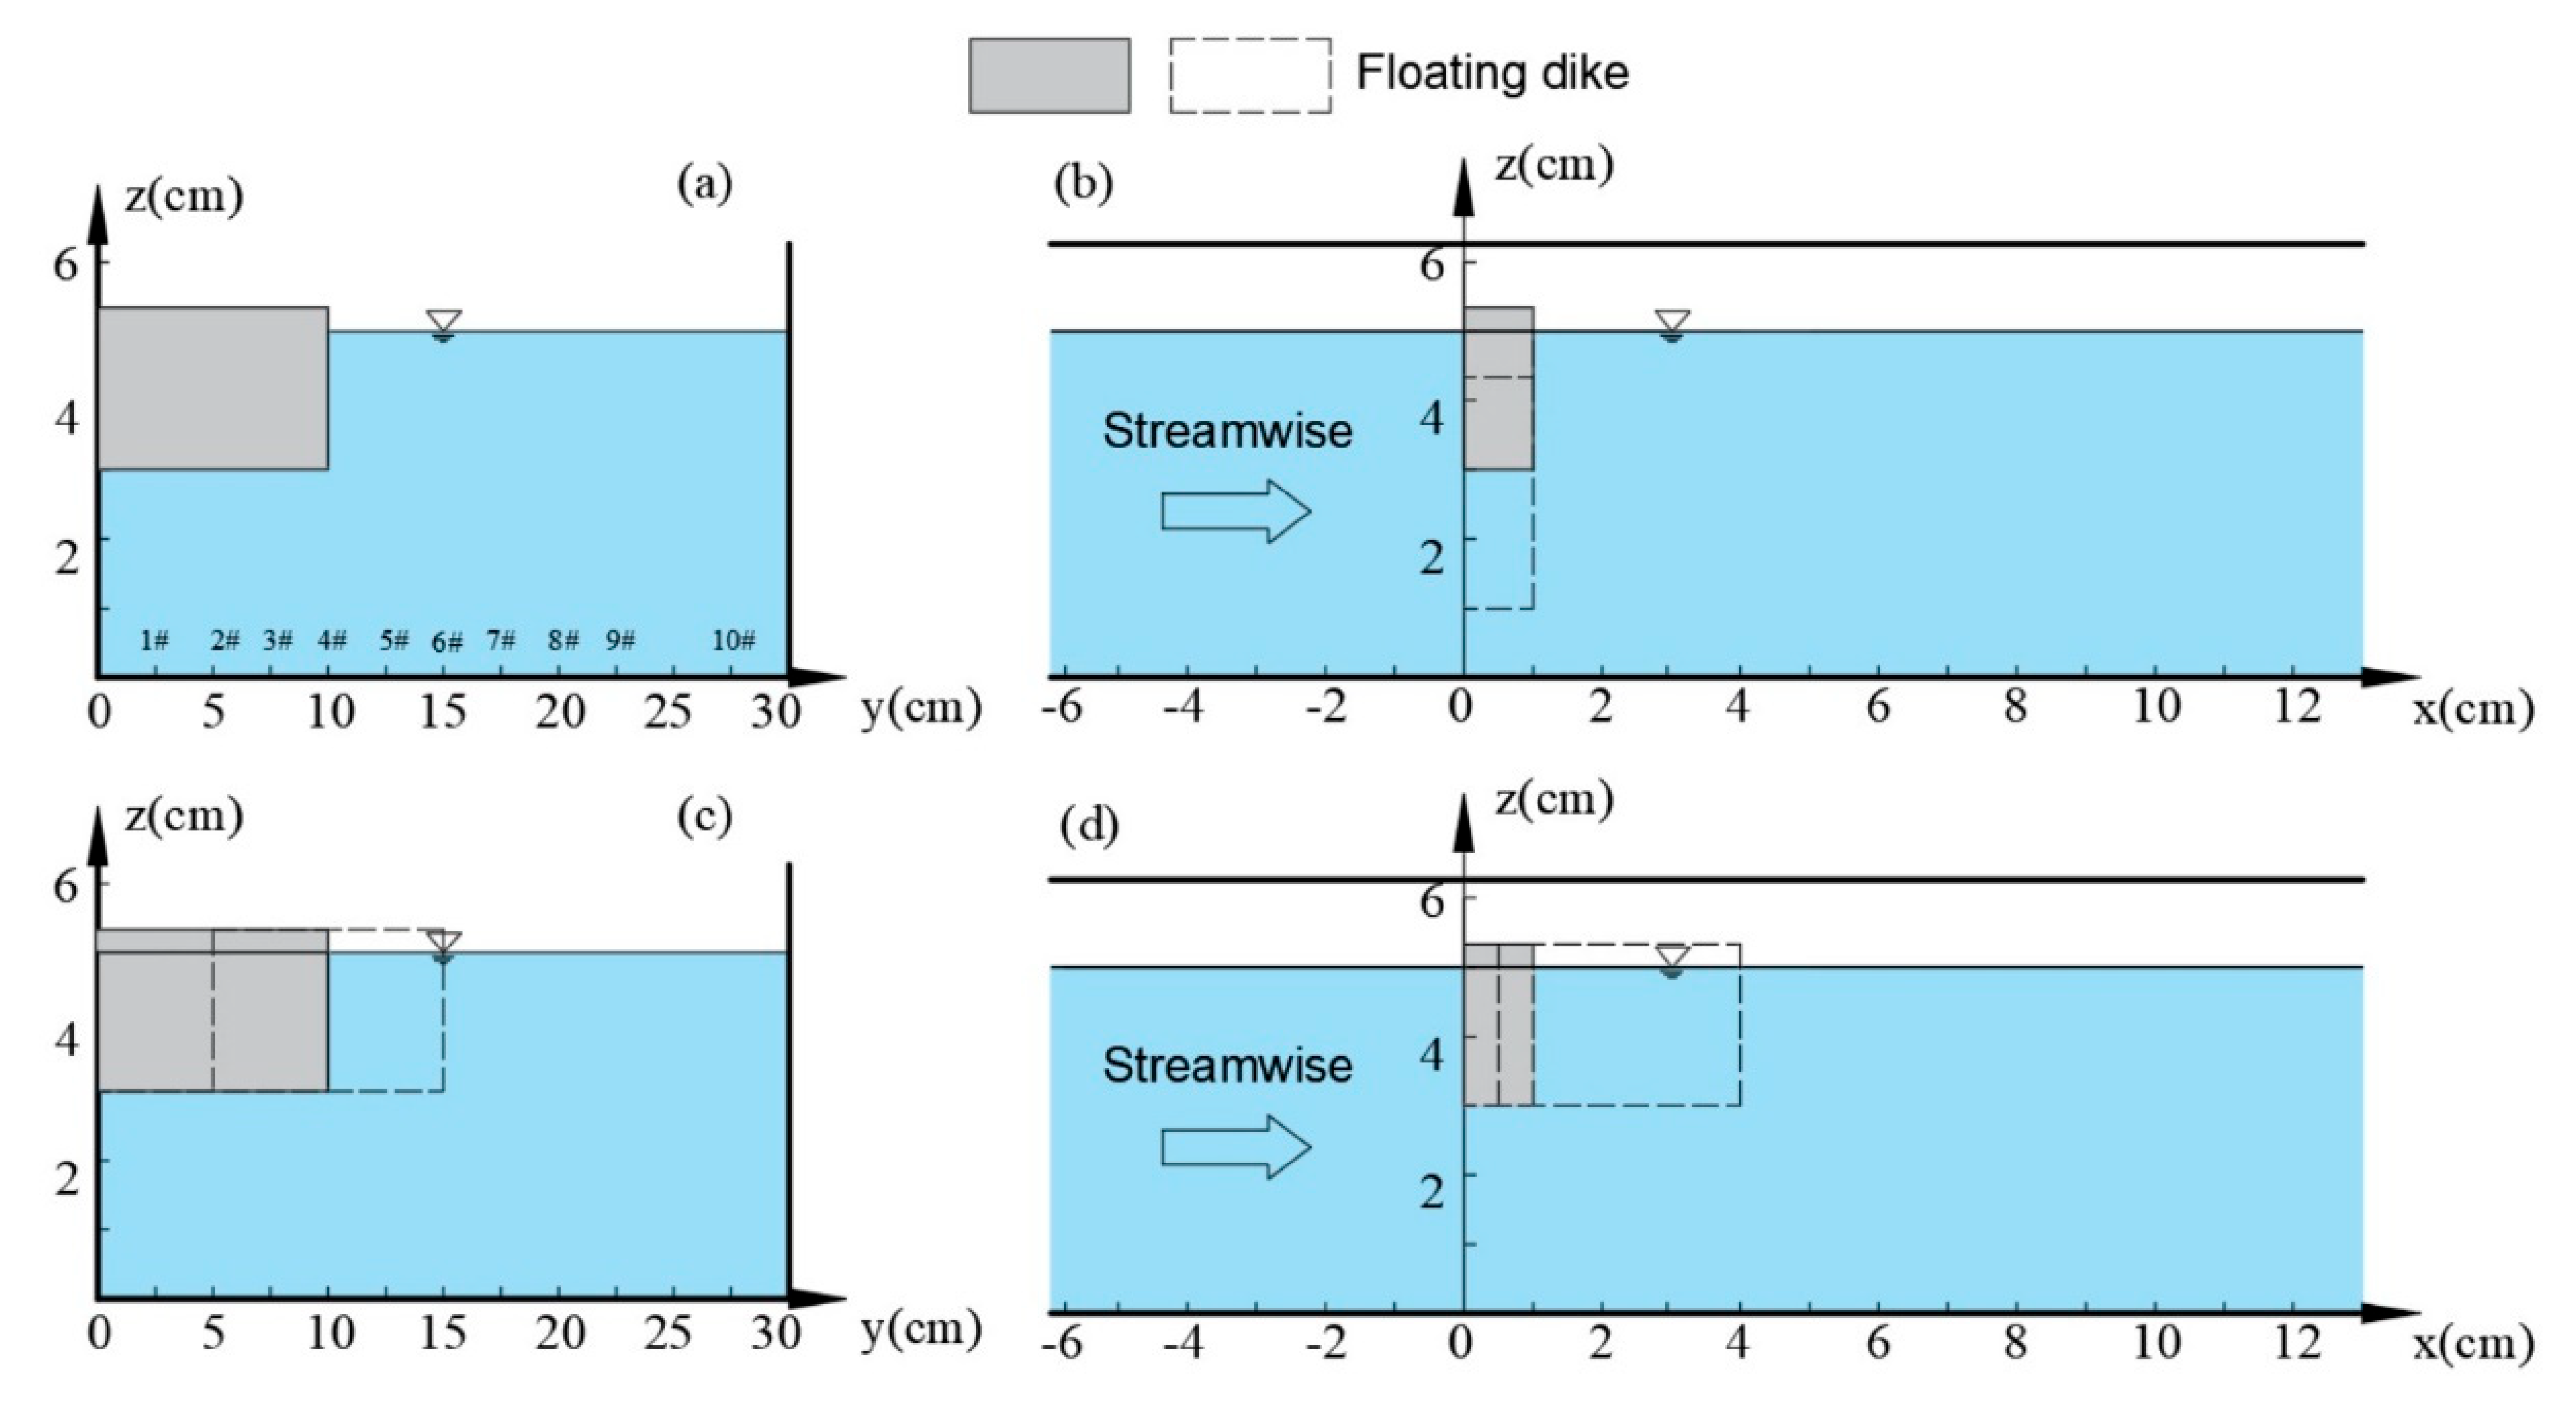
The flow structure under the effect of floating dikes of various sizes was experimentally investigated. The geometrical components modified across the different experiments included the submerged depth in the vertical direction, d, as shown in Figure 3b, the length in the transverse direction, L, shown in Figure 3c, and the thickness in the streamwise direction, B, as seen in Figure 3d. We introduced two nondimensional geometric variables to aid the analysis: the submerged ratio and length ratio L/W, where h is the water depth and W is the channel width. The key experimental parameters and the experiment cases are summarized in Table 1 and Table 2, respectively. In the experiment, the floating dike was made of foam and fixed to the left bank by glue; the layout of the floating dike in the various experiments is shown in Figure 3. The inlet discharge was kept constant at 0.00288 m3/s during all experiments, with flow depth and cross-sectional-averaged velocity approximately equal to 0.05 m and 0.19 m/s, respectively. The ratio of flume width to flow depth was 6, which minimized wall-driven secondary currents. Ten velocity field measurement sections were selected along the width of the flume (transverse to the flow direction and shown in Figure 3a). The measured longitudinal sections (LSs) were numbered from #1 to #10 corresponding to a distance (cm) from the left bank wall of 2.5, 5.0, 7.5, 10.0, 12.5, 15.0, 17.5, 20.0, 22.5, and 27.5, respectively. In the experiments, the laser setup was first moved along the lateral flume direction, where the camera focal length was adjusted to get a clear image. In the streamwise direction, the measured extent was from approximately 2 cm upstream and 10 cm downstream of the floating dike.
2.3. Calculation of Hydrodynamic Characteristics
The parameters measured during the experiments were (1) the water level around the floating dike, and (2) the vertical two-dimensional flow velocity field at selected LSs (Figure 3a), with velocity u and w in the streamwise and vertical directions, respectively. Vertical turbulence intensity and Reynolds stresses were calculated using Equations (1) and (2), to gain insight into the local hydrodynamic characteristics and the influence of the floating dike on the flow.
Absolute velocity was computed on the basis of the velocity components in the streamwise and vertical directions, given by
Vertical turbulence intensity, , (m/s) was calculated on the basis of the vertical pulse velocity (), such that
where, n is the number of statistical samples, i is the sample, and RSM is the root mean square. The vertical turbulence intensity is labeled as RSMV in subsequent figures.
Reynolds stress is calculated by
where (or RS) is the Reynolds stress (Pa), and ρ is the density of water (1000 kg/m3). The Reynolds stress is caused by velocity nonuniformity in the flow field. A larger Reynolds stress indicates greater nonuniformity and, thus, higher turbulence.
3. Results and Discussion
3.1. Local Flow Characteristics around a Floating Dike
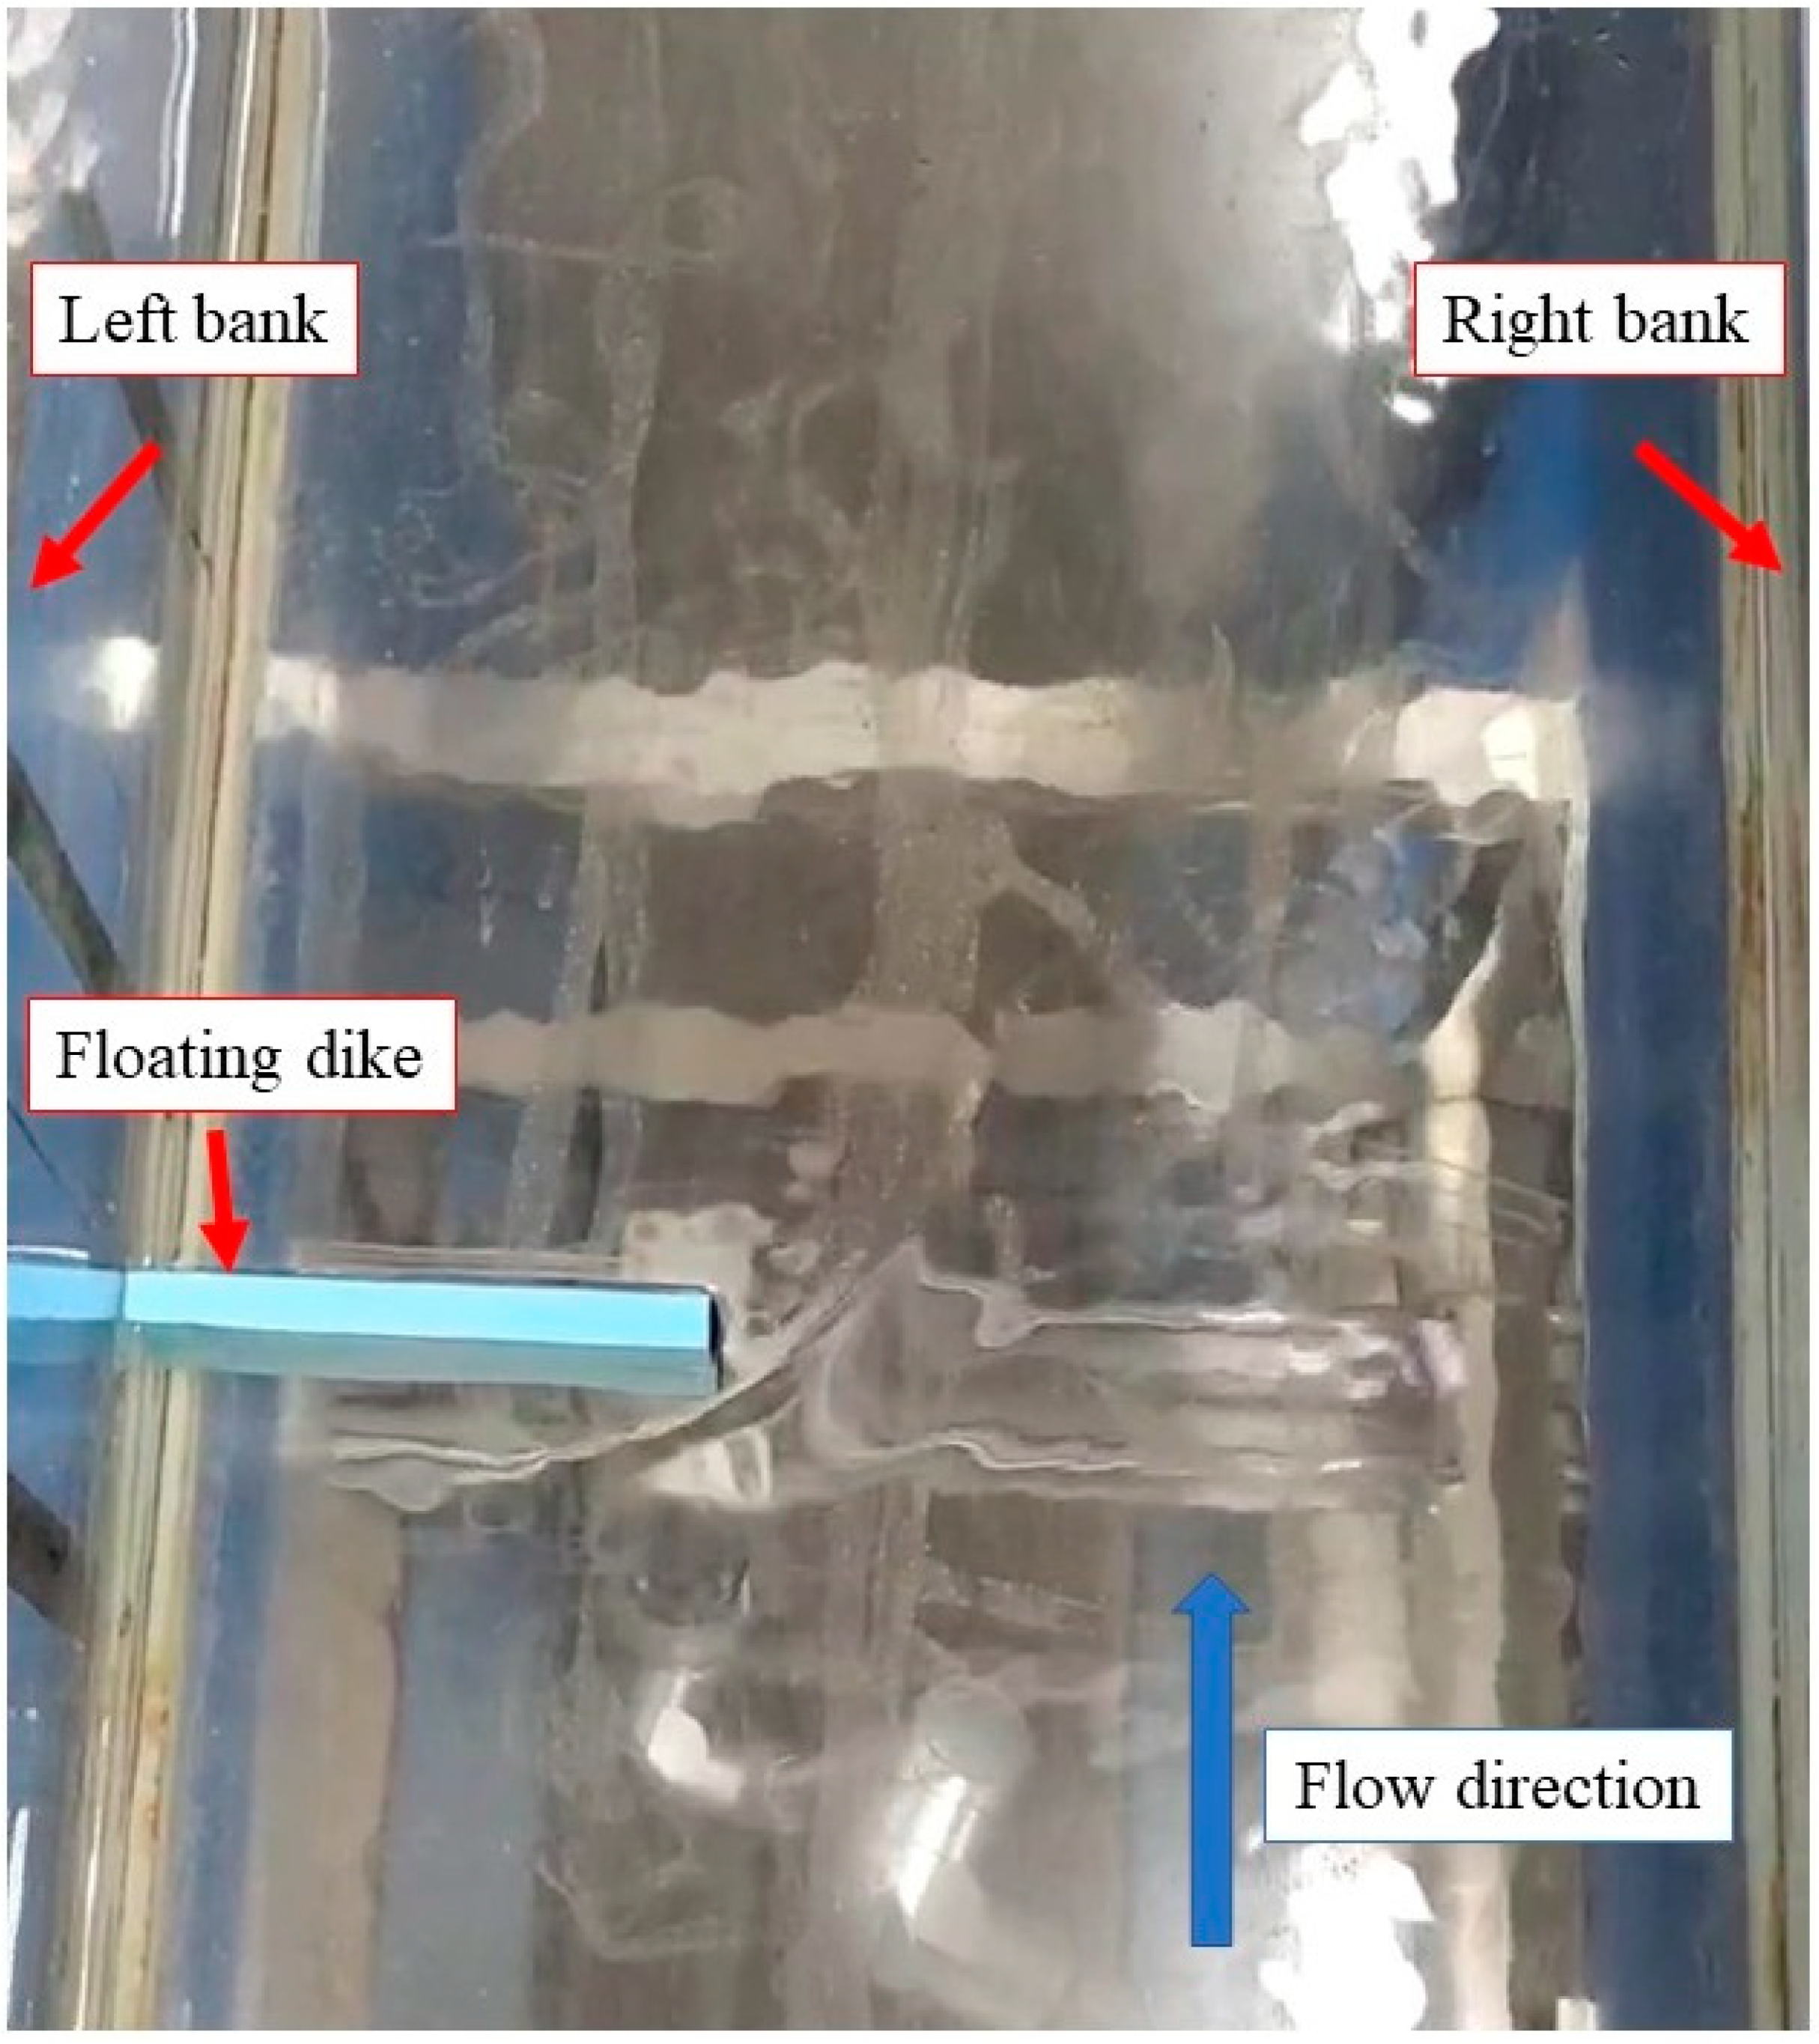
In Case 1, the experiment was run with no floating dike in the flume. The flow structure of Case 2 was then compared to that of Case 1 to demonstrate the influence of the floating dike. Case 2 acted as the reference case for all of the other floating dike experiments. In Case 1, the streamlines were nearly parallel with each other, and the flow was almost uniform (Figure 4). Figure 5 shows the surface flow around the floating dike in Case 2, and it can be observed that the flow was deflected toward the right bank. Immediately upstream of the floating dike, water flowed along the upstream edge of the dike in the transverse direction due to the impediment effect of the dike. When moving to the crest of the dike, the flow experienced separation and joined the main flow on the right side of the dike, resulting in a phenomenon of flow deflection. Because of the decrease in cross-sectional area near the floating dike, an acceleration of the neighboring flow could be expected, as demonstrated below.
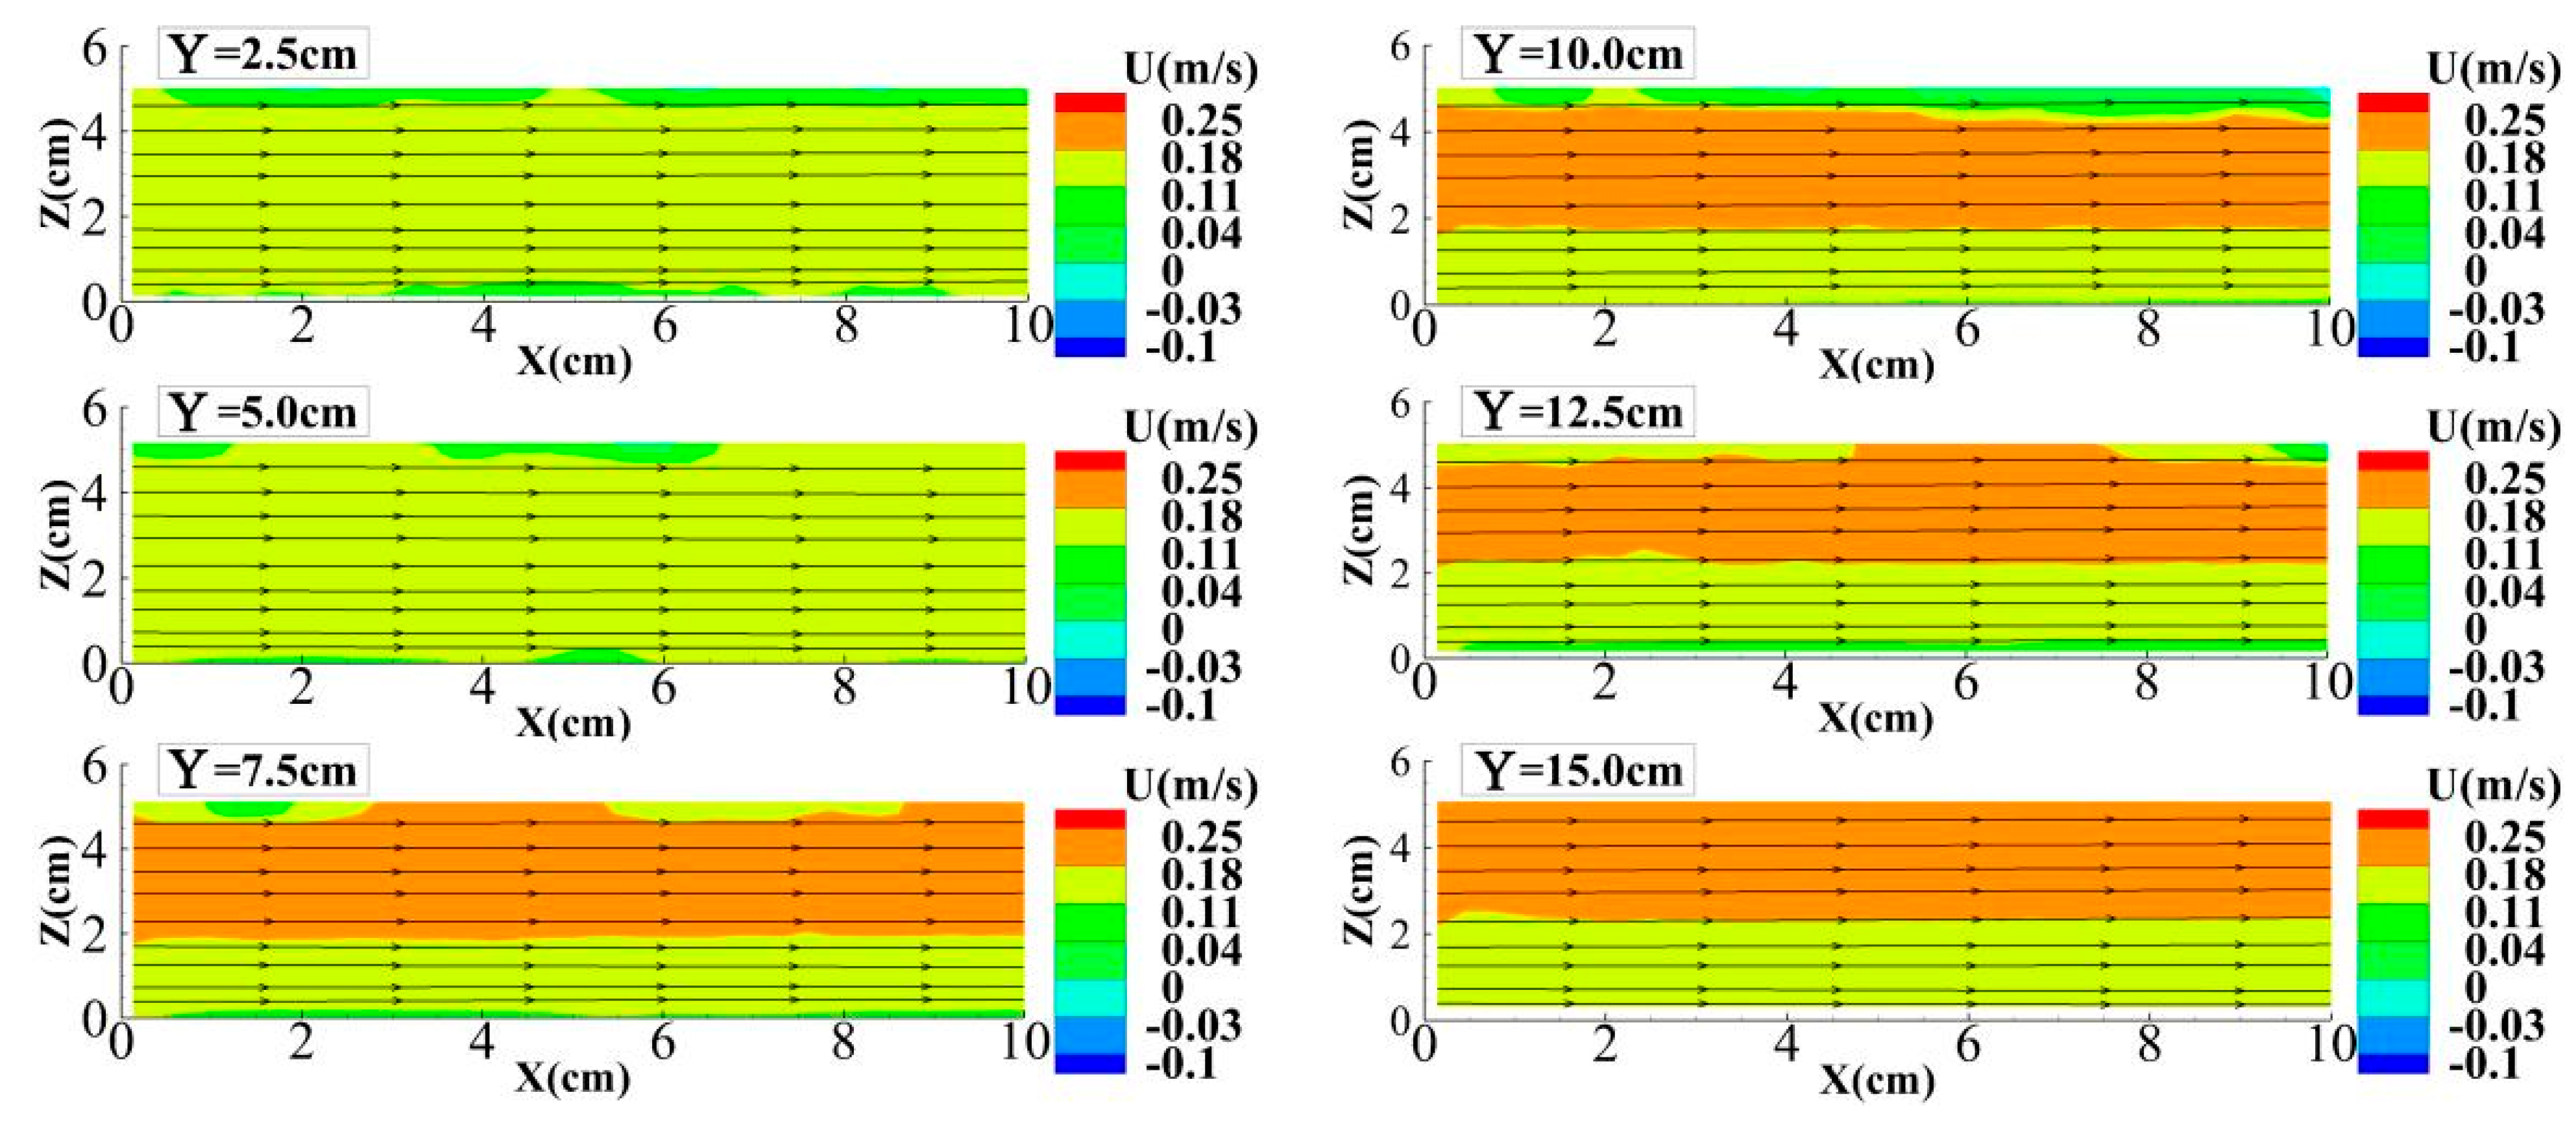
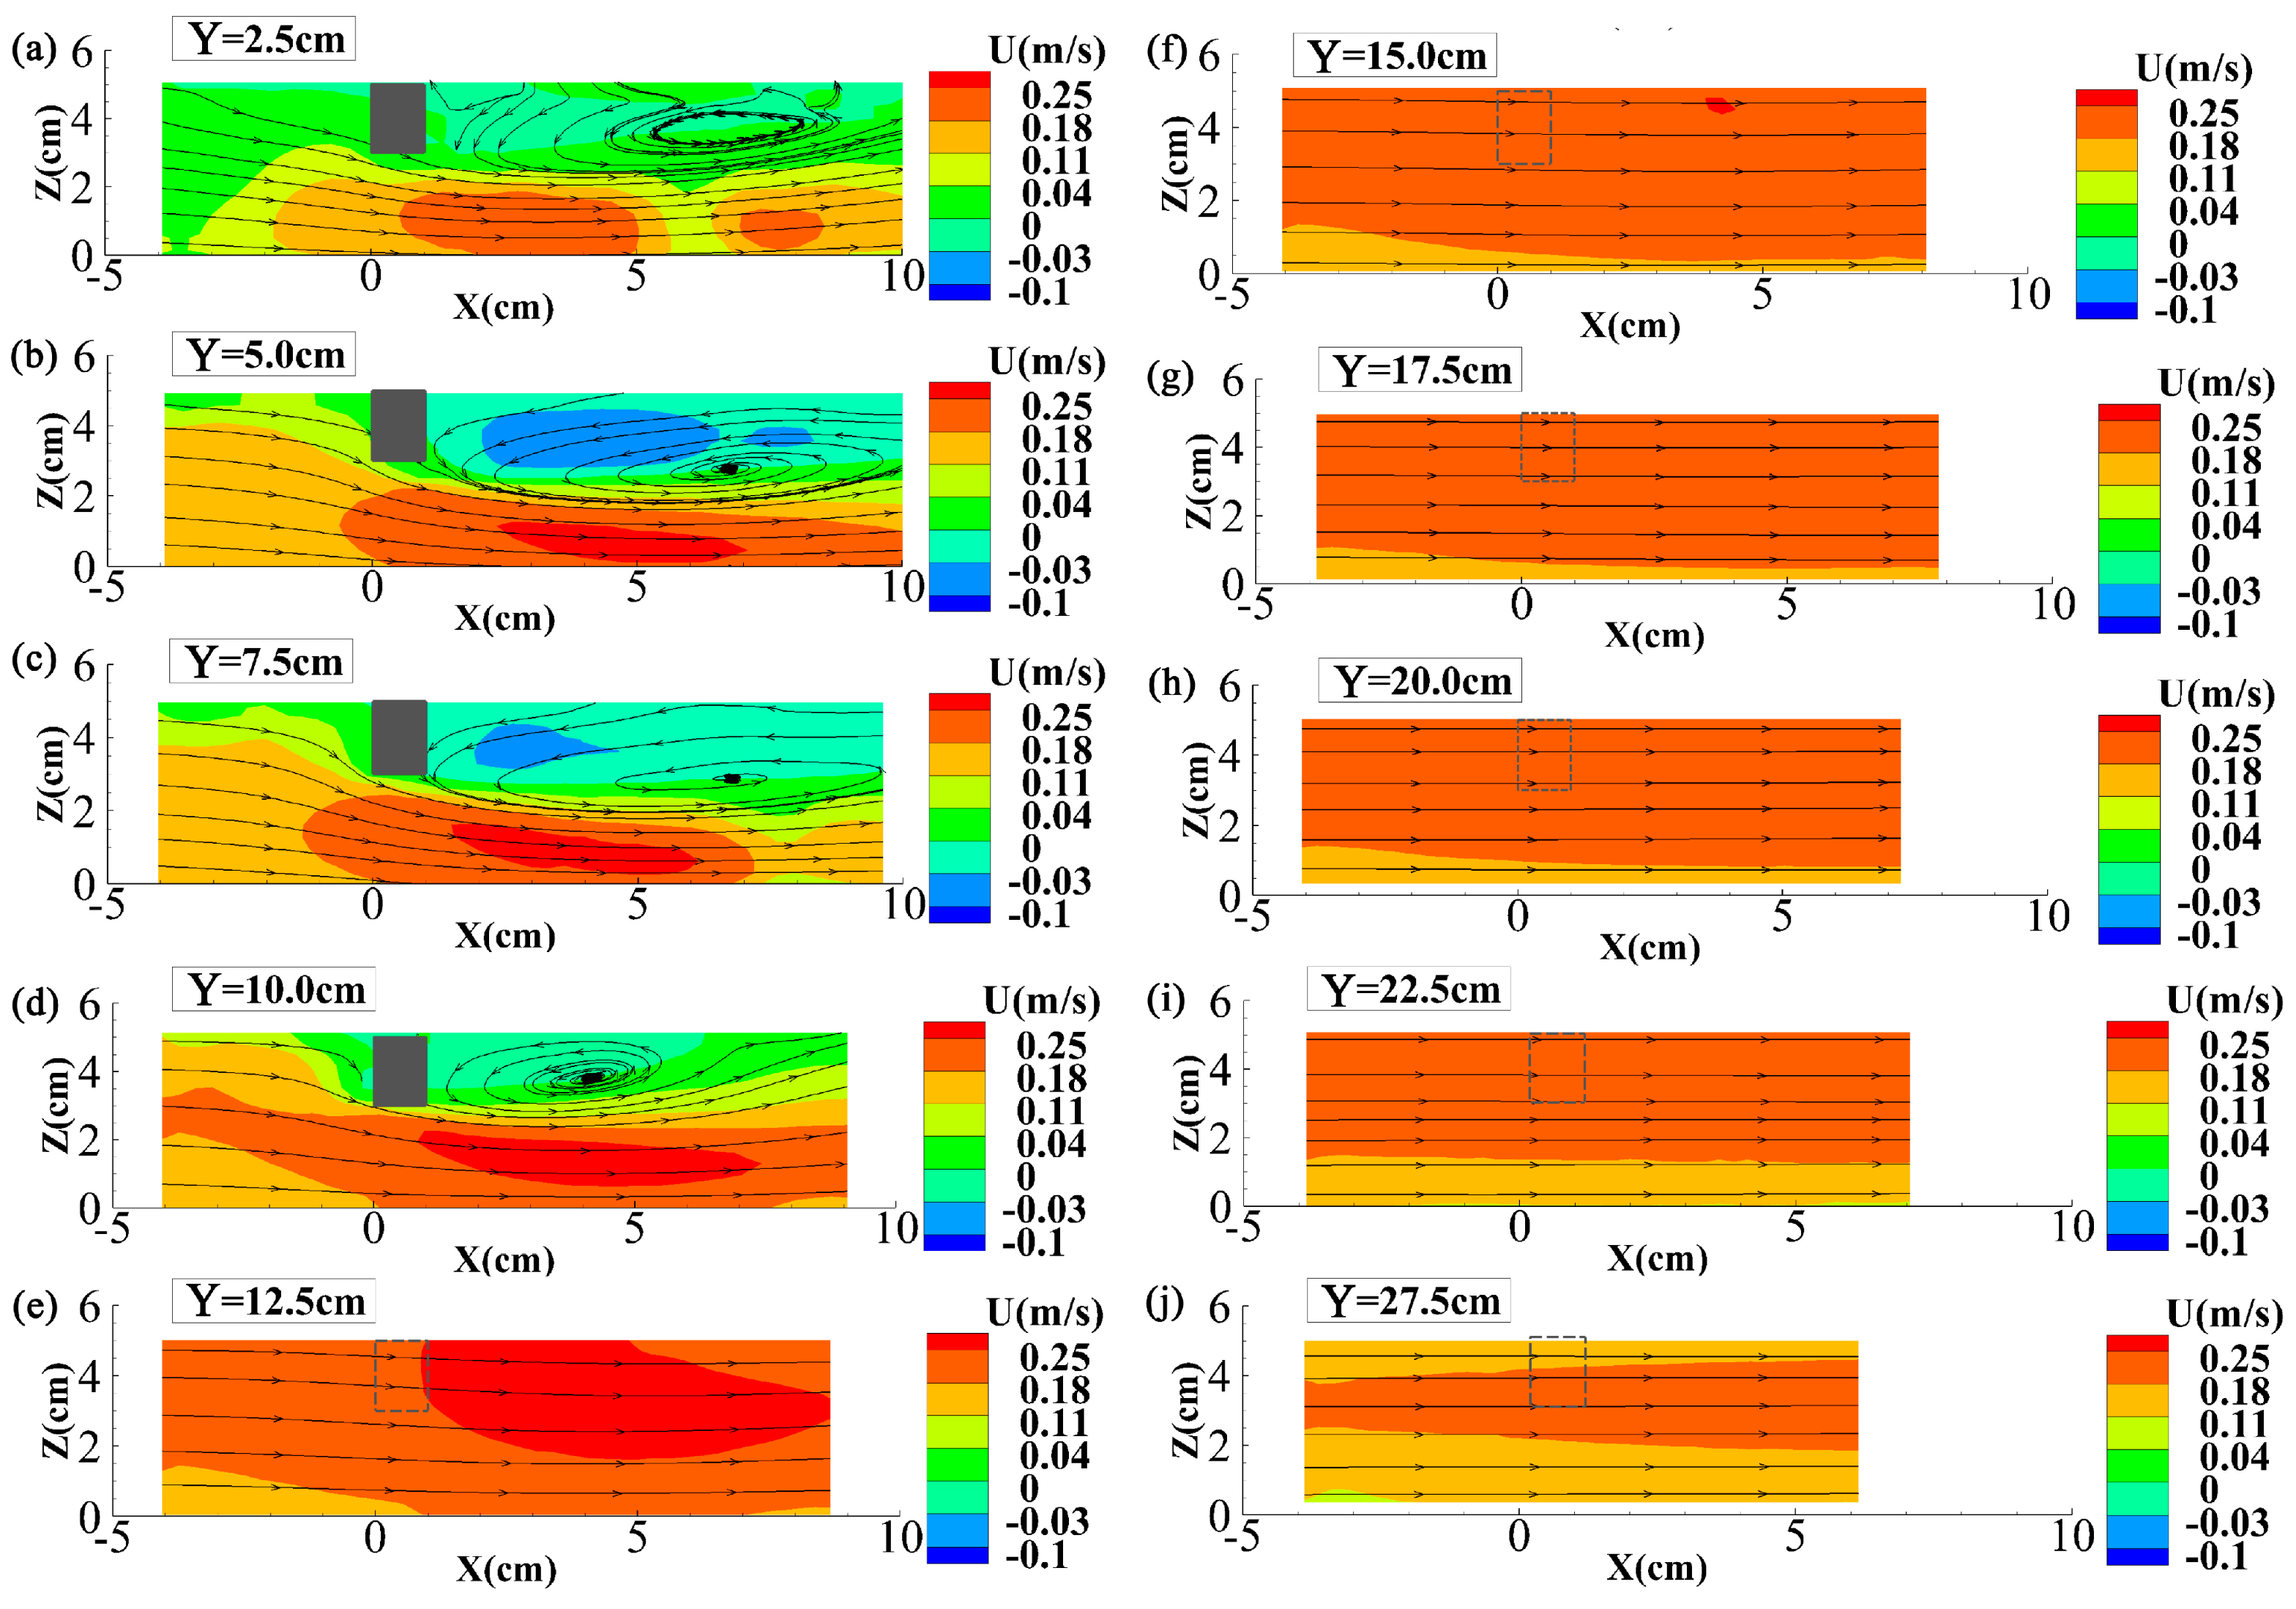
Figure 6 presents the velocity distribution at the 10 LSs (detailed in Section 2.2) for Case 2. The following features can be observed: (i) due to the flow separation, a backflow zone can be seen downstream of the floating dike in Figure 6a–d; (ii) the backflow was pronounced at LSs 5 cm and 7.5 cm, but was weak near the left bank (Figure 6a) and just to the right of the floating dike (Figure 6d); (iii) the maximum negative flow velocity in the backflow was 0.06 m/s, much smaller than the average mainstream velocity of 0.19 m/s, indicating the deceleration of flow in the backflow; (iv) because of the impediment effect of the floating dike, the flow velocity upstream of the structure was nearly 0.1 m/s and 0.01 m/s near the left bank; (v) the floating dike and the associated backflow reduced the cross-sectional area and led to an increase in flow velocity below and alongside the floating dike; (vi) the flows at LSs on the right side of the floating dike (LSs 12.5–27.5 cm) appeared to be uniform. It should be noted that the transverse velocity was not recorded in the experiment; thus, the deflected surface flow in Figure 5 is not shown in Figure 6.
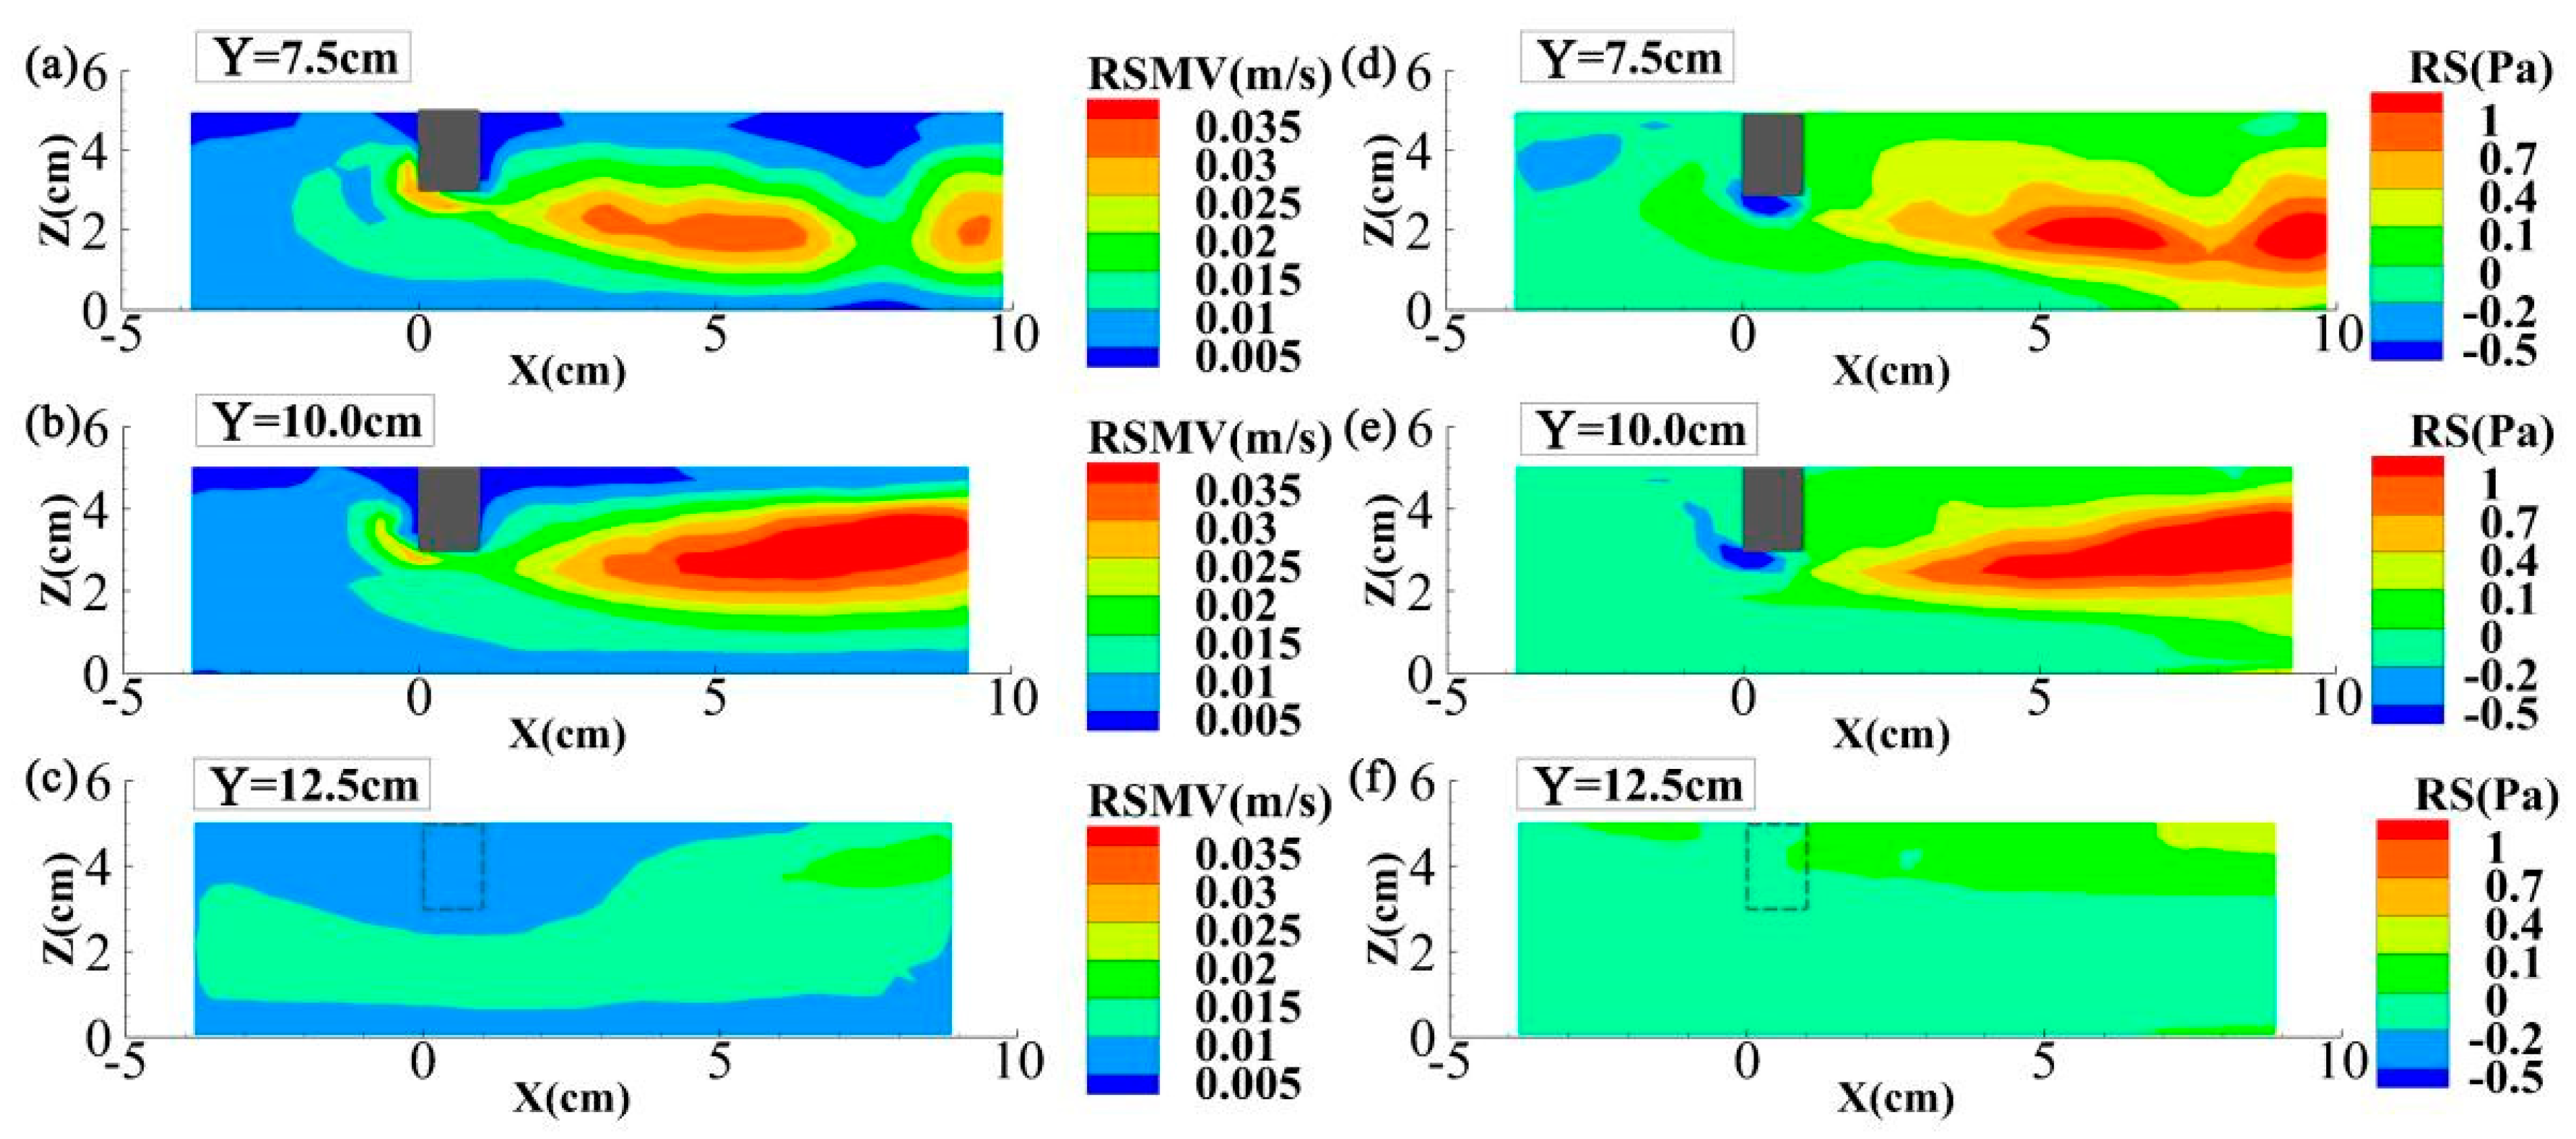
Figure 7 shows the distributions of vertical turbulence intensity and Reynolds stress at the LSs around the floating dike (LSs at 7.5, 10, and 12.5 cm). It is demonstrated in Figure 7 that a larger vertical turbulence intensity led to a larger Reynolds stress. A maximum vertical turbulence intensity of approximately 0.035 m/s occurred at the core of the backflow (Figure 7b). At the same location, the absolute value of the Reynolds stress was 1 Pa (Figure 7e). Below the floating dike, the vertical turbulence intensity was approximately 0.02–0.03 m/s, while the absolute value of Reynolds stress was relatively large at 0.5 Pa, suggesting a relatively weaker turbulence below the dike as compared with that at the core of the backflow.
3.2. Effects of Submerged Ratio of Floating Dike
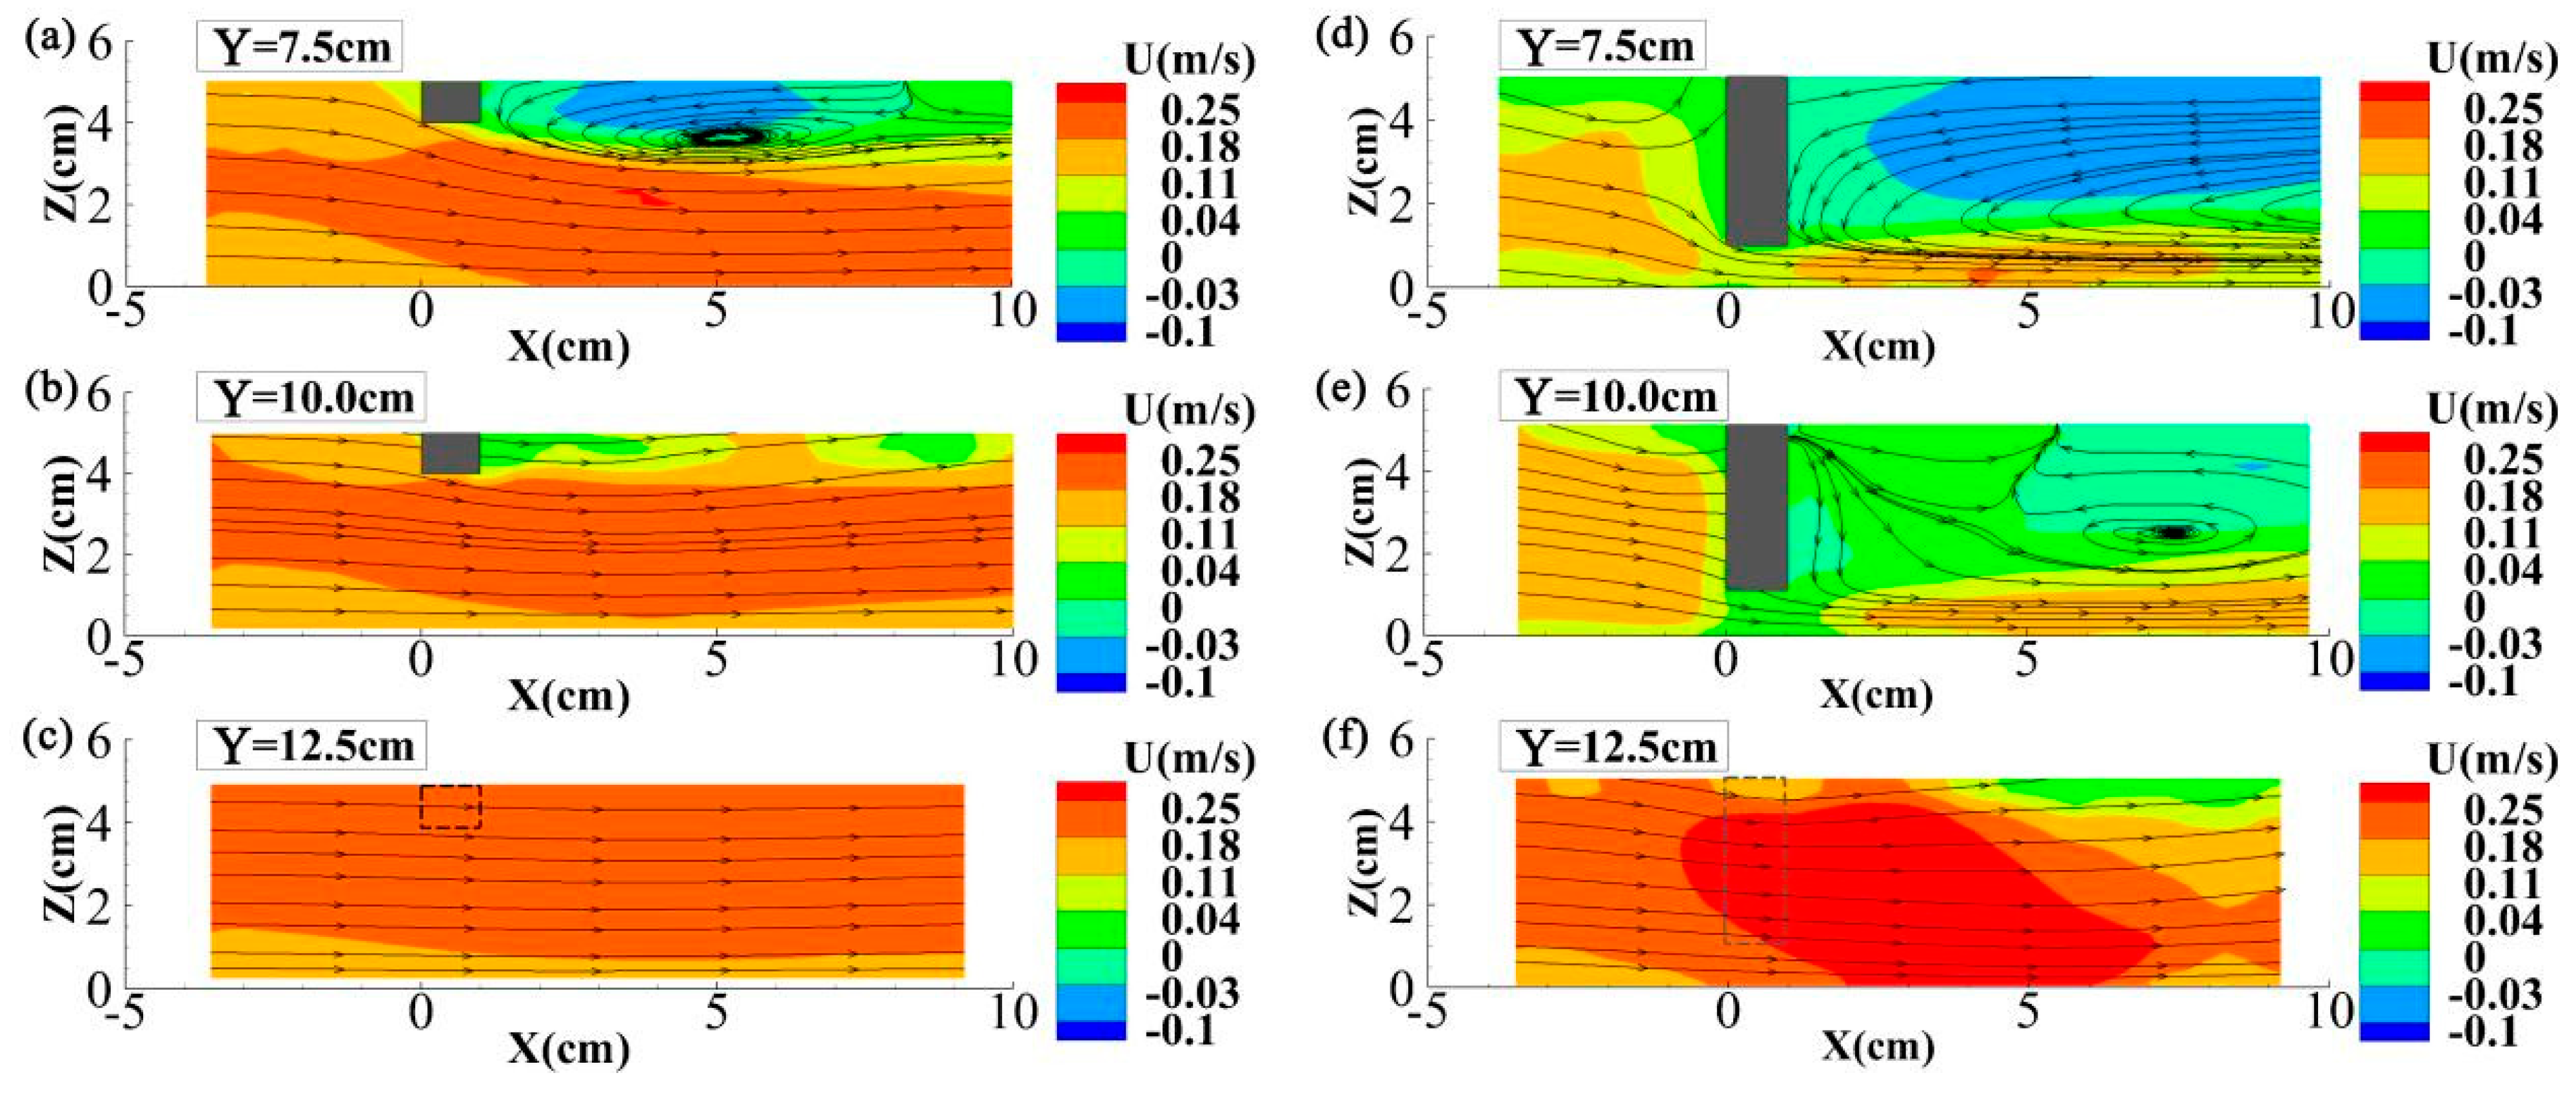
Figure 8 shows the distributions of flow velocity in the LSs around the floating dike in Cases 3 and 4, which had a smaller and larger submerged ratio compared to Case 2, respectively. To demonstrate the results more quantitatively, Table 3 presents the maximum or minimum (in the reverse direction) values for experimental parameters in different cases. Comparing Figure 8 with Figure 6, it can be observed that, as the submerged ratio increased, (i) the vertical scale of the backflow downstream of the floating dike increased (Figure 6c,d, Figure 8a,b,d,e), and (ii) the flow velocity to the right of the floating dike (LS 12.5 cm) increased significantly, with the maximum velocity reaching 0.22 m/s in Case 3 (Figure 8c) and 0.25 m/s in Case 2 (Figure 6e), as well as an even larger region featuring 0.25 m/s in Case 4 (Figure 8f). This is because, when the submerged depth of the floating dike was increased, the lateral area of the floating dike became larger, which significantly reduced the cross-sectional area and, thus, accelerated the flow.
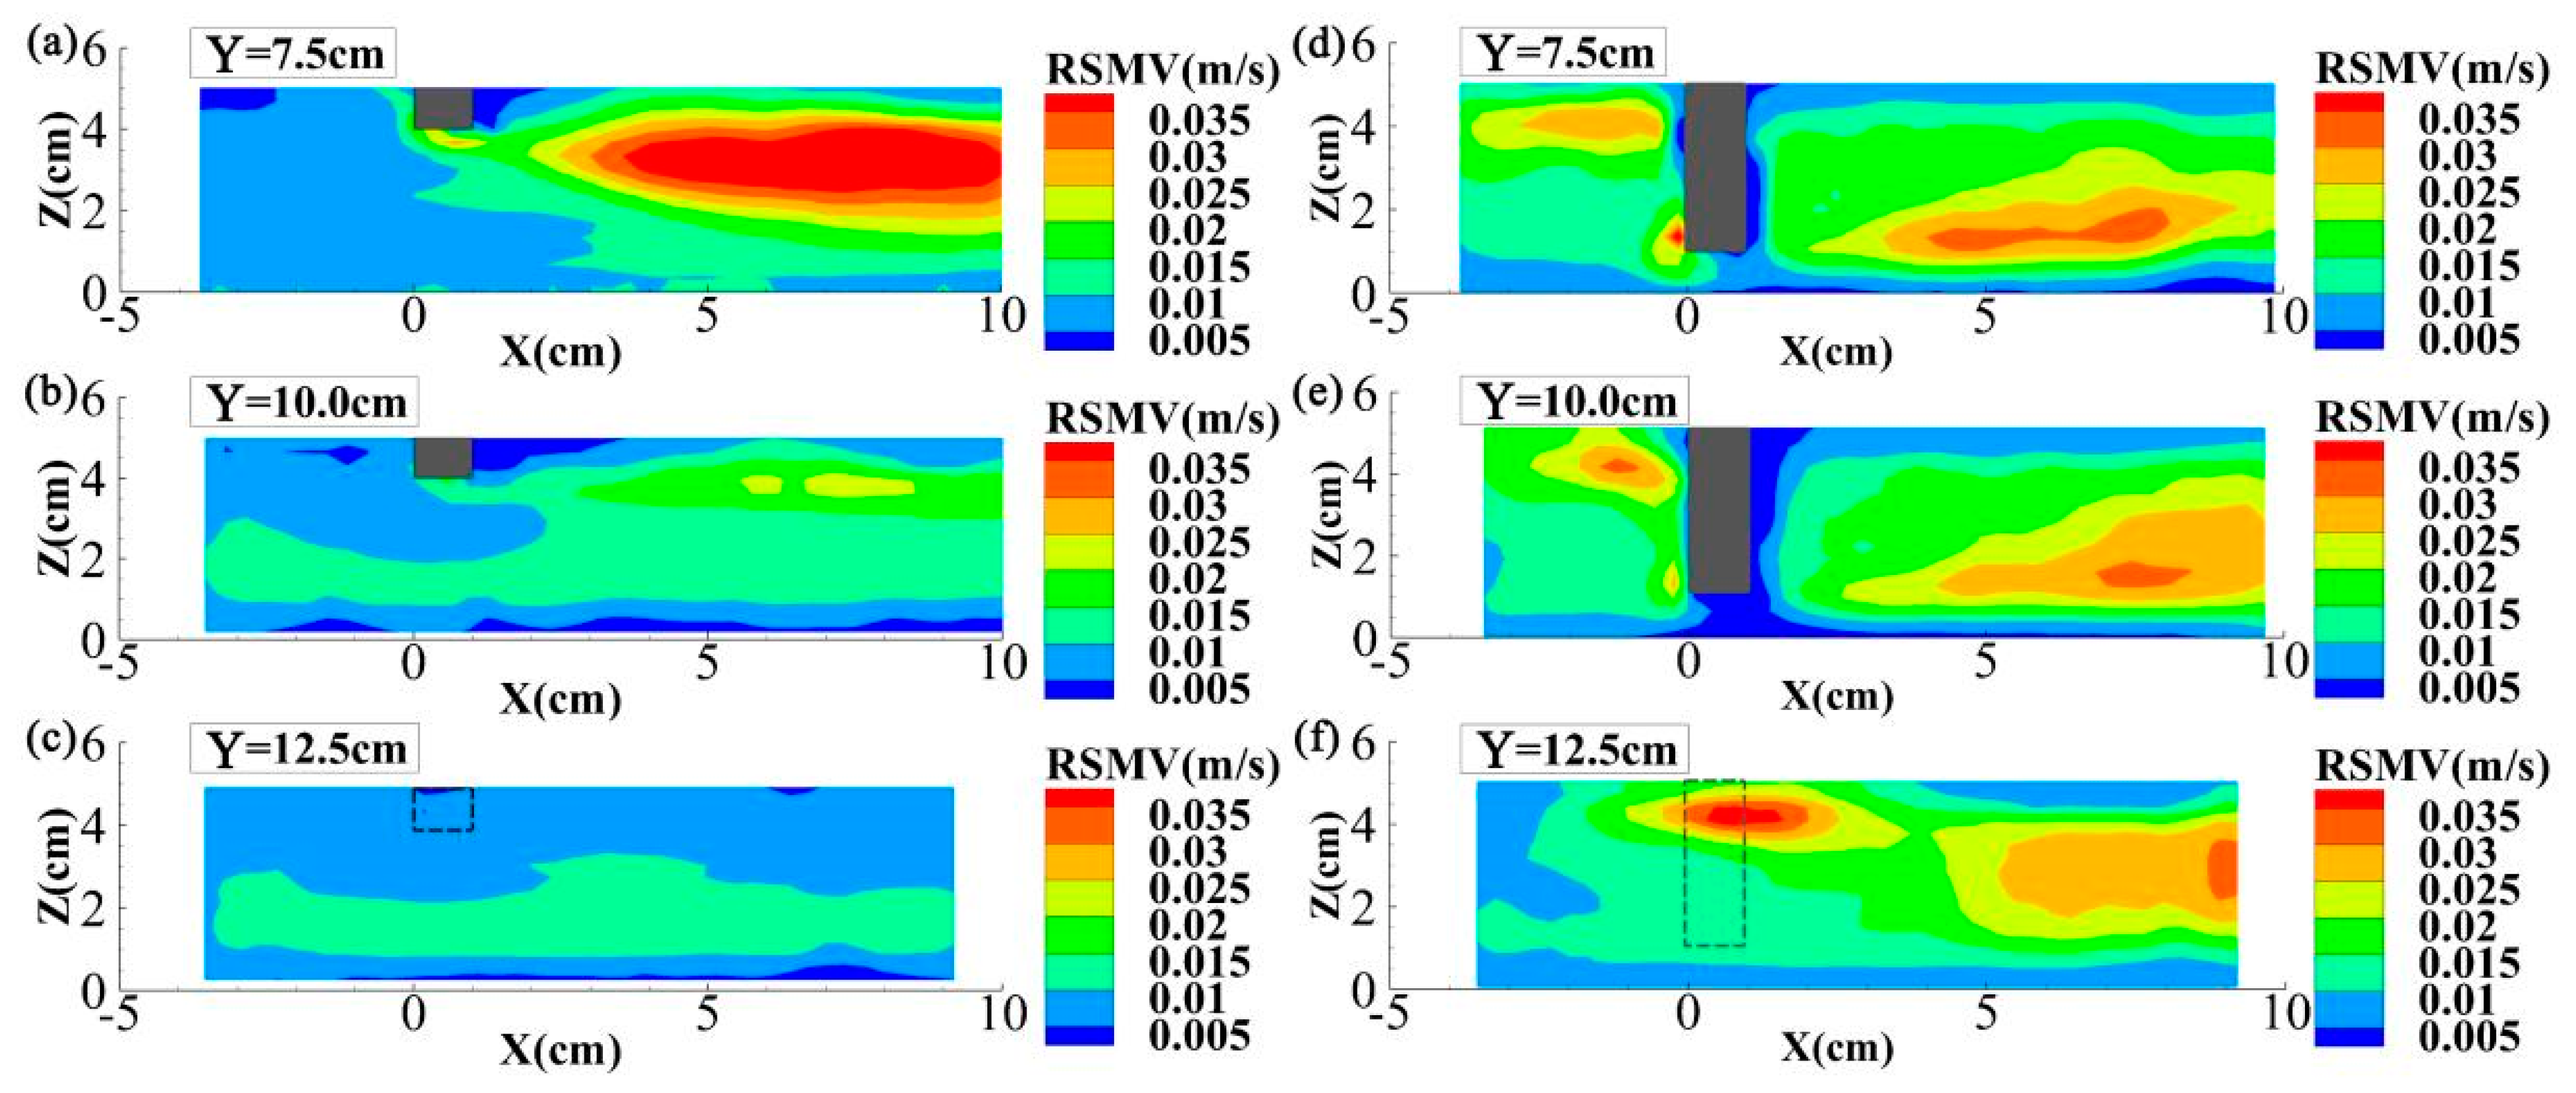
Figure 9 presents distributions of vertical turbulence intensity around the floating dike for Cases 3 and 4. Compared with Figure 7 (Case 2), the results in Figure 9 show that (i) the maximum vertical turbulence intensity of the flow downstream of the floating dike reached 0.035 m/s in Cases 2 and 3, and 0.032 m/s in Case 4, while (ii) the vertical turbulence intensity to the right of the floating dike (LS 12.5 cm) was less than 0.02 m/s in Cases 2 and 3, and approximately 0.035 m/s in Case 4, consistent with the distribution of flow velocity in Figure 9. It is demonstrated in Figure 7a–c and Figure 9 that, for Cases 2–4, the vertical turbulence intensity in the backflow zone was larger than that in other regions. The submerged ratio reached 4/5 in Case 4, and, although the vertical scale of the backflow became larger, the absolute value of the flow velocity in the backflow was reduced, leading to a smaller vertical turbulence intensity. In addition, the increase in vertical turbulence intensity seen at LS 12.5 cm (Figure 9f) was caused by the high flow velocity to the outside of the dike, a result of the decrease in cross-sectional area.
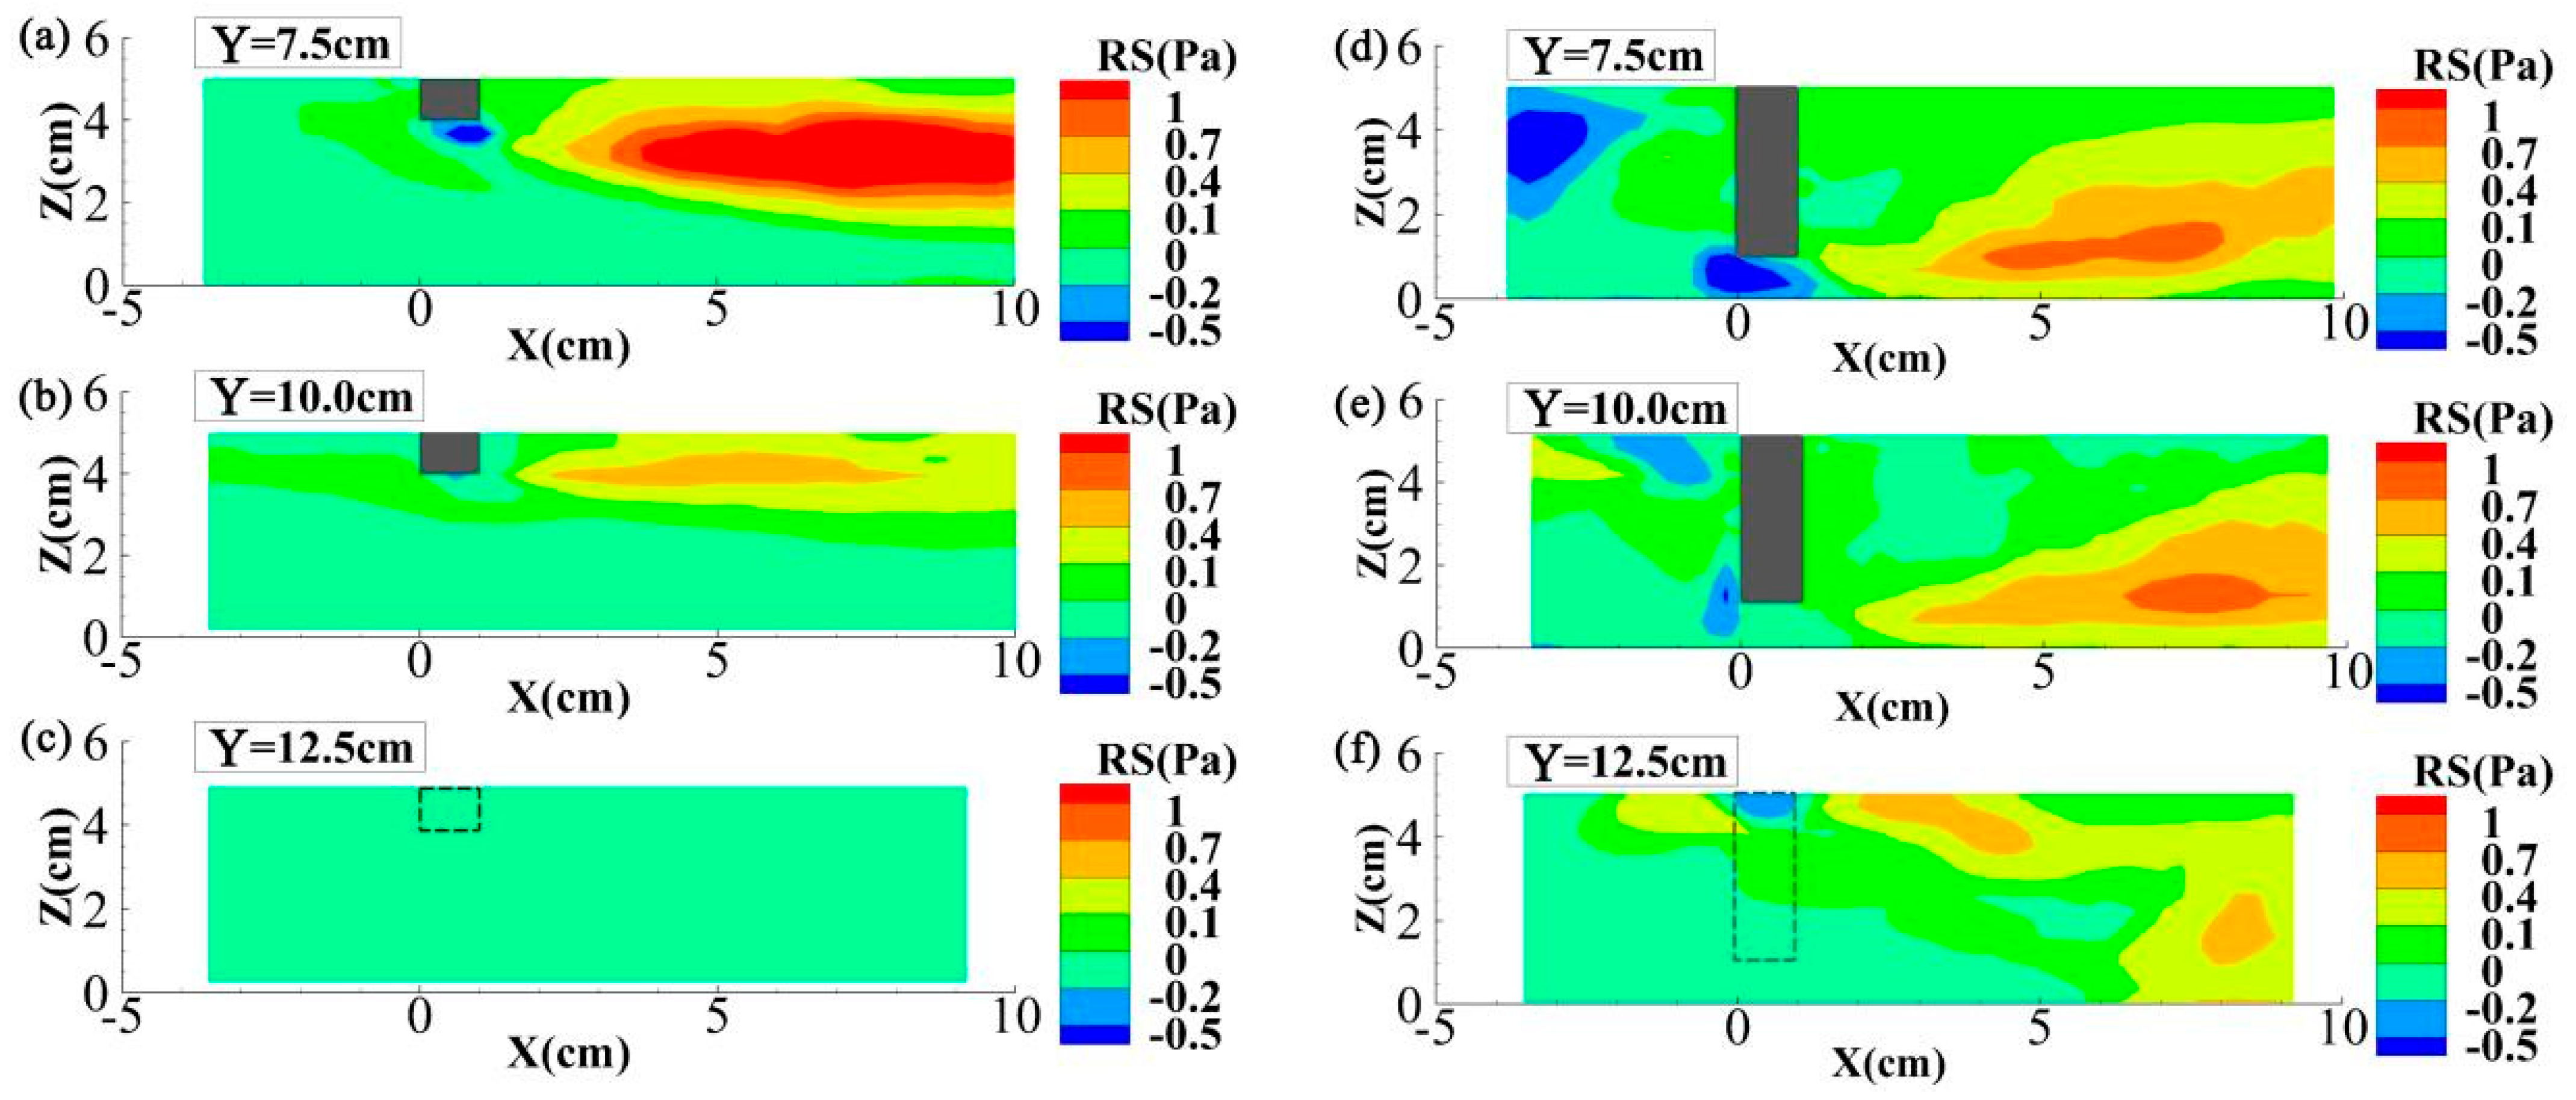
Figure 10 shows the distributions of Reynolds stress around the floating dike in Cases 3 and 4, which is qualitatively similar to Case 2, i.e., the Reynolds stresses in the backflow zone and in the region below the floating dike displayed greater absolute values, in agreement with the distribution of vertical turbulence intensity in Figure 9. When the submerged ratio increased to 4/5 (Case 4, Figure 10d–f), the maximum absolute value of Reynolds stress downstream of the floating dike decreased, while the absolute value of Reynolds stress on the right side of the floating dike increased.
3.3. Effects of Length Ratio of Floating Dike
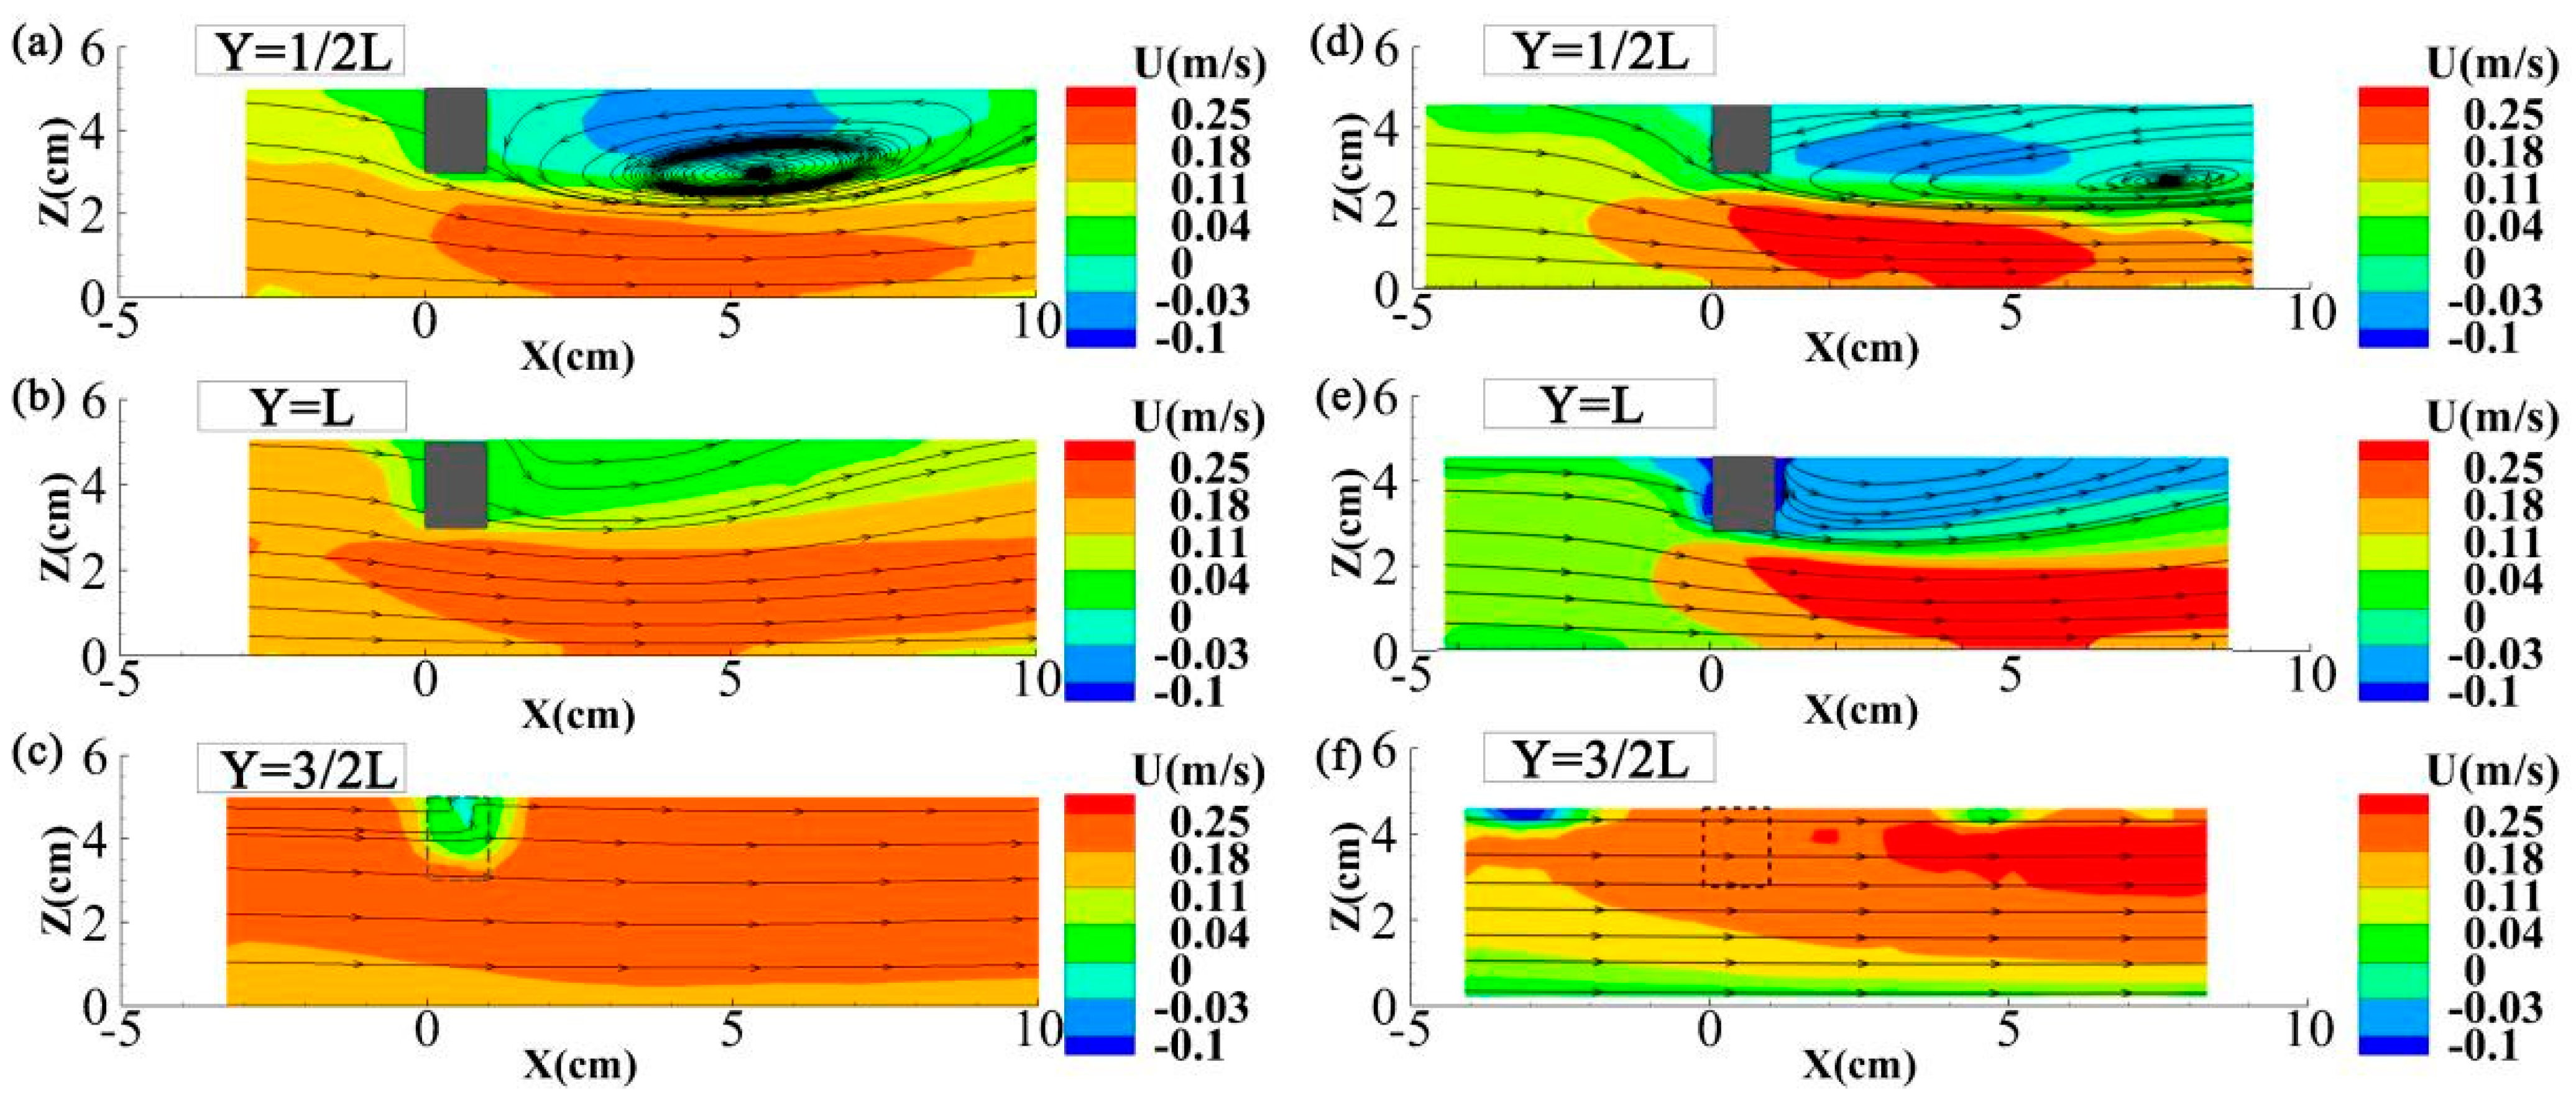
Figure 11 shows the distributions of flow velocity at LSs with locations featuring ratios of 1/2, 1, and 3/2 to the dike length in Cases 5 and 6, which had smaller and larger length ratios compared to Case 2, respectively. By comparing Figure 6 and Figure 11, it is shown that backflow zones were observed in Cases 2, 5 and 6, but the lateral scale of this zone varied across the cases due to the changing length ratio of the floating dike. Furthermore, the flow below and to the right of the floating dike was accelerated with increasing length ratio, which was related to the reduction in cross-sectional area and increase in flow acceleration. Specifically, the maximum flow velocity below or to the right of the dike was approximately 0.22 m/s in Case 5, and more than 0.25 m/s in Cases 2 and 6.
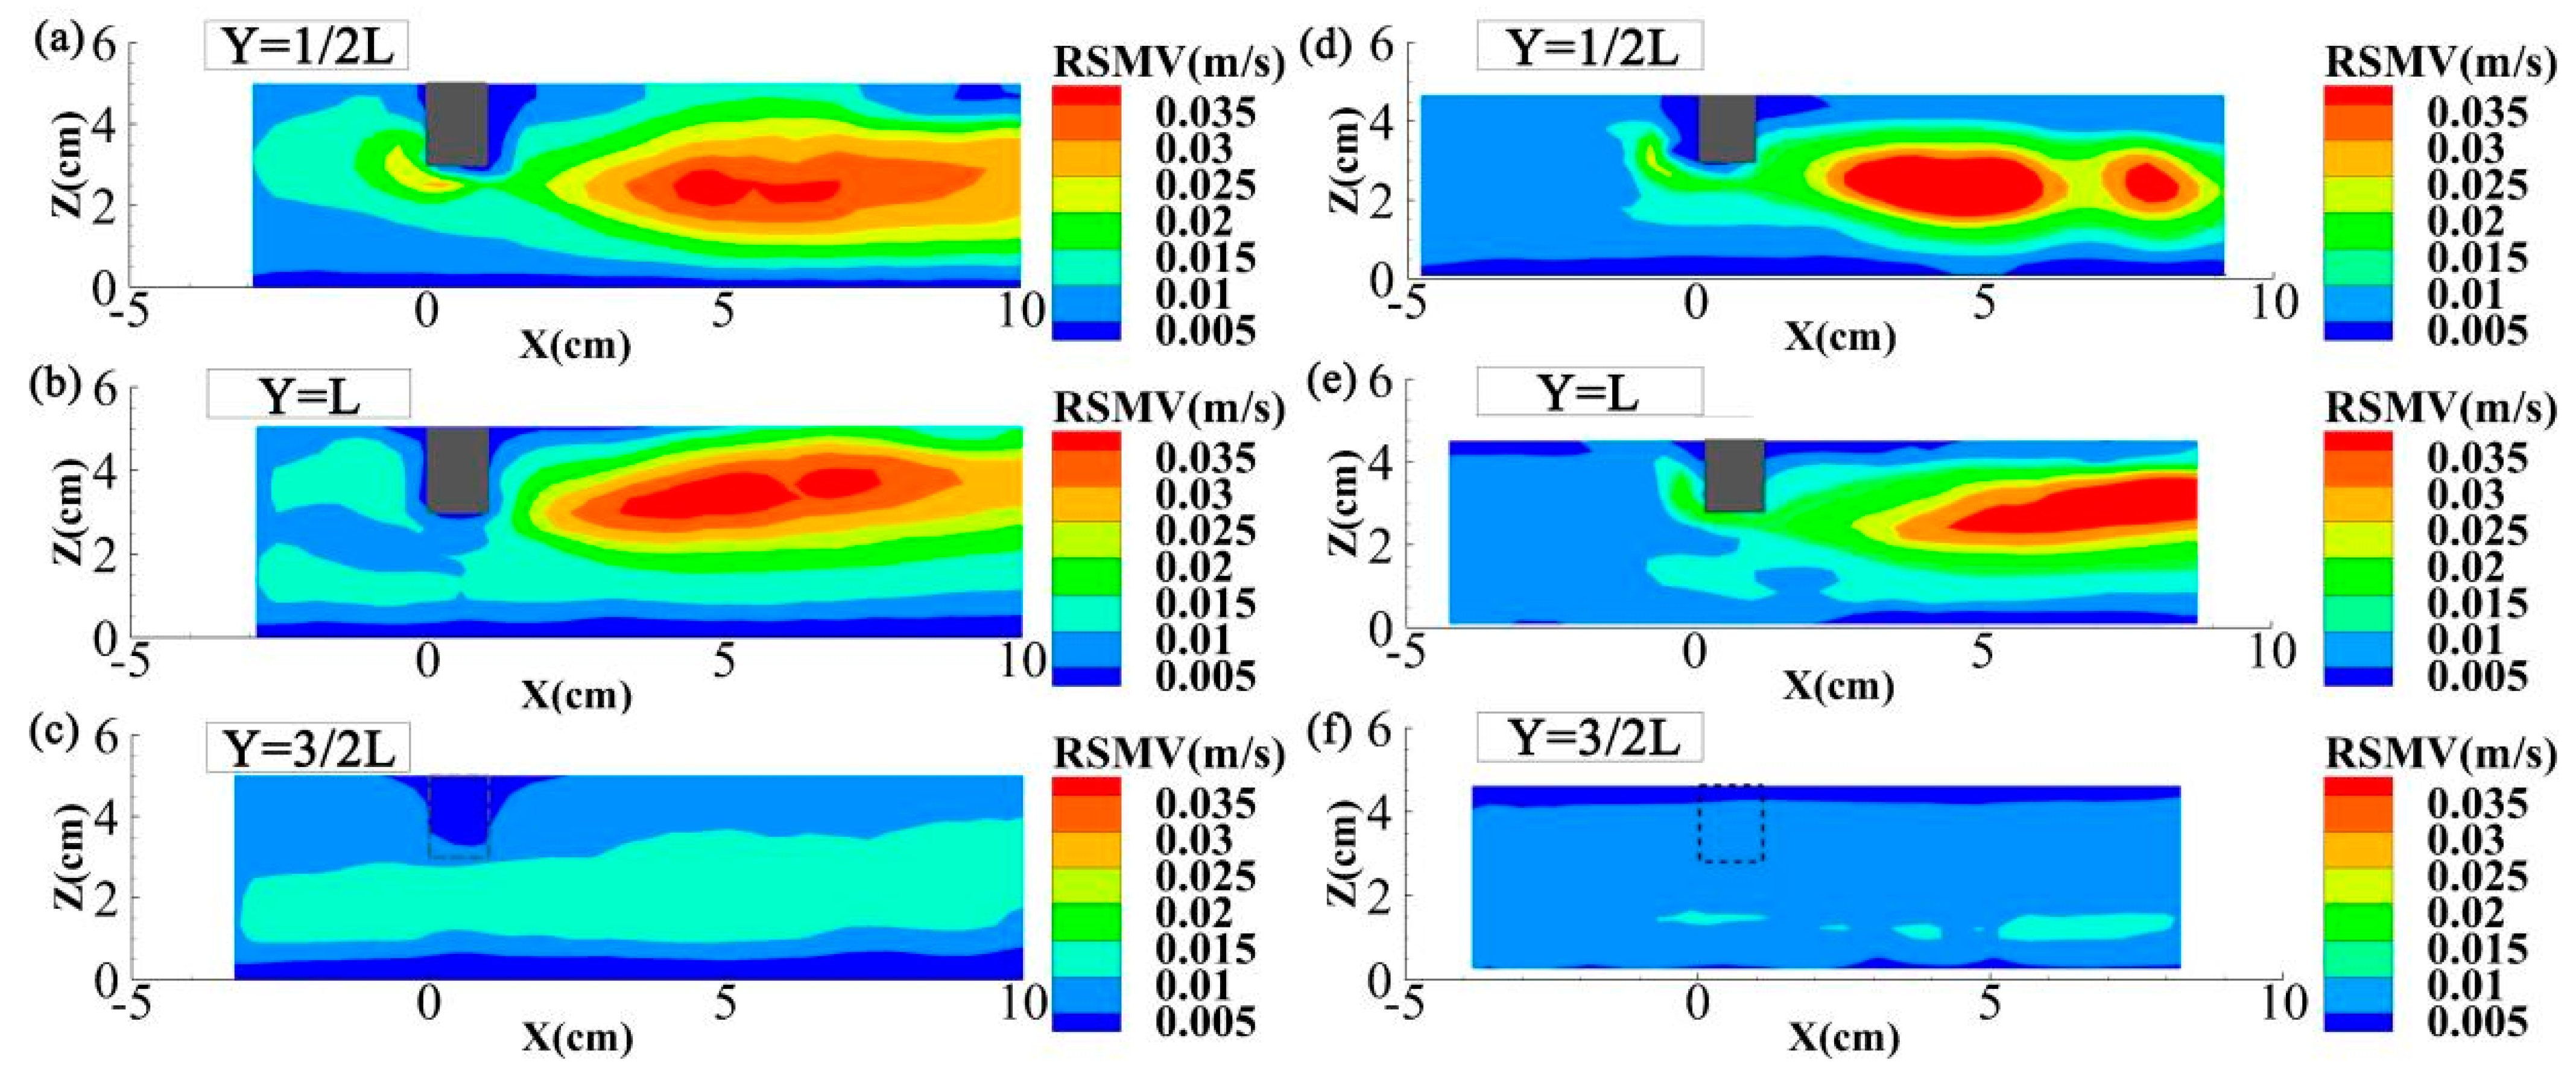
Figure 12 shows the distributions of vertical turbulence intensity at LSs with locations featuring ratios of 1/2, 1, and 3/2 to the dike length in Cases 5 and 6. It is shown that the backflow zone in both cases featured strong vertical turbulence intensity. Moreover, as the length ratio increased from 1/6 (Case 5) to 1/2 (Case 6), the vertical turbulence intensity of the backflow zone downstream of the floating dike exhibited a tendency of increasing, while that on the right side of the dike displayed a tendency of decreasing.
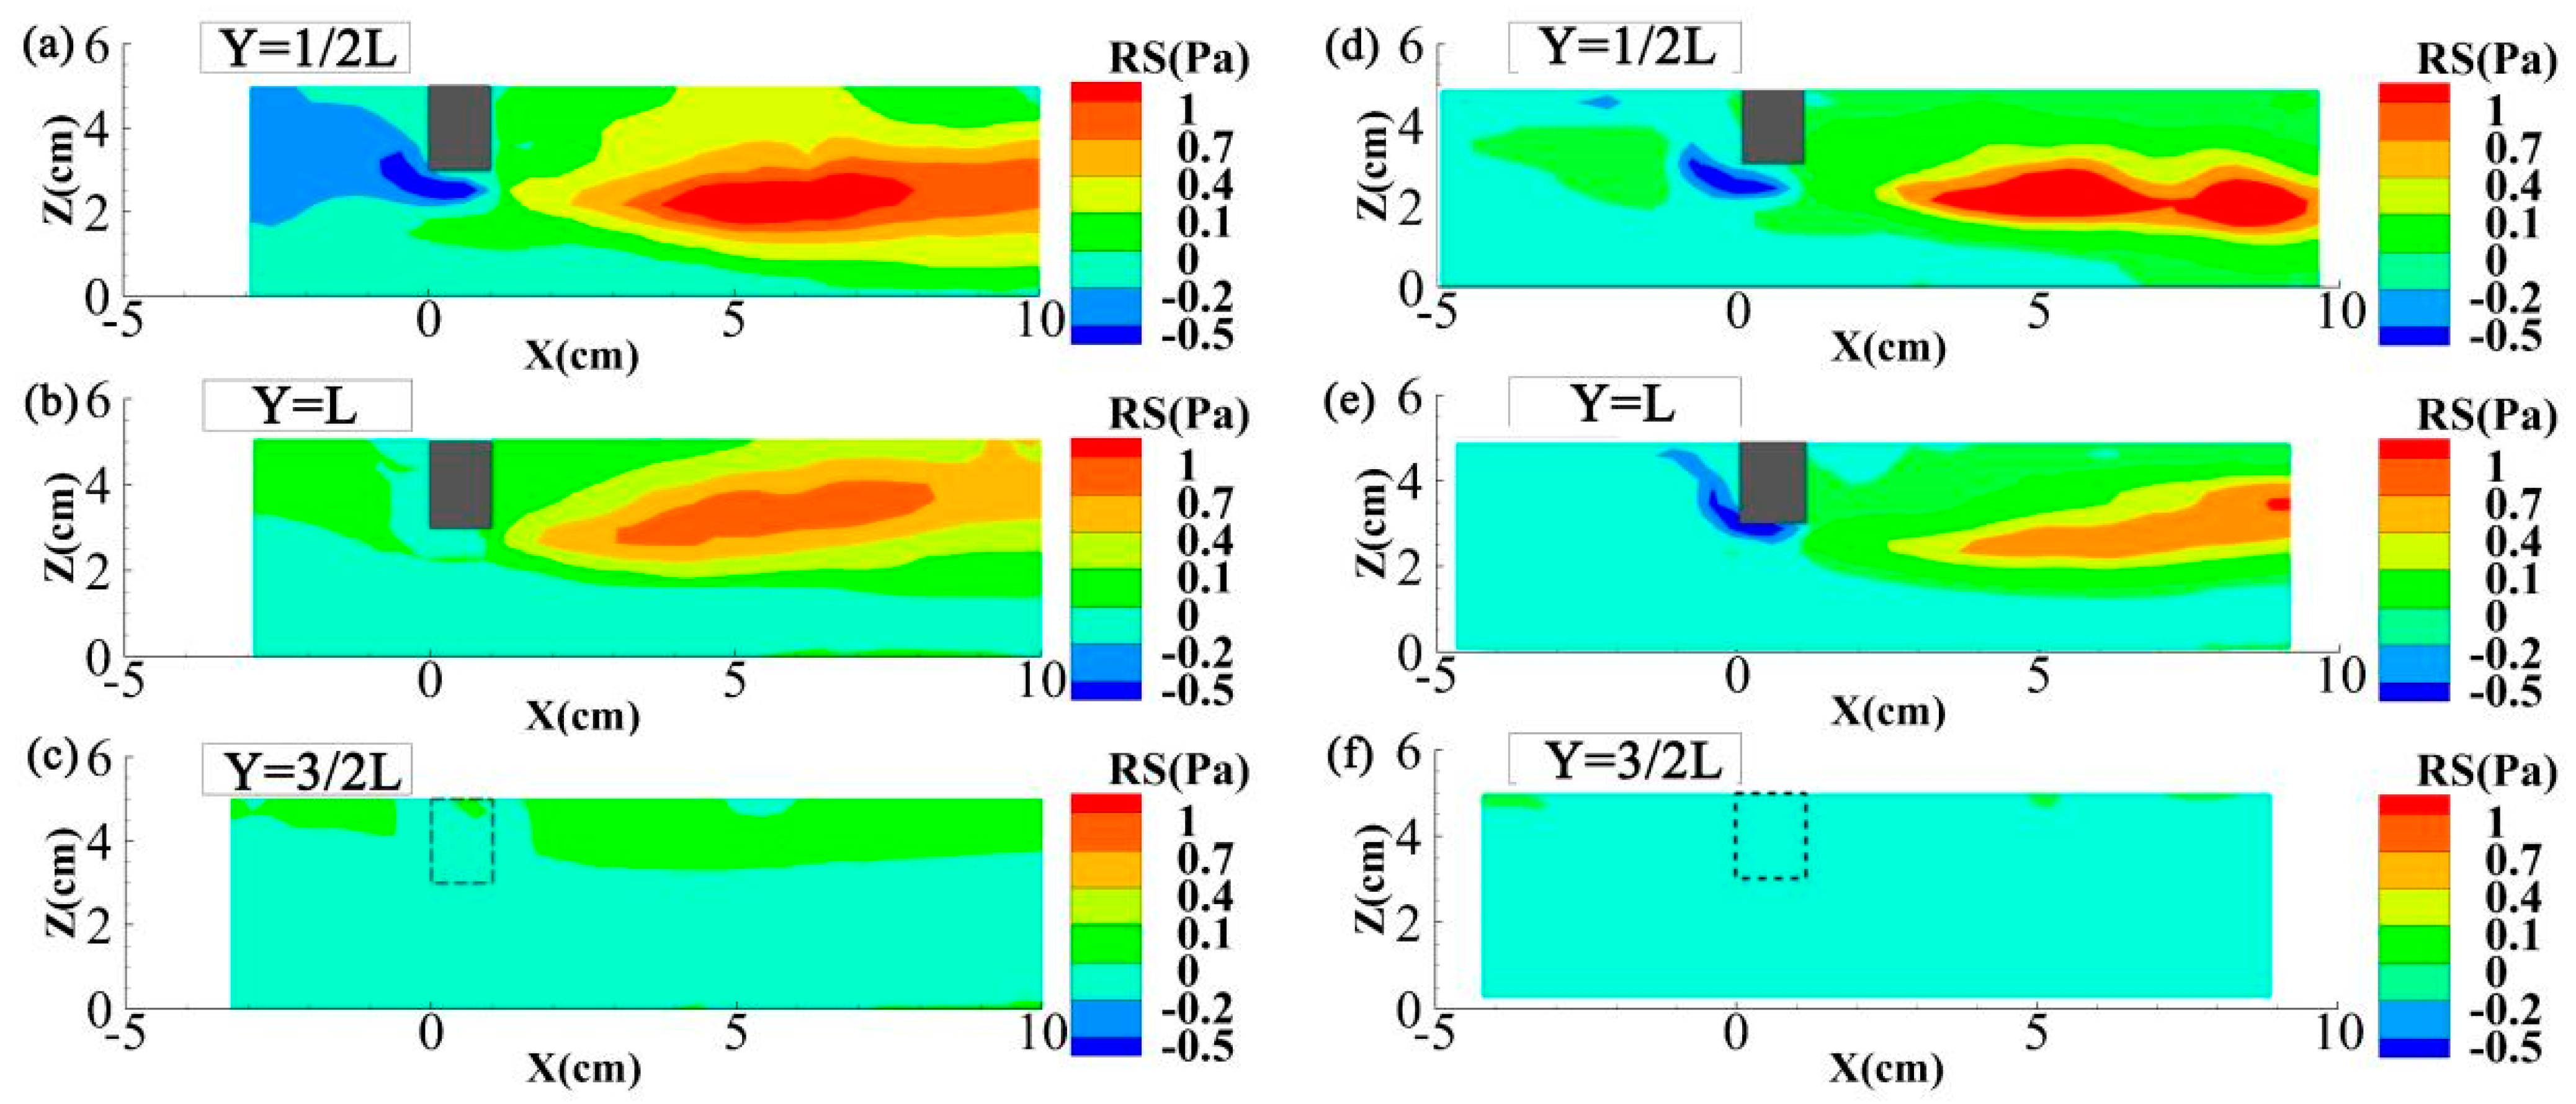
Figure 13 shows the distributions of Reynolds stress at LSs with locations featuring ratios of 1/2, 1, and 3/2 to the dike length in Cases 5 and 6. It is shown that the absolute values of Reynolds stress below the floating dike and in the backflow zone were large in both cases, while a nearly zero value characterized the remainder of the displayed domain. Additionally, as the length ratio increased (Figure 7 and Figure 13), the maximum absolute values of Reynolds stress under the floating dike in Cases 2, 5, and 6 were similar and did not display an obvious trend, i.e., these values increased from Case 5 to Case 2, and decreased from Case 2 to 6, which may be attributed to the stronger sidewall effect in Case 2 than in Case 6.
3.4. Effects of Thickness of Floating Dike
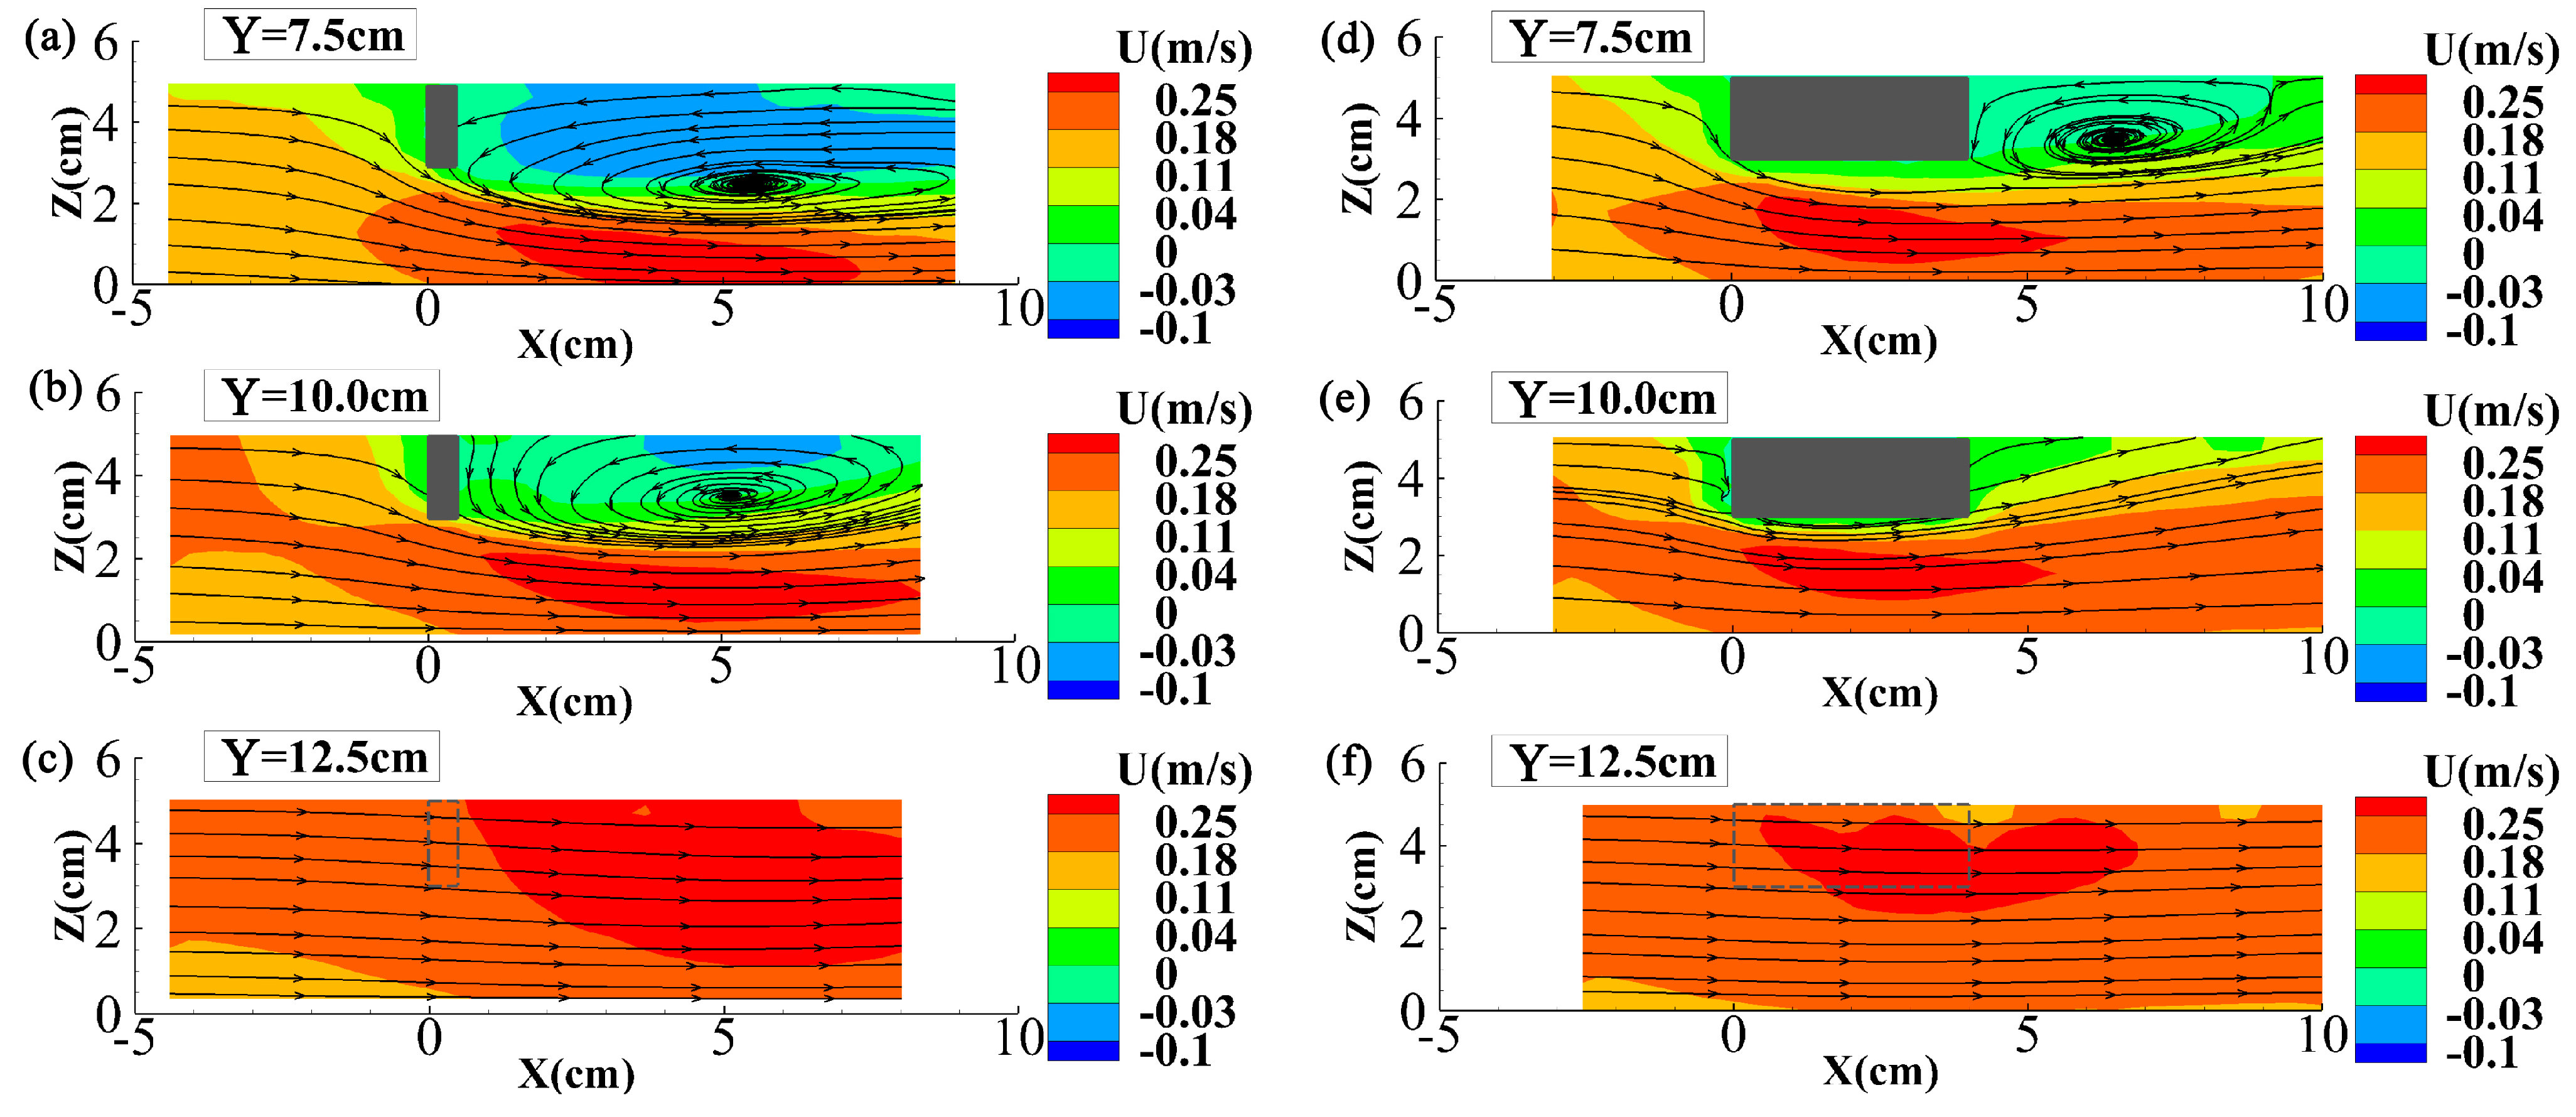
Figure 14 shows the distributions of flow velocity around the floating dike in Cases 7 and 8, which had a smaller and larger dike thickness, respectively, compared to Case 2. Comparing Figure 6 and Figure 14, it is observed that, with the increase in dike thickness (from Cases 7 to 2 to 8), the backflow downstream of the floating dike became weaker. This was most significant for Case 8, where there was no sign of a backflow zone at LS 10.0 cm; instead, the flow below the dike rose upward steadily, and the streamline extended smoothly downstream. This indicates the repression of turbulence once the floating dike thickness increased beyond a certain value. In addition, the flow velocity directly under the dike was highest in Case 8. However, downstream from and below the dike, the flow velocity in the lower section of the channel decreased with the increase in dike thickness, consistent with the weaker backflow observed downstream of the thickest dike in Case 8.
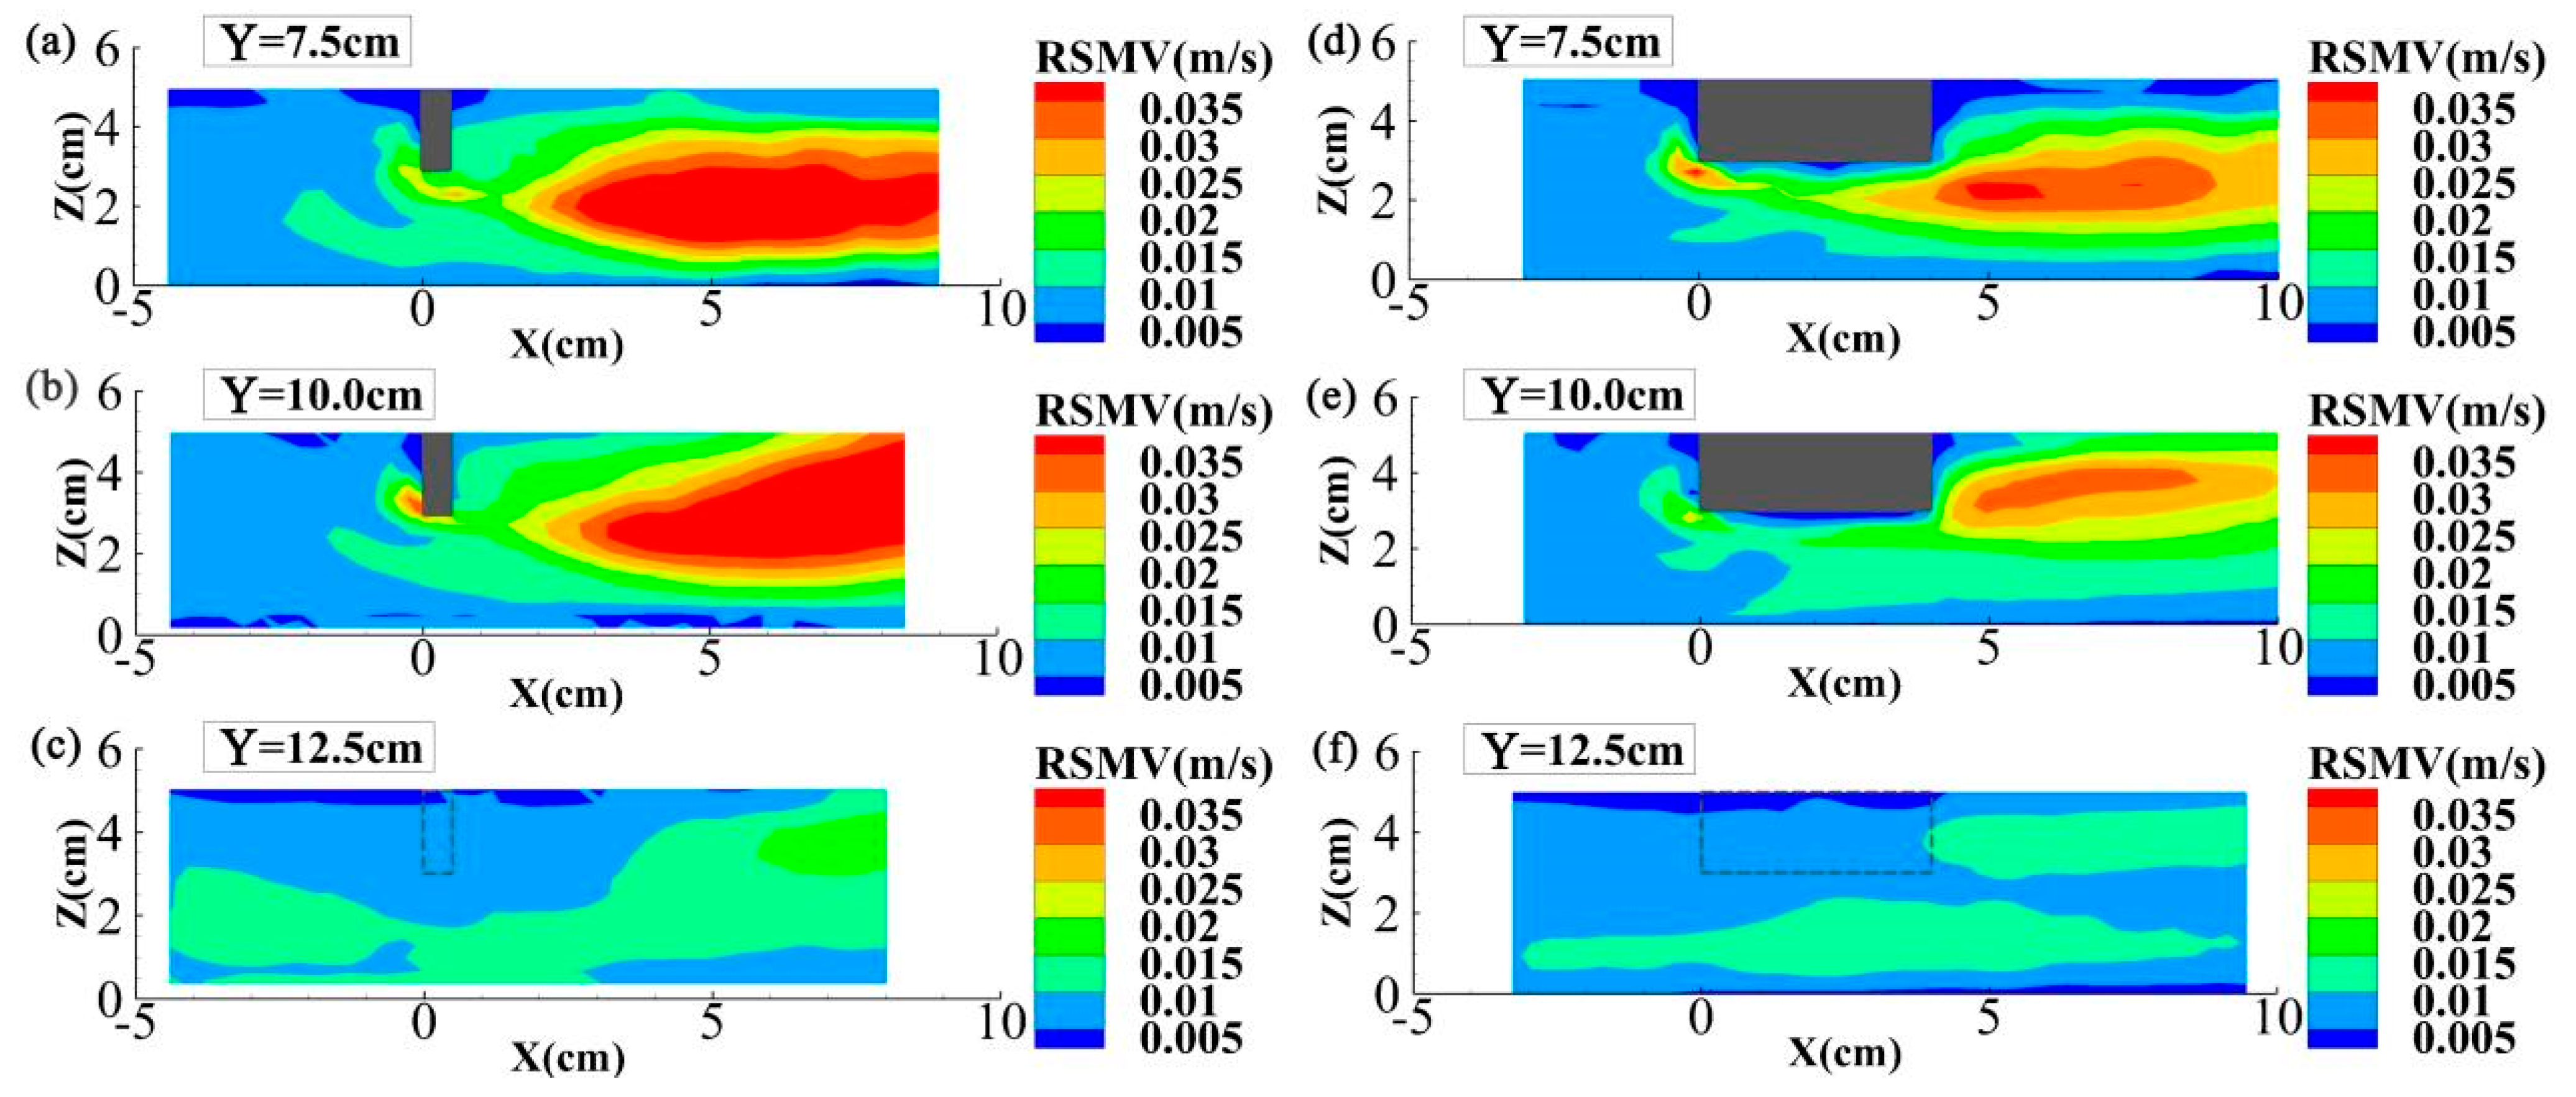
Figure 15 shows the distributions of vertical turbulence intensity around the floating dike in Cases 7 and 8. Compared with Figure 7, it is shown that, with increasing dike thickness, the vertical turbulence intensity in the backflow zone downstream of the floating dike decreased, which also suggests the repression of flow turbulence by the floating dike as its thickness increased.
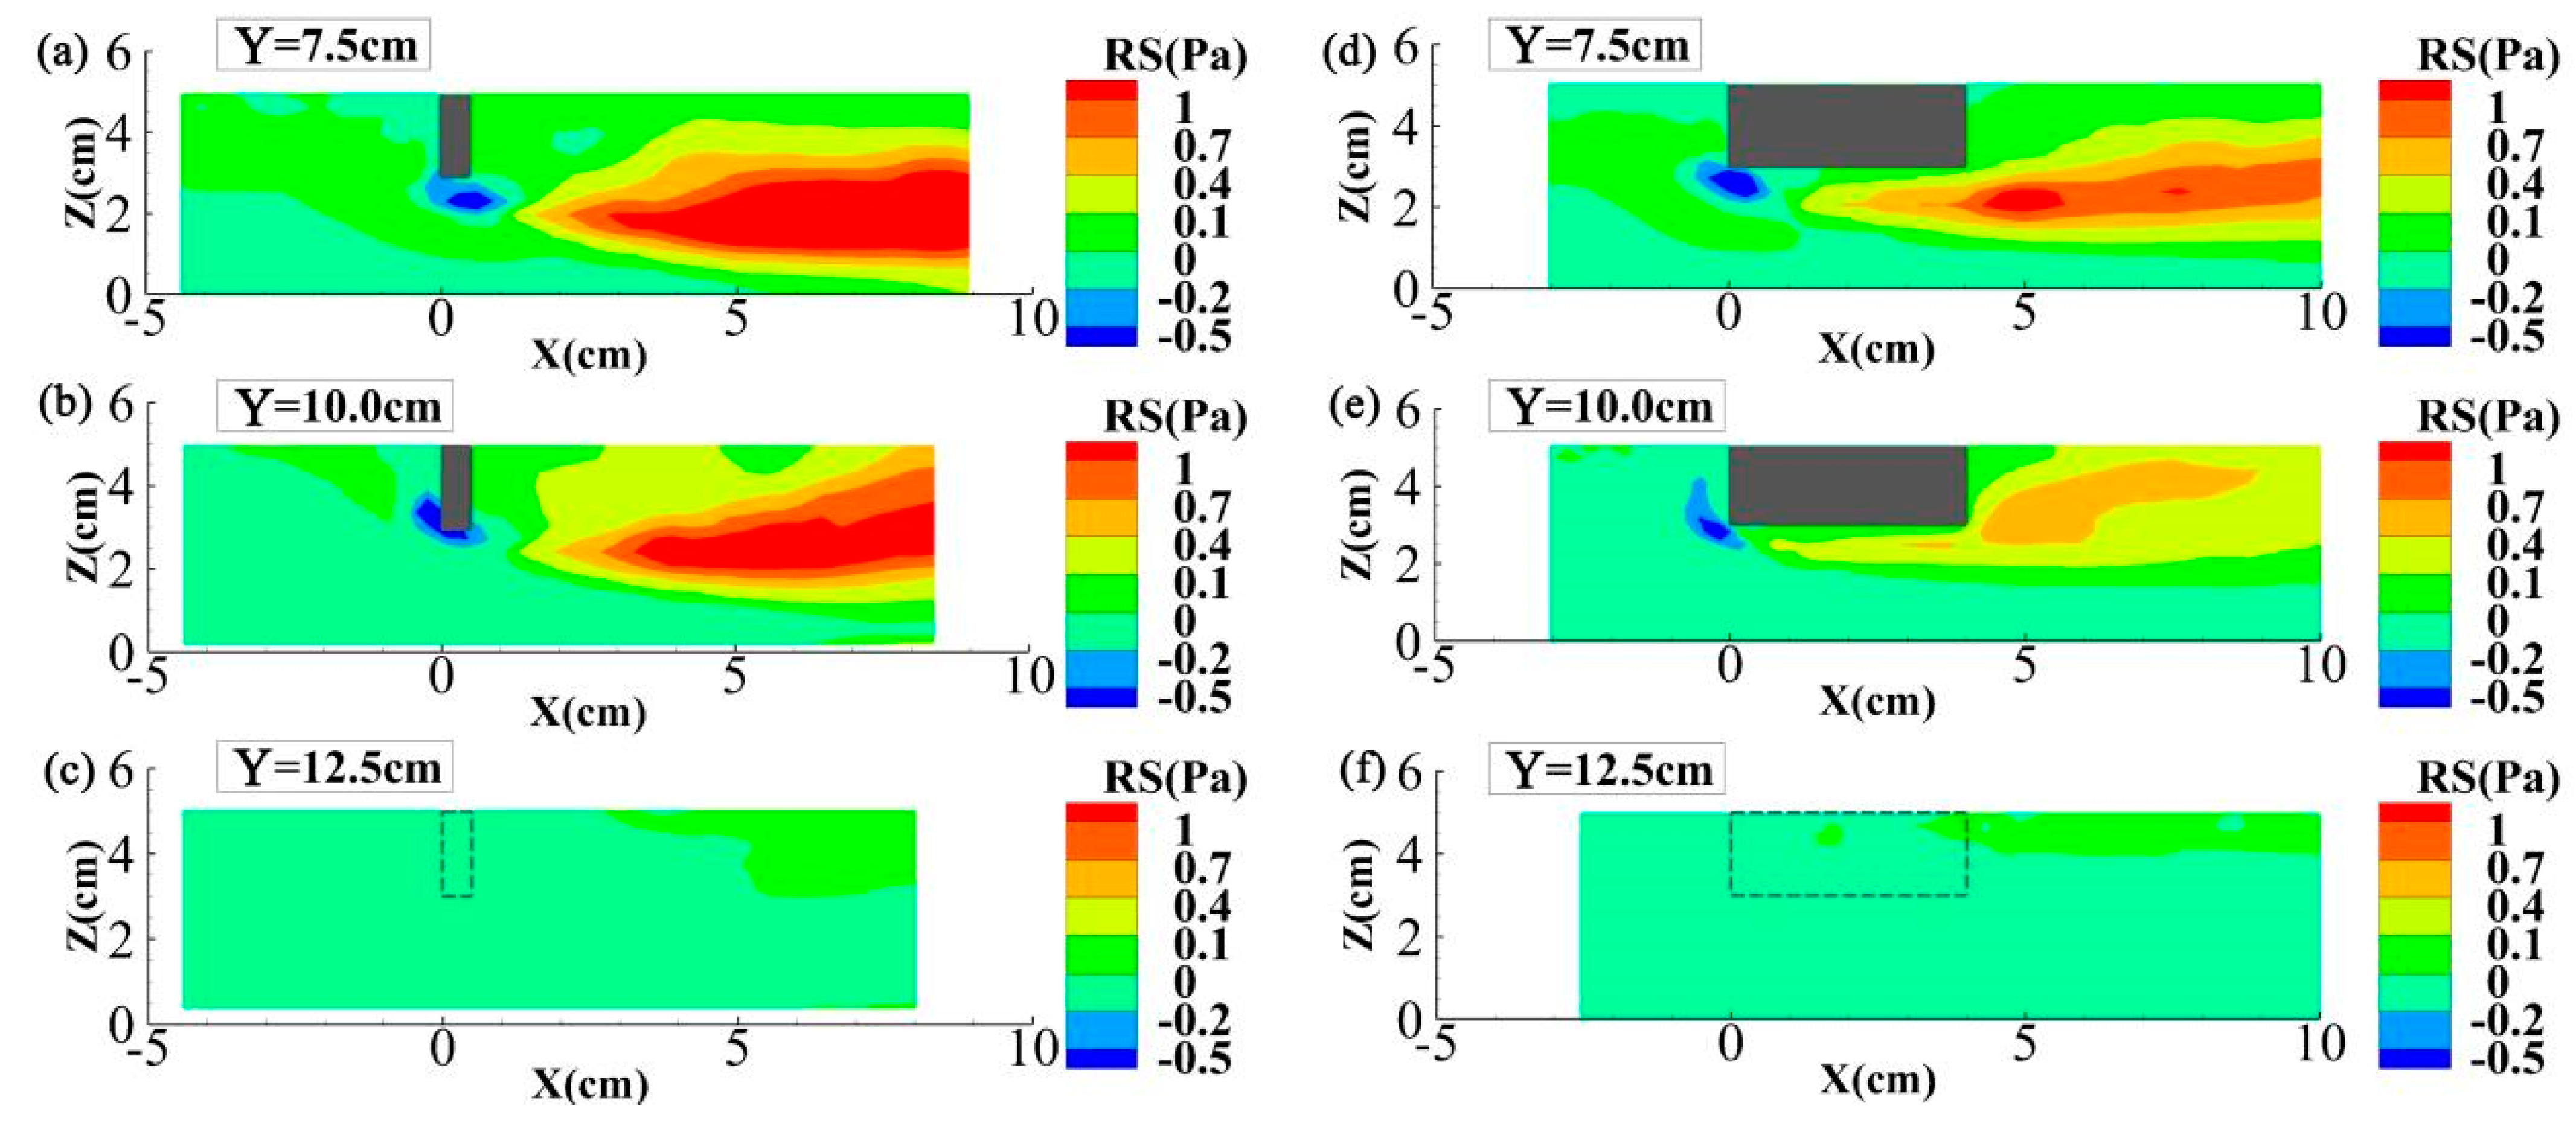
Figure 16 shows the distributions of Reynolds stress around the floating dike in Cases 7 and 8. Compared with Figure 7, it is shown that, with the increase of dike thickness, the absolute value of the Reynolds stress decreased below the floating dike and in backflow zone, indicating a weakening of flow turbulence. Again, this pattern agrees well with the patterns shown in Figure 14 and Figure 15, i.e., the increase in dike thickness led to the repression of flow turbulence.
4. Conclusions
A series of flume experiments were carried out to investigate the influence of floating dikes and their dimensions on the flow structures. The findings of the paper are summarized below.
(1) After installing the floating dike, the flow on the surface deflected to the opposite bank after passing through the floating dike because of the boundary layer flow separation on the surface of the floating dike. The vertical turbulence intensity of backflow zone downstream of the floating dike and the absolute value of Reynolds stress were large. Due to the channel blockage effect of the floating dike, the cross-sectional area of the flow passed the dike decreased, slowing the velocity upstream of the floating dike, and leading to increased flow velocities below and to the right of the floating dike.
(2) The vertical size of the downstream backflow zone of the floating dike increased with increased submerged depth of the floating dike, but the vertical turbulence intensity decreased once the submerged depth reached
= 4/5. Increasing flow velocities to the right of the dike caused an increase in the vertical turbulence intensity and the absolute value of Reynolds stress.
(3) The lateral size of the backflow zone downstream of the floating dike increased with increasing length of the floating dike. Furthermore, the vertical turbulence intensity and the absolute value of Reynolds stress downstream of the dike tended to increase. Due to the decrease in cross-sectional area with an increase in dike length, the vertical turbulence intensity decreased as the flow velocity increased on the right side of the dike.
(4) The impact of dike thickness on the local flow structure showed that the backflow zone downstream of the floating dike decreased significantly with increasing thickness. For the largest dike thickness tested in this study ( = 4 cm), no backflow was observed at LS 10.0 cm, while the velocity under and downstream of the floating dike was observed to rise steadily with smooth streamline. The flow velocity directly below the floating dike tended to increase, whereas it decreased downstream of the dike with increasing dike thickness. The vertical turbulence intensity of the flow in the backflow zone downstream of the floating dike tended to decrease, whereas the absolute value of Reynolds stress under the floating dike and in the backflow zone downstream of the floating dike decreased as the dike thickness increased.
Author Contributions
Conceptualization and methodology, W.H.; experiment, S.Y.; writing—original draft preparation, S.Y., W.H. and Y.N.; writing—review and editing, M.C. and W.H.; funding acquisition, W.H. All authors have read and agreed to the published version of the manuscript.
Funding
This study was funded by the Fundamental Research Funds for Central Public Welfare Research Institutes (Grant No. CKSF2019175/SL).
Data Availability Statement
The data presented in this study are available on request from the corresponding author.
Acknowledgments
The authors appreciate the anonymous reviewers for their comments.
Conflicts of Interest
The authors declare no conflict of interest.
References
- Cai, Y.; Xie, X.; Huang, G. Research and practice of Pontoon-type floating row applied in front of Three Gorges Dam to remove floating debris. J. Yangtze River Sci. Res. Inst. 2016, 33, 63–66. (In Chinese) [Google Scholar]
- Cai, Y.; Yang, W.; Huang, G. Study and implementation of hydraulic integrated floating debris control and reservoir surface security for water control project. Water Resour. Hydropower Eng. 2017, 48, 168–173. (In Chinese) [Google Scholar] [CrossRef]
- Li, X. Design of sewage interception and cleaning for Xiaoxia Hydropower Station. Gansu Water Conserv. Hydropower Technol. 2009, 45, 33–34, 53. (In Chinese) [Google Scholar]
- Duan, W.; Huang, G.; Zhang, H.; Li, L. Experimental research on vortexes eliminating of several typical hydraulic intakes. J. Yangtze River Sci. Res. Inst. 2011, 28, 21–26. (In Chinese) [Google Scholar]
- Huang, M. Research Report on Optimization Measures to Prevent Snail Diffusion in Water Diversion Project under Different Working Conditions; Changjiang River Scientific Research Institute: Wuhan, China, 2017. (In Chinese) [Google Scholar]
- Yu, X. Flume experiment of local scour around geotextile mattress for Shuangjiansha central bar protection in Lower Reaches of Yangtze River. J. Waterw. Harb. 2014, 35, 223–226. (In Chinese) [Google Scholar]
- Duan, X. Ecological Impacts of Water and Sediment Transportation on Macroinvertebrate Community in Rivers. Ph.D. Thesis, Tsinghua University, Beijing, China, 2009. (In Chinese). [Google Scholar]
- Buss, D.F.; Baptista, D.F.; Nessimian, J.L.; Egler, M. Substrate specificity, environmental degradation and disturbance structuring macroinvertebrate assemblages in neotropical streams. Hydrobiologia 2004, 518, 179–188. [Google Scholar] [CrossRef]
- Fox, J.F.; Papanicolaou, A.N.; Kjos, L. Eddy taxonomy methodology around a submerged barb obstacle within a fixed rough bed. J. Eng. Mech. 2005, 131, 1082–1101. [Google Scholar] [CrossRef]
- Jamieson, E.C.; Rennie, C.D.; Jacobson, R.B.; Townsend, R.D. 3-D flow and scour near a submerged wing dike: ADCP measurements on the Missouri River. Water Resour. Res. 2011, 47, 1–20. [Google Scholar] [CrossRef]
- Koken, M.; Gogus, M. Effect of spur dike length on the horseshoe vortex system and the bed shear stress distribution. J. Hydraul. Res. 2015, 53, 196–206. [Google Scholar] [CrossRef]
- Nakagawa, H.; Teraguchi, H.; Kawaike, K.; Baba, Y.; Zhang, H. Analysis of Bed Variation around Bandal-like Structures. Annu. Disaster Prev. Res.Inst. Kyoto Univ. 2011, 54, 497–510. [Google Scholar]
- Papanicolaou, A.N.T.; Kjos, L.J.; Fox, J.F. Investigation of Flow and Local Scour Characteristics around a Partially Submerged Permeable WSDOT Barb; Washington State Transportation Center: Washington, DC, USA, 2004. [Google Scholar]
- Patel, H.K.; Arora, S.; Lade, A.D.; Kumar, B.; Azamathulla, H.M. Flow behavior concerning bank stability in the presence of spur dike—A review. Water Supply 2022, 23, 237–258. [Google Scholar] [CrossRef]
- Zhou, Y.; Liu, H.; He, C.; Zong, Q. Experimental study on flow character around the pillared spur dike. J. Sediment Res. 2009, 58–62. (In Chinese) [Google Scholar] [CrossRef]
- Zhou, Y.; Michiue, M.; Hinokidani, O. Study on flow characteristics around the non-submerged spur-dikes. J. Hydraul. Eng. 2004, 31–35. (In Chinese) [Google Scholar]
- Tong, Z.S.; Zhou, H.; Wu, S.Q.; Chen, W.W.; Lu, X.J. State of the art of structures guiding floating-debris in hydro-plants. Hydro-Sci. Eng. 2002, 73–78. (In Chinese) [Google Scholar] [CrossRef]
Figure 1.
Floating dike: (a) plane view: the floating dike is attached to one side of the riverbank; (b) side view: the floating dike is floating on the water surface, moving only in the vertical direction (horizontal position is unchanged).
Figure 1.
Floating dike: (a) plane view: the floating dike is attached to one side of the riverbank; (b) side view: the floating dike is floating on the water surface, moving only in the vertical direction (horizontal position is unchanged).

Figure 2.
Experimental setup in the flume.

Figure 3.
Experimental setup of (a) the measured longitudinal sections 1# to 10#; the floating dikes with different (b) submerged depths, (c) lengths, and (d) thicknesses.
Figure 3.
Experimental setup of (a) the measured longitudinal sections 1# to 10#; the floating dikes with different (b) submerged depths, (c) lengths, and (d) thicknesses.

Figure 4.
Distributions of the absolute velocity at longitudinal sections in Case 1.

Figure 5.
Photograph of the surface flow in Case 2.

Figure 6.
Distributions of the absolute velocity at longitudinal sections (a) Y = 2.5 cm, (b) Y = 5.0 cm, (c) Y = 7.5 cm, (d) Y = 10.0 cm, (e) Y = 12.5 cm, (f) Y = 15.0 cm, (g) Y = 17.5 cm, (h) Y = 20.0 cm, (i) Y = 22.5 cm, and (j) Y = 27.5 cm in Case 2. The grey areas in subfigures (a) to (d) demonstrate the floating dike, and the dotted lines in subfigures (e) to (j) indicate the location of floating dike in the coordinate system.

Figure 7.
Distributions of vertical turbulent intensity (on the left) at longitudinal sections (a) Y = 7.5 cm, (b) Y = 10.0 cm, (c) Y = 12.5 cm, and the <u’w’> component of Reynolds stress (on the right) at longitudinal sections (d) Y = 7.5 cm, (e) Y = 10.0 cm, (f) Y = 12.5 cm in Case 2. The grey areas in subfigures (a,b,d,e) demonstrate the floating dike, and the dotted lines in subfigures (c,f) indicate the location of floating dike in the coordinate system.

Figure 8.
Distributions of velocity at longitudinal sections (a) Y = 7.5 cm, (b) Y = 10.0 cm, (c) Y = 12.5 cm in Case 3 (on the left) and at longitudinal sections (d) Y = 7.5 cm, (e) Y = 10.0 cm, (f) Y = 12.5 cm in Case 4 (on the right).The grey areas in subfigures (a,b,d,e) demonstrate the floating dike, and the dotted lines in subfigures (c,f) indicate the location of floating dike in the coordinate system.

Figure 9.
Distributions of vertical turbulent intensity at longitudinal sections (a) Y = 7.5 cm, (b) Y = 10.0 cm, (c) Y = 12.5 cm in Case 3 (on the left) and at longitudinal sections (d) Y = 7.5 cm, (e) Y = 10.0 cm, (f) Y = 12.5 cm in Case 4 (on the right). The grey areas in subfigures (a,b,d,e) demonstrate the floating dike, and the dotted lines in subfigures (c,f) indicate the location of floating dike in the coordinate system.

Figure 10.
Distributions of the <u’w’> component of Reynolds stress at longitudinal sections (a) Y = 7.5 cm, (b) Y = 10.0 cm, (c) Y = 12.5 cm in Case 3 (on the left) and at longitudinal sections (d) Y = 7.5 cm, (e) Y = 10.0 cm, (f) Y = 12.5 cm in Case 4 (on the right). The grey areas in subfigures (a,b,d,e) demonstrate the floating dike, and the dotted lines in subfigures (c,f) indicate the location of floating dike in the coordinate system.

Figure 11.
Distributions of velocity at longitudinal sections (a) Y = 1/2 L, (b) Y = L, (c) Y = 3/2 L in Case 5 (on the left) and at longitudinal sections (d) Y = 1/2 L, (e) Y = L, (f) Y = 3/2 L in Case 6 (on the right). The grey areas in subfigures (a,b,d,e) demonstrate the floating dike, and the dotted lines in subfigures (c,f) indicate the location of floating dike in the coordinate system.

Figure 12.
Distributions of vertical turbulent intensity at longitudinal sections (a) Y = 1/2 L, (b) Y = L, (c) Y = 3/2 L in Case 5 (on the left) and at longitudinal sections (d) Y = 1/2 L, (e) Y = L, (f) Y = 3/2 L in Case 6 (on the right). The grey areas in subfigures (a,b,d,e) demonstrate the floating dike, and the dotted lines in subfigures (c,f) indicate the location of floating dike in the coordinate system.

Figure 13.
Distributions of the <u’w’> component of Reynold stress at longitudinal sections (a) Y = 1/2 L, (b) Y = L, (c) Y = 3/2 L in Case 5 (on the left) and at longitudinal sections (d) Y = 1/2 L, (e) Y = L, (f) Y = 3/2 L in Case 6 (on the right). The grey areas in subfigures (a,b,d,e) demonstrate the floating dike, and the dotted lines in subfigures (c,f) indicate the location of floating dike in the coordinate system.

Figure 14.
Distributions of velocity at longitudinal sections (a) Y = 7.5 cm, (b) Y = 10.0 cm, (c) Y = 12.5 cm in Case 7 (on the left) and at longitudinal sections (d) Y = 7.5 cm, (e) Y = 10.0 cm, (f) Y = 12.5 cm in Case 8 (on the right). The grey areas in subfigures (a,b,d,e) demonstrate the floating dike, and the dotted lines in subfigures (c,f) indicate the location of floating dike in the coordinate system.

Figure 15.
Distributions of vertical turbulent intensity at longitudinal sections (a) Y = 7.5 cm, (b) Y = 10.0 cm, (c) Y = 12.5 cm in Case 7 (on the left) and at longitudinal sections (d) Y = 7.5 cm, (e) Y = 10.0 cm, (f) Y = 12.5 cm in Case 8 (on the right). The grey areas in subfigures (a,b,d,e) demonstrate the floating dike, and the dotted lines in subfigures (c,f) indicate the location of floating dike in the coordinate system.

Figure 16.
Distributions of the <u′w′> component of Reynolds stress at longitudinal sections (a) Y = 7.5 cm, (b) Y = 10.0 cm, (c) Y = 12.5 cm in Case 7 (on the left) and at longitudinal sections (d) Y = 7.5 cm, (e) Y = 10.0 cm, (f) Y = 12.5 cm in Case 8 (on the right). The grey areas in subfigures (a,b,d,e) demonstrate the floating dike, and the dotted lines in subfigures (c,f) indicate the location of floating dike in the coordinate system.


Table 1.
Summary of the key experimental parameters.
| Definition | Symbol | Dimension |
|---|---|---|
| Water depth | h | [L] |
| Channel width | W | [L] |
| Dike length | L | [L] |
| Submerged depth of the dike | d | [L] |
| Dike thickness | B | [L] |
| Length ratio | K = L/W | 1 |
| Submerged ratio | D = d/h | 1 |
Table 2.
Summary of experimental cases 1–8.
| Case No. | Submerged Depth d (cm) | Submerged Ratio D = d/h | Length L (cm) | Length Ratio K = L/W | Thickness B (cm) |
|---|---|---|---|---|---|
| 1 | / | / | / | / | / |
| 2 | 2 | 2/5 | 10 | 1/3 | 1 |
| 3 | 1 | 1/5 | 10 | 1/3 | 1 |
| 4 | 4 | 4/5 | 10 | 1/3 | 1 |
| 5 | 2 | 2/5 | 5 | 1/6 | 1 |
| 6 | 2 | 2/5 | 15 | 1/2 | 1 |
| 7 | 2 | 2/5 | 10 | 1/3 | 0.5 |
| 8 | 2 | 2/5 | 10 | 1/3 | 4 |
Table 3.
Maximum or minimum (in the reverse direction) values for experimental parameters.
| Case No. | In the Backflow Zone | On the Right Side of the Dike | |||
|---|---|---|---|---|---|
| U (m/s) | RSMV (m/s) | RS (Pa) | U (m/s) | ||
| Max | Min | Max | Max | Max | |
| 2 | 0.08 | −0.06 | 0.035 | 1 | 0.25 |
| 3 | 0.08 | −0.06 | 0.035 | 1 | 0.22 |
| 4 | 0.08 | −0.06 | 0.032 | 0.85 | 0.25 |
| 5 | 0.08 | −0.06 | 0.035 | 1 | 0.22 |
| 6 | 0.02 | −0.06 | 0.035 | 1 | 0.25 |
| 7 | 0.08 | −0.06 | 0.035 | 1 | 0.25 |
| 8 | 0.02 | −0.02 | 0.035 | 1 | 0.25 |
Disclaimer/Publisher’s Note: The statements, opinions and data contained in all publications are solely those of the individual author(s) and contributor(s) and not of MDPI and/or the editor(s). MDPI and/or the editor(s) disclaim responsibility for any injury to people or property resulting from any ideas, methods, instructions or products referred to in the content. |
© 2023 by the authors. Licensee MDPI, Basel, Switzerland. This article is an open access article distributed under the terms and conditions of the Creative Commons Attribution (CC BY) license (https://creativecommons.org/licenses/by/4.0/).
Share and Cite
MDPI and ACS Style
Huang, W.; Ni, Y.; Creed, M.; Yu, S. Experimental Analysis of 3D Flow Structures around a Floating Dike. Water 2023, 15, 703. https://doi.org/10.3390/w15040703
AMA Style
Huang W, Ni Y, Creed M, Yu S. Experimental Analysis of 3D Flow Structures around a Floating Dike. Water. 2023; 15(4):703. https://doi.org/10.3390/w15040703
Chicago/Turabian StyleHuang, Wei, Yufang Ni, Maggie Creed, and Sihan Yu. 2023. "Experimental Analysis of 3D Flow Structures around a Floating Dike" Water 15, no. 4: 703. https://doi.org/10.3390/w15040703
Note that from the first issue of 2016, this journal uses article numbers instead of page numbers. See further details here.