
Investigation of the Hydroelectric Development Potential of Nonpowered Dams: A Case Study of the Buyuk Menderes River Basin

1
Department of Civil and Environmental Engineering, Norwegian University of Science and Technology (NTNU), S.P. Andersens veg 5, 7491 Trondheim, Norway
2
Department of Civil Engineering, Izmir University of Economics, İzmir 35330, Turkey
*
Author to whom correspondence should be addressed.
Water 2023, 15(4), 717; https://doi.org/10.3390/w15040717
Submission received: 23 December 2022
/
Revised: 8 February 2023
/
Accepted: 9 February 2023
/
Published: 11 February 2023
(This article belongs to the Special Issue New Methodologies and Practical Solutions to Face Sanitary and Environmental Issues Related to Human Cycle of Water)
Abstract
:The adaptation of nonpowered dams (NPDs) to dams with hydroelectric generation units requires only minor interventions compared with the construction of a completely new dam and power plant. Thus, it is both more economical and has a minimal environmental impact, especially during construction. The aim of this study was to determine the environmental, technical, and economic feasibility of hydroelectric retrofitting projects in the Büyük Menderes basin in Turkey. For this purpose, the economic feasibility and retrofitting potential of 11 NPDs in the basin were investigated using Water Evaluation and Planning (WEAP) software. The results from the energy simulation revealed that the annual average hydropower generation potential and installed capacity for the selected 11 NPDs are 38.7 GWh/year and 4.4 MW, respectively. The total estimated capital investment cost of the 11 retrofit projects was found to be $7.9 million with a total NPV of $25.6 million. In addition, in this study, the leveled electricity cost for each retrofitting project was established and compared with the LCOE values of other renewable energy sources. The findings show that retrofitting NPDs may represent an as yet untapped opportunity to support the global energy transition by providing a cheaper and more environmentally friendly option to pioneer rural electrification.
1. Introduction
Climate change and increasing energy demands call for extensive development of new low-carbon energy sources. Currently, the dominant renewable energy source globally is hydropower, and hydropower is expected to continue to play an important role in the energy future of the whole world [1,2], both for base load production as well as for balancing intermittent renewable sources, such as solar and wind. Access to clean energy at an affordable price is also one of the 17 main UN Sustainable Development Goals (UN SDGs). Although acknowledged as a clean (low-carbon) source of energy, the construction and operation of hydroelectric power plants (HEPPs) may have significant local environmental impacts. In addition, the construction of new dams and reservoirs can have severe negative effects on aquatic ecosystems (e.g., [3,4]), unless very careful design and ecologically sound mitigating measures are put in place. The adaptation of hydroelectric power to nonhydropowered dams (NPDs), rather than building new dams, can increase hydropower generation with only limited adaptation to the dam site and without further flow changes [5].
According to ICOLD World Dams [6], 29,163 dams and reservoirs are exclusively used for irrigation and flood control globally, and as such, they are not used for hydropower production (NPDs). This number corresponds to 50% of the total number of registered dams. Water stored in reservoirs supports 12–16% of global food production [7]. Considering that the world’s population and food demand will increase by 70% by 2050, increased storage of water for irrigation is one possible option to secure the future water supply. With the expected 60% increase in energy demand by 2050 to be supplied by renewable sources, it is likely that more dams will be built in the coming years [2]. This represents an alternative to building new dams and reservoirs for purposes other than hydropower across the world, thereby providing untapped potential for new energy generation [5].
The total annual electricity production in Turkey is approximately 300 TWh and is predominantly from coal, gas, and hydroelectricity [8]. The country’s electricity production is dominated by coal-fired power plants, and the carbon footprint of electricity generation is 400 g of CO per kilowatt-hour, which is slightly below the global average of emissions from electricity production [8]. With its rapidly growing population and economy, Turkey’s energy demand and generation increased by 8–9% in recent years and had reached 335 TWh by 2022. According to the results of the ’Turkish Electricity Energy Demand Projection Report’ study for the 2020–2040 period, electricity consumption is expected to reach 370 TWh in 2025 and 591 TWh in 2040 according to the base Scenario, making Turkey strongly dependent on energy imports to meet national demands [9]. As of 2022, Turkey had 504 dams; 203 were large dams, and the others were in the form of ponds. Thirty-one of these dams were generating hydroelectricity, i.e., only about 6% of the total number of reservoirs. As of the end of October 2022, the total registered hydroelectric power was 31 GWh.
Retrofitting refers to the expansion of an existing dam and its associated reservoir by adding hydropower technology in order to enable the production of hydroelectric power from these nonpowered dams. The addition of such a function can be made without any additional social or environmental impacts, beyond those produced when the dams and reservoirs were first built. Ass such, there is a lower impact than that of developing a new hydropower project. Retrofitting allows sustainability by producing fewer environmental and social impacts and sometimes providing a reduced cost and a net reduction in energy use/investment. The lack of research to date on the retrofit potential of existing NPDs in Turkey may lead to unnecessarily high economic costs and environmental burden from building new hydroelectric power plants.
Surprisingly few studies have assessed the hydropower potential of retrofitting existing dams and reservoirs. Ref. [10] carried out a study in a basin in southern Spain and concluded that 5 out of 13 dams studied are economical feasible to be retrofitted. Ref. [11] identified a set of challenges associated with the integration of a small hydropower plant into the existing Mujib Dam, while [12] investigated the potential for hydropower use in existing South African dams. Some studies carried out in the US have investigated the potential of retrofitting with encouraging outcomes (e.g., [13]).
In order to produce substantial volumes of energy, sufficient volumes of water and head must be available. Furthermore, the economic and technical factors as well as the compatibility of hydroelectric generation with current water use need to be evaluated. For a dam to be suitable for retrofitting, it needs feasible and affordable technical solutions that can utilize sufficient water volumes without adversely affecting the initial water use. The configuration of a hydrological model for the river basin of concern, taking into account the existing water use, is of great importance for the assessment of the feasibility of retrofitting and to identify potential water-related conflicts. Maintaining the current outflow pattern from dams will minimize potential conflicts between hydropower, environmental requirements, and existing water users and is, therefore, a prerequisite for the evaluation of the hydropower retrofitting potential.
In this study, the hydroelectric generation potential of retrofitting NPDs in the Büyük Menderes River basin in Turkey was investigated. We took into account the current water use and assessed the technical, environmental, and economic feasibility of the project. This is the first study to assess the technical and economical retrofitting potential in Turkey. The findings presented are expected to mobilize further prefeasibility studies in different river basins across Turkey and potentially provide results that can facilitate the initiation and planning of future retrofitting projects. An important prerequisite on which this study is based is that that the introduction of hydropower technology through retrofitting should not compromise the ability of the dams and reservoirs to perform their primary purpose. The study is also based on the assumption that turbines for the power station will be placed at the foot of the dam, giving no room for the construction of tunnels. Hydropower generation simulations were run for the different sub-basins, ensuring that years with no data in all months were excluded from the simulation.
2. Materials and Methods
2.1. Study Site
In this study, the hydroelectric generation potential of retrofitting NPDs in the B. Menderes River basin was investigated. The topographic precipitation area of the B. Menderes Basin, located in the western Anatolian region of Turkey at latitudes 3706–38055 N and longitudes 27015–30036 E, constitutes approximately 3% of Turkey’s total area, 26,010 km. B. Menderes is the longest river in the Aegean Region. It has long bends and compound loops and a length of approximately 584 km. Its main tributaries are the Çine, Emir, Akçay, Banaz, Madran, Kufi, and Dandalaz streams. The B. Menderes Basin has the most fertile agricultural land due to its ecological characteristics, and it makes significant contributions to the agriculture of the Aegean Region and Turkey. Cotton, vegetables, and fruits are produced in these plains. There is a wide variety of crop patterns in this highly productive region where intensive agriculture is practiced. According to the B. Menderes Basin Master Plan Report [14], the annual average precipitation of the basin is approximately 633 mm, and the annual average temperature is 15.6 C. Seventy-eight percent of the total water in the basin is used for agriculture, 2% is used for industry, and 6% is used for drinking and other purposes. The characteristics of the basin are provided in Table 1.
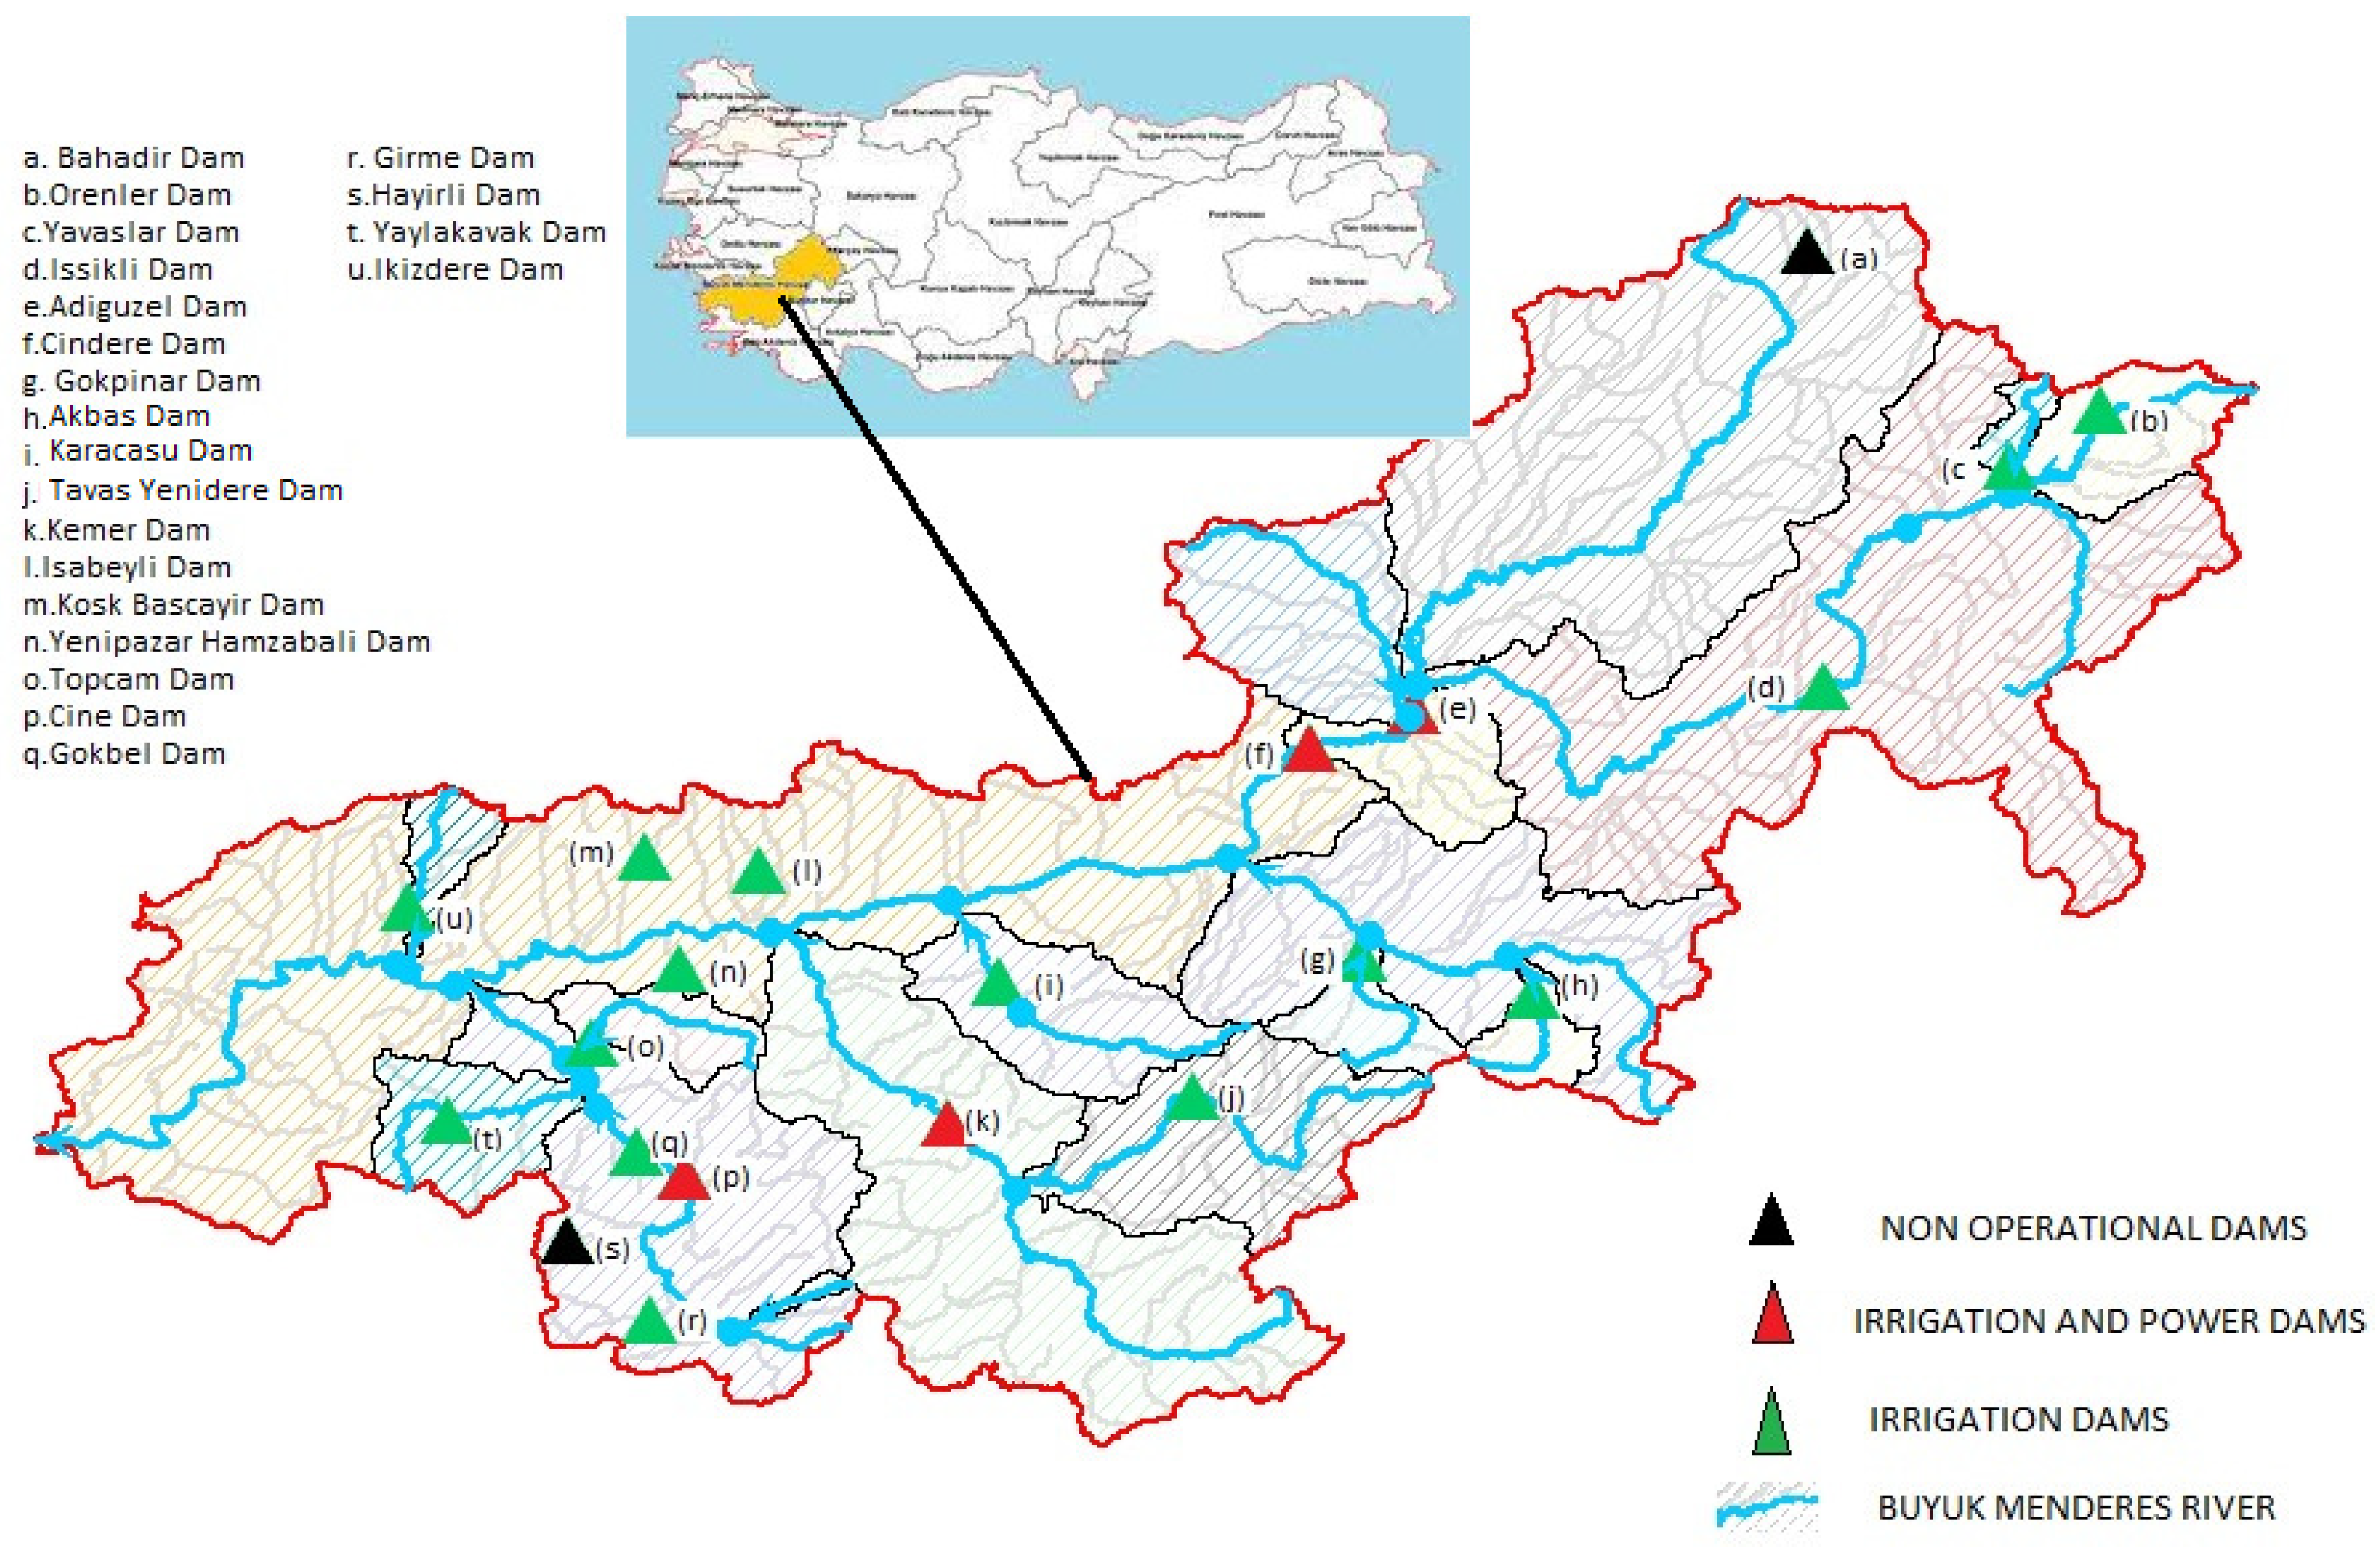
The B. Menderes basin has a total of 21 dams, which were developed for the purposes of irrigation, water supply, energy, and industry in operation shown in Figure 1. There are 17 HEPPs in the basin: 6 built on dams and 11 on rivers and irrigation canals. The installed power capacity and average project energy production value of the HEPPs operated in the basin are 305 MW and 741 GWh/year, respectively. The three major dams in the basin, Adiguzel- Cindere, Kemer, and Cine, collectively hold an annual water potential of 1240 hm. These dams are powered irrigation dams with annual irrigation and power potentials of 718 hm and 355 GWh, respectively. Due to a renewal of irrigation networks in the lower section of the basin, the Akcay Hydro Electric Power Plant (HEPP), which is in line with the Kemer reservoir, will have to reduce its regulation and allow more water to flow downstream for irrigation purposes. According to the [14] report, with a total of 13 new hydroelectric power plants planned to be developed in the basin, the total capacity will be 33 MW. Eleven of the functional dams are NPDs, and others are currently used for irrigation, water supply, and industrial demands within the basin. The 11 NPDs have a total potential annual inflow capacity of 845 hm and a gross head of above 6.4 m, as summarized in Table 2. Research from the available data from the DSI on NPDs within the B. Menderes basin suggests that an average of 43.87% of the total annual inflow into the reservoirs is not regulated for their intended purposes and is therefore available for power production. This indicates that about 370 hm of water could be made available for power production in the various reservoirs. Table 2 reveals key components for the computation of the energy potential of each dam.
2.2. Hydrological Model Development
Water Evaluation and Planning (WEAP) software was selected as the tool for use in this study [15]. This software provides a platform that allows the user to create virtual versions of naturally existing watersheds. Scenarios can be created by modifying the data in the core elements of the model setup via a user-friendly interface. In the WEAP model, a basin or components of a watershed are converted to WEAP elements. To be able to run simulations with the WEAP model, there is a need for climatic data input, including time series of temperature and precipitation as the most important climatic inputs. In this study, a WEAP model simulation was carried out for the period matching the duration of available data from 1964 to 2010. The data required for this study were obtained from the National Center for Atmospheric Research, Computational and Information System Laboratory (NCEP-NCAR). This open access resource provides monthly averages of a range of climate data. In addition, discharge and irrigation parameters were calibrated with data from approximately 50 local gauging stations. This study employed the soil moisture method, which is one of the five methods of simulating the water balance of a basin in WEAP. Hydropower data, which were fed as input into the WEAP model, included the maximum turbine flow, tailwater elevation, plant factor, generating efficiency, hydropower priority, and energy demand for the virtually installed hydropower plants, as well as data on the existing reservoirs, such as elevation–volume curves. WEAP calculates the hydropower for each reservoir based on the available water in the reservoir and the different priorities set for other demand nodes. In a situation where hydropower is given the least priority, a full reservoir will serve and meet all of the water needs of the demand nodes before considering power production. If water is available for energy production, the WEAP model calculates the energy output using information on the volume of flow through the turbine at each given time step and the hydro generating factor (HGF), which is also a function of the water density, plant factor, available head, plant efficiency, and acceleration due to gravity [16].
2.3. The WEAP Model Calibration and Validation
Regional calibration was done for all the sub-basins in this model. First, a sensitivity analysis was performed for various calibration parameters to measure their influence on the runoff volume changes for the sub-basins in the basin [17]. The default values of these parameters in WEAP were increased and decreased by given percentages and the subsequent runoff volume changes were observed. The sensitivity of each parameter was measured by observing the absolute difference between the observed and simulated flow when each parameter was changed from its default value. The sensitivity was recorded as the ratio of the absolute difference between the observed and simulated flow when the default value of a parameter was changed to the absolute value between the observed and simulated flow when the parameter was at its default value. As a result of the sensitivity analysis, the main calibration parameters used for calibration were determined to be the crop coefficient (Kc), soil water content (SWC), deep water capacity (DWC), and flow resistance (RRF). Next, the model was switched to the sub-basin delineation mode to obtain an approximate understanding of the dominant land uses and elevation bands in the sub-basin.
The PBIAS was the main objective function used to assess the performance of the calibration process. The model was run with monthly time steps, while the PBIAS was calculated on a yearly basis. For the purpose of this study, the Kc values for the various land uses in the sub-basins were obtained from FAO report 56 [18]. Because equifinality in model calibration is permitted, all other calibration parameters, with the exceptions of Kc, SWC, and RRF, were left at their default values after the achievement of a good value for the objective function (PBIAS) for model evaluation. The percent bias (PBIAS) is a measure of the percentage by which the simulated annual flow generated from the model differs from the observed annual flow [19]. The PBIAS objective function is expressed in Equation (1).
where the observed flow (m/s) at time step i, and the simulated flow (m/s) at time step i. In this study, PBIAS calibration values were used [19]. The best value for PBIAS in any calibration is 0%, and this is achieved when the simulated and observed flow are the same throughout all time steps under consideration.
Two scenarios were considered in this study. Scenario 1 considered the potential of all water released from dams. The maximum turbine capacity was set to be equal to the total flow output capacity of the reservoir, excluding the spillway capacity. Economic factors were not taken into account during the calculation, and in most cases, the total capacity was the sum of the hydraulic structures and capacities of various pipes that probably divert water from the downstream river. Scenario 2 considered the potential of water flowing from turbines designed according to historical discharge observations in the basin. Maximum turbine capacities are found by analyzing the observed daily average values for the historical flow downstream of the dams covering the simulation period. Within the scope of this study, turbine capacities were chosen to be twice the average output values [20]. The economic analysis performed was based on this Scenario 2 and, therefore, included the construction of new hydraulic structures such as turbines and pipes in the cost estimates.
2.4. Economic Analysis
The net present value (NPV) of a project is a common measure for assessing economic viability that takes into account the value of time. The NPV represents the value of a project for a given year, taking into account the costs and benefits over its entire lifetime. The costs and benefits included in the NPV are discounted for the specified year using a discount rate. The turbines for the various reservoirs were chosen based on the head, discharge, and optimal efficiency of the turbine with reference to the given technical specification [21] (Table 2). The operating and maintenance cost for the running of the power production business was assumed to be 4% of the capital investment cost. At the current energy price of $0.09/kWh (energy price in 2022 for Turkey [22]), the annual revenue was generated as the product of the current energy price and the annual energy produced by each dam. A combination of natural resources and income tax for power production was assumed to be 35% of the revenue generated from power production. From the estimated cost and revenue values, an economic analysis was conducted to verify the economic viability of running the power production business for a period of 49 years at a discount rate of 5%. The project’s benefit–cost ratio was also assessed over the 49-year period. The internal rate of return was used to determine the level of return on investment for each retrofitted dam. The levelized cost of electricity was also generated for each retrofitting project and compared to the LCOE values of other emerging renewable energy sources [23].
2.5. Minimum Flow Considerations
In order to maintain the minimum habitat and ecological quality standards within the river, a minimum flow value was included in all sections downstream of the dams identified for assessment of the retrofitting potential. The minimum flow introduced was a so-called Q95 flow value, which is a statistical flow value that is exceeded 95 percent of the time. This is a very commonly applied minimum flow value in regulated rivers [24]. Minimum flow values set for ecological purposes normally have higher priority than power production, and for this reason, minimum flow releases were given the highest priority in the model simulations.
3. Results
3.1. Model Calibration and Evaluation
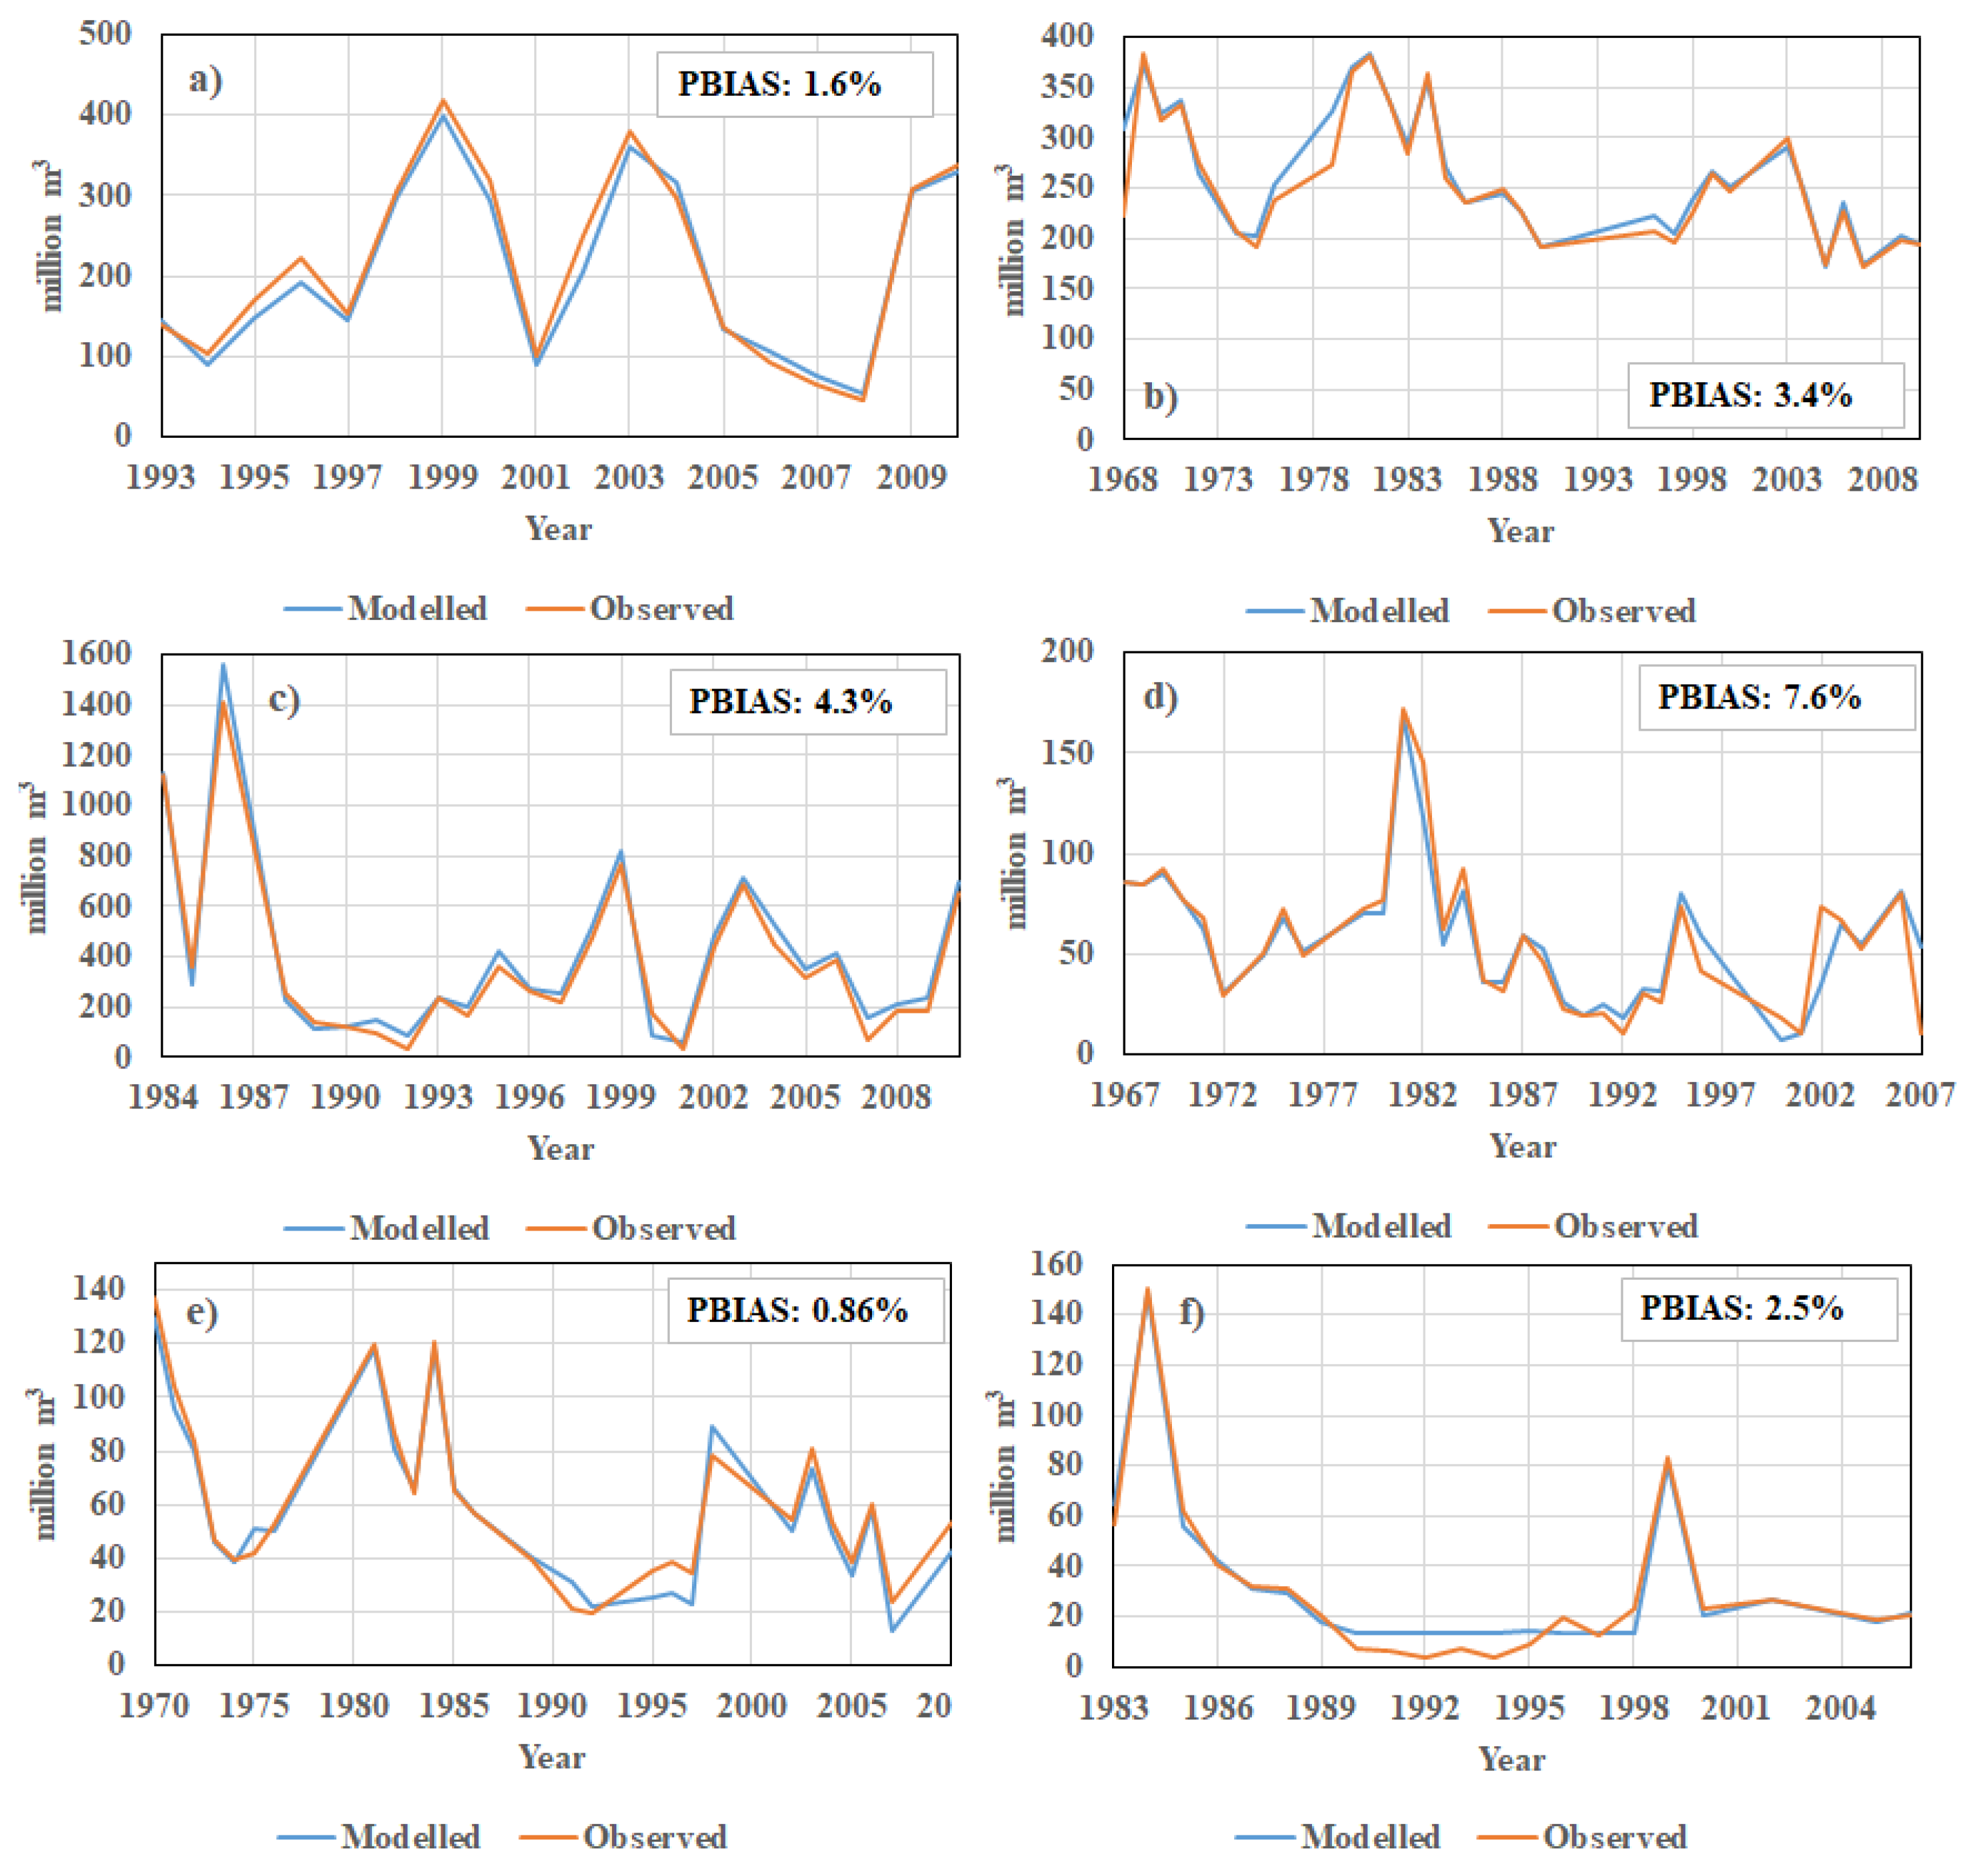
The final calibration of the Kufi, Curuksu, Dandalas, Cine, Ikizdere, and Tavas sub-basins resulted in overall PBIAS values of 1.6%, 3.4%, 4.3%, 7.6%, 0.86%, and 2.5% respectively. For the Kufi sub-basin, there was minimal deviation between the observed and simulated flows for both dry and wet years. It can, however, be seen in Figure 2 that the modeled total annual flow in 1996 was slightly lower than the observed flow. For the Curuksu basin, the annual total simulated and observed flows for 1968 and 1979 recorded the highest deviations. In both years, the simulated total annual flow exceeded that of the observed flow. For the Dandalas sub-basin, the drop in the total annual flow from 1970 to 1974 was well reflected by the simulated flow. The deviation between the simulated and observed total annual flows was, however, high for 1975, 1995, 1996, and 1997. For the Cine sub-basin, the simulated flow was shown to closely follow the recessions of the interannual hydrograph, with the exception of the years 1992, 2000, and 2007. For the Ikizdere sub-basin, high deviations between the observed and simulated flows were recorded for the period from 1996 to 2006. The modeled flow missed the peaks and recessions of the observed flow from 1996 to 2006. For the Tavas Yenidere subbasin, the high annual total value recorded in 1984 was followed by a fast recession and remained constant from 1985 to 1998. The modeled flow was able to closely follow this peak and recession in the observed flow. According to these results, it can be said that the simulated annual total flow closely follows all of the peaks and recessions of the interannual period. The simulated annual total flow values were within a very good range () for each sub-basin during calibration [19].
3.2. Energy Production with NPDs
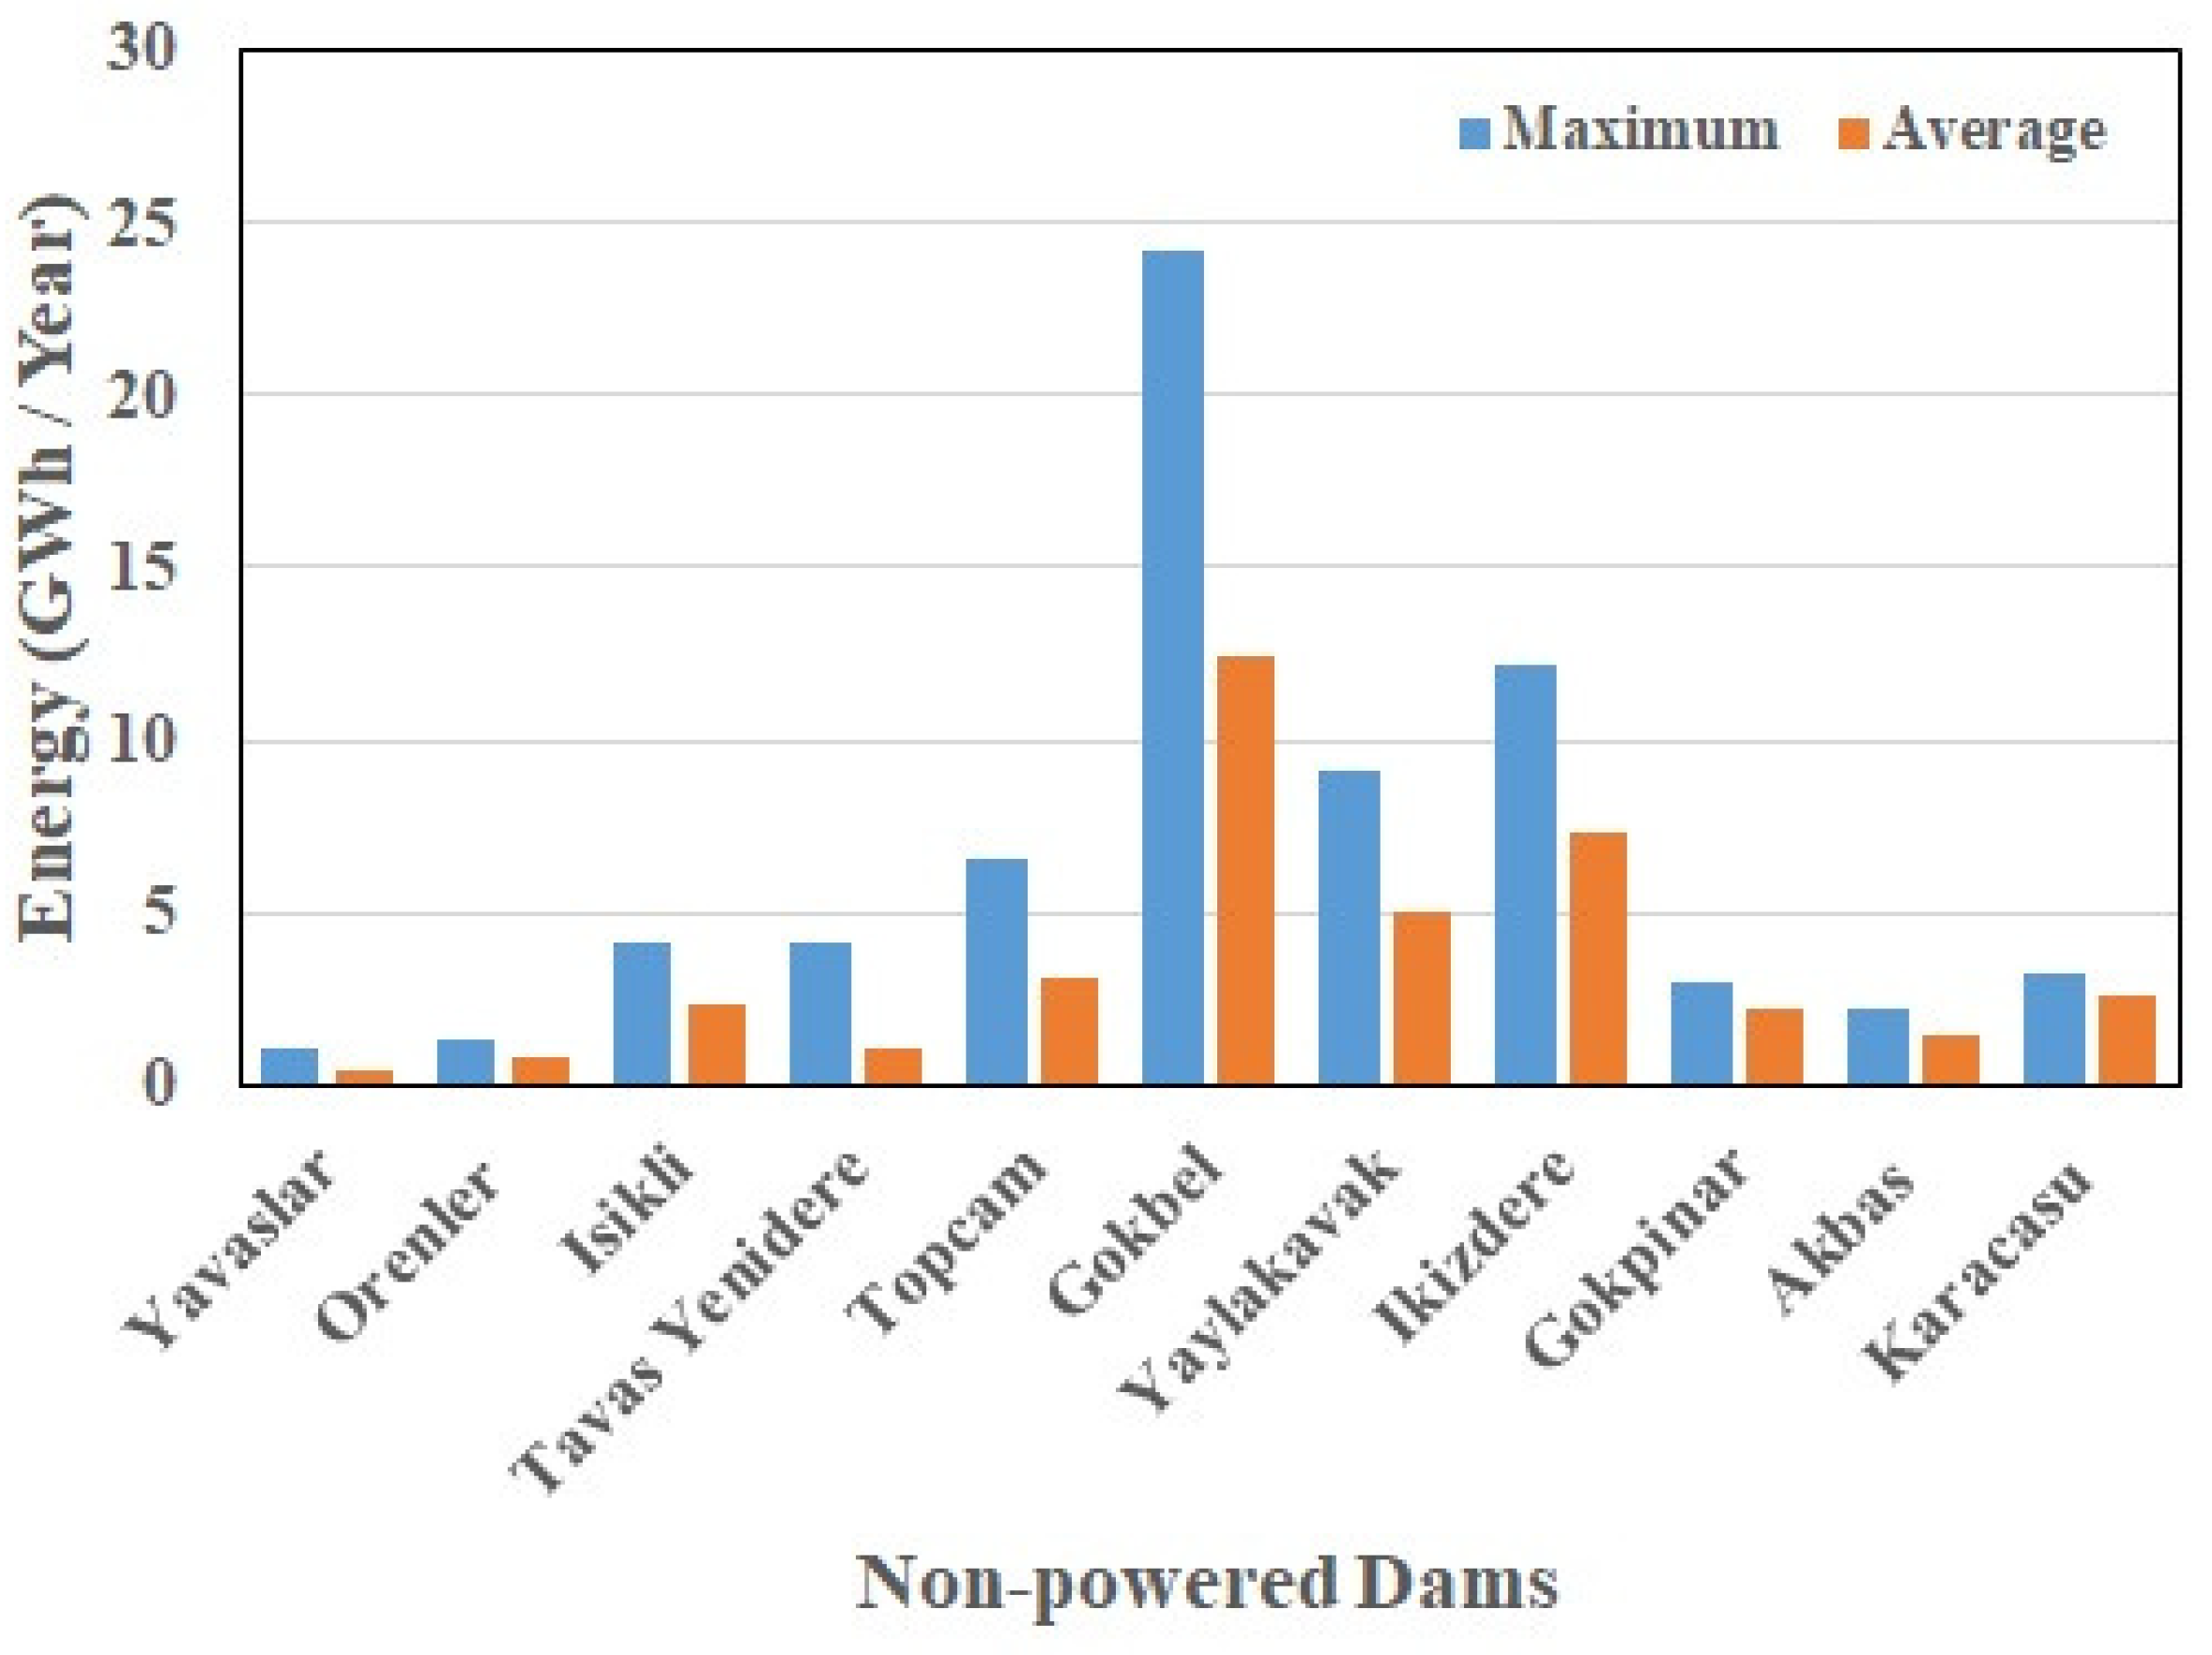
After complete schematization and calibration of the model, the average and maximum annual hydropower generation potential from the NPDs were determined and are displayed in Figure 3 for Scenario 1. The results show that the Gokbel dam has the highest annual energy production potential with a value of 12.5 GWh, and Yavaslar has the lowest with a value of 0.4 GWh. The average annual energy production within the basin was recorded to be 3.5 GWh. In total, the energy production from hydropower retrofitting in the basin is 38.7 GWh of energy annually.
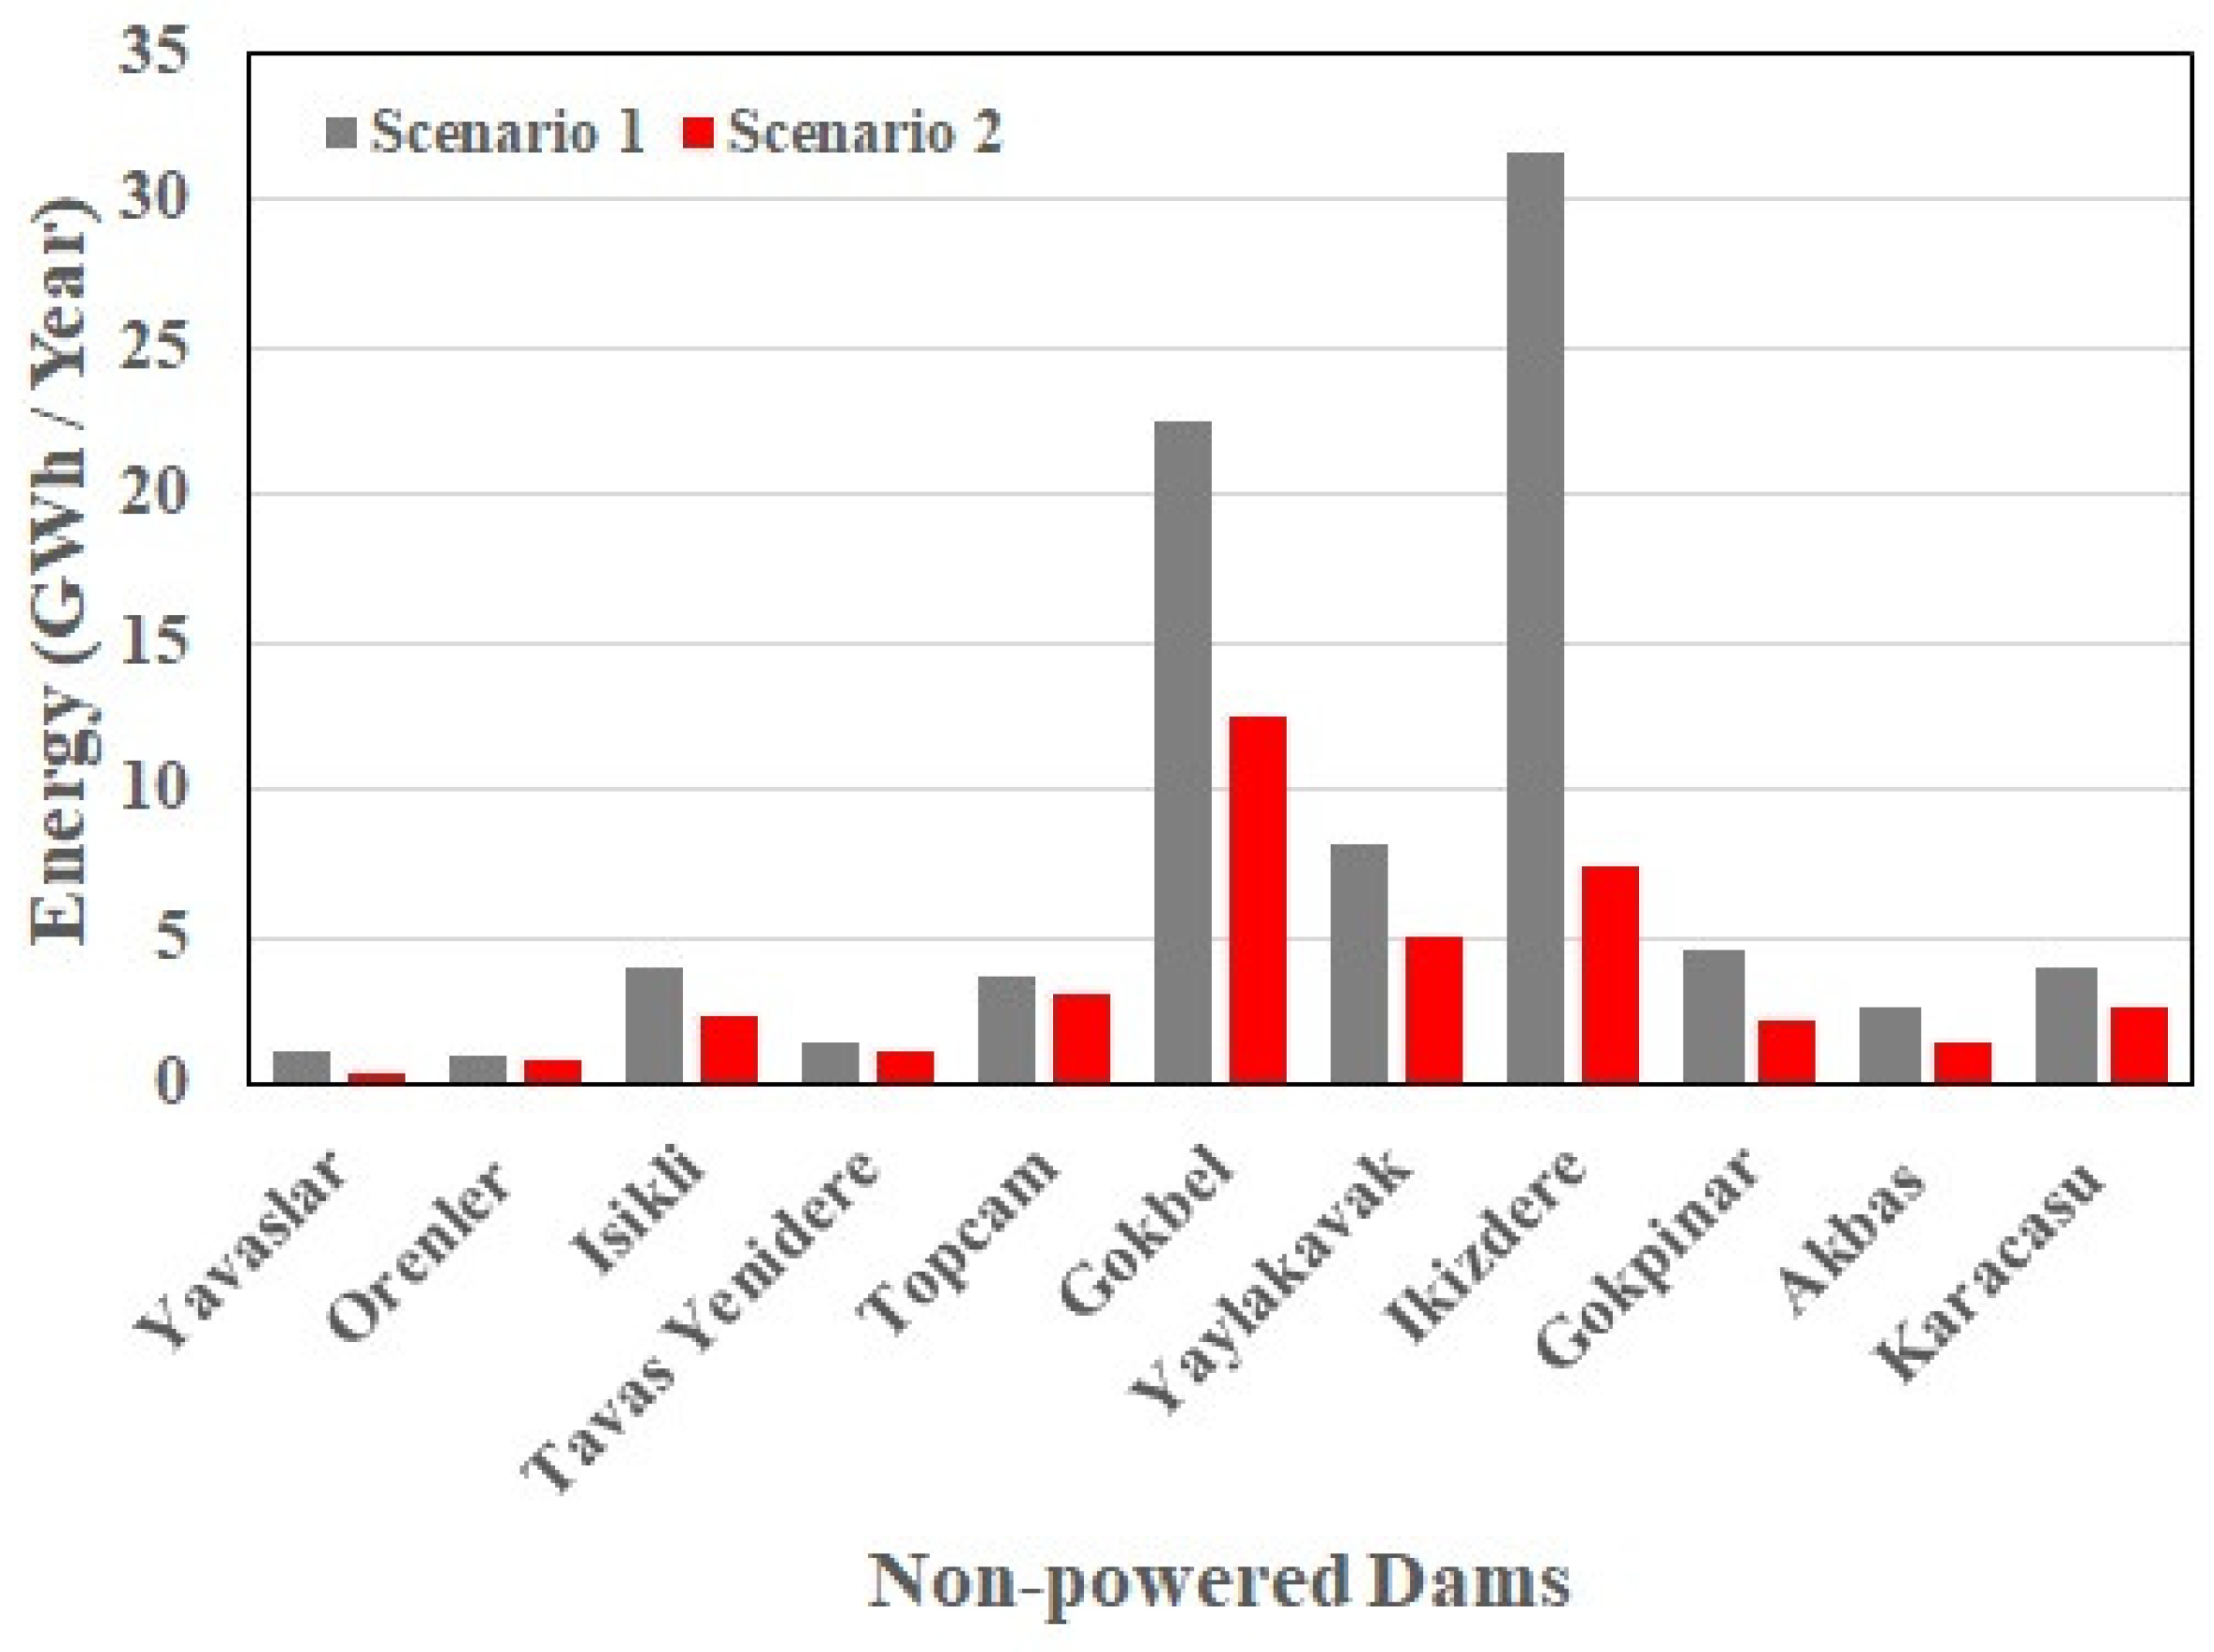
Figure 4 compares Scenario 1 and Scenario 2 for the dams under investigation and shows a total capacity of 4.4 MW (38.7 GWh) for all hydropower retrofitted dams within the basin. The hypothetical potential energy production (Scenario 1) generally exceeded the actual energy production (Scenario 2) from the NPDs. This comparison gives an idea of the capacity factors of the various NPDs in this study. Orenler dam, with a capacity factor of 0.845, was recorded as having the highest capacity factor, and Ikizdere dam, with a capacity factor of 0.23, had the lowest. The average capacity factor of all reservoirs within the basin was 0.583. The basin’s annual total hydropower retrofitting potential flow was 4.4 MW with an average capacity factor of 0.58. Table 3 presents the annual power potential for Scenario 2 and the calculated capacity factors. Gokbel recorded the highest power production at an annual production value of 1.4 MW (12.5 GWh), and Yavaslar recprded the lowest with an annual production value of 40.0 kW (0.35 GWh). The average annual power production from all dams within the basin was 402 kW (3.5 GWh).
3.3. Cost of Retrofitting
The cost of engineering equipment and materials required to retrofit these NPDs includes the cost of complete electromechanical equipment, powerhouse construction, penstock pipes, transportation, installation, and civil works. The prices of these components were retrieved from the NVE (The Norwegian Water Resources and Energy Directorate) cost base for a small hydropower project. The prices of the equipment in the NVE cost base were prices as of the year 2010, and the appropriate inflation and exchange rates were applied to convert them into their current US dollar values for the purpose of this study. The planned scheme for retrofitting was established to have pipes that tap water from the intake position, run water down and through turbines in the powerhouse located at the foot of the dam, and release the same water into the irrigation channel for irrigation purposes. To minimize head losses related to the use of the pipes in the scheme, pipe diameter optimization was performed to select pipes with optimum diameters and cost. Table 4 displays the selected pipe diameters and list of turbines for each dam and the capital investment cost for the retrofitting of the 11 dams.
3.4. Economic Analysis
Application of the economic analysis was based on Scenario 2. The capital investments, operational and maintenance costs, and power production revenue are presented in Table 5. At an estimated value of $1.8 million, Gokbel was recorded as having the highest capital investment requirement for its retrofitting project, and Yavaslar had the lowest cost, at an estimated $294 thousand. The total estimated investment cost required to execute the retrofitting projects was $7.9 million. Gokbel dam recorded the highest number of all 11 NPDs for the estimated operation and maintenance costs, $73 thousand, and it also had the highest estimated income and natural tax cost, $394 thousand. With a value of $12 thousand, Yavaslar recorded the lowest estimated annual operating and maintenance cost, as shown in Figure 5, as well as the lowest annual income and natural resource tax value, at a cost of $11 thousand. The results from the operation and maintenance cost estimation show that the total annual operation and maintenance cost for all 11 dams was $306 thousand. The total annual income and natural resource tax for all retrofitted dams was $1.2 million. At an estimated value of $1.1 million, Gokbel dam recorded the highest annual revenue from energy production, while the lowest estimated revenue was for Yavaslar at $32 thousand. The total estimated annual energy production revenue from all 11 retrofitted dams was $3.5 million.
The energy production potential for Scenario 2 of the NPDs was subjected to economic feasibility tests with the net present values, internal rate of return, and benefit–cost ratio employed as the major economic indices for decision making. Table 5 shows the net cash flow results for the NPV after running the power production business from all retrofitted dams for a total of 49 years at a discount rate of 5% and an energy price of $0.09/kWh. Gokbel dam recorded the highest NPV at a value of $9.5 million, and Yavaslar dam, the lowest NPV, $−0.144 million. The average NPV for all retrofitting projects in the basin was $2.3 million, and the total NPV of all hydropower retrofitting projects within the basin was $25.6 million. The results for the net present value show that 9 out of the 11 hydropower retrofitting projects under investigation had a positive NPV.
The highest internal rate of return (IRR) used in financial analysis to estimate the profitability of potential investments is given for each dam in Table 5. Ikizdere dam was found to have the highest IRR with a value of 38%. The lowest internal rate of return was recorded by two dams, namely Tavas Yenidere and Yavaslar, which both recorded an IRR of −4%. The average IRR for all hydropower retrofitting projects in the basin was 14.72%. The IRR results show that 2 out of the 11 hydropower retrofitting projects had negative IRR values. The benefit–cost ratio is the ratio of the total benefit to the total cost of the hydropower retrofitting projects within the basin. Ikizdere was found to have the best B/C ratio with a recorded value of 1.654, and Tavas Yenidere recorded the lowest value of 0.615. The average B/C ratio for all hydropower retrofitting projects in the basin was 1.21. The B/C ratio results indicate that the Tavas Yenidere, Orenler, and Yavaslar reservoirs all recorded values below 1.
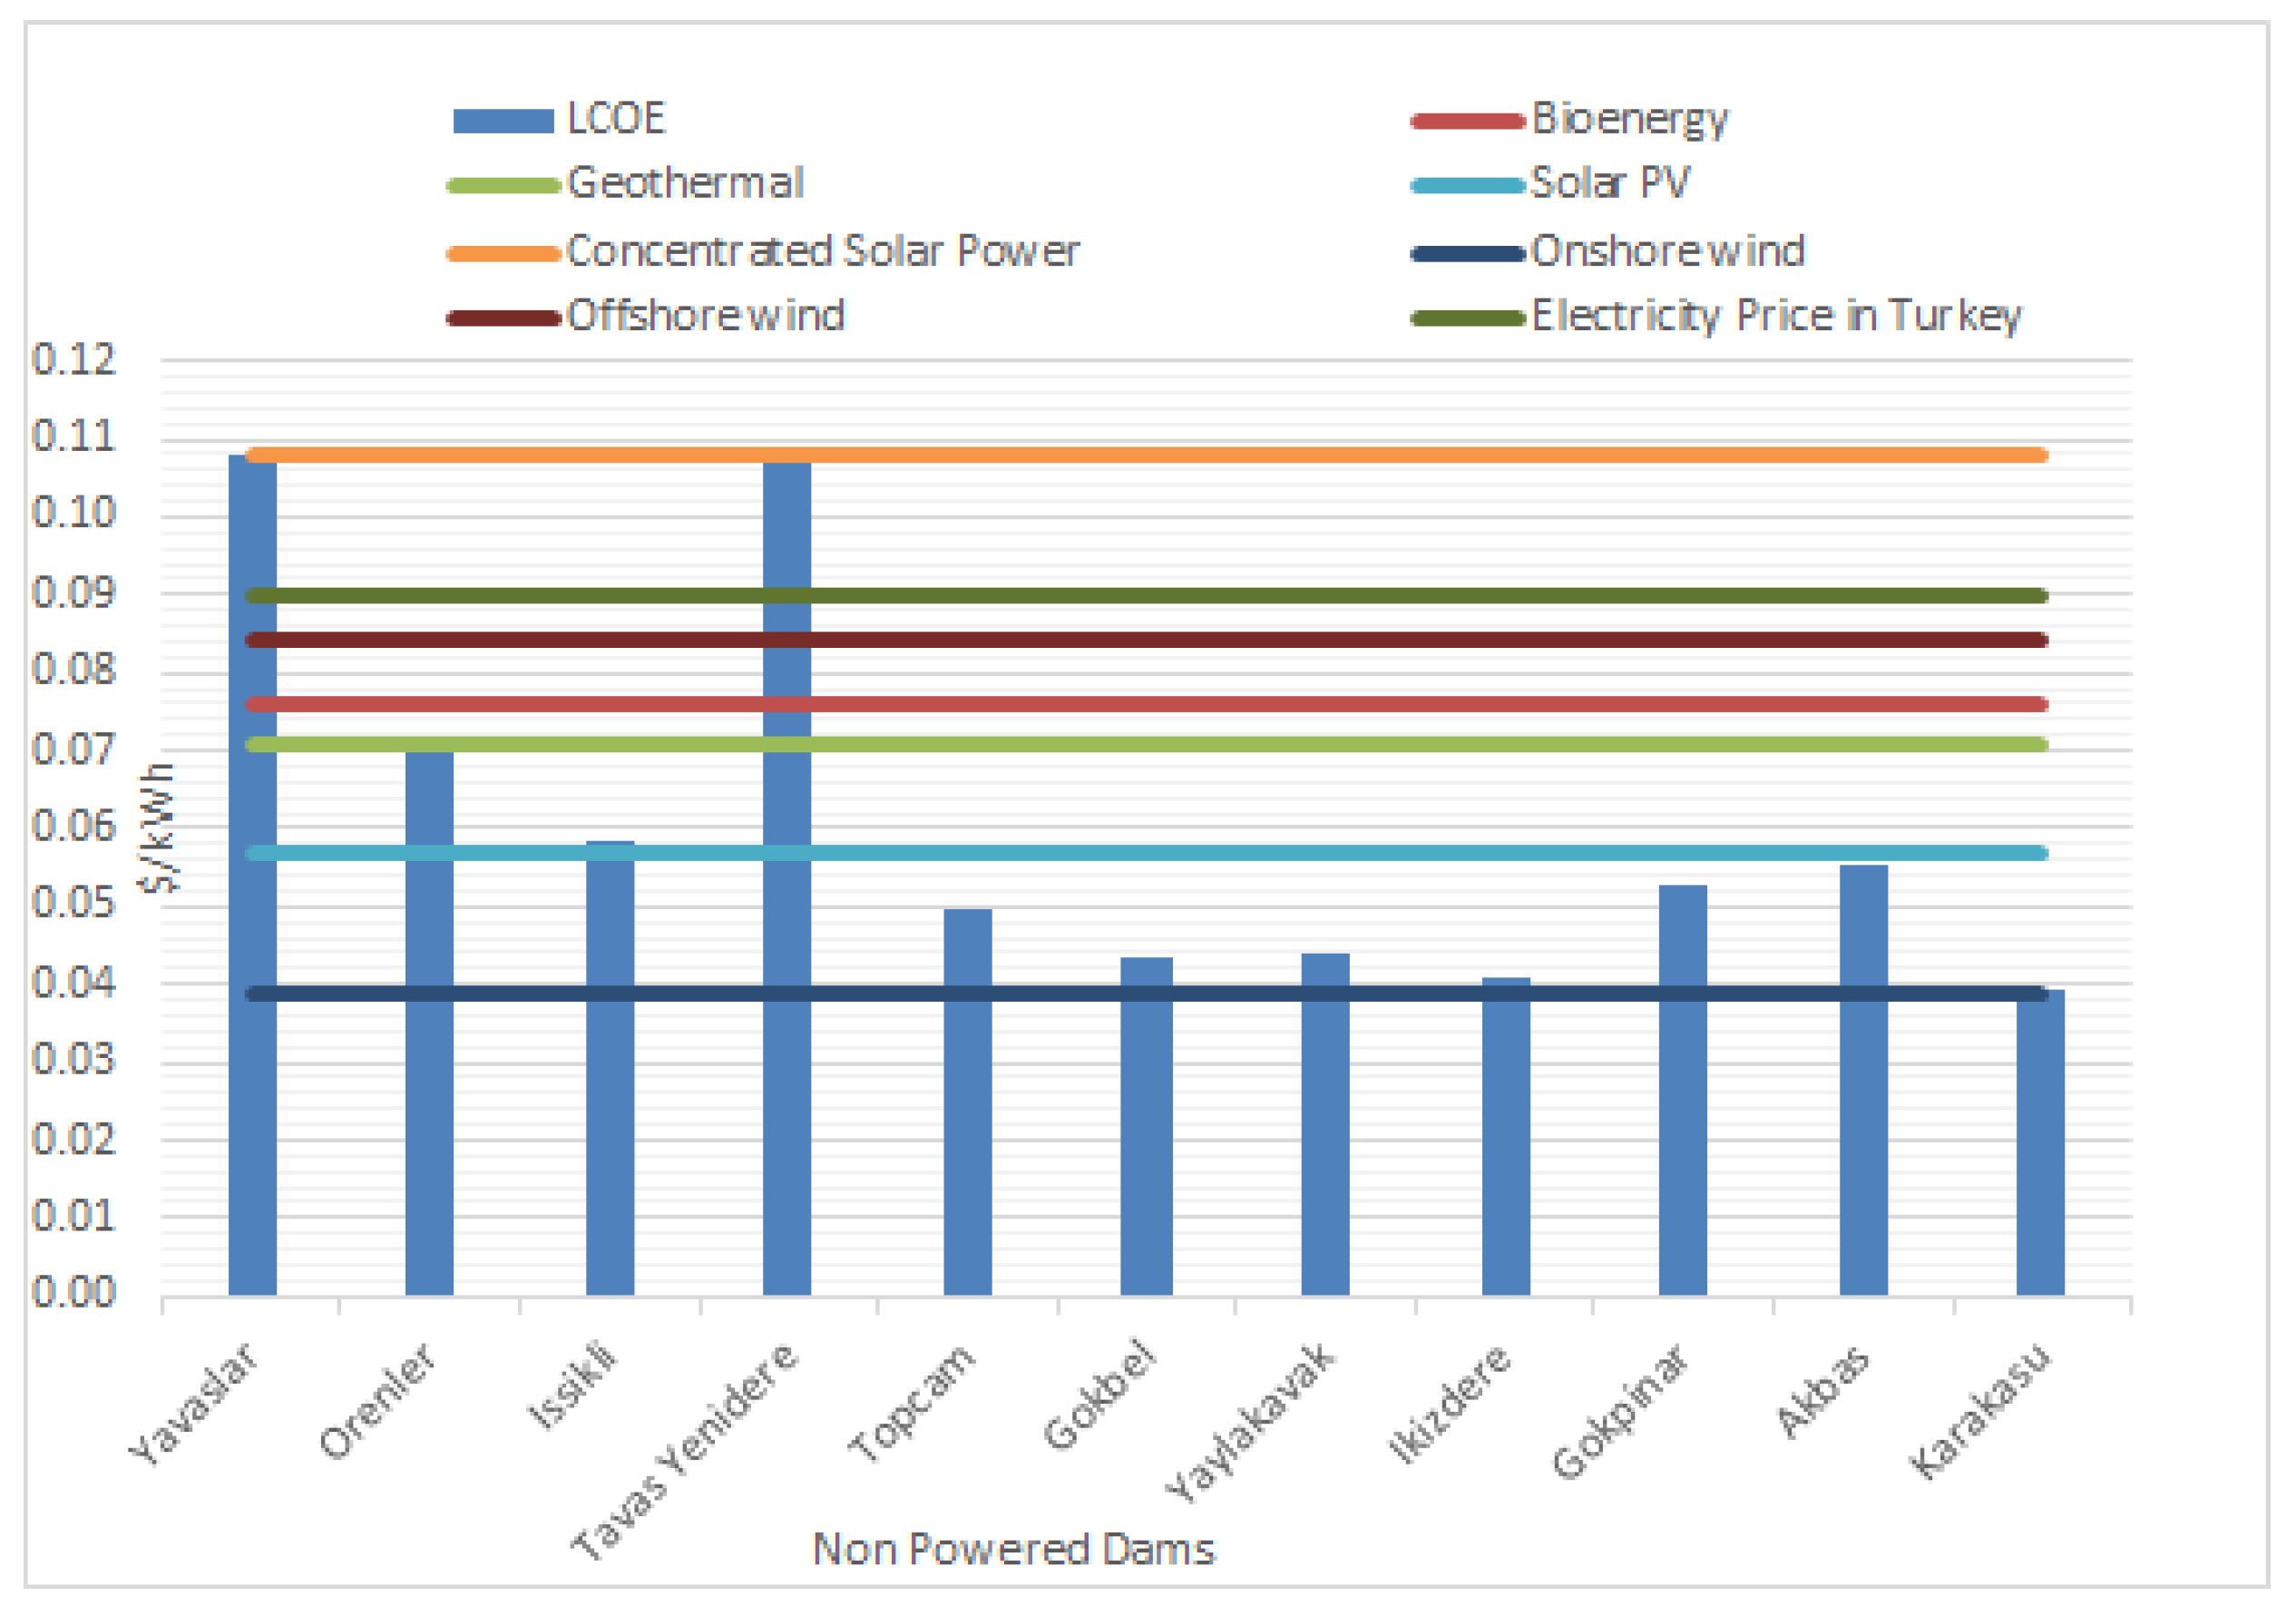
The results of the levelized cost calculation are displayed in Figure 5. The Levelized Cost of Electricity (LCOE) for the sites studied for retrofitting was compared against global values for a set renewable technologies and the electricity price in Turkey (by $0.09/kWh). The market competitiveness of the electricity produced from these dams depends on the LCOE. If the LCOE of one of the dams lies below that of another renewable power producing source, then it will be more competitive in the electricity market than that renewable energy source. The levelized cost of electricity computed for the retrofitted dams recorded the highest value for the Yavaslar dam, $0.1077/kWh, and the lowest levelized cost was recorded for the Karacasu dam, $0.03926/kWh. The average levelized cost of electricity for all 11 retrofitted dams was $0.061/kWh. It can be said that only electricity produced from the Tavas Yenidere and Yavaslar dams cannot be sold profitably in the market with an electricity price of $0.09/kWh in Turkey. The average LCOE for the 11 retrofitted projects was lower than those of renewables like bioenergy, geothermal energy, concentrated solar power, and offshore wind, whose values were retrieved from [23]. Renewable sources of energy such as solar PV and On-shore wind energy, however, have lower LCOE values of $0.057/kWh and $0.039/kWh, respectively.
4. Discussion
This study used the available data and tools to develop a methodology that calculates the retrofitting potential of NPDs within the B. Menderes basin. With this methodology, a simulation of the hydropower production for the period of available data was completed and presented for each of the NPDs. An economic analysis involving a rough estimate of the cost of retrofitting and the possible revenue generation from hydropower production was conducted to verify the economic feasibility of hydropower retrofitting in this basin.
The calibration results of various basins produced PBIAS values ranging from 0.86% to 7.6%; this indicates that all basins are well calibrated and reflect the water balance in the respective basins appropriately. The energy production simulation obtained from the model showed an annual average energy potential of 38.7 GWh and a total installed capacity of 4.42 MW for the sum of all NPDs in the B. Menderes basin, according to economic optimization.
The average LCOE for the retrofitting of all reservoirs was 0.061$/kWh, indicating that when the projects are completed as a unit, it could be a better option when compared with other renewables like bioenergy, geothermal energy, concentrated solar power, and offshore wind, and for most of the NPDs in a similar cost range, such as onshore wind. In addition, in the study of [25] for an HEPP built in Turkey, the LCOE value was calculated to be $58.4/MWh, and when compared with the results of this study, the retrofitting of NPDs appears to be an economically viable option.
With the proposed monthly irrigation flow variation, power production is dominant between November and March when irrigation is zeroed. The recharge volume of the reservoir for irrigation in the next planting season is therefore reduced, and this was evident by the unmet irrigation demands in various sub-basins. The average unmet irrigation demand within the basin was 79 million m, translating to 16 thousand hectares of unirrigated land in a year. The economic implications of agricultural losses linked to water scarcity caused by hydropower retrofitting represent a possible obstacle to the successful implementation of these retrofitting projects.
The results suggest that the total cost of executing these retrofitting projects could be $7.9 million. The capital costs for the most and least expensive retrofitting projects were about $1.8 million and $294 thousand, respectively. The net present value of all retrofitting projects, when operated for a 49-year period at a discount rate of 5%, was $25.6 million. The average internal rate of the return and benefit–cost ratio for all retrofitting projects were 14.72% and 1.53, respectively.
Setting appropriate flow requirements for the conditions is essential to ensure a minimum habitat standard within the river and thus, to some extent, maintain ecological qualities. For each dam, minimum flow values were set for each of three quarters in a year. The flow values with the probability of being exceeded 95% of the time in the respective quarters of the year were chosen as the minimum flows for the dams. The total minimum flow release from all reservoirs was 68 million m. With the different energy equivalents of the reservoir in the basin, the annual cost of releasing the minimum flow was $293 thousand. A comparison of the cost of sustaining the river ecology by minimum flow release and the total annual power production revenue of $3.5 million suggests that the minimum flow release will have no serious financial implications on the running of the retrofitting projects in the basin. It could therefore be suggested that the cost of the minimum flow is not an economic obstacle that impedes the execution of these retrofitting projects. The main unmet demands within the different sub-basins were the irrigation and drinking water demands. Out of the 27 demand points in this study, 13 points in a particular hydrological basin registered unmet demands. For a valid analysis of the registered levels of unmet demands within the basin, all irrigation unmet demands were separated from unmet drinking water demands.
The sum of the average unmet water demand for the 10 irrigation nodes of concern in the basin was 79 million m. This volume of unavailable water suggests that, in a typical dry year, 17 thousand out of a total of 56 thousand hectares needing irrigation will be without irrigation water for the whole year. The results indicate that about 30% of the land scheduled for irrigation will have unmet water needs for a year. From the results, it could be suggested that the sub-basins of these 10 irrigation demand nodes are prone to water scarcity issues. An average water scarcity of 30% within these sub-basins could translate to serious agricultural economic losses, creating a potential obstacle to the execution of the retrofitting projects. The retrofitting of the Topcam, Yaylakavac, Karacasu, Ikizdere, Isikli, Yavaslar, and Orenler reservoirs may, to some extent, be affected by this unmet demand experienced within the sub-basins of concern. An optimized power production scheme that minimizes power production water use and increases benefits could be put into play to make more water available for the irrigation season. A possible solution to the unmet demand caused by hydrologically induced water scarcity may be to cultivate crops with lower irrigation water needs but higher economic return in water-scarce areas.
The unmet drinking water demands simulated by the model suggest that the drinking water demands in the Cine, Dandalas, and Ikizdere sub-basins are unmet. These demands may be attributed to the population size and water availability. The unmet drinking water demand is highest in Ikizdere, suggesting an excessive population for the water resources available. Another reason could be that the water availability is, on average, very low in the sub-basin. The total average volume of unmet drinking water demand in the basin was found to be 8 million m. The absence of this volume of water suggests that about 413 thousand of the 1.2 million people in the area will not be able to access water for a year. The drinking water flow release is set to be equal for each month of regulation. This means that drinking water is released to a demand point every month. The continuous monthly release of the drinking water supply suggests that hydropower production, a secondary priority in the model, will have a minimal connection to these unmet drinking water demands. The drinking water scarcity of the three demand points translates to 36%. The drinking water scarcity results indicate that the sub-basins are very critical and require a high level of attention in water resource planning. The uncertainty in the population data input for each of the drinking water demand points could also be a cause of this high level of unmet demand. Possible mitigation measures to curb drinking water scarcity include investment in groundwater schemes. Aquifers could be a solution, but attention should be given to the water stress index within the sub-basins.
Ref. [26] calculated the project target and the maximum and minimum energy production values of the HEPPs commissioned in the B. Menderes basin, finding the average production rate in the basin to be 68%. In other words, there is a big difference between actual electricity production and the annual planned energy production of the power plants built in the B. Menderes basin. Based on a study included in the [27] report that was conducted on 259 river and canal power plants in Turkey between 2015 and 2018, the ratio of realized energy production to planned energy production was 60% on average, and a survey of the production in dam HEPPs revealed that, on average, 75% of the planned production had been realized. This shows that the difference in energy production in the B. Menderes basin is higher than the national average. In particular, a very low energy production efficiency was found for run-of-the-river, nonstorage HEPPs compared with HEPPs with storage, which is due to them being dependent on the hydrology of the project and hydrometeorological data in daily precipitation; therefore, it can be said that drought, in particular, directly affects electricity production [26]. Many projects have been designed with careless and insufficient engineering hydrology, incomplete data, and no integrated watershed planning approach [26]. In particular, there are many rapidly built small dams and HEPPs that lead to inefficient use of water resources and even the drying up and disappearance of streams.
Hydroelectric energy investment is increasing rapidly in Turkey, and in accordance with a report by the [14], the B. Menderes basin has a power potential of 913.31 GWh, including existing and planned projects. Due to issues with regard to irrigation water distribution to the lower parts of the basin, some of the planned projects have been abandoned, reducing the energy potential to 862 GWh. The energy provided by these retrofitting projects could replace some of the energy lost from the canceled hydropower projects in the basin. The energy potential in the basin could possibly rise to 900.77 GWh with investment in these projects. A total of 13 new hydropower projects have been planned at different locations within the B. Menderes basin [27], with a total energy production of 106.89 GWh and a capacity of 21.3 MW. Investment in these retrofitting projects could provide the basin with 39% of this planned energy supply at a relatively cheap cost and with minimum environmental impact. The possible future scenarios for these investments in Turkey, however, have not been scientifically analyzed. There has been no consideration of the energy potential of existing storage dams. Re-evaluating existing storage and NPDs and updating the operating program and generation strategy will increase the sustainability of the project’s benefits.
5. Conclusions
There is a total annual inflow volume of 349 million cubic meters of water in reservoirs not used for hydropower in the Büyük Menderes River basin. This volume of water represents a significant water resource that could be used for power generation. The results of this study show that the annual average hydropower generation potential and installed capacity for the selected 11 NPDs are 38.7 GWh/year and 4.4 MW, respectively. Based on the annual energy per capita value for Turkey (2740 kWh/year), the energy produced from all of the retrofitting projects included in this study could provide total annual energy needs for approximately 14 thousand people within the basin. The total estimated capital investment cost of all 11 retrofitting projects was computed to be $7.9 million, including the costs of purchasing and installing the complete set of electromechanical equipment, penstock, and powerhouse. The estimated total annual revenue from operating these retrofitted dams is $3.5 million. The total NPV from operating these retrofitted dams for a period of 49 years at a discount rate of 5% was determined to be $25.6 million, indicating that, if all projects are executed together, they will be profitable. Some other remarkable results obtained within the scope of this study are as follows:
- By investing in these retrofitting projects, Turkey could avoid the release of about 276,447 ton of CO into the atmosphere over a 49-year period of operation. With the results of this study, attention can be drawn to the hydroelectric potential of existing dams, a renewable energy source with less environmental impact.
- The economic impacts of agricultural losses from water scarcity caused by hydropower can be a potential barrier to the successful implementation of these retrofitting projects.
- As a result of the comparison of the minimum flow release with the cost of maintaining the river ecology and the total annual electricity generation income, it was shown that the minimum flow cost is not an economic barrier to the implementation of these projects.
The promising results of this study will hopefully draw more attention to the hidden hydropower potential of the existing infrastructure and thus provide a cost-effective renewable energy source. In order to increase capacity and optimize investments in hydropower, a series of studies/research on the retrofit potential of NPDs in Turkey need to be conducted, focusing particularly on the competitiveness of the electricity produced. In addition, the following issues should be considered for future studies on the retrofitting potential of existing dams:
- Analysis of climate change and the impact of data from different climates on the retrofitting potential.
- Investigation of the retrofitting potential including groundwater data.
- The development of technical guidelines for retrofitting with equipment to be used in the dam based on dam type, dam size, and new technologies.
- Investigation of socioeconomic, environmental, and legal barriers to the retrofitting of NPDs by considering the legislative aspect.
Author Contributions
The majority of the study was carried out for the Master’s thesis of Q.A.O. as part of the Master’s program on hydropower development at NTNU, under the supervision of A.B. and T.H.B., Q.A.O. was responsible for carrying out the study, which included processing input data, setting up the software for simulation, interpretation of the results, and production of the majority of the figures. A.B. was responsible for data collection, the interpretation and validation of data and results, and writing and editing of the manuscript. T.H.B. was responsible for the development of the retrofitting concept, outlining the design of the study, and reviewing the manuscript. All authors have read and agreed to the published version of the manuscript.
Funding
The study was carried out as part of NTNU’s ordinary educational program and did not receive any external funding.
Data Availability Statement
The data that support the findings of this study are available from the [DSI (General Directorate of State Hydraulic Works), Department of Survey, Planning, and Allocations, Environment Branch Directorate] but restrictions apply to the availability of these data, which were used under license for the current study and are not publicly available. Data are, however, available from the authors upon reasonable request and with permission of the [DSI (General Directorate of State Hydraulic Works)].
Acknowledgments
The authors would like to thank the DSI (General Directorate of State Hydraulic Works), Deputy Director of DSI 21st Regional Directorate Nevzat Tatar for providing the data.
Conflicts of Interest
The authors declare no conflict of interest.
Abbreviations
The following abbreviations are used in this manuscript:
| DSI | General Directorate of State Hydraulic Works in Turkiye |
| HEPP | Hydroelectric power plant |
| ICOLD | International Commission on Large Dams |
| IEA | International Energy Agency |
| NPD | Non-powered dam |
| NVE | Norwegian Water Resources and Energy Directorate |
| WEAP | Water Evaluation and Planning |
References
- Tortajada, C. Water infrastructure as an essential element for human development. Int. J. Water Resour. Dev. 2014, 30, 8–19. [Google Scholar] [CrossRef]
- IEA. Net Zero by 2050 A Roadmap for the Global Energy. 2021. Available online: https://www.iea.org/reports/net-zero-by-2050 (accessed on 22 December 2022).
- World Commission of Dams. Dams and Development—A New Framework; The Report of the World Commission of Dams; World Commission of Dams: London, UK, 2020; ISBN 1-85383-798-9. [Google Scholar]
- IPBES. Summary for Policymakers of the Global Assessment Report on Biodiversity and Ecosystem Services of the Intergovernmental Science-Policy Platform on Biodiversity and Ecosystem Services; IPBES Secretariat: Bonn, Germany, 2019; 56p. [Google Scholar] [CrossRef]
- Hansen, C.; Musa, M.; Sasthav, C.; DeNeale, S. Hydropower development potential at non-powered dams: Data needs and research gaps. Renew. Sustain. Energy Rev. 2021, 145, 111058. [Google Scholar] [CrossRef]
- International Commission on Large Dams. World Register of Dams; International Commission on Large Dams ICOLD-CIGB: Paris, France, 2019. [Google Scholar]
- Duncan, B.; Grubb, M.; Windram, C. International Trade and Climate Change Policies; Earthscan: London, UK, 2020. [Google Scholar]
- Rodriguez, H.R.; Helgenberger, S.H.; Ertör, P.E.; Nagel, L.N. (Eds.) Securing Turkey’s Energy Supply and Balancing the Current Account Deficit through Renewable Energy Assessing the Co-Benefits of Decarbonising the Power Sector; COBENEFITS: Potsdam, Germany, 2020. [Google Scholar]
- IEA—Turkey. Turkey 2021 Energy Policy Review. 2021. Available online: https://www.iea.org/reports/turkey-2021 (accessed on 22 December 2022).
- Fjøsne, N.R.; Bakken, T.H. Potential from retrofitting non-powered dams for hydro production. Int. J. Hydropower Dams 2021, 28. [Google Scholar]
- Al-Shnynat, N. Challenges of integrating a small hydropower plant at existing Mujib Dam. Eur. J. Electr. Eng. 2018, 20, 181–191. [Google Scholar] [CrossRef]
- Van Vuuren, S.J.; Blersch, C.L.; Van Dijk, M. Modelling the feasibility of retrofitting hydropower to existing South African dams. In Proceedings of the Water Research Commission 40-Year Celebration Conference, Kempton Park, South Africa, 31 August–1 September 2011; Volume 37, pp. 679–692. [Google Scholar]
- Hadjerioua, B.; Wei, Y.; Kao, S.C. An Assessment of Energy Potential at Non-Powered Dams in the United States. Oak Ridge Natl. Lab. 2012, 37, 679–692. [Google Scholar]
- DSI Master Plan. Büyük Menderes Basin Master Plan Report. Alter and Akarsu. 2019.
- Yates, D.; Sieber, J.; Purkey, D.; Huber-Lee, A. WEAP21—A Demand-, Priority-, and preference-driven water planning model. Water Int. 2005, 30, 487–500. [Google Scholar] [CrossRef]
- WEAP Tutorial. Water Evaluation And Planning System Tutorial—A Collection of Stand-Alone Modules to Aid in Learning the WEAP Software. 2016. Available online: https://www.weap21.org/index.asp?action=213 (accessed on 22 December 2022).
- Eryani, I.G.A.P.; Jayantari, M.W.; Wijaya, I.K.M. Sensitivity analysis in parameter calibration of the WEAP Model for integrated water resources management in Unda watershed. Civ. Eng. Archit. 2022, 10, 455–469. [Google Scholar] [CrossRef]
- Allen, R.G.; Pereira, L.S.; Raes, D.; Smith, M. Crop Evapotranspiration-Guidelines for Computing Crop Water Requirements-FAO Irrigation and Drainage Paper 56; Food and Agriculture Organization of the United Nations: Rome, Italy, 1998; ISBN 92-5-104219-5. [Google Scholar]
- Moriasi, D.N.; Arnold, J.G.; Van Liew, M.W.; Bingner, R.L.; Harmel, R.D.; Veith, T.L. Model evaluation guidelines for systematic quantification of accuracy in watershed simulations. Trans. ASABE 2007, 50, 885–900. [Google Scholar] [CrossRef]
- SWECO Norge AS. Cost Base for Small-Scale Hydropower Plants (<10,000 kW); Norwegian Water Resources and Energy Directorate: Oslo, Norway, 2012.
- Norwegian Water Resources and Energy Directorate. The Norwegian Water Resources and Energy Directorate Report; Norwegian Water Resources and Energy Directorate: Oslo, Norway, 2010.
- Bloomberg, L.P. Turkey Significantly Raises Electricity, Natural Gas Prices; Bloomberg: New York, NY, USA, 2022. [Google Scholar]
- International Renewable Energy Agency. Renewable Power Generation Costs in 2020; International Renewable Energy Agency: Abu Dhabi, United Arab Emirates, 2021; ISBN 978-92-9260-348-9.
- Bakken, T.H.; Sundt, H.; Ruud, A.; Harby, A. Development of small versus large hydropower in Norway comparison of environmental impacts. Energy Procedia 2012, 20, 185–199. [Google Scholar] [CrossRef]
- Bor, A.; Uctug, F.G. Environmental and economic life cycle assessment of a run-of-the-river type hydroelectricity power plant in Turkey. Environ. Prog. Sustain. Energy 2021, 41, 1058–1071. [Google Scholar] [CrossRef]
- Koc, C. A study on solutions and problems of hydroelectric power plants in the operation. Sustain. Water Resour. Manag. 2022, 8, 90. [Google Scholar] [CrossRef]
- SPD Hidropolitik Akademi. Hidroenerji Raporu Yekdem’e Kayıtlı HES’lerin Üretim Verimliliği, Su Politikaları Derneği; Rapor No: 2019-2, Kavaklıdere-Ankara, s.28; SPD Hidropolitik Akademi: Ankara, Türkiye, 2019. [Google Scholar]
Figure 1.
Map of the B. Menderes River Basin as configured in WEAP.

Figure 2.
Calibration Results for the (a) Kufi; (b) Curusku; (c) Cine; (d) Ikizdere; (e) Dandalaz; and (f) Tavas Yenidere sub-basins.
Figure 2.
Calibration Results for the (a) Kufi; (b) Curusku; (c) Cine; (d) Ikizdere; (e) Dandalaz; and (f) Tavas Yenidere sub-basins.

Figure 3.
Annual maximum and average energy production for Scenario 1 of the 11 NPDs.

Figure 4.
Comparison of the annual average energy production of 11 NPDs.

Figure 5.
Levelized Cost of Electricity for Retrofitted Reservoirs.


Table 1.
Characteristics of B. Menderes River Basin.
| Basin Properties | |
|---|---|
| Drainage area | 2500 km |
| Annual average precipitation | 633 mm |
| Annual average temperature | 15.6 |
| Total water potential | 3,649,854 hm/year |
| Total agricultural irrigation area | 1,231,520 ha |
| Total amount of irrigation water provided from dams and ponds | 1573 hm |
| Total amount of drinking water provided from dams and ponds | 402 hm |
Table 2.
Energy Specifications of the 11 NPDs.
| Dam | Outflow (m/s) | Head (m) | Annual Average Flow (hm) | Energy Equivalent (kWh/m) |
|---|---|---|---|---|
| Yavaslar | 1.50 | 37.00 | 11.84 | 0.09 |
| Orenler | 1.75 | 19.85 | 19.16 | 0.05 |
| Isikli | 20.00 | 6.40 | 250.00 | 0.02 |
| Tavas Yenidere | 2.18 | 40.62 | 15.00 | 0.10 |
| Topcam | 3.00 | 54.15 | 28.00 | 0.13 |
| Gokbel | 16.00 | 37.10 | 246.60 | 0.09 |
| Yaylakavak | 2.90 | 68.50 | 48.80 | 0.17 |
| Ikizdere | 2.00 | 95.80 | 134.70 | 0.24 |
| Gokpinar | 2.77 | 41.20 | 45.22 | 0.10 |
| Akbas | 0.75 | 68.25 | 16.00 | 0.17 |
| Karacasu | 1.10 | 53.20 | 30.00 | 0.13 |
Table 3.
Annual power potential and the capacity factors for the NPDs.
| NPD | Potential [GWh/Year] | Capacity Factor |
|---|---|---|
| Yavaslar | 0.35 | 0.33 |
| Orenler | 0.79 | 0.85 |
| Isikli | 2.27 | 0.58 |
| Tavas Yenidere | 1.08 | 0.72 |
| Topcam | 3.06 | 0.82 |
| Gokbel | 12.50 | 0.56 |
| Yaylakavak | 4.99 | 0.61 |
| Ikizdere | 7.34 | 0.24 |
| Gokpinar | 2.22 | 0.49 |
| Akbas | 1.50 | 0.56 |
| Karacasu | 2.64 | 0.68 |
Table 4.
Optimized Penstock Diameter, Capital Cost, and Turbine Type for the NPDs.
| Dam | Optimised Penstock Diameter (m) | Capital Cost (Mil $) | Turbine Type |
|---|---|---|---|
| Yavaslar | 0.84 | 0.29 | Francis |
| Orenler | 1.02 | 0.36 | Kaplan |
| Isikli | 3.00 | 0.71 | Kaplan |
| Tavas Yenidere | 1.10 | 0.93 | Francis |
| Topcam | 1.28 | 0.66 | Francis |
| Gokbel | 2.75 | 1.82 | Francis |
| Yaylakavak | 1.21 | 0.76 | Francis |
| Ikizdere | 0.90 | 0.87 | Francis |
| Gokpinar | 0.66 | 0.54 | Francis |
| Akbas | 0.68 | 0.41 | Francis |
| Karacasu | 0.80 | 0.54 | Francis |
Table 5.
Economic key numbers and indicators for the retrofitting of the NPDs.
| Dam | Capital Cost (Mil $) | Operation and Maintenance Cost (Mil $) | Annual Natural Resource Tax (Mil $) | Annual Revenue (Mil $) | LCOE ($/kWh) | IRR(%) | NPV (Mil $) | B/C Ratio |
|---|---|---|---|---|---|---|---|---|
| Yavaslar | 0.29 | 0.47 | 0.44 | 1.26 | 0.108 | −4.00 | −0.14 | 0.80 |
| Orenler | 0.36 | 0.58 | 0.99 | 2.84 | 0.072 | 3.00 | 0.18 | 1.18 |
| Isikli | 0.71 | 1.13 | 2.86 | 8.17 | 0.059 | 9.00 | 1.09 | 1.45 |
| Tavas Yenidere | 0.93 | 1.48 | 1.36 | 3.88 | 0.109 | −4.00 | −0.48 | 0.78 |
| Topcam | 0.66 | 1.05 | 3.86 | 11.02 | 0.050 | 17.00 | 1.96 | 1.71 |
| Gokbel | 1.82 | 2.91 | 15.75 | 45 | 0.043 | 30.00 | 9.48 | 1.96 |
| Yaylakavak | 0.76 | 1.21 | 6.28 | 17.95 | 0.044 | 28.00 | 3.73 | 1.94 |
| Ikizdere | 0.87 | 1.39 | 9.25 | 26.42 | 0.041 | 38.00 | 5.90 | 2.09 |
| Gokpinar | 0.54 | 0.87 | 2.8 | 7.99 | 0.053 | 14.00 | 1.31 | 1.62 |
| Akbas | 0.41 | 0.66 | 1.89 | 5.4 | 0.055 | 12.00 | 0.81 | 1.54 |
| Karacasu | 0.54 | 0.54 | 2.58 | 9.04 | 0.039 | 19.00 | 1.74 | 1.74 |
Disclaimer/Publisher’s Note: The statements, opinions and data contained in all publications are solely those of the individual author(s) and contributor(s) and not of MDPI and/or the editor(s). MDPI and/or the editor(s) disclaim responsibility for any injury to people or property resulting from any ideas, methods, instructions or products referred to in the content. |
© 2023 by the authors. Licensee MDPI, Basel, Switzerland. This article is an open access article distributed under the terms and conditions of the Creative Commons Attribution (CC BY) license (https://creativecommons.org/licenses/by/4.0/).
Share and Cite
MDPI and ACS Style
Okang, Q.A.; Bakken, T.H.; Bor, A. Investigation of the Hydroelectric Development Potential of Nonpowered Dams: A Case Study of the Buyuk Menderes River Basin. Water 2023, 15, 717. https://doi.org/10.3390/w15040717
AMA Style
Okang QA, Bakken TH, Bor A. Investigation of the Hydroelectric Development Potential of Nonpowered Dams: A Case Study of the Buyuk Menderes River Basin. Water. 2023; 15(4):717. https://doi.org/10.3390/w15040717
Chicago/Turabian StyleOkang, Quentin Adjetey, Tor Haakon Bakken, and Aslı Bor. 2023. "Investigation of the Hydroelectric Development Potential of Nonpowered Dams: A Case Study of the Buyuk Menderes River Basin" Water 15, no. 4: 717. https://doi.org/10.3390/w15040717
Note that from the first issue of 2016, this journal uses article numbers instead of page numbers. See further details here.