
Evaluation of Water Resources Utilization Efficiency Based on DEA and AHP under Climate Change
1
State Key Laboratory of Simulation and Regulation of Water Cycle in River Basin, China Institute of Water Resources and Hydropower Research, Beijing 100038, China
2
College of Hydrology and Water Resources, Hohai University, Nanjing 210098, China
*
Author to whom correspondence should be addressed.
Water 2023, 15(4), 718; https://doi.org/10.3390/w15040718
Submission received: 29 December 2022
/
Revised: 4 February 2023
/
Accepted: 9 February 2023
/
Published: 11 February 2023
(This article belongs to the Special Issue Climate Change Impacts on Land Surface, Hydrological Processes and Water Management)
Abstract
:In the context of climate change, the problem of water scarcity is becoming increasingly serious, and improving the efficiency of water resources use is an important measure to alleviate this problem. The evaluation of water resources utilization efficiency has become the basis of water resource management. Data envelopment analysis (DEA) and analytic hierarchy process (AHP) are widely used in the evaluation of water resources utilization efficiency. However, one of these methods is mostly used for evaluation, which cannot reflect the influence of both objective and subjective factors. Therefore, in this study, we propose a water resources utilization efficiency index (WEI) to evaluate the water resources utilization efficiency of each region in the Tumen River Basin (TRB), combining both DEA and AHP methods. Firstly, the DEA-CCR model was used to quantify domestic, agricultural and industrial water use efficiency in the TRB. The DEA-BCC model was used to analyze the main influences on water use efficiency in each sector. Secondly, the WEI was constructed by assigning weights using the AHP model based on the importance of each water use sector. The results show that the WEI values for most areas within the TRB trended upwards between 2014 and 2019. In particular, domestic water use efficiency ranged from 0.294 to 0.775, while agricultural and industrial water use efficiency ranged from 0.039 to 0.054 and 0.031 to 0.375, respectively. Technical efficiency is the main factor influencing water use efficiency in TRB. This study could provide a basis for water resource management and mitigation of water scarcity in the context of climate change.
1. Introduction
The problem of water shortage has received much attention from the international community. Additionally, the contradiction between water supply and water demand has become increasingly serious due to climate change and human activities, which affects sustainable social and economic development [1,2]. On the one hand, surface water is showing a decreasing trend due to the influence of climate change and human activities [3]. On the other hand, both natural processes and anthropogenic activities are important influencing factors causing water quality deterioration [4]. Although China has relatively abundant total water resources, the water resource problem is particularly prominent and complex due to the large population and the uneven distribution of water resources in time and space [5,6]. Therefore, improving the efficiency of water resource utilization has gradually become a research hotspot, especially for domestic, agricultural and industrial purposes [7,8,9]. The efficiency of water resource utilization is the basis for understanding the current situation and developing more efficient water resource utilization.
As climate change exacerbates the risk of water scarcity, more and more researchers are focusing on water resource management in the context of climate change to promote the synergistic and sustainable development of water resources and socio-economic conditions. Some studies have shown that climate change exacerbates the risk of water scarcity in terms of both water supply and water demand and have explored synergistic urban water management pathways in this context [10]. Some researchers have suggested that the impact of climate change on the spatial and temporal distribution of water resources cannot be ignored in the development of water resource management systems and strategies to improve the efficiency of water use [11]. Many countries have also begun to focus on water management under climate change scenarios, implementing adaptive water management strategies to improve water use efficiency while coping with weather extremes [12,13]. It can be seen that water resource management is an important tool to mitigate water scarcity in the context of climate change. Improving the efficiency of water resource utilization is one of the most effective and least costly means of water resource management. In addition, the impact of climate change cannot be ignored while improving water resource utilization efficiency.
In recent years, the efficiency of water resource utilization has received a lot of attention from researchers. A multi-objective stochastic fuzzy programming method has been proposed to optimize the allocation of agricultural soil and water resources and to improve the efficiency of irrigation water use [14]. Tan and Zhang developed a robust fractional programming (RFP) method to improve the efficiency of agricultural water use under uncertain conditions [15]. Ali proposed a knowledge-based optimization model to optimize the location and control of valves to reduce industrial water supply system leakage and improve the efficiency of water resource utilization [16]. The abovementioned studies mainly focus on improving the efficiency of water use in a certain area. In addition, there are also studies on improving the overall regional water use efficiency by optimizing the water use structure and spatial layout [17,18,19].
Additionally, several governments and international organizations have proposed water management measures, policies and regulations to improve water resource utilization efficiency. The Mediterranean Strategy for Sustainable Development (MSSD) includes a policy to enhance water demand management (WDM) to improve water use efficiency [20]. The state of California has incorporated water distribution efficiency into its water management indicators [21]. The most stringent water resource management policy proposed by China has played an important role in alleviating water shortages and ensuring water supply security and the sustainable development of water resources and has significantly improved water resource utilization efficiency [22]. A reasonable evaluation of water resource utilization efficiency is the basis of water resource management.
Water resource utilization efficiency is an important indicator to evaluate the level of water use in a region. Due to different concerns, there are many definitions of water resource utilization efficiency. From the perspective of water environment and economy, water resource utilization efficiency is defined as the comprehensive efficiency that reflects economic benefits and water pollution in the process of economic production [23]. Some researchers believe that water resource utilization efficiency refers to the ability to minimize the input of water resources under output [24]. In this study, we define water use utilization efficiency as the economic, social and ecological benefits generated by a unit of water resources in a region. Depending on the sector of water use, water use efficiency can be classified as agricultural water use efficiency, industrial water use efficiency, domestic water use efficiency, etc. Therefore, there are many evaluation index of water resources utilization efficiency, and water consumption per unit output value is often used in water resource management, such as water consumption per 104 CNY of industrial added value, irrigation water consumption per haand water consumption per unit GDP [25,26]. The above indicators mainly consider the single use of water.
In addition, researchers have also proposed evaluation methods of water resource efficiency. The main methods are fuzzy comprehensive evaluation (FCE), water footprint, analytic hierarchy process (AHP), data envelopment analysis (DEA), etc. [27,28]. The AHP is a multi-criteria decision-making method for quantitative evaluation, which can effectively combine subjective factors with objective judgments [29]. Abed-Elmdoust and Kerachian combined the analytic hierarchy process to build a water efficiency rating index system to quantify the relative power of water users [30]. Poveda-Bautista et al. proposed a new synthetic irrigation efficiency index based on AHP to evaluate irrigation water efficiency [31]. Although the AHP method is widely used in the evaluation of water resource utilization efficiency, the subjective decision of people has a great impact on the results, and it is difficult to carry out strict mathematical demonstrations and interpretations. On the contrary, DEA is a cost-parameter method of comprehensive evaluation and analysis. The analysis results are objective and widely used in the efficiency evaluation of various industries, including water resource utilization efficiency evaluation [32,33]. Yang and Li used the DEA-SBM model to evaluate the total factor efficiency of water resources and energy resources in China’s provinces [34]. Yang used a data envelopment analysis Tobit (DEA-Tobit) two-stage model to evaluate the utilization efficiency of water resources in China [35].
The Tumen River Basin (Chinese side, TRB) is located at the border between China, North Korea and Russia, and the Tumen River is the border river between China and North Korea. Therefore, the management of water resources in this area is of strategic importance not only for the socio-economic development of Yanbian Prefecture, but also for the stability of the Northeast Asian region. Under the combined influence of climate change and human activities, the TRB has shown a significant decline in surface runoff [36]. Some studies have shown that a significant increase in water consumption is the main cause of this problem [37]. At the same time, the special geographical location of the TRB and its relatively backward development pattern make the use of water resources in the area less efficient than in other parts of China. As socio-economic development progresses, the contradiction between water supply and demand in the TRB will become increasingly acute. Therefore, the TRB was chosen as the study area for this study to evaluate the water resources utilization efficiency.
In this study, we wanted the water use efficiency evaluation index to reflect the influence of objective factors such as climate change and production technology, as well as subjective factors such as regional socio-economic development bias, so we used a combination of DEA and AHP to conduct water use efficiency evaluation research. We used the DEA-BCC model to evaluate the efficiency of domestic, agricultural and industrial water use. By combining the calculation results of the DEA-BCC model, the main influencing factors of water use efficiency of each industry were analyzed. At the same time, a water use efficiency index (WEI) was constructed based on AHP to evaluate the comprehensive water use efficiency of water resources in each region. In the context of climate change, the problem of water scarcity will be exacerbated. In order to alleviate the contradiction between water supply and demand, a scientific and reasonable evaluation of the efficiency of water resources use in different regions and at different times is needed. On the one hand, this study provides an objective evaluation of the water use efficiency of different water-using sectors and analyses the influencing factors, helping managers to recognize the shortcomings in the development and use of water resources in each region, and can provide a basis for the formulation of regional water use plans. Therefore, this study is important for regional water resources management and alleviating water scarcity problems.
2. Materials and Methods
2.1. Study Area
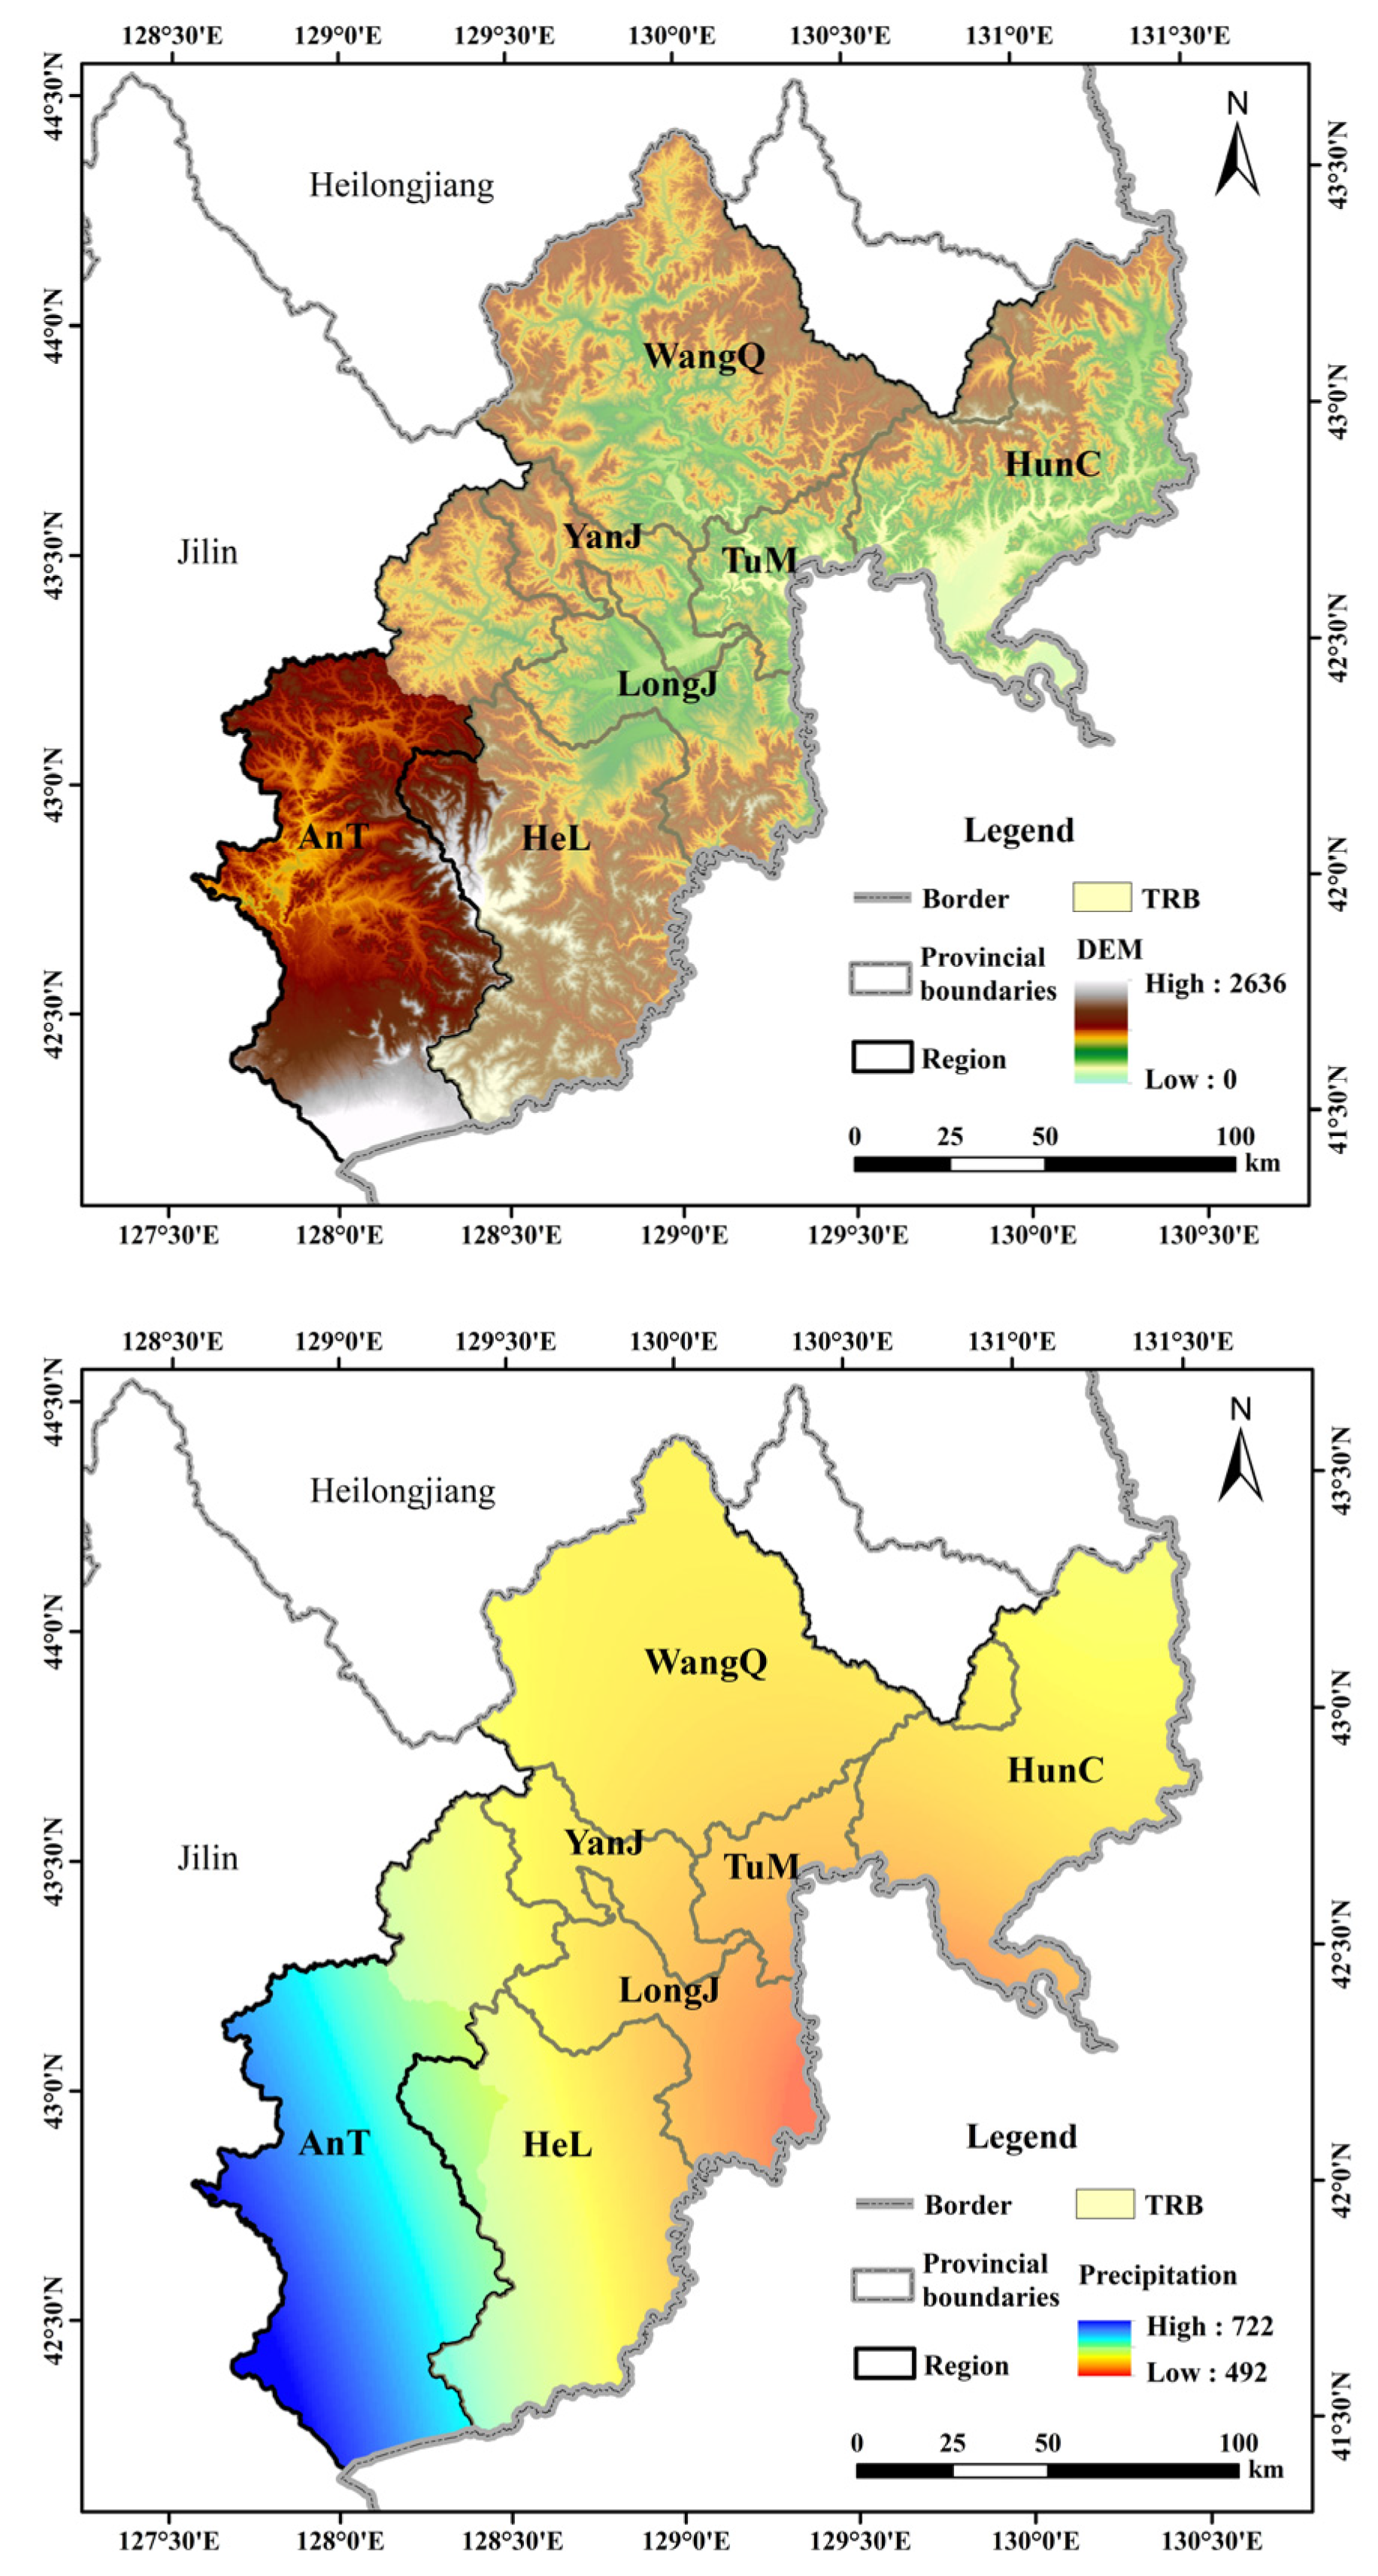
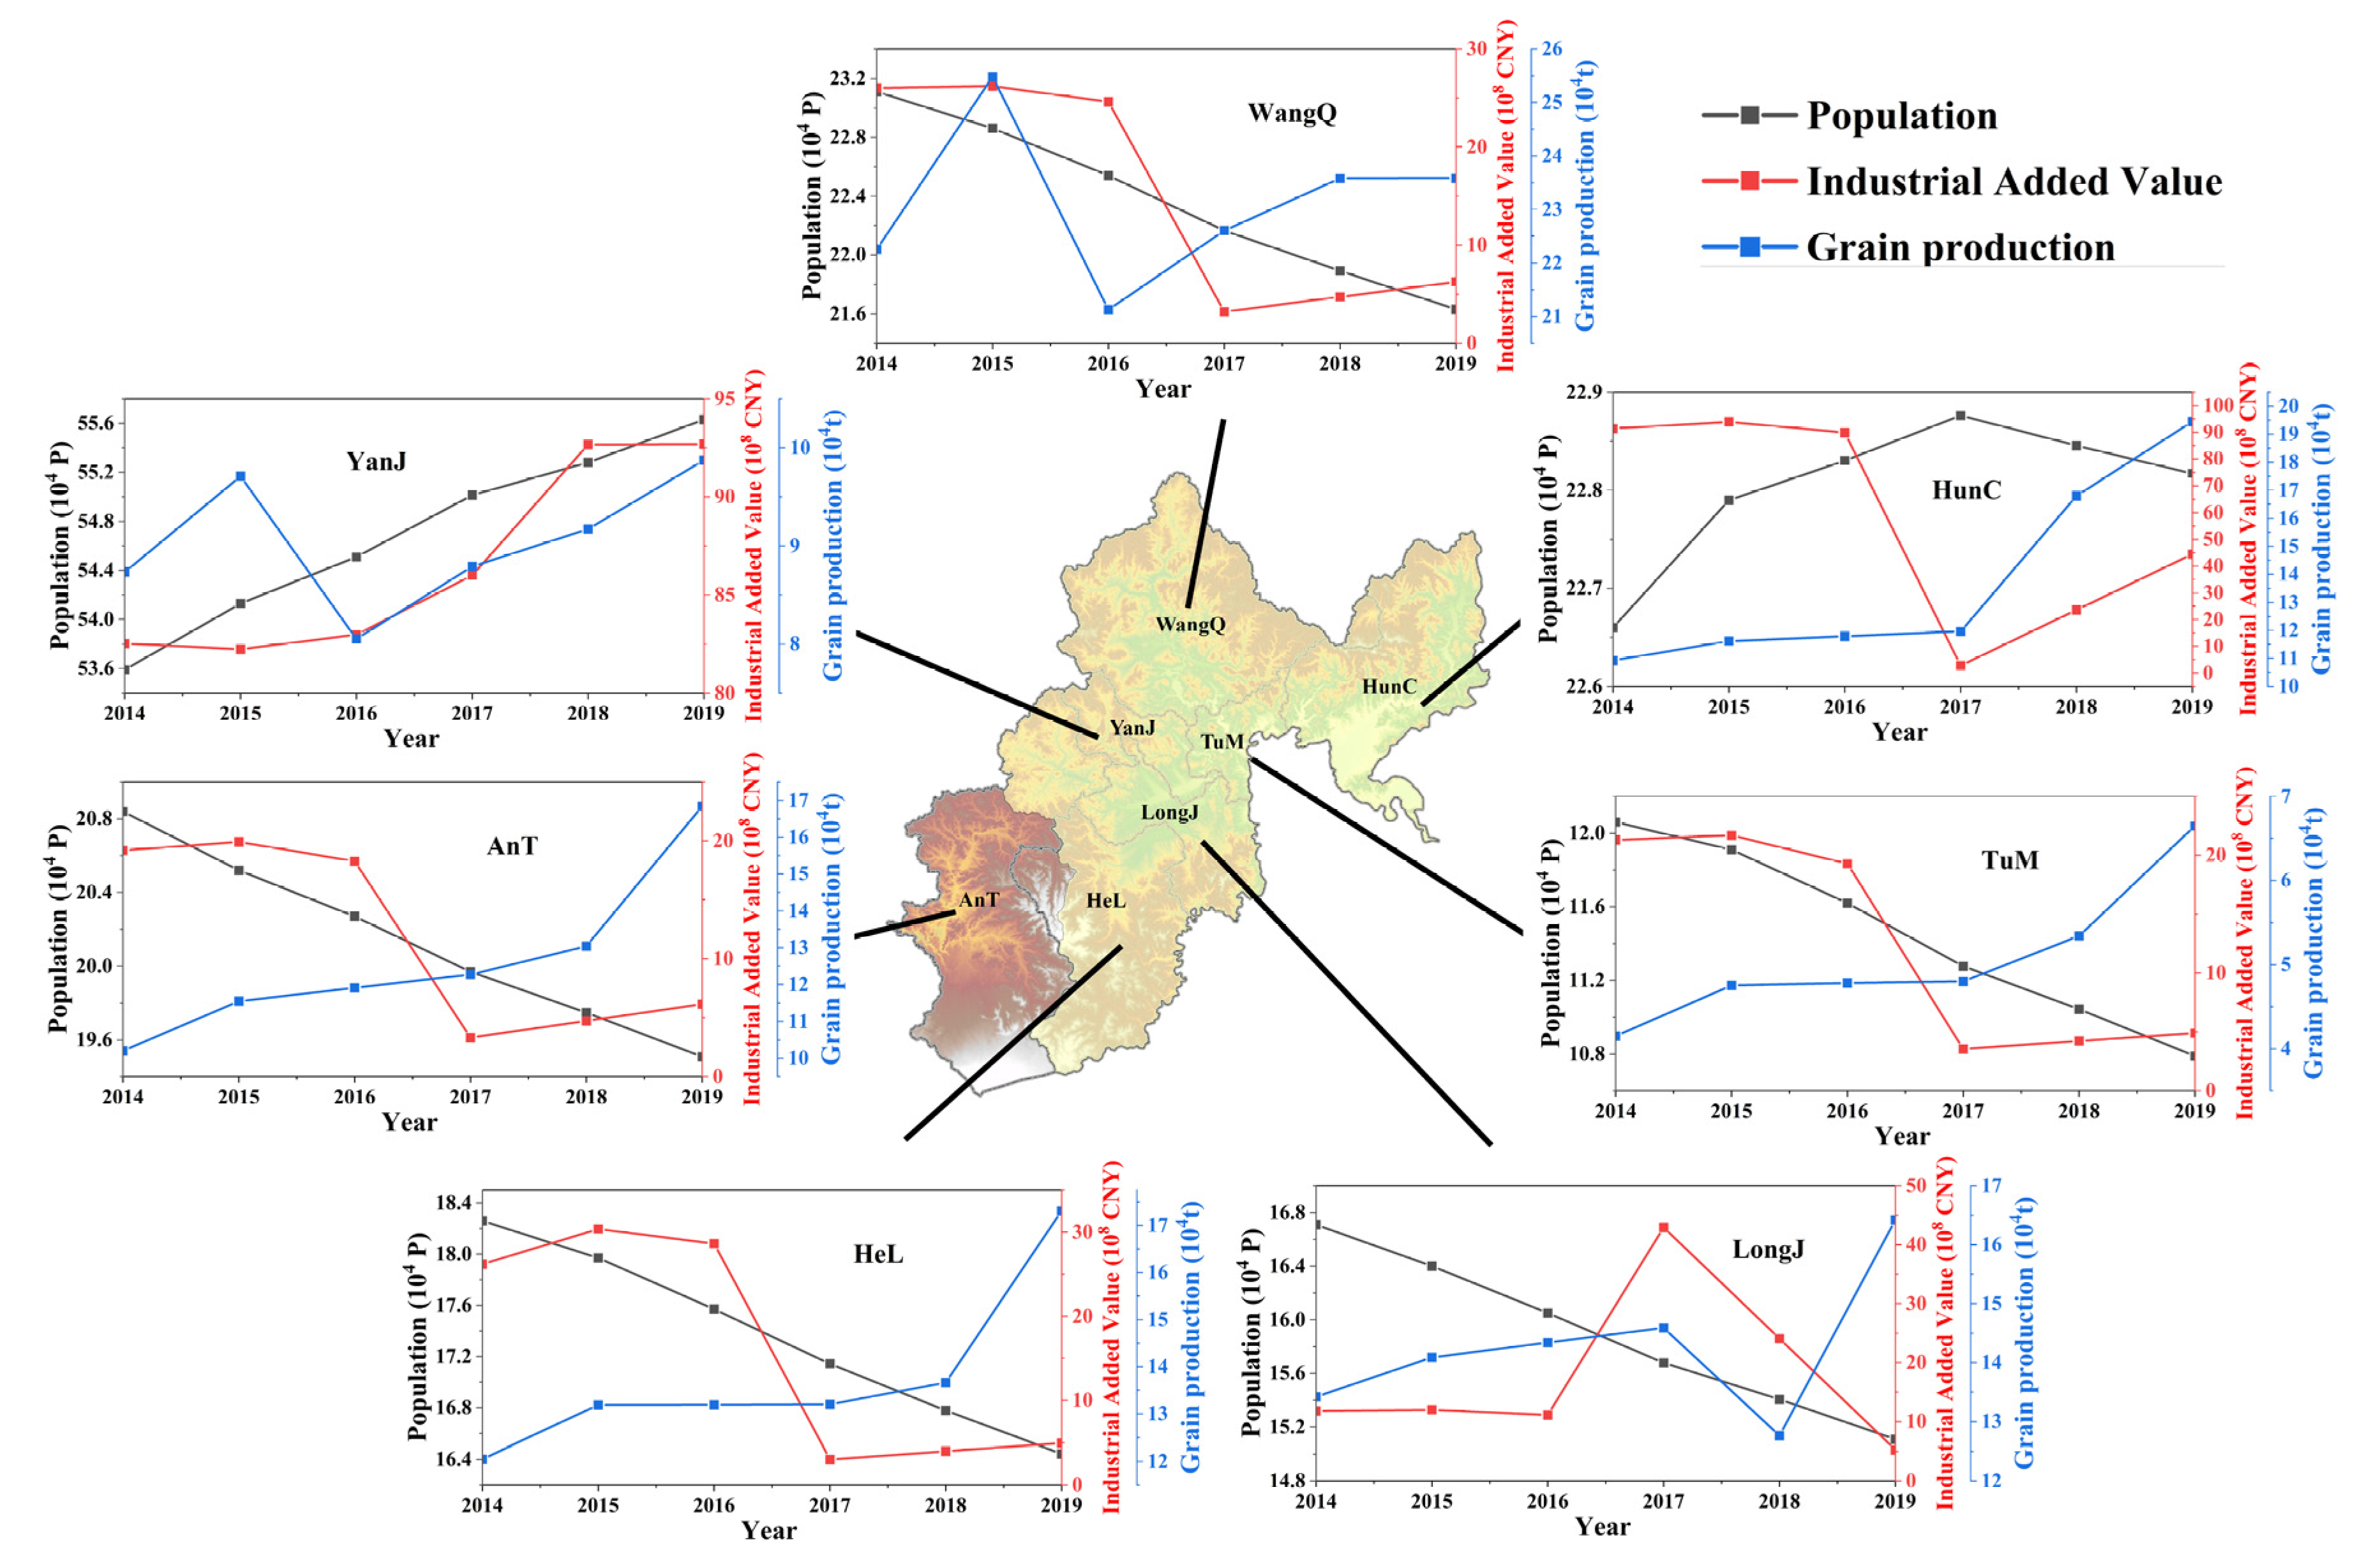
The Tumen River’s mainstem originates from the east side of the main peak of the Changbai Mountain range. The river has a total length of 525 km, of which 10 km denotes the border between China and North Korea and 15 km denotes the border between Russia and North Korea. The Tumen River Basin (Chinese side, hereinafter referred to as the TRB) is located in the mountains of northeast China (41°59′–44°01′ N, 128°17′–131°18′ E). The Chinese side of the basin covers an area of 22,400 km2, accounting for 68.2% of the whole basin area. The TRB belongs to the temperate continental subhumid monsoon climate zone, which has an annual average temperature of 2.6–5.4 °C. The temperature gradually increases from west to east, annual precipitation is 400–800 mm, and all climatic factors have vertical changes. As is shown in Figure 1, the TRB contains 7 regions: HeL, LongJ, YanJ, TuM, WangQ, HunC and AnT. As is shown in Figure 2, the water use in the TRB shows a decreasing trend, and farmland irrigation is the main water use method in the TRB except for TuM from 2014 to 2019. Additionally, as is shown in Figure 3, the population, industrial added value and grain production of YanJ show an upward trend, while the population and industrial added value of the other regions show a downward trend, and grain production shows an upward trend.
2.2. Data
In this study, data on water use for domestic agriculture and industry and socioeconomic data such as population, industrial added value, and grain production are used to calculate the efficiency of water resource utilization. The data on water use are from the Bulletin of Water resources from 2014 to 2019 released by the Water Resources Bureau of Yanbian Korean Autonomous Prefecture. The socio-economic data were obtained from the Statistical Yearbook published by the China Social and Economic Big Data Research Platform (https://data.cnki.net/ (accessed on 10 November 2022)).
2.3. Methods
2.3.1. Data Envelopment Analysis (DEA)
Data envelopment analysis (DEA) is a non-parametric test method used to evaluate the relative effectiveness of comparable units of the same type using a linear programming method according to multiple input and output indicators. The DEA was proposed by Charnes, Cooper and Rhodes in 1978, and the CCR model was subsequently developed [38].
The CCR model can calculate the efficiency of resource allocation under the condition of constant returns to scale (CRS). The object to be evaluated is called a decision-making unit (DMU). Suppose there are DMUs, and each DMU has inputs and outputs. The (; ) represents the th input of the th DMU, and the (; ) represents the th output of the th DMU. and represent the input and output weight vectors, respectively. With the efficiency index of the th DMU as the target and the efficiency of all DMUs as the constraint, the model can be expressed as
Let , , through Charnes–Cooper transformation, and introduce relaxation variable and residual variable , which can be simplified into the following linear programming model:
where λ is derived according to the duality rule without special meaning; is the overall efficiency calculated by the CCR model, which reflects the production efficiency of DMU with a certain input. The input and output of the DMU are comprehensively effective when , and this means that the input and output of the DMU are invalid when .
The traditional DEA can only compare between DMUs to find the relative effective units and use it as a criterion to evaluate the efficiency of each unit relatively. This method is suitable for comparing and ranking efficiency among DMUs, but it cannot objectively judge the true efficiency of each DMU. Therefore, this study introduces a DMU with the highest efficiency of water use in the characterized area based on traditional DEA to evaluate the true water use efficiency of other DMUs.
At the same time, domestic, agricultural and industrial water consumption are selected as input indicators, and population, grain output, and industrial added value are taken as output indicators. The OE is a comprehensive evaluation of the water resource allocation capacity, management and technical capacity of each unit and is the main indicator for evaluating the efficiency of domestic, agricultural and industrial water use in this study. Additionally, in this paper, the OE of domestic, agricultural and industrial water is recorded as , and . In addition, the DEA provides a model to distinguish between technical efficiency (TE) and scale efficiency (SE).
Banker and Charnes proposed the BCC model based on the CCR model, assuming that the return on the scale is variable (VRS) [39]. This model is used to calculate TE and can be expressed as
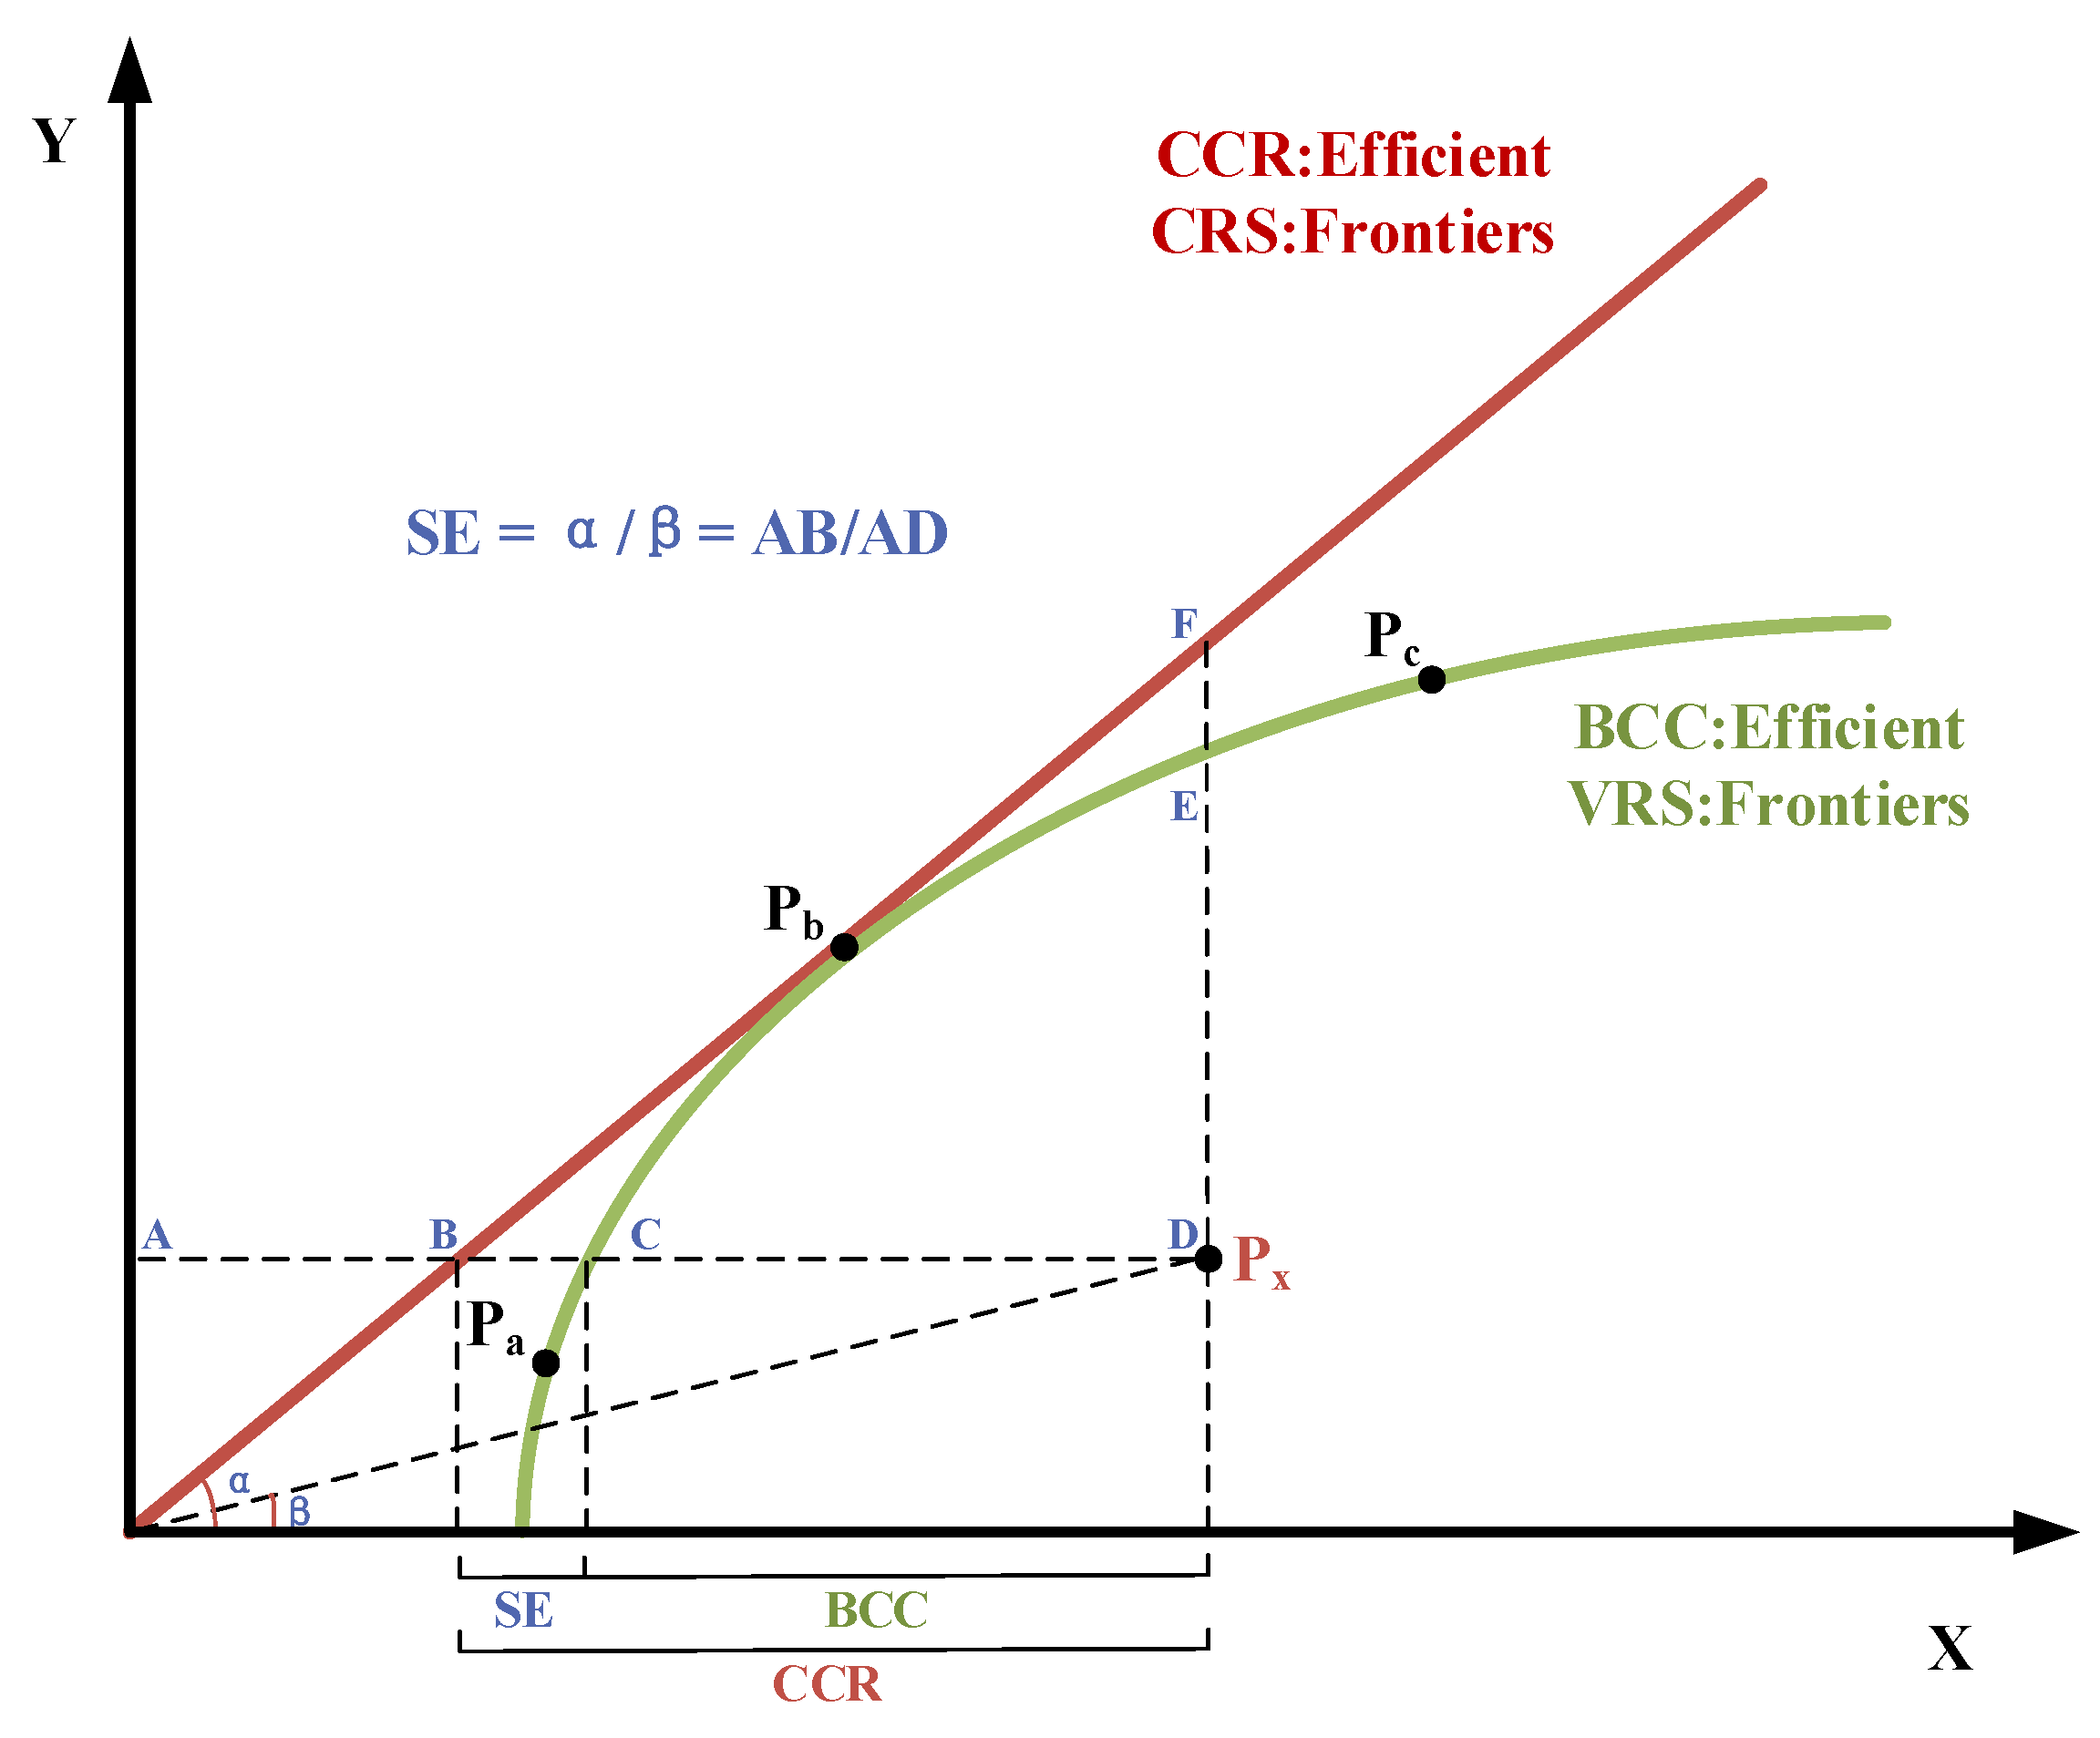
As is shown in Figure 4, the OE and TE at point are valid, and the TE at points and are valid, but the OE is invalid. In addition, SE is calculated by OE and TE, which can be expressed as
2.3.2. Water Resource Utilization Efficiency Index (WEI)
The DEA is a non-parametric evaluation method, which has the characteristic of objective index weight determination [40]. However, in the application of calculating water resource utilization efficiency, the importance of each essential factor is different due to subjective factors. Therefore, in this study, we put forward the efficiency index of water resource utilization for evaluation in combination with the analytic hierarchy process.
- (1)
- The weight of factors:
The analytic hierarchy process (AHP) is widely used in assigning weights to different water use sectors [41]. This method obtains their weighting coefficients by comparing the matrix of the elements with the relevant values [42,43]. In this study, we compared the industries in pairs and graded them according to their level of importance. The pair-wise comparison process was performed using a nine-point scale, and the numerical values and the corresponding levels of importance are shown in Table 1 [29]. For example, if is strongly important compared to , then its importance level . Additionally, the judgment matrix formed by the two-by-two comparison has the following properties [44].
Additionally, the number in the column is divided by the sum of all numbers in the column, and after normalization, the average value of each row is the weight of each factor. The weight of factors is expressed as .
- (2)
- Determination of WEI:
The WEI is constructed according to the results of the DEA and the weight of each factor. In this study, three factors—domestic water, agricultural water and industrial water—were considered. The WEI is calculated as follows:
where , and represent the weight of domestic, agricultural and industrial water, respectively.
3. Results
3.1. Domestic Water Efficiency
As was mentioned in Section 2.3.1, this study added a DMU to the DEA calculation of domestic water to represent the highest level of regional domestic water use efficiency. The output index took the average population of the other seven regions in the TRB basin, which is 26.38 × 10⁴ P. At the same time, concerning the Standard for Domestic Water Consumption of Urban Residents, the lowest per capita water consumption in the region was selected and calculated in combination with the population. In this study, the daily water consumption index was selected as 80 L/P·d. The OE, TE and SE of the DMU representing the regional optimal domestic water efficiency were calculated to be 1. We counted the D-WEI for each DMU from 2014 to 2019 in order to compare domestic water use efficiency between regions. As is shown in Figure 5, the domestic water use efficiency varies between regions within the TRB, with D-WEI ranging from 0.294 to 0.775, with a mean value of 0.600. AnT and HeL have higher domestic water efficiency with D-WEI of 0.775 and 0.733, respectively. YanJ has the lowest domestic water use efficiency of 0.294, although it has a high percentage of domestic water use. In addition, LongJ’s domestic water use efficiency ranged from 0.496 to 0.775 from 2014 to 2019, with large differences in domestic water use efficiency between the years.
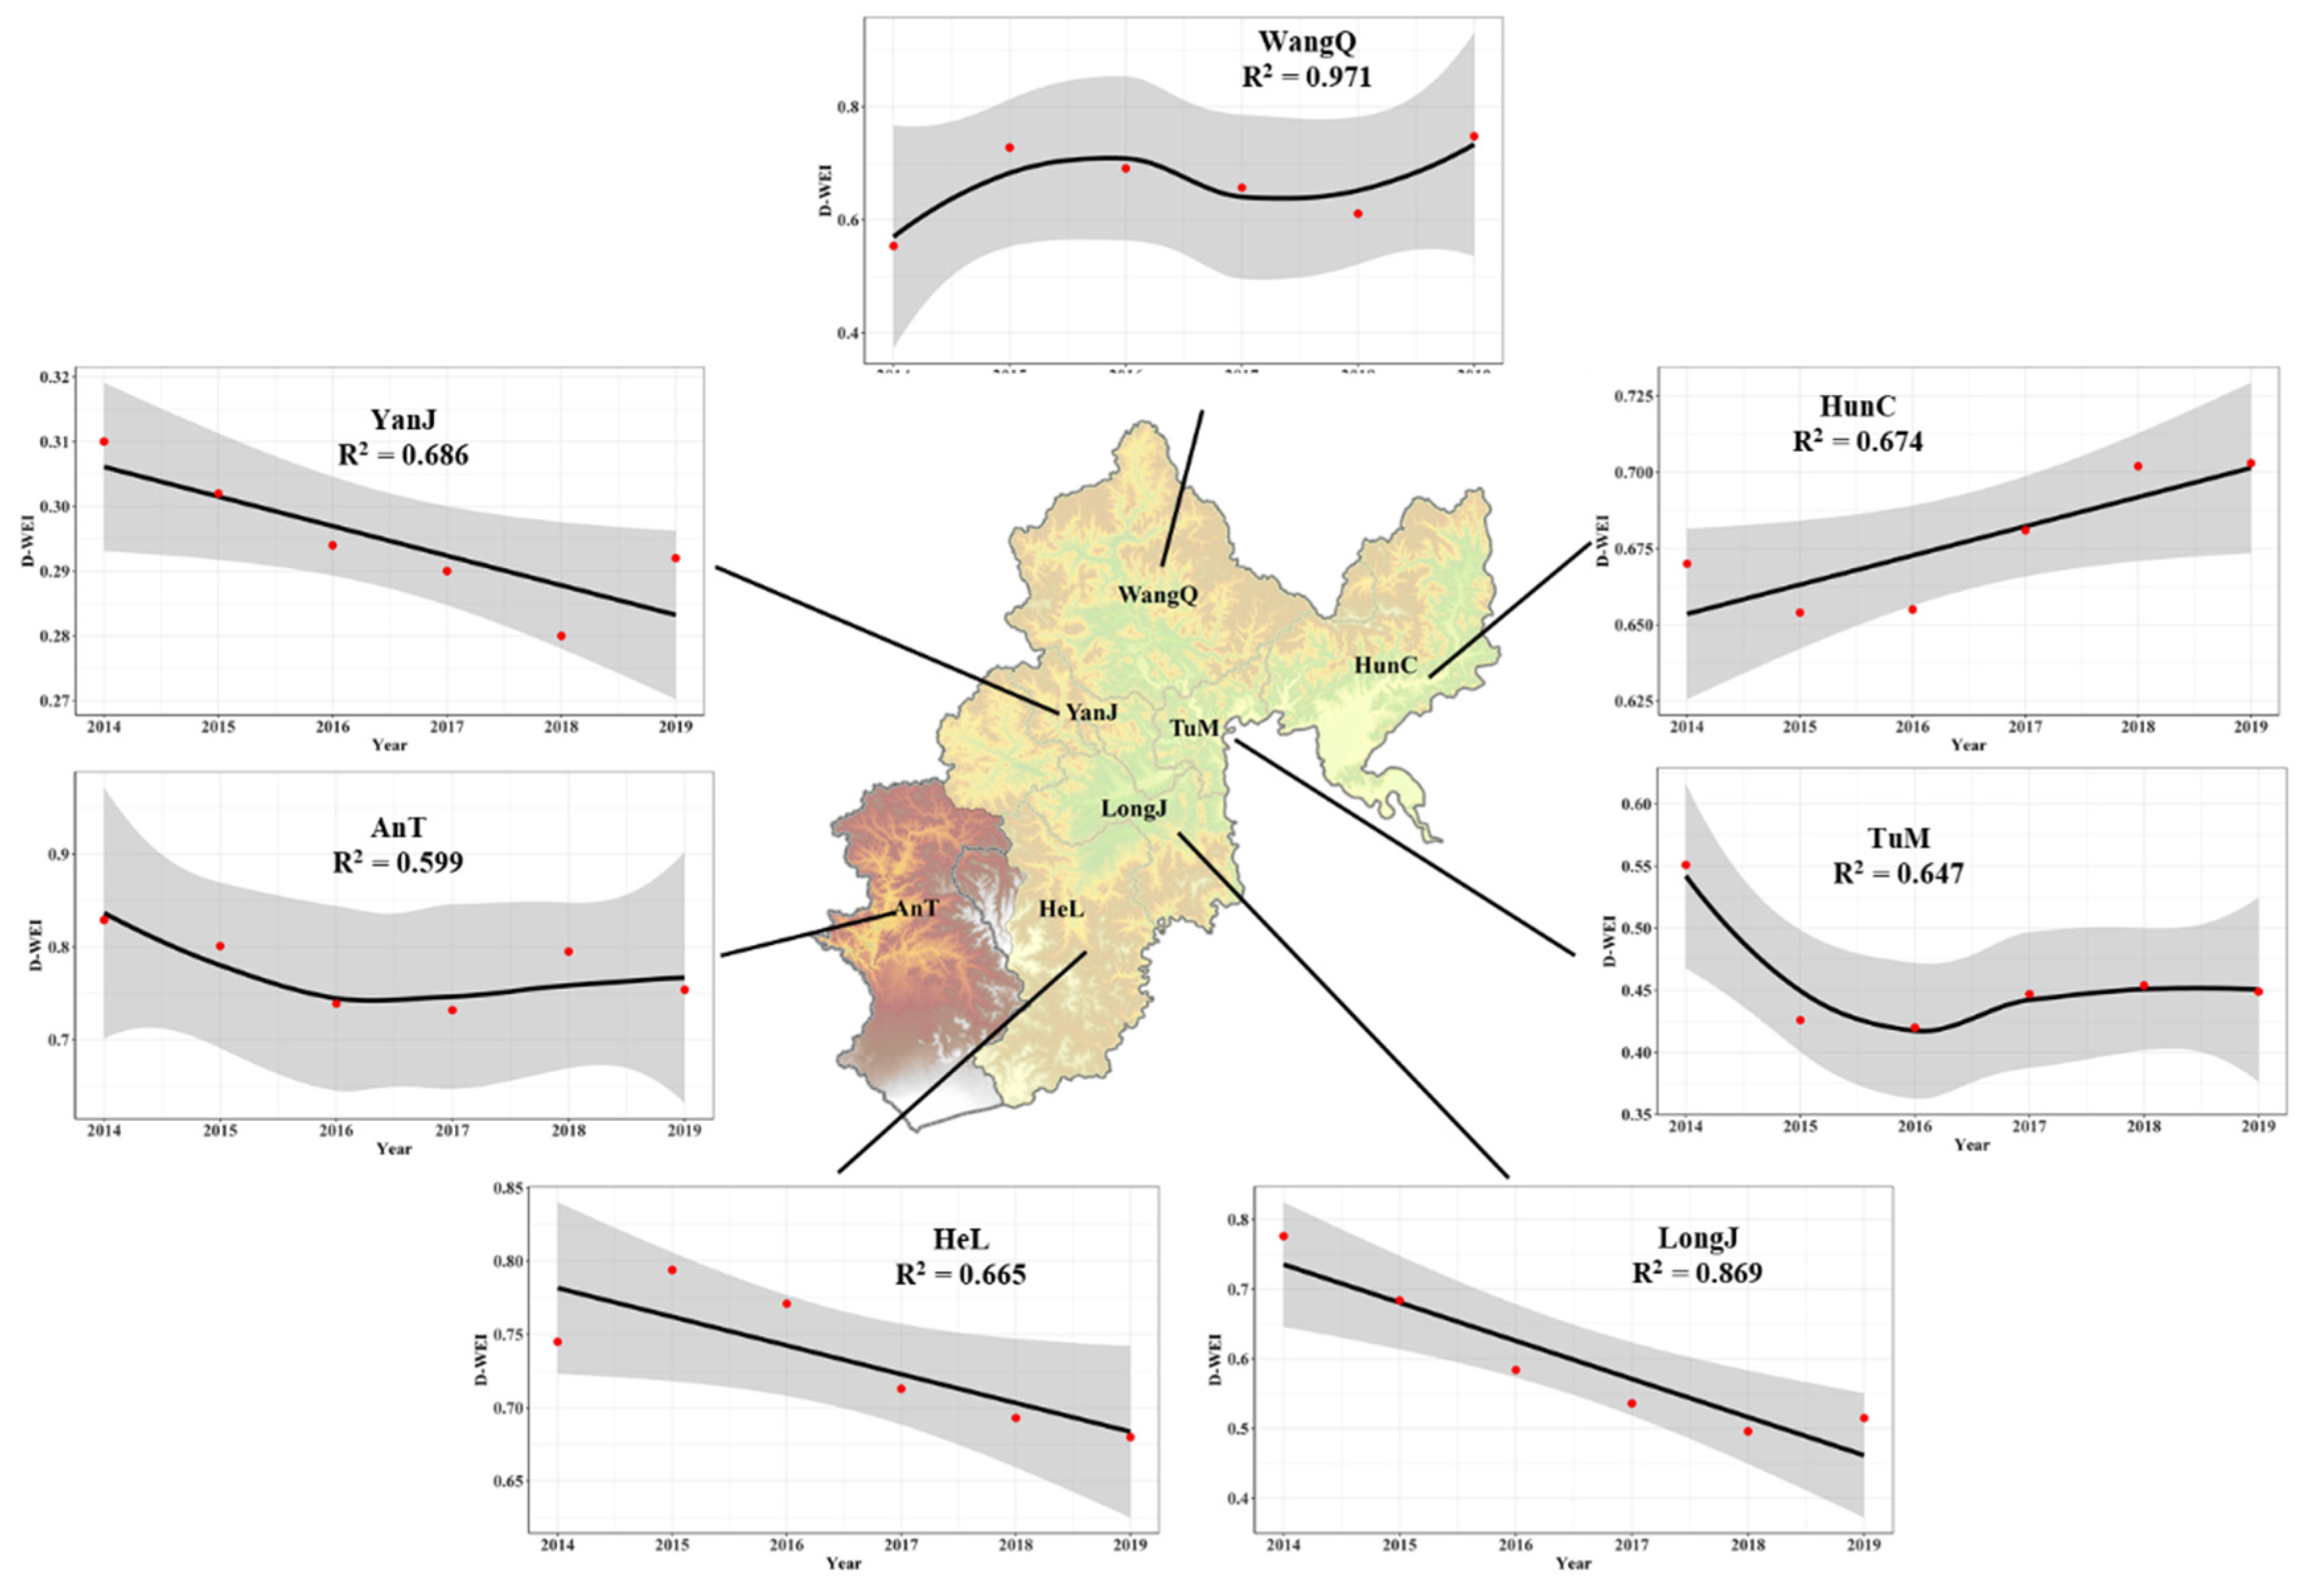
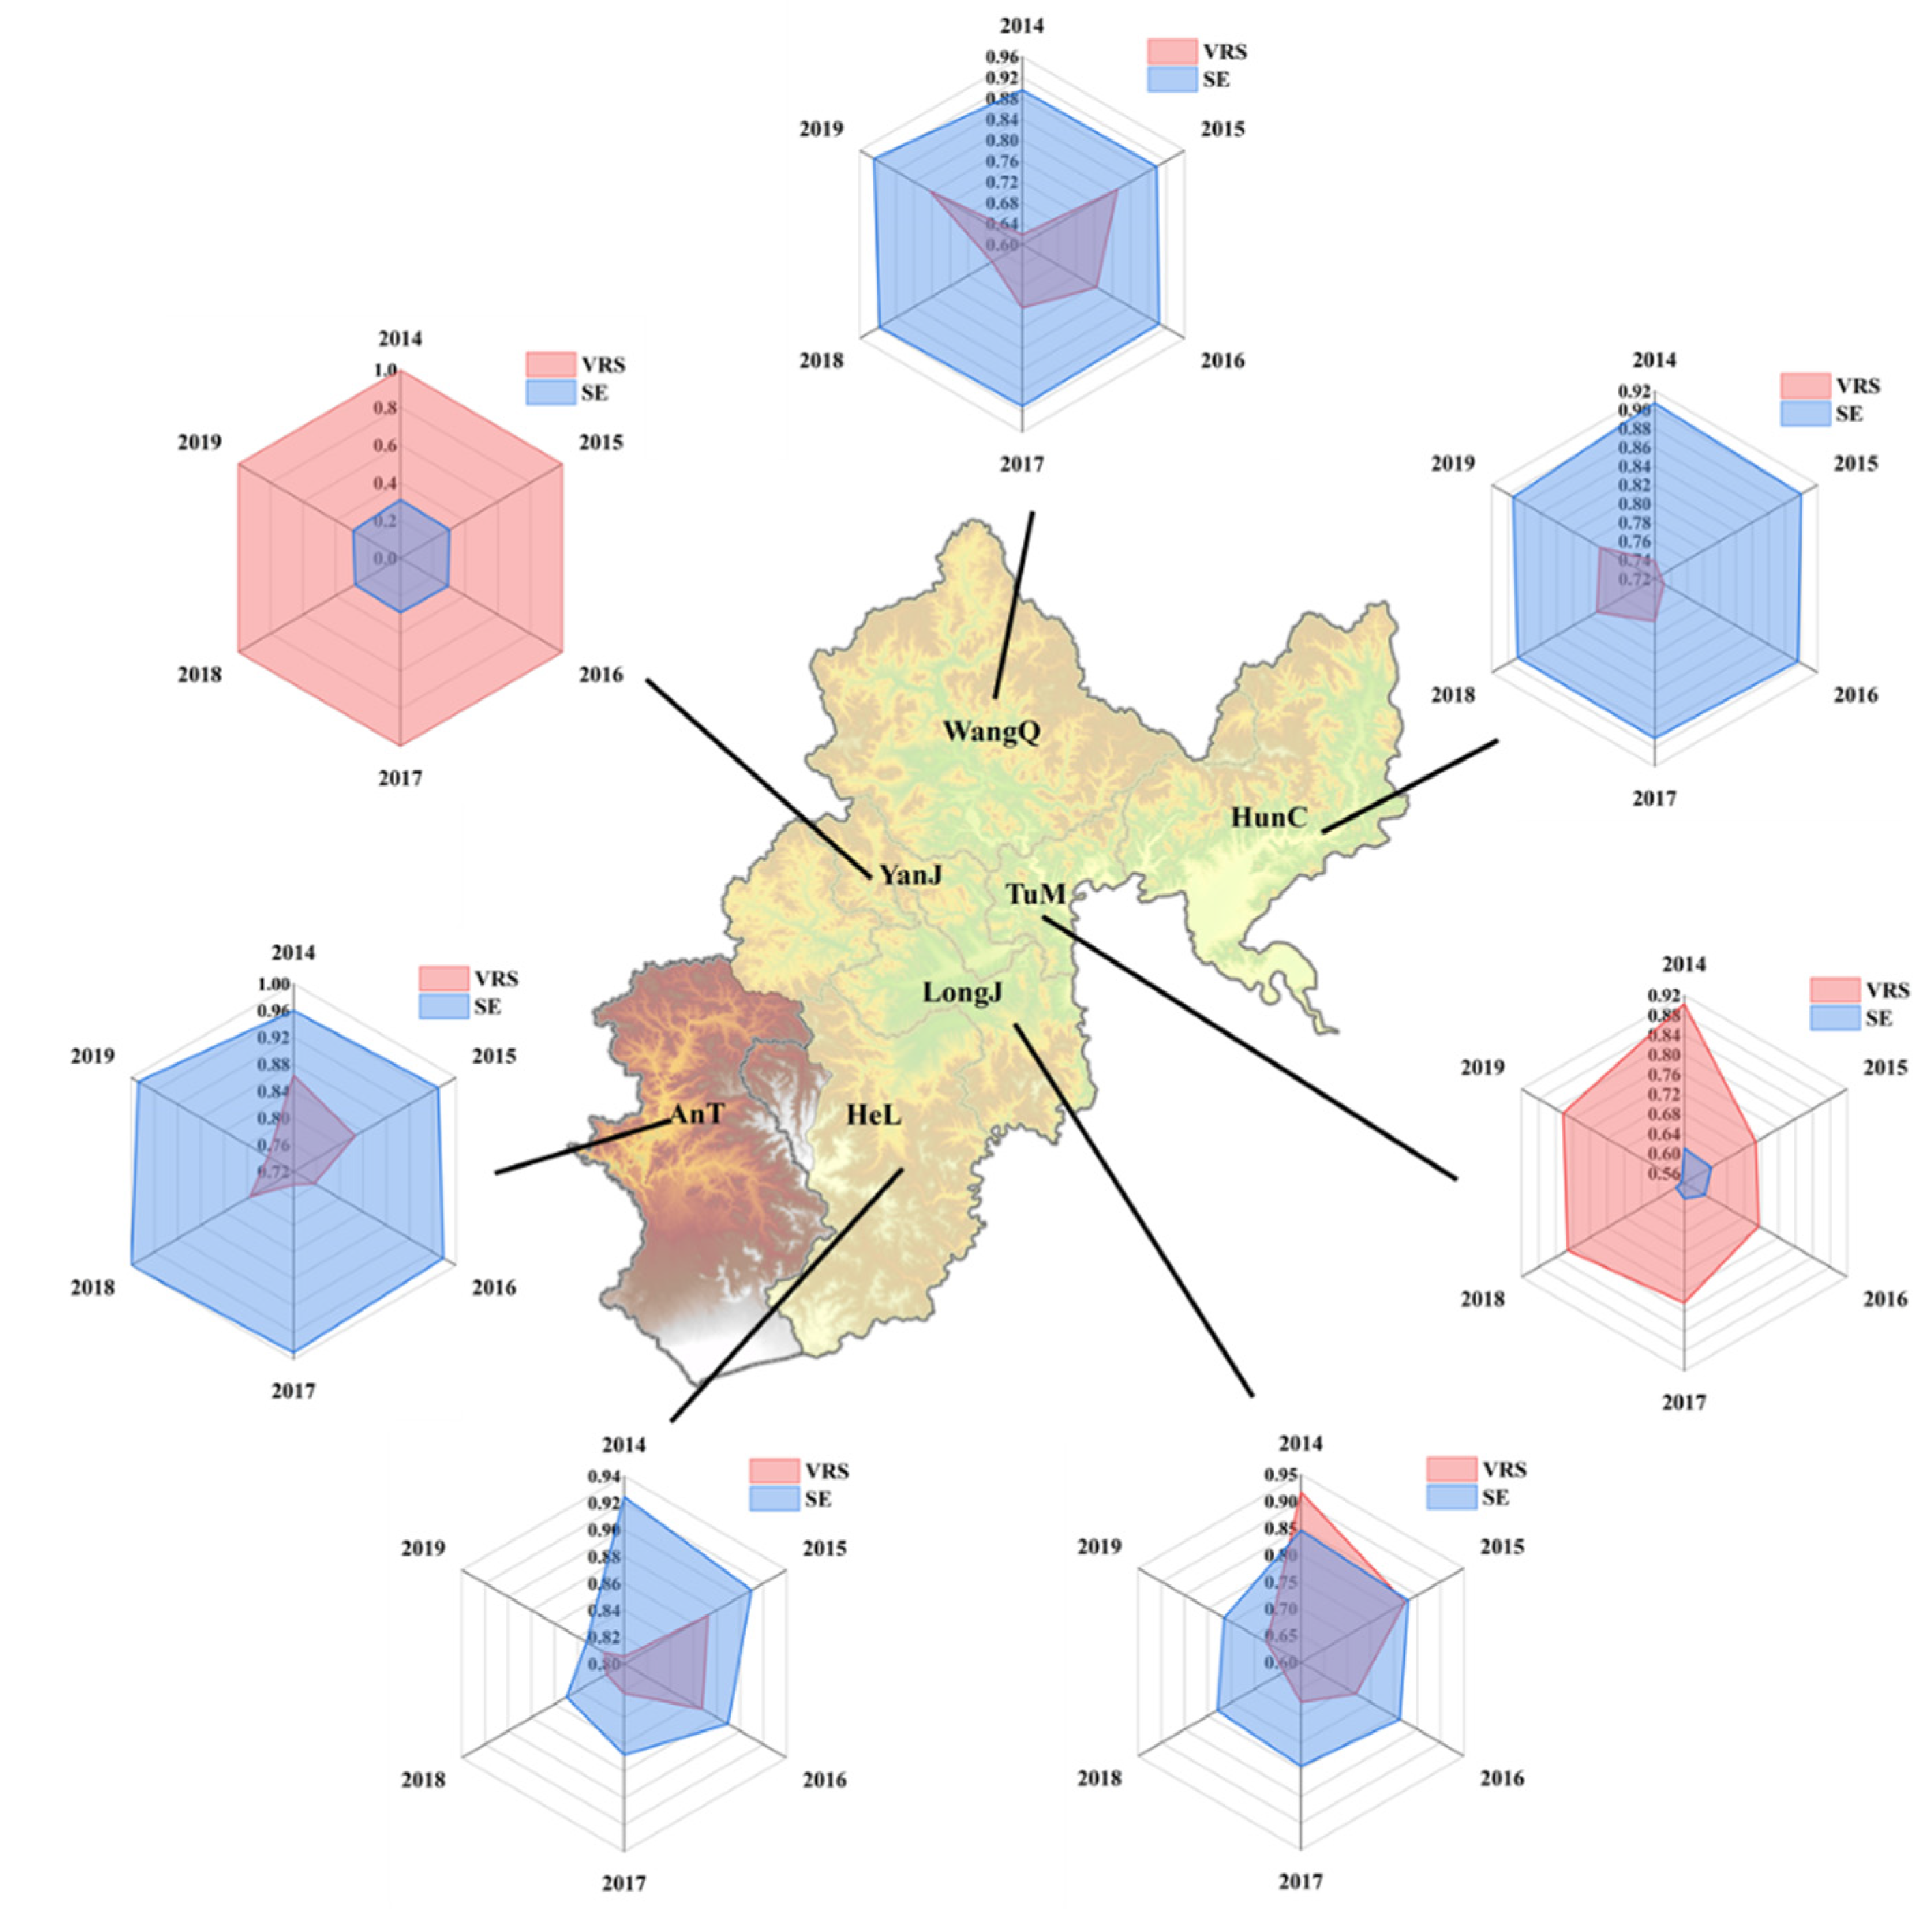
We fit the trend of D-WEI for each region between 2014 and 2019 and display it in Figure 6. With the population declining year by year, HunC’s domestic water use efficiency has shown a clear upward trend. The results of TE and OE for domestic water shown in Figure 7 show that HunC domestic water efficiency is mainly limited by technical efficiency. Additionally, the TE value of HunC increased from 0.74 in 2014 to 0.77 in 2019, which indicates an increasing level of water saving. The D-WEI of YanJ showed a downward trend between 2014 and 2019, reaching a minimum of 0.28 in 2018. According to our analysis, the main factor affecting domestic water use efficiency in YanJ City is the city-scale efficiency. At the same time, mainly due to technical efficiency, the D-WEI of HeL and LongJ also show downward trends when the population continues to decline. The domestic water efficiency of AnT and TuM in 2019 decreased compared with that of 2014, but the domestic water efficiency gradually stabilized after 2017. According to our analysis, the domestic water efficiency of AnT is mainly affected by the technical efficiency, and the TE value shows a decreasing trend. The domestic water efficiency of TuM is mainly affected by scale efficiency. In recent years, the TE value has shown an increasing trend, but the OE value has shown a downward trend. The D-WEI of WangQ showed an overall upward trend, but there was a temporary decline between 2015 and 2018. We can see from the TE and OE value calculation that the scale efficiency of WangQ has not changed significantly, and the decline in technical efficiency from 2015 to 2018 is the main reason for the decline in domestic water efficiency.
The domestic water use efficiency in most areas of the TRB is mainly affected by technical efficiency, which can be explained by many reasons such as water supply facilities and water resource management. The decline in the domestic water use efficiency of YanJ and TuM is mainly affected by scale efficiency, but the reasons are different. The rising rate of domestic water is higher than that of the population, which is the main reason for the decline in the domestic water efficiency of YanJ. In the case of population decline in TuM, the domestic water consumption did not decrease, resulting in a decline in domestic water use efficiency.
3.2. Agricultural Water Efficiency
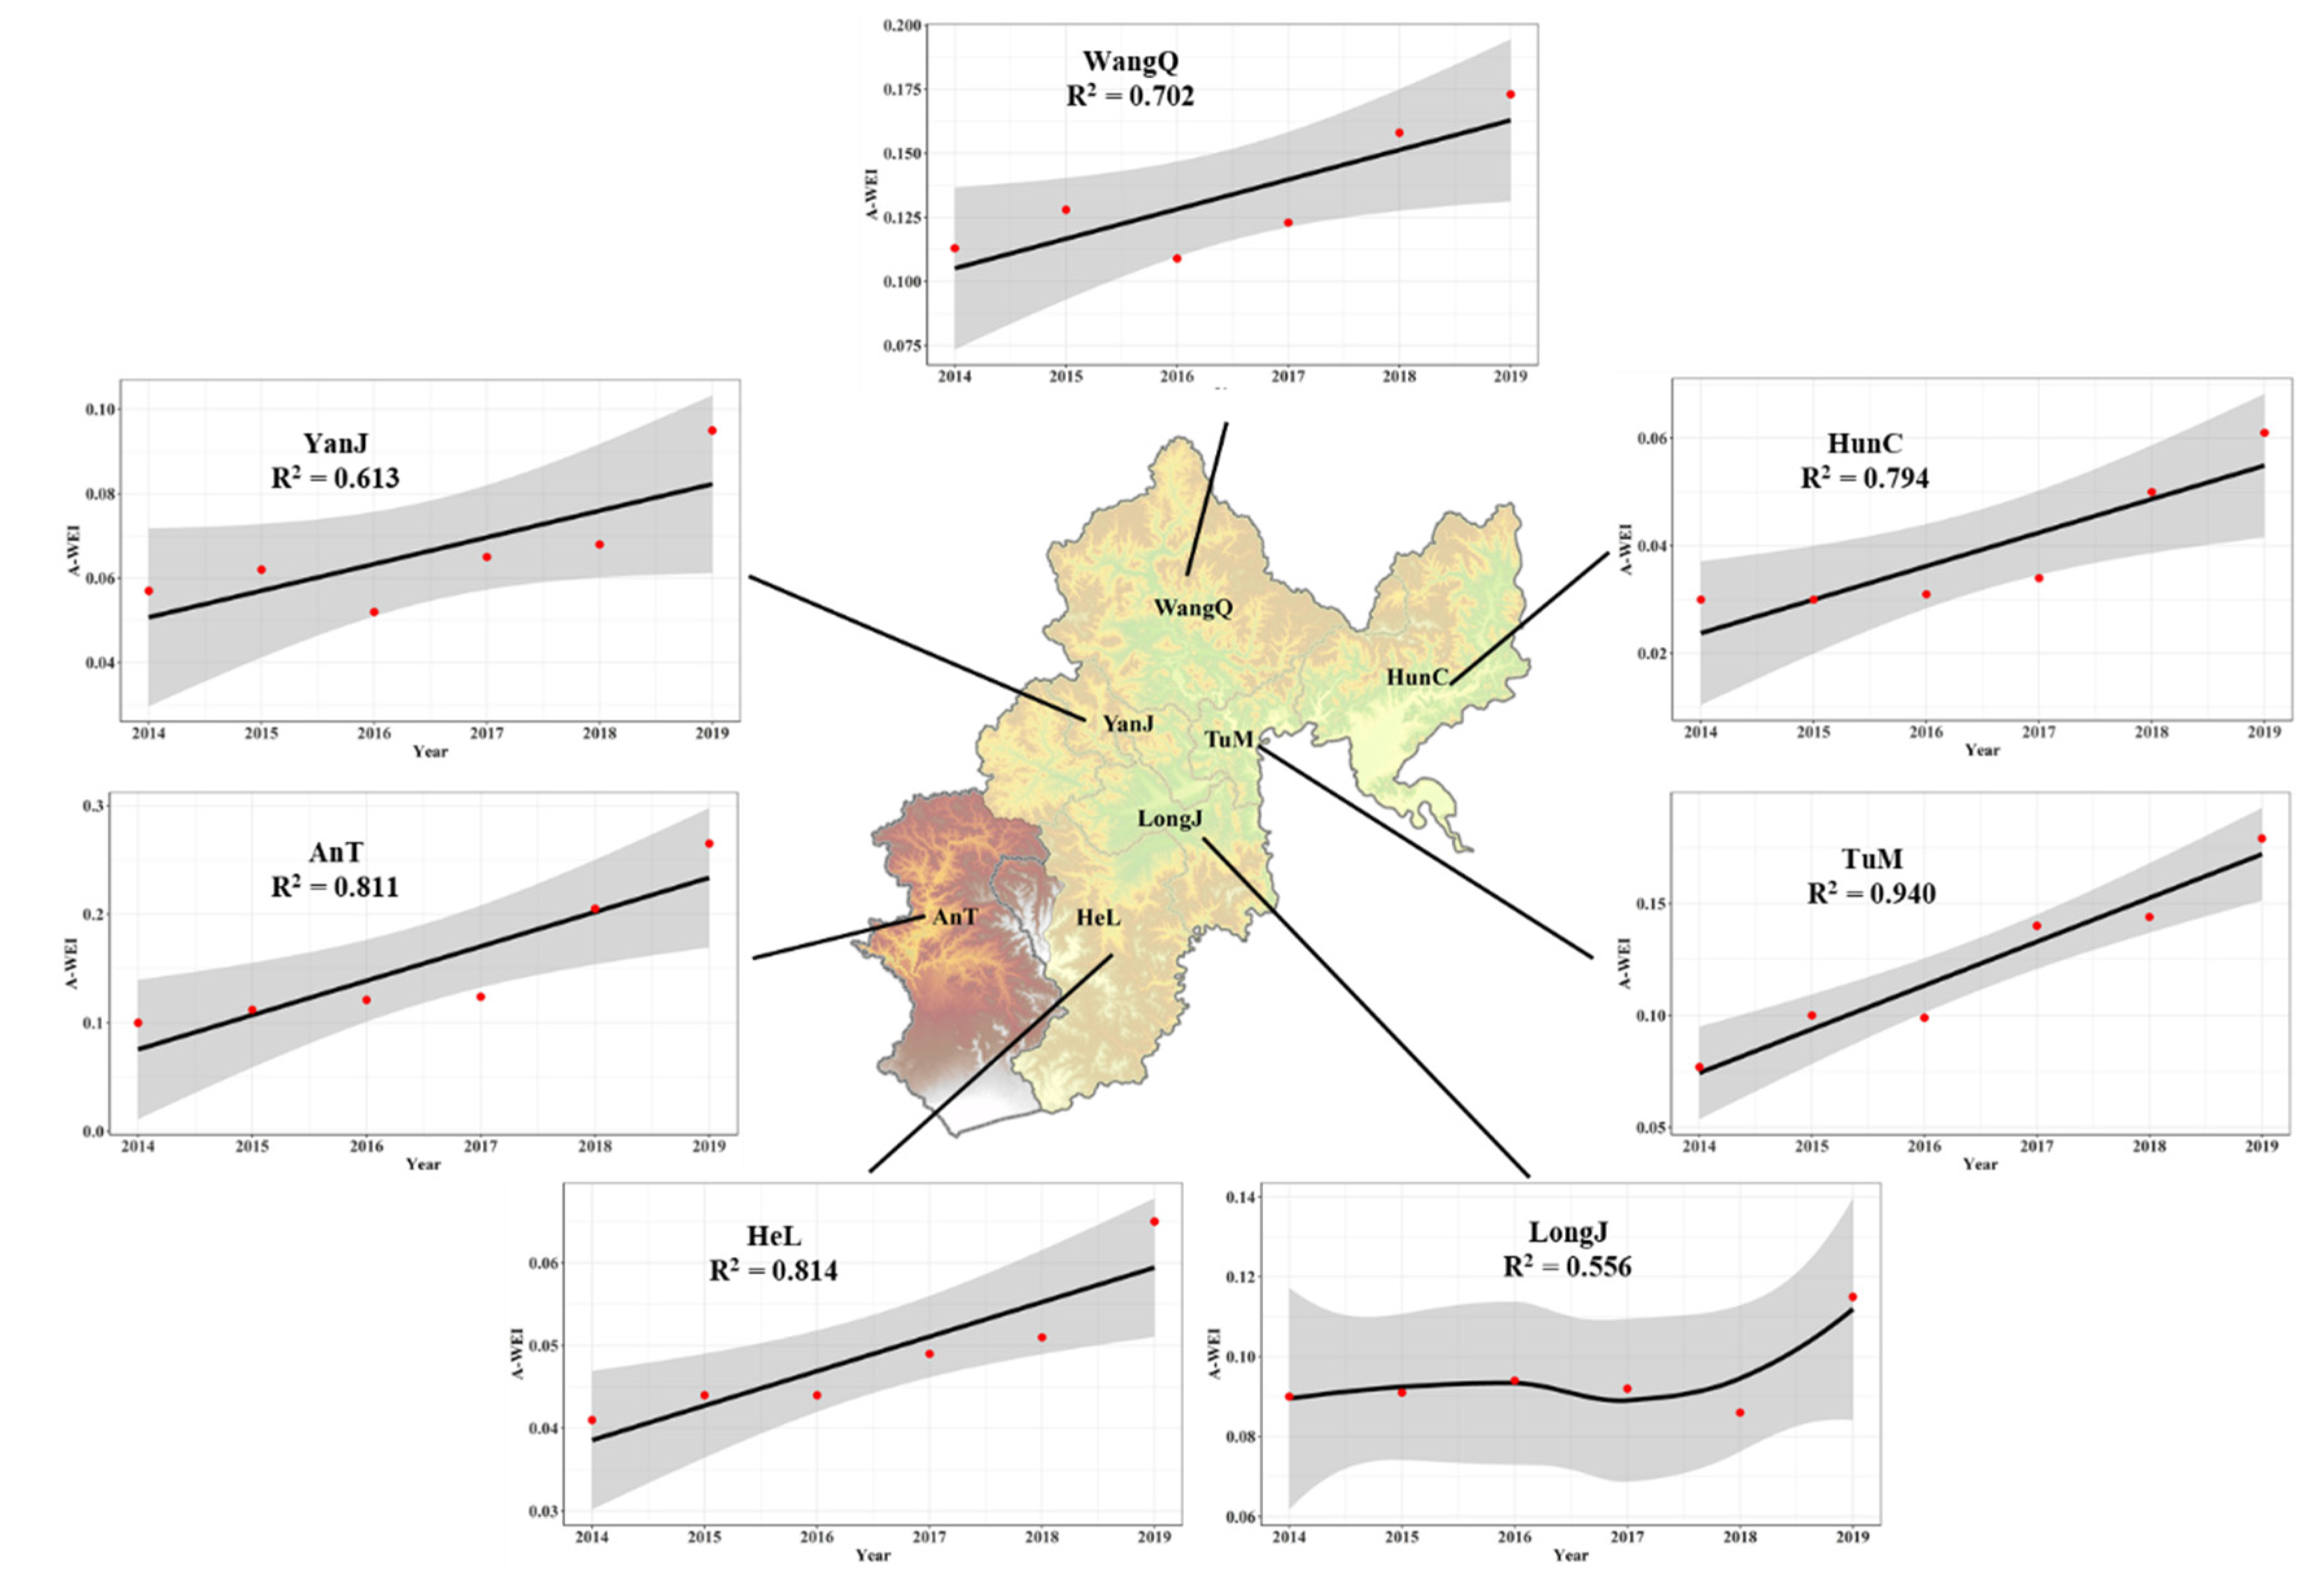
Similar to domestic water efficiency, we added a DMU to represent the optimal level of regional agricultural water efficiency, with input and output index values of 784.2 × 10⁴ m3 and 18.13 × 10⁴ t, respectively. As shown in Figure 8, the average of A-WEI for each region ranged from 0.039 to 0.154, with an average value of 0.094. Compared with the optimal level, the agricultural water use efficiency of the TRB is low. The A-WEI average values of AnT and WangQ were higher, at 0.154 and 0.134, respectively. The A-WEI mean values of HunC and HeL were lower, at 0.039 and 0.049, respectively. Among all the DEA calculation results, AnT had the highest A-WEI in 2019, reaching 0.265, and HunC had the lowest A-WEI in 2014, reaching 0.030. Among them, the agricultural water use efficiency of HeL and LongJ have not changed significantly from 2014 to 2019. The agricultural water use efficiency of AnT has changed greatly, from 0.10 in 2014 to 0.26 in 2019.
As is shown in Figure 9, the comprehensive agricultural water use efficiency of all regions in the TRB basin showed an increasing trend. Besides TuM, the main influencing factor of comprehensive agricultural water use efficiency in other regions was technical efficiency (Figure 10). Additionally, with the increase in grain production and the decrease in water consumption, the TE and SE of agricultural water use in most areas of the TRB showed an upward trend. The improvement of agricultural water use efficiency benefits from the promotion of water-saving irrigation facilities and strict agricultural water management. In general, although the agricultural water use efficiency of the TRB is relatively low, it shows an upward trend. Agriculture is the main industry of the TRB, and agricultural water consumption accounts for 73% of the total water consumption. The improvement of agricultural water use efficiency is conducive to the sustainable use of water resources.
3.3. Industrial Water Efficiency
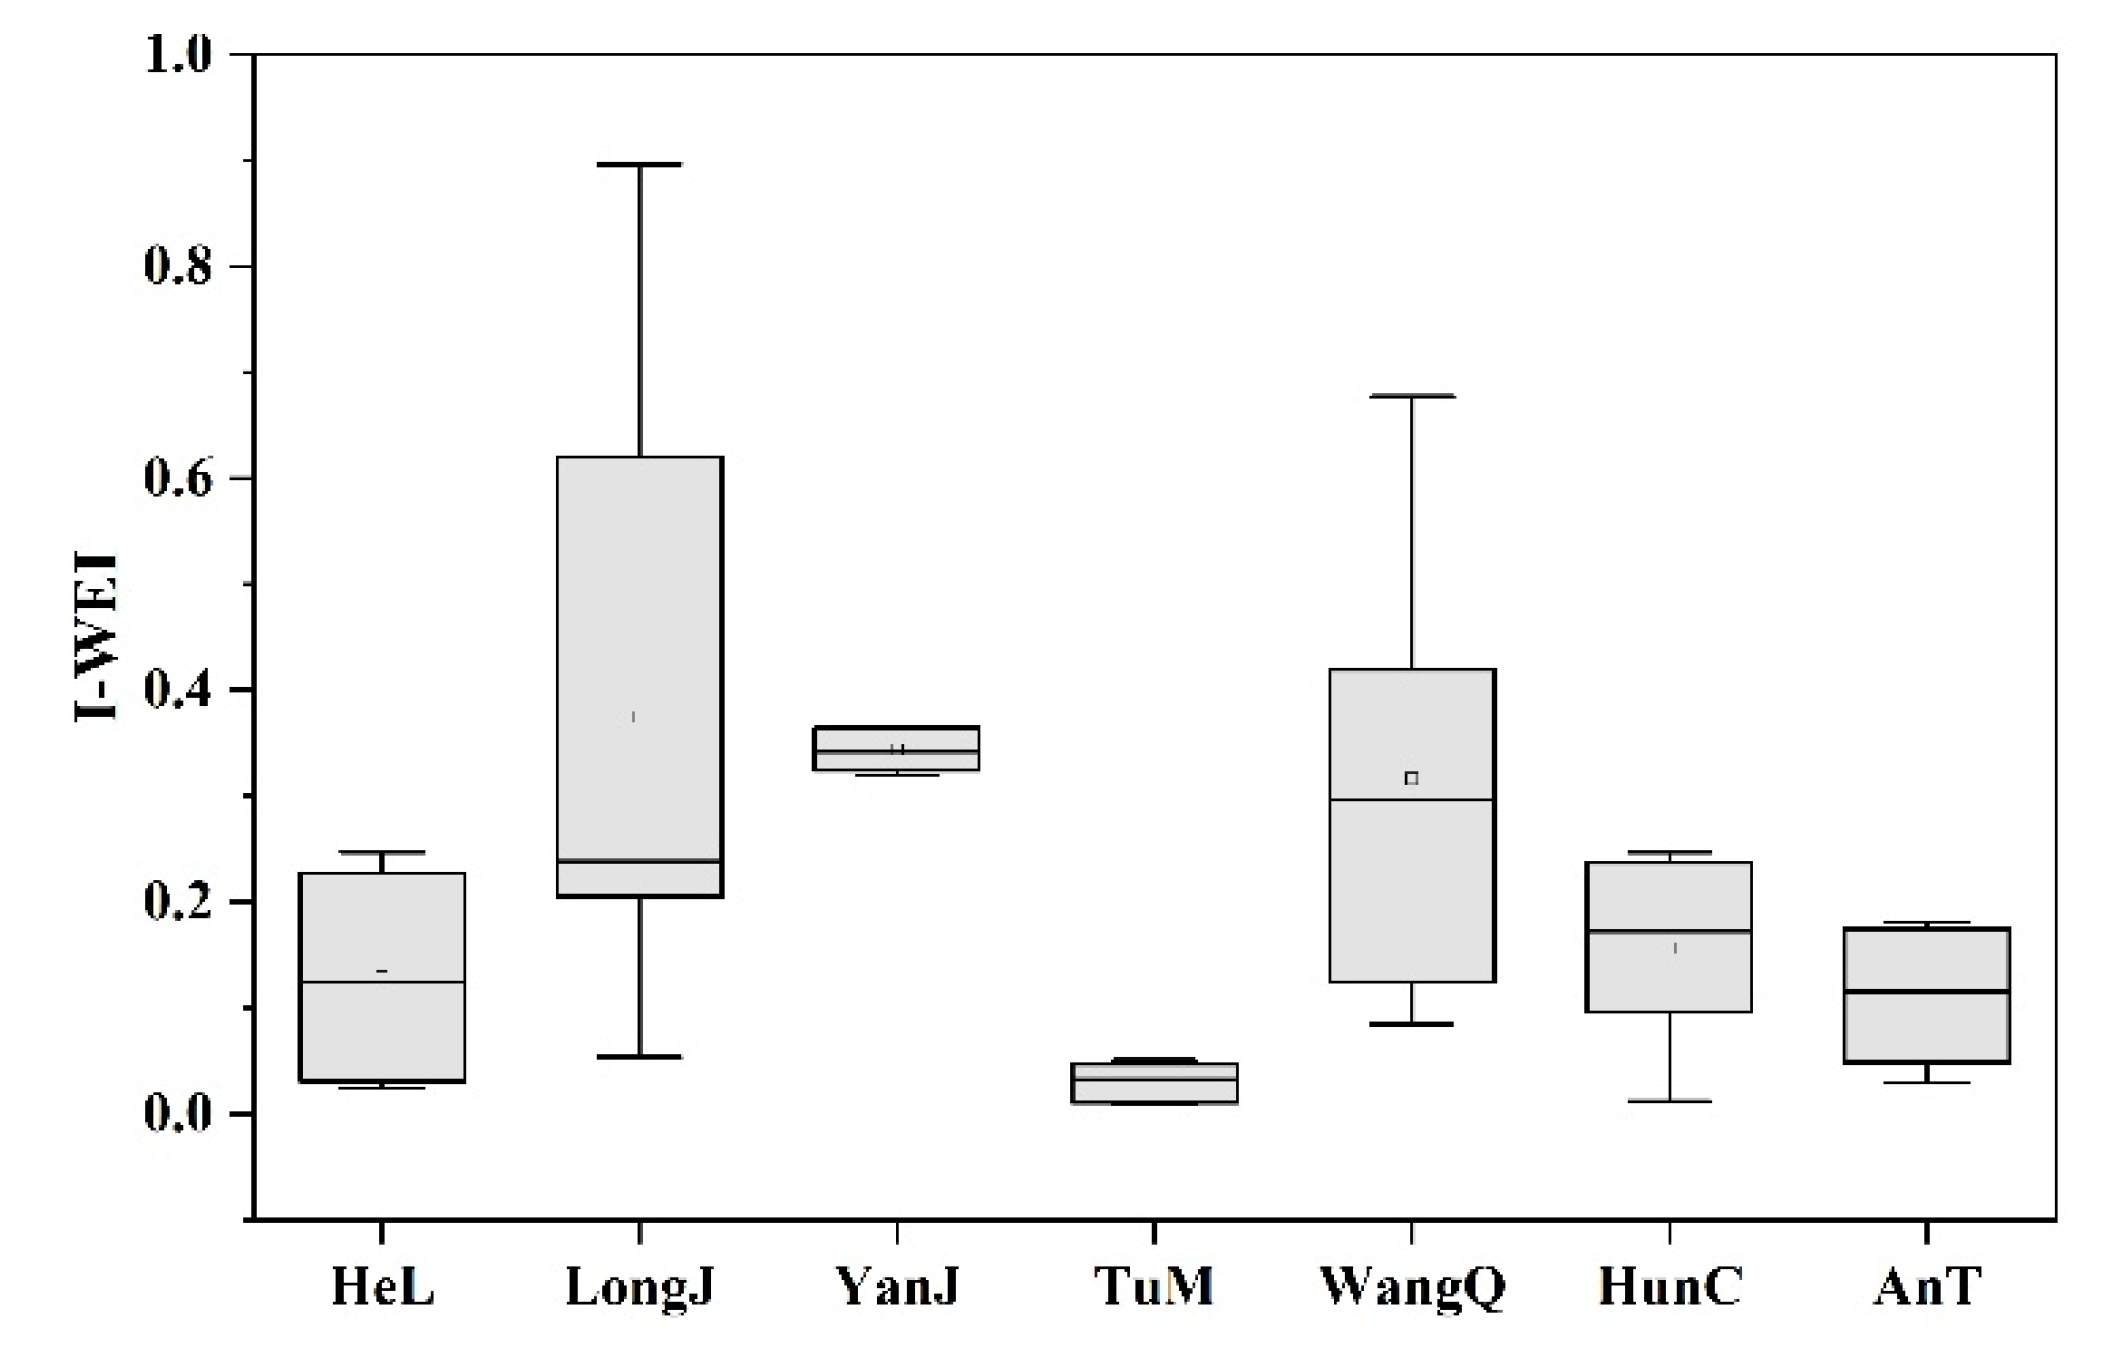
In this study, we added a DMU to represent the optimal level of regional industrial water efficiency, with input and output index values of 223.78 × 10⁴ m3 and 33.58 × 10⁸ CNY, respectively. As is shown in Figure 11, the I-WEI of each region in the TRB ranged from 0.031 to 0.375, with an average value of 0.209. The average I-WEI values of YanJ and LongJ were higher, at 0.343 and 0.375, respectively. The average I-WEI values of TuM and AnT were relatively low, at 0.031 and 0.111, respectively. Among all the DEA calculation results, LongJ had the highest I-WEI in 2017, reaching 0.896, and TuM had the lowest I-WEI in 2017, reaching 0.009. The industrial water efficiency of YanJ and TuM did not change much between 2014 and 2019. The industrial water use efficiency of LongJ varies greatly, with the maximum I-WEI value appearing in 2017, 0.89, and the minimum value appearing in 2014, only 0.05.
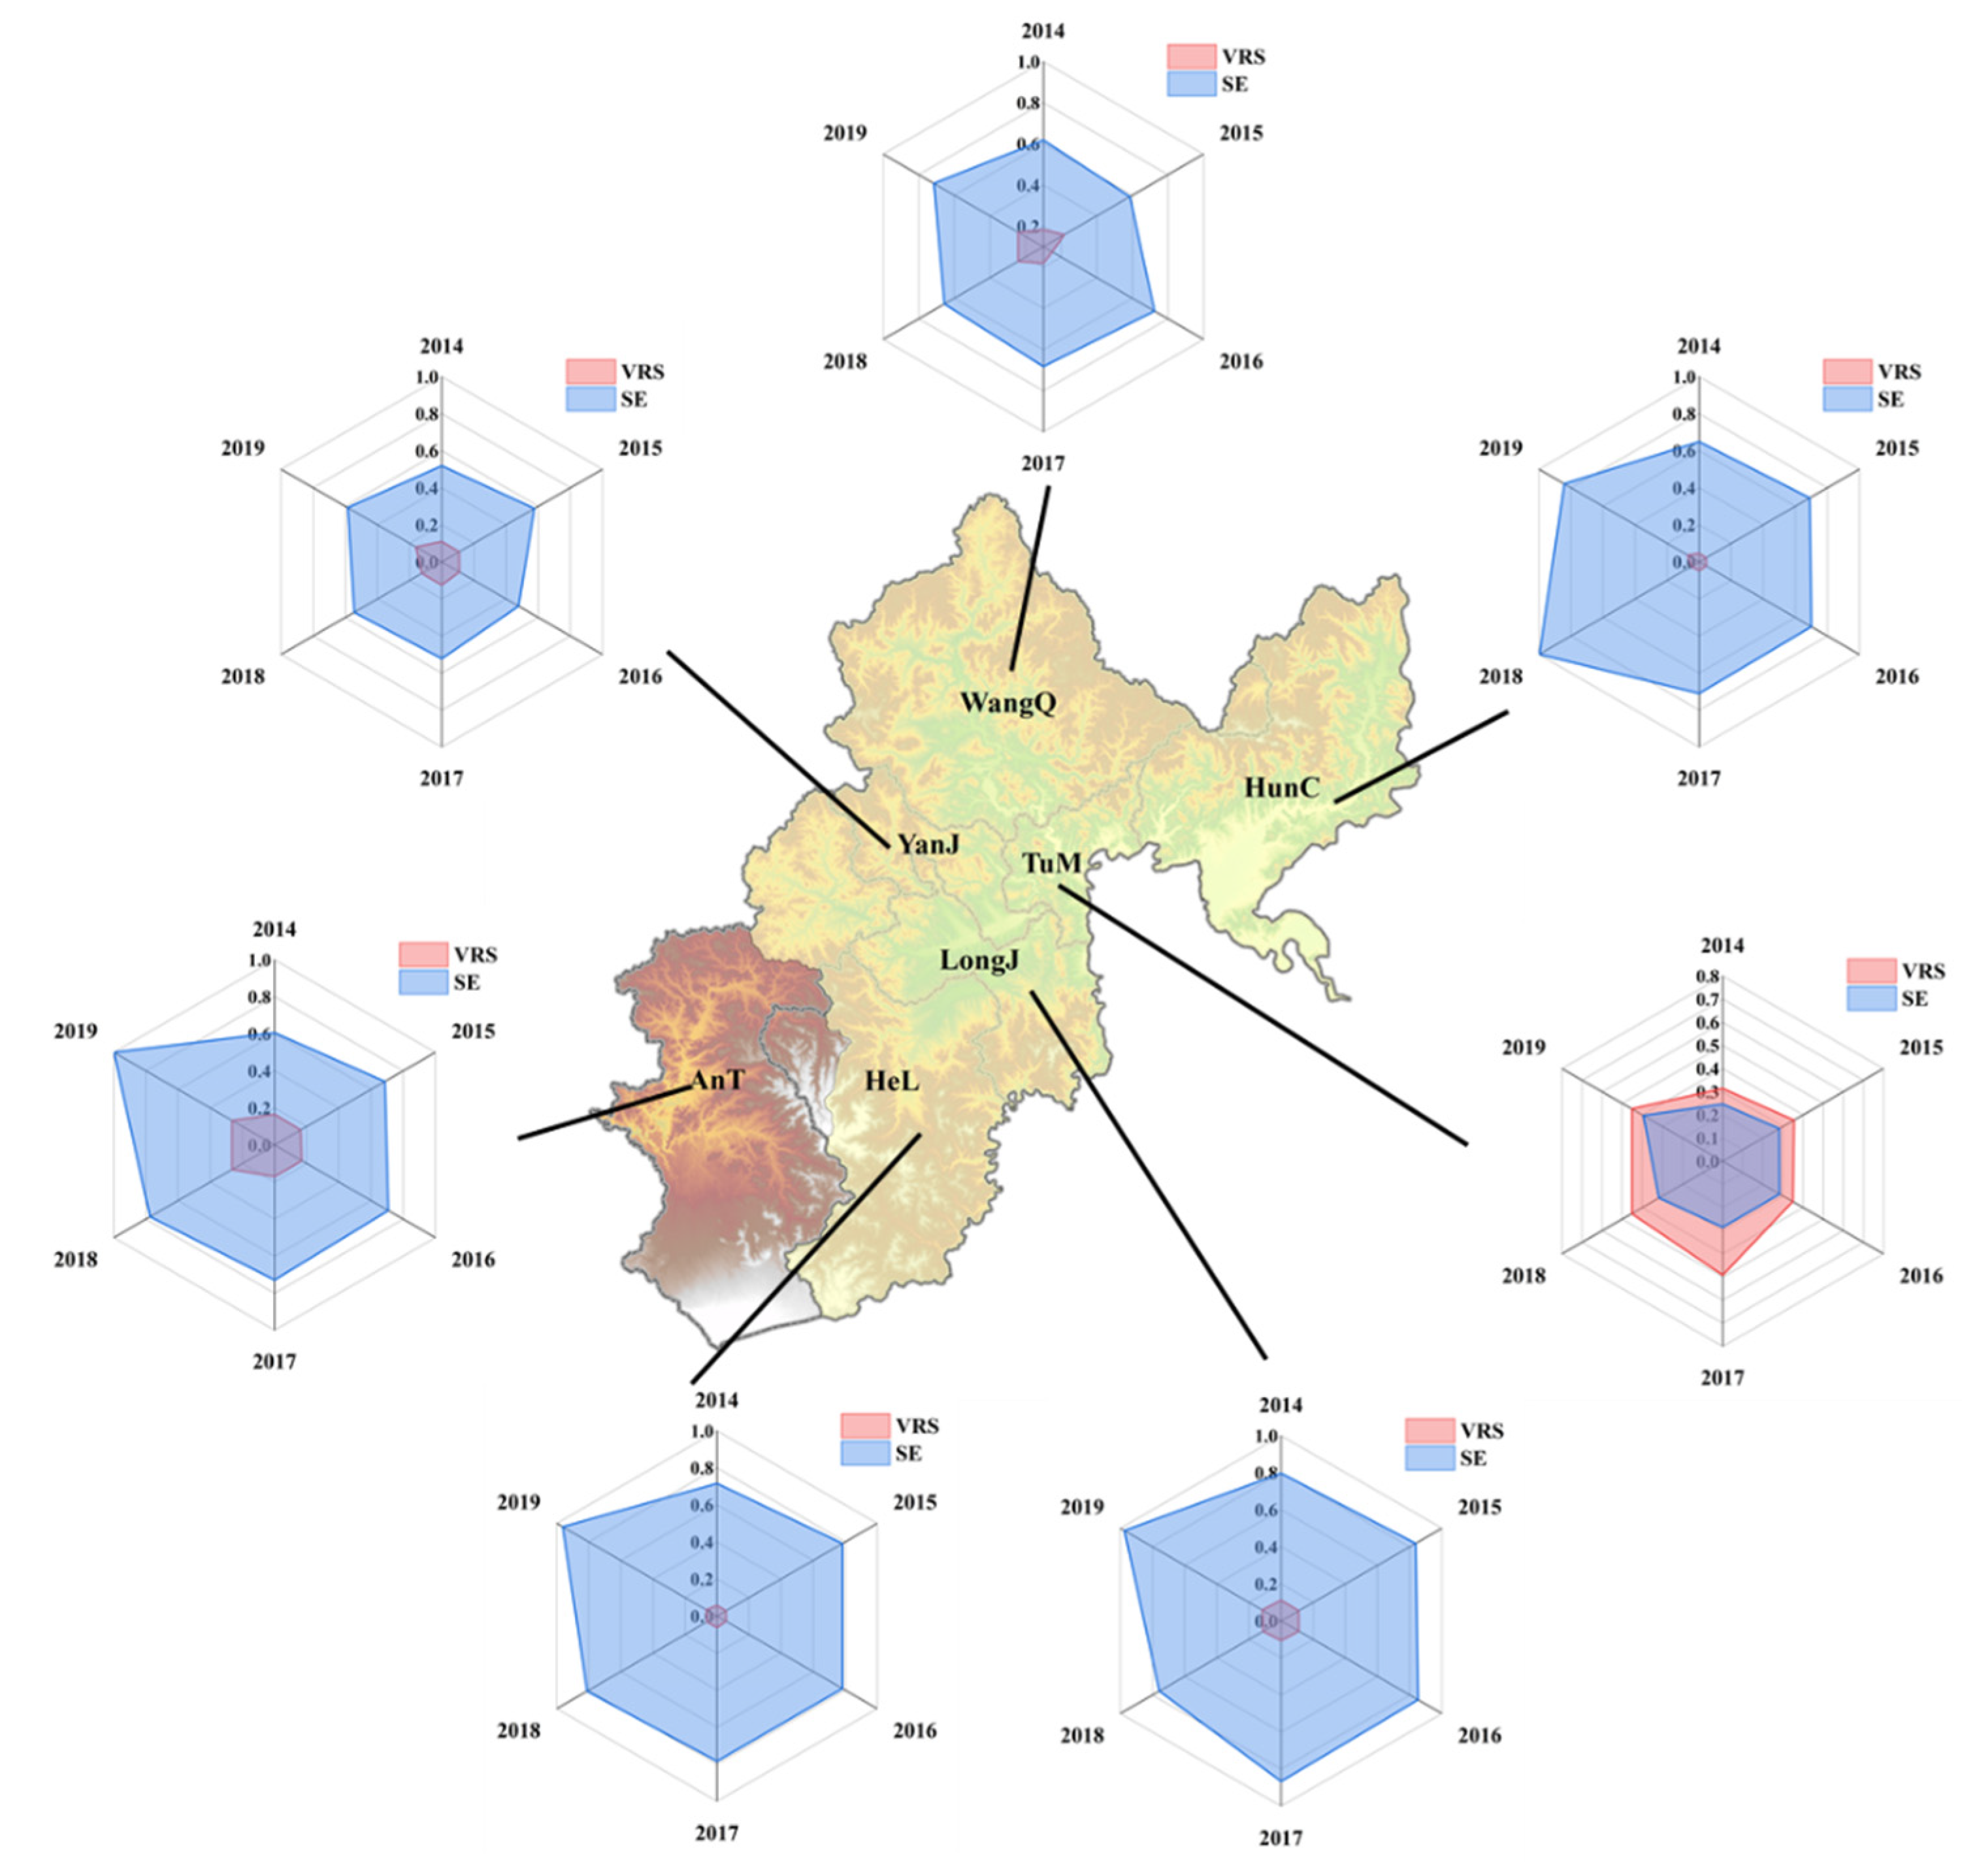
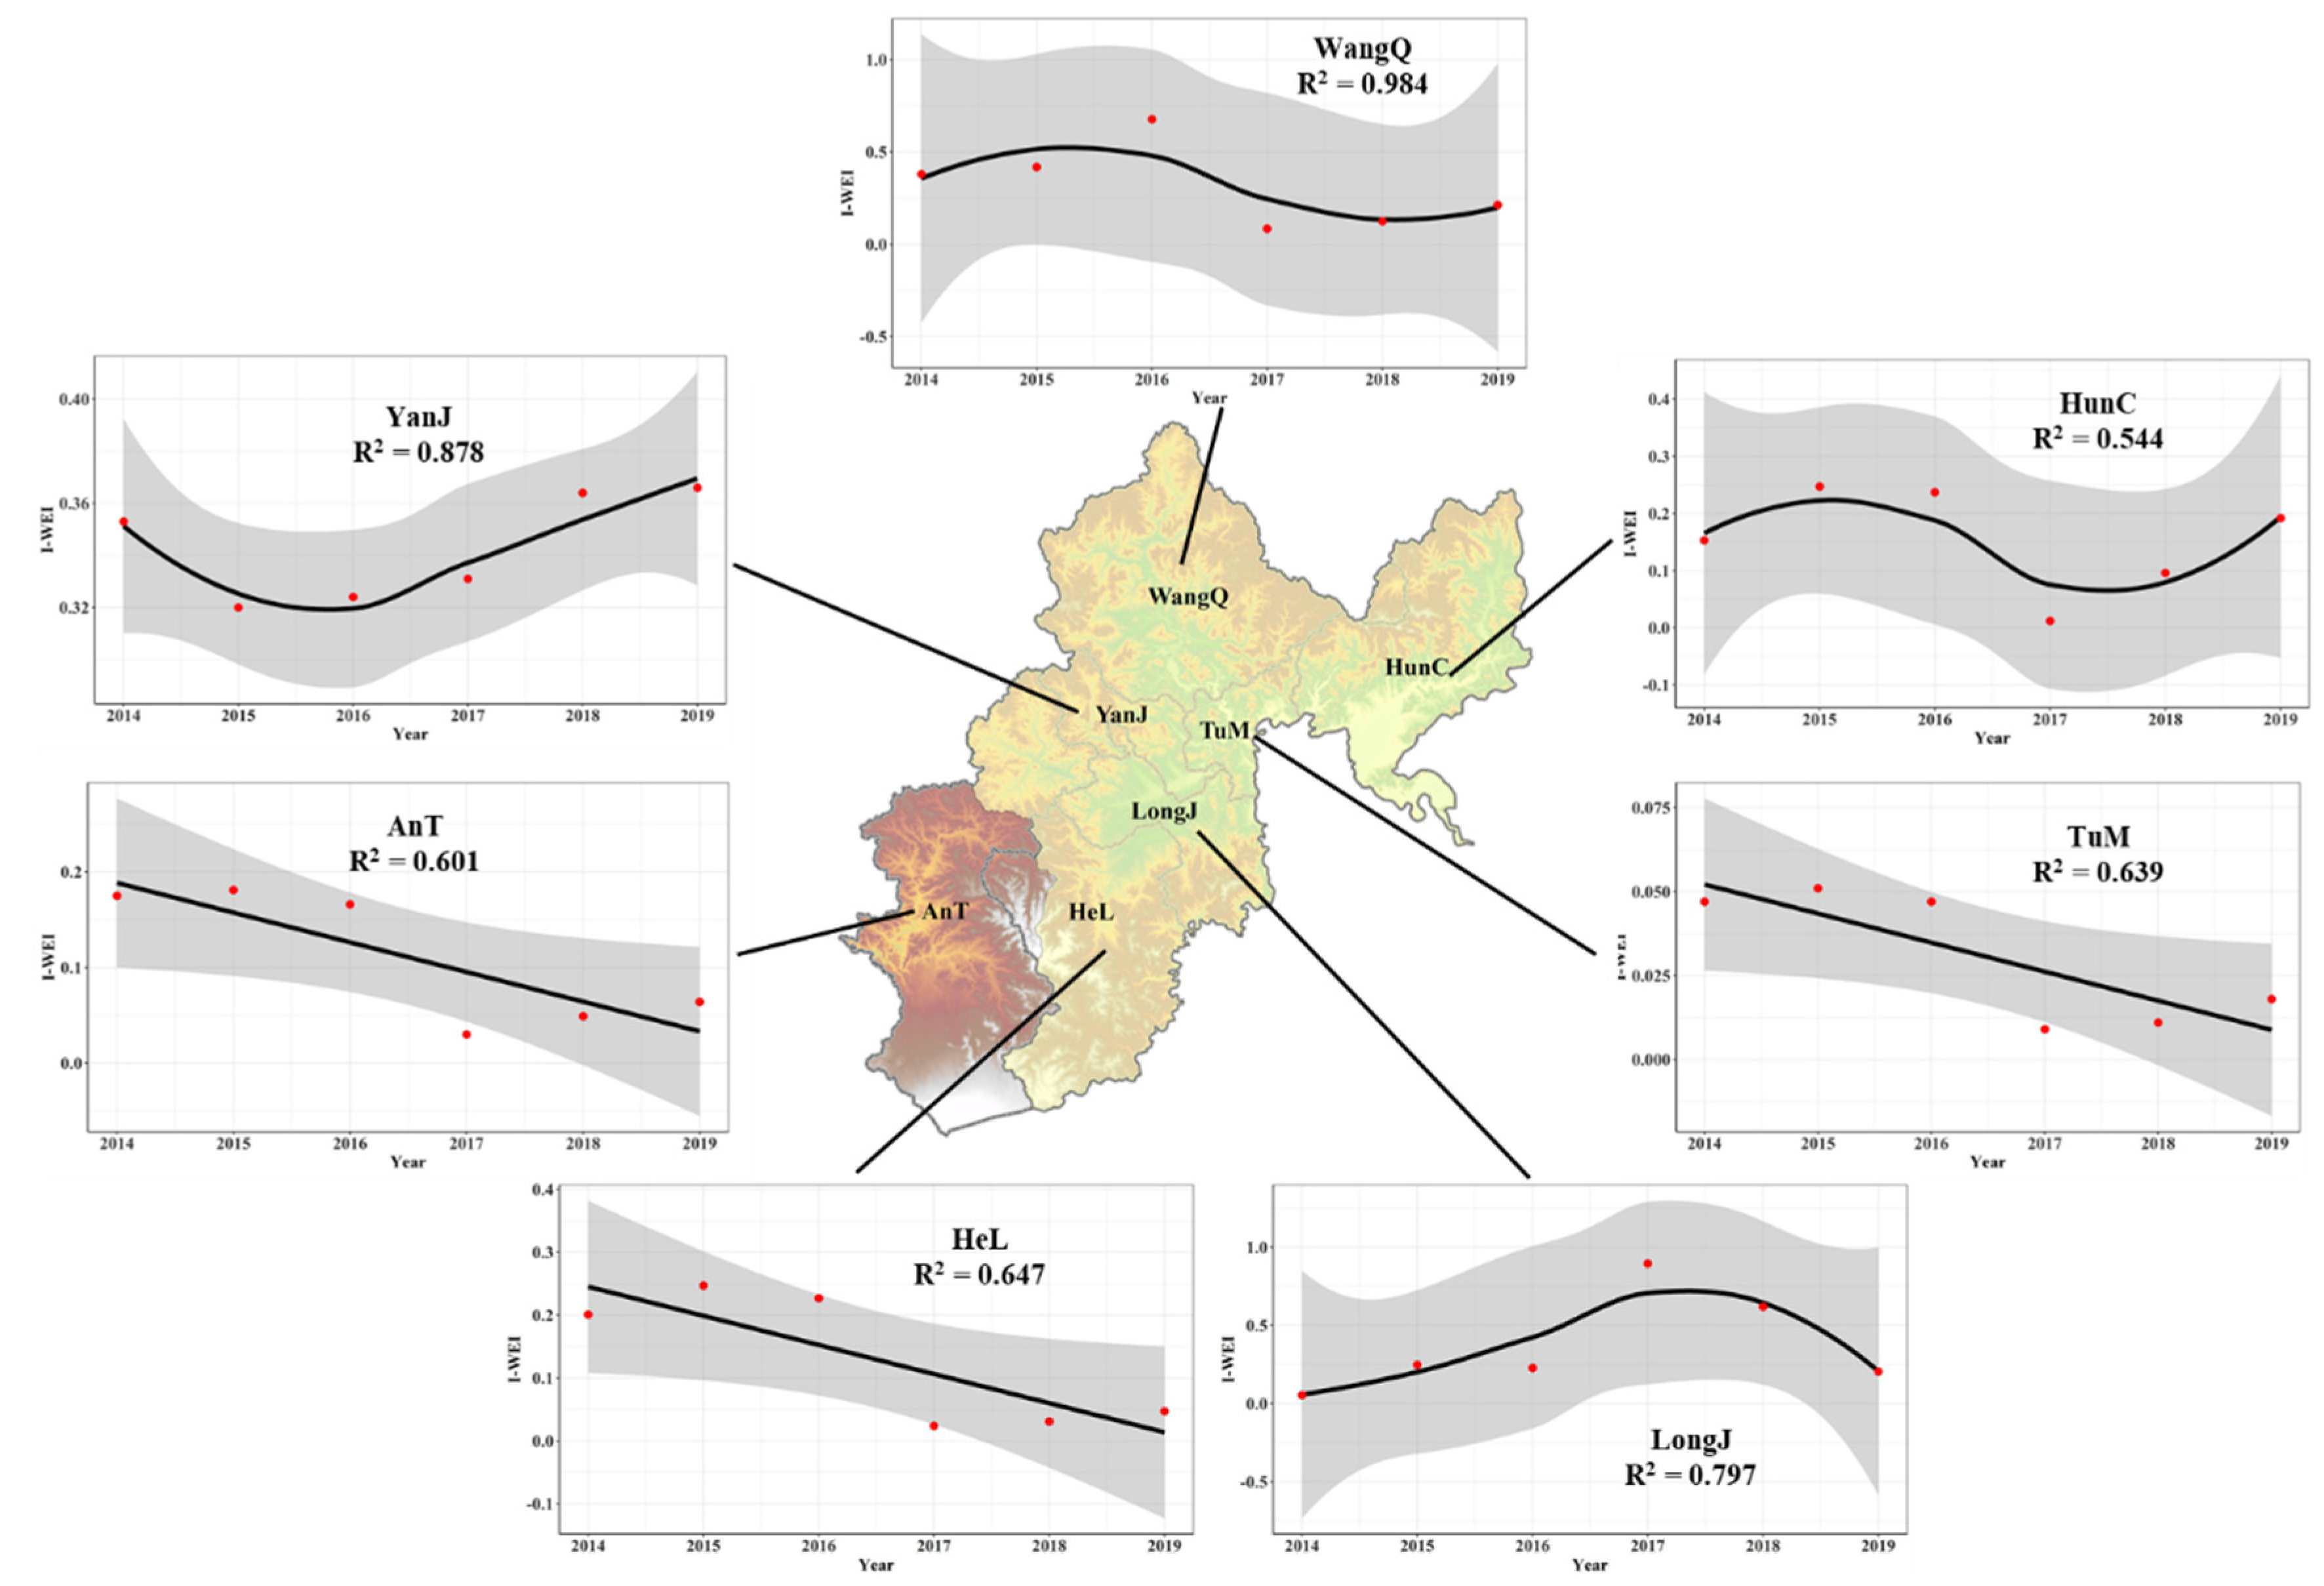
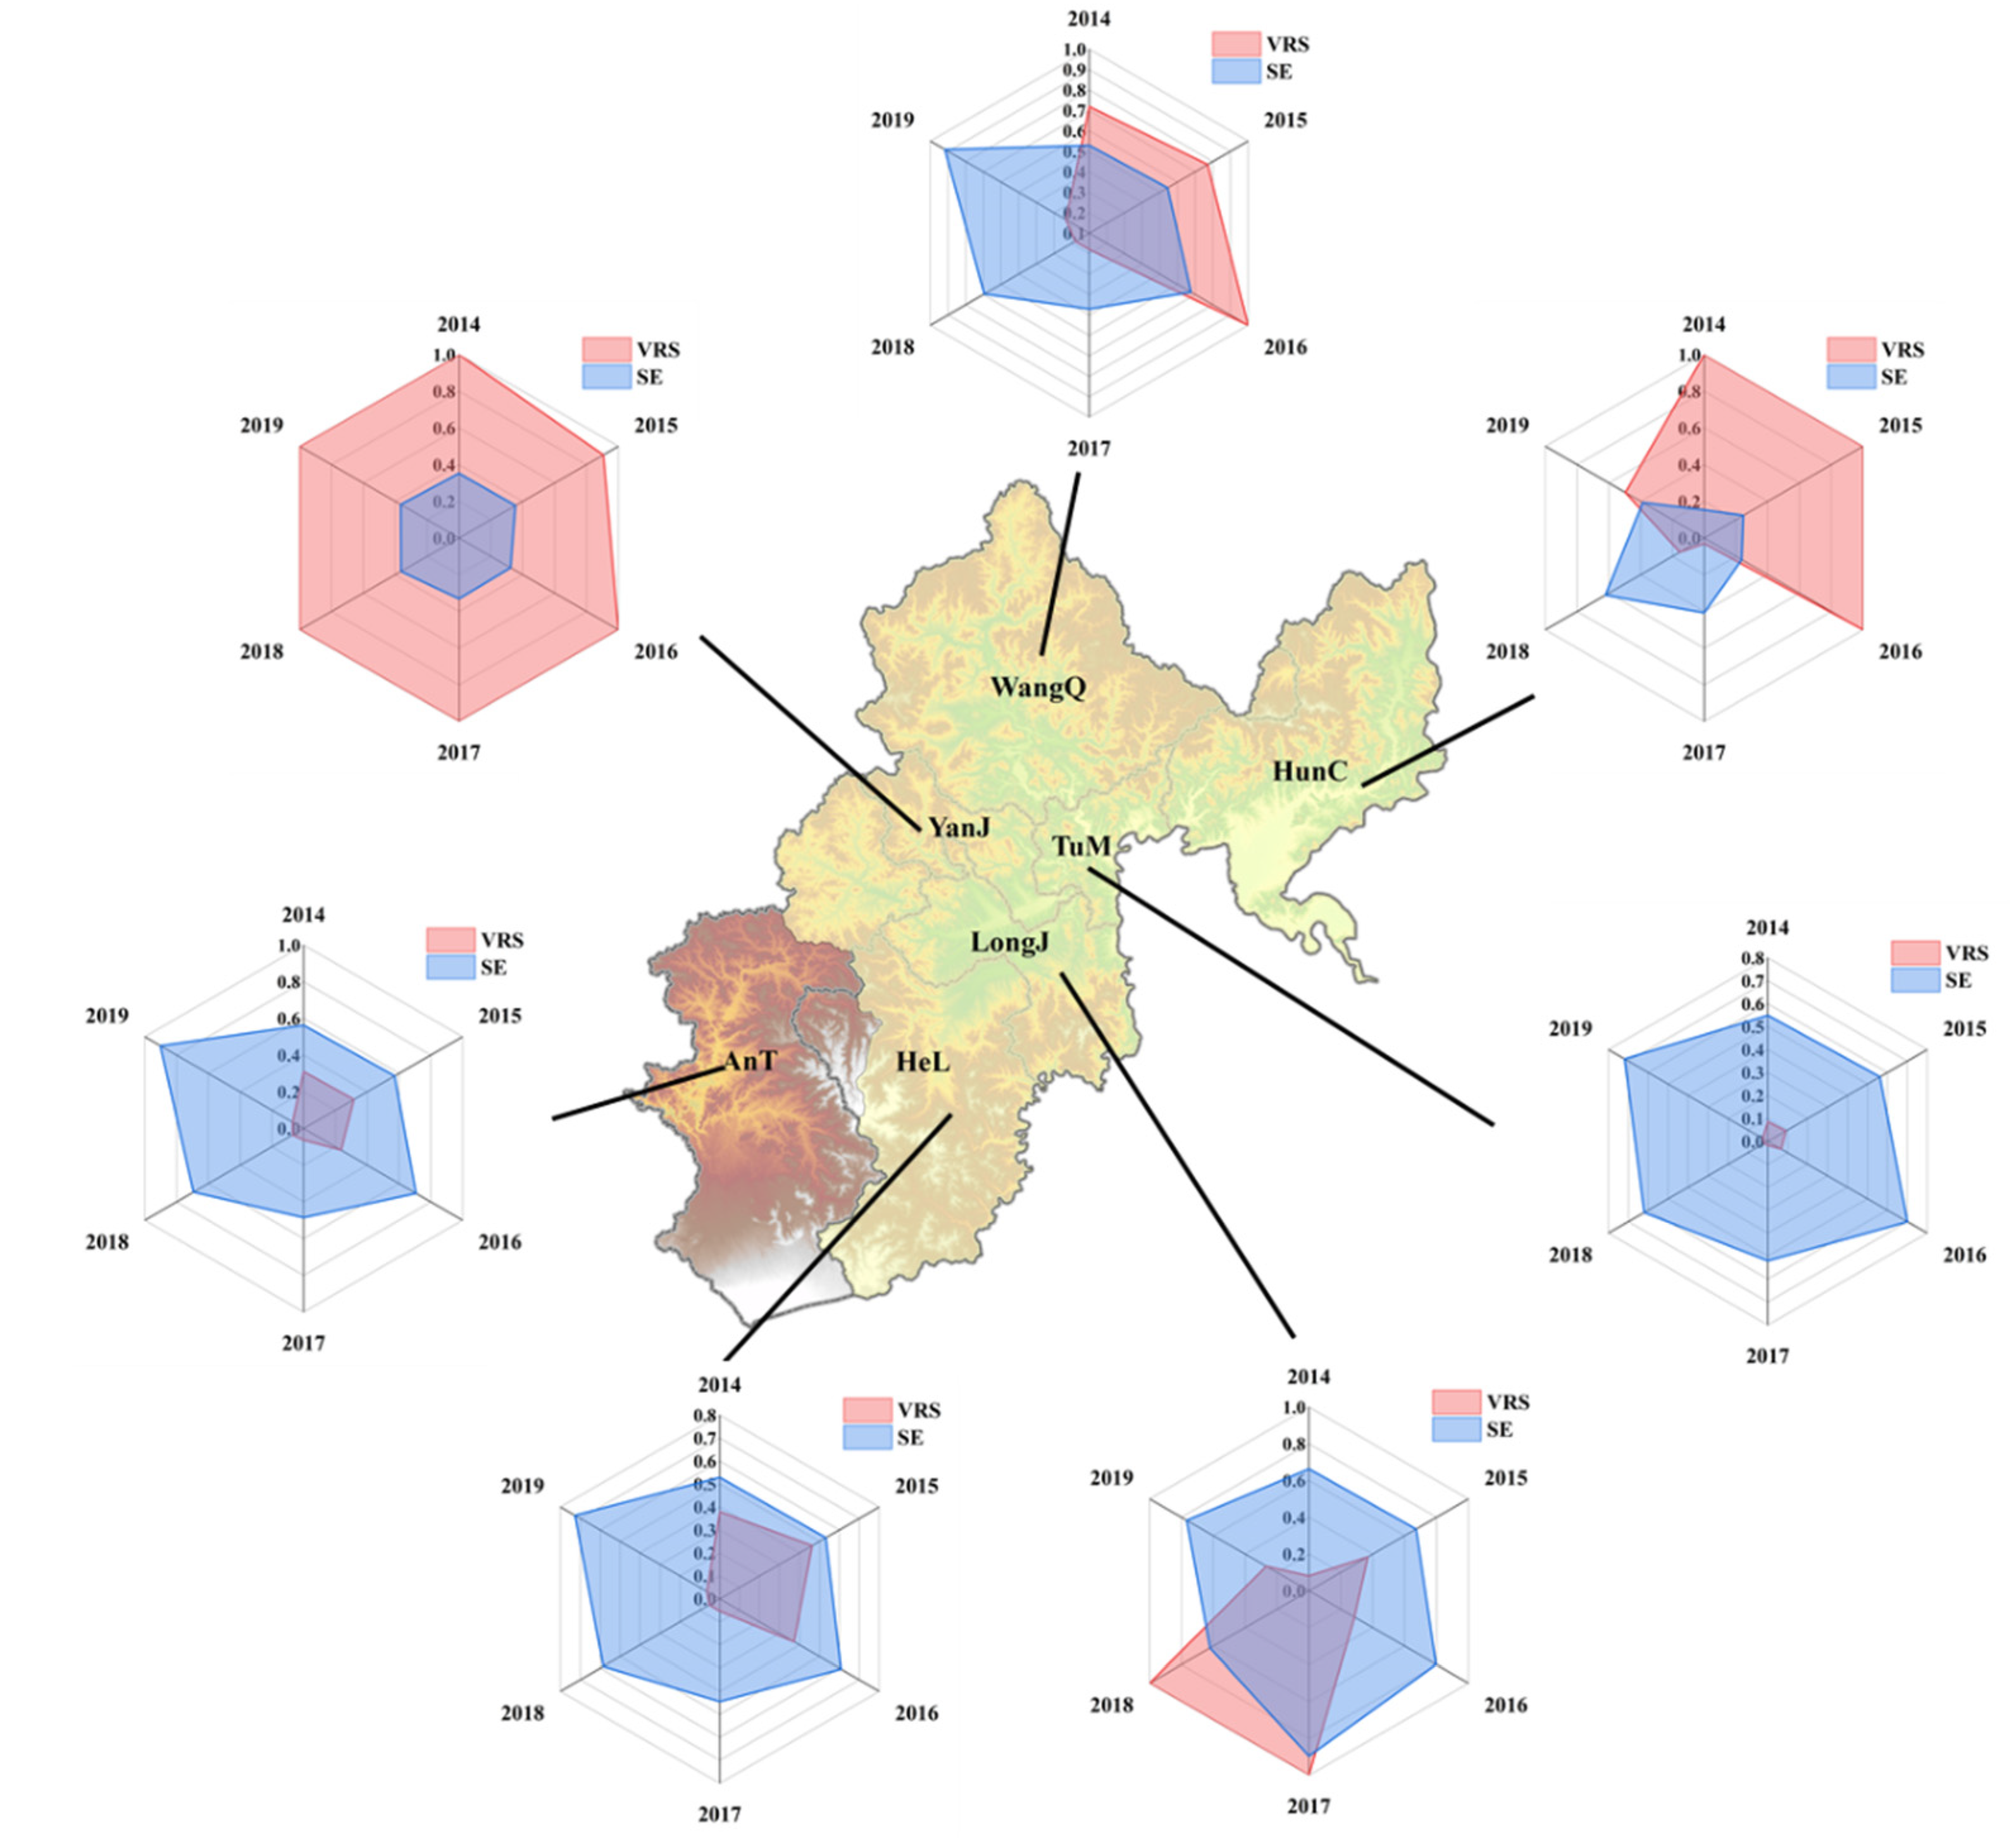
Figure 12 shows the variation trend of I-WEI in each region from 2014 to 2019. At the same time, we show the calculation results of TE and SE in each region in Figure 13 to analyze the causes of I-WEI changes. The results show that the I-WEI values of AnT, HeL, and TuM show a downward trend. Technical efficiency, involving factors such as management and water supply facilities, is the main factor affecting the comprehensive industrial water use efficiency of AnT, HeL and TuM. The I-WEI of HunC and YanJ showed a trend of decreasing first, then increasing, and then gradually increasing after 2016 and 2017, respectively. Scale efficiency is the main factor affecting the comprehensive industrial water use efficiency of YanJ. The comprehensive industrial water efficiency of HunC was mainly affected by the scale efficiency before 2016 and the technical efficiency after 2016. Mainly affected by technical efficiency, the I-WEI of LongJ showed an upward trend before 2017 and then gradually decreased. The change in I-WEI of WangQ was relatively stable, mainly showing a downward trend, and slightly increased after 2018. Additionally, the comprehensive industrial water use efficiency of WangQ was mainly affected by technical efficiency after 2016.
3.4. Utilization Efficiency of Water Resources
The level of importance is determined according to the TRB’s socio-economic development bias. Although domestic water accounts for a small proportion of water consumption, it is the main factor to maintain daily life and protect human health. Agriculture is the main industry of the TRB and is also the main water user. In addition, from the perspective of water conservation, agricultural water use efficiency is the main indicator to evaluate the water use efficiency of the TRB region. Compared with other factors, the industrial water consumption in the TRB is relatively small, and its importance is relatively low. To sum up, the importance of domestic water use efficiency in the TRB is between equally important and moderately important when compared with the agricultural water use efficiency; domestic water use efficiency is strongly important when compared with industrial water use efficiency; agricultural water use efficiency is moderately important when compared with industrial water use efficiency. As is shown in Table 2, the weights of the domestic water use efficiency, agricultural water use efficiency and industrial water use efficiency of the TRB are 0.58, 0.31, and 0.11, respectively.
According to the weight of each factor and the DEA calculation results, the results of WEI in each region of the TRB are shown in Table 3. According to the statistics, the average value of WEI in the TRB was 0.401. As is shown in Figure 14, YanJ had the lowest average WEI value from 2014 to 2019 in the TRB, at only 0.229, while AnT has the highest WEI value, at 0.511. Among all the calculated results, AnT had the highest WEI value of 0.527 in 2019, while YanJ had the lowest WEI value of 0.222 in 2016. According to the calculation results, we have fitted the changing trend of WEI in each region from 2014 to 2019. As is shown in Figure 15, the WEI of HeL and LongJ shows a downward trend, while that of HunC shows an upward trend. In addition, the WEI of YanJ, AnT, and TuM showed a trend of declining first and then rising, and the turning point was around 2016. WangQ’s WEI showed an upward trend before 2016 and after 2017, and its value in 2016 decreased briefly in 2017.
4. Discussion
Under the influence of climate change and human activities, runoff in many areas is decreasing, and some permanent surface water bodies are transformed into seasonal water bodies, resulting in more serious water shortage problems [45,46]. Therefore, effective water resource management has become the most urgent task at present. The evaluation of water resources utilization efficiency is an important means of mapping the current status of regional water resources development and use, and is the basis for water resources management. In previous studies, DEA and AHP have been widely used in the evaluation of water resources utilization efficiency. The DEA is directly based on the input and output data of the decision unit for efficiency evaluation and is highly objective [8,47,48]. The AHP combines objective evaluation indicators based on a subjective judgement structure (mainly two-by-two comparisons) and is able to fully reflect the subjective thoughts of decision makers [49,50,51]. Often, only one of these methods is used when conducting water resources utilization efficiency evaluations. However, we believe that for a single water-using sector, objective factors such as water supply technology and the scale of water use are the main factors affecting water resources utilization efficiency. Subjective factors such as industrial structure and development planning also have an impact when evaluating the overall water resources utilization efficiency of a region. Therefore, in this study, we constructed the water resources utilization efficiency index (WEI) to evaluate the water resource efficiency of the region based on both DEA and AHP. DEA was used to evaluate the water use efficiency of domestic, agriculture and industry, and AHP was used to combine the results of the DEA analysis of each sector to evaluate the overall water resource efficiency of the region. This index comprehensively considers the objective factors (climate change, technology, scale, etc.) and subjective factors (decision-maker’s preference, development direction, etc.) that affect the water resource utilization efficiency so that it can more accurately and reasonably evaluate the water resource utilization efficiency of each region. Additionally, in contrast to other studies, the DMU, which expresses the regional advanced water use efficiency level, was added to the DEA analysis in this study to obtain the optimal water use level of the region. At the same time, we used the DEA-BCC model to calculate the TE and SE of domestic, agriculture, and industry to analyze the main factors affecting water use efficiency.
The results of the study show that, despite differences in WEI and its trends across regions, the overall water use efficiency of most cities will gradually improve in the future. In addition, according to our analysis, water use efficiency in most regions is mainly influenced by technical efficiency.
In terms of domestic water use efficiency, the domestic water use efficiency in WangQand HunC is on an upward trend, while in other areas the domestic water use efficiency is stable or declining. As shown in Figure 2 and Figure 3, the change in domestic water use in the TRB is relatively stable from 2014 to 2019, but the decline in domestic water use efficiency is explained by the large population loss in all areas except YanJ. In addition, as shown in Figure 7, relatively outdated water supply management practices and technologies, as well as ageing water supply equipment, are the main reasons for the inefficiency of domestic water use in most areas. Therefore, we recommend strengthening water management, supplying water according to demand and strictly enforcing a strict water resource management system. In addition, old water supply facilities should be renovated to reduce the leakage rate of the pipe network.
From the perspective of agricultural water use, water use efficiency is on the rise in all regions. On the one hand, the rapid development of agriculture due to the expanding scale of food production is one of the reasons for the increase in agricultural water use efficiency. On the other hand, the promotion of irrigation water-saving techniques and the improvement of agricultural water management are the main reasons for the increase in agricultural water use efficiency. Agriculture is the main water-using sector in the TRB and the continued promotion of irrigation water-saving techniques on farmland on an existing basis is of great significance in alleviating the contradiction between water supply and demand in the TRB.
In terms of industry, with the exception of YanJ, the added value of industry in all other regions showed a declining trend, with the decline in the scale of industrial output being one of the reasons for the impact on industrial water use efficiency. In addition, according to the results shown in Figure 14, backward industrial technology and the slow development of new industries are the main reasons for low industrial water use efficiency. Therefore, we suggest that we should vigorously develop new industries, carry out technical transformation of high water-consuming industries and improve the reuse rate of industrial water.
This study was limited by a lack of data and the fact that only three groups of input and output indicators were used for the DEA analysis of water use efficiency in domestic, industrial, and agricultural areas. If conditions permit, this method can be combined with other indicators to evaluate the comprehensive utilization efficiency of water resources more accurately, such as water consumption, ecological water consumption, GDP and irrigation area. At the same time, in this study, we added a DMU representing the optimal water use level according to relevant standards to evaluate the water resource utilization efficiency of each region. We adopted the regional average level for the output indicators in the DMU, which may have caused this assessment to underestimate the impact of scale efficiency on the comprehensive utilization efficiency of water resources. In future research, we will analyze the optimal input and output index values that the region may achieve to make the evaluation results of the comprehensive utilization efficiency of regional water resources more reasonable.
5. Conclusions
Water scarcity will become more and more serious as a result of climate change, placing greater demands on water resource management. Improving the efficiency of water resource use is one of the most basic and important ways to alleviate water resource problems. Therefore, there is an urgent need to solve the problem of how to respond more accurately and reasonably to the development and use of water resources under the influence of climate change. This study combines DEA and AHP to propose an evaluation method for comprehensive water resource utilization efficiency. The DEA model is used to evaluate the efficiency of water use in different sectors by comparing them across regions, reflecting the impact of objective factors such as climate change, water-saving technology and industry size on water use efficiency, while the APH model reflects the impact of subjective preferences of managers on water development and use efficiency by classifying the importance of different sectors. Therefore, in this study, the DEA-CCR model is used to calculate the water use efficiency of domestic, agricultural and industrial water use in each region. Additionally, the DEA-BCC model is used to calculate the TE and SE of various industries to analyze the main influencing factors of water use efficiency. Combined with the AHP method, a comprehensive efficiency rating index (WEI) of water resources and its evaluation method are proposed. At the same time, according to the analysis results, the policy recommendations for the TRB to improve water resource utilization efficiency are given. This study can provide a basis for strengthening regional water resource management. The main conclusions include the following:
- (1)
- The domestic water use efficiency of the TRB was between 0.274 and 0.775 and showed a stable or declining trend in most regions from 2014 to 2019. The WUE for agriculture was between 0.039 and 0.054, and all regions showed an increasing trend year by year. The industrial WUE was between 0.031 and 0.375 and showed a downward trend in most regions. Technical efficiency is the main factor affecting the water efficiency in the TRB for domestic, agricultural, and industrial use.
- (2)
- There are differences in the WEI and its change trend in different regions. The comprehensive utilization efficiency of water resources in most areas of TRB is on the rise, especially since 2016. However, due to the impact of domestic water use efficiency, the comprehensive utilization efficiency of water resources in HeL and LongJ shows a downward trend.
- (3)
- Technical efficiency is the main factor affecting the comprehensive utilization efficiency of water resources in the TRB. We propose to strengthen water resource management, strictly implement a water resource management system, promote water-saving technology and transform old water supply facilities to improve technical efficiency. In addition, by optimizing the industrial layout and vigorously developing high-tech industries, the scale efficiency of the TRB can be further improved while ensuring social and economic development.
Author Contributions
S.Z.: writing—original draft preparation; J.L., C.L. and F.Y.: writing—review and editing; L.J. and W.C.: data curation. All authors have read and agreed to the published version of the manuscript.
Funding
This research was funded by the National Key Research and Development Project (2019YFC0409104 and 2017YFC1502405) and the National Natural Science Foundation of China (51822906).
Institutional Review Board Statement
Not applicable.
Informed Consent Statement
Not applicable.
Data Availability Statement
The data presented in this study are available on request from the corresponding author.
Conflicts of Interest
The authors declare no conflict of interest.
References
- UNESDOC. World Water Development Report 2020: Water and Climate Change; UNESCO: Paris, France, 2020. [Google Scholar]
- IPCC. Climate Change 2022: Impacts, Adaptation and Vulnerability; IPCC: Geneva, Switxarland, 2022. [Google Scholar]
- Huang, W.; Duan, W.; Chen, Y. Rapidly declining surface and terrestrial water resources in Central Asia driven by socio-economic and climatic changes. Sci. Total Environ. 2021, 784, 147193. [Google Scholar] [CrossRef] [PubMed]
- Molekoa, M.; Avtar, R.; Kumar, P.; Thu Minh, H.; Dasgupta, R.; Johnson, B.; Sahu, N.; Verma, R.; Yunus, A. Spatio-Temporal Analysis of Surface Water Quality in Mokopane Area, Limpopo, South Africa. Water 2021, 13, 220. [Google Scholar] [CrossRef]
- Wang, G.; Lin, N.; Zhou, X.; Li, Z.; Deng, X. Three-Stage Data Envelopment Analysis of Agricultural Water Use Efficiency: A Case Study of the Heihe River Basin. Sustainability 2018, 10, 568. [Google Scholar] [CrossRef]
- Zhang, C.; Anadon, L.D. A multi-regional input–output analysis of domestic virtual water trade and provincial water footprint in China. Ecol. Econ. 2014, 100, 159–172. [Google Scholar] [CrossRef]
- Kang, S.; Hao, X.; Du, T.; Tong, L.; Su, X.; Lu, H.; Li, X.; Huo, Z.; Li, S.; Ding, R. Improving agricultural water productivity to ensure food security in China under changing environment: From research to practice. Agric. Water Manag. 2017, 179, 5–17. [Google Scholar] [CrossRef]
- Wang, M.; Huang, Y.; Li, D. Assessing the performance of industrial water resource utilization systems in China based on a two-stage DEA approach with game cross efficiency. J. Clean. Prod. 2021, 312, 127722. [Google Scholar] [CrossRef]
- Marston, L. Water use in a changing world. Nat. Clim. Chang. 2022, 12, 317–319. [Google Scholar] [CrossRef]
- Lv, H.; Yang, L.; Zhou, J.; Zhang, X.; Wu, W.; Li, Y.; Jiang, D. Water resource synergy management in response to climate change in China: From the perspective of urban metabolism. Resour. Conserv. Recycl. 2020, 163, 105095. [Google Scholar] [CrossRef]
- Li, Y.; Deng, J.; Zang, C.; Kong, M.; Zhao, J. Spatial and temporal evolution characteristics of water resources in the Hanjiang River Basin of China over 50 years under a changing environment. Front. Environ. Sci. 2022, 10, 968693. [Google Scholar] [CrossRef]
- Li, J.; Tian, P.; Shi, X.; Gong, H.; Wang, L.; Liu, R.; Shao, S. Research progress on water resource management. J. Zhejiang Univ. Sci. Ed. 2019, 46, 248–260. [Google Scholar]
- Claudia, P.W. Adaptive and sustainable water management: From improved conceptual foundations to transformative change. Int. J. Water Resour. Dev. 2020, 36, 397–415. [Google Scholar]
- Ren, C.; Li, Z.; Zhang, H. Integrated multi-objective stochastic fuzzy programming and AHP method for agricultural water and land optimization allocation under multiple uncertainties. J. Clean. Prod. 2019, 210, 12–24. [Google Scholar] [CrossRef]
- Tan, Q.; Zhang, T. Robust fractional programming approach for improving agricultural water-use efficiency under uncertainty. J. Hydrol. 2018, 564, 1110–1119. [Google Scholar] [CrossRef]
- Ali, M.E. Knowledge-Based Optimization Model for Control Valve Locations in Water Distribution Networks. J. Water Resour. Plan. Manag. 2015, 141, 04014048. [Google Scholar] [CrossRef]
- Ren, C.F.; Guo, P.; Li, M.; Gu, J.J. Optimization of Industrial Structure Considering the Uncertainty of Water Resources. Water Resour. Manag. 2013, 27, 3885–3898. [Google Scholar] [CrossRef]
- Ren, C.F.; Li, R.H.; Zhang, L.D.; Guo, P. Multiobjective Stochastic Fractional Goal Programming Model for Water Resources Optimal Allocation among Industries. J. Water Resour. Plan. Manag. 2016, 142, 10. [Google Scholar] [CrossRef]
- Liu, H.; Jia, Y.W.; Niu, C.W.; Gan, Y.D. Spatial Pattern Analysis of Regional Water Use Profile Based on the Gini Coefficient and Location Quotient. J. Am. Water Resour. Assoc. 2019, 55, 1349–1366. [Google Scholar] [CrossRef]
- Mat, H.; Burak, S. Municipal water demand and efficiency analysis: Case studies in Turkey. Water Policy 2010, 12, 695–706. [Google Scholar] [CrossRef]
- Glickfeld, M.; Naik, K.S. Integrating water distribution system efficiency into the water conservation strategy for California: A Los Angeles perspective. Water Policy 2017, 19, 1030–1048. [Google Scholar] [CrossRef]
- Cheng, Z.; Zhao, Y.T.; Wang, N.N.; Song, T.; Song, Z. Assessing the Impact of the Strictest Water Resources Management Policy on Water Use Efficiency in China. Water 2022, 14, 2291. [Google Scholar] [CrossRef]
- Chen, Q.; Ai, H.; Zhang, Y.; Hou, J. Marketization and water resource utilization efficiency in China. Sustain. Comput. Inform. Syst. 2019, 22, 32–43. [Google Scholar] [CrossRef]
- Wang, X.B.; Wang, Z.L. Research on the impact of environmental regulation on water resources utilization efficiency in China based on the SYS-GMM model. Water Supply 2021, 21, 3643–3656. [Google Scholar] [CrossRef]
- Han, Z.Q.; Liu, T.; Wang, T.; Liu, H.F.; Hao, X.R.; Ouyang, Y.N.; Zheng, B.; Li, B.L. Quantification of water resource utilization efficiency as the main driver of plant diversity in the water-limited ecosystems. Ecol. Model. 2020, 429, 108974. [Google Scholar] [CrossRef]
- Pan, Z.; Wang, Y.; Zhou, Y.; Wang, Y. Analysis of the water use efficiency using super-efficiency data envelopment analysis. Appl. Water Sci. 2020, 10, 139. [Google Scholar] [CrossRef]
- Ren, B.; Zhang, Q.W.; Ren, J.H.; Ye, S.; Yan, F. A Novel Hybrid Approach for Water Resources Carrying Capacity Assessment by Integrating Fuzzy Comprehensive Evaluation and Analytical Hierarchy Process Methods with the Cloud Model. Water 2020, 12, 3241. [Google Scholar] [CrossRef]
- Zhu, Y.N.; Jiang, S.; Han, X.X.Q.; Gao, X.R.; He, G.H.; Zhao, Y.; Li, H.H. A Bibliometrics Review of Water Footprint Research in China: 2003–2018. Sustainability 2019, 11, 5082. [Google Scholar] [CrossRef]
- Saaty, T.L. A scaling method for priorities in hierarchical structures. J. Math. Psychol. 1977, 15, 234–281. [Google Scholar] [CrossRef]
- Abed-Elmdoust, A.; Kerachian, R. Evaluating the Relative Power of Water Users in Inter-Basin Water Transfer Systems. Water Resour. Manag. 2014, 28, 495–509. [Google Scholar] [CrossRef]
- Poveda-Bautista, R.; Roig-Merino, B.; Puerto, H.; Buitrago-Vera, J. Assessment of Irrigation Water Use Efficiency in Citrus Orchards Using AHP. Int. J. Environ. Res. Public Health 2021, 18, 5667. [Google Scholar] [CrossRef]
- Ren, C.; Li, R.; Guo, P. Two-Stage DEA Analysis of Water Resource Use Efficiency. Sustainability 2016, 9, 52. [Google Scholar] [CrossRef]
- Wang, S.; Zhou, L.; Wang, H.; Li, X. Water Use Efficiency and Its Influencing Factors in China: Based on the Data Envelopment Analysis (DEA)—Tobit Model. Water 2018, 10, 832. [Google Scholar] [CrossRef]
- Yang, W.; Li, L. Analysis of Total Factor Efficiency of Water Resource and Energy in China: A Study Based on DEA-SBM Model. Sustainability 2017, 9, 1316. [Google Scholar] [CrossRef] [Green Version]
- Yang, Y. Evaluation of China’s water-resource utilization efficiency based on a DEA-Tobit two-stage model. Water Supply 2021, 21, 1764–1777. [Google Scholar] [CrossRef]
- Zhang, S.; Liu, J.; Li, C.; Yu, F.; Jing, L.; Sun, J. Analyzing the Impact of Climate Change and Human Activities on Surface Runoff in the Changbai Mountain Area, Northeast China. Water 2021, 13, 3473. [Google Scholar] [CrossRef]
- Qi, P.; Huang, X.; Xu, Y.J.; Li, F.; Wu, Y.; Chang, Z.; Li, H.; Zhang, W.; Jiang, M.; Zhang, G.; et al. Divergent trends of water bodies and their driving factors in a high-latitude water tower, Changbai Mountain. J. Hydrol. 2021, 603, 127094. [Google Scholar] [CrossRef]
- Charnes, A.; Cooper, W.W.; Rhodes, E.; Slowinski, R.; Artalejo, J.; Billaut, J.C.; Dyson, R.; Peccati, L. Measuring the efficiency of decision making units. Eur. J. Oper. Res. 1978, 2, 429–444. [Google Scholar] [CrossRef]
- Banker, R.D.; Charnes, A.; Cooper, W.W. Some Models for Estimating Technical and Scale Inefficiencies in Data Envelopment Analysis. Manag. Sci. 1984, 30, 1078–1092. [Google Scholar] [CrossRef]
- Cooper, W.W.; Seiford, L.M.; Zhu, J. Handbook on Data Envelopment Analysis; Springer: Berlin/Heidelberg, Germany, 2004. [Google Scholar]
- Arshad, A.; Zhang, Z.; Zhang, W.; Dilawar, A. Mapping favorable groundwater potential recharge zones using a GIS-based analytical hierarchical process and probability frequency ratio model:A case study from an agro-urban region of Pakistan. Geosci. Front. 2020, 11, 15. [Google Scholar] [CrossRef]
- Bathrellos, G.D.; Skilodimou, H.D.; Chousianitis, K.; Youssef, A.M.; Pradhan, B. Suitability estimation for urban development using multi-hazard assessment map. Sci. Total Environ. 2017, 575, 119–134. [Google Scholar] [CrossRef] [PubMed]
- Umar, M.; Khan, S.N.; Arshad, A.; Aslam, R.A.; Khan, H.M.S.; Rashid, H.; Pham, Q.B.; Nasir, A.; Noor, R.; Khedher, K.M.; et al. A modified approach to quantify aquifer vulnerability to pollution towards sustainable groundwater management in Irrigated Indus Basin. Environ. Sci. Pollut. Res. Int. 2022, 29, 27257–27278. [Google Scholar] [CrossRef]
- Vojtek, M.; Vojteková, J.; Costache, R.; Pham, Q.B.; Lee, S.; Arshad, A.; Sahoo, S.; Linh, N.T.T.; Anh, D.T. Comparison of multi-criteria-analytical hierarchy process and machine learning-boosted tree models for regional flood susceptibility mapping: A case study from Slovakia. Geomat. Nat. Hazards Risk 2021, 12, 1153–1180. [Google Scholar] [CrossRef]
- Huang, W.; Duan, W.; Nover, D.; Sahu, N.; Chen, Y. An integrated assessment of surface water dynamics in the Irtysh River Basin during 1990–2019 and exploratory factor analyses. J. Hydrol. 2021, 593, 125905. [Google Scholar] [CrossRef]
- Hu, Y.; Duan, W.; Chen, Y.; Zou, S.; Kayumba, P.M.; Sahu, N. An integrated assessment of runoff dynamics in the Amu Darya River Basin: Confronting climate change and multiple human activities, 1960–2017. J. Hydrol. 2021, 603, 126905. [Google Scholar] [CrossRef]
- Cheng, L.; Song, S.; Xie, Y. Evaluation of Water Resources Utilization Efficiency in Guangdong Province Based on the DEA–Malmquist Model. Front. Environ. Sci. 2022, 10, 819693. [Google Scholar] [CrossRef]
- Xie, Q.; Ma, H.; Zheng, X.; Wang, X.; Wang, F.-Y. Evaluation and Spatial–Temporal Difference Analysis of Urban Water Resource Utilization Efficiency Based on Two-Stage DEA Model. IEEE Trans. Comput. Soc. Syst. 2022, 9, 1282–1296. [Google Scholar] [CrossRef]
- Zhou, K. Comprehensive evaluation on water resources carrying capacity based on improved AGA-AHP method. Appl. Water Sci. 2022, 12, 103. [Google Scholar] [CrossRef]
- Sun, S.; Wang, Y.; Liu, J.; Cai, H.; Wu, P.; Geng, Q.; Xu, L. Sustainability assessment of regional water resources under the DPSIR framework. J. Hydrol. 2016, 532, 140–148. [Google Scholar] [CrossRef]
- Minatour, Y.; Bonakdari, H.; Aliakbarkhani, Z.S. Extension of Fuzzy Delphi AHP Based on Interval-Valued Fuzzy Sets and its Application in Water Resource Rating Problems. Water Resour. Manag. 2016, 30, 3123–3141. [Google Scholar] [CrossRef]
Figure 1.
Geographical location and precipitation in the Tumen River Basin (TRB).

Figure 2.
Analysis of water use in the TRB from 2014 to 2019.

Figure 3.
Socio-economic situation of the TRB from 2014 to 2019.

Figure 4.
Methods for data envelopment analysis (DEA). The red line represents the CCR model; the green line represents the BCC model.
Figure 4.
Methods for data envelopment analysis (DEA). The red line represents the CCR model; the green line represents the BCC model.

Figure 5.
Comparison of domestic water use efficiency in the TRB’s regions.

Figure 6.
The trend of domestic water efficiency from 2014 to 2019.

Figure 7.
The result of TE and SE for domestic water from 2014 to 2019.

Figure 8.
Comparison of agricultural water use efficiency in TRB regions.

Figure 9.
The trend of agricultural water efficiency from 2014 to 2019.

Figure 10.
The result of TE and SE for agricultural water from 2014 to 2019.

Figure 11.
Comparison of industrial water use efficiency in the TRB regions.

Figure 12.
The trend of industrial water efficiency from 2014 to 2019.

Figure 13.
The result of TE and SE for industrial water from 2014 to 2019.

Figure 14.
Comparison of water resource utilization efficiency index (WEI) in the TRB’s regions.

Figure 15.
The trend of the water resource utilization efficiency index (WEI) from 2014 to 2019.


Table 1.
The numerical values and their corresponding levels of importance.
| Levels of Importance | Value |
|---|---|
| Equally important | 1 |
| Moderately important | 3 |
| Strongly important | 5 |
| Very Strongly important | 7 |
| Extremely important | 9 |
| Intermediate values | 2, 4, 6, 8 |
Table 2.
The weighting coefficient of each factor in the evaluation of water resource utilization efficiency. L1 = domestic water use efficiency, L2 = agricultural water use efficiency, L3 = industrial water use efficiency.
Table 2.
The weighting coefficient of each factor in the evaluation of water resource utilization efficiency. L1 = domestic water use efficiency, L2 = agricultural water use efficiency, L3 = industrial water use efficiency.
| L1 | L2 | L3 | Weights | |
|---|---|---|---|---|
| L1 | 1 | 2 | 5 | 0.58 |
| L2 | 1/2 | 1 | 3 | 0.31 |
| L3 | 1/5 | 1/3 | 1 | 0.11 |
Table 3.
The WEI for each region in the TRB from 2014 to 2019.
| Regions | 2014 | 2015 | 2016 | 2017 | 2018 | 2019 |
|---|---|---|---|---|---|---|
| HeL | 0.468 | 0.502 | 0.487 | 0.433 | 0.422 | 0.421 |
| LongJ | 0.485 | 0.453 | 0.394 | 0.438 | 0.383 | 0.357 |
| YanJ | 0.236 | 0.230 | 0.222 | 0.225 | 0.224 | 0.239 |
| TuM | 0.350 | 0.284 | 0.280 | 0.304 | 0.310 | 0.319 |
| WangQ | 0.399 | 0.509 | 0.510 | 0.429 | 0.418 | 0.512 |
| HunC | 0.416 | 0.417 | 0.417 | 0.408 | 0.435 | 0.449 |
| AnT | 0.532 | 0.520 | 0.485 | 0.468 | 0.531 | 0.527 |
Disclaimer/Publisher’s Note: The statements, opinions and data contained in all publications are solely those of the individual author(s) and contributor(s) and not of MDPI and/or the editor(s). MDPI and/or the editor(s) disclaim responsibility for any injury to people or property resulting from any ideas, methods, instructions or products referred to in the content. |
© 2023 by the authors. Licensee MDPI, Basel, Switzerland. This article is an open access article distributed under the terms and conditions of the Creative Commons Attribution (CC BY) license (https://creativecommons.org/licenses/by/4.0/).
Share and Cite
MDPI and ACS Style
Zhang, S.; Liu, J.; Li, C.; Yu, F.; Jing, L.; Chen, W. Evaluation of Water Resources Utilization Efficiency Based on DEA and AHP under Climate Change. Water 2023, 15, 718. https://doi.org/10.3390/w15040718
AMA Style
Zhang S, Liu J, Li C, Yu F, Jing L, Chen W. Evaluation of Water Resources Utilization Efficiency Based on DEA and AHP under Climate Change. Water. 2023; 15(4):718. https://doi.org/10.3390/w15040718
Chicago/Turabian StyleZhang, Shanjun, Jia Liu, Chuanzhe Li, Fuliang Yu, Lanshu Jing, and Weifan Chen. 2023. "Evaluation of Water Resources Utilization Efficiency Based on DEA and AHP under Climate Change" Water 15, no. 4: 718. https://doi.org/10.3390/w15040718
Note that from the first issue of 2016, this journal uses article numbers instead of page numbers. See further details here.