Article

Evaluation of Human Health Risks Associated with Groundwater Contamination and Groundwater Pollution Prediction in a Landfill and Surrounding Area in Kaifeng City, China

The Fifth Institute of Resources and Environment Investigation of Hennan Province, Zhengzhou 450053, China
*
Author to whom correspondence should be addressed.
Water 2023, 15(4), 723; https://doi.org/10.3390/w15040723
Submission received: 16 November 2022 / Revised: 4 February 2023 / Accepted: 7 February 2023 / Published: 11 February 2023

Abstract

:
Landfill accumulation can cause its leachate to seep into groundwater, which can lower the quality of local groundwater. Exploring the risks of groundwater contamination to human health in the area around a landfill can offer a clear understanding of the current situation of regional groundwater and provide a theoretical basis for groundwater remediation and governance. By taking a landfill in Kaifeng City, China as the research object, this study explored the chemical types and sources of groundwater in the study area, used the entropy-weighted water quality index (EWQI) to evaluate the groundwater quality and assessed human health risks in the study area. The results show that the groundwater in the study area is neutral (7.14 ≤ pH ≤ 7.86), and the water chemical type is HCO3—Ca·Na. The EWQI results indicated that the overall water quality in the study area ranges from 48.4 to 250.26, which is above the medium level, and that the local water quality is poor. The deterioration of groundwater quality in the study area is mainly influenced by NH4+-N, Mn, As, F and Pb. According to the human health risk assessment model, the non-carcinogenic risk to humans through oral and dermal exposure can be assessed. In this paper, five ions, NH4+-N, Mn, As, F and Pb in groundwater, were selected for the analysis of groundwater in the study area to assess non-carcinogenic risk to humans through oral administration. The results showed that the hazard quotient (HQ) values for NH4+-N, Mn, As, F and Pb varied in the following ranges: 9.14 × 10⁻⁴—0.03; 0.07—0.22; 0.02–0.07; 0.16—0.23; and 0.01—0.13, respectively (all of these are less than 1, and so the potential risks to human health can be ignored). The characteristic pollutant Pb was selected as a predictor to study the influence on groundwater quality in eastern fish ponds and farmlands under continuous leakage. The leakage can be detected timeously to reduce the effects downstream by using enhanced monitoring measures.

1. Introduction

Landfill is a common way to dispose of solid waste in most countries and regions [1]. Improper landfill management or aging facilities can cause leachate to flow into groundwater and change the chemical components of groundwater [2,3]. Leachate is an effluent containing organic matter and heavy metal ions due to the influence of solid waste [4,5]. Leachate causes changes in the contents of anions and cations in groundwater as well as an increase in the content of heavy metal ions, effects which can pollute groundwater. Common groundwater contamination includes heavy metal contamination, “tri-nitrogen” contamination, fluoride contamination, arsenic contamination, and organic contamination [6]. Heavy metal ions are difficult to biodegrade in the groundwater circulation system. Additionally, because they are persistent, bio-accumulative, carcinogenic, and endocrine-disrupting, heavy metals can continue to degrade the groundwater environment and threaten human life and health [7,8,9,10,11,12,13,14]; fluoride in groundwater is a major cause of dental fluorosis and bone wrinkles in people around the world [15]; organic contamination poses a moderate to high risk to aquatic organisms in groundwater [16]. Excess fluoride in drinking water can negatively affect human intellectual development, reproductive hormone levels and protoplasm, and influence the enzymatic, digestive, urinary, and cardiovascular systems to varying degrees [17]. Excess lead has systemic effects on the human body, including the human respiratory, cardiovascular, digestive, hematological, neurological, and reproductive systems, and affects children’s intelligence quotient [18]. In recent years, many scholars at home and abroad have explored groundwater pollutant sources, spatial distribution characteristics, and pollution using different methods, and have achieved remarkable results. For example, multivariate analysis methods such as Pearson correlation coefficient analysis and principal component analysis were employed to investigate sources of such metals [19] and to determine human health risks using the chronic dose index for toxic and metal-like metals [20]. The multivariate statistical method was adopted to estimate spatial distributions and pollution evaluation [21] and the landfill water pollution index, entropy-weighted water quality index (EWQI), and groundwater pollution indices were employed to evaluate water quality, etc. [22,23,24].
The human health risk assessment model can be used to establish the relationship between groundwater contaminants and human health and assess their hazard level, and this model is widely used to evaluate groundwater pollution hazards [25,26,27,28,29,30,31]. Therefore, long-term observation and human health risk management in high-risk areas with poor groundwater quality are necessary to avoid adverse effects of chemical substances in groundwater on the health of drinking water populations (residents in the study area who exploit and use shallow groundwater). Predicting the trend of contaminant dispersion is important to eliminate or control pollution [32]. The groundwater modeling system (GMS) is commonly used groundwater simulation software and is the most effective simulation software, using a modular finite-difference ground-water flow model and a modular three-dimensional multispecies transport model [33]. The use of model simulations allows for the visualization of pollutant trends over time and space and provides a basis for pollutant treatment.
The present research is based on a study of an informal landfill (built without the approval of the relevant departments, operators did not obtain the approval of the land department and environmental protection department and or complete other required procedures for landfills) in Kaifeng City, China. The aims of the research are to determine the groundwater quality and the type of groundwater chemistry in the study area through water chemical analysis, to evaluate the groundwater quality and the main harmful ions in the study area, and to estimate the health risks in the study area on this basis. GMS software was used to simulate the pattern of the characteristic Pb pollutant concentration (and its spatiotemporal variation) in the study area. The result provides a theoretical basis for the remediation and treatment of landfills.

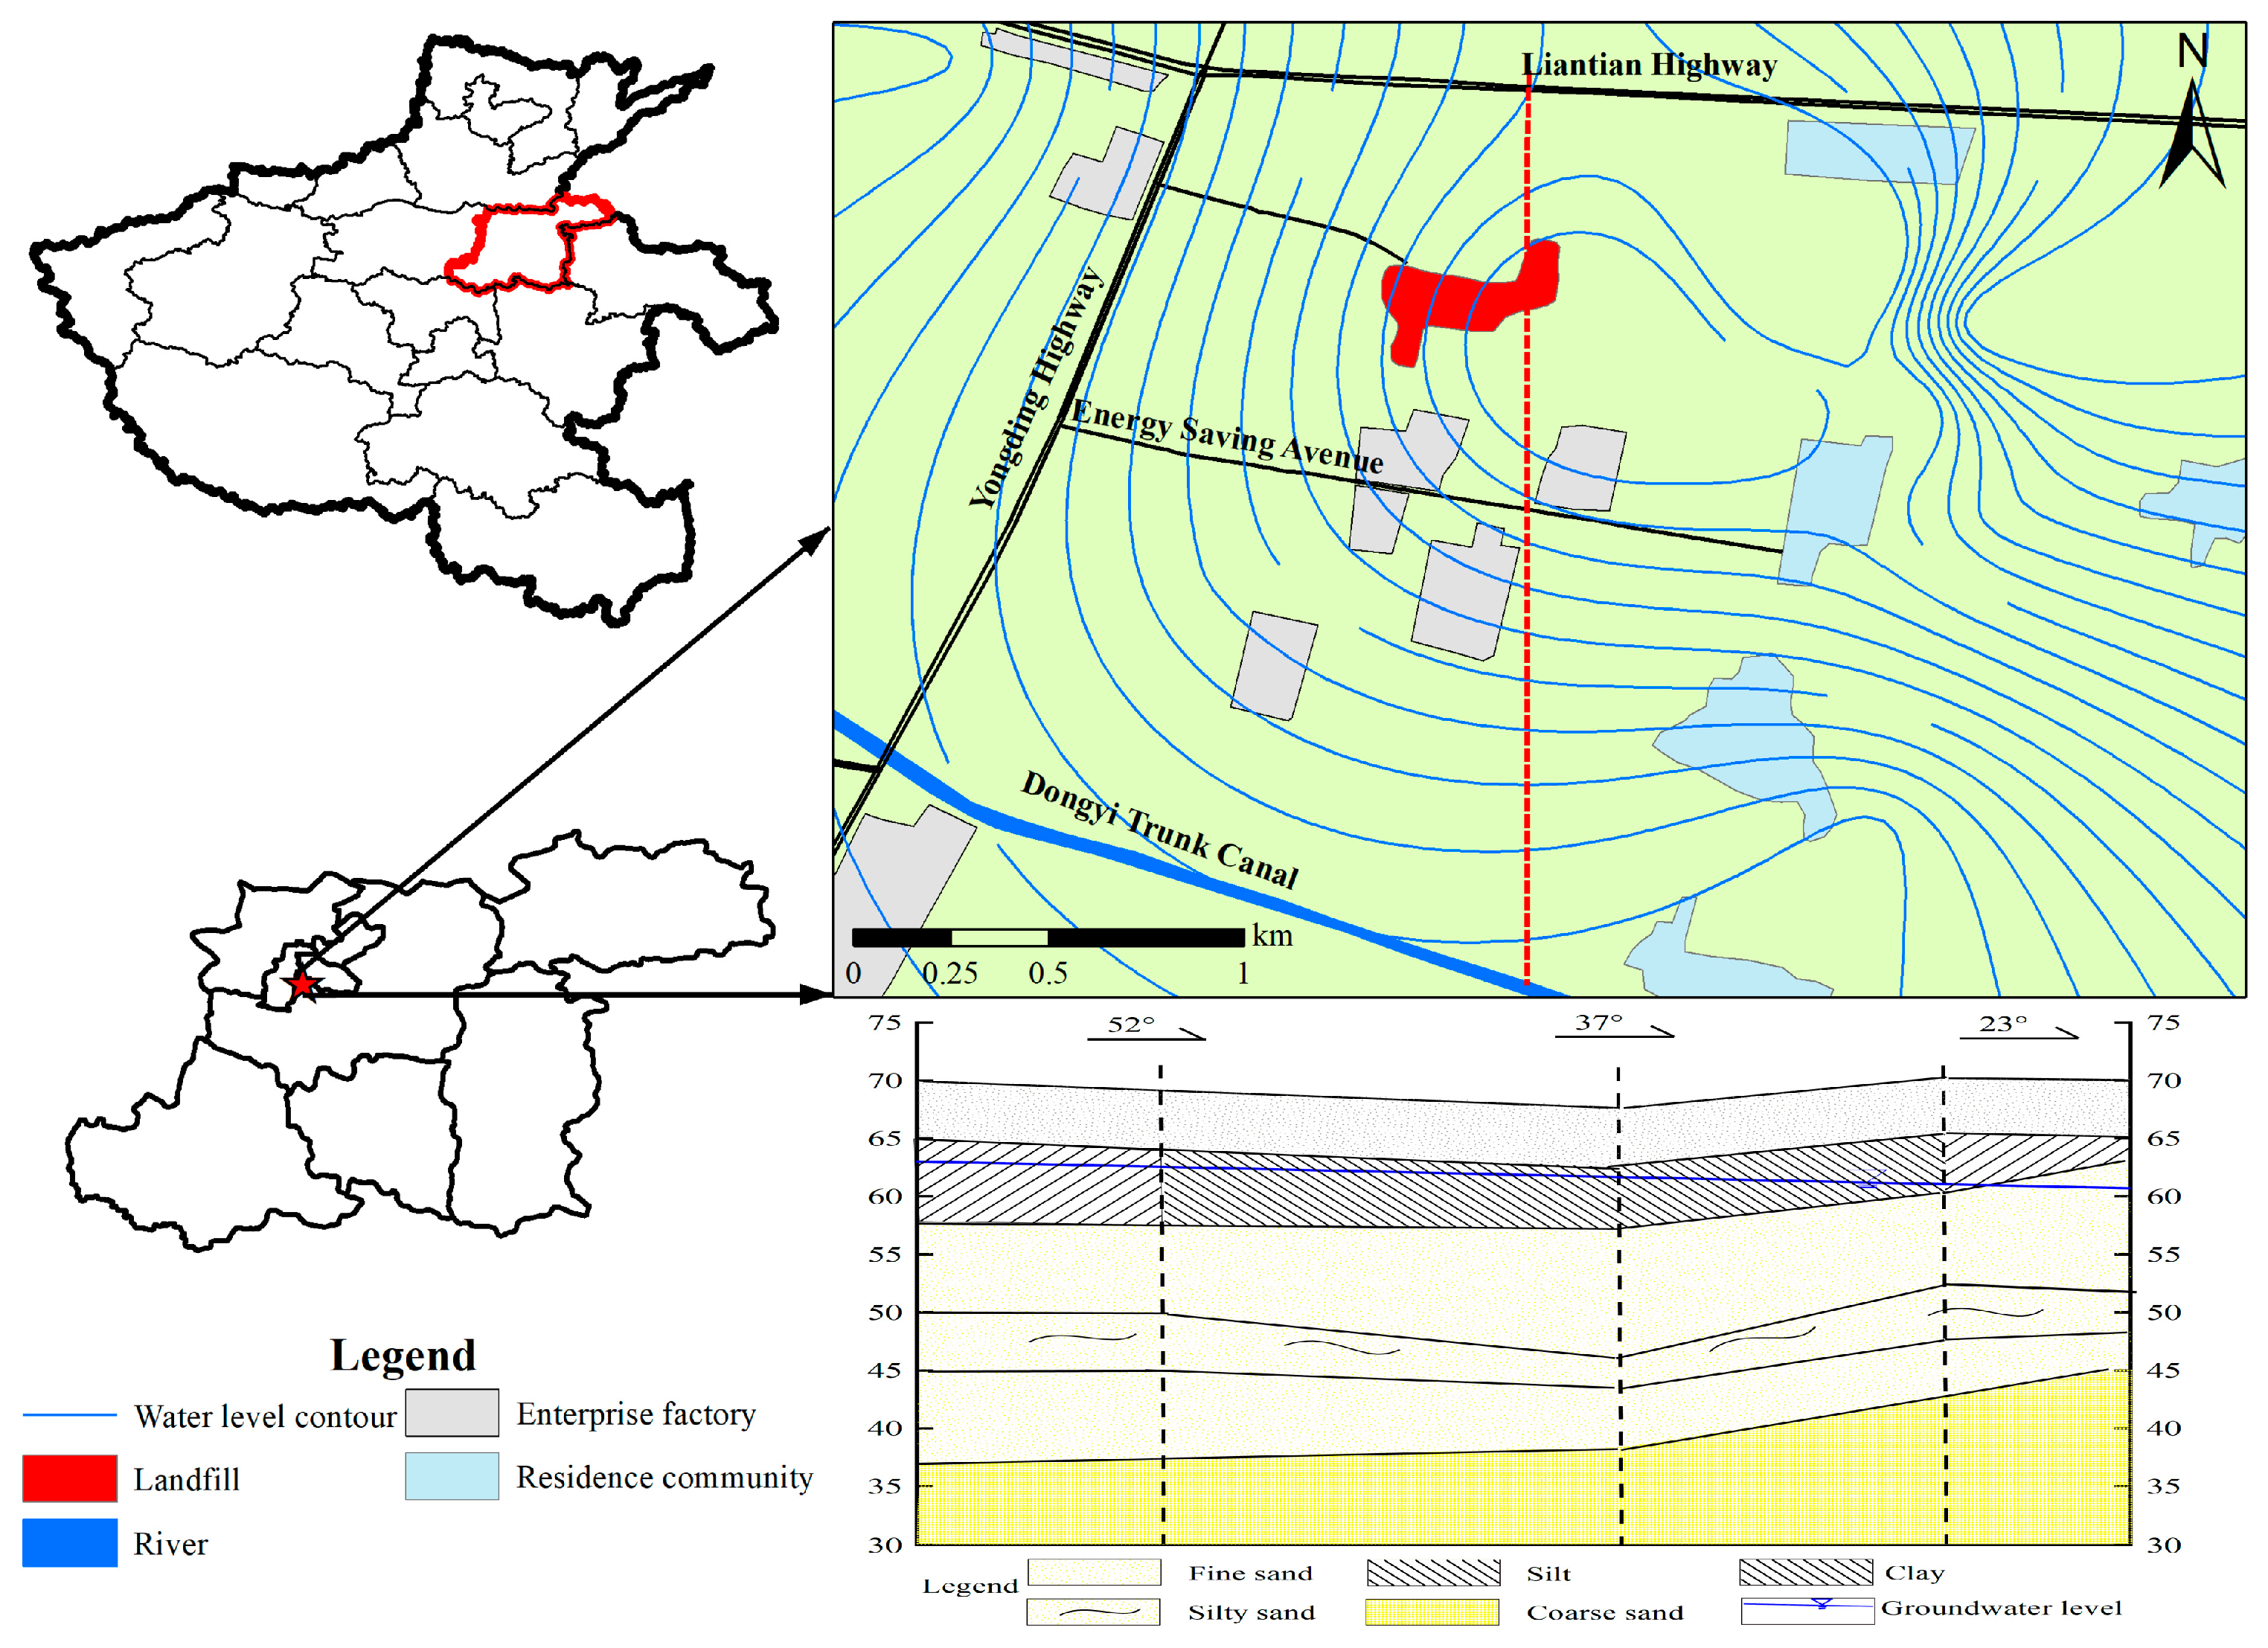
2. Overview of the Study Area

Located in the eastern part of Henan Province, China, Kaifeng has a total area of 6444 km2, including 362 km2 of urban area and 67 km2 of built-up area. Kaifeng is located 500 km from the Yellow Sea to the east. There are many rivers and lakes in Kaifeng. These belong to two major water systems, the Yellow River and the Huai River, and the water resources mainly include surface water and shallow groundwater. The main residential water in the study area comes from groundwater. According to the data of the seventh census, as of 1 November 2020, the resident population of Kaifeng was 4,824,016. The landfill was built in 1997 and expanded in 2011, and has been operating for 18 years, with a current landfill volume of four to five million tons. The geographical location map of the study area is illustrated in Figure 1.
The study area lies in the Eastern Henan Plain, which is geotectonically located in the component of the North China Platform. Geotectonically, it is in the compound exchange part of Qinling—Kunlun latitudinal tectonic system and Xinhua Second Subsidence Zone, the North China Depression, and lies in the North China Depression Basin, with the sedimentary layer thickness of 1000 to 5000 m. Since most of the geological formations are hidden under a thick sediment layer, the surface traces are unobvious, and most of the areas have a single geological structure and relatively simple geological conditions. The geomorphological type of the area in which the study area is located is the alluvial fan plain of the Yellow River, with undulating micro-landscapes and a general trend of the terrain sloping from northwest to southeast. The area has the ground slope dropping from 1/4000 to 1/2000 and the elevation ranging from 69 to 78 m.
Kaifeng is rich in groundwater reserves and has good water quality. Shallow groundwater refers to the groundwater in the upper aquifer of the Holocene and Upper Pleistocene systems. The top plate of the aquifer is buried at a depth of 10 to 30 m, and the bottom plate is buried at a depth of 40 to 70 m. The aquifer consists of three to six layers of medium and fine sands, going from fine to coarse from top to bottom, in a “binary structure”. It is 20 to 55 m thick, gradually thinning from north—west to south—east. The water table is generally buried at depths of 2 to 4 m and 10 to 15 m under “the old Kaifeng”. The main sources of shallow groundwater recharge are atmospheric precipitation, seepage from rivers, canals, lakes and ponds, irrigation recharge, and lateral runoff recharge. The direction of shallow groundwater flow is north—west to south—east, which is consistent with the direction of topographic inclination. Artificial overmining has led to the formation of a water level landing funnel in some areas. Groundwater around the funnel runs off to the center of the funnel. The main drainage method of submarine groundwater is artificial mining, followed by evaporation and cross—flow drainage. In the peripheral area of the landing funnel, the annual change in submarine groundwater is mainly influenced by precipitation, evaporation, and agricultural irrigation; the groundwater dynamics is of “infiltration—mining—evaporation type”. Within the funnel, the dynamic type is “infiltration-extraction type”.

3. Materials and Methods

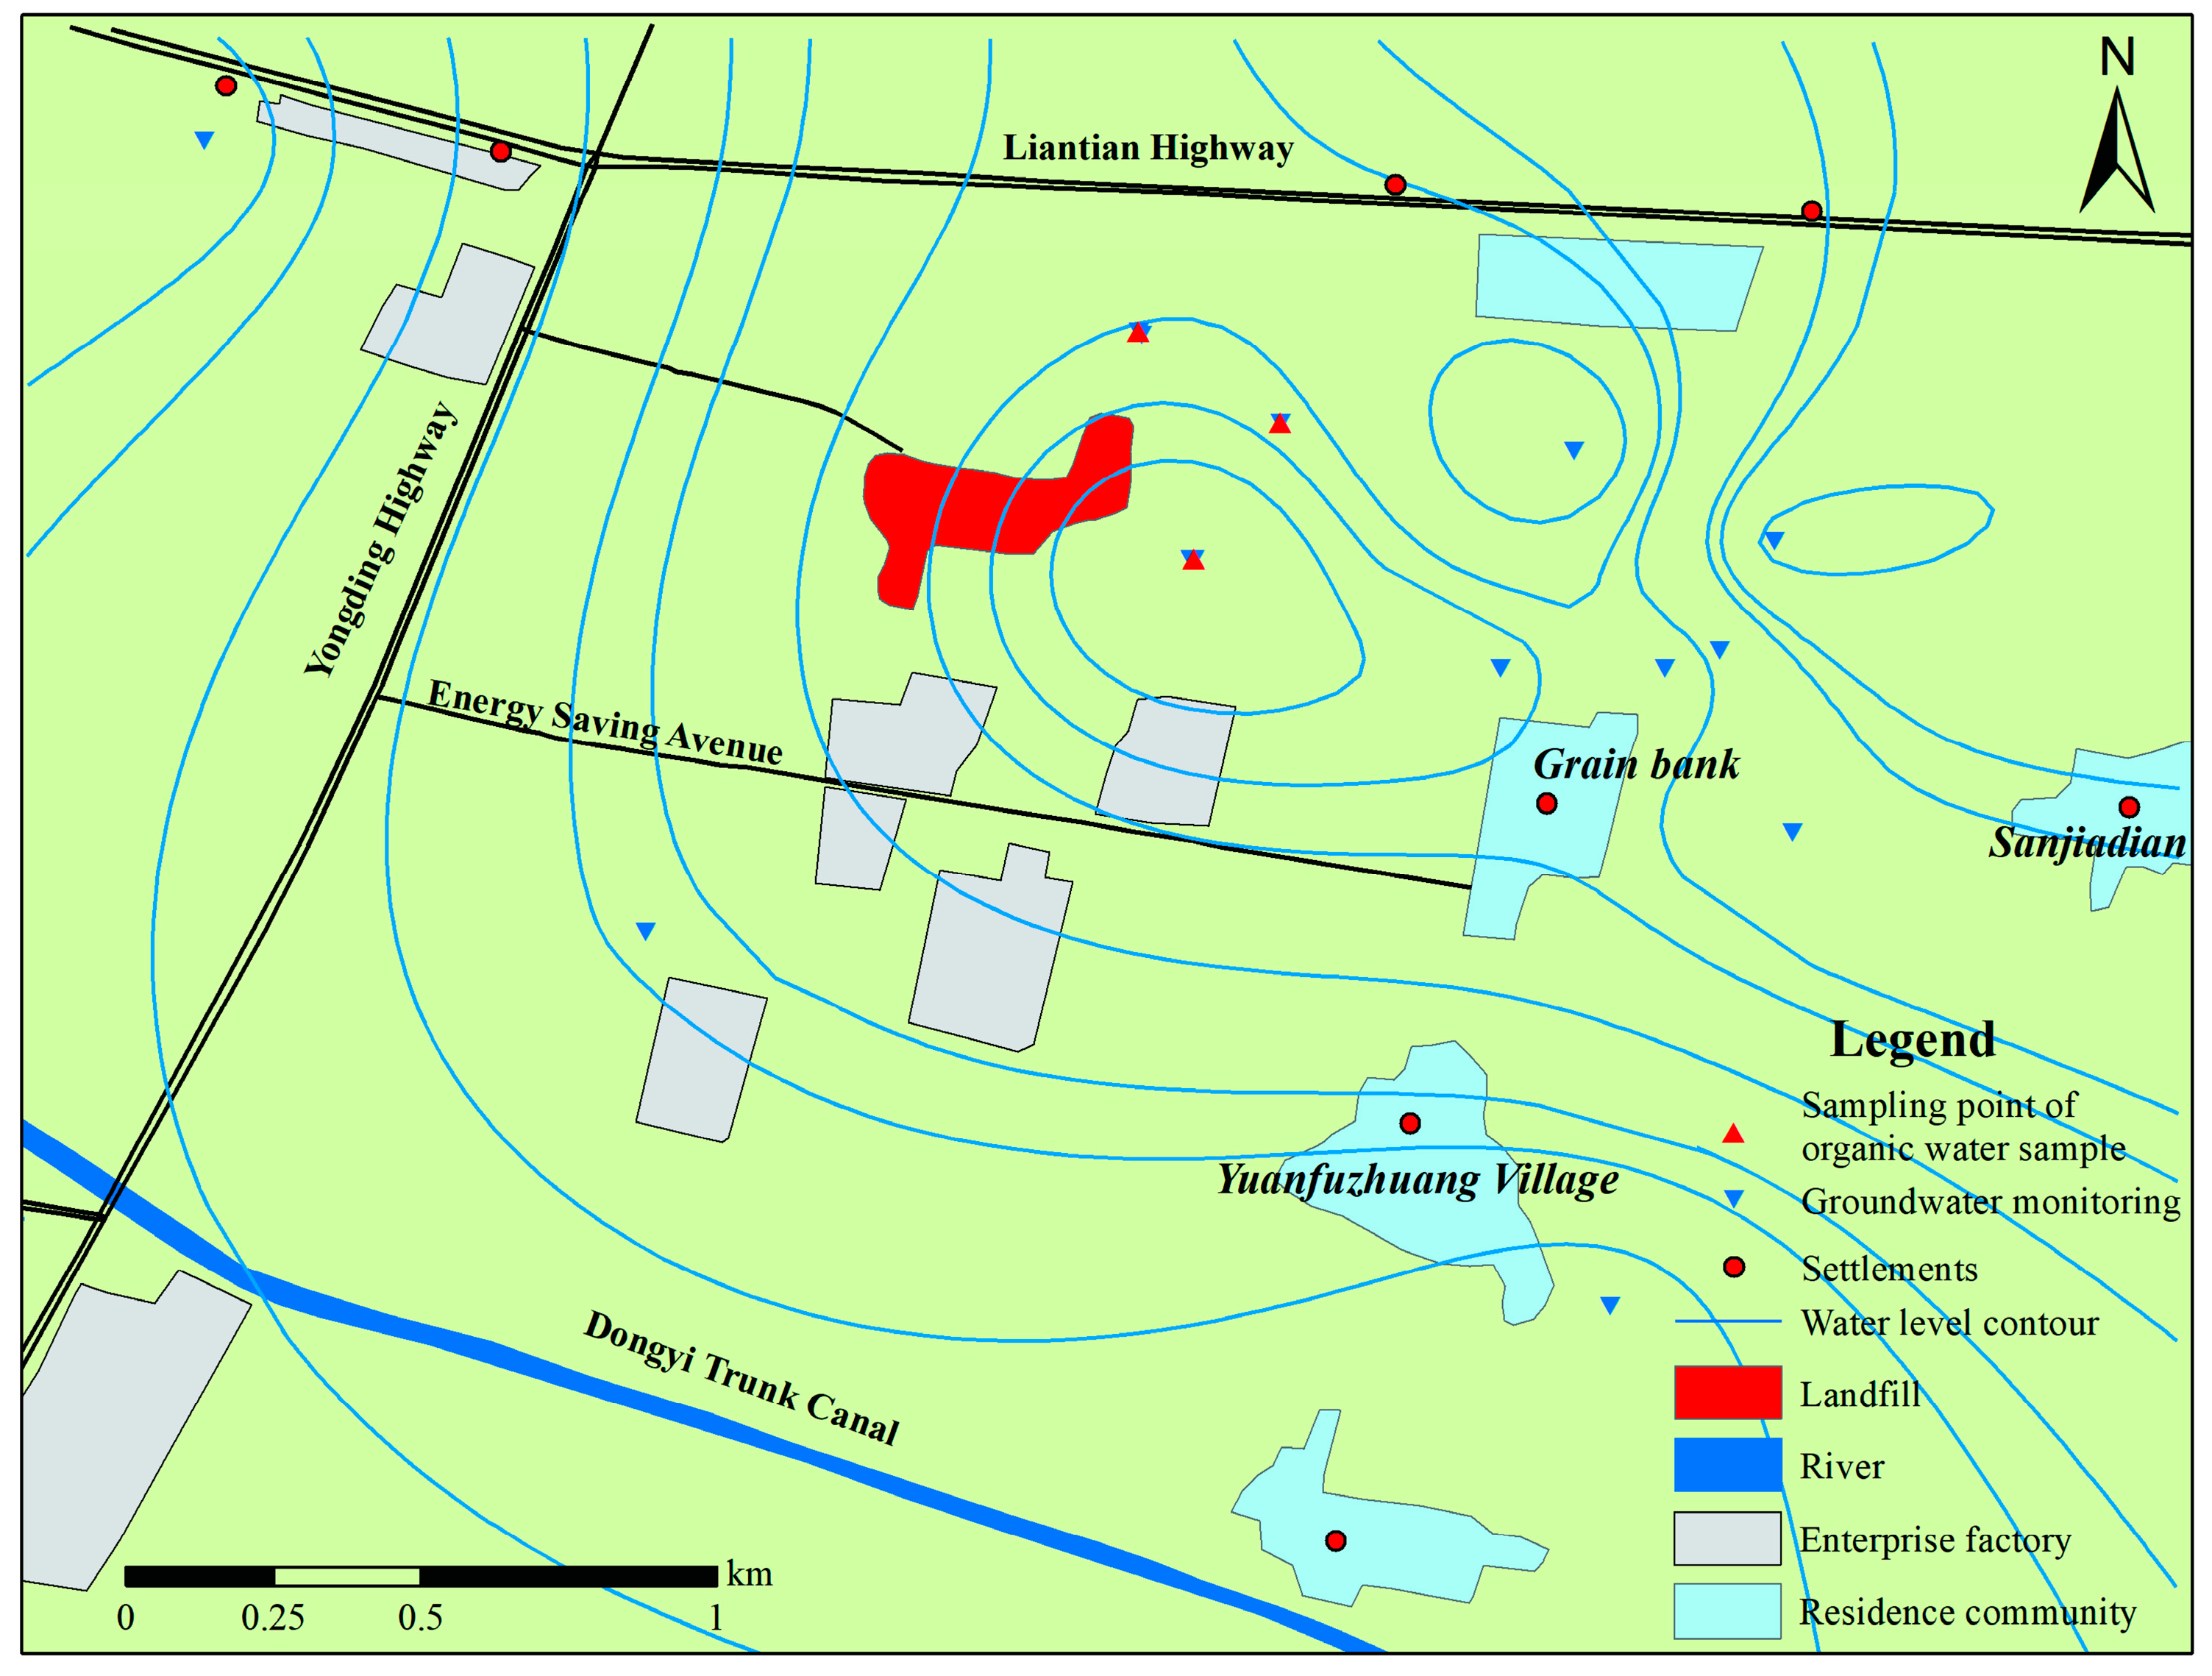
3.1. Monitoring Point Placement and Sample Testing

A total of eight groundwater environmental monitoring points were established, seven existing wells were selected and one new monitoring well (8#) was opened for monitoring. One existing well was selected as 1# groundwater background monitoring point some 350 m upstream of the landfill dump (northwest direction), one self-provided well was selected as 2# groundwater background monitoring point at the northwest corner of the landfill, and locations 3#, 4#, 5#, 6#, 7#, and 8# downstream of the landfill dump could be selected as groundwater pollution source diffusion monitoring wells. The location of groundwater monitoring points in the investigation area of the landfill site is illustrated in Figure 2.
Water quality samples were obtained from 8 monitoring sites for a total of 15 days from 18 September to 2 October 2021, and the wells were washed and pumped for 15 min prior to sampling. The sampling bottles (brown glass bottles that had been cleaned with deionized water) were washed with water taken from each sampling point three times before sampling, with a sampling volume of 2.5 L, and brought back to the laboratory for pretreatment within 24 h. The water samples were tested with reference to the test methods specified in the Groundwater Quality Standard (GB/T 14848-2017) [34].
Na+ was tested using atomic absorption spectrophotometry (Analytik Jena AG, Jena, Germany); As, Mn and Pb were determined by inductively coupled plasma emission spectrometry (ICP/AES); K+,Ca2+, Mg2+, Cl and SO42− were determined using ion chromatography (YC3060, Qingdao Elen General Technology Co., Ltd., Qingdao, China) and HCO3 was measured using titration (RC-DD02C, Rui Cheng Yong Chuang). According to the Standard Test Method for Drinking Water (GB/T 5750.6-2006) [35], the detection limit for Na+, K+, Ca2+, Mg2+, Mn, As, Pb, Cl and SO42− was 5 μg/L, 20 μg/L, 11 μg/L, 13 μg/L, 0.5 μg/L, 35 μg/L, 20 μg/L, 0.15mg/L and 0.75 mg/L, respectively. According to the Groundwater Quality Analysis Method-Titration Method (DZ/T 0064.49-2021), the detection limit for HCO3 was determined to be 5 mg/L. The relative error was calculated using the anion balance Equation (1), and the relative error range of ± 5% suggests that the data are both valid and reliable.
E = (∑mc − ∑ma)/(∑mc+∑ma) × 100%
where E denotes the relative error, %; mc and ma are the milligram equivalent concentrations of cations and anions, meq/L.
QA/QC was run during the experimental analysis to monitor the whole experimental process, and blank controls were set during the water sample testing.

3.2. Groundwater Quality Evaluation

The main methods used for groundwater quality evaluation include fuzzy integrated analysis, principal component factor analysis, cluster analysis, etc. In this study, we mainly used the EWQI to evaluate the groundwater quality in the study area. The specific steps are presented as follows:
First, the eigenvalue matrix X is established as:
X = [ x 11 x 12 x 1 n x 21 x 22 x 2 n x i j x m 1 x m 2 x m n ]
To eliminate the effects of different units, Equation (2) is normalized:
When j is chosen as a positive indicator, we obtain:
yij = [xij − (xij)min]/[(xij)max − (xij)min]
when j is chosen as a negative indicator, we get:
yij = [(xij)max − xij]/[(xij)max − (xij)min]
j that is used as a moderate indicator is forwarded and calculated as follows:
xij′ = |xij − k|
In the equation: (xij)min is the smallest value among such indicators, (xij)max is the maximum of such indicators, k takes the average value of parameter j.
Combining (2) to (5), the standard matrix Y is obtained as follows:
Y = [ y 11 y 12 y 1 n y 21 y 22 y 2 n y i j y m 1 y m 2 y m n ]
Based on yij in Equation (6), the ratio Pij of parameter j of sample I is calculated
Pij = yij/(∑yij) (i = 1, 2, ……m)
The information entropy ej of parameter j is calculated from Equation (7):
ej = −1/lnm (∑Pij × lnPij) (i = 1, 2, ……m)
Its entropy weight wj can be calculated using Equation (8):
wj = (1 − ej)/[∑(j = 1, 2, ……n)(1 − ej)]
EWQI can be calculated based on Equation (9):
EWQI = ∑wi × qi (i = 1, 2,……n)
In the equation: qj is the quality level of each groundwater sample, and:
qj = Cj/Sj × 100
In the equation: Cj represents the mass concentration of each chemical parameter in each water sample (mg/L); Sj denotes the World Health Organization or the national guarantee provisions of the allowable limits of physical and chemical parameters.
The groundwater quality can be classified into five classes according to the EWQI [36], as shown in Table 1.

3.3. The Evaluation Methodology of Health Human Risks Arising from Groundwater Contamination

According to the survey, most of the residents in the study area use wells to extract groundwater for daily use. As such, a health risk assessment is essential for a comprehensive quality assessment of drinking water. The National Academy of Sciences proposed a health risk assessment model in 1983, It is still widely used today. Guidelines for Investigation and Evaluation of the Environmental Condition of Groundwater were issued by China in September 2019 (Environment Office Soil Letter [2019] No. 770). They regulate the health risk evaluation model steps as: hazard identification, exposure assessment, toxicity assessment, and risk characterization.

3.3.1. Hazard Identification

In accordance with GB 50137 [37], this study area should be classified as a Class II site (land for multiple, medium, and high—rise residential areas with more complete public utilities, transportation facilities, and public service facilities with a more complete layout and good environment). In the second type of land use, the exposure period for adults is long and the frequency of exposure is high, and the carcinogenic risk and non-carcinogenic effects of contaminants are generally assessed based on the exposure during the adult period [38]. Non—carcinogenic (NH4+-N, Mn and Pb) risk evaluations for adults exposed to this environment were primarily considered under the parameters of the drinking groundwater pathway.

3.3.2. Exposure Assessment

For the non—carcinogenic effects of a single contaminant, the groundwater exposure corresponding to the drinking groundwater pathway is calculated using Equation (12) by considering the exposure hazard of the population in adulthood:
CGWERna = (GWCRa × EFa × EDa)/(BWa × ATnc)
where CGWERna denotes drinking exposure corresponding to receiving groundwater (non-carcinogenic effect); GWCRa is daily water intake for adults, L·d−1; EFa refers to adult exposure frequency, d·a−1; EDa is adult exposure period, a; BWa denotes adult weight, kg; ATnc represents mean time to non-carcinogenic effects, d.
The parameters used in this study are shown in Table 2. The model parameters were taken from “Guidelines for Investigation and Evaluation of Groundwater Environmental Conditions” (Environment Office Soil Letter [2019] No. 770, China), i.e., water that can meet the requirements for drinking water, specifically a centralized water supply that is stored again, pressurized, and disinfected or treated in—depth before entering the home and is delivered to the user through pipes or containers. The detailed parameter values are shown in Table 2.

3.3.3. Toxicity Assessment

The harmful effects of pollutants on human health were assessed using different pathways, including carcinogenic effects, non—carcinogenic effects, the mechanism of the human health hazards of pollutants and dose—effect relationships, etc. [39].

3.3.4. Risk Characterization

Risk characterization is the process of assessing the degree of health risk hazard that may arise from different exposure pathways or the probability that a certain health effect will occur. For non—carcinogenic risks, the characterization indicator is the hazard quotient (HQ) [3]. The HQ of the groundwater drinking route is calculated using Equation (13):
HQ = CGWERna × Cgw/(RfDo × WAF)
where CGWERna represents the groundwater exposure corresponding to the groundwater drinking route considering the exposure hazard of the population in the adult period; Cgw is the concentration of groundwater contaminants, mg·L−1, reference values obtained from plot surveys; RfDo denotes the reference dose for oral intake, mg·kg−1·d−1; WAF is the reference dose distribution ratio for exposure to groundwater, dimensionless.

3.4. Hydrogeological Modeling Methods

3.4.1. Hydrogeological Conceptual Model

According to the hydrogeological conditions of the area where the landfill is located, the shallow aquifer is used as the main simulation layer. In the north—south direction, it extends to the nearby rivers and dry canals, respectively, and is generalized to the given head boundary; in the east—west direction, according to the regional groundwater flow field distribution characteristics, it is taken parallel to the groundwater flow field water level contour as the boundary, and is generalized to the given head boundary. This results in the final circle of the simulation area, with an area of 13.12 km2. The groundwater runoff in the simulation area is sluggish and largely runs from north—west to south-east. The internal shallow groundwater dynamics are mainly affected by artificial exploitation and meteorological conditions (atmospheric precipitation), and the groundwater table rises during periods with an abundance of water and vice versa. Therefore, we constructed a conceptual model of three-dimensional non-homogeneous individual heterogeneous unsteady flow in the simulation area, and the mathematical model is presented as follows:
{ x ( K x × h x ) + y ( K y × h y ) + z ( K z × h z ) + ε = μ × h t   x , y , z Ω h ( x , y , z ) = h 0   x , y , z Ω h ( x , y , z ) Γ 1 = Φ ( x , y , z )   x , y , z Γ 1 ( K n × h n ) Γ 2 = q ( x , y , z )   x , y , z Γ 2
where: Ω—seepage area; x, y, z—Cartesian coordinates (m); h—the water level elevation of the body containing water (m); t—time (d); Kx, Ky and Kz are coefficients of permeability in the x, y, and z-directions, respectively (m/d); Kn—coefficient of permeability in the normal direction of the boundary surface (m/d); Μ—gravity feed water degree; ε—source sink term (1/d); h0—initial water level (m); Γ1—Class I boundary; Γ2—Class II boundary; ñ—normal direction of the boundary surface; φ(x, y, z)—Class I boundary head (m); q(x, y, z)—single-width flow at Class II boundaries (m3/d/m). The inflow is positive, outflow is negative, and that at the water separation boundary is 0.

3.4.2. Conceptual Model of Groundwater Contamination

The landfill site was built in 1986 and decommissioned in June 2009. The main types of waste are mainly domestic waste, mixed with some construction waste and medical waste. There is no lining under or around the landfill, and the garbage is directly filled on the 5 m thick layer of powder soil, and its permeability is 0.11 m/d as measured by seepage pressure meter (a relatively large permeability). Within a radius of 1 km, a survey was conducted to obtain a range of water pollution receptors in residential areas, villages, schools, etc. In a comprehensive analysis, the pollutant dispersion pathways are: (1) vertically downwards migration of pollutants: pollutants deposited by rainfall or their self-weight, in the process of migration by adsorption on the surface of the soil medium or dissolved in precipitation and thus groundwater; (2) horizontal diffusion of pollutants: pollutants deposited by rainfall, shallow groundwater and other horizontal migration via diffusion. The process of pollutant transport and transformation involves convection and dispersion, and the mathematical model of solute transport is:
ne×∂C/∂T = ∂/(∂Xi) [ne×Dij×∂C/(∂Xj)] − ∂/(∂Xi) (ne×CVi) ± C′ W
Dij = aijmnVmVn/|V|
where: αijmn—dispersion of the aquifer; Vm and Vn—the velocity components in the m and n directions, respectively; |v|—speed; C—concentration of simulated pollutants (mg/L); ne—effective porosity; t—time (d); W—flux per unit area of the source/sink; Vi—seepage rate (m/d); C′—concentration of pollutants in the source/sink (mg/L).

4. Results and Discussion

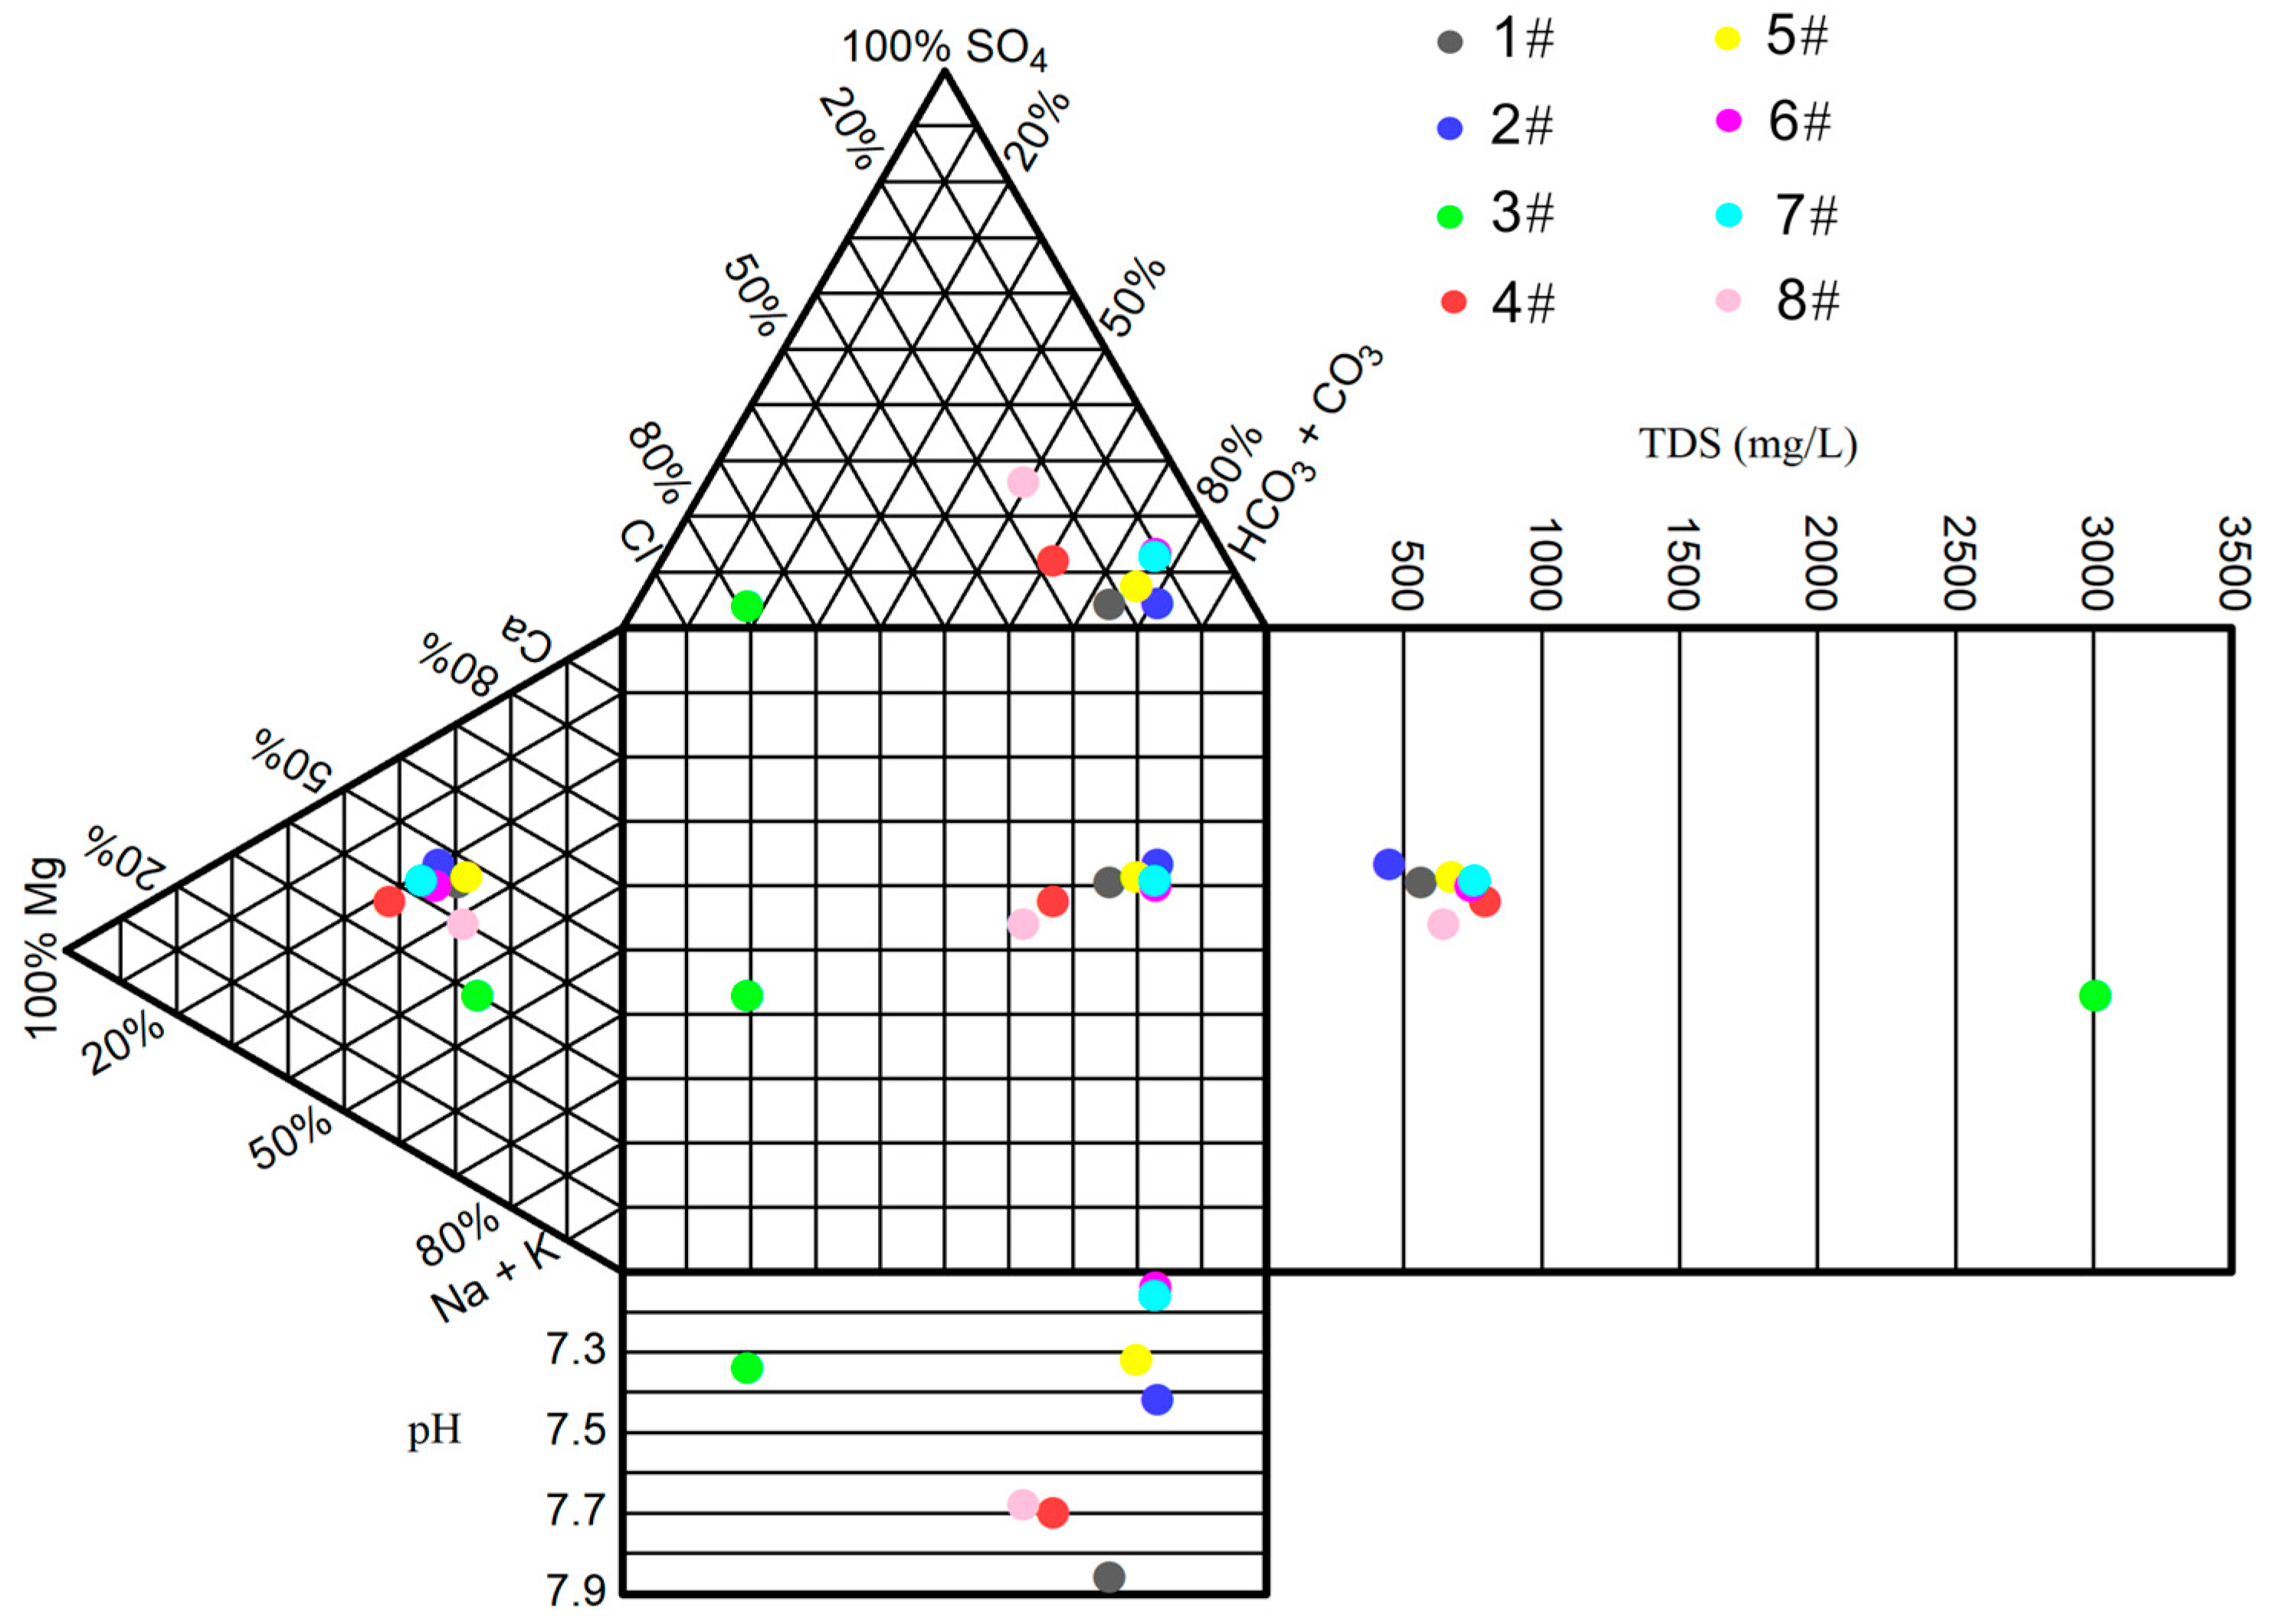
4.1. Water Chemistry Characteristics

The chemical classification of water is based on the relative content and proportional relationship of the major anions and cations in the water body. A Durov diagram is a common graph which expresses the type of water chemistry, allowing for the visualization of the relationship between groundwater water chemical characteristics, salinity and pH. Durov plots of water samples from the study area are shown in Figure 3; the cation concentration in groundwater is (in descending order): Ca2+ > Na+ > Mg2+ > K+, the anion concentration is such that HCO3 > Cl > SO42−, and the water chemistry type is an HCO3—Ca·Na type water, and the range of total dissolved solids (TDS) in 87.5% of the water samples is less than 1 g/L.
The main parameters and the chemical compositions of the water samples in this study area are listed in Table 3. The highest level uses the recommended value of Class II water issued by the National Health and Wellness Commission in the Sanitary Standard for Drinking Water for Domestic Used (GB 5749-2022, China) [40], i.e., water that can meet the requirements for drinking water. The centralized water supply is stored again, pressurized, disinfected, or treated in-depth before entering the home and is delivered to users through pipes or containers. The pH of groundwater plays a very important role in the evaluation of its quality. The pH allowed in China’s drinking water quality standard ranges from 6.5 to 8.5. The pH range of water quality in the study area is between 7.14 and 7.86, and the pH value does not exceed the standard, indicating that the pH situation of water quality in the study area is acceptable. As seen from Table 3, the coefficient of variation (C.V.) values of four types of ions, K+, Na+, NH4+-N, and Cl, within the study area are greater than 1, indicating that these four types of ions have high variation and dispersion in concentration at different sampling points in the study area and have wide ranges; other ions exhibit a low-difference distribution. The concentrations of TDS, NH4+-N, Ca2+, Mg2+, Na+, HCO3, Cl and Mn in the water samples from the sampling sites in the study area appear to exceed the permissible limits. Among them, four sampling points of water samples Mg2+ exceeded the standard, seven sampling points of water samples Mn exceeded the standard, two sampling points of water samples HCO3 exceeded the standard, and with TDS and the rest of the ions only one sampling point of water samples exceeded the standard. This, combined with the coefficient of variation, demonstrated that the study area was more seriously contaminated with heavy metal ions. As, NH4+-N, Mn, F and Pb were selected for the risk assessment of the study area.
As shown in Table 3, the study area was contaminated with NH4+-N, Mn, and Pb. Groundwater nitrogen pollution has long been of concern, and many studies have shown that groundwater nitrogen pollution originates from agricultural fertilizers. Long—term consumption of water with excessive Mn can cause neurological dysfunction and neurological weakness in the early stages and Parkinson’s syndrome in the later stages, and consumption of raw water with excessive Mn can cause irreversible brain disorders such as neurological and psychological disorders [41]. Visual dysfunction and speech abnormalities can occur when high doses of manganese—containing well water are consumed over a long period of time [42]. Excessive amounts of lead can do harm to the human respiratory and cardiovascular systems and affect children’s intelligence [17,18].
The study area lies in the upper central part of the alluvial fan of the Yellow River, which belongs to the Quaternary System, and the groundwater of the Quaternary System mainly consists of loose—layer pore water. The sedimentary thickness of the Fourth Series is large, and the lithology of the aquifer is gravelly cobble with drift stone and sandy gravel, and the accumulated thickness gradually decreases from south-west to north-east. The recharge sources of the fourth system pore water are mainly atmospheric precipitation, surface water (river and channel water), agricultural irrigation water infiltration recharge and lateral recharge from neighboring areas. In recent years, artificial recharge has also become one of the sources of groundwater recharge, and groundwater discharge mainly occurs in the form of artificial extraction. Therefore, under the hydrogeological conditions, the groundwater in the study area is vulnerable to pollution, and the geological features of the area are interspersed with ferromanganese mottling, and so the iron and manganese exceedance may be caused by regional geological reasons. The area is located in the upper central part of the alluvial fan of the Yellow River, which is dominated by pore water and is subject to high evaporation all year round, resulting in a enrichment of iron and manganese [43].

4.2. Groundwater Quality Evaluation Results

Six groundwater parameters in the study area were selected for use in the EWQI calculation and evaluation, including TDS, Cl, SO42−, NH4+-N, F, and Mn. The EWQI values of water samples in the study area, calculated using Equation (10), ranged from 48.4 to 250.26, with one water sample having EWQI values above 200, three water samples having EWQI values between 101 and 150, and four water samples having EWQI values between 51 and 100. The spatial distribution of EQWI levels in the study area is shown in Figure 4. In summary, calculations using an EWQI method show that the overall water quality in the study area is above the medium level and the local water quality level is poor. Comparisons of the water quality parameters and EWQI values imply that EWQI does not change significantly when the NH4+-N concentration increases (Figure 5a), and EWQI values will increase when the Mn concentration increases (Figure 5b). The average contribution of Mn to the water samples of the study area is 55%, thus serving as the main indicator of changes in groundwater quality.

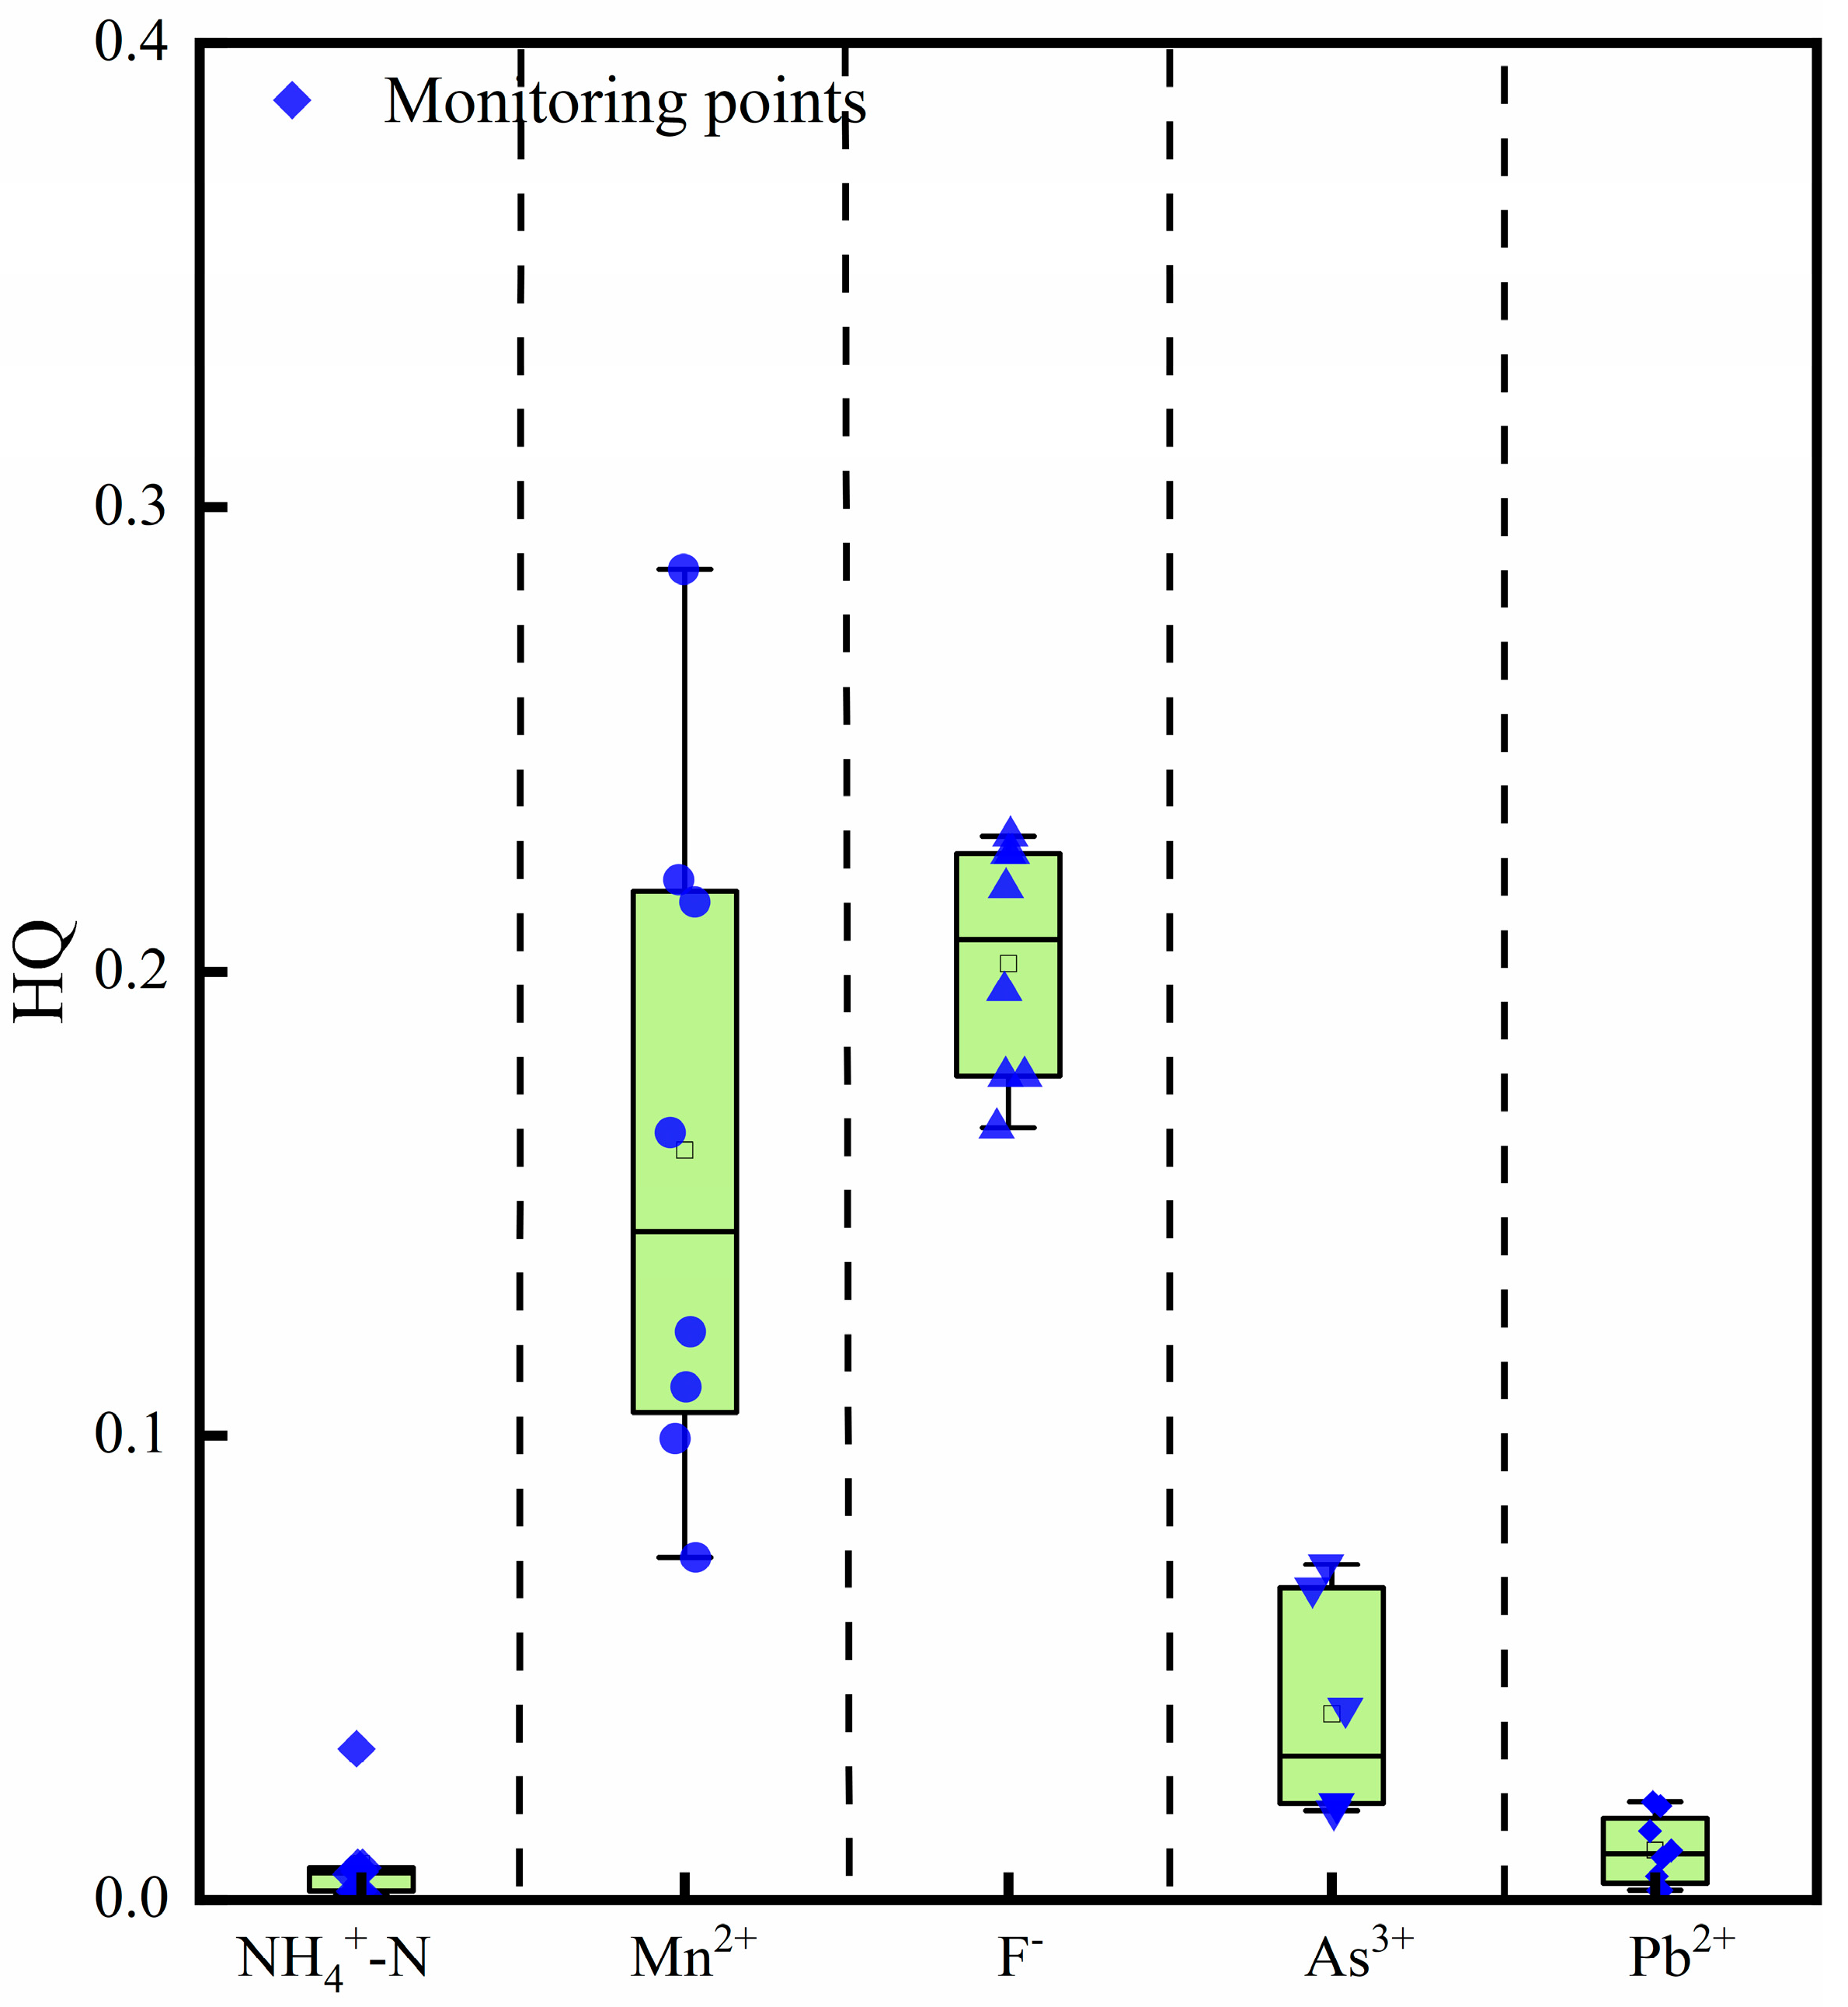
4.3. Health Risk Evaluation Results

Risk levels that do not produce adverse or deleterious health effects in exposed populations include acceptable carcinogenic risk levels for carcinogens and acceptable quotients for non-carcinogens [44,45,46,47]. According to HJ 25.3-2019, the acceptable carcinogenic risk level for a single contaminant in the criteria is 10−6 and the acceptable HQ for a single contaminant is 1. Based on the health risk evaluation model, five parameters of NH4+-N, Mn, As, F and Pb in the groundwater of the study area were selected to evaluate the potential risk of the groundwater drinking pathway to humans. The HQ values of NH4+-N, Mn, As, F and Pb in the study area were calculated according to Equations (12) and (13). As illustrated in Figure 6, the hazard quotient (HQ) values for NH4+-N, Mn, As, F and Pb varied in the following ranges: 9.14 × 10⁻⁴—0.03; 0.07—0.22; 0.02—0.07; 0.16—0.23; and 0.01—0.13, respectively (all of which are less than 1, so the potential risks to human health can be ignored). In summary, the ion concentration can be considered to have no effect on human health when it is within permissible values.

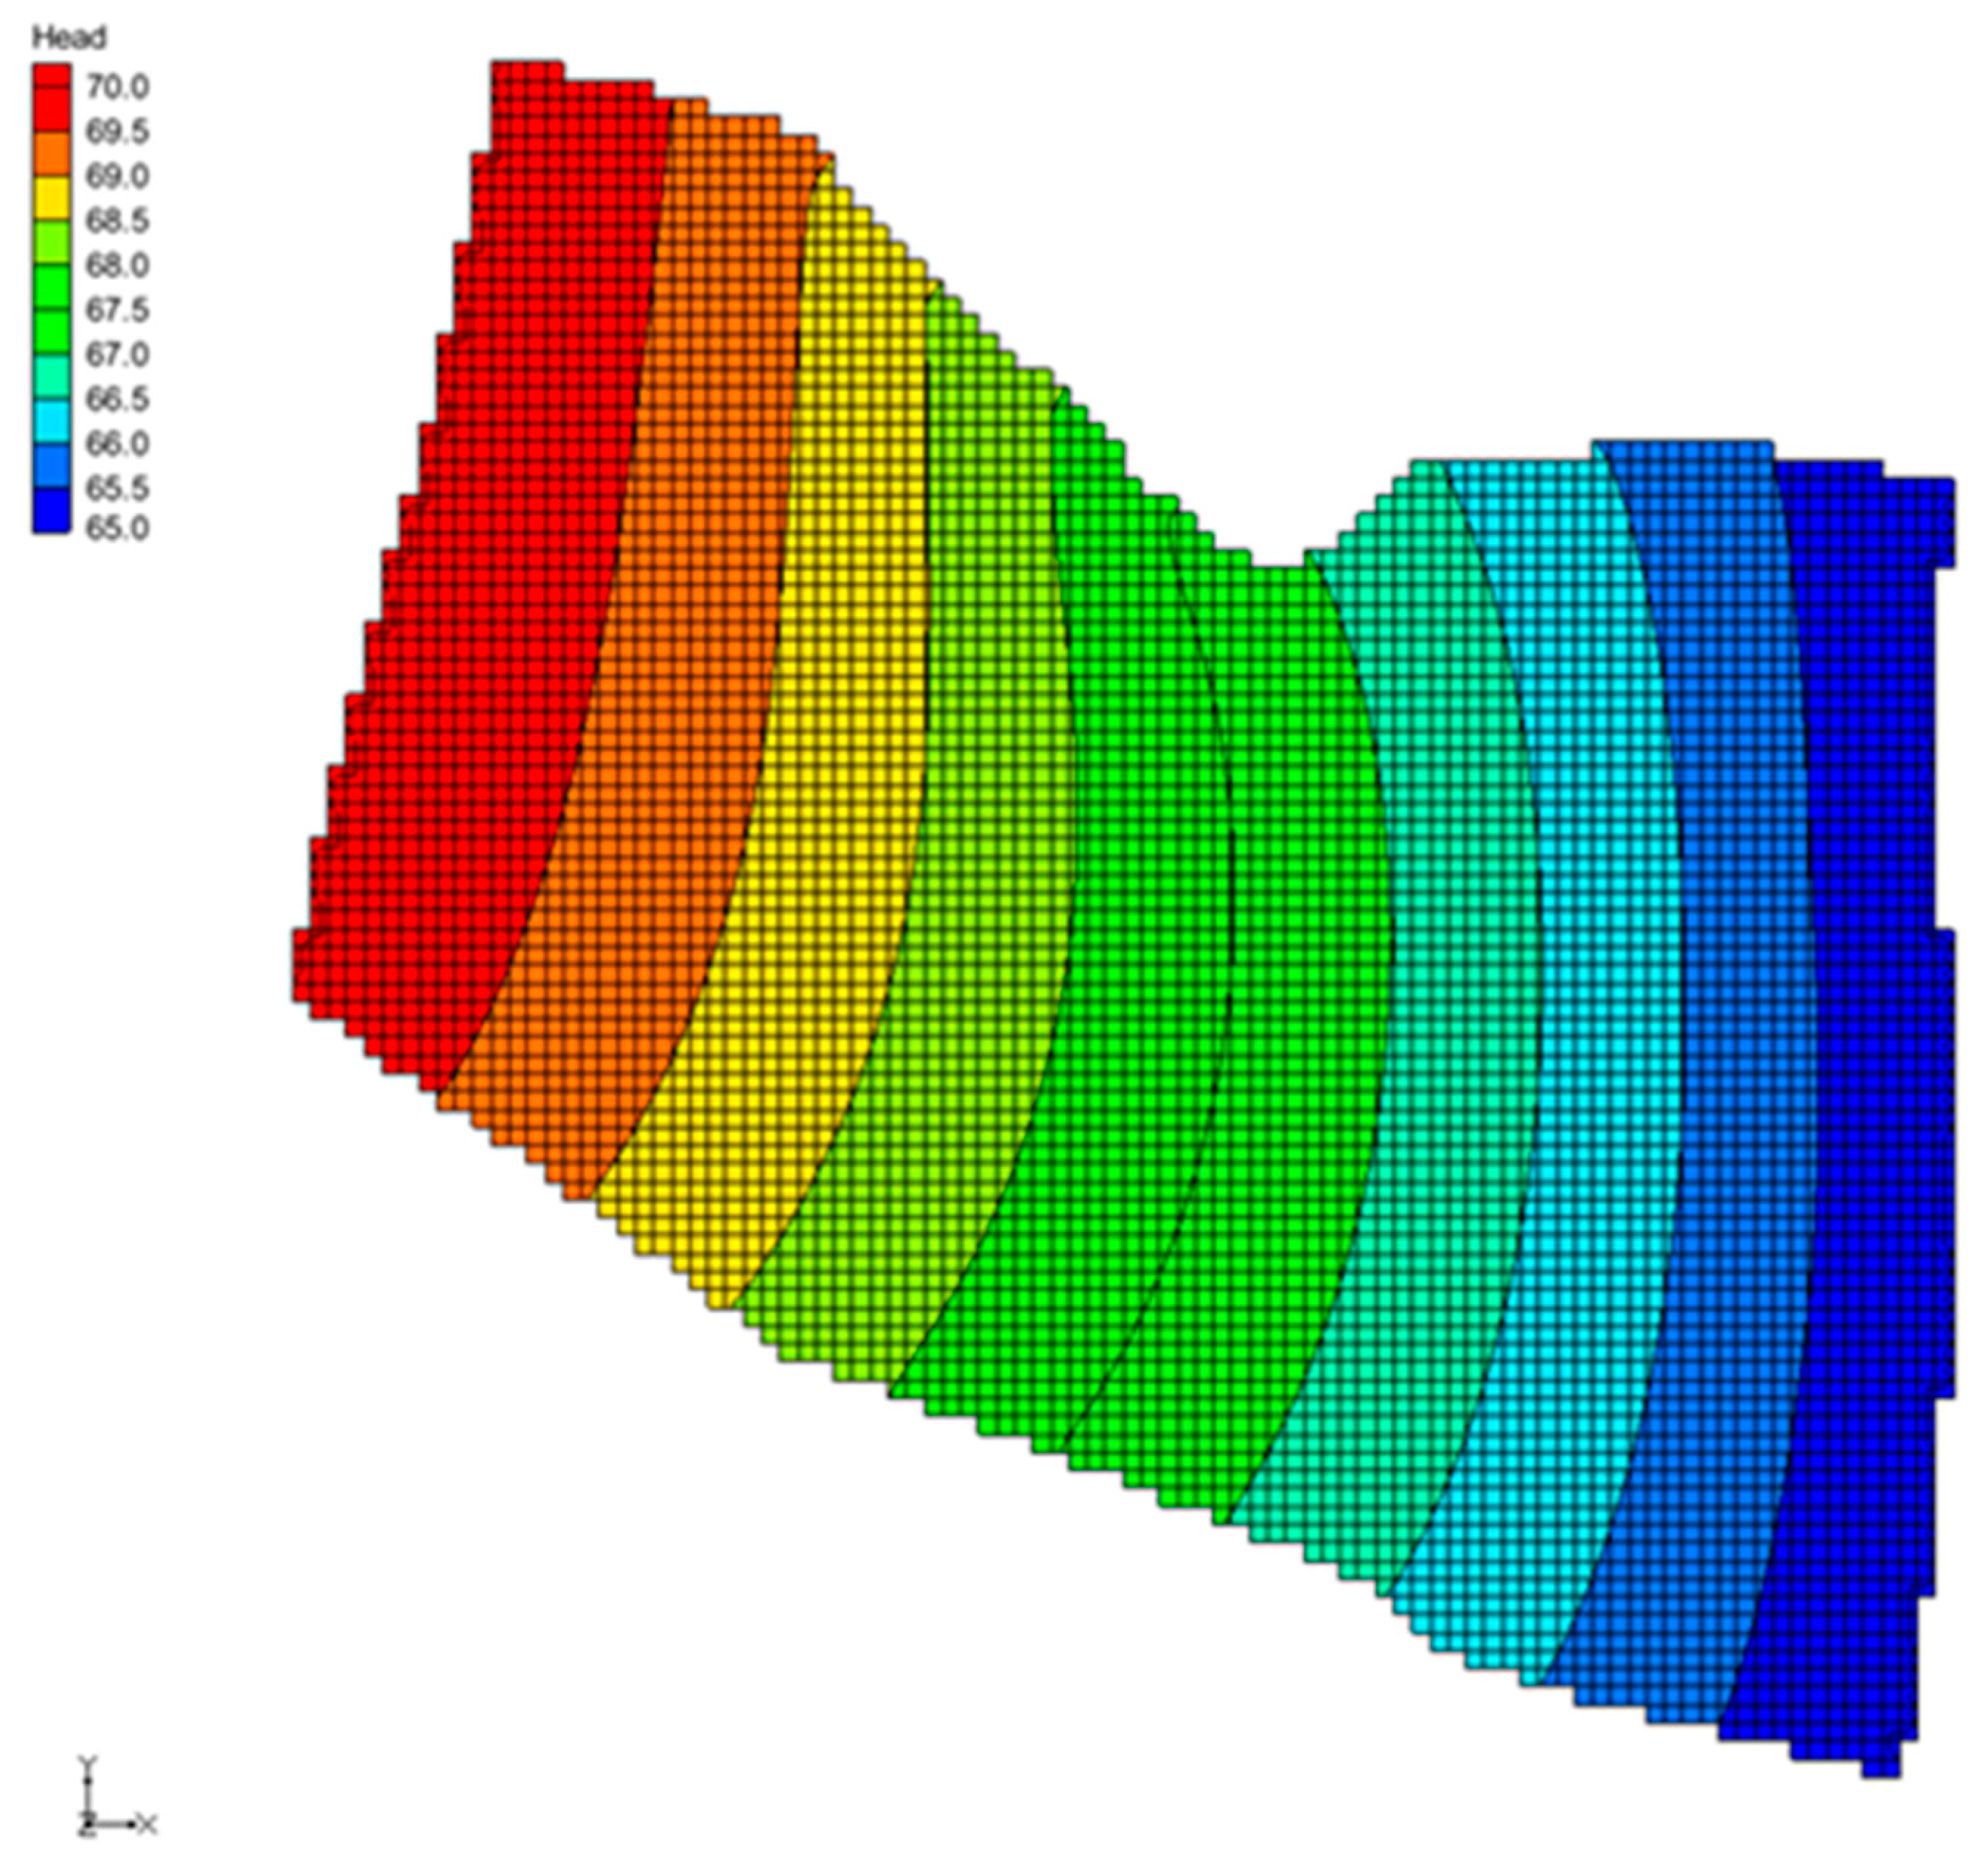
4.4. Numerical Groundwater Model

GMS software was used for numerical modeling and solving. In the software, the simulation area was divided into 95 rows, 92 columns, and three layers in the plane using a 50 m × 50 m section format, and 26,220 valid cells were thus obtained.
Groundwater in the area mainly receives recharge from atmospheric rainfall infiltration, irrigation infiltration recharge, lateral recharge, river and canal infiltration, etc. The main discharge items are artificial mining and lateral discharge. Among them, rainfall infiltration recharge and irrigation infiltration recharge were assigned using the recharge subroutine package in GMS and added to the first layer of the model in a faceted form; the lateral runoff was automatically calculated by the software based on the internal water level difference, with the Specified Head module being used to delineate the boundary type; groundwater extraction was inscribed using the Well module. Finally, the dynamics of each source—sink term was controlled by time series assignment.
Based on the currently available historical water level dynamic data and knowledge of the flow field in the assessment area, the groundwater flow field was obtained, as shown in Figure 7, after the model parameters were identified and verified for the purpose of this simulation. The distribution of this simulated flow field is similar to the regional measured iso-water level, the difference of water level values is small, and the direction of groundwater flow is consistent, which satisfies the relevant requirements in the Working Requirements for Groundwater Resources Management Model (GBT14497-93) [48]. Therefore, the established simulation model conforms to the hydrogeological conditions of the assessment area and can be used for further studies.
On this basis, the groundwater solute transport parameters in the evaluation area were coupled, the spatiotemporal distribution of solutes under the given conditions was simulated with the kinetic energy of groundwater as the driving force, and then the groundwater solute transport model in the simulation area was obtained. The groundwater level flow field at the end is shown in Figure 8. The final obtained model parameters are displayed in Table 4.

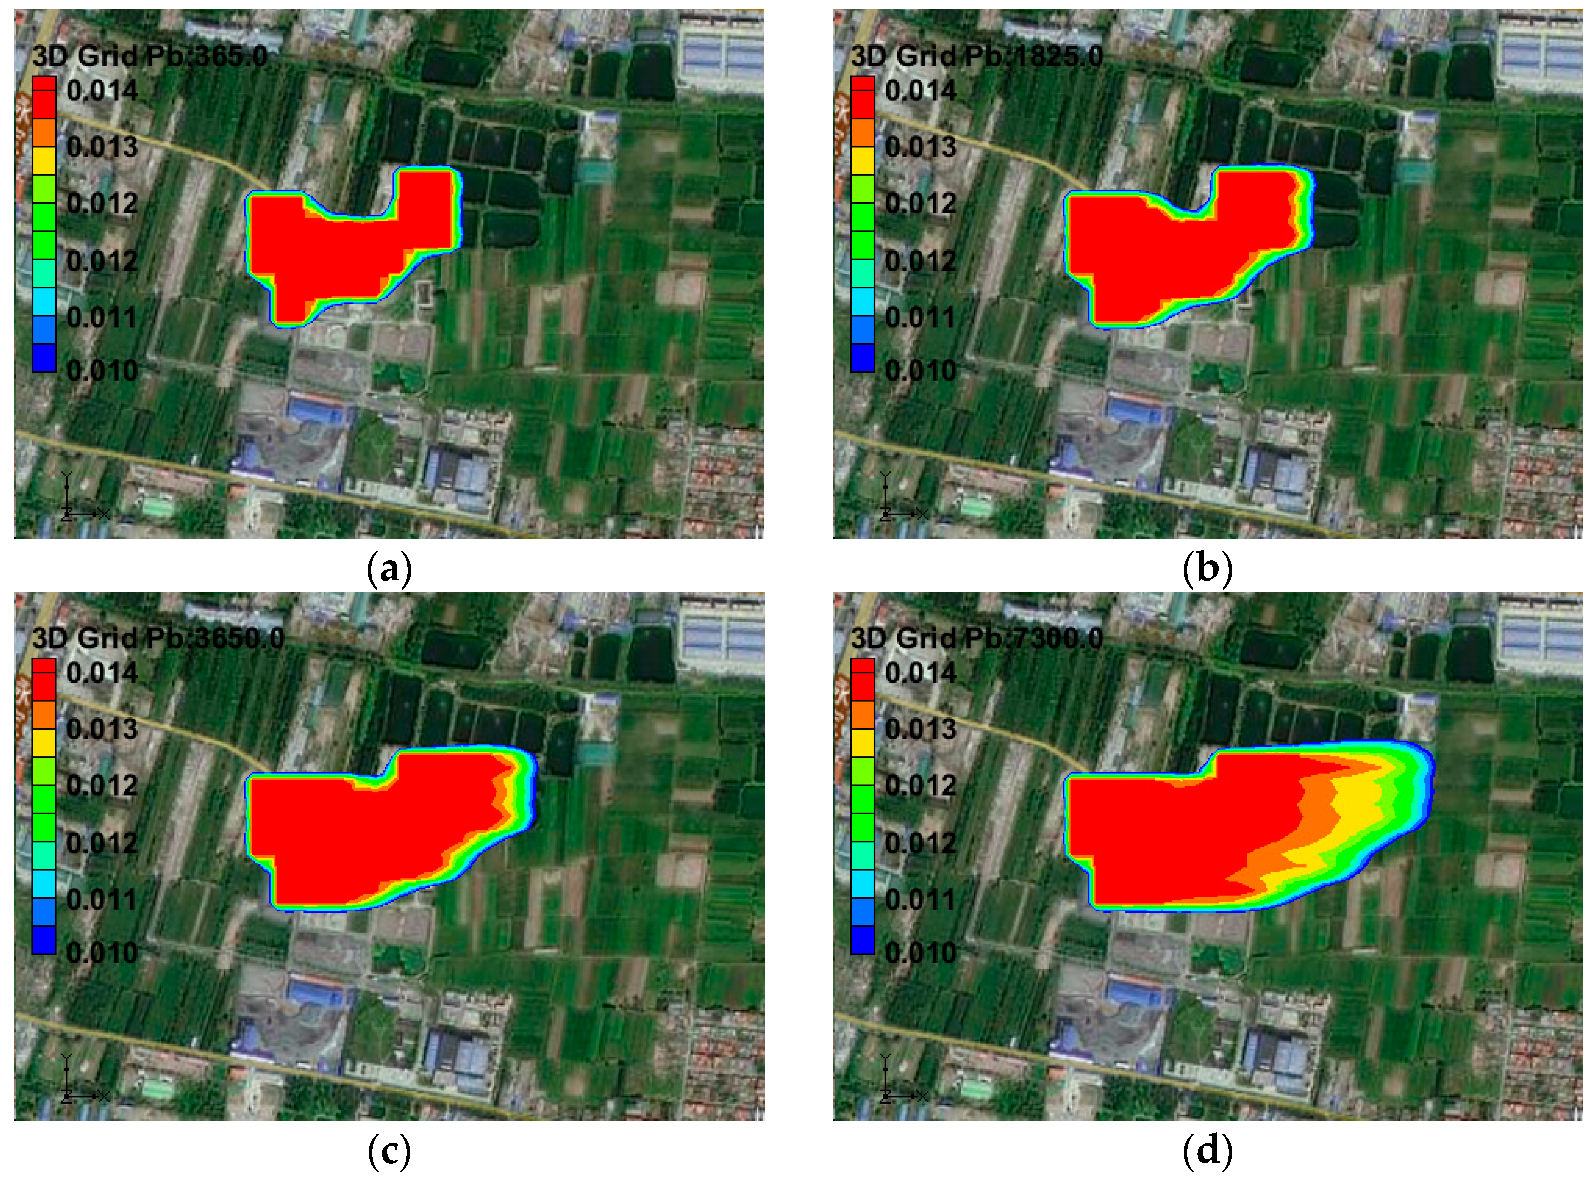
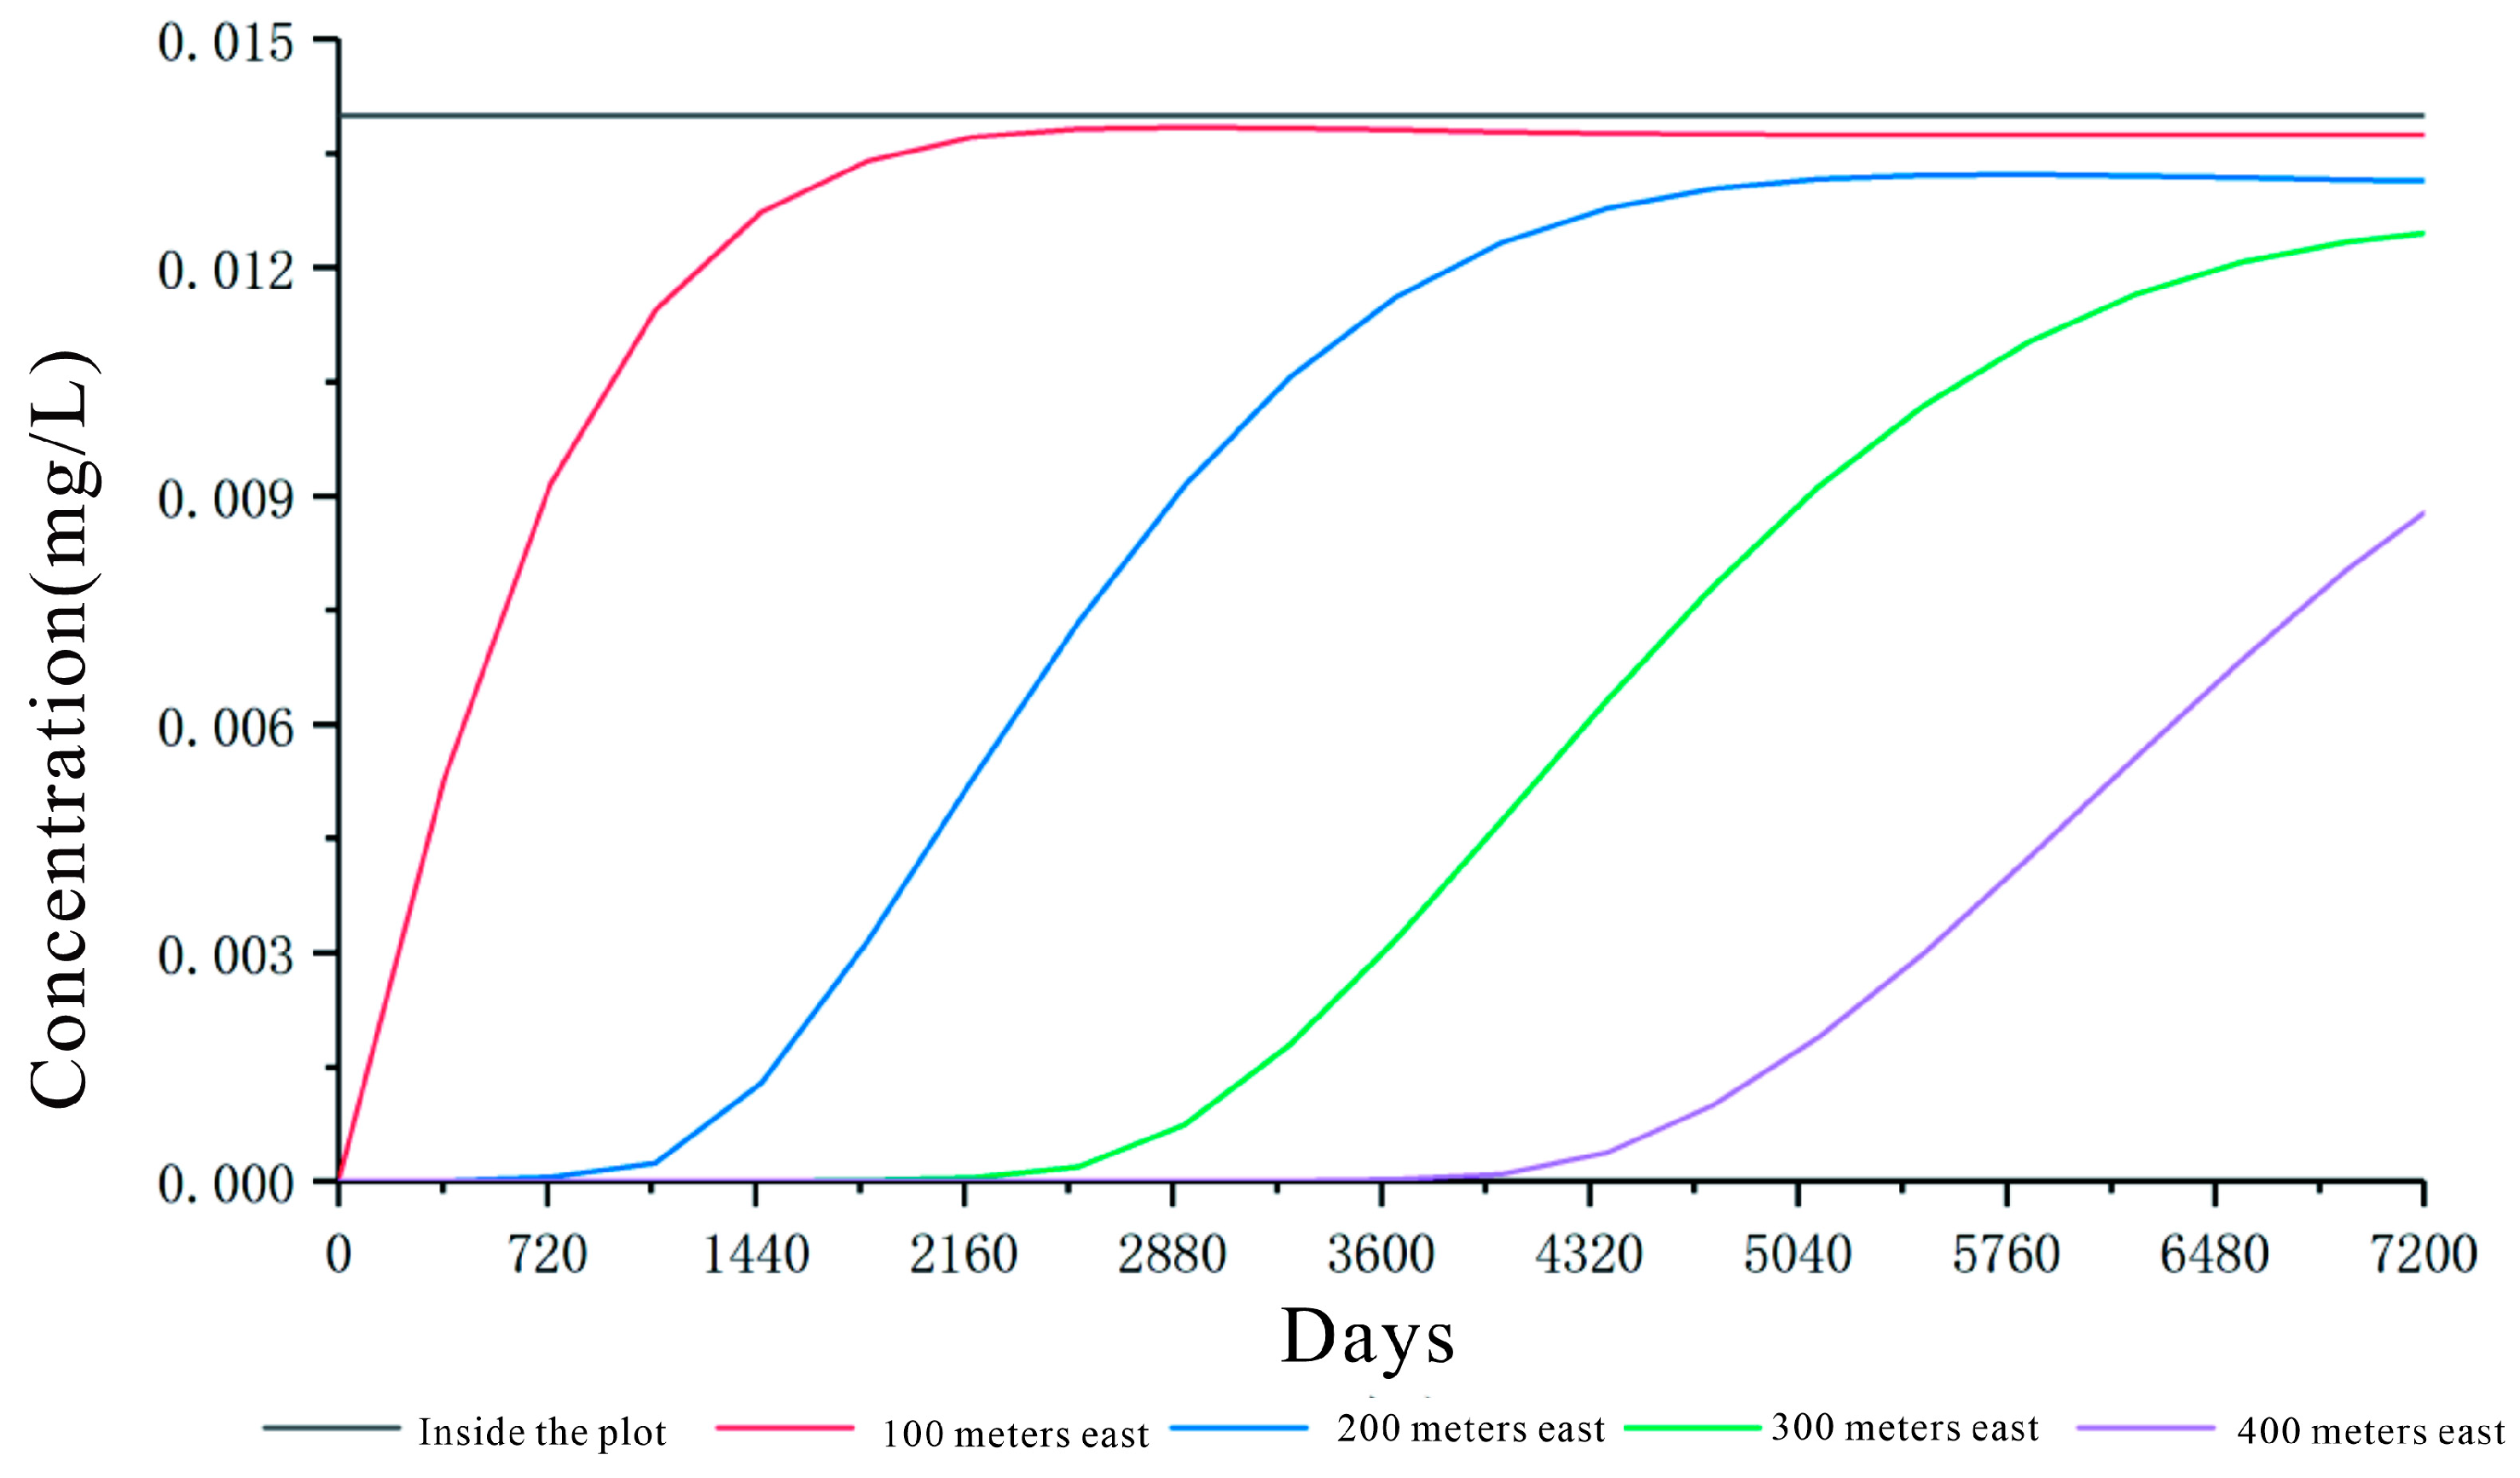
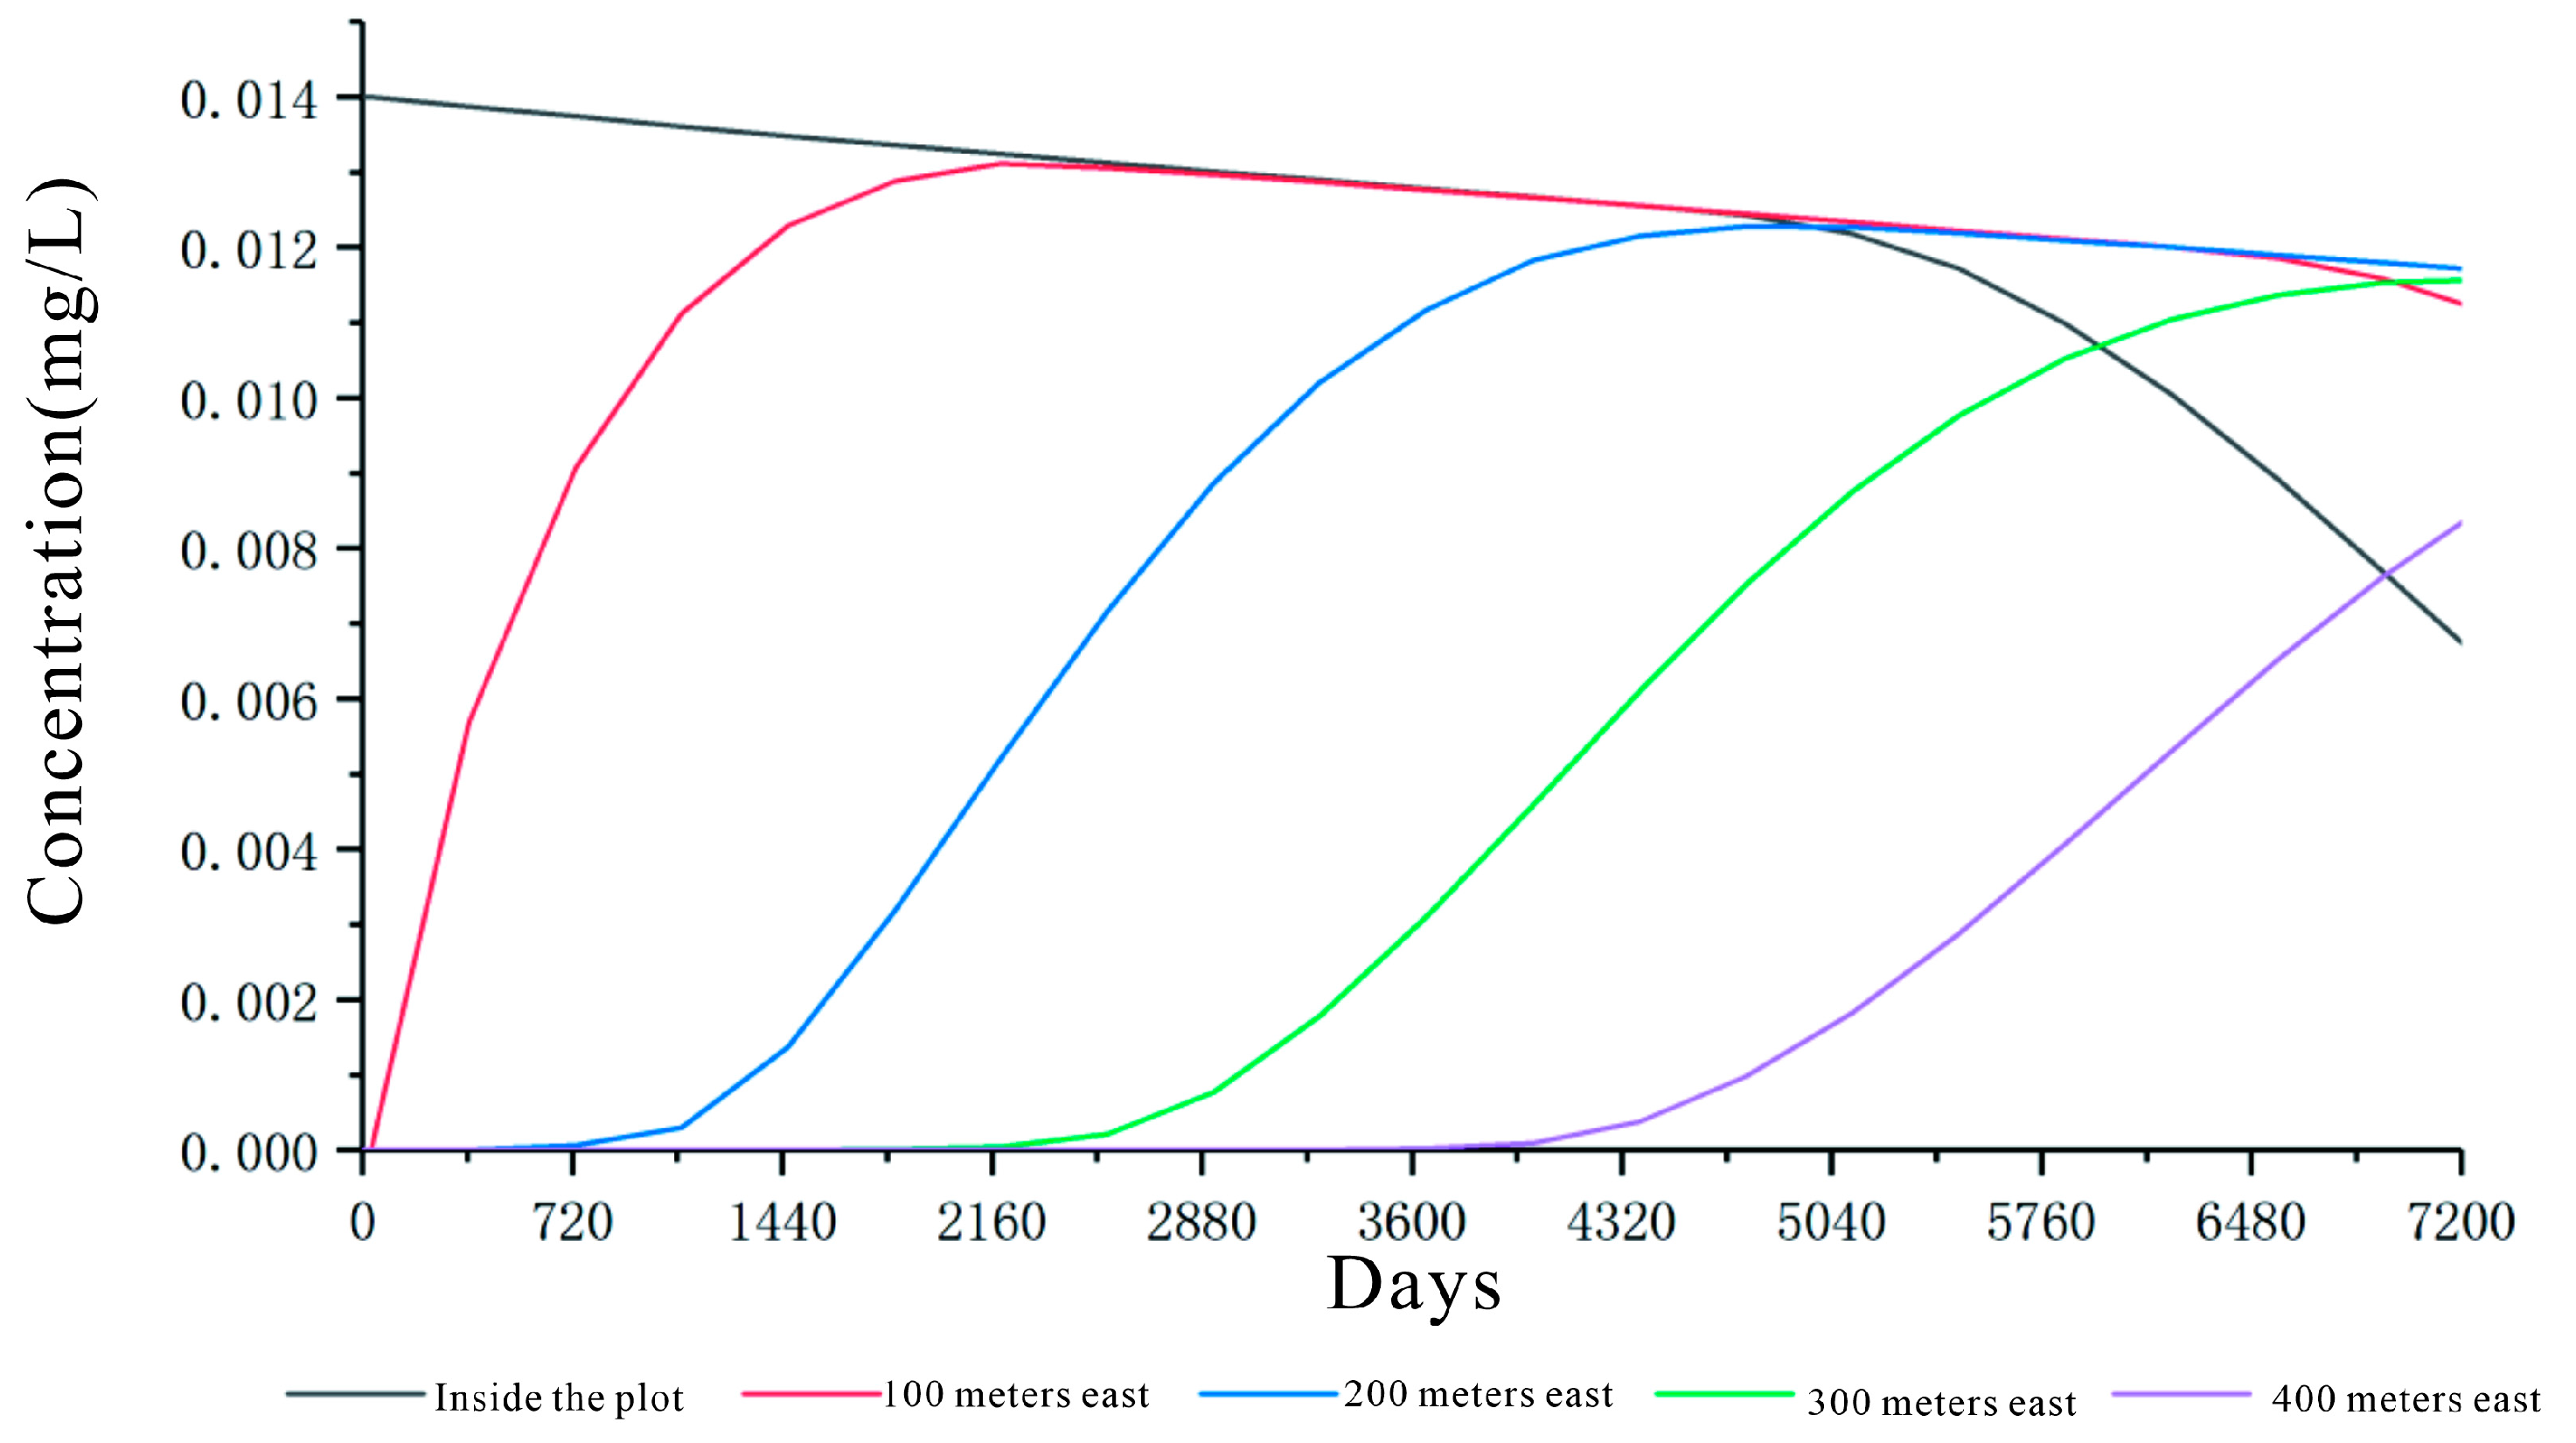
4.5. Pollution Prediction

As the release of pollutants from pollution sources may have an impact on the groundwater environment, this assessment determines the impact on the surrounding sensitive points by predicting the migration direction and concentration of pollutants so that protection measures can be taken timeously. Considering that the exceedance of Mn and As may be related to the geological background, lead (Pb) was selected as the predictive factor for this simulation, and its concentration in the groundwater was set to 0.014 mg/L according to the survey results. The following prediction scenarios were established:
  • Sustained release: assuming the pollution source was not treated during the prediction period, pollutants were continuously released into groundwater. The maximum range of impact and concentration distribution characteristics of the predicted pollutants were simulated to provide a basis for pollution prevention and control.
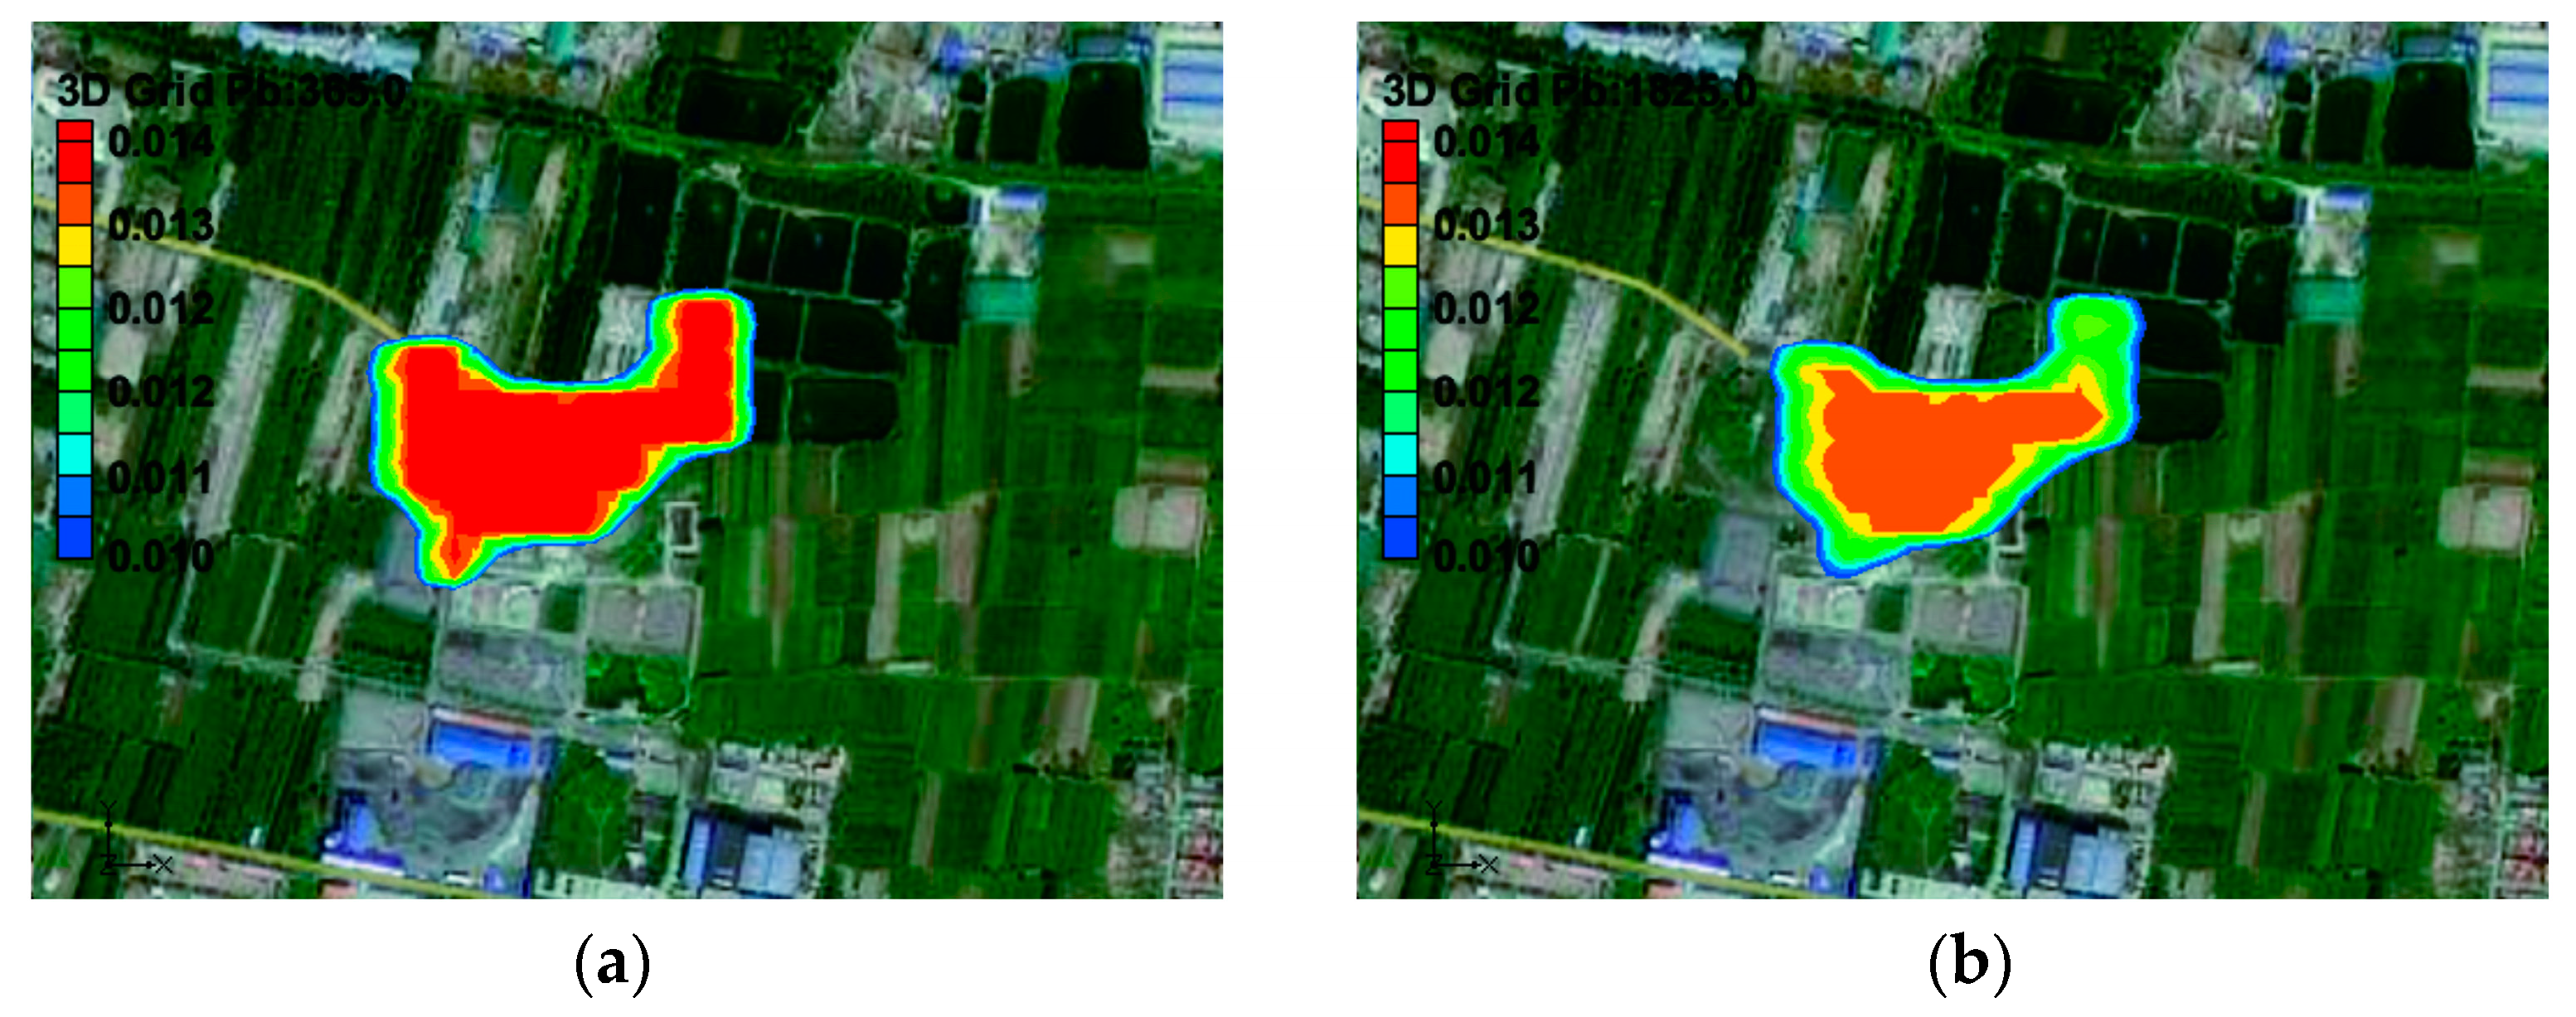
  • Intensive monitoring: assuming that the frequency of water sample testing of monitoring wells near the source of pollution occurs once per month, the discovery of pollution exceeds the standard time needed to take mitigating measures, which simulates the prediction of the impact of encrypted detection conditions and concentration distribution characteristics of pollutants. The finding provides a basis for monitoring design and pollution prevention.
As illustrated in Figure 9 and Figure 10, under continuous release conditions, Pb maintains a constant concentration of 0.014 mg/L at points within the landfill area, the contamination plume continuously spreads downstream to the east, driven by the groundwater flow field, and the exceedance area gradually increases with time during the process. Among them, after one year, the excessive pollution plume migrated eastward by some 42.7 m, and the area of exceedance was 92,314 m2; after 5 years, the excessive pollution plume spread significantly to the east by some 107.7 m, resulting in the groundwater quality of some fish ponds in its immediate vicinity exceeding the standard, and the overall area of exceedance was 118,799 m2; after 10 years, it migrated eastward by some 188.21 m, the exceeded area of fish ponds groundwater increased, and the overall area of exceedance reached 149,514 m2; after 20 years, the pollution plume has passed through the fish ponds and had a greater impact on the water quality of farmland. At this time the migration had reached 347.82 m, and the overall area of exceedance was 204,830 m2.
From Figure 11 and Figure 12, it can be seen that the concentration of pollutants in the landfill site gradually decreased with time after 30 days of short-term release (curve “within the site”), the contamination plume kept moving downstream to the east, driven by the groundwater flow field, and the area of exceedance gradually decreased with time during the process. Among them, after one year, the pollution plume moved 42.84 m to the east, the central concentration of the pollution plume was 0.0138 mg/L, and the overall area of exceedance was 82,984 m2; after 5 years, it had moved 106.16 m to the east, which made the groundwater quality in some areas of the fish pond exceed acceptable standards, and the central concentration of the pollution plume was reduced to 0.0134 mg/L, with an overall area of exceedance of 75,407 m2; after 10 years, the source of excessive pollution migrated eastward to a distance of 185.71 m, and the concentration of the center of the pollution plume decreased to 0.0128 mg/L, with an overall area of exceedance of 65,345 m2; 20 years later, the pollution plume had left the landfill and migrated 338.21 m eastward through the fish pond, which had a greater impact on the groundwater quality under the surrounding farmland, and the concentration of the center of the pollution plume was reduced to 0.0117 mg/L, and the area of exceedance was 44,255 m2.

5. Conclusions

Taking a landfill site in Kaifeng and the surrounding area as the study area, analysess of groundwater chemical characteristics, groundwater quality evaluation and human health risk evaluation, and groundwater pollution simulation and prediction were conducted for the groundwater in the study area. The main conclusions are drawn as follows:
(1)
The groundwater in the study area is neutral, the groundwater is held as pore water, its water chemistry is of the HCO3—Ca·Na type, and the overall total dissolved solids amount to less than 1 g/L;
(2)
According to the EWQI calculation results, the overall water quality in the study area is above the medium level, and the local water quality level is poor. Analyzing the causes, the groundwater in the study area was found to be mainly contaminated by NH4+-N and Mn. Due to the presence of farmed land around the upstream wells, the increase in the concentration of groundwater NH4+-N was caused by the result of long-term fertilization; other wells downstream were also contaminated to varying degrees and so it was determined that the leachate discharged from the landfill pile may have been the cause;
(3)
Using the health risk evaluation model, the non-carcinogenic risks of NH4+-N and Mn in the study area were evaluated mainly through two routes: oral ingestion of groundwater and dermal contact. The HQs at all monitoring sites were less than 1, indicating that their potential risks could be ignored;
(4)
Under the continuous release scenario of pollutants, a Pb pollution plume in the groundwater flow field was driven by continuous diffusion to the east of the downstream area, which exceeded the standard pollution plume area and continued to increase. The process successively caused the fish ponds, and farmland groundwater quality to exceed Class III water quality limits. After 20 years, it spread 347.82 m to the east, and the area of exceedance reached 204,830 m2;
(5)
Intensive monitoring was able to detect contaminant leaks in time and mitigate the impact on downstream groundwater. Under monthly monitoring, contaminant leakage was detected and measures were taken timeously, and the maximum concentrations of the leaked contaminants and the area of exceedance were gradually reduced over time, and the contaminant plume was moved 338.21 m (at its greatest extent) to the east after 20 years, while the area of exceedance was reduced to 44,255 m2.

Author Contributions

Conceptualization, X.M. and S.W.; methodology, X.M.; software, X.M.; validation, S.W.; investigation, S.Z. and T.L.; resources, S.W.; data curation, S.H. and X.Z.; writing—original draft preparation, X.M.; writing—review and editing, S.W.; supervision, S.W.; project administration, S.W. All authors have read and agreed to the published version of the manuscript.

Funding

This research received no external funding.

Institutional Review Board Statement

Not applicable.

Informed Consent Statement

Not applicable.

Data Availability Statement

Not applicable.

Conflicts of Interest

The authors declare no conflict of interest.

References

  1. Wang, K.; Reguyal, F.; Zhuang, T. Risk assessment and investigation of landfill leachate as a source of emerging organic con-taminants to the surrounding environment: A case study of the largest landfill in Jinan City, China. Environ. Sci. Pollut. Res. 2021, 28, 18368–18381. [Google Scholar] [CrossRef]
  2. Parvin, F.; Tareq, S.M.; Parvin, F.; Tareq, S.M. Impact of landfill leachate contamination on surface and groundwater of Bangladesh: A systematic review and possible public health risks assessment. Appl. Water Sci. 2021, 11, 100. [Google Scholar] [CrossRef]
  3. Chaudhary, R.; Nain, P.; Kumar, A. Temporal variation of leachate pollution index of Indian landfill sites and associated human health risk. Environ. Sci. Pollut. Res. 2021, 28, 28391–28406. [Google Scholar] [CrossRef] [PubMed]
  4. Sanga, V.F.; Fabian, C.; Kimbokota, F. Heavy metal pollution in leachates and its impacts on the quality of groundwater resources around Iringa municipal solid waste dumpsite. Environ. Sci. Pollut. Res. 2023, 30, 8110–8122. [Google Scholar] [CrossRef] [PubMed]
  5. Troudi, N.; Tzoraki, O.; Hamzaoui-Azaza, F.; Melki, F.; Zammouri, M. Estimating adults and children’s potential health risks to heavy metals in water through ingestion and dermal contact in a rural area, Northern Tunisia. Environ. Sci. Pollut. Res. 2022, 29, 56792–56813. [Google Scholar] [CrossRef] [PubMed]
  6. Reshadi, M.A.M.; Soleymani Hasani, S.; Nazaripour, M.; McKay, G.; Bazargan, A. The evolving trends of landfill leachate treatment research over the past 45 years. Environ. Sci. Pollut. Res. 2021, 28, 66556–66574. [Google Scholar] [CrossRef]
  7. Gupta, V.; Kumar, D.; Dwivedi, A.; Vishwakarma, U.; Malik, D.S.; Paroha, S.; Gupta, N. Heavy metal contamination in river water, sediment, groundwater and human blood, from Kanpur, Uttar Pradesh, India. Environ Geochem Health. 2022. [Google Scholar] [CrossRef]
  8. Lee, S.W.; Cho, H.G.; Kim, S.O. Comparisons of human risk assessment models for heavy metal contamination within abandoned metal mine areas in Korea. Environ. Geochem. Health 2019, 41, 481–505. [Google Scholar] [CrossRef]
  9. Alsubih, M.; El Morabet, R.; Khan, R.A.; Khan, N.A.; ul Haq Khan, M.; Ahmed, S.; Changani, F. Occurrence and health risk assessment of arsenic and heavy metals in groundwater of three industrial areas in Delhi, India. Environ. Sci. Pollut. Res. 2021, 28, 63017–63031. [Google Scholar] [CrossRef] [PubMed]
  10. Alidadi, H.; Tavakoly Sany, S.B.; Zarif Garaati Oftadeh, B.; Mohamad, T.; Shamszade, H.; Fakhari, M. Health risk assessments of arsenic and toxic heavy metal exposure in drinking water in northeast Iran. Environ. Health Prev. Med. 2019, 24, 59. [Google Scholar] [CrossRef]
  11. Li, L.; Wang, S.; Shen, X.; Jiang, M. Ecological risk assessment of heavy metal pollution in the water of China’s coastal shellfish culture areas. Environ. Sci. Pollut. Res. 2020, 27, 18392–18402. [Google Scholar] [CrossRef]
  12. Wang, Z.; Qin, H.; Liu, X. Health risk assessment of heavy metals in the soil-water-rice system around the Xiazhuang uranium mine, China. Environ. Sci. Pollut. Res. 2019, 26, 5904–5912. [Google Scholar] [CrossRef]
  13. Khalid, S.; Shahid, M.; Shah, A.H.; Saeed, F.; Ali, M.; Qaisrani, S.A.; Dumat, C. Heavy metal contamination and exposure risk assessment via drinking groundwater in Vehari, Pakistan. Environ. Sci. Pollut. Res. 2020, 27, 39852–39864. [Google Scholar] [CrossRef]
  14. Petrosyan, V.; Pirumyan, G.; Perikhanyan, Y. Determination of heavy metal background concentration in bottom sediment and risk assessment of sediment pollution by heavy metals in the Hrazdan River Armenia. Appl. Water Sci. 2019, 9, 102. [Google Scholar] [CrossRef]
  15. Duvva, L.K.; Panga, K.K.; Dhakate, R.; Himabindu, V. Health risk assessment of nitrate and fluoride toxicity in groundwater contamination in the semi-arid area of Medchal, South India. Appl. Water Sci. 2022, 12, 11. [Google Scholar] [CrossRef]
  16. Kazemi, A.; Esmaeilbeigi, M.; Sahebi, Z.; Shooshtari, S.J. Hydrochemical evaluation of groundwater quality and human health risk assessment of trace elements in the largest mining district of South Khorasan, Eastern Iran. Environ Sci Pollut Res. 2022, 29, 81804–81829. [Google Scholar] [CrossRef]
  17. He, L.; Tu, C.; He, S.; Long, J.; Sun, Y.; Sun, Y.; Lin, C. Fluorine enrichment of vegetables and soil around an abandoned aluminium plant and its risk to human health. Environ. Geochem. Health 2021, 43, 1137–1154. [Google Scholar] [CrossRef]
  18. Soto-Jiménez, M.F.; Flegal, A.R. Inventory of Pb emissions from one of the largest historic Pb smelter worldwide: 118-year legacy of Pb pollution in northern Mexico. Environ. Sci. Pollut. Res 2021, 28, 20737–20750. [Google Scholar] [CrossRef]
  19. Yuan, Z.; Li, Q.; Ma, X.; Han, M. Assessment of heavy metals contamination and water quality characterization in the Nanming River, Guizhou Province. Environ. Geochem. Health 2021, 43, 1273–1286. [Google Scholar] [CrossRef]
  20. Ulniković, V.P.; Kurilić, S.M. Heavy metal and metalloid contamination and health risk assessment in spring water on the territory of Belgrade City, Serbia. Environ. Geochem. Health 2020, 42, 3731–3751. [Google Scholar] [CrossRef]
  21. Cao, X.; Li, W.; Song, S.; Wang, C.; Khan, K. Source apportionment and risk assessment of soil heavy metals around a key drinking water source area in northern China: Multivariate statistical analysis approach. Environ. Geochem. Health 2023, 45, 343–357. [Google Scholar] [CrossRef]
  22. Talalaj, I.A.; Biedka, P. Use of the landfill water pollution index LWPI for groundwater quality assessment near the landfill sites. Environ. Sci. Pollut. Res. 2016, 23, 24601–24613. [Google Scholar] [CrossRef]
  23. El Mountassir, O.; Bahir, M.; Ouazar, D.; Chehbouni, A.; Carreira, P.M. Temporal and spatial assessment of groundwater contamination with nitrate using nitrate pollution index NPI, groundwater pollution index GPI, and GIS case study: Essaouira basin, Morocco. Environ. Sci. Pollut. Res. 2022, 29, 17132–17149. [Google Scholar] [CrossRef]
  24. Li, C.; Gao, Z.; Chen, H.; Wang, J.; Liu, J.; Li, C.; Xu, C. Hydrochemical analysis and quality assessment of groundwater in southeast North China Plain using hydrochemical, entropy-weight water quality index, and GIS techniques. Environ. Earth. Sci. 2021, 80, 523. [Google Scholar] [CrossRef]
  25. Li, H.; Chai, L.; Yang, Z.; Liao, Q.; Liu, Y.; Ouyang, B. Seasonal and spatial contamination statuses and ecological risk of sediment cores highly contaminated by heavy metals and metalloids in the Xiangjiang River. Environ. Geochem. Health 2019, 41, 1617–1633. [Google Scholar] [CrossRef]
  26. Mokarram, M.; Saber, A.; Obeidi, R. Effects of heavy metal contamination released by petrochemical plants on marine life and water quality of coastal areas. Environ. Sci. Pollut. Res. 2021, 28, 51369–51383. [Google Scholar] [CrossRef]
  27. Kumar, P.; Mishra, V.; Yadav, S.; Yadav, A. Heavy metal pollution and risks in a highly polluted and populated Indian river–city pair using the systems approach. Environ. Sci. Pollut. Res. 2022, 29, 60212–60231. [Google Scholar] [CrossRef]
  28. Herath, I.K.; Wu, S.; Ma, M.; Ping, H. Heavy metal toxicity, ecological risk assessment, and pollution sources in a hydropower reservoir. Environ. Sci. Pollut. Res. 2022, 29, 32929–32946. [Google Scholar] [CrossRef] [PubMed]
  29. Lu, Q.; Bian, Z.; Tsuchiya, N. Assessment of heavy metal pollution and ecological risk in river water and sediments in a historically metal mined watershed, Northeast Japan. Environ. Monit. Assess. 2021, 193, 814. [Google Scholar] [CrossRef] [PubMed]
  30. Zhang, Y.; He, Z.; Tian, H.; Huang, X.; Zhang, Z.; Liu, Y.; Li, R. Hydrochemistry appraisal, quality assessment and health risk evaluation of shallow groundwater in the Mianyang area of Sichuan Basin, Southwestern China. Environ. Earth Sci. 2021, 80, 576. [Google Scholar] [CrossRef]
  31. Zhou, Y.; Li, P.; Chen, M.; Dong, Z.; Lu, C. Groundwater quality for potable and irrigation uses and associated health risk in southern part of Gu’an County, North China Plain. Environ. Geochem. Health 2021, 43, 813–835. [Google Scholar] [CrossRef]
  32. Valivand, F.; Katibeh, H. Prediction of Nitrate Distribution Process in the Groundwater via 3D Modeling. Environ. Model Assess. 2020, 25, 187–201. [Google Scholar] [CrossRef]
  33. Ahmed, A.T.; Alluqmani, A.E.; Shafiquzzaman, M. Impacts of landfill leachate on groundwater quality in desert climate regions. Int. J. Environ. Sci. Technol. 2019, 16, 6753–6762. [Google Scholar] [CrossRef]
  34. GB/T 14848-2017; Groundwater Quality Standard. Ministry of Land and Resources of the People’s Republic of China; Ministry of Water Resources: Beijing, China, 2017.
  35. GB/T 5750.6-2006; Standard Test Methods for Drinking Water—Metal indexes. Ministry of Health of the People’s Republic of China; China National Standardization Administration Committee: Beijing, China, 2006.
  36. Amiri, V.; Rezaei, M.; Sohrabi, N. Groundwater quality assessment using entropy weighted water quality index (EWQI) in Lenjanat, Iran. Environ. Earth Sci. 2014, 72, 3479–3490. [Google Scholar] [CrossRef]
  37. GB 50137-2011; Classification of Urban Land and Standard for Planning and Construction Land. Ministry of Housing and Urban-Rural Development of the People’s Republic of China: Beijing, China, 2010.
  38. Zuo, R.; Chen, X.; Li, X.; Shan, D.; Yang, J.; Wang, J.; Teng, Y. Distribution, genesis, and pollution risk of ammonium nitrogen in groundwater in an arid loess plain, northwestern China. Environ. Earth Sci. 2017, 76, 629. [Google Scholar] [CrossRef]
  39. Ige, O.O.; Owolabi, A.T.; Olabode, O.F.; Obasaju, D.O. Groundwater quality evaluation: A case study of Igando waste dumpsite, south-western Nigeria. Appl. Water Sci. 2022, 12, 79. [Google Scholar] [CrossRef]
  40. GB 5749-2022; Hygienic Standard for Drinking Water. National Health and Wellness Commission of the People’s Republic of China: Beijing, China, 2022.
  41. Prasad, S.; Saluja, R.; Joshi, V.; Garg, J.K. Heavy metal pollution in surface water of the Upper Ganga River, India: Human health risk assessment. Environ. Monit. Assess 2020, 192, 742. [Google Scholar] [CrossRef]
  42. Vig, N.; Ravindra, K.; Mor, S. Heavy metal pollution assessment of groundwater and associated health risks around coal thermal power plant, Punjab, India. Int. J. Environ. Sci. Technol. 2022. [Google Scholar] [CrossRef]
  43. Ukah, B.U.; Egbueri, J.C.; Unigwe, C.O.; Ubido, O.E. Extent of heavy metals pollution and health risk assessment of groundwater in a densely populated industrial area, Lagos, Nigeria. Int. J. Energy Water Res. 2019, 3, 291–303. [Google Scholar] [CrossRef]
  44. Boateng, T.K.; Opoku, F.; Akoto, O. Heavy metal contamination assessment of groundwater quality: A case study of Oti landfill site, Kumasi. Appl. Water Sci. 2019, 9, 33. [Google Scholar] [CrossRef]
  45. Gao, Z.; Han, C.; Yuan, S.; Liu, J.; Peng, Y.; Li, C. Assessment of the hydrochemistry, water quality, and human health risk of groundwater in the northwest of Nansi Lake Catchment, North China. Environ. Geochem. Health 2022, 44, 961–977. [Google Scholar] [CrossRef] [PubMed]
  46. Rahman, M.A.; Paul, M.; Bhoumik, N.; Hassan, M.; Alam, M.; Aktar, Z. Heavy metal pollution assessment in the groundwater of the Meghna Ghat industrial area, Bangladesh, by using water pollution indices approach. Appl. Water Sci. 2020, 10, 186. [Google Scholar] [CrossRef]
  47. Singh, K.R.; Dutta, R.; Kalamdhad, A.S.; Kumar, B. Review of existing heavy metal contamination indices and development of an en-tropy-based improved indexing approach. Environ. Dev. Sustain. 2020, 22, 7847–7864. [Google Scholar] [CrossRef]
  48. GB/T 14497-1993; Working Requirements for Groundwater Resource Management Model. Ministry of Geology and Minerals of the People’s Republic of China: Beijing, China, 1993.
Figure 1. Overview of the study area and hydrogeological profile.
Water 15 00723 g001
Figure 2. Location map of groundwater monitoring sites in the study area.
Water 15 00723 g002
Figure 3. Durov plots of water samples from sampling sites in the study area.
Water 15 00723 g003
Figure 4. Spatial distribution of EWQI value levels in the study area.
Water 15 00723 g004
Figure 5. Groundwater NH4+-N and Mn v. EWQI scatter plots. (a) Scatterplot of NH4+-N EWQI levels in groundwater; (b) Scatterplot of Mn EWQI levels in groundwater.
Water 15 00723 g005
Figure 6. Box line map of groundwater hazard factor in the study area.
Water 15 00723 g006
Figure 7. Three-dimensional structural model of the simulation area (vertical exaggeration 5×).
Water 15 00723 g007
Figure 8. Groundwater level flow field at the end of the fitted time period.
Water 15 00723 g008
Figure 9. Pb concentration distribution map. (a) After 1 year; (b) After 5 years; (c) After 10 years; (d) After 20 years.
Water 15 00723 g009
Figure 10. Pb concentration variation curve.
Water 15 00723 g010
Figure 11. Pb concentration distribution map. (a) After 1 year; (b) After 5 years; (c) After 10 years; (d) After 20 years.
Water 15 00723 g011aWater 15 00723 g011b
Figure 12. Pb concentration variation curve.
Water 15 00723 g012
Table 1. EWQI classification.
EWQIGradeDescription
≤501Excellent
50~1002Good
101~1503Moderate
151~2004Poor
>2005Very poor
Table 2. Health risk evaluation parameters.
ParameterDescriptionUnitRecommended Value
GWERaDaily drinking water intake for adultsL·d−11
EFaAdult exposure frequencyd·a−1250
EDaAdult exposure perioda25
BWaAdult body masskg61.8
ATncMean time to non-carcinogenic effectsd9125
RfDo (NH4+-N)Reference dose of ammonia nitrogen via oral intakemg/(kg·d)0.97
RfDo (Mn)Reference dose of Mn via oral intakemg/(kg·d)0.046
RfDo (As)Reference dose of As via oral intakemg/(kg·d)0.0043
RfDo (F)Reference dose of F via oral intakemg/(kg·d)0.06
RfDo (Pb)Reference dose of Pb via oral intakemg/(kg·d)0.0035
WAFReference dose distribution ratio for exposure to groundwaterDimensionless0.5
Table 3. Reference values for water chemistry characteristics in the study area.
ParameterUnitHighest Level Min.Max.MeansStandard Deviation C.V.
pH-6.5–8.57.1407.8607.4530.2660.036
TDSmg/L1000446.0003010.000954.875838.1480.878
K+mg/L-0.94413.6003.2374.2761.321
Ca2+mg/L20079.800274.000124.45063.0090.506
Na+mg/L20039.100458.000114.050139.5391.223
Mg2+mg/L5034.200145.00061.25037.3030.609
HCO3mg/L600326.000703.000521.750125.5910.241
Clmg/L25041.6001090.000200.625360.6721.798
SO42−mg/L25016.500130.00064.60037.7880.585
NH4+-Nmg/L0.50.0401.4200.3400.4491.321
Fmg/L1.20.4500.6200.5460.0690.127
Asmg/L0.050.0040.0140.0080.0040.512
Mnmg/L0.10.1530.5950.3350.1520.454
PbMg/L0.010.0020.0210.0110.000060.005
Table 4. Parameter table of the coupled groundwater solute transport model.
Layer NumberKh (m/d)Kv (m/d)μLongitudinal DispersionLateral Dispersion
Level 112.871.280.24.420.442
Level 23.870.390.1510.1
Level 312.871.280.24.420.442
Disclaimer/Publisher’s Note: The statements, opinions and data contained in all publications are solely those of the individual author(s) and contributor(s) and not of MDPI and/or the editor(s). MDPI and/or the editor(s) disclaim responsibility for any injury to people or property resulting from any ideas, methods, instructions or products referred to in the content.

