5.1. Groundwater Isotopic Composition and Sources
Hydrogen (δ
2H) and oxygen (δ
18O) isotopes are effective tools for analyzing hydrological processes across various scales [
11].
Table 3 summarizes the isotopic composition of the water samples taken in the HSB. The relationship between δ
2H and δ
18O for all water samples is plotted in
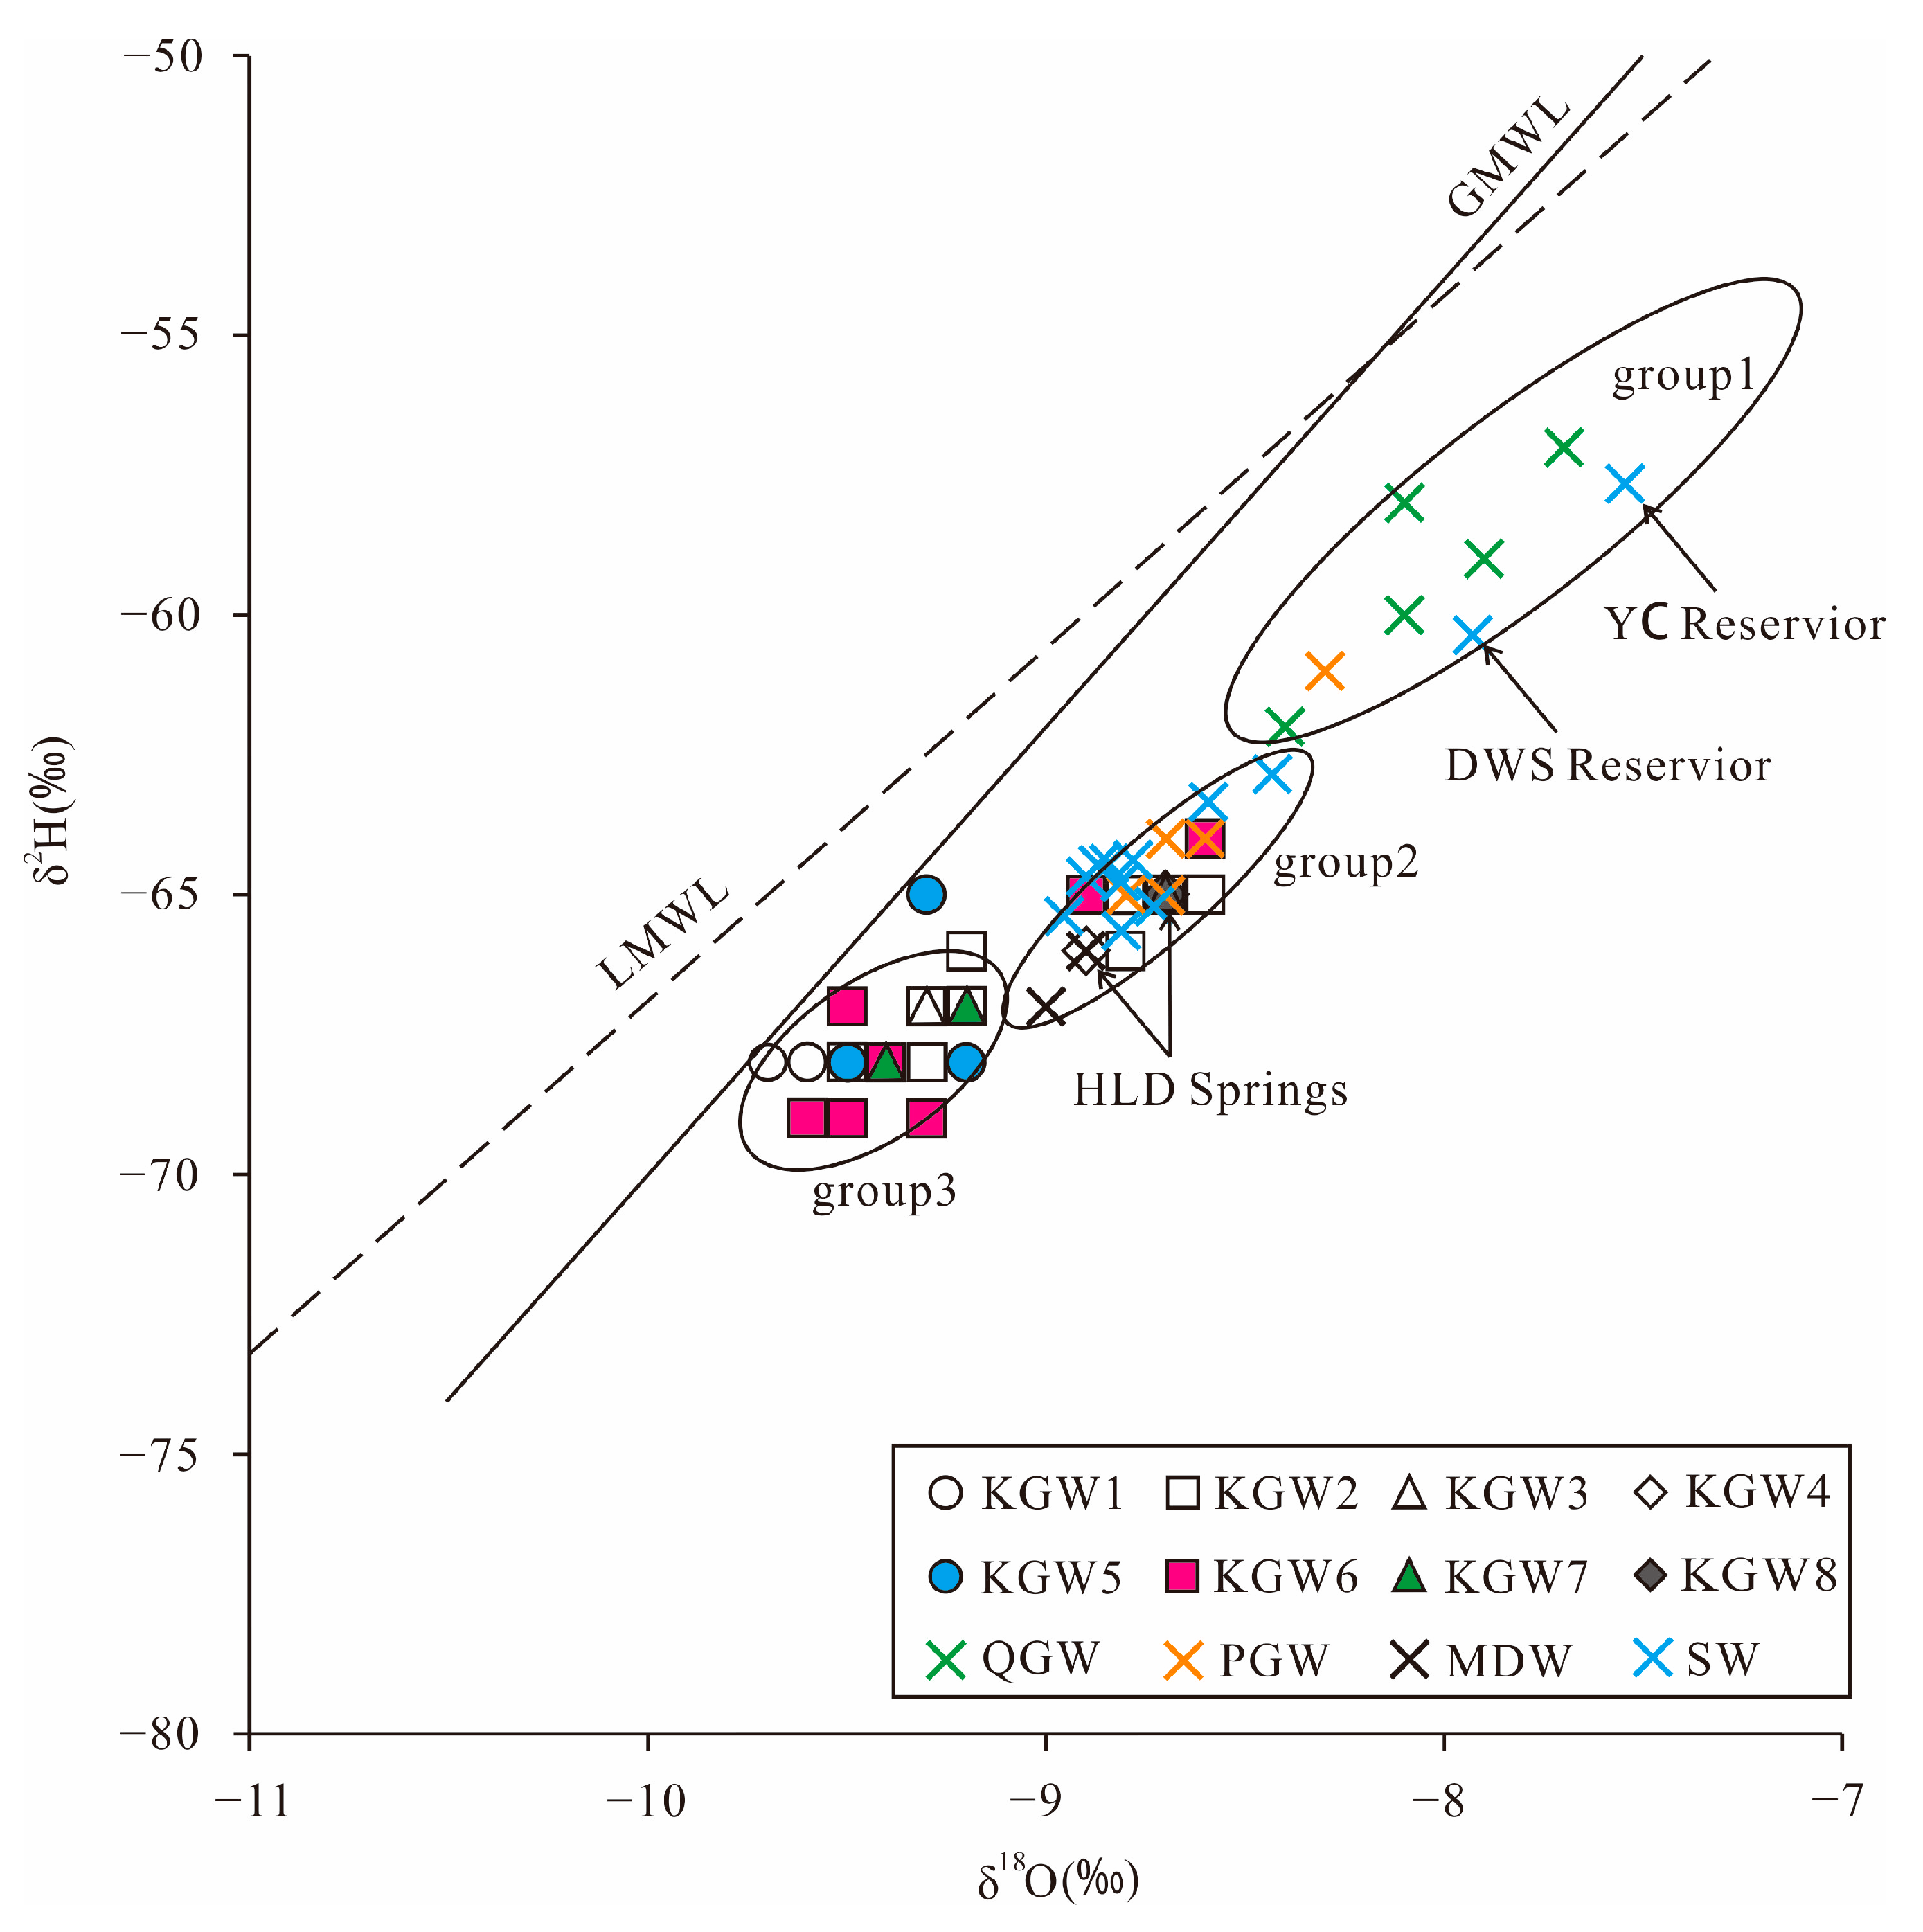
Figure 4. Due to the lack of precipitation isotope data in the study area, the data of the adjacent Shijiazhuang station were selected. The local meteoric water line was fitted as δ
2H = 6.4δ
18O-3.8. The slope and intercept of the local meteoric water line (LMWL) were lower than that of the global meteoric water line (GMWL: δ
2H= 8δ
18O + 10) [
28], which probably resulted from secondary evaporation during rainfall.
As can be seen in
Figure 4, all samples were distributed near GMWL and LMWL, indicating that the groundwater in the study area was mainly derived from meteoric water. In addition, all the samples were distributed in parallel to the LMWL, but the intercept was lower. This phenomenon can be interpreted as the evaporated soil moisture mixing with the subsequent rainfall, which infiltrated the soil and impelled the residual water downward by regular rainfall events [
7].
The δ
2H and δ
18O values of the QGW samples ranged from −62.0 to −57.0 and −8.4~−7.7, respectively. The PGW samples ranged from −65.0 to −64.0 and −8.8~−8.5, respectively. The KGW samples ranged from −69.0 to −64.0 and −9.6~−8.6, respectively, while the MDW samples ranged from −67.0 to −66.0 and −9.1~−8.9, respectively (
Table 3).
It can also be seen that the QGW samples were concentrated in the upper right corner (group 1), which reflected the fact that the QGW potentially underwent strong evaporation, resulting in higher δ
2H and δ
18O values, while the δ
2H and δ
18O values for most of the KGW samples were significantly low, implying the KGW was probably formed by precipitation under wet and cold climate or high-altitude conditions [
10,
18]. In addition, the δ
2H and δ
18O values of the PGW and MDW samples were closer to those of the KGW samples, reflecting that some of the KGW samples had a relatively close hydraulic connection with the PGW and MDW samples.
It is worth noting that most of the surface water (SW) samples were located in group 2, except the YC Reservoir (S11) and DWS Reservoir (S12). The river water samples were isotopically similar to the spring water and some of the KGW samples. This showed that both the reservoir water and the Quaternary groundwater (QGW) had experienced strong evaporation. The concentration of heavy isotopes in the reservoir water was higher than that in the river water. The river water was mainly recharged by the karst groundwater rather than precipitation.
5.3. Correlation of Hydrochemical Composition
The consistency of the sources of the hydrochemical composition in groundwater can be inferred with a correlation analysis [
10,
30]. The correlation matrix of the major water chemical index was determined using SPSS software (
Table 4). The results showed that TDS had a high positive correlation (r ≥ 0.70,
p = 0.01) with Na
+, Ca
2+, Mg
2+, Cl
−, SO
42− and HCO
3−, which proved that the above ions were the main factors affecting the TDS value. Na
+-Cl
−, Ca
2+-SO
42−, Ca
2+-HCO
3− and Ca
2+-Mg
2+ also had a high positive correlation (r ≥ 0.70,
p = 0.01), indicating that the dissolution of carbonate, sulfate and halite occurred in the study area. In addition, the NO
3− had a positive strong correlation with Na
+ and Cl
− (r ≥ 0.70,
p = 0.01) and moderate correlations with Ca
2+ and SO
42− (0.50 ≤ r <0.70,
p = 0.01). As mentioned above, the NO
3− concentration was relatively high and had a relatively high correlation with Na
+ and HCO
3−, indicating that NO
3− in groundwater might be related to anthropogenic activities such as agricultural irrigation and domestic pollution.
5.4. Water–Rock Interaction
The ratios of ion concentrations can effectively reflect the formation mechanisms and sources of the major ions in groundwater [
11,
31].
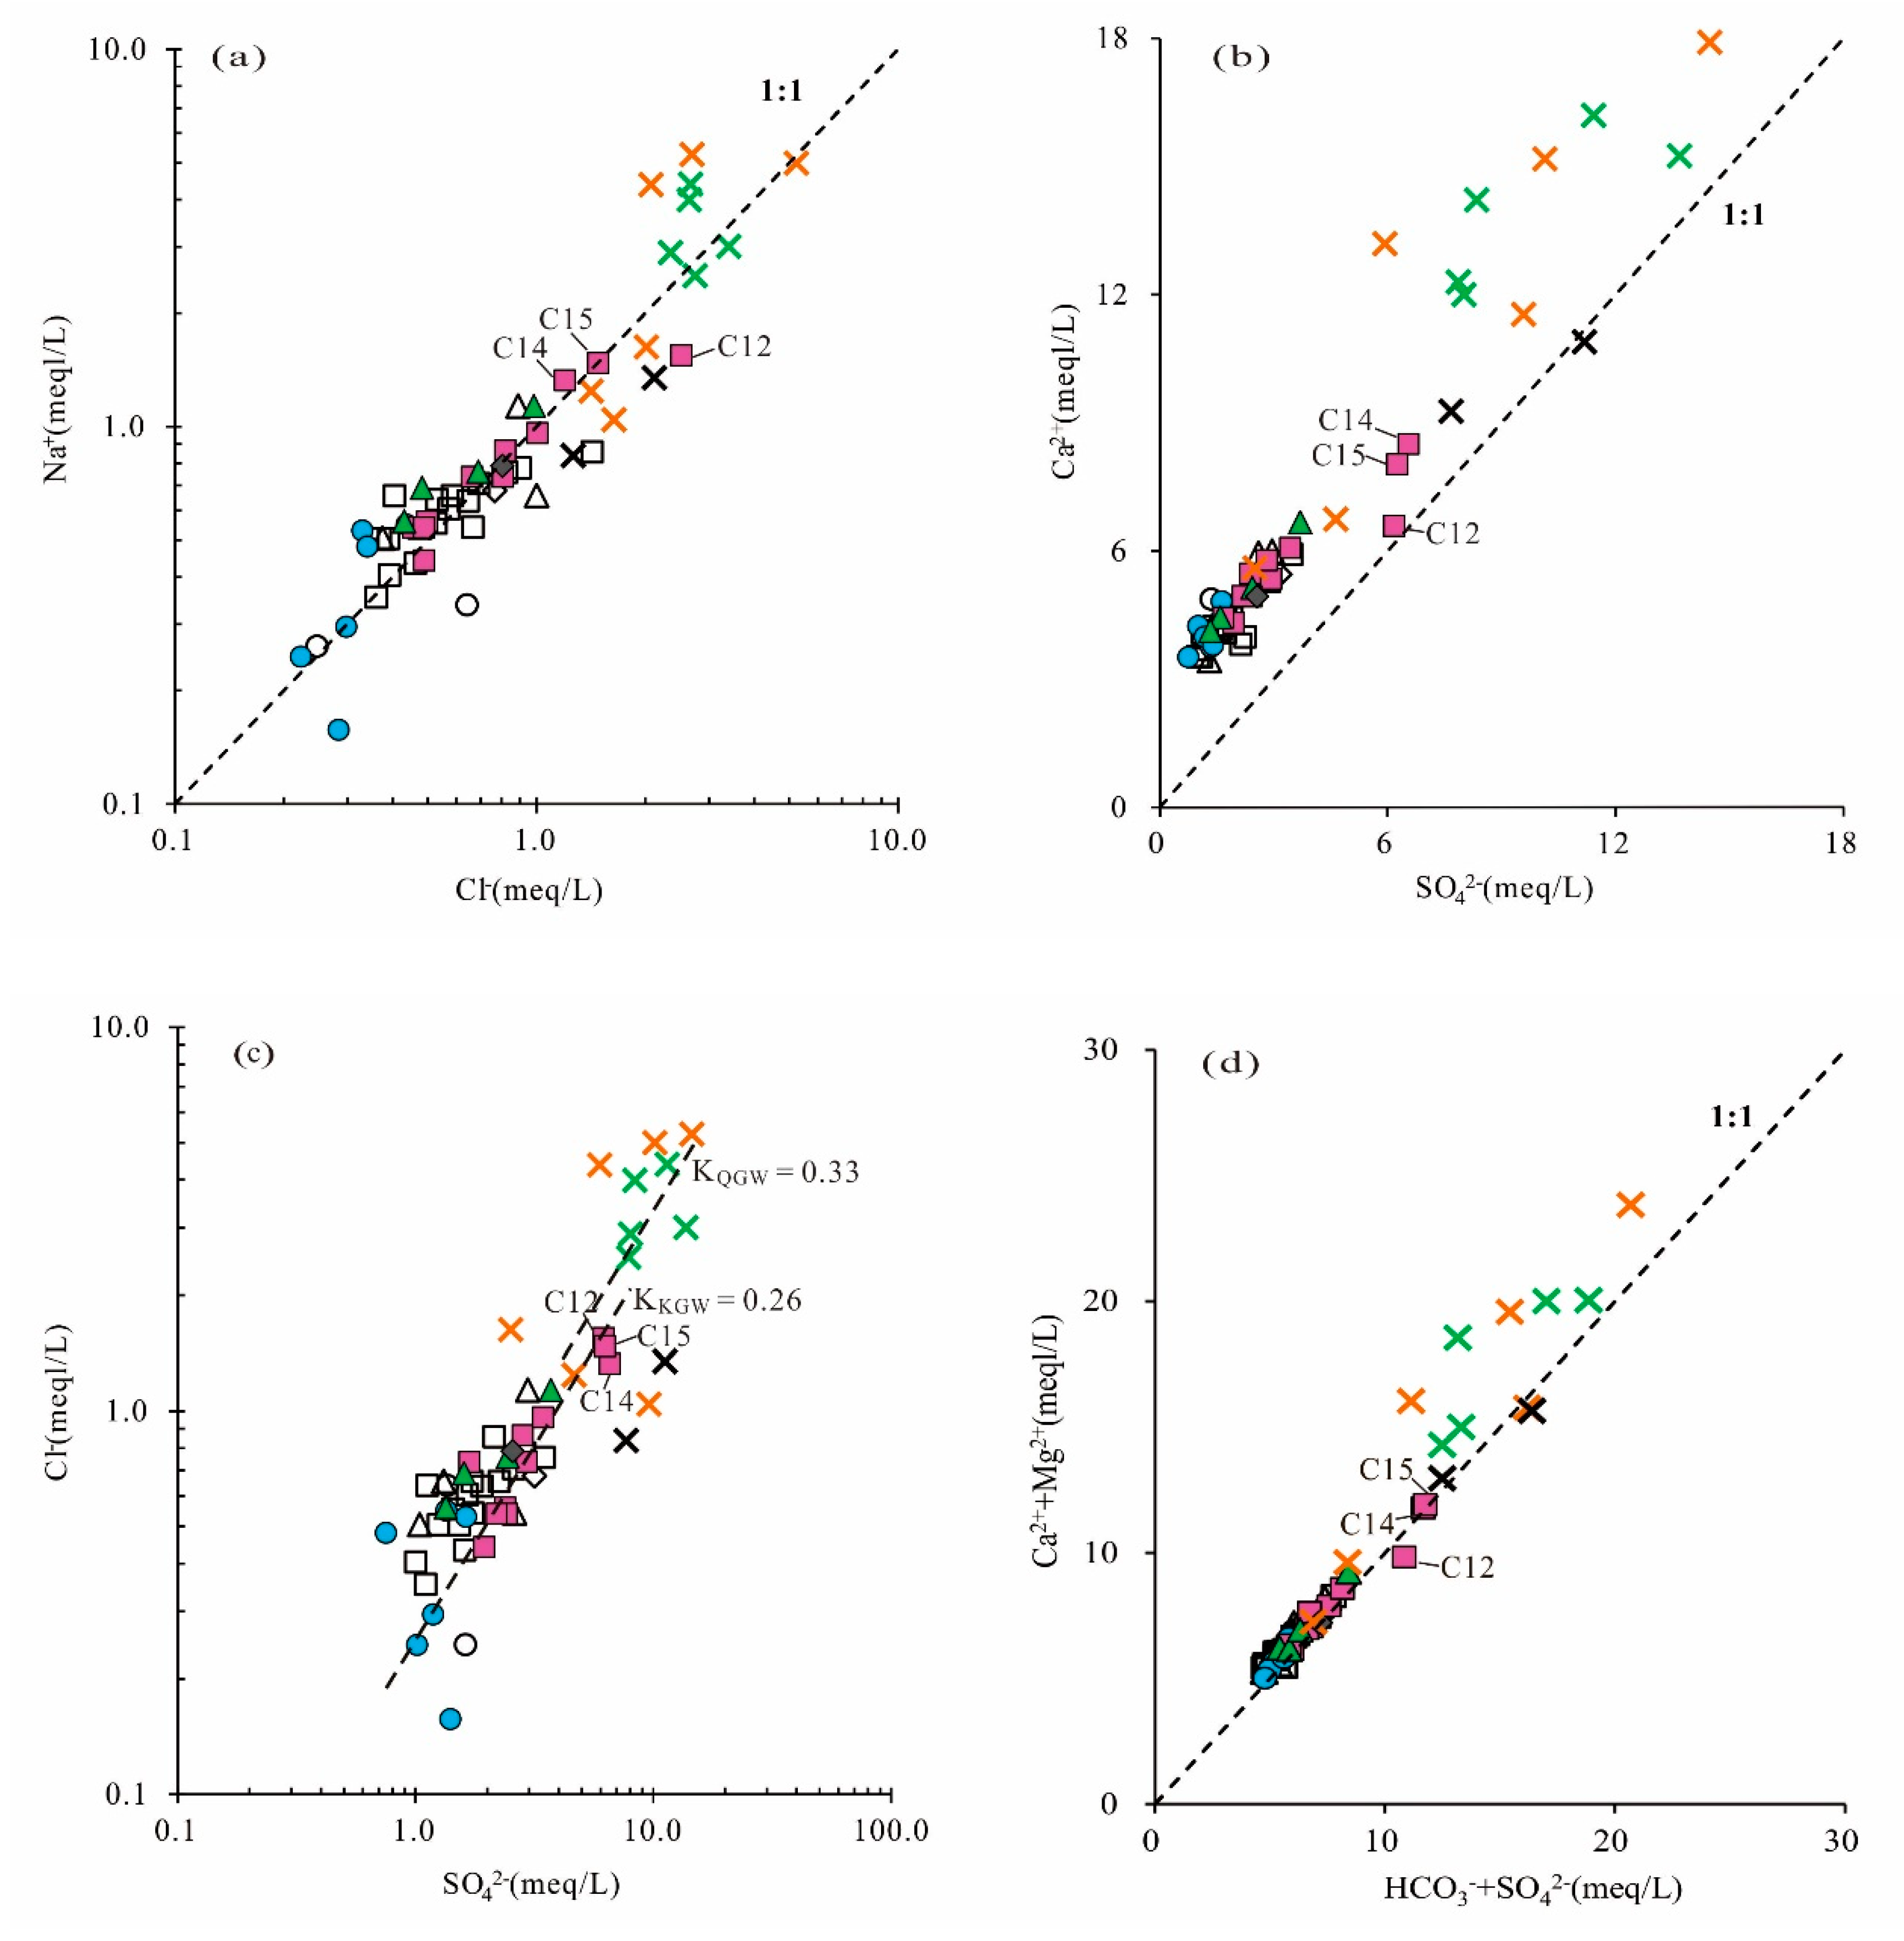
The scatter diagram of Cl
− versus Na
+ (
Figure 6a) showed that almost all the water samples were close to the 1:1 line. It indicated that the dissolution of halite might be the main source of Cl
− and Na
+ in different types of groundwater. The ratio of Na
+/Cl
− ranged from 0.47 to 1.80 with a mean value of 0.99. The results followed the expected 1:1 trend line, which further confirmed that Na
+ and Cl
− were derived primarily from halite dissolution. Halite could dissolve continuously into the groundwater.
In the plot of SO
42− and Ca
2+, if gypsum dissolution is the only source of SO
42− in the groundwater, Ca
2+/SO
42− will follow the 1:1 line. It can be seen in
Figure 6b that the majority of the samples were distributed above the 1:1 line, and the Ca
2+ concentration was higher than SO
42−, suggesting that Ca
2+ was not completely from gypsum dissolution and that there were other sources such as carbonate (dolomite, calcite) mineral dissolution, reverse cation exchange or anthropogenic input.
As shown in
Figure 6c, there were no significant correlations between SO
42− and Cl
− in some of the PGW and KGW samples (Zone I), while there were significant positive correlations between SO
42− and Cl
− in the majority of QGW, PGW and KGW samples from the runoff area (Zone II). It indicated that SO
42− and Cl
− in these samples probably had the same sources and might have been related to anthropogenic activities, such as coal mining development, agricultural irrigation and industrial production. In addition, it was worth noting that the slope of Cl
−/SO
42− in the QGW was higher than that in the KGW, implying that anthropogenic activities had a greater impact on shallow groundwater, resulting in higher concentrations of SO
42− and Cl
−.
The relationship between (HCO
3−+SO
42−) and (Ca
2++Mg
2+) (expressed in meq/L) in groundwater samples will follow the 1:1 line if these ions are strongly controlled by the carbonate and gypsum equilibrium [
18]. As shown in the scatter plot (
Figure 6d), nearly all the KGW samples were distributed along the equiline (1:1 line), reflecting that Ca
2+, Mg
2+, HCO
3− and SO
42− were mainly derived from the dissolution of carbonate and gypsum, whereas most of the QGW and PGW samples fell above the 1:1 line, indicating that there were extra sources of Ca
2+ and Mg
2+ in the QGW and PGW, such as the dissolution of silicate minerals.
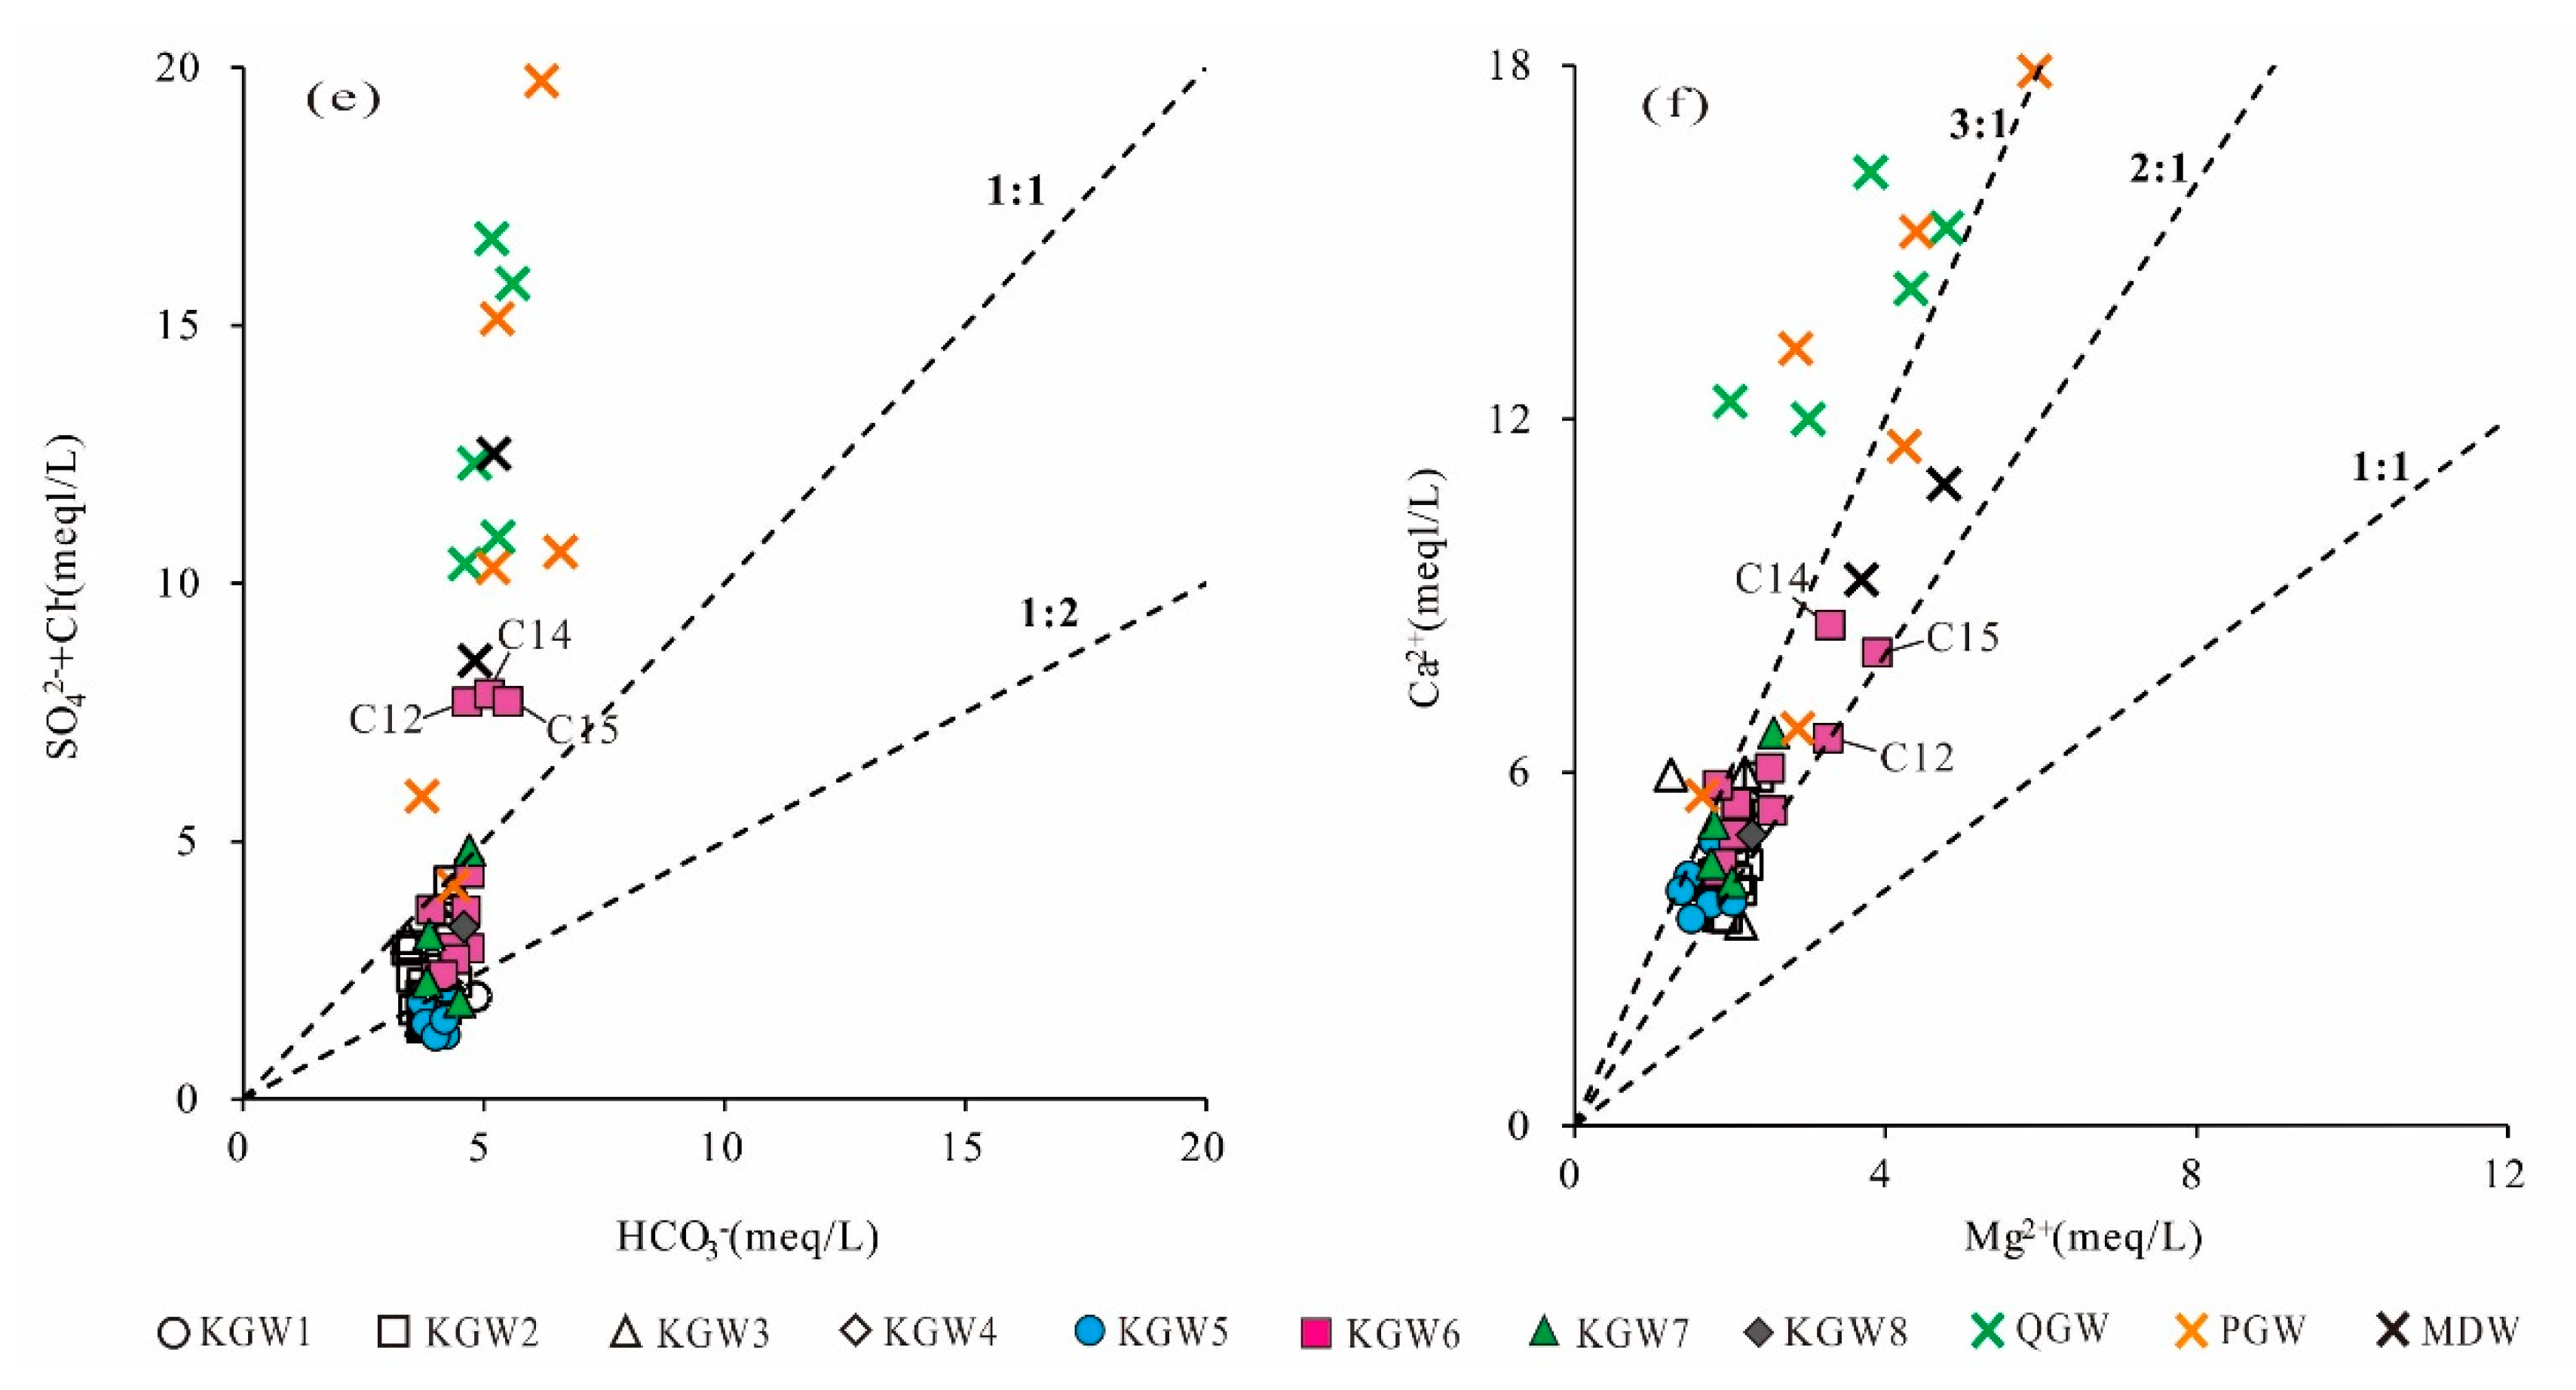
From the relationship between HCO
3− and (Cl
−+SO
42−) (
Figure 6e), it can be seen that most of the PGW, QGW and KGW samples had different influence mechanisms in the area. Specifically, the majority of KGW samples were below the 1:1 line except for three points, indicating that most of the KGW samples were dominated by the dissolution of carbonate rocks. While most of the QGW and PGW samples deviated far from the 1:1 line, the high concentration of Cl
− and SO
42− could be related to agricultural and industrial activities. Excess Cl
− and SO
42− were the evidence of increased pollution. In addition, three KGW samples (C12, C14, C15) from the coal mining runoff area (Zone II
1) were distributed above the 1:1 line and mixed with the QGW and PGW samples, suggesting that the karst groundwater in some runoff areas closely connected with the shallow groundwater and was affected by anthropogenic activities.
The scatter plots of Mg
2+ versus Ca
2+ can be used to infer whether the Mg
2+ and Ca
2+ in groundwater were derived from the dissolution of dolomite, calcite and gypsum. Theoretically, when the ratio of γ(Ca
2+)/γ(Mg
2+) is 1:1, it indicates that dolomite is dissolved in groundwater. When the ratio of γ(Ca
2+)/γ(Mg
2+) is 2:1, it implies that calcite and dolomite are dissolved at the same time in groundwater. If the ratio of γ(Ca
2+)/γ(Mg
2+) is greater than two, there are other sources of Ca
2+ in the groundwater, such as gypsum dissolution, silicate dissolution, reverse cation exchange or external input. As shown in
Figure 6f, almost all the KGW samples were located between the 2:1 and 3:1 lines. The concentration of Ca
2+ in the groundwater ranged from 3.4 to 8.5 meq/L with a mean of 4.8 meq/L. The concentration of Mg
2+ varied from 1.2 to 3.9 meq/L and had an average mean of 2.0 meq/L. It implied that the dissolution of calcite, dolomite and gypsum might occur simultaneously in the carbonate aquifer. In contrast, most of the PGW and QGW samples fell above the 3:1 line. The concentration of Ca
2+ was much greater than that of Mg
2+, which indicated that there might be other factors contributing to excessive Ca
2+, such as the dissolution of silicate minerals.
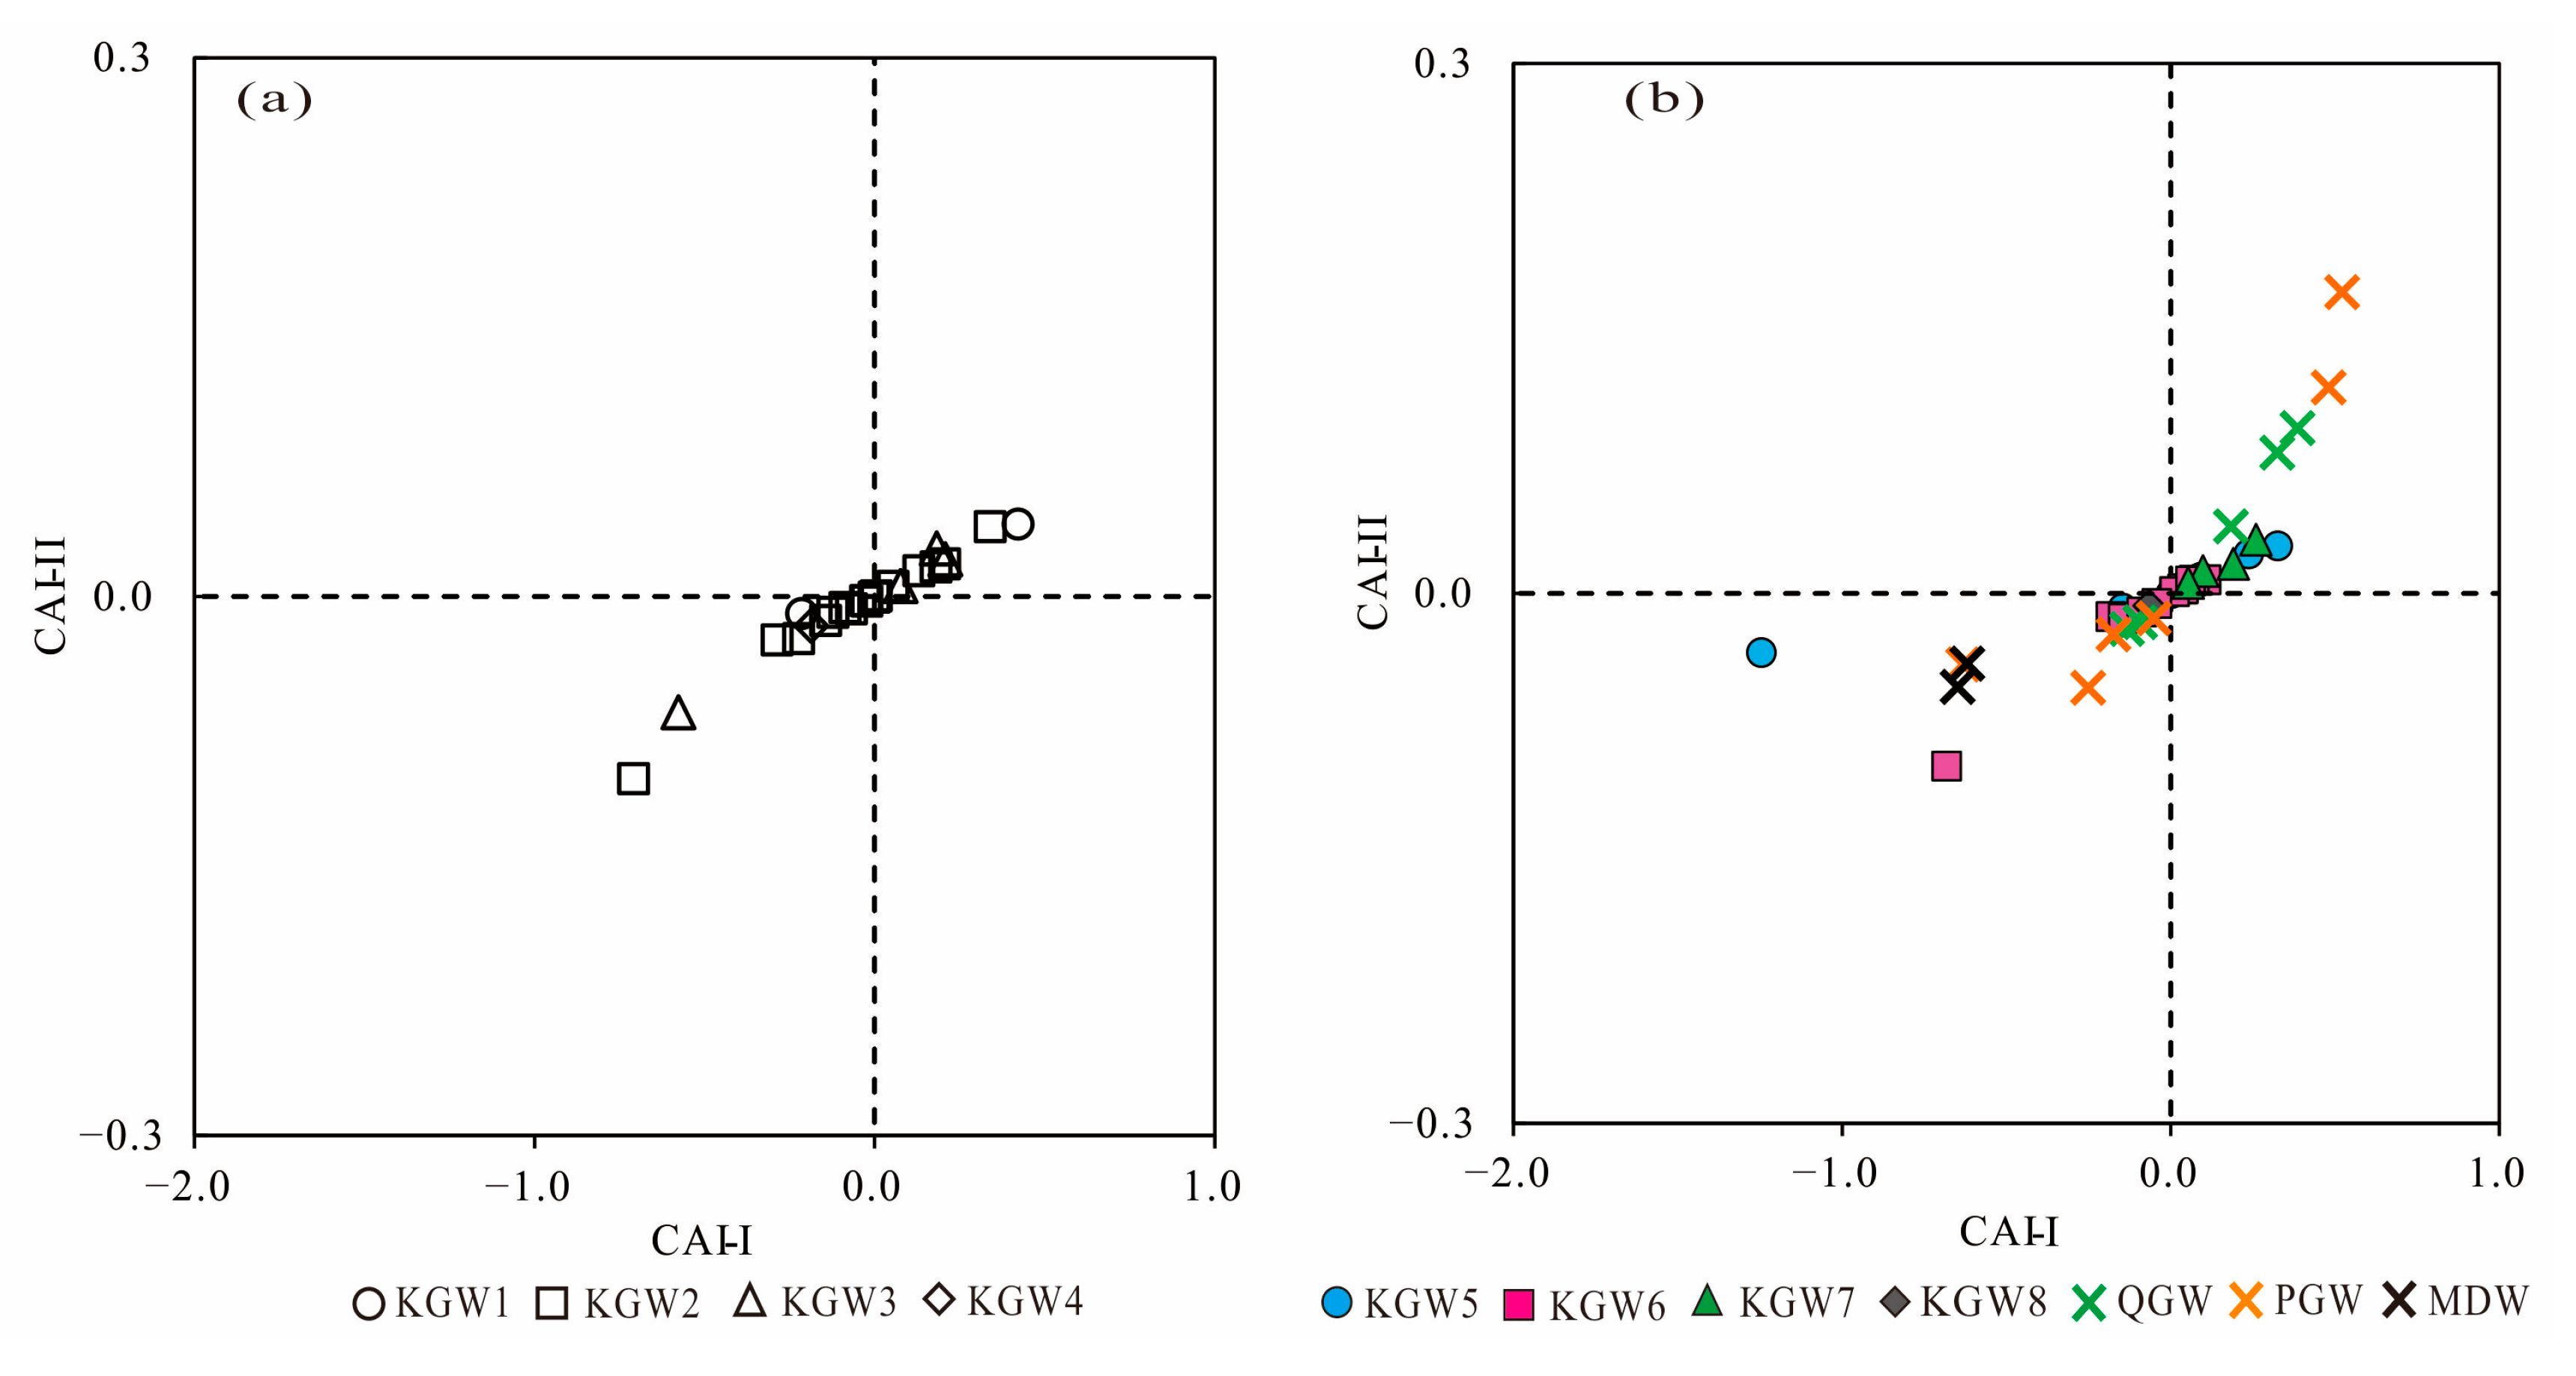
5.5. Ion Exchange Processes
Ion exchange is a natural reaction in the hydrochemical evolution of groundwater, which influences the major chemical composition of groundwater. The Schoeller indices (CAI-I and CAI-II) are vital indicators of the ion exchange occurring in the aquifer [
32,
33]. The CAI (CAI-I and CAI-II) value can be positive or negative; the positive CAI value indicates that the ion exchange takes place between Ca
2+ and Mg
2+ from the rocks with Na
+ of the water, and similarly, the negative CAI value means the Na
+ from the rocks was replaced by Ca
2+ and Mg
2+ in the water. The ion exchange reactions can be expressed by the following equations (Equations (1) and (2)):
Both of the indices (CAI-I and CAI-II) are positive, implying that a reverse ion exchange occurs in the groundwater, whereas the negative values of CAI indicate forward ion exchange in the groundwater.
As shown in
Figure 7a,b, there were both positive and negative ion exchanges of all samples in 2013 and 2019, indicating that the forward and reverse ion exchange simultaneously occurred in different types of groundwater.
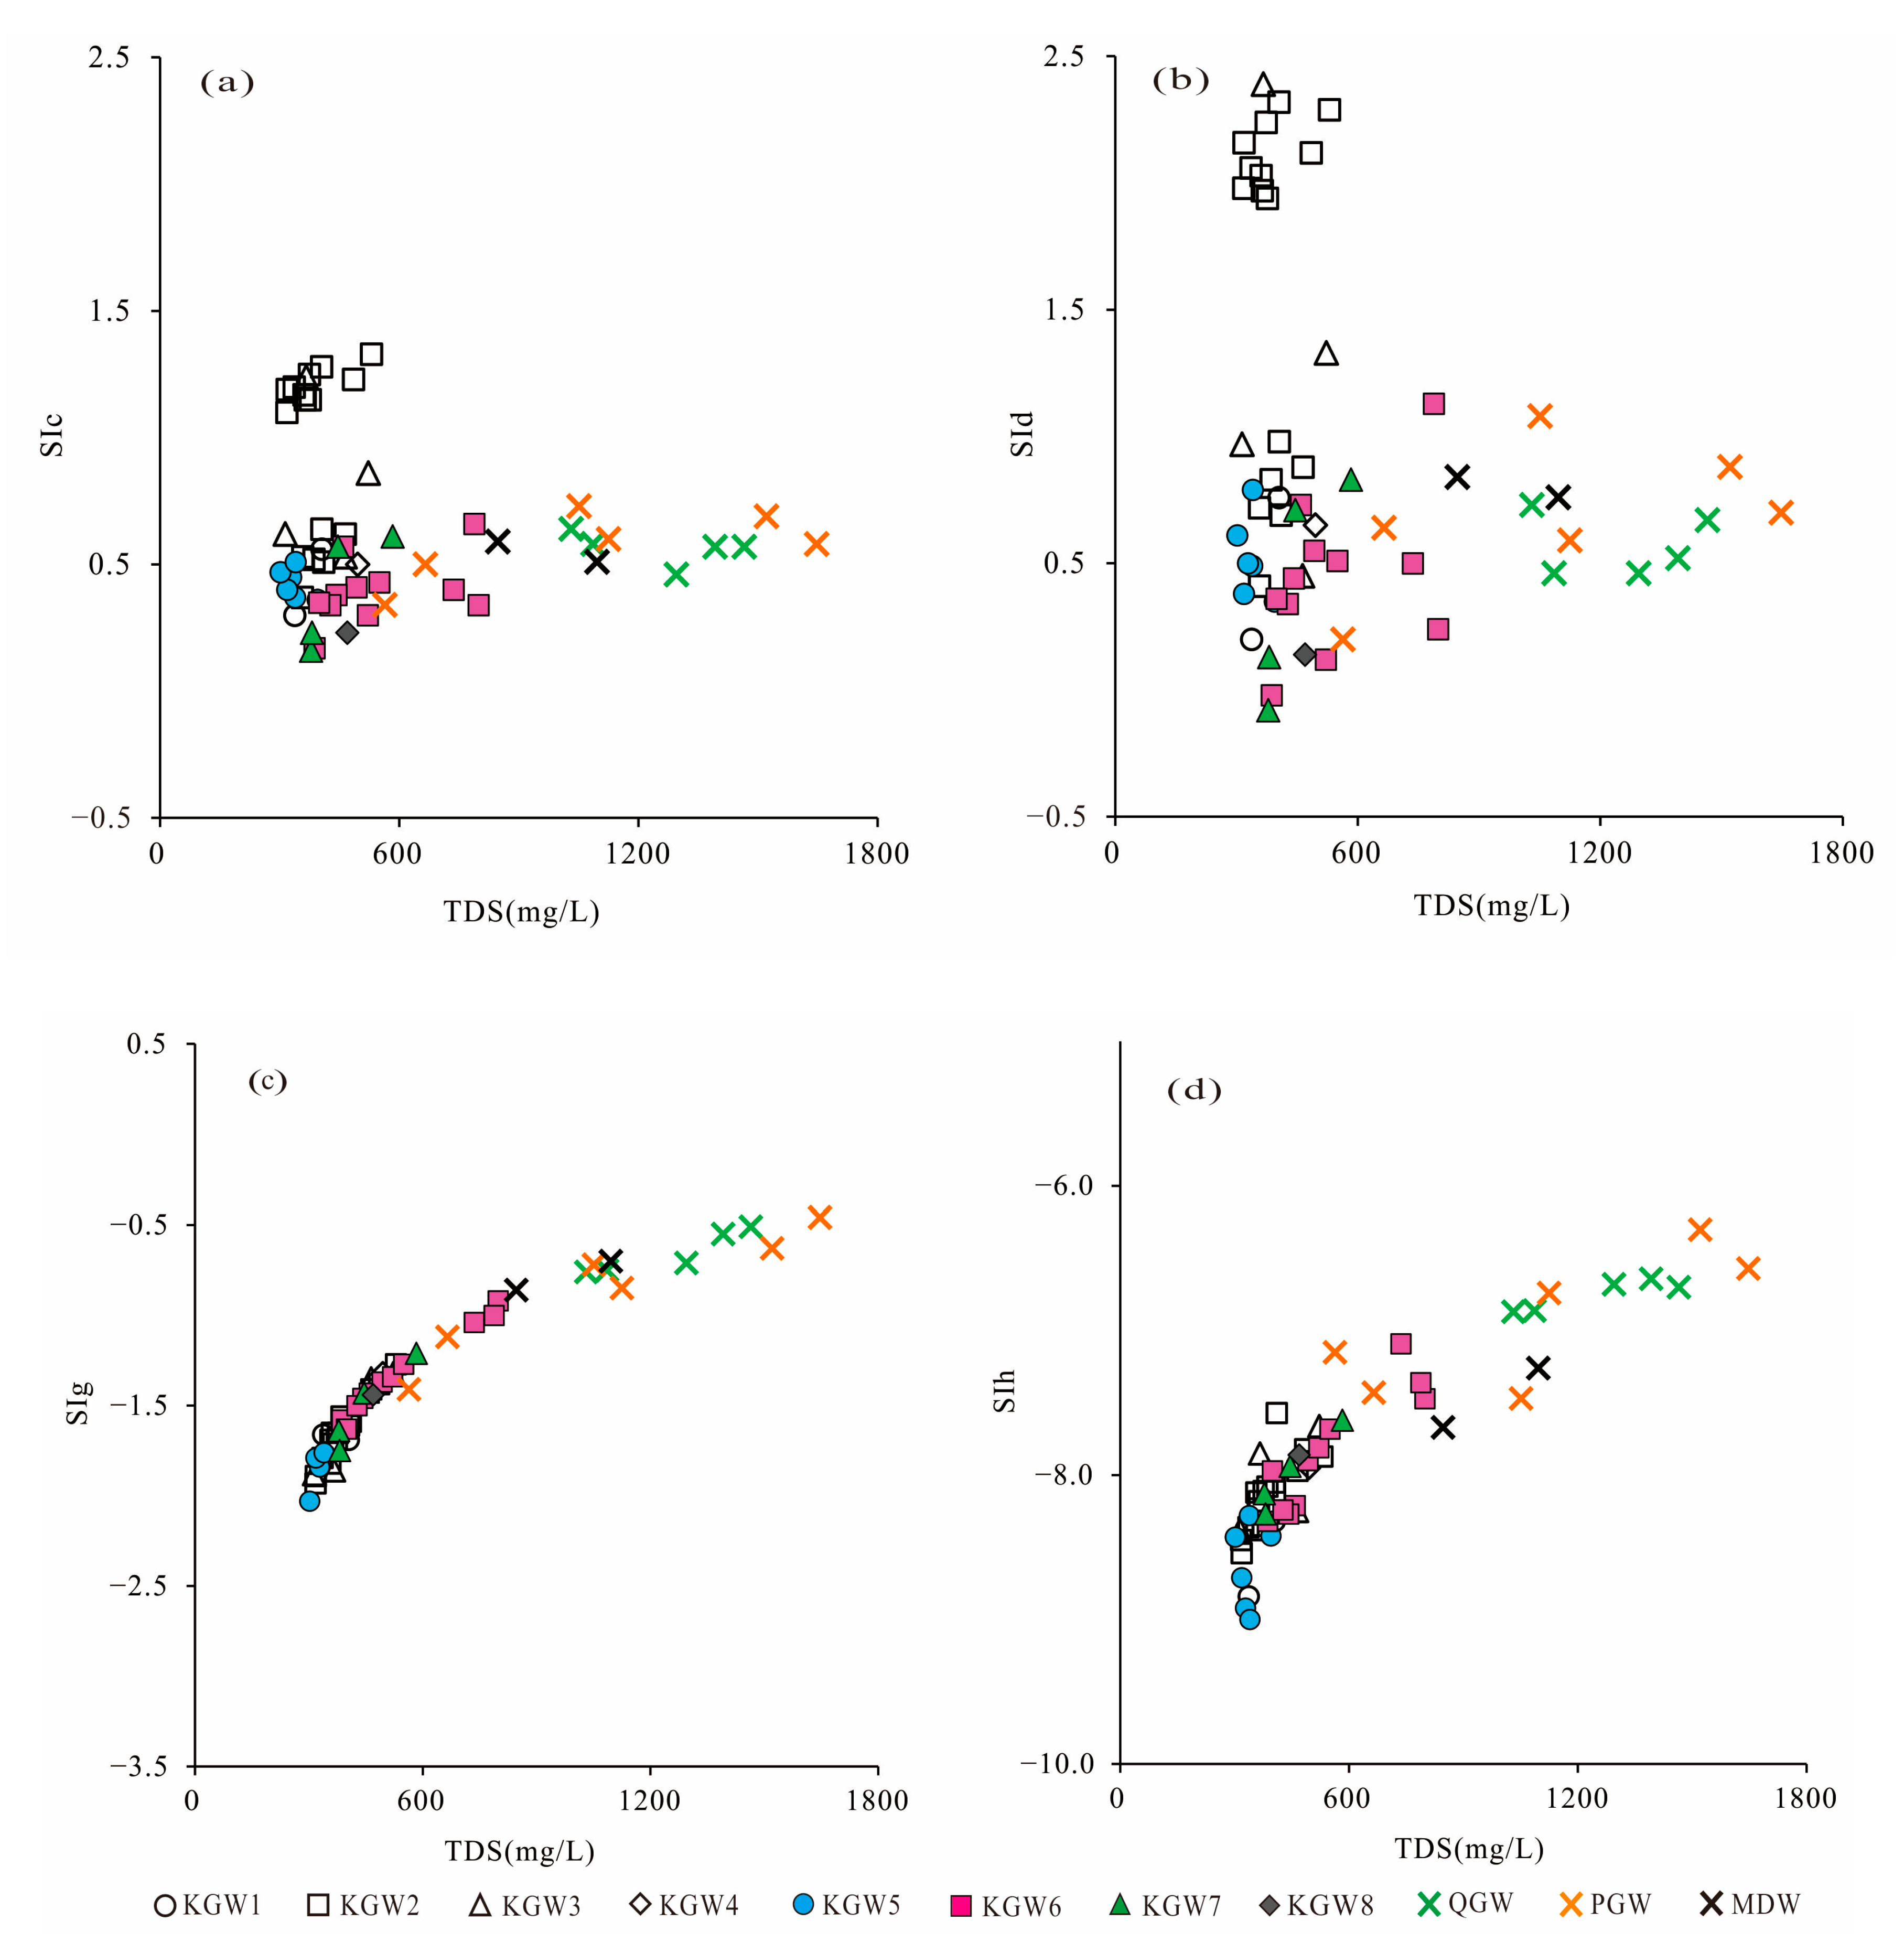
5.6. Saturation Indices
To better understand the equilibrium state between groundwater and minerals, the saturation indices (SI) of calcite, dolomite, gypsum and halite were calculated with PHREEQC [
34,
35]. Generally, the SI value is less than −0.5, between −0.5 and 0.5 or greater than 0.5, which represents that the mineral is in an unsaturated state (dissolution), saturated state (equilibrium) or oversaturated state (precipitation), respectively [
10]. The SI values of calcite and dolomite in the karst groundwater indicated notable differences in 2013 and 2019. As shown in
Figure 8a,b, the SI values of calcite and dolomite in the karst groundwater ranged from 0.30 to 1.33 and 0.20 to 2.39, respectively, with an average of 0.86 and 1.41 in 2013. It suggested that the karst groundwater was oversaturated with respect to calcite and dolomite in 2013, and these carbonate mineral phases might have influenced the chemical composition in the HSB. However, the SI values of calcite and dolomite in the karst groundwater varied from 0.16 to 0.66 and −0.08 to 1.13 with a mean of 0.40 and 0.44, respectively, in 2019, indicating that the karst groundwater was saturated with respect to calcite and dolomite in 2019. Especially in the runoff area where coal mines were distributed (Zone II
1), most of the KGW samples changed from the oversaturated to saturated state during 2013–2019.
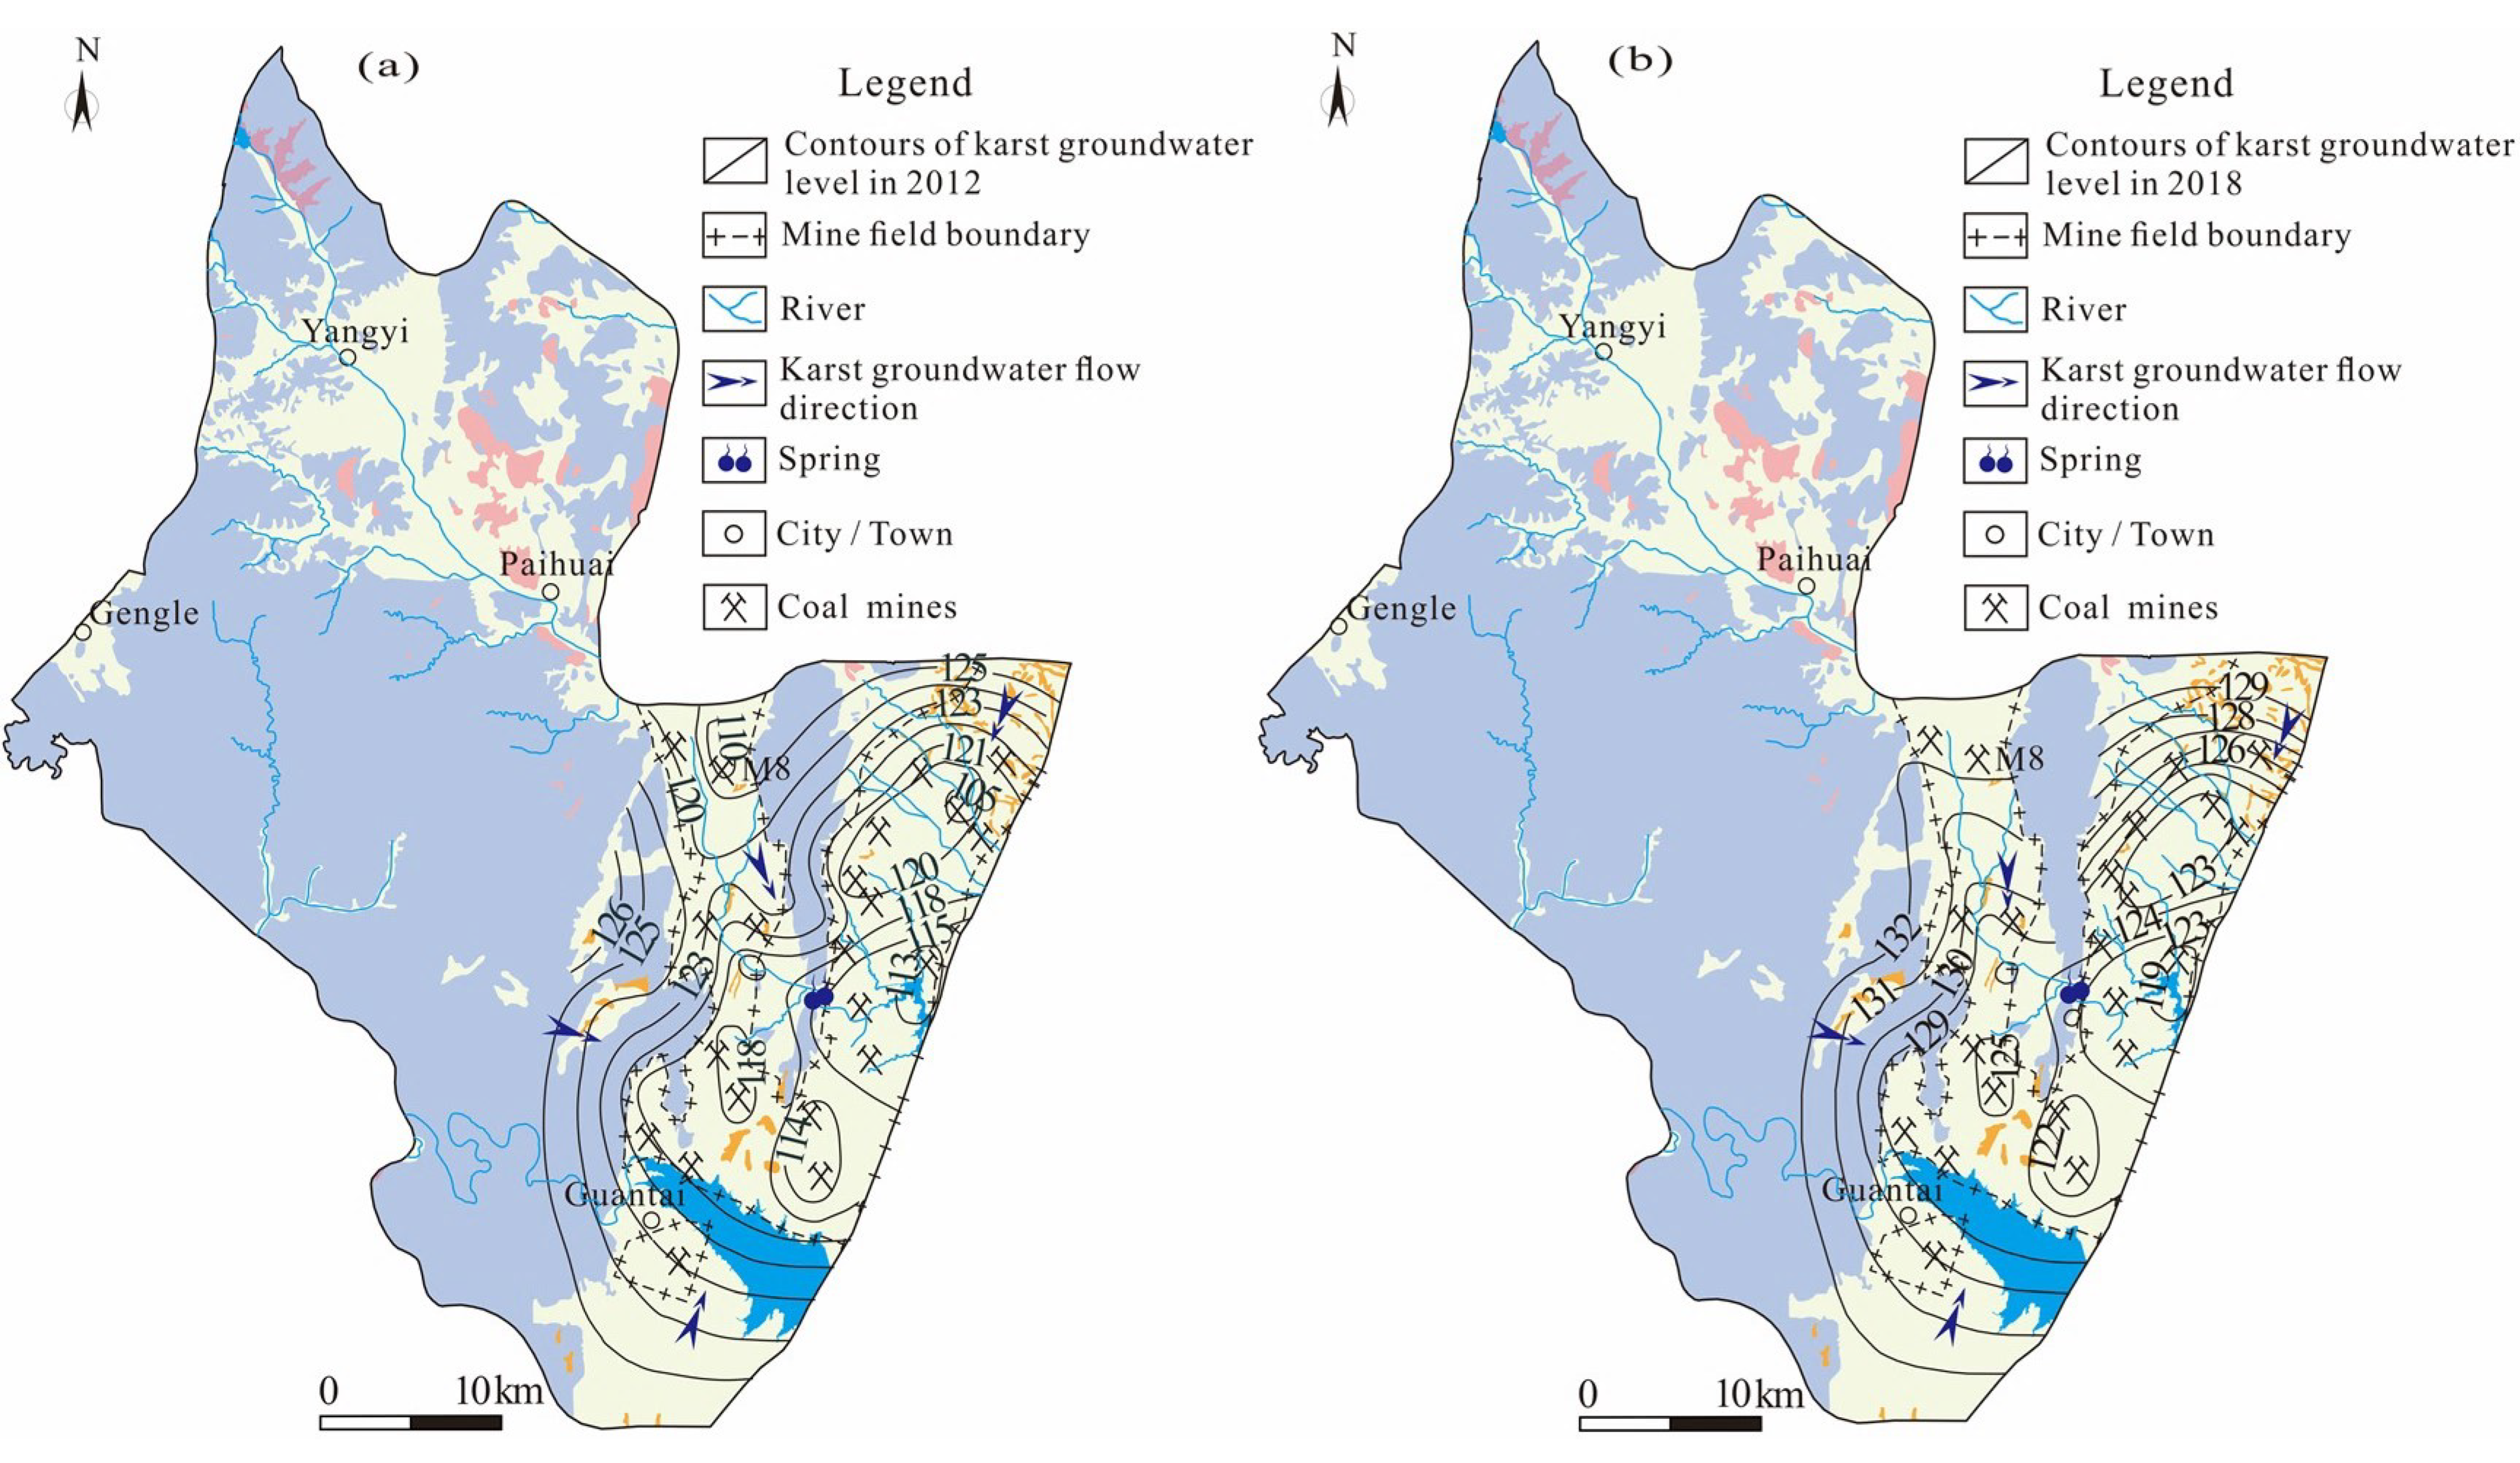
This might have been related to the overall uplift of the karst groundwater level in the study area. Understanding the temporal and spatial variations in groundwater level is an essential prerequisite for groundwater management [
36]. Taking the northern runoff area as an example (
Figure 9), only one coal mine (M8) in the northern runoff area was in production (this coal mine was closed in 2016), and the karst groundwater level was between 118 and 123 m in 2012. In recent years, due to the increase in rainfall and the decrease in exploitation, the karst groundwater level in the northern runoff area rose to 124~132 m, with the overall groundwater level rising by 6~8 m and even 15 m in some areas in 2018 [
37]. Consequently, the overall groundwater level was relatively low, and the flow was very slowly affected by natural and human factors in 2012–2013, as calcite and dolomite minerals were in an oversaturated state. However, the calcite and dolomite minerals gradually transited to a saturated state with the groundwater level rising during the period of 2018–2019. As time goes on, if the groundwater level continues to rise, the groundwater and minerals will be expected to reach a new equilibrium state again.
The SI values of gypsum and halite in the karst groundwater in 2013 and 2019 are shown in
Figure 8c and
Figure 8d, respectively. The SI values of gypsum and halite in the karst groundwater ranged from −1.93 to −1.27 and −8.84 to −7.57, respectively, with an average of −1.62 and −8.15 in 2013, respectively, indicating that gypsum and halite minerals were in a dissolved state in 2013. In contrast, the SI values of gypsum and halite in the karst groundwater varied from −2.03 to −0.92 and −9.00 to −7.09 with a mean of −1.49 and −8.09 in 2019, respectively. Compared with 2013, the SI values of gypsum and halite had little change in 2019. In addition, the SI values of gypsum and halite showed an increasing tendency along the TDS, which indicated that the increase in TDS concentration in the karst groundwater might be related to the dissolution of gypsum and halite, whereas there were no significant correlations between the TDS and SI values of calcite and dolomite, which indicated that the dissolution of calcite and dolomite was a very rapid process. Considering the carbonate rocks were widely distributed in the aquifer of the entire region, the dissolution of carbonate rocks had most likely been completed rapidly in the initial stage of the chemical evolution in the karst groundwater. Therefore, it can be considered that carbonate rock dissolution was an important source of HCO
3−, Ca
2+ and Mg
2+ in karst groundwater, which was consistent with the above conclusion.
Furthermore, the SI values of calcite, dolomite, gypsum and halite had little difference in different aquifers. However, the TDS concentrations from Quaternary sediment and most Permian sandstone aquifers were obviously higher than those in carbonate aquifers. It showed that there was a close hydraulic connection between Quaternary sediment groundwater and most Permian sandstone groundwater, which was likely affected by human activities.
5.7. Analyses of the Sources of SO42− in Groundwater
As previously discussed, the concentration of SO42− showed a significant change, especially in the runoff areas impacted by mining activities during 2013–2019. Therefore, it is necessary to identify the source of SO42− in the study area.
In general, the main sources of SO
42− in groundwater include atmospheric precipitation, sulfate mineral dissolution (gypsum, etc.) and sulfide minerals oxidation such as pyrite [
20]. The δ
34S value of SO
42− from atmosphere precipitation is generally around −3~+9‰; the δ
34S content from evaporite and limestone can reach above +20‰, even up to +35‰ from gypsum, and the δ
34S composition of SO
42− from the oxidation of sulfides varies from-30‰ to +5‰ [
20,
38].
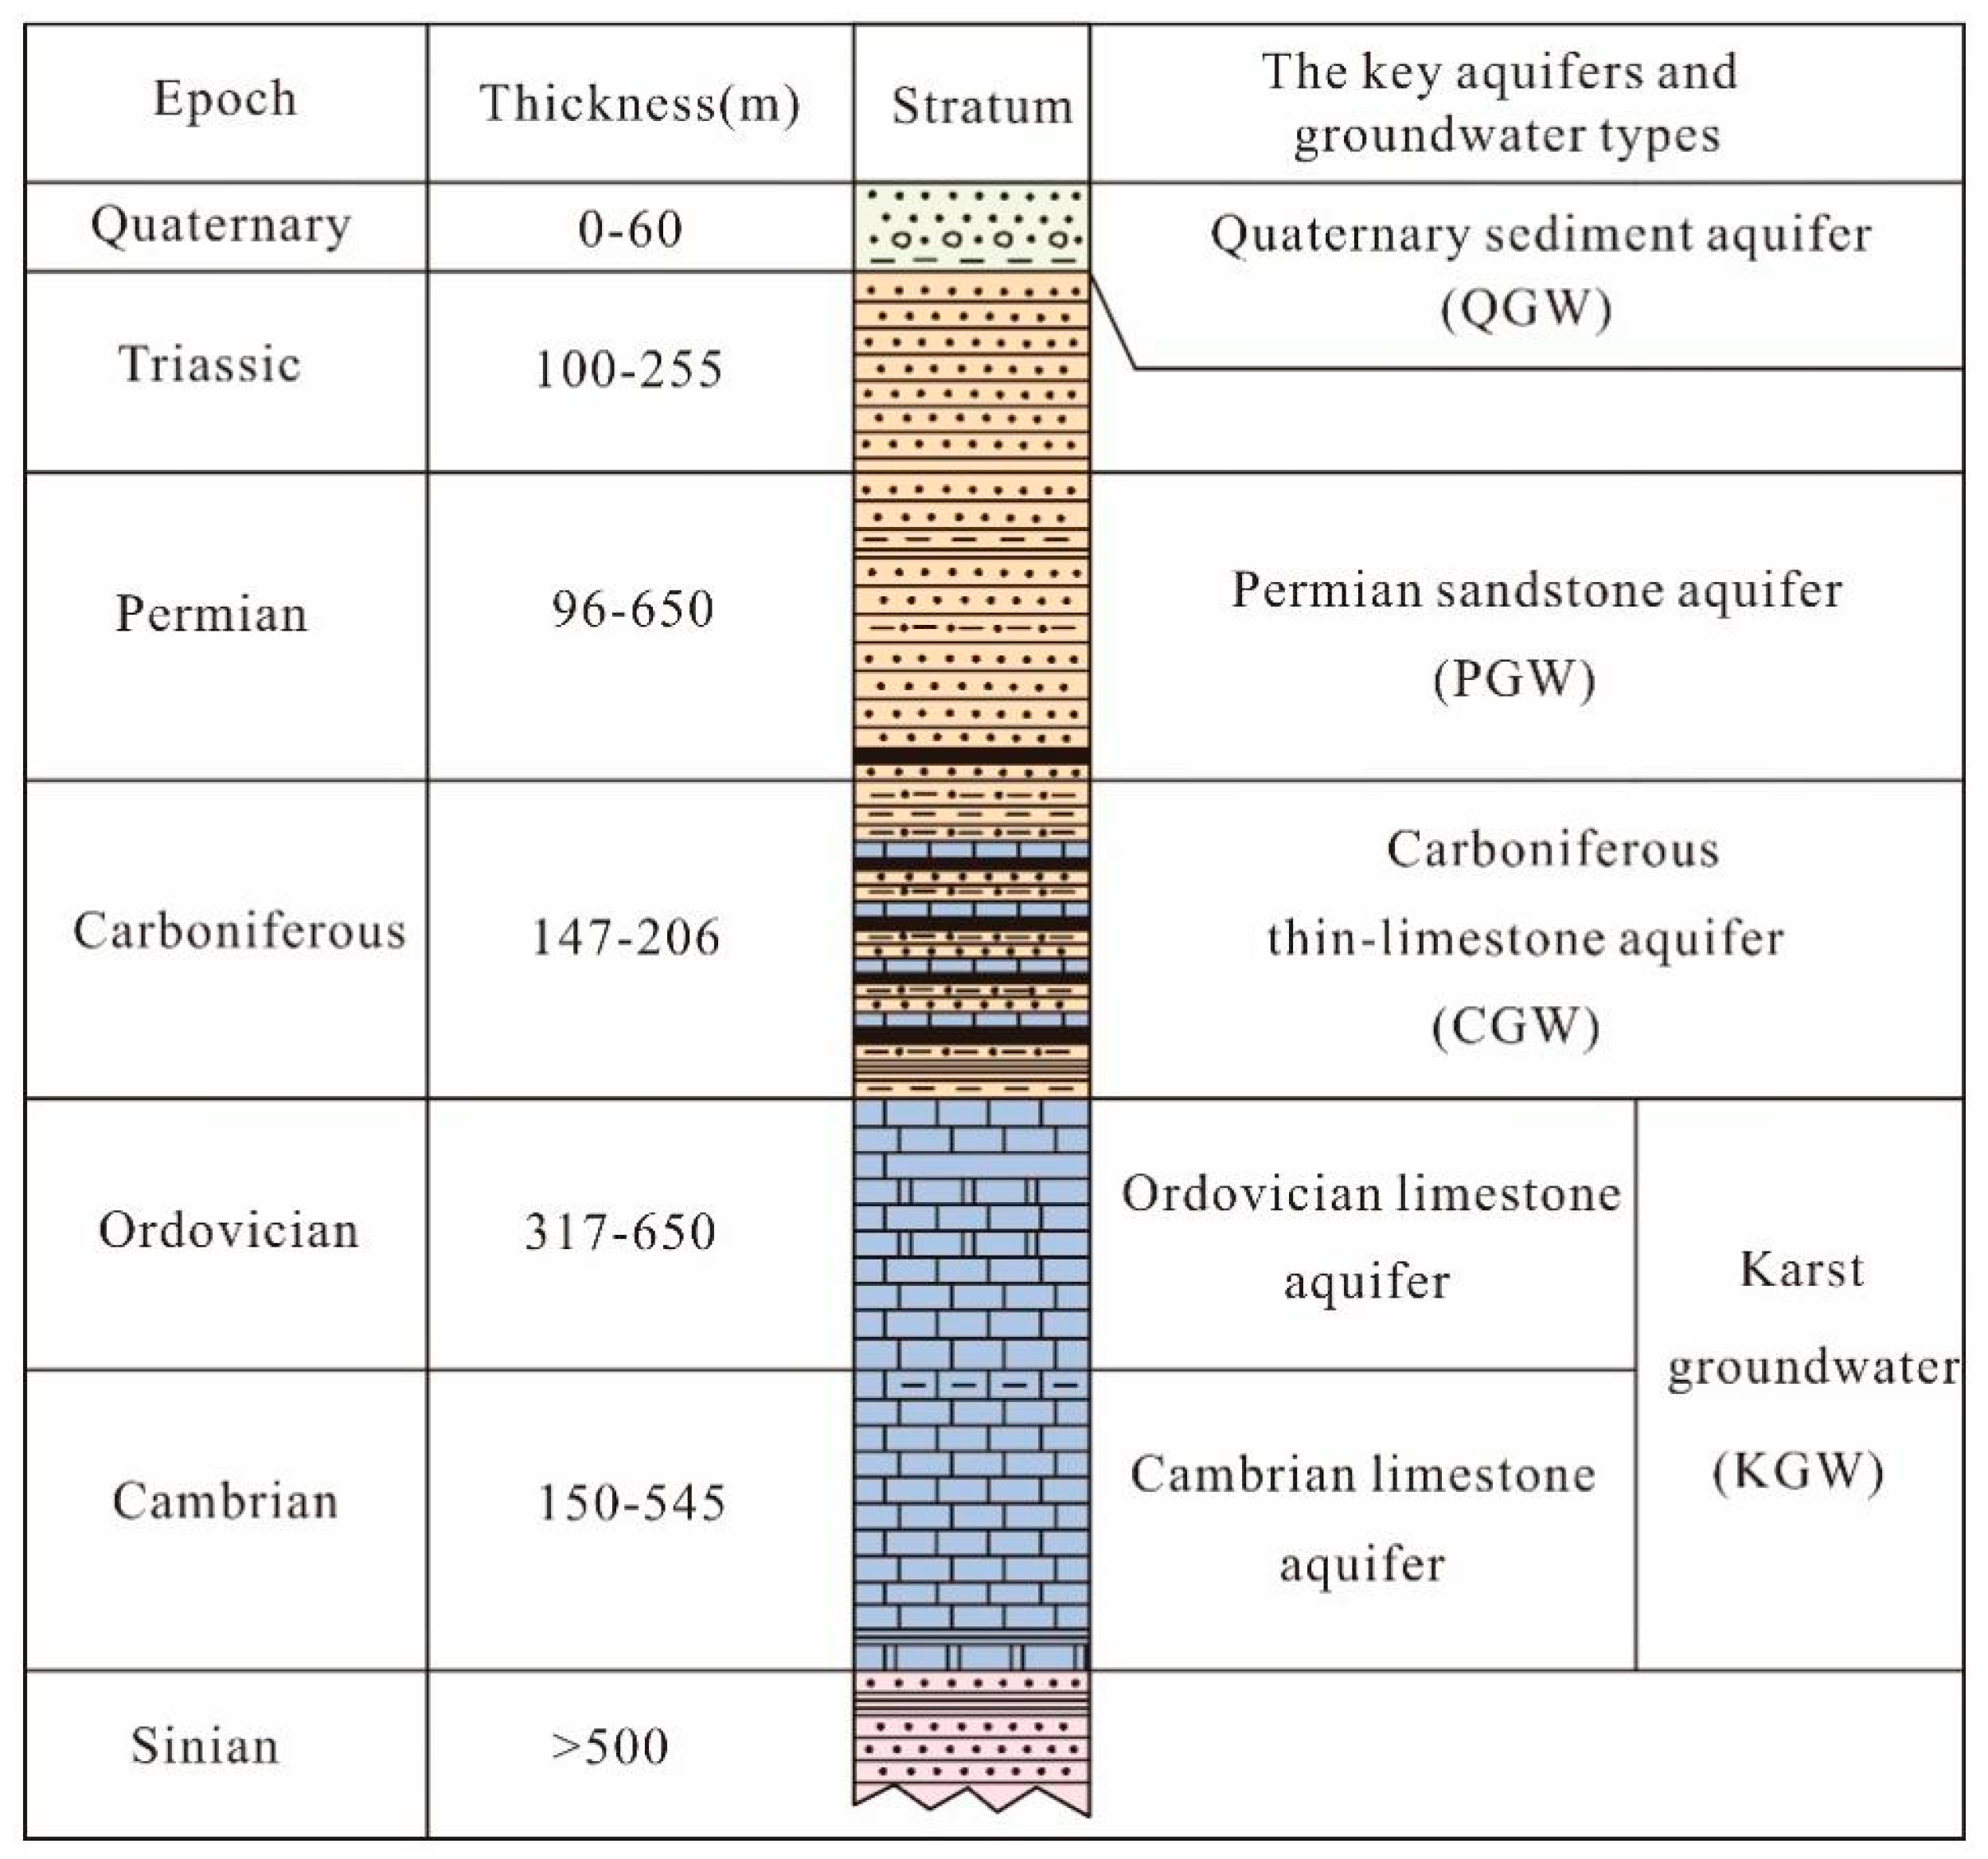
It can be seen from
Table 5 that the concentrations of SO
42− in the groundwater from the Carboniferous thin-layer limestone aquifer were the highest in the study area followed by the Permian sandstone groundwater, and SO
42− concentrations in the karst groundwater from the Cambrian and Ordovician aquifers were the lowest. This was likely related to the dissolution of sulfate minerals in different aquifers. The Carboniferous Taiyuan Formation is one of the main coal-bearing strata in Northern China, and the pyrite content in the coal is relatively high. Therefore, the concentrations of SO
42− in the groundwater from Carboniferous strata were proportionally high.
According to
Figure 10a, the δ
34S values gradually increased with the decrease in the SO
42−/Cl
− ratios. The samples from the Carboniferous thin-layer limestone groundwater (CGW) had relatively high SO
42−/Cl
− ratios and low δ
34 values, distributing around the end member of sulfide oxidation (pyrite, etc.) (
Figure 10b), which implied that the major sources of SO
42− and the S-isotopic composition were derived from mineral dissolution. While the δ
34S values of the other water samples were close to the end member of precipitation, the concentrations of SO
42− were much higher than those of precipitation, indicating that the sulfate in the groundwater was probably derived from the combination of gypsum dissolution and sulfide mineral oxidation by meteoric water. These reactions were as follows (Equations (3) and (4)):
There are several relatively impermeable layers among the Permian sandstone, Carboniferous thin-layer limestone and the Cambrian–Ordovician karst aquifer, and they are relatively independent of each other under natural conditions. However, anthropogenic activities such as coal mining and groundwater pumping lead to the hydraulic connection among different aquifers.
As shown in
Figure 10b, some samples (E5, E6, D2) from the Permian sandstone groundwater and Cambrian–Ordovician karst groundwater in the runoff areas (Zone II) fell on the mixing line between gypsum dissolution and sulfide oxidation, which lay close to the samples of Carboniferous thin-layer limestone groundwater. The results further showed that there was a certain hydraulic connection between the karst groundwater and other types of groundwater in some parts of the study area.
5.8. Anthropogenic Factors Affecting the Groundwater Quality
The concentration of NO
3− ion in groundwater does not exceed 20 mg/L under natural conditions [
39]. A total of 56.9% of the groundwater samples exceeded this threshold, indicating that the groundwater was influenced by anthropogenic inputs in the area. Anthropogenic activities such as domestic sewage, manure and agricultural fertilization have been proven to be the main sources of NO
3− in groundwater. In addition, domestic sewage infiltration into groundwater often occurs in urbanized areas [
40]. As shown in
Table 4, the concentration of NO
3− had a good correlation with Na
+, Ca
2+, Cl
− and SO
42−, and showed the best correlation with Cl
− (r = 0.773,
p = 0.01), indicating that NO
3− and these ions might have had the same anthropogenic origin. In addition to the dissolution of halite, excessive Cl
− was generally related to agricultural activities and domestic pollution.
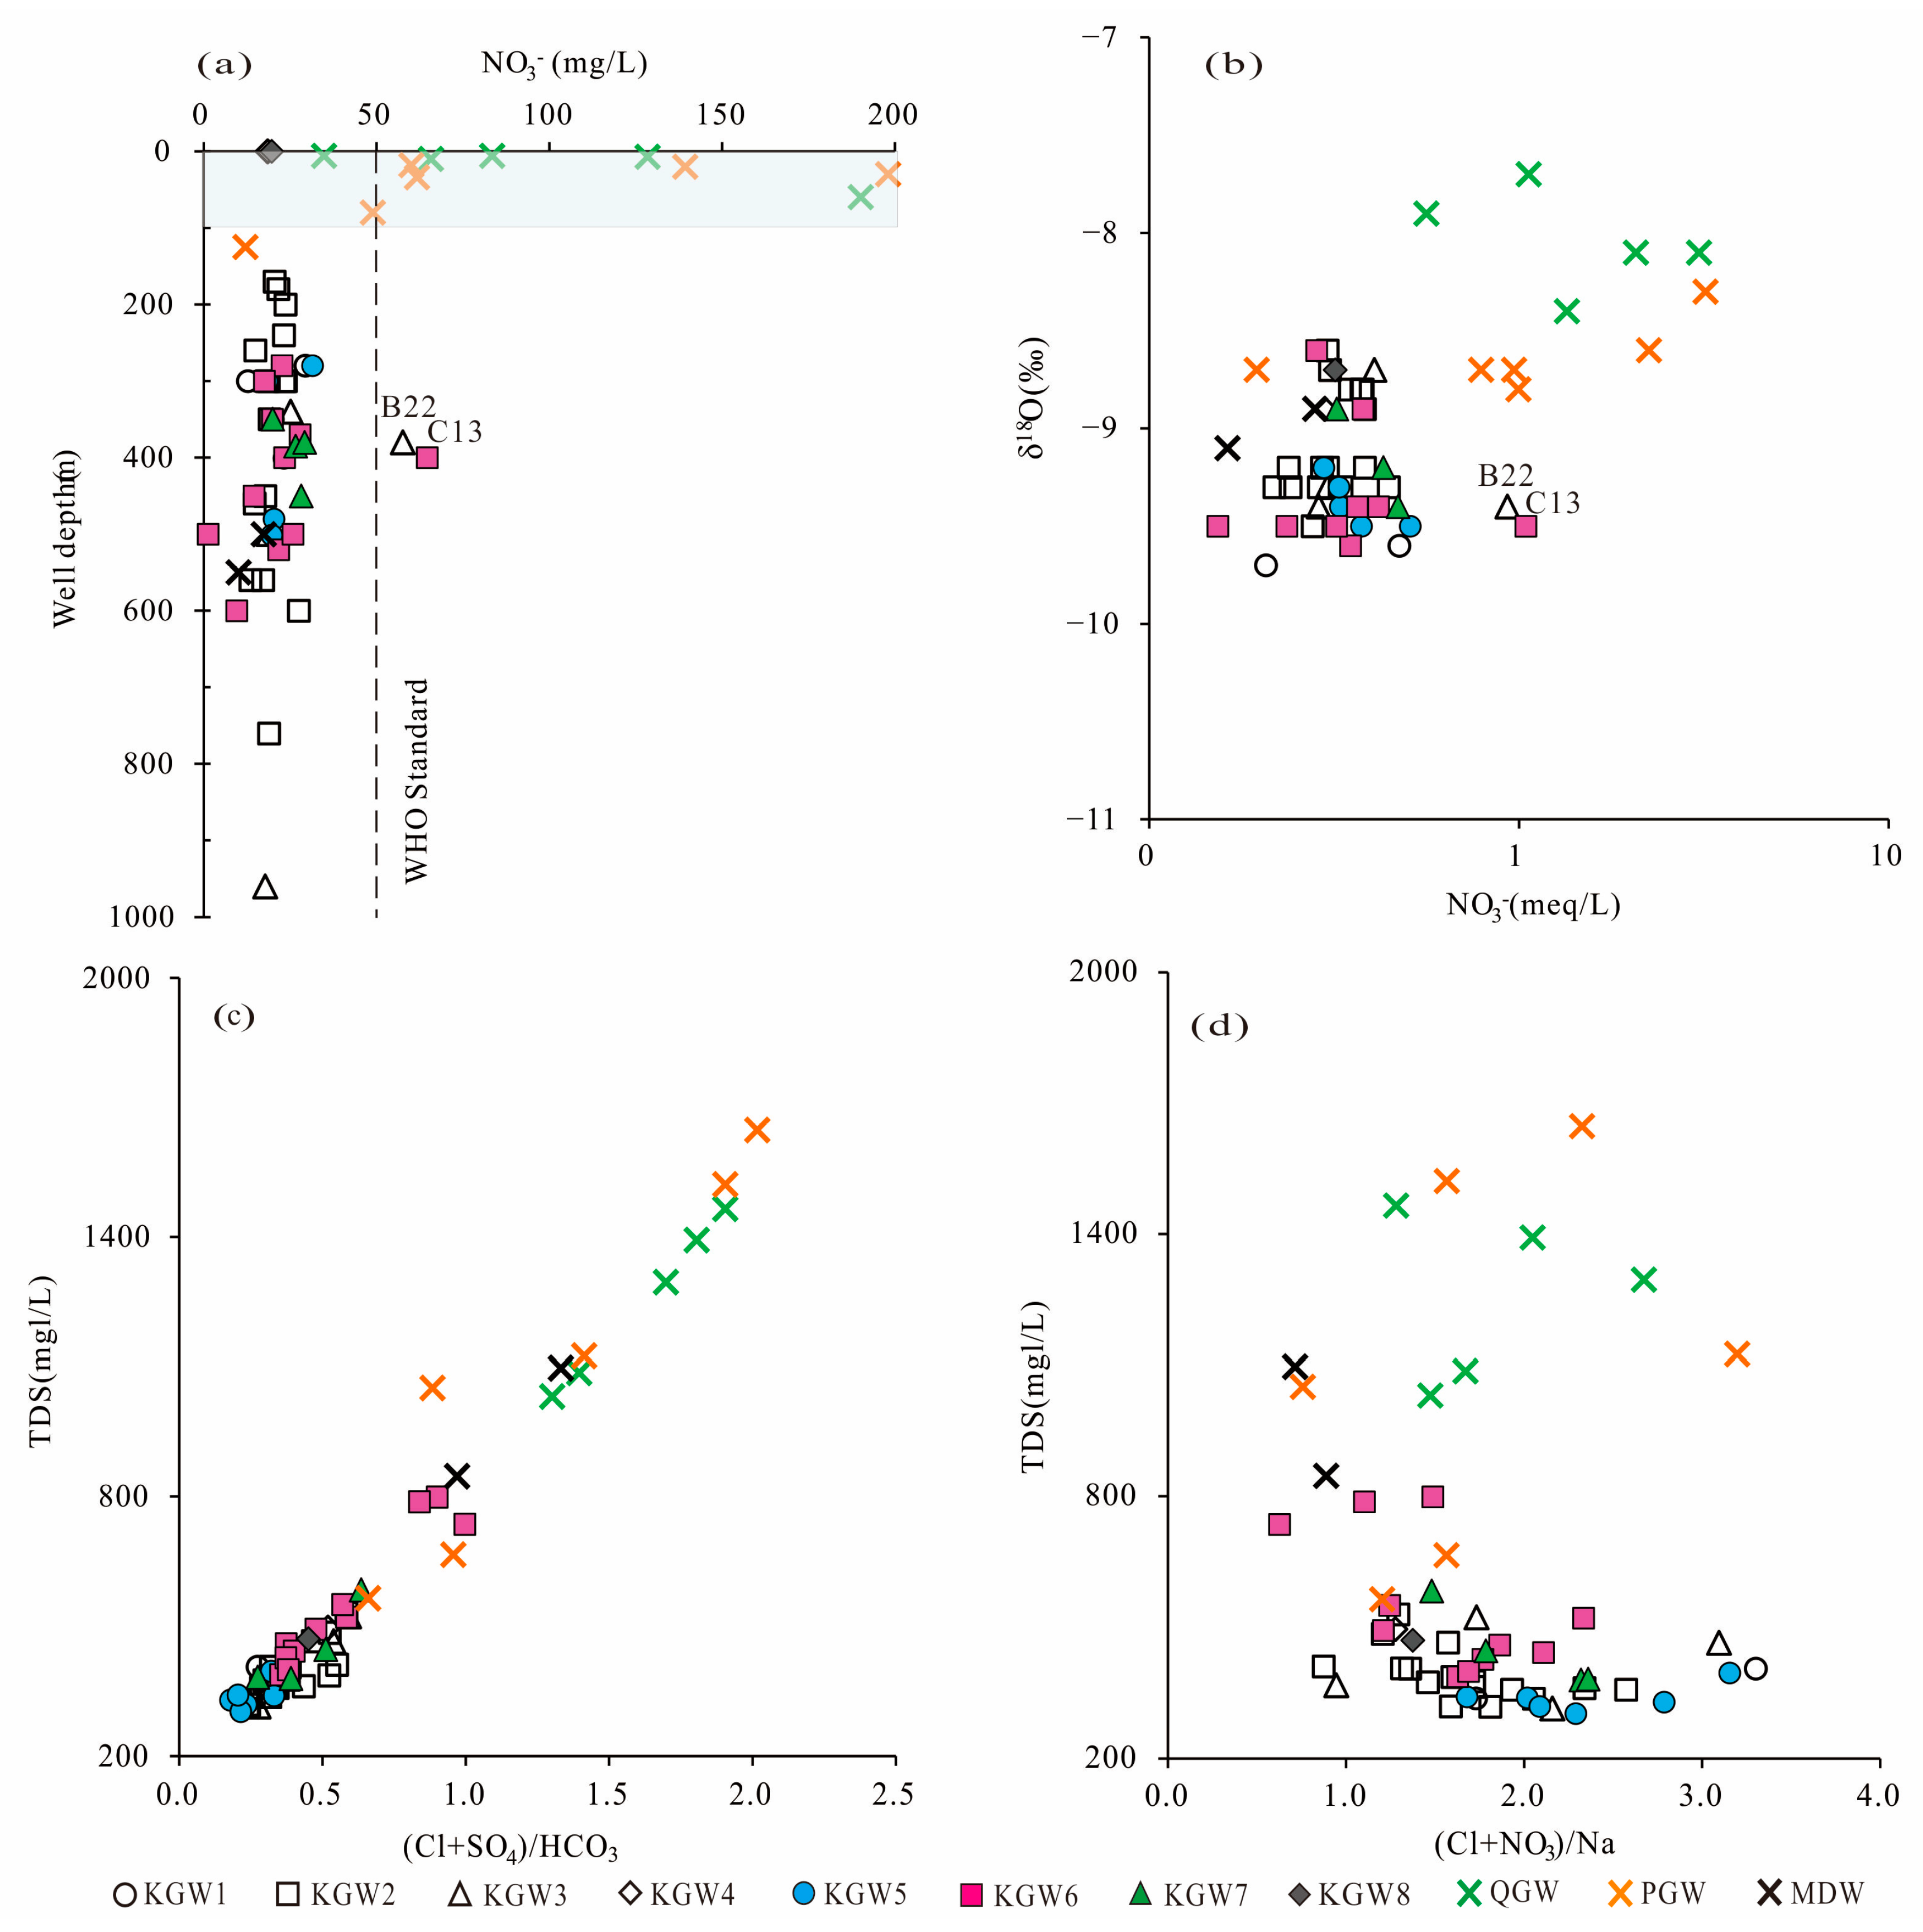
The variation trend of NO
3− concentrations in groundwater with well depth is shown in
Figure 11a. A total of 80% of the samples from the Quaternary sediment aquifer and 66.7% of the samples from the Permian sandstone aquifer exceeded 50 mg/L, which is the permissible limit for drinking water set by the World Health Organization (WHO) [
41]. The results showed that 95.6% of the samples of karst groundwater were within this threshold. In addition, the groundwater samples with NO
3− exceeding the standard were mainly distributed at the depth of 0~100 m below the surface, and the maximum concentration was up to 198 mg/L. It showed that shallow groundwater was more affected by anthropogenic activities than deep groundwater.
Theoretically, shallow groundwater is greatly affected by evaporation due to its shallow groundwater table. As shown in
Figure 11b, compared to the karst groundwater, the shallow Quaternary sediment groundwater and most of the Permian sandstone groundwater were more enriched in heavy isotopes. In addition, the NO
3− concentrations were significantly higher in several deep karst groundwater samples (B22, C13) in the runoff area, indicating that some karst groundwater was affected by nitrate pollution due to coal mining, agricultural activities and other factors.
Generally, the TDS values of all the groundwater samples increased with the increasing (Cl
− + SO
42−)/HCO
3− (expressed in molar ratios) (
Figure 11c). Similarly, the TDS values of the groundwater samples in the Quaternary sediments aquifer and most Permian sandstone aquifer increased with the increasing of (NO
3− + Cl
−)/Na
+ molar ratio, whereas there were no significant correlations between the TDS values and (NO
3− + Cl
−)/Na
+ in the karst groundwater (
Figure 11d).
The results showed that the contribution from evaporite dissolution to the karst groundwater exceeded that from anthropogenic influence, while the Quaternary sediment groundwater and most of the Permian sandstone groundwater were affected by agricultural activities and domestic sewage. These were consistent with the fact that the NO3− concentrations in the shallow groundwater generally exceeded the WHO standard.


 ,
, 


