
Capillary Imbibition in Layered Sandstone


1
College of Architecture and Civil Engineering, Xi’an University of Science and Technology, Xi’an 710054, China
2
College of Geology and Environment, Xi’an University of Science and Technology, Xi’an 710054, China
3
State Key Laboratory of Road Engineering Safety and Health in Cold and High-Altitude Regions, CCCC First Highway Consultants Co., Ltd., Xi’an 710065, China
*
Author to whom correspondence should be addressed.
Water 2023, 15(4), 737; https://doi.org/10.3390/w15040737
Submission received: 15 January 2023
/
Revised: 7 February 2023
/
Accepted: 10 February 2023
/
Published: 13 February 2023
(This article belongs to the Special Issue Landslides and Sediment Disasters Prevention)
Abstract
:Spontaneous capillary imbibition in rocks is fundamental to numerous geomorphological processes and has caused numerous engineering problems. Sedimentary rocks are widely distributed across the Earth’s surface and usually bear layer structures that make the pore structure anisotropic. Understanding the effects of the anisotropic pore structure on capillary imbibition in sedimentary rocks is crucially important but remains inadequate, especially on larger scales than a single tube. In this study, the capillary imbibition process in sandstone was monitored by measuring the water absorption mass, height of the water absorption front, NMR (nuclear magnetic resonance) T2 spectra, and stratified moisture distribution. The results demonstrate that (1) the layer structure had a significant effect on the capillary imbibition process by altering water absorption rate and water redistribution mode, as the time of the water front reaching the top of Sample A1 lagged behind Sample A2 by 500 min; (2) vapor diffusion and condensation occurred ahead of the water-absorption front, which was more obvious in samples with well-developed beddings; (3) in sandstone samples with bedding planes perpendicular to the height (Per samples), internal water migration lagged behind superficial water migration and was longer in sandstones with well-developed beddings, such as the case of Sample A2, for which the time lag was as large as 280min. Based on a combination of observations of the sandstone structure at pore scale and layer scale with results calculated from the Lucas–Washburn equation, we propose the concept of the representative pore-structure element (RPE). Based on analysis on water migration in RPEs, we suggest that the effects of the layer structure on capillary imbibition in sandstone are embedded in the different water migration modes in Par (samples with bedding planes parallel to the height) and Per samples. The water migration mode in Par samples can be simplified as primary upward intra-layer migration followed by intra-layer horizontal migration, while that in Per samples is primary intra-layer horizontal migration followed by intra-layer upward migration.
1. Introduction
Spontaneous capillary imbibition in porous materials (e.g., rock, soil, concrete) occurs widely in nature and engineering. It is a key influence on several geomorphological processes, such as the wet–dry weathering of rocks [1,2,3,4,5,6,7,8,9] and the formation of vadose zones [10,11,12,13,14,15], and also induces many geological engineering problems, such as the deterioration of building materials [16,17,18] and the weathering of cultural relics [19,20,21,22,23,24,25,26]. Sedimentary rocks are a typical porous material that is widely distributed across the Earth’s surface. They are often used as building materials and are major material sources of weathering. The pore system in sedimentary rocks is primarily featured by the layer structure, which may cause anisotropy in the capillary imbibition process.
There has been plentiful research on capillary water migration in rocks, mainly focusing on the effects of liquid properties (salt content, viscosity, pH, et al.) [27,28,29], pore structure (size, shape, connectivity) [30,31,32,33,34,35], and environmental conditions (temperature, humidity) [36,37,38] on the capillary imbibition process. The influence of pore structure on capillary imbibition is particularly important and has received much research attention. The Young–Laplace equation explains the source of capillary suction; i.e., the surface tension causes the liquid surface to bend, thus creating a pressure difference that allows the liquid to rise [39]. Bell and Cameron [40] found the proportional relationship between water migration height and square root of time. Based on the Young–Laplace and Hagen–Poiseuille equations, Lucas [41] and Washburn [42] proposed the Lucas–Washburn (LW) equation, which describes the capillary water migration process while considering the influence of the capillary radius. The LW equation assumes that the section of a capillary tube is uniform and circular, which is different from the actual situation, generating disagreements between the predicted results and the experimental ones. Therefore, many scholars have sought to improve the LW equation by considering the geometrical features of capillary pores [43,44,45,46,47,48]. These features include changes in the cross-sectional area [49,50,51], branching and intersection of pores [52], and tortuosity [53,54]. Some scholars introduced the fractal theory to describe the tortuousness of capillaries [55,56]. As an alternative, Lundblad and Bergman (1997) [57] proposed that the complex effects of geometrical features of capillaries can be equalized by employing an effective radius, so that the capillary imbibition equation stays as simple as the LW law.
These studies deepen the understanding of capillary imbibition process; however, these classic models provide primarily one-dimensional (1D) solutions, which ignores the effect of capillary interactions in pore networks. Recently, more attention has been paid to water migration in two- or three-dimensional (2D or 3D) capillary networks [58]. Among them, one of the most fundamental studies was on the capillary competition phenomenon of a Y-shaped bifurcation [59]. Despite these attempts, capillary imbibition in rocks with anisotropic pore network can still not be predicted perfectly. Anisotropy is an inherent attribute of the pore structure in layered rocks and is characterized by the significant difference in pore radius and connectivity along the bedding and perpendicular to the bedding, as well as between adjacent layers [60,61]. Therefore, capillary imbibition in layered rocks should be studied at a scale larger than one single tube or one Y-shaped bifurcation. Still, research on the capillary imbibition in layered rocks at larger scales is inadequate, and the way that the layer structure modifies capillary water migration remains uncertain.
In addition, the capillary imbibition in rock pores should be related to water vapor adsorption and condensation as well, whose effects are commonly neglected. The movement of water vapor is mainly affected by the relative humidity of the environment (under constant-temperature conditions) [62,63]. At low relative humidities, water molecules are bound to the particle surface in the form of adsorption film [64,65]. Along with increases in relative humidity, water-vapor adsorption approaches its maximum value gradually; afterwards, a free-water layer appears. Capillary condensation occurs via liquid bridges when the thickness of adsorption water film reaches a critical value. In our experiment, the vapor adsorption and condensation during water migration was verified by analyzing the bound water content through the T2 spectrum.
Apart from theoretical investigations on capillary imbibition in porous rocks, experimental studies promote understanding of this phenomenon as well. Among them, weighing and visual observation methods were initially adopted to clarify the migration process and moisture distribution in porous rocks, as they are intuitive and convenient. However, absorption water mass or rising height of the absorption front cannot accurately reflect the water migration process inside samples, and especially cannot measure the migration process of water vapor. Therefore, some technologies such as electrical resistivity tomography (ERT) [66], nuclear magnetic resonance imaging (MRI) [67], X-ray computerized tomography CT [68], and infrared thermography (IRT) are employed to monitor the capillary imbibition process. Some of the above methods, for instance, MRI [69,70,71] and X-ray CT, measure variation of moisture distribution along the imbibition direction directly, while others adopt parameters such as resistivity (ERT) and infrared rays (IRT), which are sensitive to moisture content, to demonstrate moisture movement indirectly [72,73,74]. Nuclear magnetic resonance technology has great advantages in such experiments, since it not only quickly obtains the water distribution in rock without damaging it, but also accurately characterizes the rock’s pore structure. In this study, two types of sandstone samples with different layer orientations were used in capillary imbibition experiments. During the experiments, the water migration process was carefully observed by measuring water absorption mass, height of the absorption front, lightness of the sample tops, nuclear magnetic resonance T2 spectra, and the stratified moisture distribution. The typical pore structure of layered sandstone was obtained through multi-scale observation of the pore structure with MRI and cast thin sections. Based on the results, the concept of the representative pore-structure element (RPE) is proposed. Combined with some basic theories of capillary water movement, effects of layer structure on the moisture migration process were interpreted at the sample scale and pore structure scale.
2. Methodology
2.1. Sample Preparation
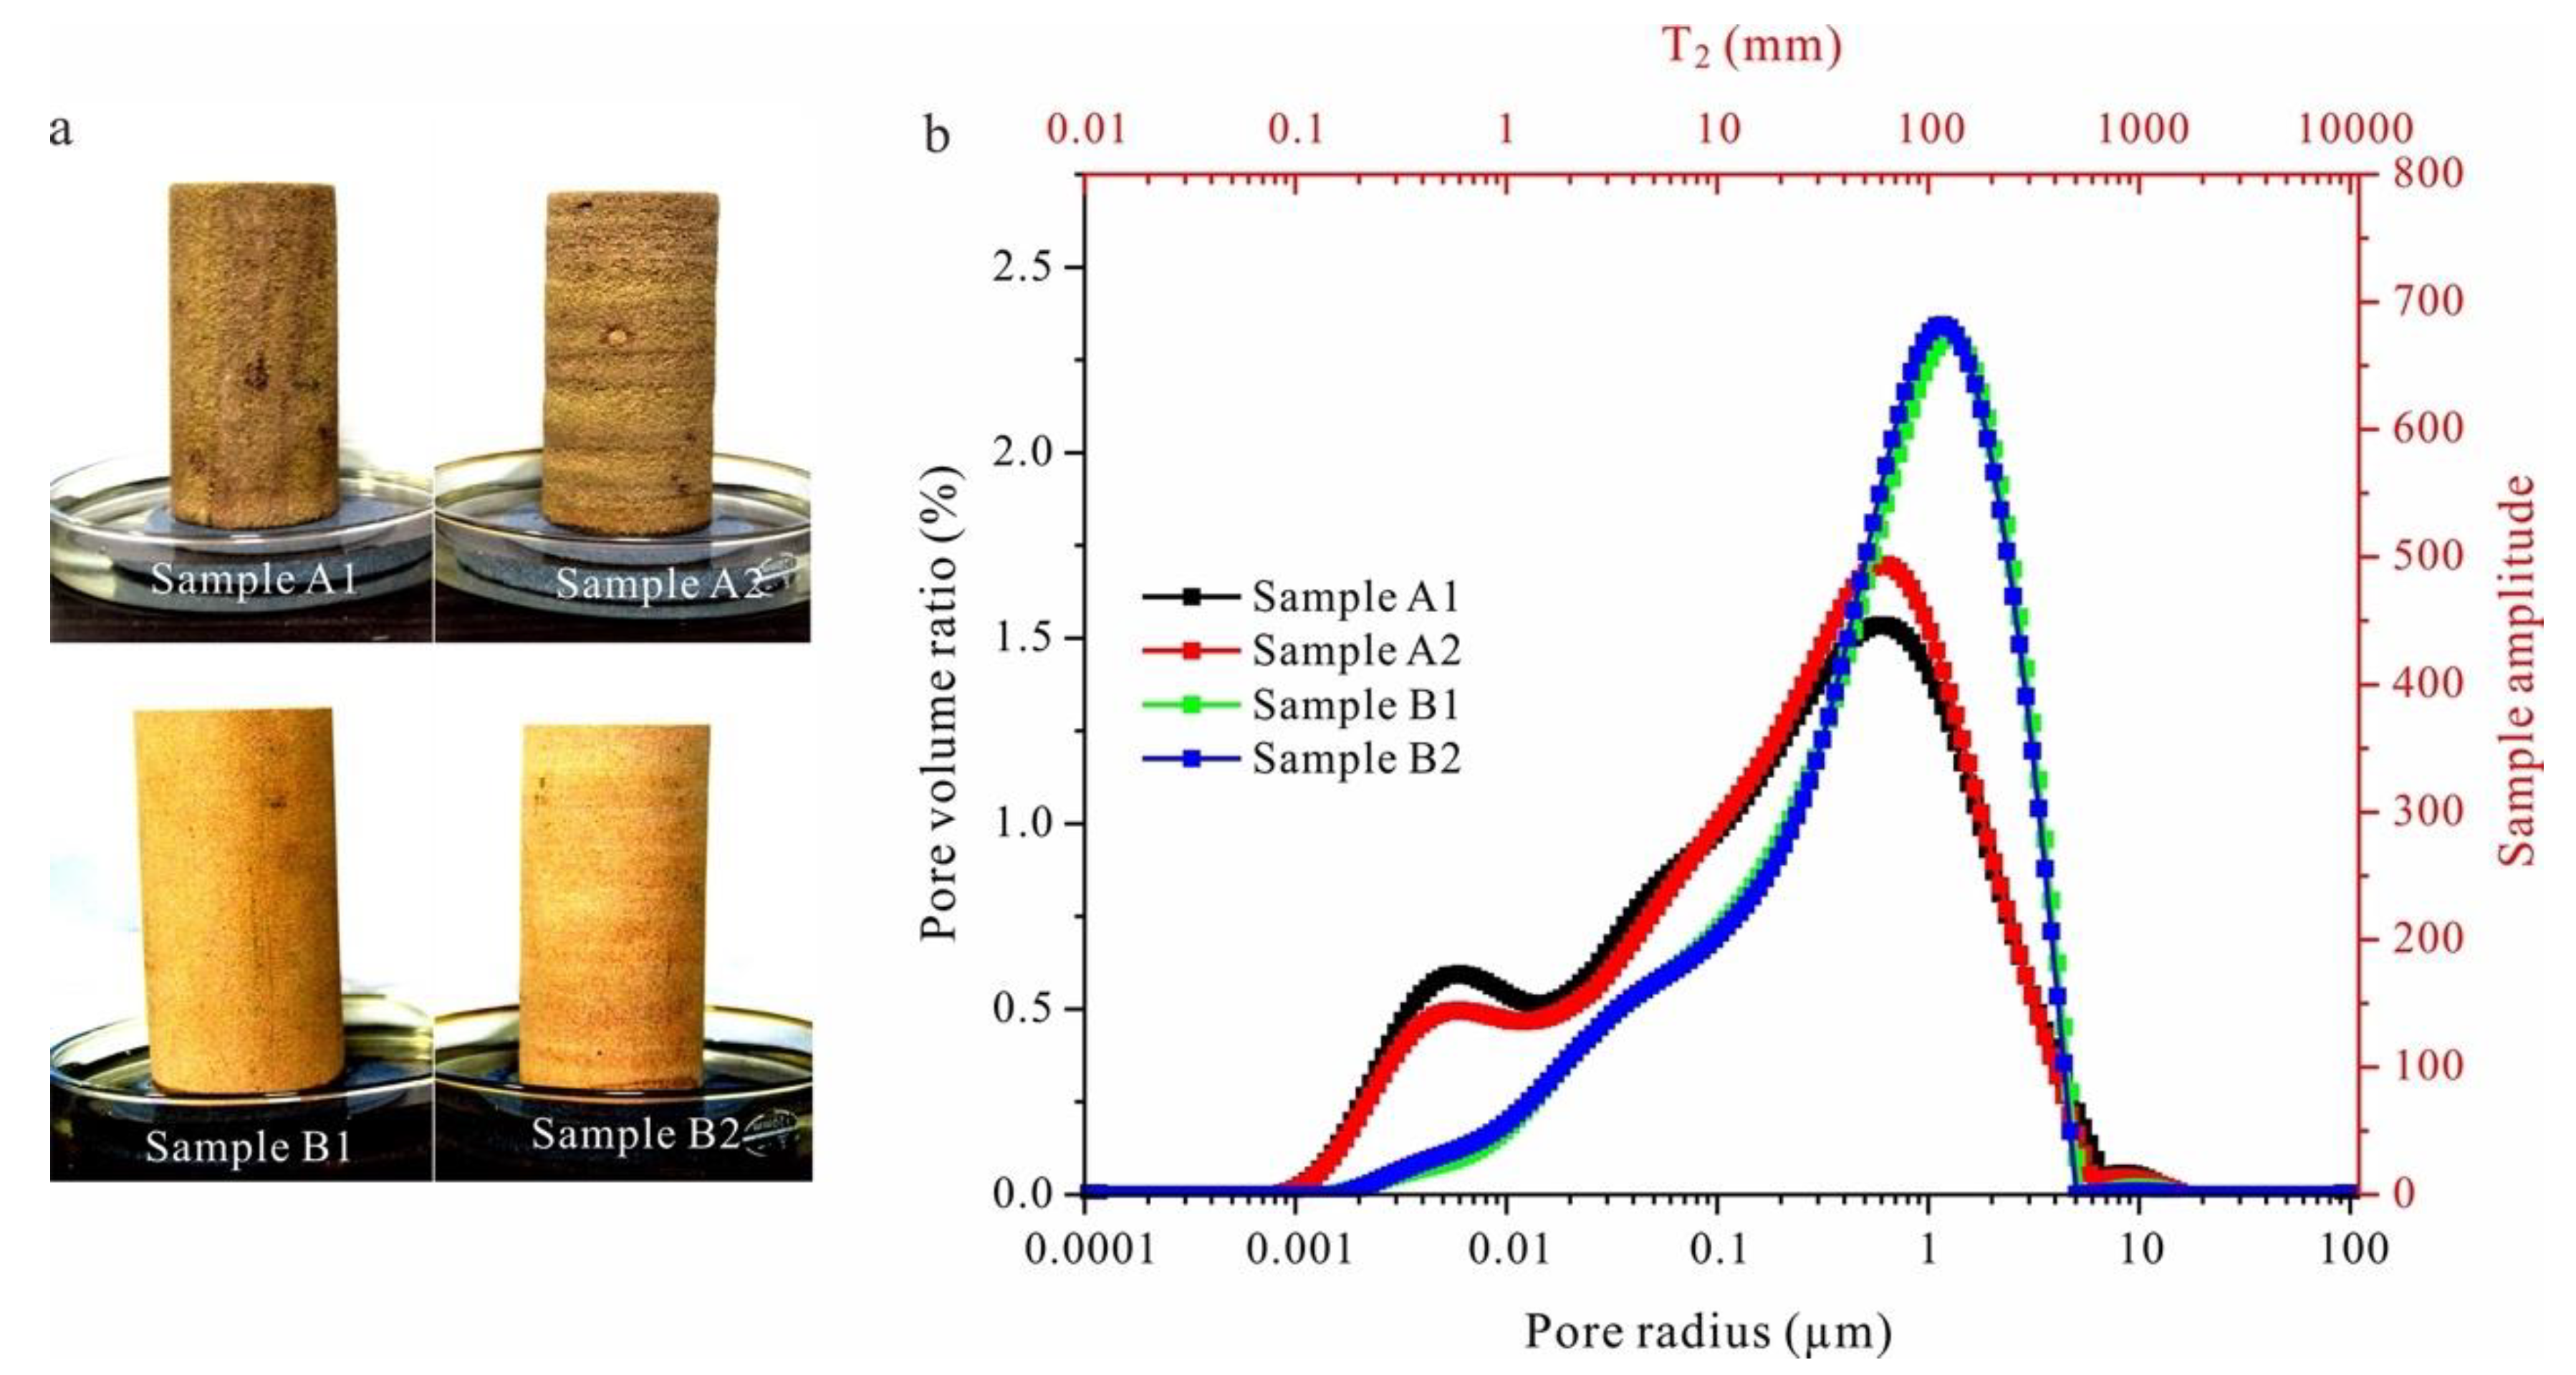
Four sandstone samples were selected for the test, as shown in Figure 1a [75]. Cylindrical samples with a diameter of 50 mm were drilled from two sandstone blocks both perpendicular and parallel to the bedding plane. After that, the cylindrical cores were cut into standard samples with a height of 100 mm. The top and bottom surface of the samples were polished to be smooth. Samples A1 and A2 were taken from the same coarse-grained sandstone, which had well-developed bedding with alternating coarse-grained strata and fine-grained strata. The mineral composition of Sample A1 and A2, derived from XRD experimental results, are shown in Table 1. After the samples were saturated in a vacuum chamber, we could obtain their porosity, and the pore size distribution curves (Figure 1b) could be calculated from the NMR T2 distributions (Figure 1b); the principle is introduced in Section 2.2. The porosity of Sample A1 was 16.97%; while the porosity of Sample A2 was 18.60%. Samples B1 and B2 were taken from the same fine-grained sandstone, which had obvious bedding as well but with no great differences in grain size between the adjacent strata. Mineral composition of Sample B1 and B2 derived from XRD experimental results are shown in Table 2. The porosity of Sample B1 was 14.93%, and the porosity of Sample B2 was 14.59%. Sample A1 and B1 were sandstones with bedding planes parallel to the axis of the cylindrical core (hereinafter marked by Par samples), while Sample A2 and B2 were sandstones with bedding planes perpendicular to the axis of the cylindrical core (hereinafter marked by Per samples). Pore size distribution curves of the four samples are shown in Figure 1b (the principle is introduced in Section 2.2).
2.2. Background Theory of Nuclear Magnetic Resonance (NMR)
- (1)
- Measurement of pore size distribution
Generally, we study the moisture changes of rock and soil by measuring their relaxation time, T2, which can reflect the water content of samples [76,77]. In capillary tubes of different radii, the T2 of water is different. Therefore, the pore size distribution of rock can be calculated according to T2 spectra [78], which is related to the average pore size as follows:
where is a geometric factor ( = 3 for spherical pores and 2 for columnar pores; hence, = 2 in this study); is the surface relativity of pore walls and is strongly influenced by paramagnetic ions or electrons on the solid surface; and is the average radius. According to Equation (1), there is a one-to-one correspondence between T2 and pore size.
- (2)
- Measurement of stratified moisture distribution
Like the basic phenomena of T2 spectra, stratified moisture content can be reflected by the signal value. On the basis of the static magnetic field B0, a gradient magnetic field Gy is superimposed along the axis of the cylindrical core of the sample. Assume that the magnetic field strength of cross section A, which is along the sample’s axis of cylindrical core, is BA. When a pulse of frequency rBA is applied (where r is a positive integer), only the hydrogen protons at cross section A will undergo magnetic resonance. Therefore, the stratified moisture distribution of the sample can be obtained from the signal intensity at different height sections of the sample.
- (3)
- Nuclear magnetic resonance imaging (MRI)
An NMR imaging sequence was used to obtain the layered structure of a sample [79], in which, the brighter a pixel was, the higher the moisture content was interpreted to be. On the basis of the static magnetic field B0, the phase-encoding gradient Gp was applied in the y-direction. Therefore, protons along this direction had different phase values. In the process of collecting the sample signal, a gradient magnetic Gr was applied along the x-direction, and the precession frequencies of protons at different positions along this direction were different. So, the frequency and phase values could be used to determine the unique position of the proton. Then, through Fourier transformation of the position information, an image illustrating the layer structure was obtained.
2.3. Experimental Design
2.3.1. Capillary Imbibition Test
The four dried samples were placed on a permeable stone in a petri dish. The water surface in the petri dish only just diffused through the permeable stone, and its height was kept constant during the tests (Figure 1a). The following parameters were tested under different water absorption times:
- (1)
- Water absorption mass and height rising of the water absorption front
The water absorption mass of a sample equals the mass of the sample after water absorption minus that at dry state. The mass of samples was measured with a balance at regular intervals. The height of the water-absorption front on the surface of the samples was measured at the same intervals. The interval time between measurements was 10–30 min in the early stage and 300 min in the later period. Four fixed measuring lines were arranged on the side of the sample, and the height of water migration between the water-absorption front and the ground was measured along the four measuring lines. The average value was taken as the height increase of the water absorption front at a certain time.
- (2)
- Lightness of the sample’s top surface
To observe the water redistribution process on the top surface of samples, the lightness of the top surface was measured during the water migration process. The lightness of a surface is determined by its ability to reflect light. The good light-reflection ability of water causes the reflection of the upper surface of sandstone to vary according to water conditions. Therefore, by measuring the lightness of the upper surface, the moisture distribution process at that location can be determined. The lightness value was measured by colorimeter (3nh NR145), and the lightness value of the upper surface was obtained by taking the average value of the three values.
- (3)
- NMR T2 spectra and stratified moisture content of samples
After these three parameters were measured, the T2 spectra and stratified moisture content were also tested. For this, an NMR microstructural analysis and imaging system was used (MacroMR12-150H-I). The parameters of the T2 spectral test were set in accordance withj Jia et al. [80]. The parameters for the stratified moisture content test were as follows: P1 (pulse 1 (pulse 90°)) = 14.52, TD (time data) = 256, SW (sampling bandwidth) = 20 kHz, TW (time wait) = 1000 ms, RFD (regulate first data) = 0.008 ms, RG1 (regulate analog gain 1) = 10 dB, DRG1 (regulate digital gain 1) = 3, NS (number sampling) = 4, TE (time echo) = 1.42752 ms, DR (data radius) = 1, PRG (pre-amp regulate gain) = 2, GM (the frequency encoding gradient application direction) = 1, FOVR (field of view) = 200 mm, Ga1 (frequency coding compensates for the percentage of gradient output) = 4.186%, DL1 (the frequency encoding compensates for the gradient duration) = 1 ms, GA0 (frequency coding compensates for the percentage of gradient output) = 5.56738%.
2.3.2. Observations of the Layer Structures and Pore Structures of Samples
The layer structure of the sandstone was observed by NMR imaging after the samples were completely saturated with distilled water via the vacuum method. The equipment was the same as above, and the test parameters were set in accordance with Jia et al. [79]. The pore structure of sandstone was observed by optical microscopy using cast thin sections.
3. Results
3.1. Water-Absorption Mass Changes with Time
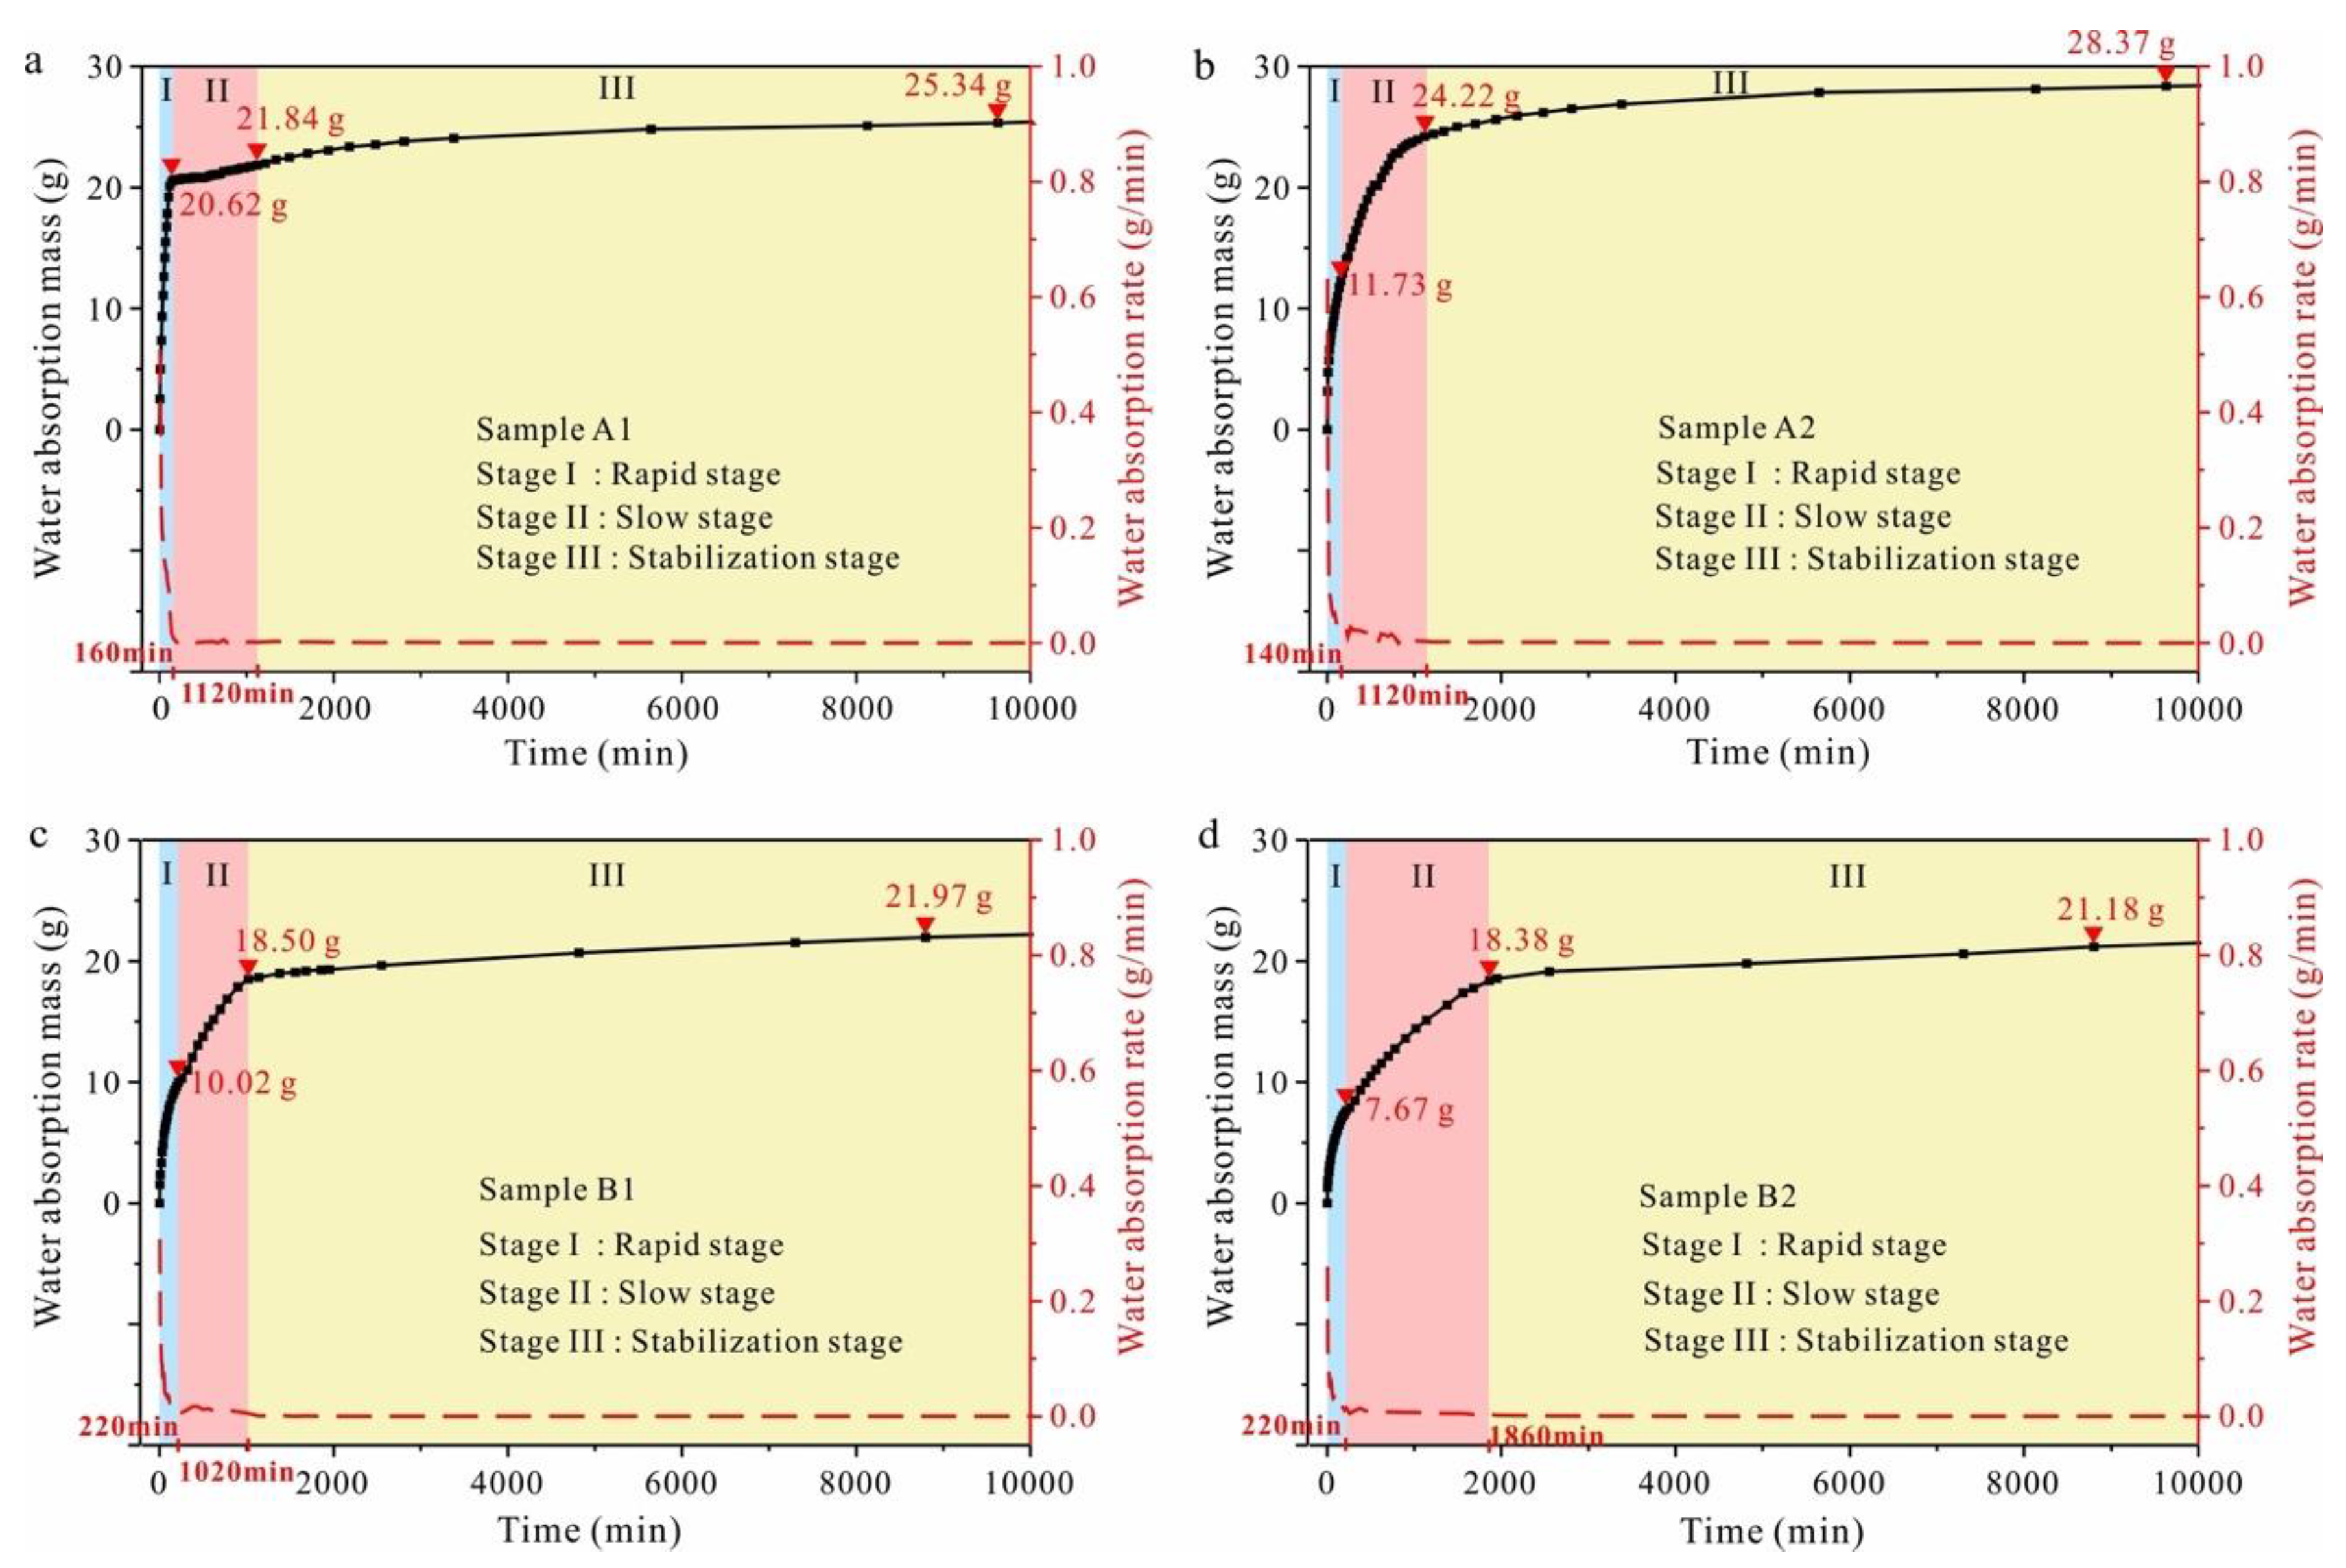
The water migration processes in the four samples were similar (Figure 2), showing a three-stage trend of (1) rapid increasing, (2) slow increasing, and (3) stabilization. The stages were divided according to the change in the water-absorption rate. When the water-absorption rate is much higher than 0.01, this stage is the stage of rapid growth. However, the layer orientation had a significant effect on the capillary imbibition process. The layer orientation mainly affected the duration time, water absorption mass, and the rate of water-absorption mass in each stage.
In sandstone with well-developed bedding (Samples A1 and A2), the layer orientation caused significant differences in water absorption mass and its rate of change at each stage. In Par sample (Sample A1), shown in Figure 2a, the water mass mainly increased during the rapid increase stage, while for the Per sample (Sample A2), shown in Figure 2b, the water absorption mass increased mainly in the slow increasing stage. Counting the water-absorption mass and its proportion at each stage, shown in Table 3, in the Par sample (Sample A1), water-absorption mass increase during the rapid increase stage accounted for 81.37% of the total water-absorption mass, while that absorbed in the slow increasing stage accounted for 4.81%. The parameters in Table 3 are defined in the note below the table. In the Per sample (Sample A2), water-absorption mass increase during the rapid increase stage accounted for 41.35% of the total water-absorption mass in sandstone, while that absorbed in the slow increasing stage accounted for 44.03%. In addition, in each stage, the water increase rate (the increase in the water absorption mass per unit time) is significantly greater in Par sample than that in Per sample (Table 3).
In sandstone with poorly developed bedding (Samples B1 and B2), the layer orientation caused significant differences in the duration of the slow increasing stage (Figure 2c,d). In addition, the layer orientation still affected the water-absorption mass and its rate at each stage, but the influence is not as pronounced in these sandstones with poorly developed bedding. In the Par sample (Sample B1), the slow increasing stage lasted for 800 min, while in the Per sample (Sample B2), the slow increasing stage lasted for 1640 min. In the Par sample (Sample B1), the water-absorption mass increase during the rapid increasing stage accounted for 46.42% of the total water-absorption mass, while that in the slow increasing stage accounted for 38.39%. In the Per sample (Sample B2), the water-absorption mass increase during the rapid increasing stage accounted for 36.21% of the total water absorption mass, while that in the slow increasing stage accounted for 50.57% (Table 3). In each stage, the average rate of change in water absorption was greater in the Par sample than in the Per sample, but the difference is smaller compared to the well-developed sandstone.
In addition, the total water-absorption mass of the samples was influenced by porosity. The water-absorption mass of the four samples were ranked in descending order as A2, A1, B1, and B2, which is the same order as for porosity.
3.2. Variation in the Height of the Absorption Front
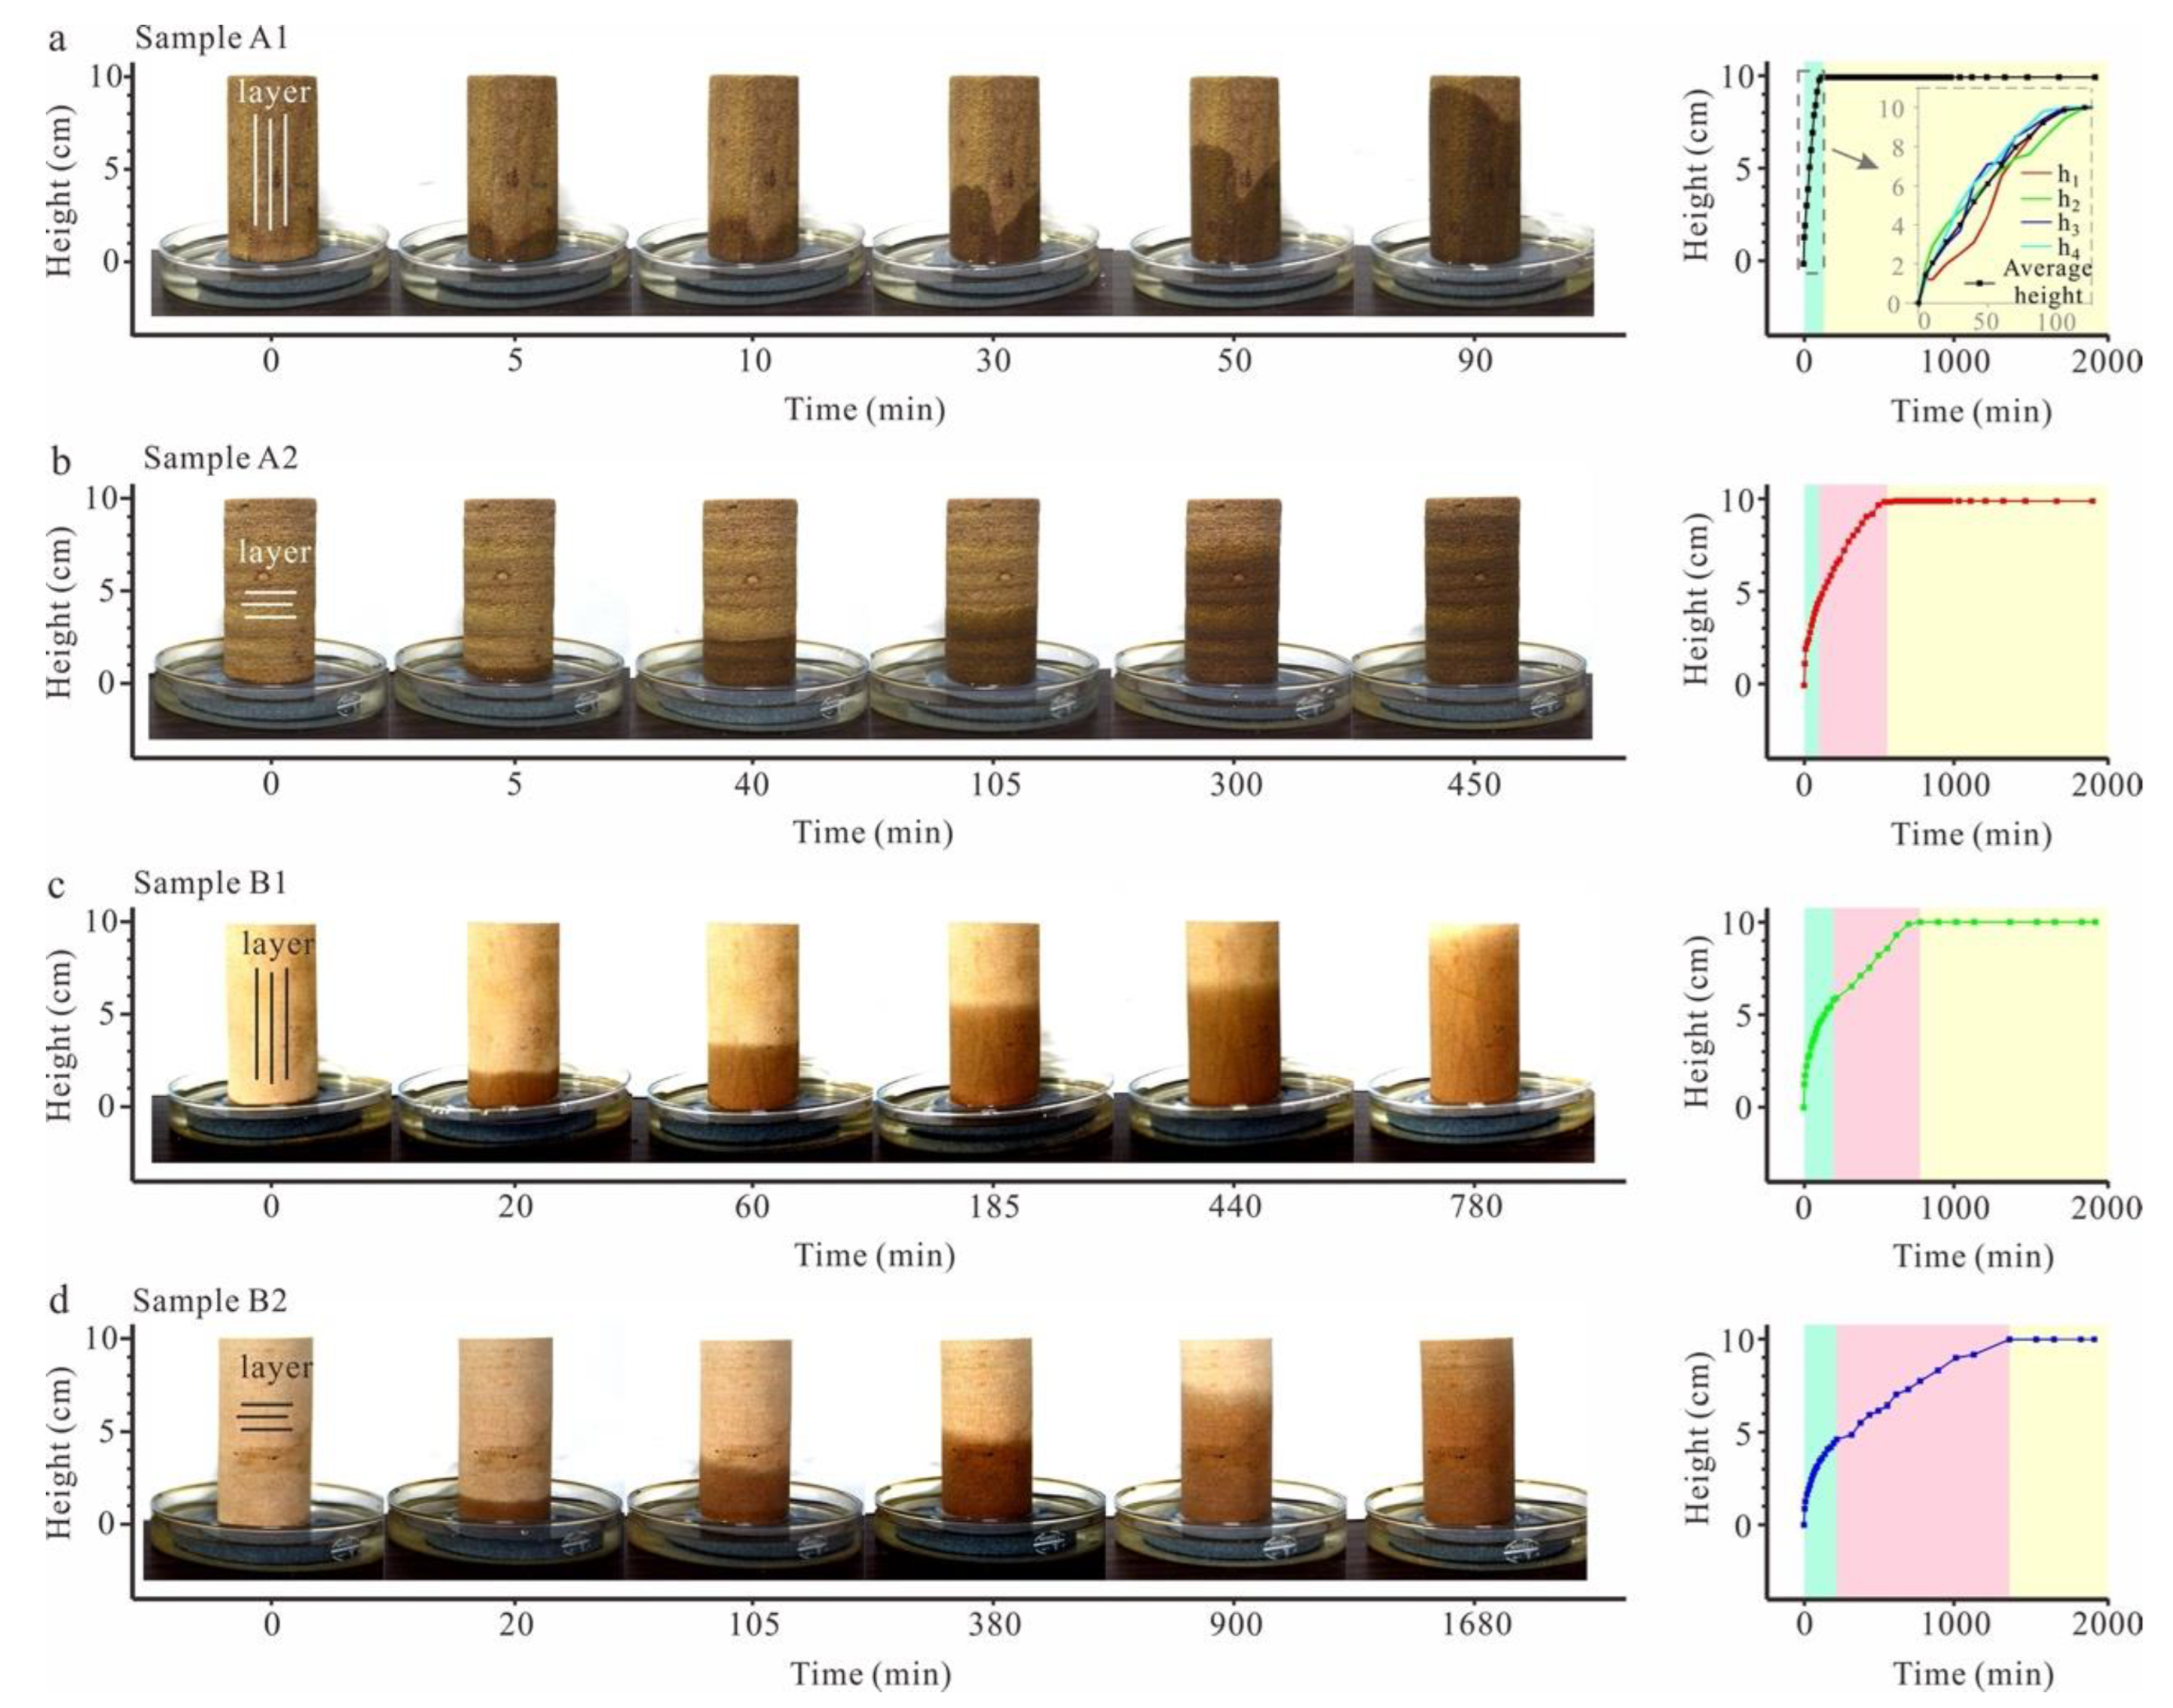
The orientation of the bedding plane has a significant effect on the rising rate and morphology of the water-absorption front, and this effect varies with the degree of layer development (Figure 3). The rising rate in the water-absorption front was higher in the Par sample than in the Per sample. This phenomenon is more obvious in well-developed bedding sandstone. The rising of the water-absorption front in Sample A1 can be divided into two stages: (1) rapid rising and (2) stabilization. The front reached the top of the sample within 105 min. The rise in Sample A2 can be divided into three stages: (1) rapid rising, (2) slow rising, and (3) stabilization. It took 500 min for the front to reach the top of the sample. Samples B1 and B2 also featured these three stages, and it took 700 min and 1380 min, respectively, for the fronts to reach the tops of the samples.
The influence of layer orientation on the morphology of the water absorption fronts was mainly evident in sandstone with well-developed bedding. The height of the water-absorption front varied significantly within the different layers of the Par sample, reflecting different absorption rates. Meanwhile, the front height increased uniformly layer by layer in the Per sample. In sandstone with poorly developed bedding, there was no obvious difference in the morphologies of the water absorption fronts, demonstrating that the water absorption rates were relatively uniform.
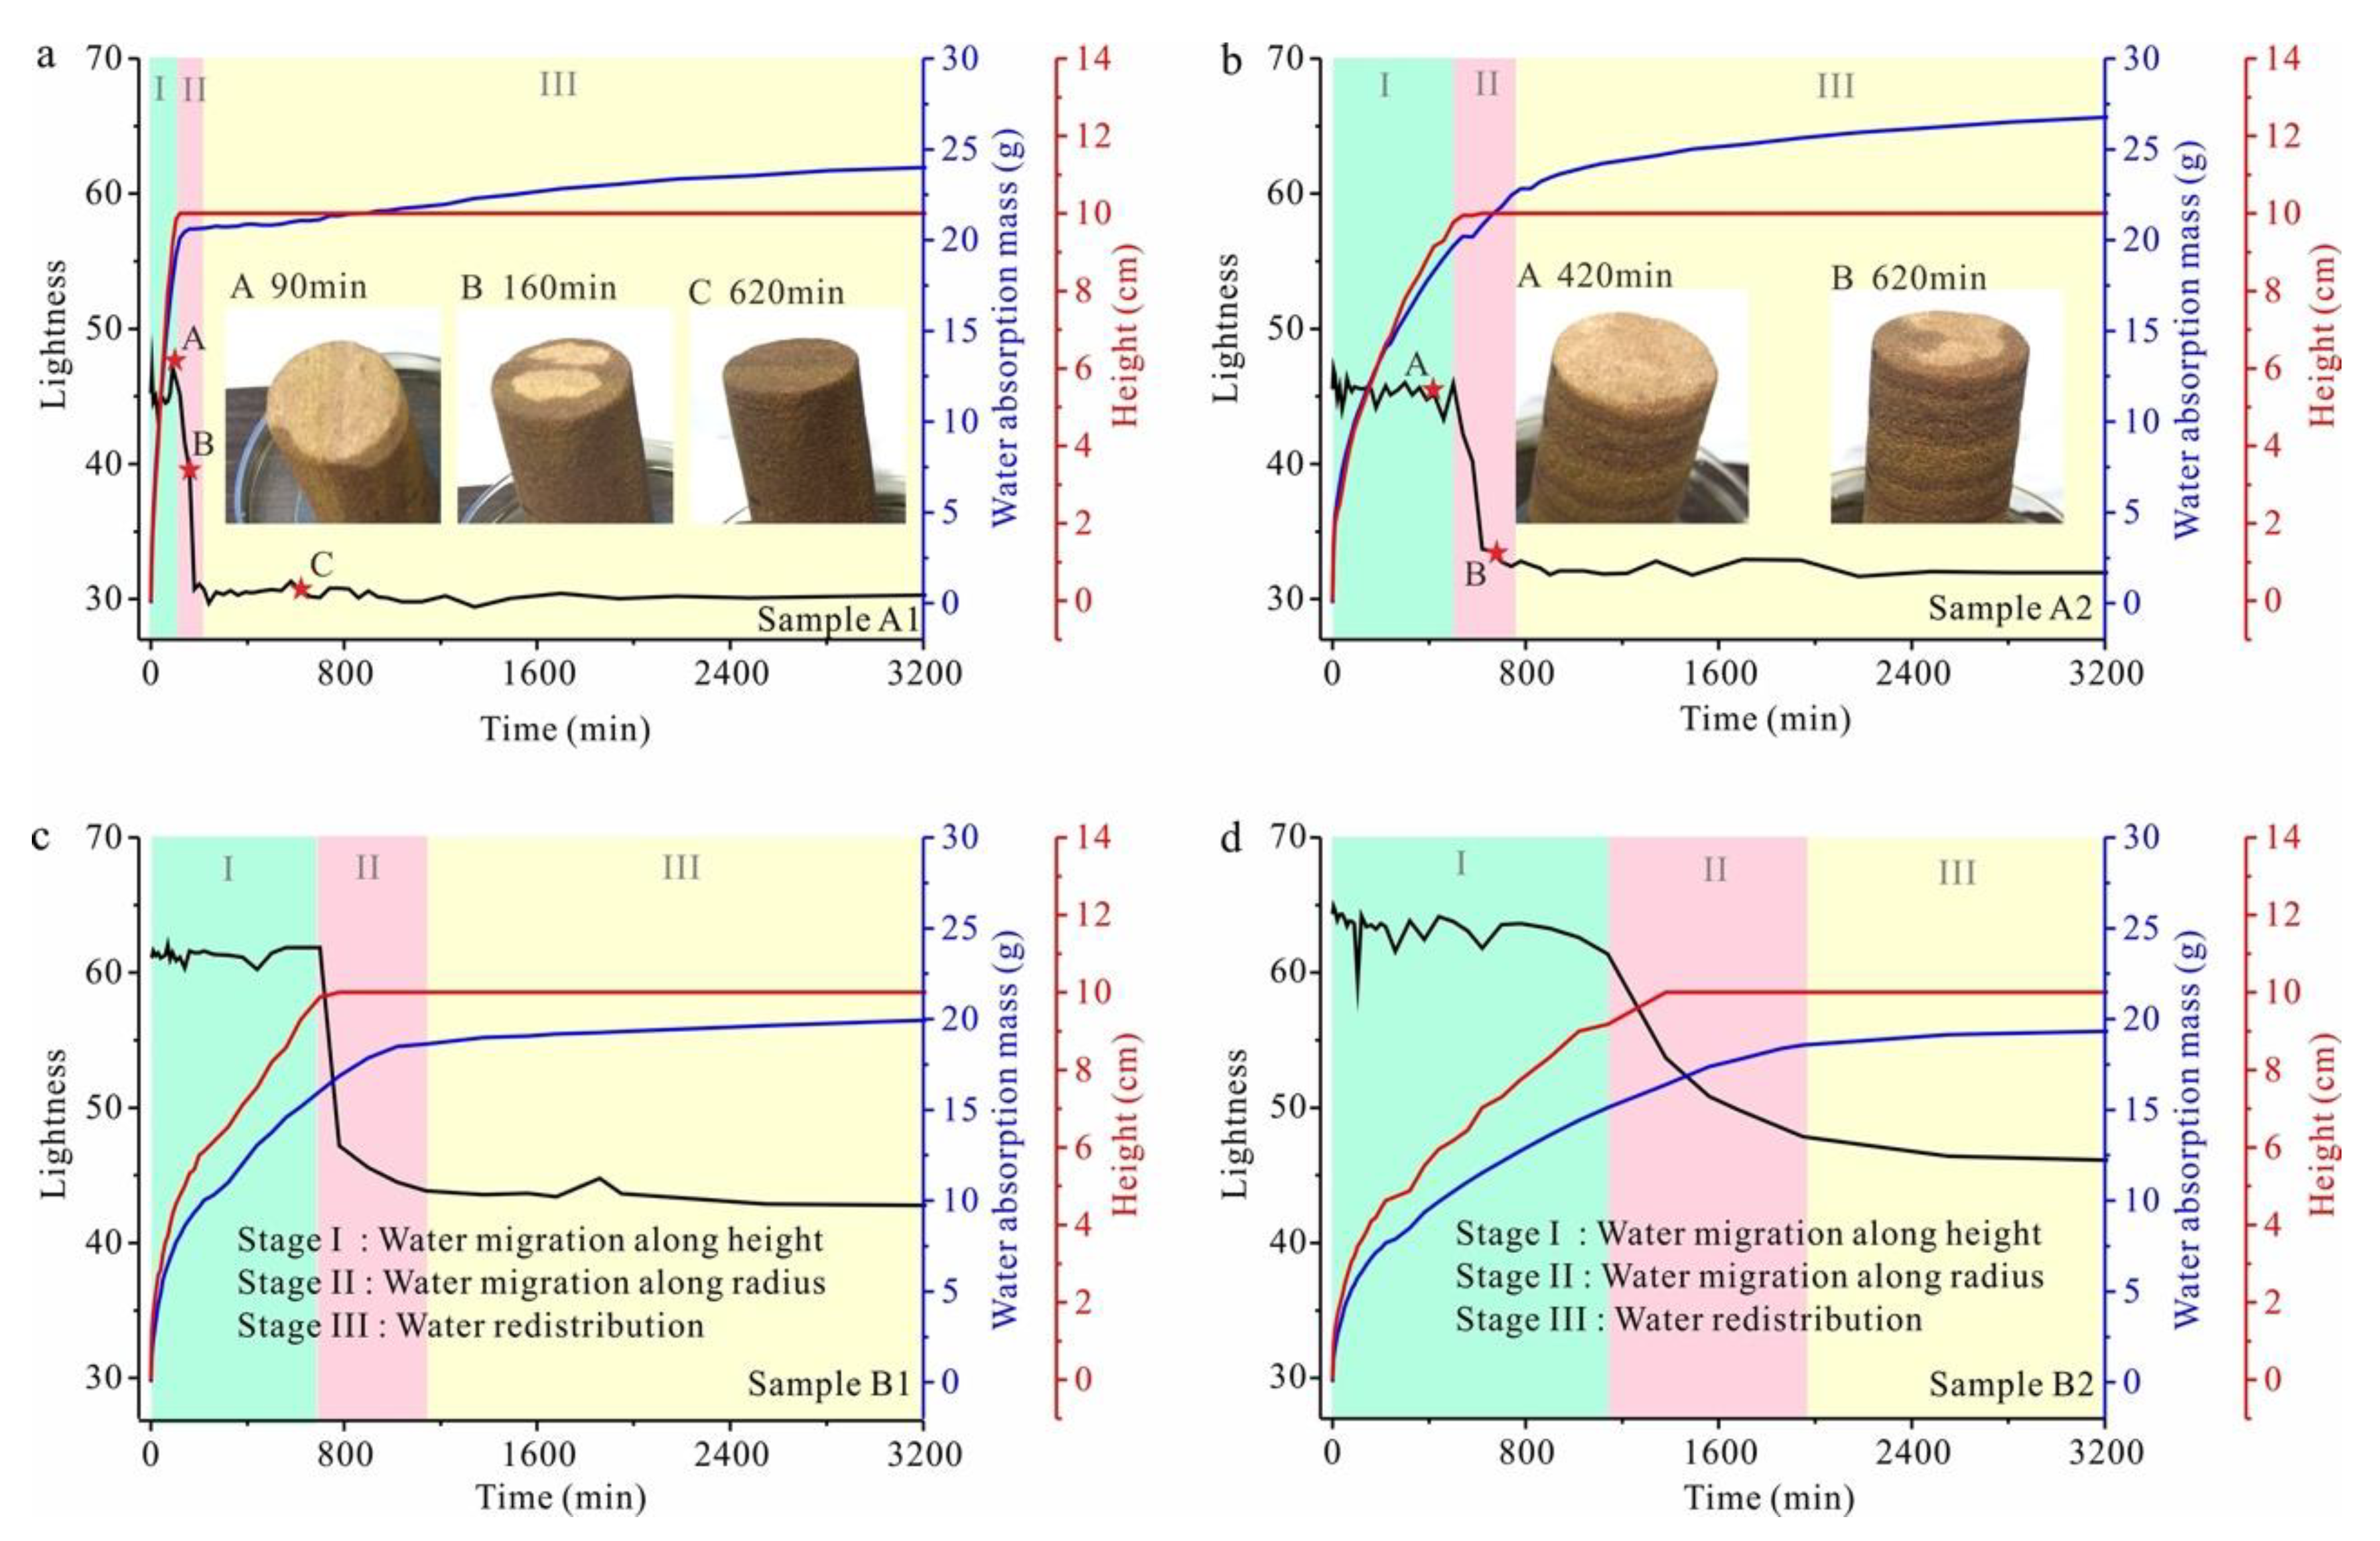
3.3. Water Distribution at the Top of Samples According to Lightness
The lightness of the top surface of the samples was negatively correlated with the water content of that surface. The change in lightness of the top surface may reflect the moisture migration process along the radial direction of the specimen. The change in lightness of the top surface corresponds to the phases of the height increase of the water absorption front and can be divided into three stages: (1) Water migrates along the axis of cylindrical core. In this stage, water mainly migrates upward along the dominant seepage channels in the axis of cylindrical core. The absorption front gradually rises to the top surface, but its lightness is largely unchanged. As shown in Figure 4a,b, red star A is the top surface of the sample in this state. (2) Water migrates along the radial direction. In this stage, water mainly migrates along the radial seepage channels. The height of the water absorption front no longer changes, but the lightness of the top surface decreases significantly. As shown in Figure 4a,b, red star B is the top surface of the sample in this state. (3) Water redistributes. Water migration in this stage mainly occurs between pores of different sizes. The lightness and water absorption mass of the samples are also stable (Figure 4). As shown in Figure 4a, red star C is the top surface of the sample in this state.
The variation in lightness in different types of layered sandstones indicates that (1) the layer orientation has a significant effect on the capillary imbibition process in the axis of cylindrical core; (2) the layer orientation also has a significant influence on the capillary imbibition process in the radial direction. The main features of this phenomenon are (1) in sandstone with well-developed bedding, radial water migration in the Par sample (Sample A1) lasted for 130 min after the water absorption front reached the top, while in the Per sample (Sample A2), it lasted 240 min; (2) in sandstone with poorly developed bedding, radial water migration in the Par sample (Sample B1) lasted 440 min after the water absorption front reached the top, while in the Per sample (Sample B2), it lasted 810 min.
It should be noted that during the stage of water migration along the height, there was still minor radial migration. In addition, the initial difference in lightness between Specimens A and B was caused by a difference in the grain thickness of the sandstone samples.
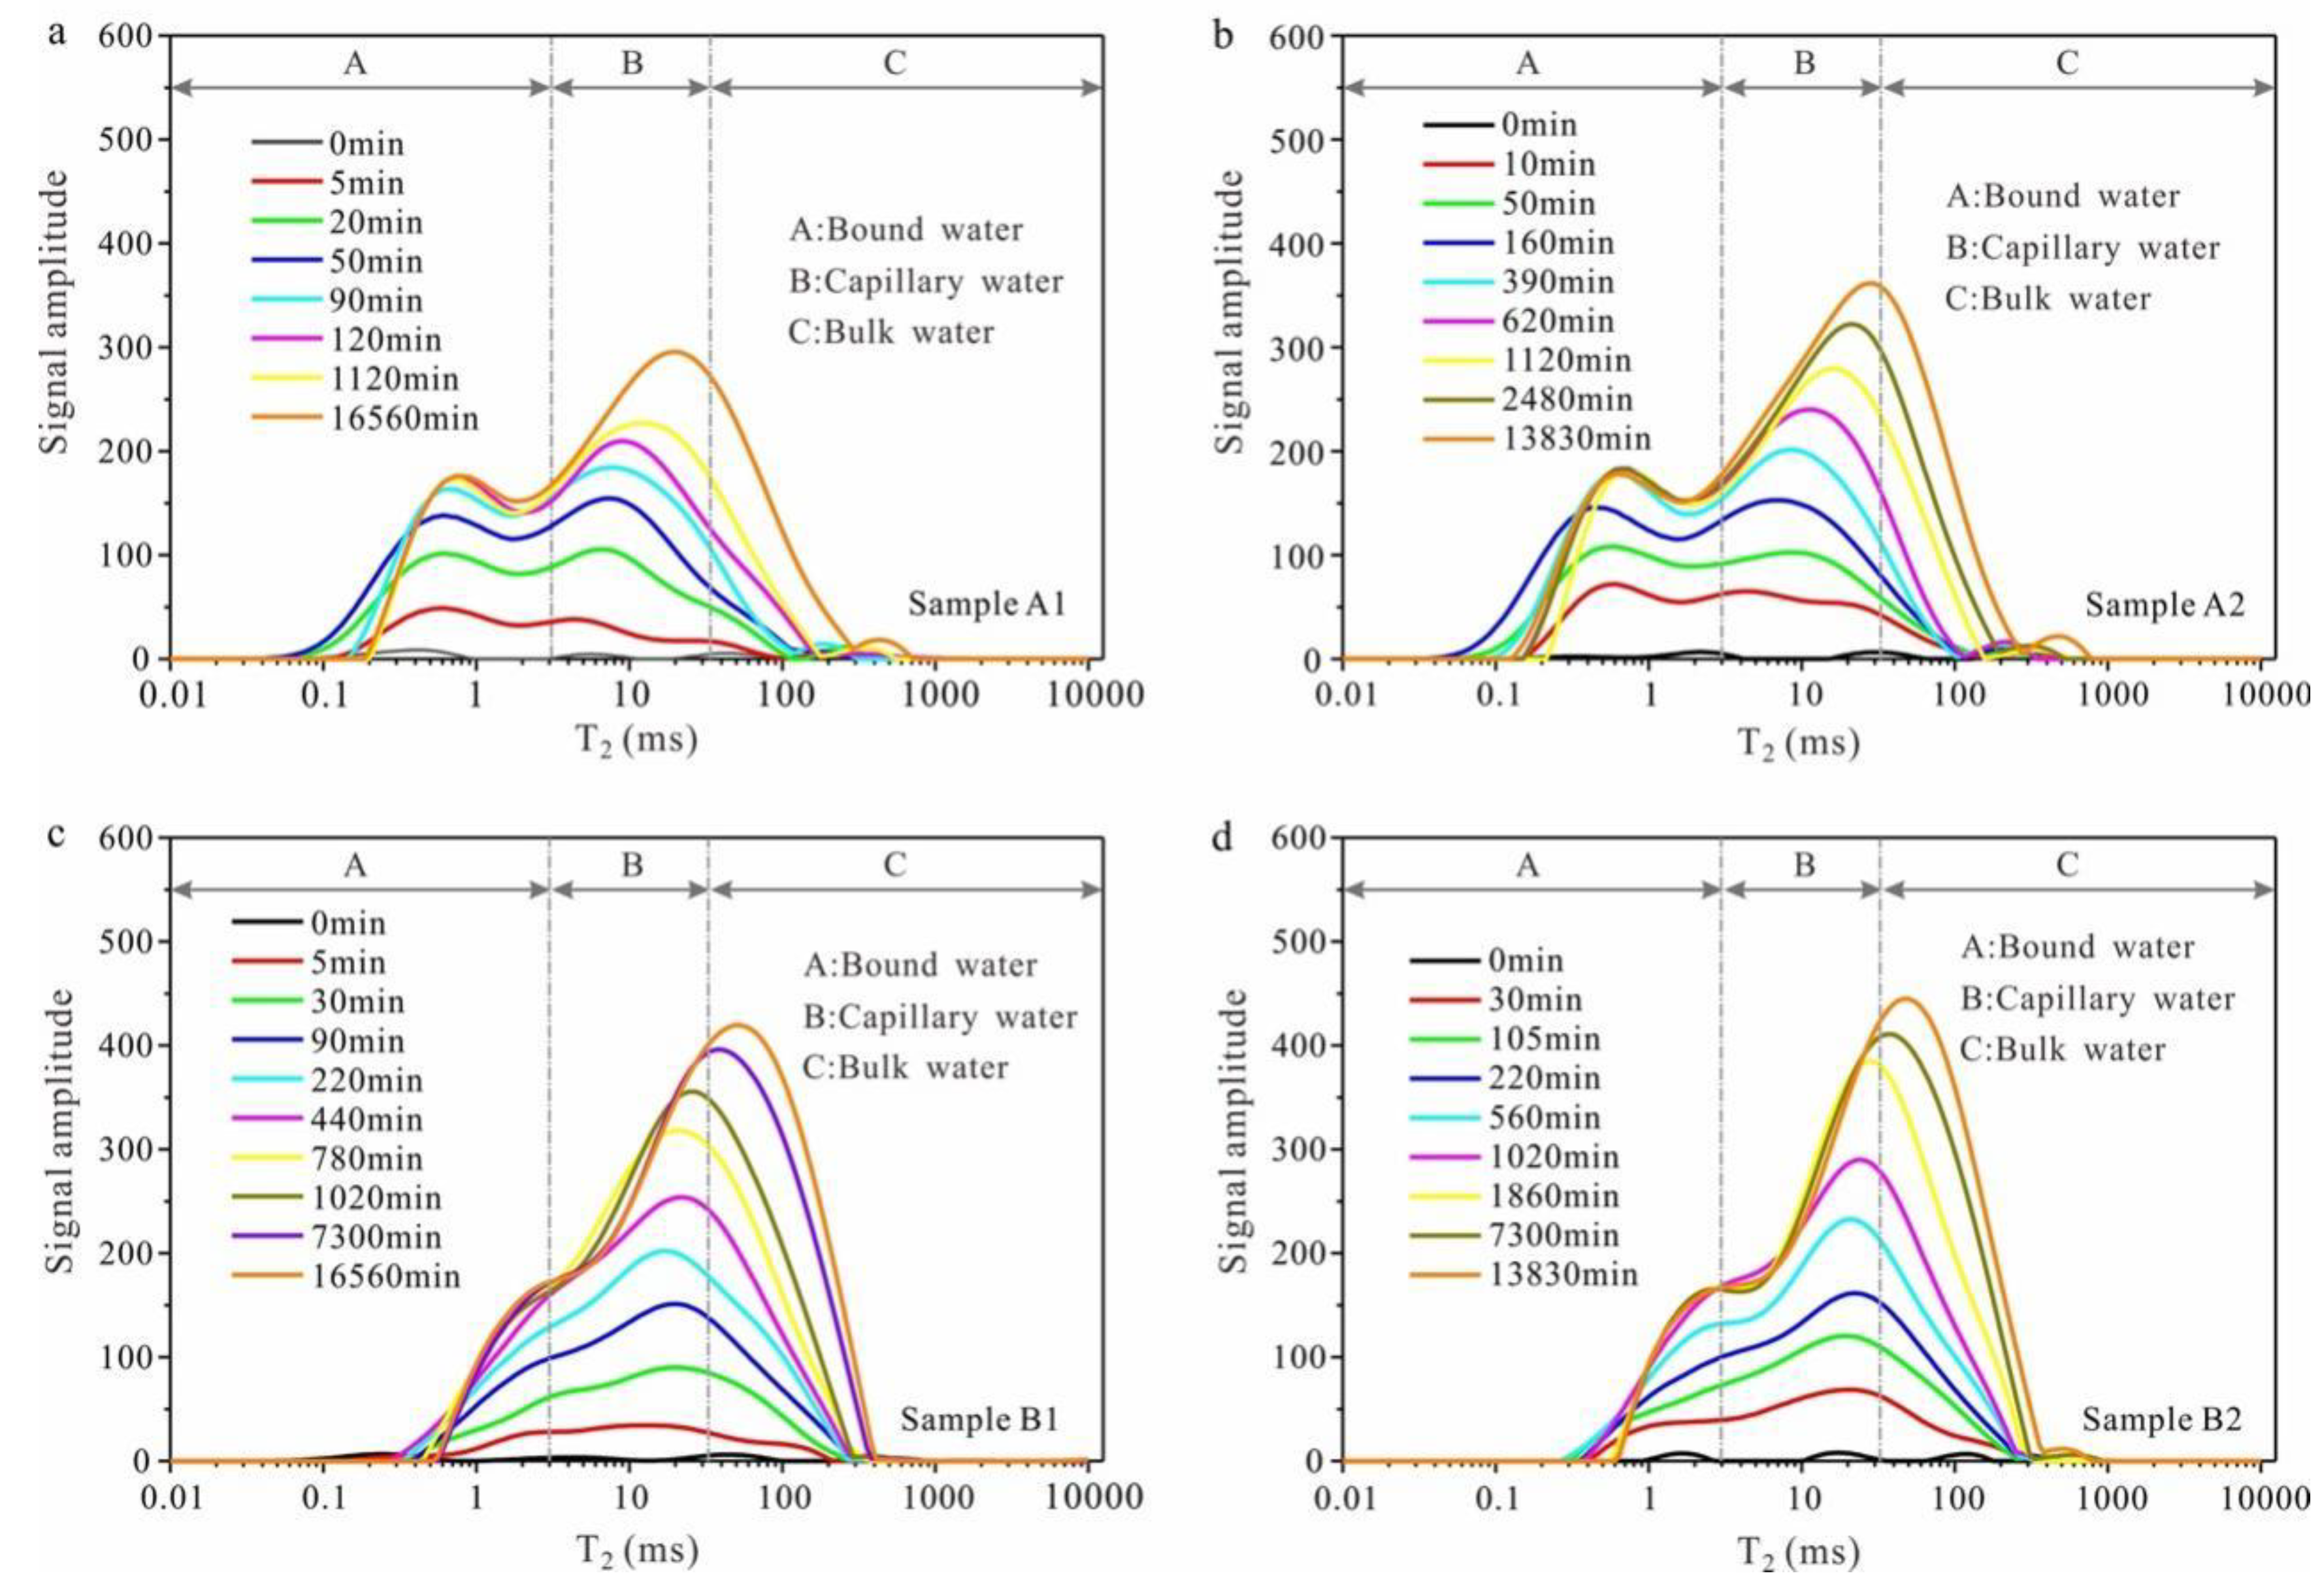
3.4. Variation in T2 Spectra during Water Adsorption
The T2 spectra of the samples at different moments reflect the capillary imbibition process (Figure 5). To study the pore water transport process more clearly, pore water was classified into three types—bound water, capillary water, and bulk water—according to the T2 spectra. The T2 of bound water in sandstone is generally <3 ms, whereas those of capillary water range between 3 and 33 ms, and values of >33 ms are associated with bulk water or free water [75]. The bound water content was the first to reach stabilization in all four samples during the capillary imbibition process, followed by capillary water, and finally, bulk water (Figure 5 and Figure 6). In addition, upon comparing the stabilization times of the bound water and water absorption mass and the time taken for the water absorption front to reach the top of the sample (Table 4), it can be found that the bound water content stabilized before the measured water absorption front reached the top. Given the fact that bound water may transport in the pores through vapor diffusion in addition to surface diffusion, the stabilization time of three types of water indicate that vapor diffusion did exist in the capillary imbibition process; i.e., vapor diffused and condensed to fill partial micropores and adsorb on the surface of pores ahead of the water-absorption front (Figure 6).
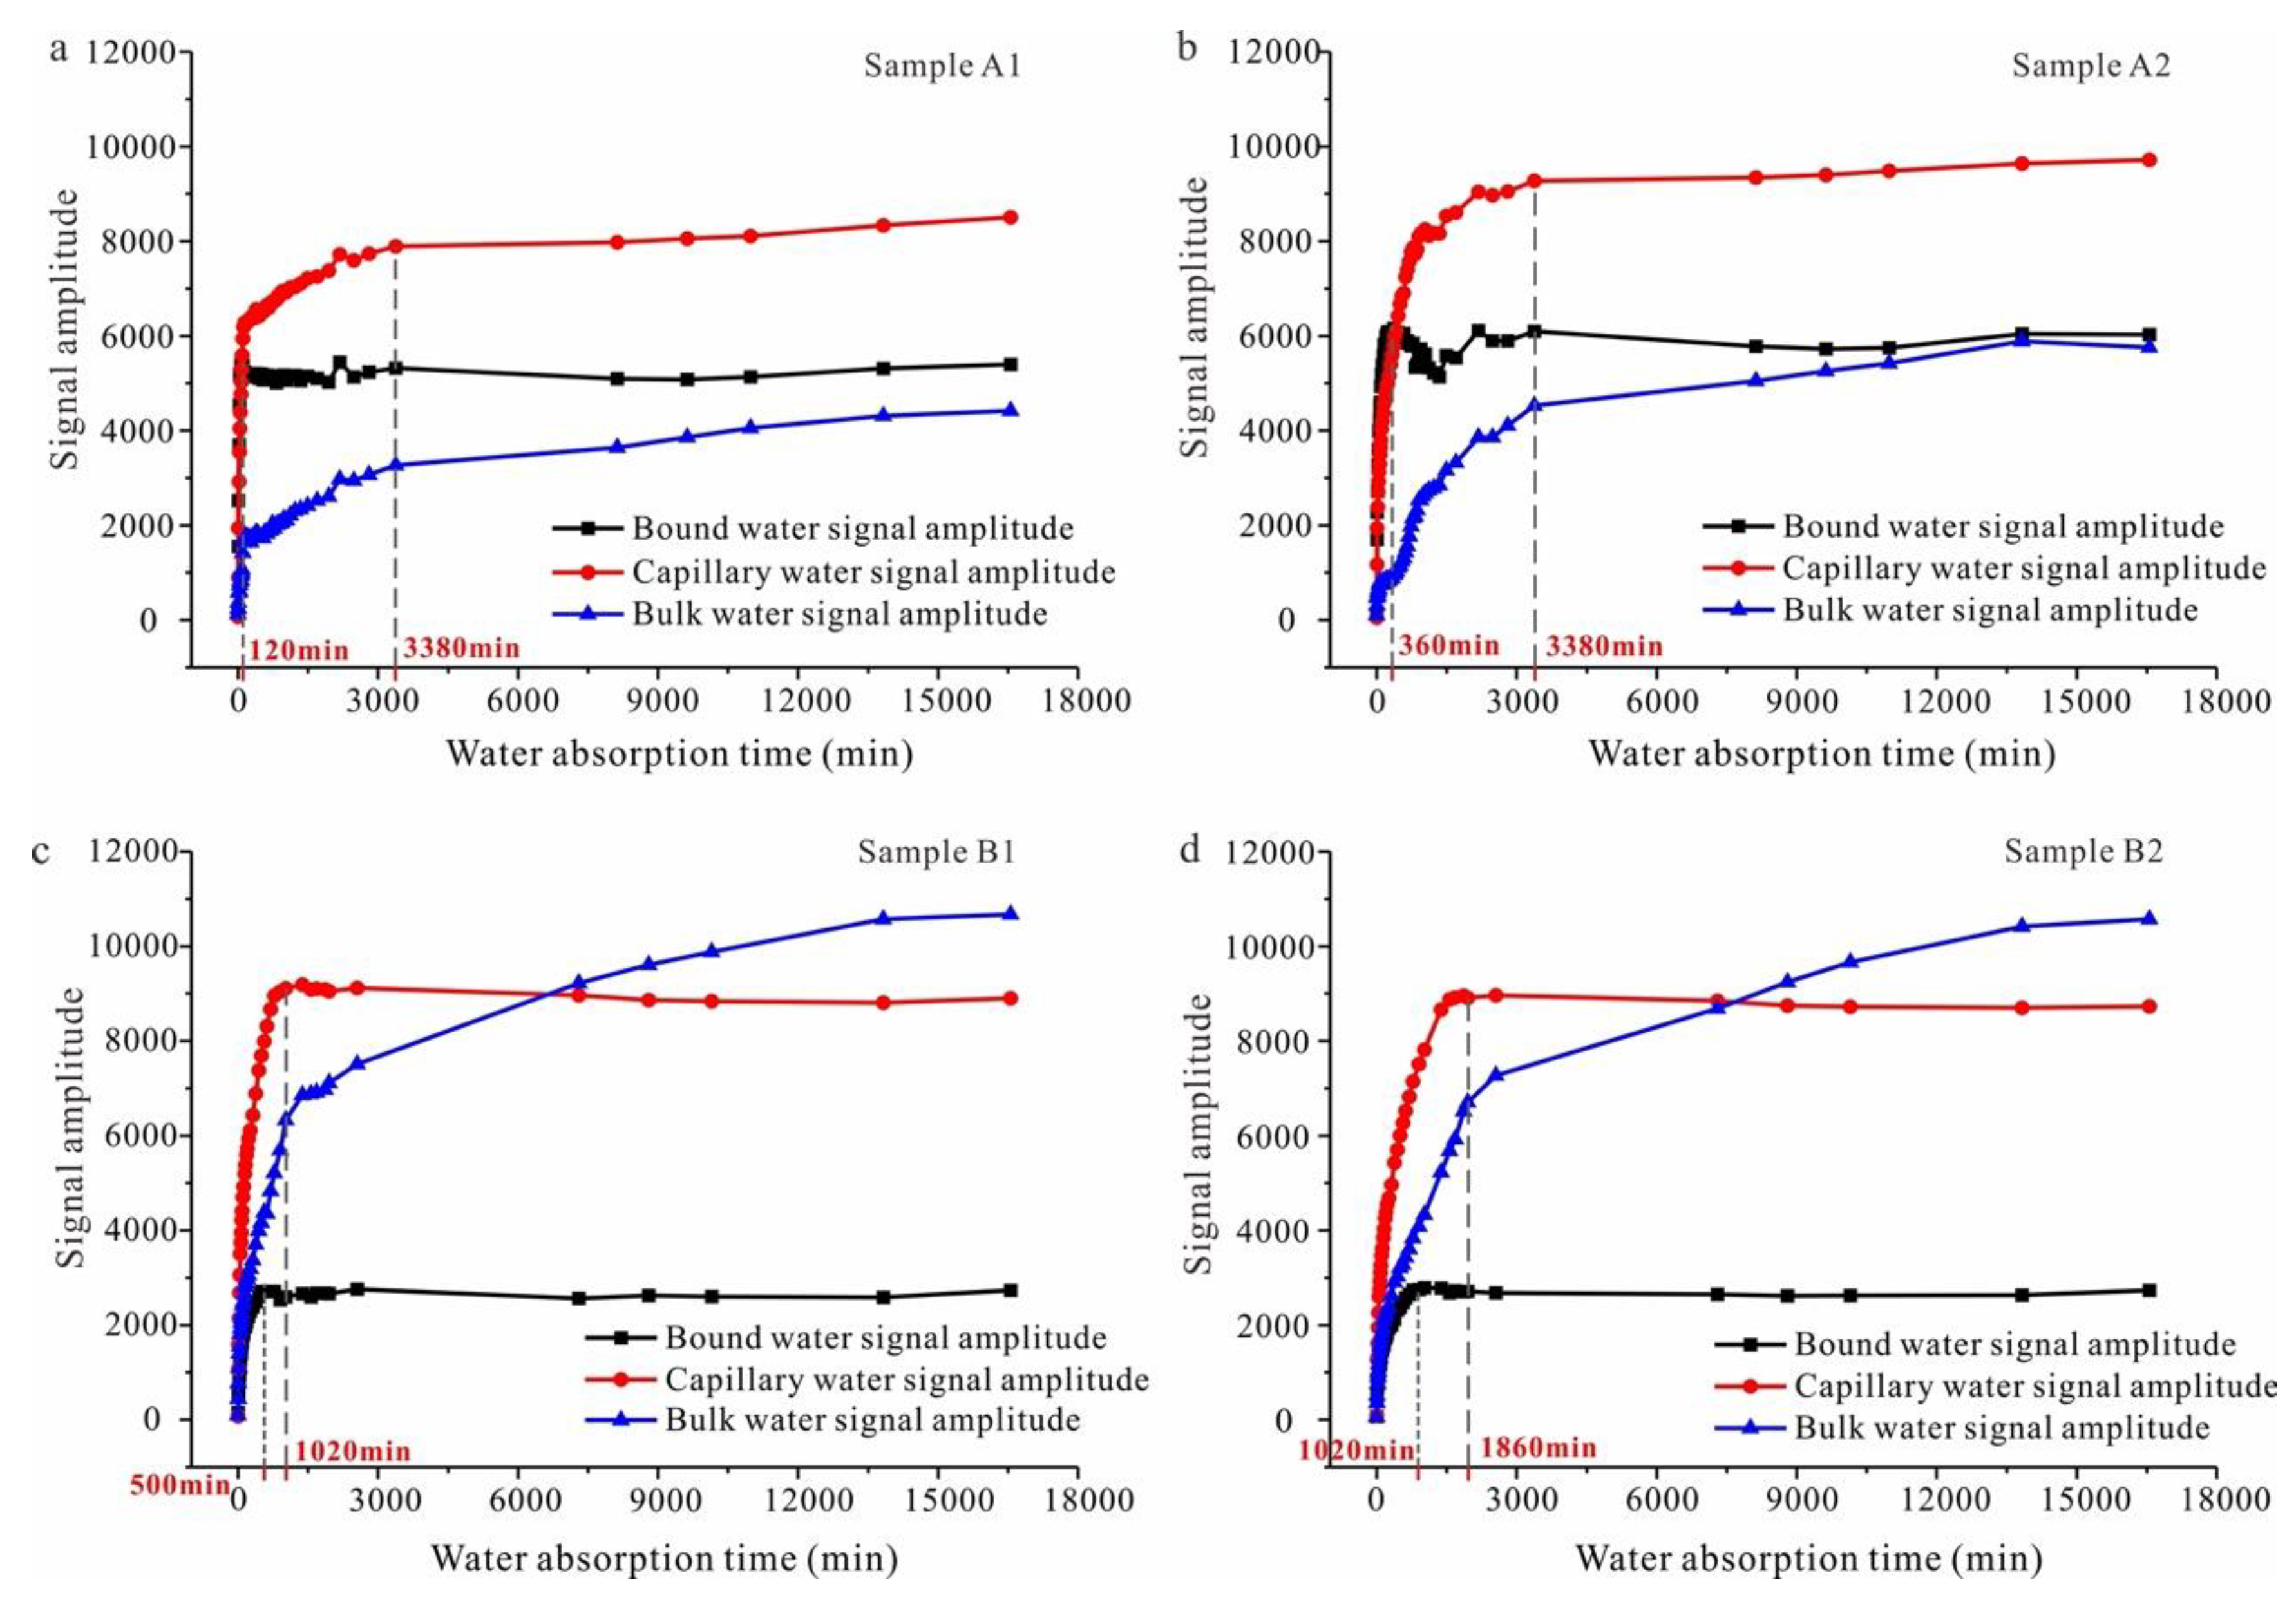
The results in Figure 7 and Figure 8 also show that the porosity and layer orientation of the samples had significant effects on the migration processes and final state of water distribution in the following manner: (1) Bound water content stabilization time is influenced by the porosity and layer orientation of the sample. The higher the porosity, the shorter the time required for the bound water to reach stability. The stabilization time in the Par samples was significantly shorter than that in Per samples. In sandstone with well-developed bedding, it took 120 min for the bound water content to reach stability in the Par sample (Sample A1) and 360 min in the Per sample (Sample A2). In sandstone with poorly developed bedding, it took 500 min for the bound water content to reach stability in the Par sandstone (Sample B1) and 1020 min in the Per sample (Sample B2). (2) The time taken for the capillary water content to reach stability was mainly influenced by porosity. The higher the porosity of the sample, the longer it took for the capillary water content to reach stability. In sandstone with well-developed bedding (Samples A1 and A2), the stabilization time was relatively long due to the high porosity, being 3380 min in both. Sandstone with poorly developed bedding (Samples B1 and B2) had lower porosity, corresponding to shorter times required for their capillary water contents to stabilize, being 1020 min and 1860 min, respectively. (3) The bulk water content stabilization time was unaffected by layer orientation and pore size. (4) The layer orientation did not affect the final content of each type of water.
According to the pore water classification method mentioned above, the signal amplitude of different types of water can be calculated, and then its proportion in the total signal amplitude can be obtained. In sandstone with well-developed bedding, the contents of bound water, capillary water, and bulk water inside the Par sample (Sample A1) accounted for 30%, 46%, and 24%, respectively, of the total water; while in the Per sample (Sample A2), they accounted for 28%, 45%, and 27%. In sandstone with poorly developed bedding, the contents of bound water, capillary water, and bulk water inside the Par sample (Sample B1) accounted for 12%, 40%, and 48%, respectively, of the total water; while in the Per sample (Sample B2), they accounted for 12%, 40%, and 48%. This indicates that the proportions of different types of water within a rock were mainly related to its pore size distribution and had no direct correlation with layer orientation.
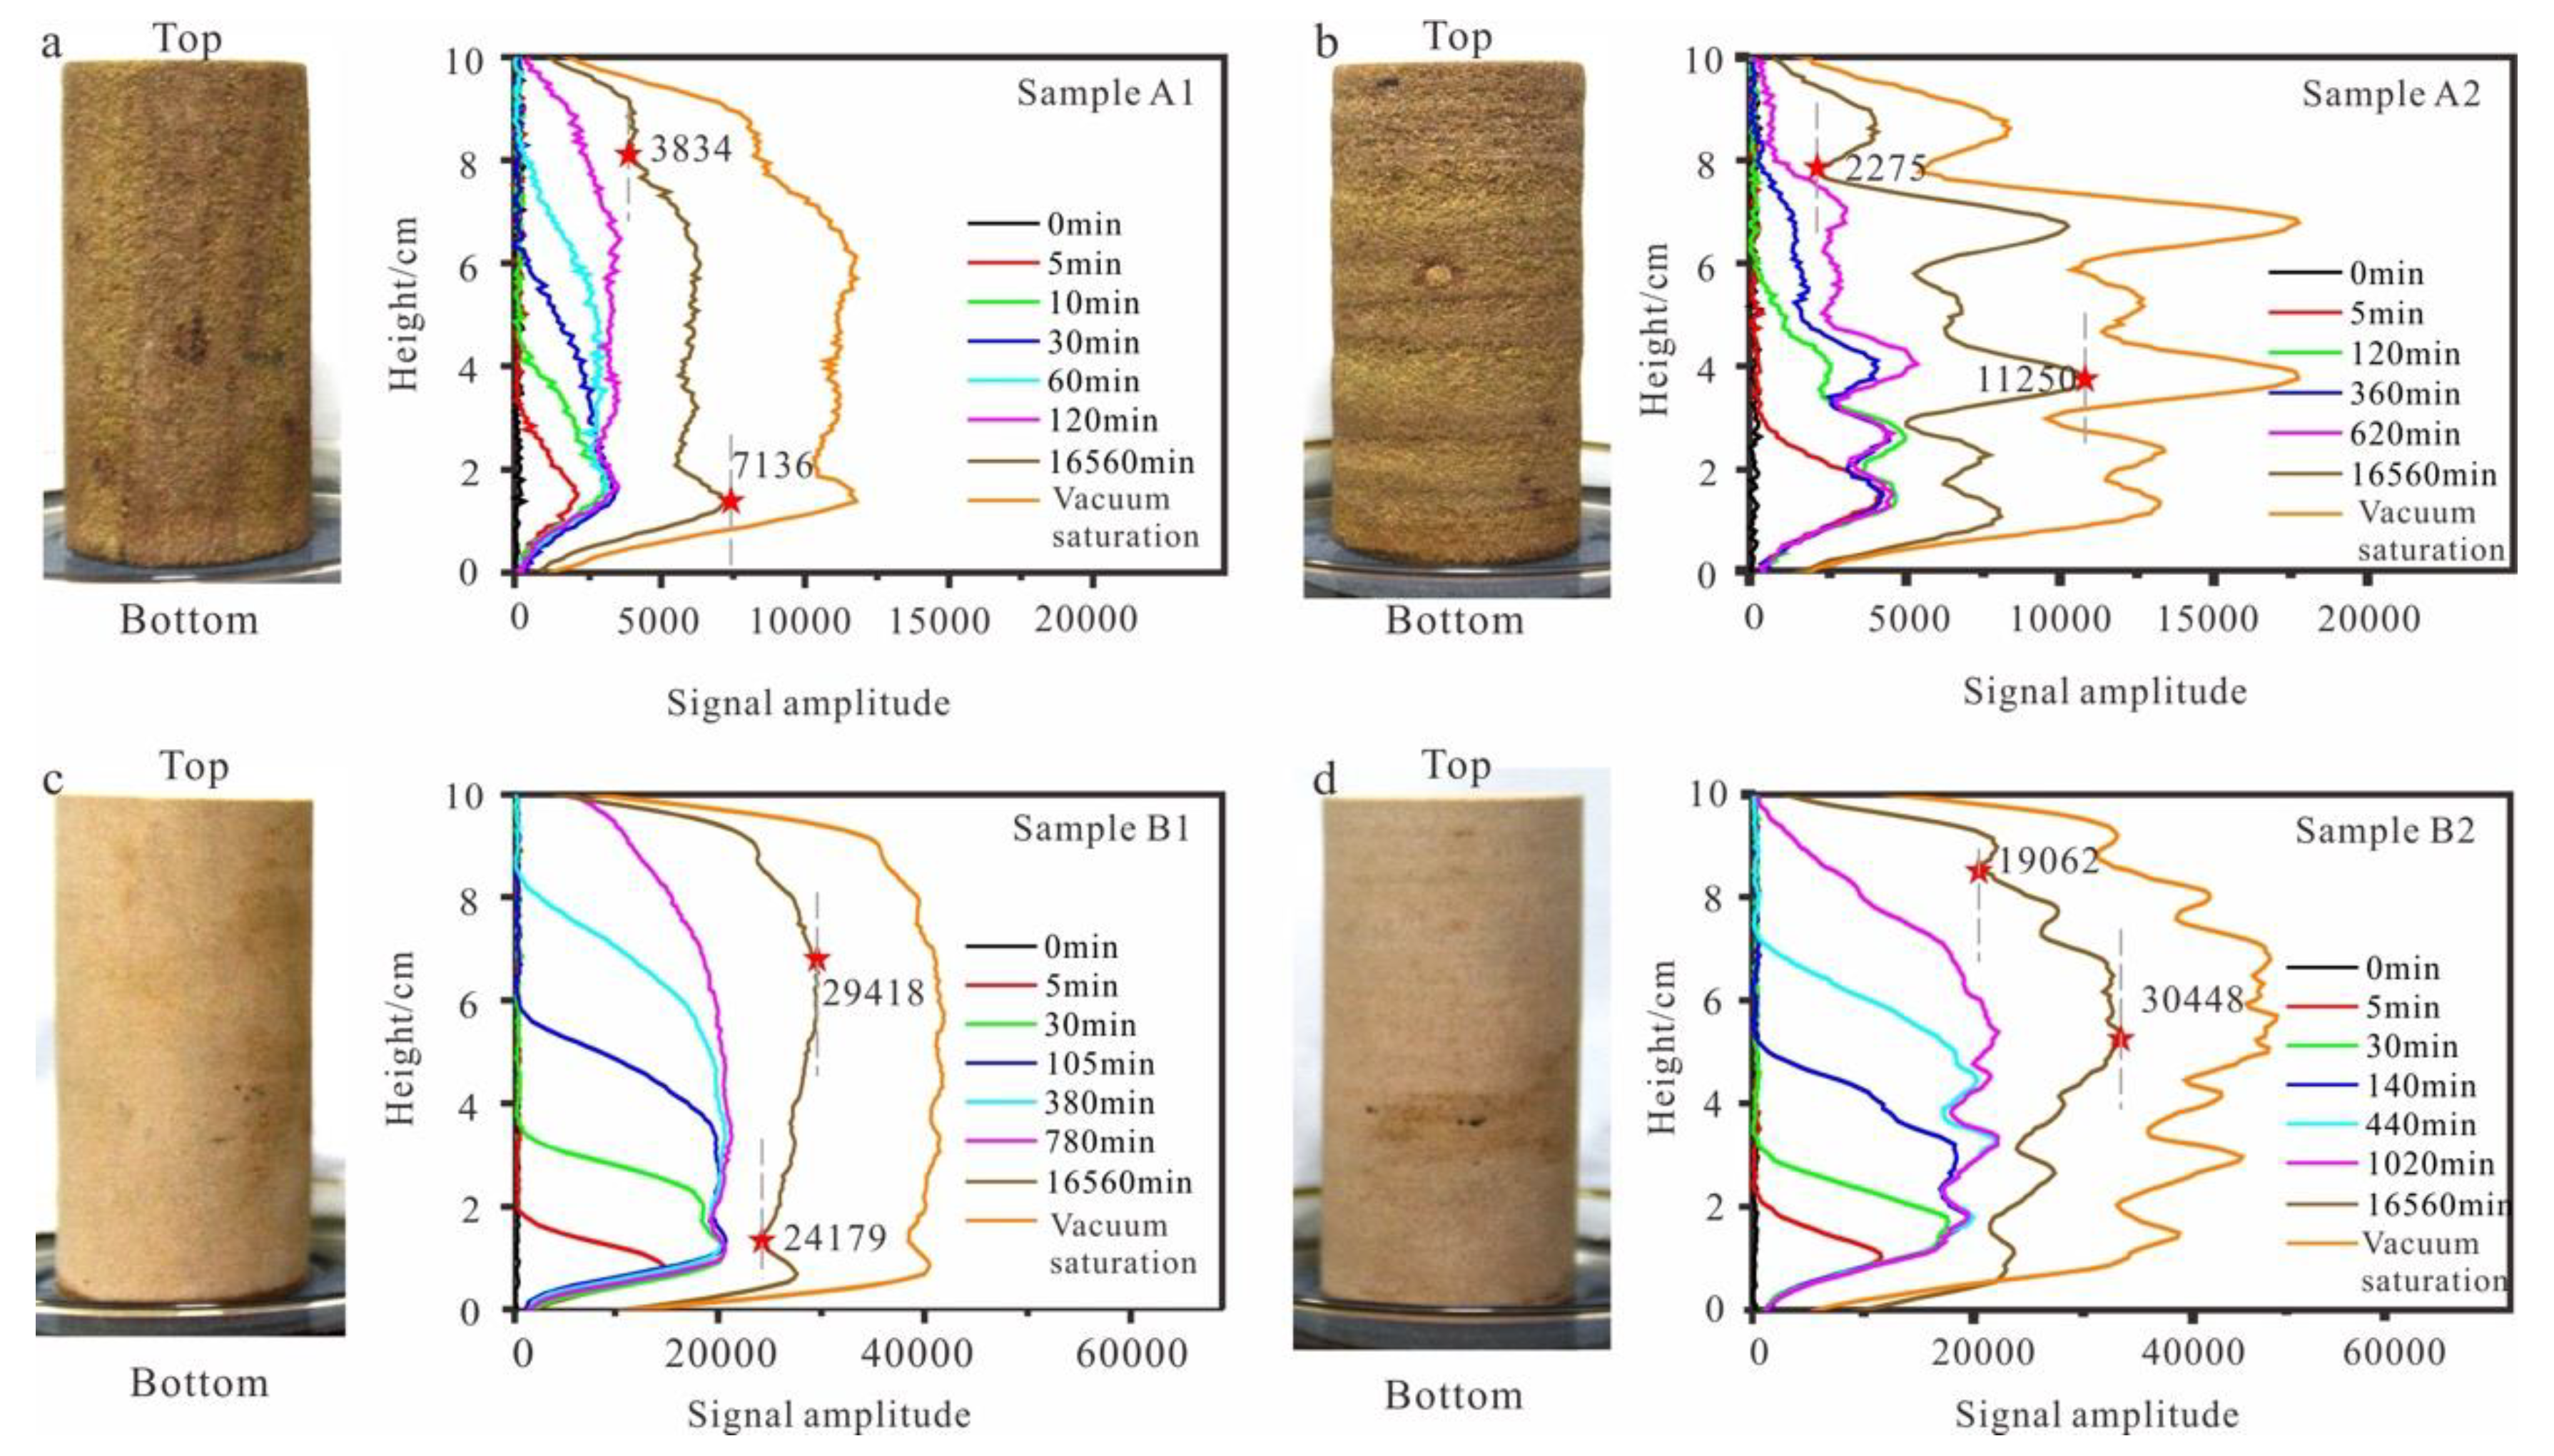
3.5. Variation in Stratified Moisture Distribution during Capillary Imbibition
The stratified moisture distribution curve obtained by NMR can intuitively reflect the water migration process along the axis of cylindrical core of the samples. Corresponding to changes in water-absorption height, the curve can be divided into two stages: (1) water migration and (2) redistribution. In the water migration stage, water primarily migrates in the axis of the cylindrical core, and the signal amplitude of the stratified moisture distribution curve also increases in this direction. In the redistribution stage, water migration in the main capillary channels is largely complete, and water mainly migrates into adjacent pores. The stratified moisture distribution curve no longer changes in the axis of the cylindrical core while its overall signal amplitude increases (Figure 7).
The stratified moisture distribution curves of samples with different layer directions show that the layer direction influences the water migration along the axis of the cylindrical core. In the Par sample, the signal difference is relatively small along the axis of the cylindrical core; while in the Per sample, the difference is greater. In sandstone with well-developed bedding, the maximum-to-minimum signal amplitude ratio after water absorption stabilized was 0.54 in the Par sample (Sample A1) and 0.20 in the Per sample (Sample A2). In sandstone with poorly developed bedding, the ratio was 0.82 in the Par sample (Sample B1) and 0.63 in the Per sample (Sample B2). Here, it should be noted that since moisture dissipated more rapidly at the sample surface, the data from both ends of the samples were excluded when determining the maximum and minimum signal amplitudes.
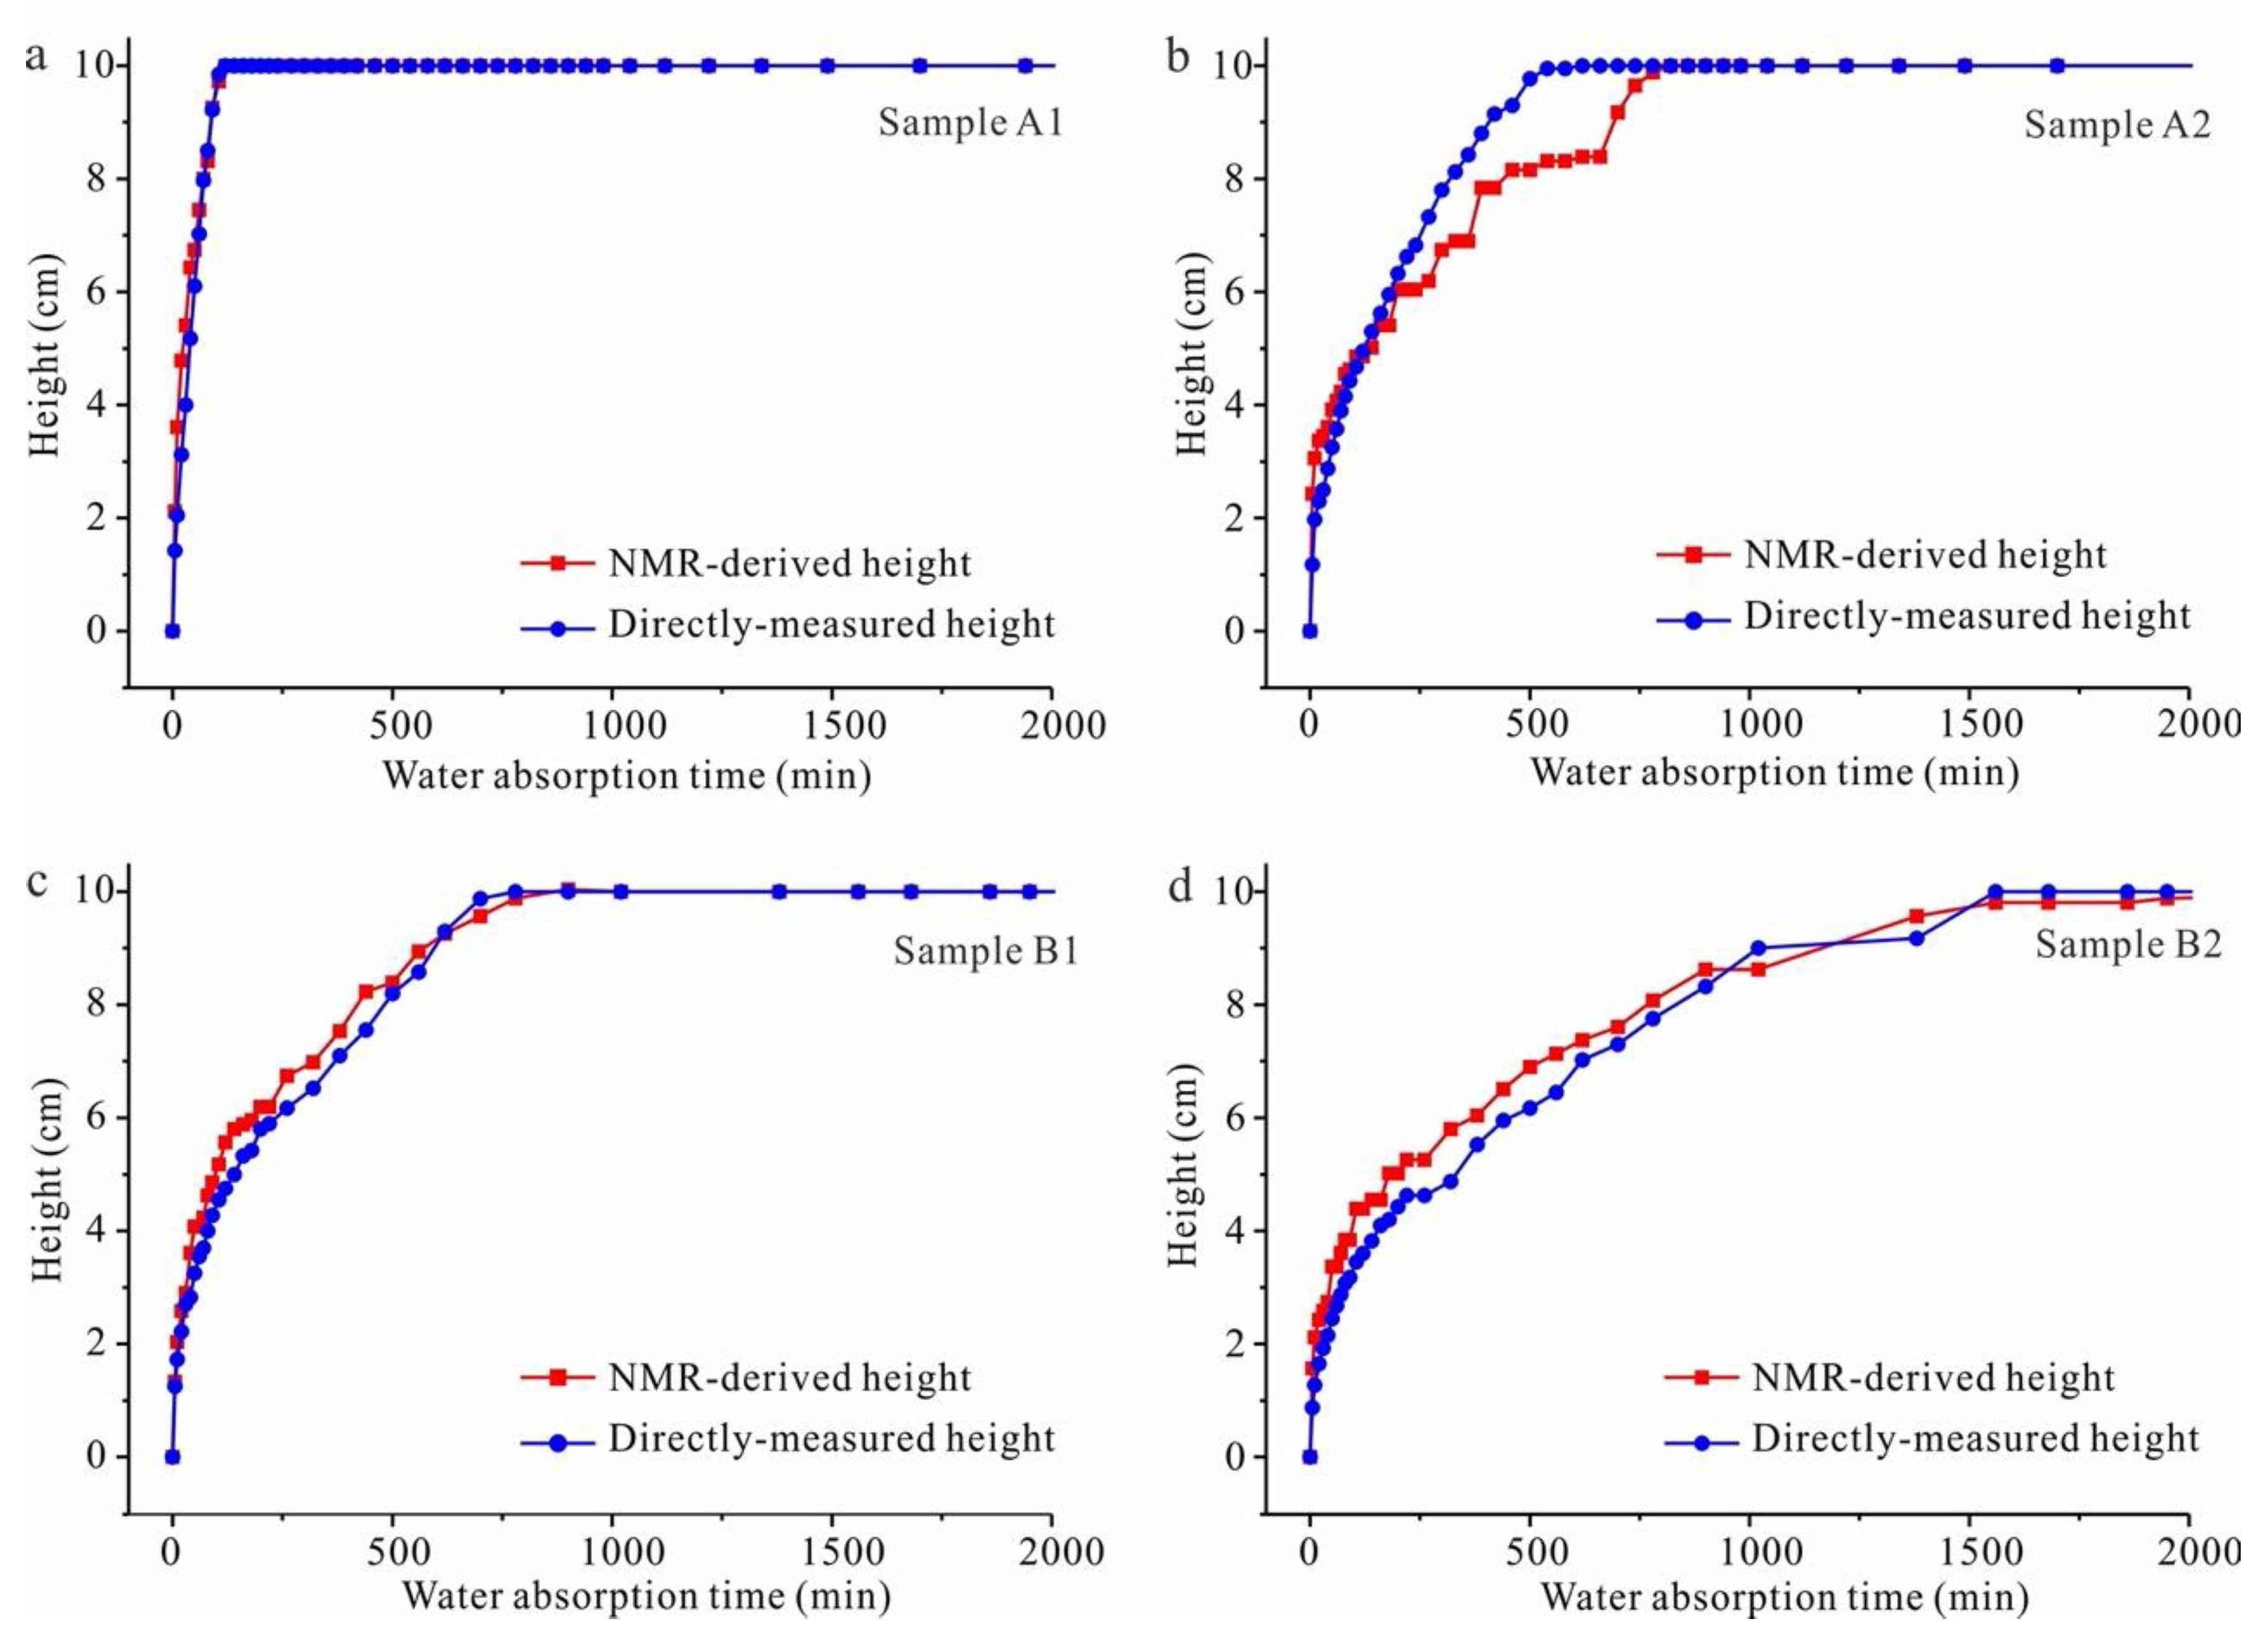
Upon comparing the water-absorption height reflected by stratified moisture distribution curves with the directly measured height of the water-absorption front (Figure 8), we found that the internal and superficial capillary imbibition processes were basically synchronized in the Par sample, while in the Per sample, internal water migration lagged behind superficial water migration. In sandstone with well-developed beddings, there was little difference between the directly measured height and NMR-derived height in the Par sample (Sample A1), while in the Per sample (Sample A2), the NMR-derived height lagged behind the measured height. This phenomenon was not obvious in samples with poorly developed bedding (Figure 8).
4. Pore Structure of Layered Sandstone
4.1. Layer Structure According to MRI
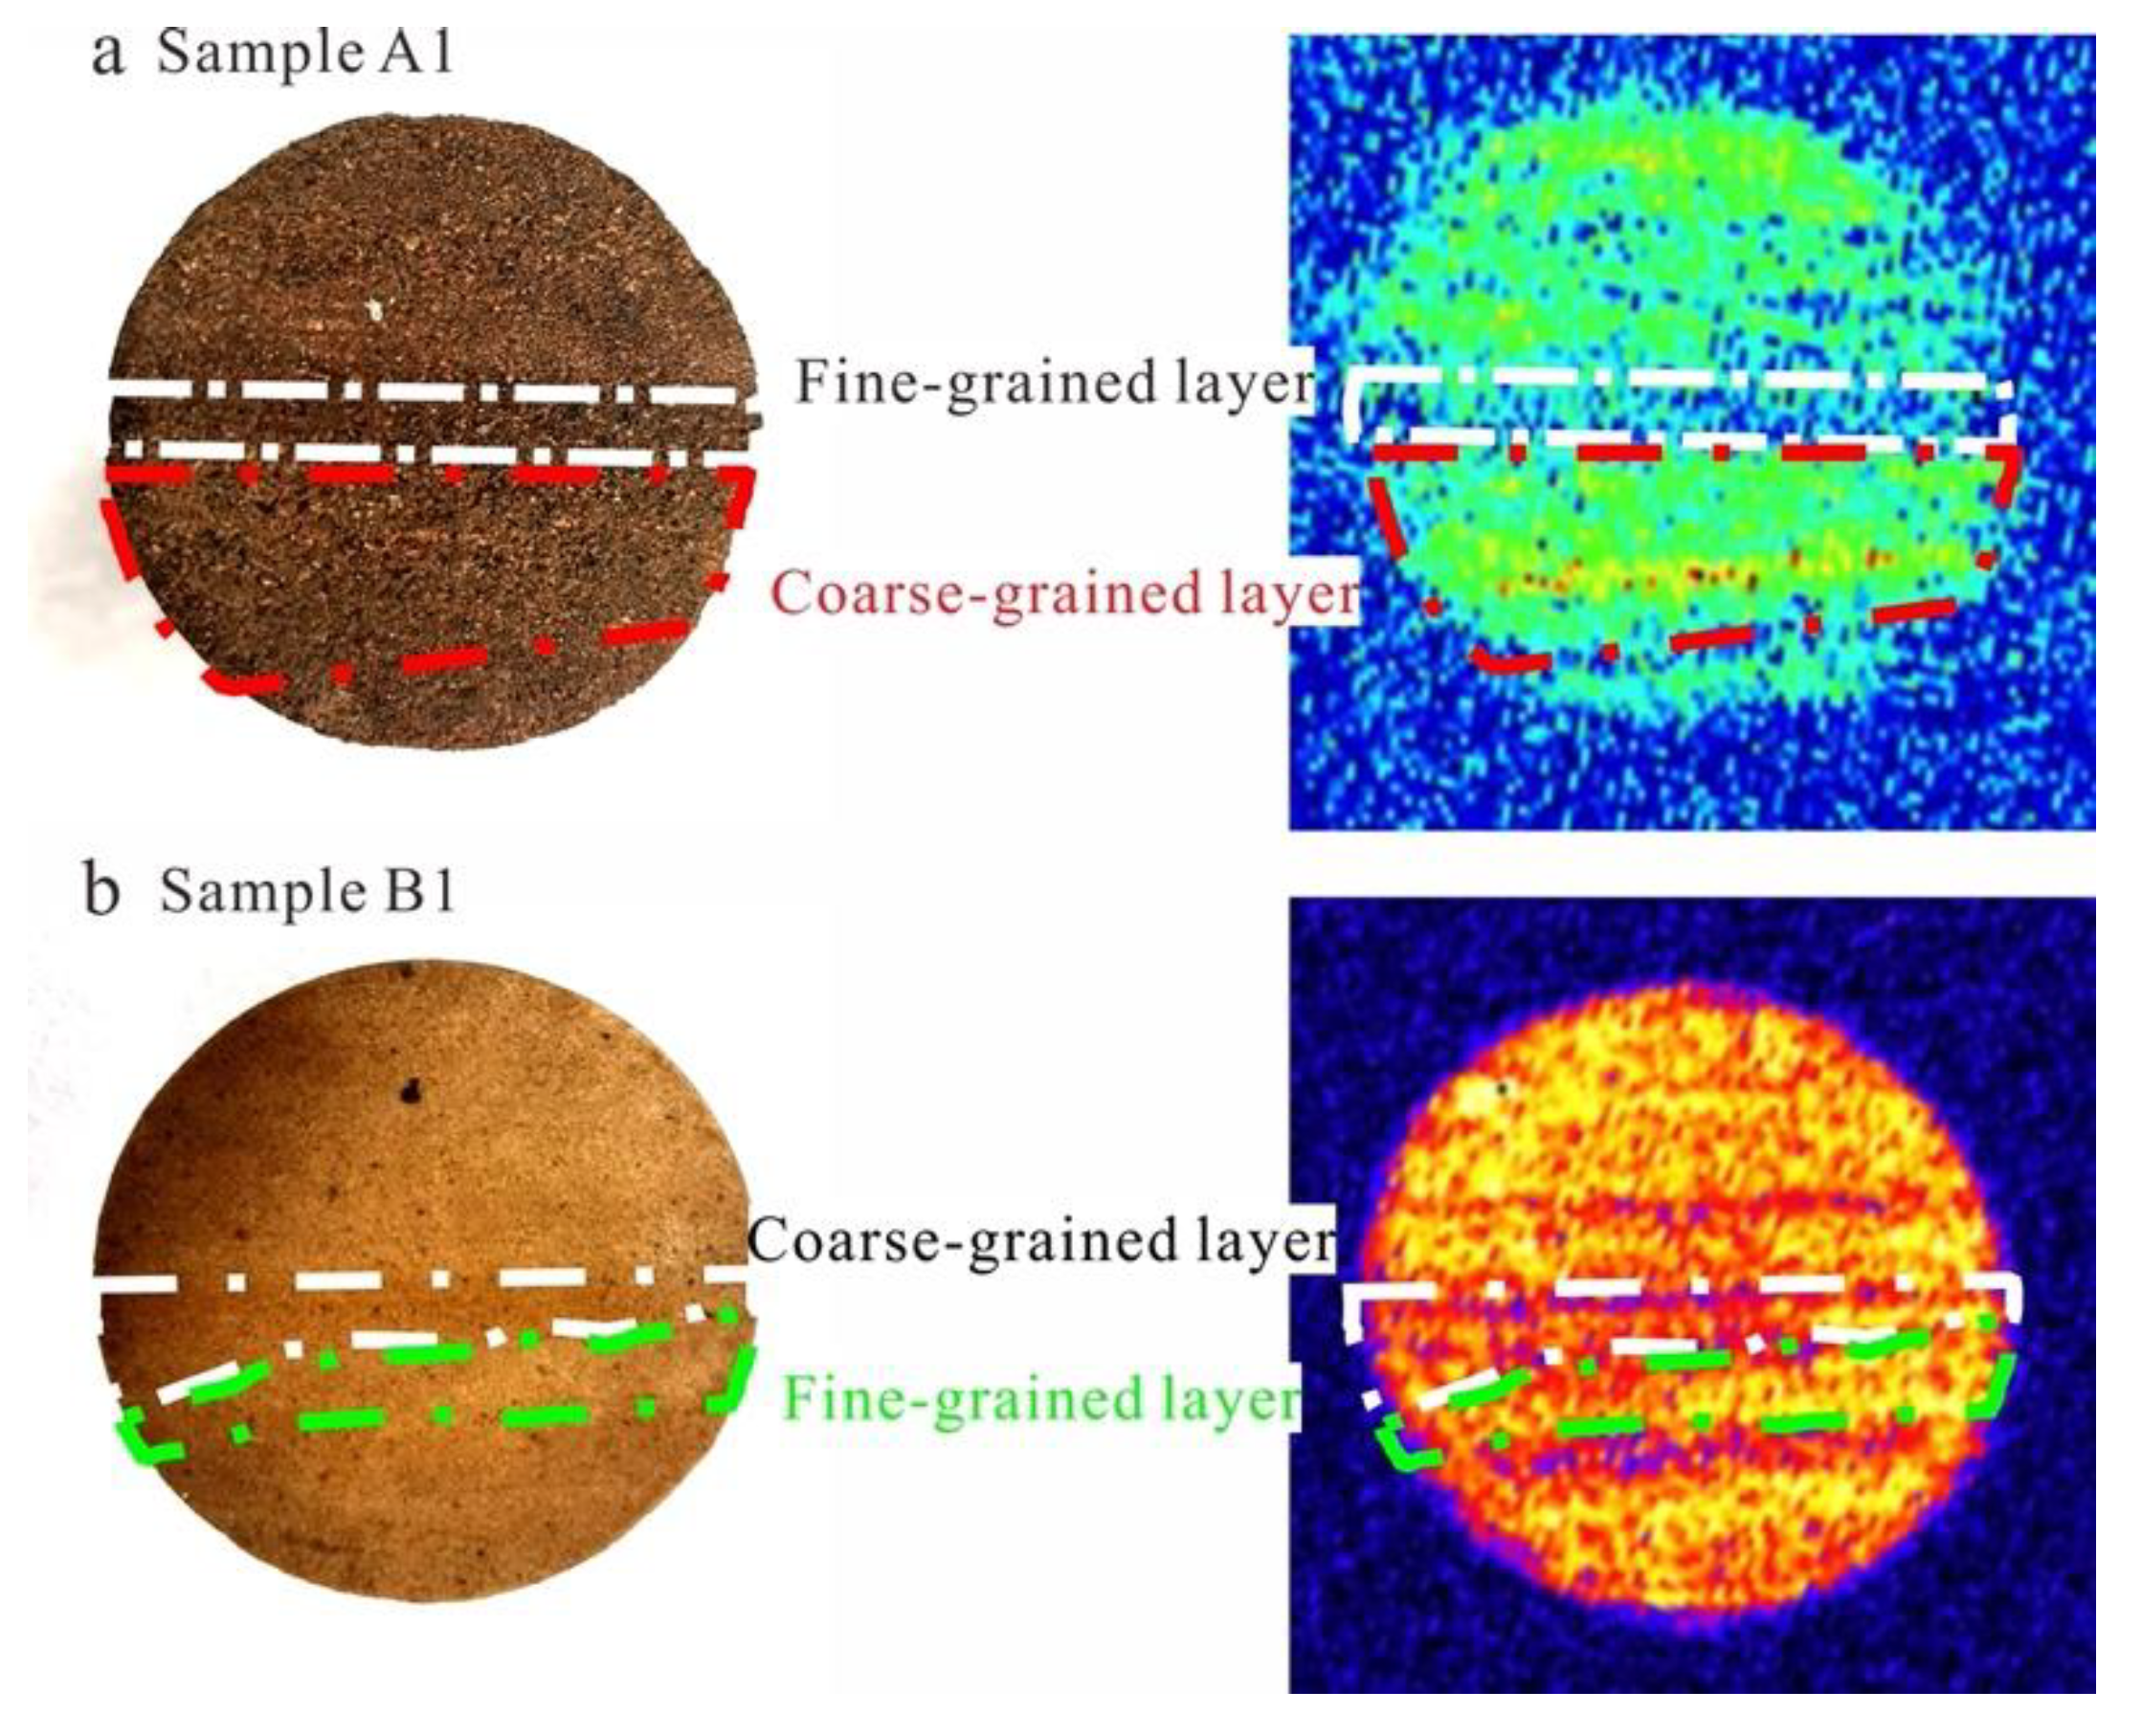
Based on the above experimental results, the layer structure and porosity had important influences on the migration and distribution of water in the samples. To study the layer structures more closely, the samples were subjected to NMR imaging. Figure 9a,b show images from the MRI of two Par samples: Samples A1 and B1, respectively. The coarse layers and fine layers of the samples can be clearly seen in the imaging results.
4.2. Pore Structure Observed in Cast Thin Sections
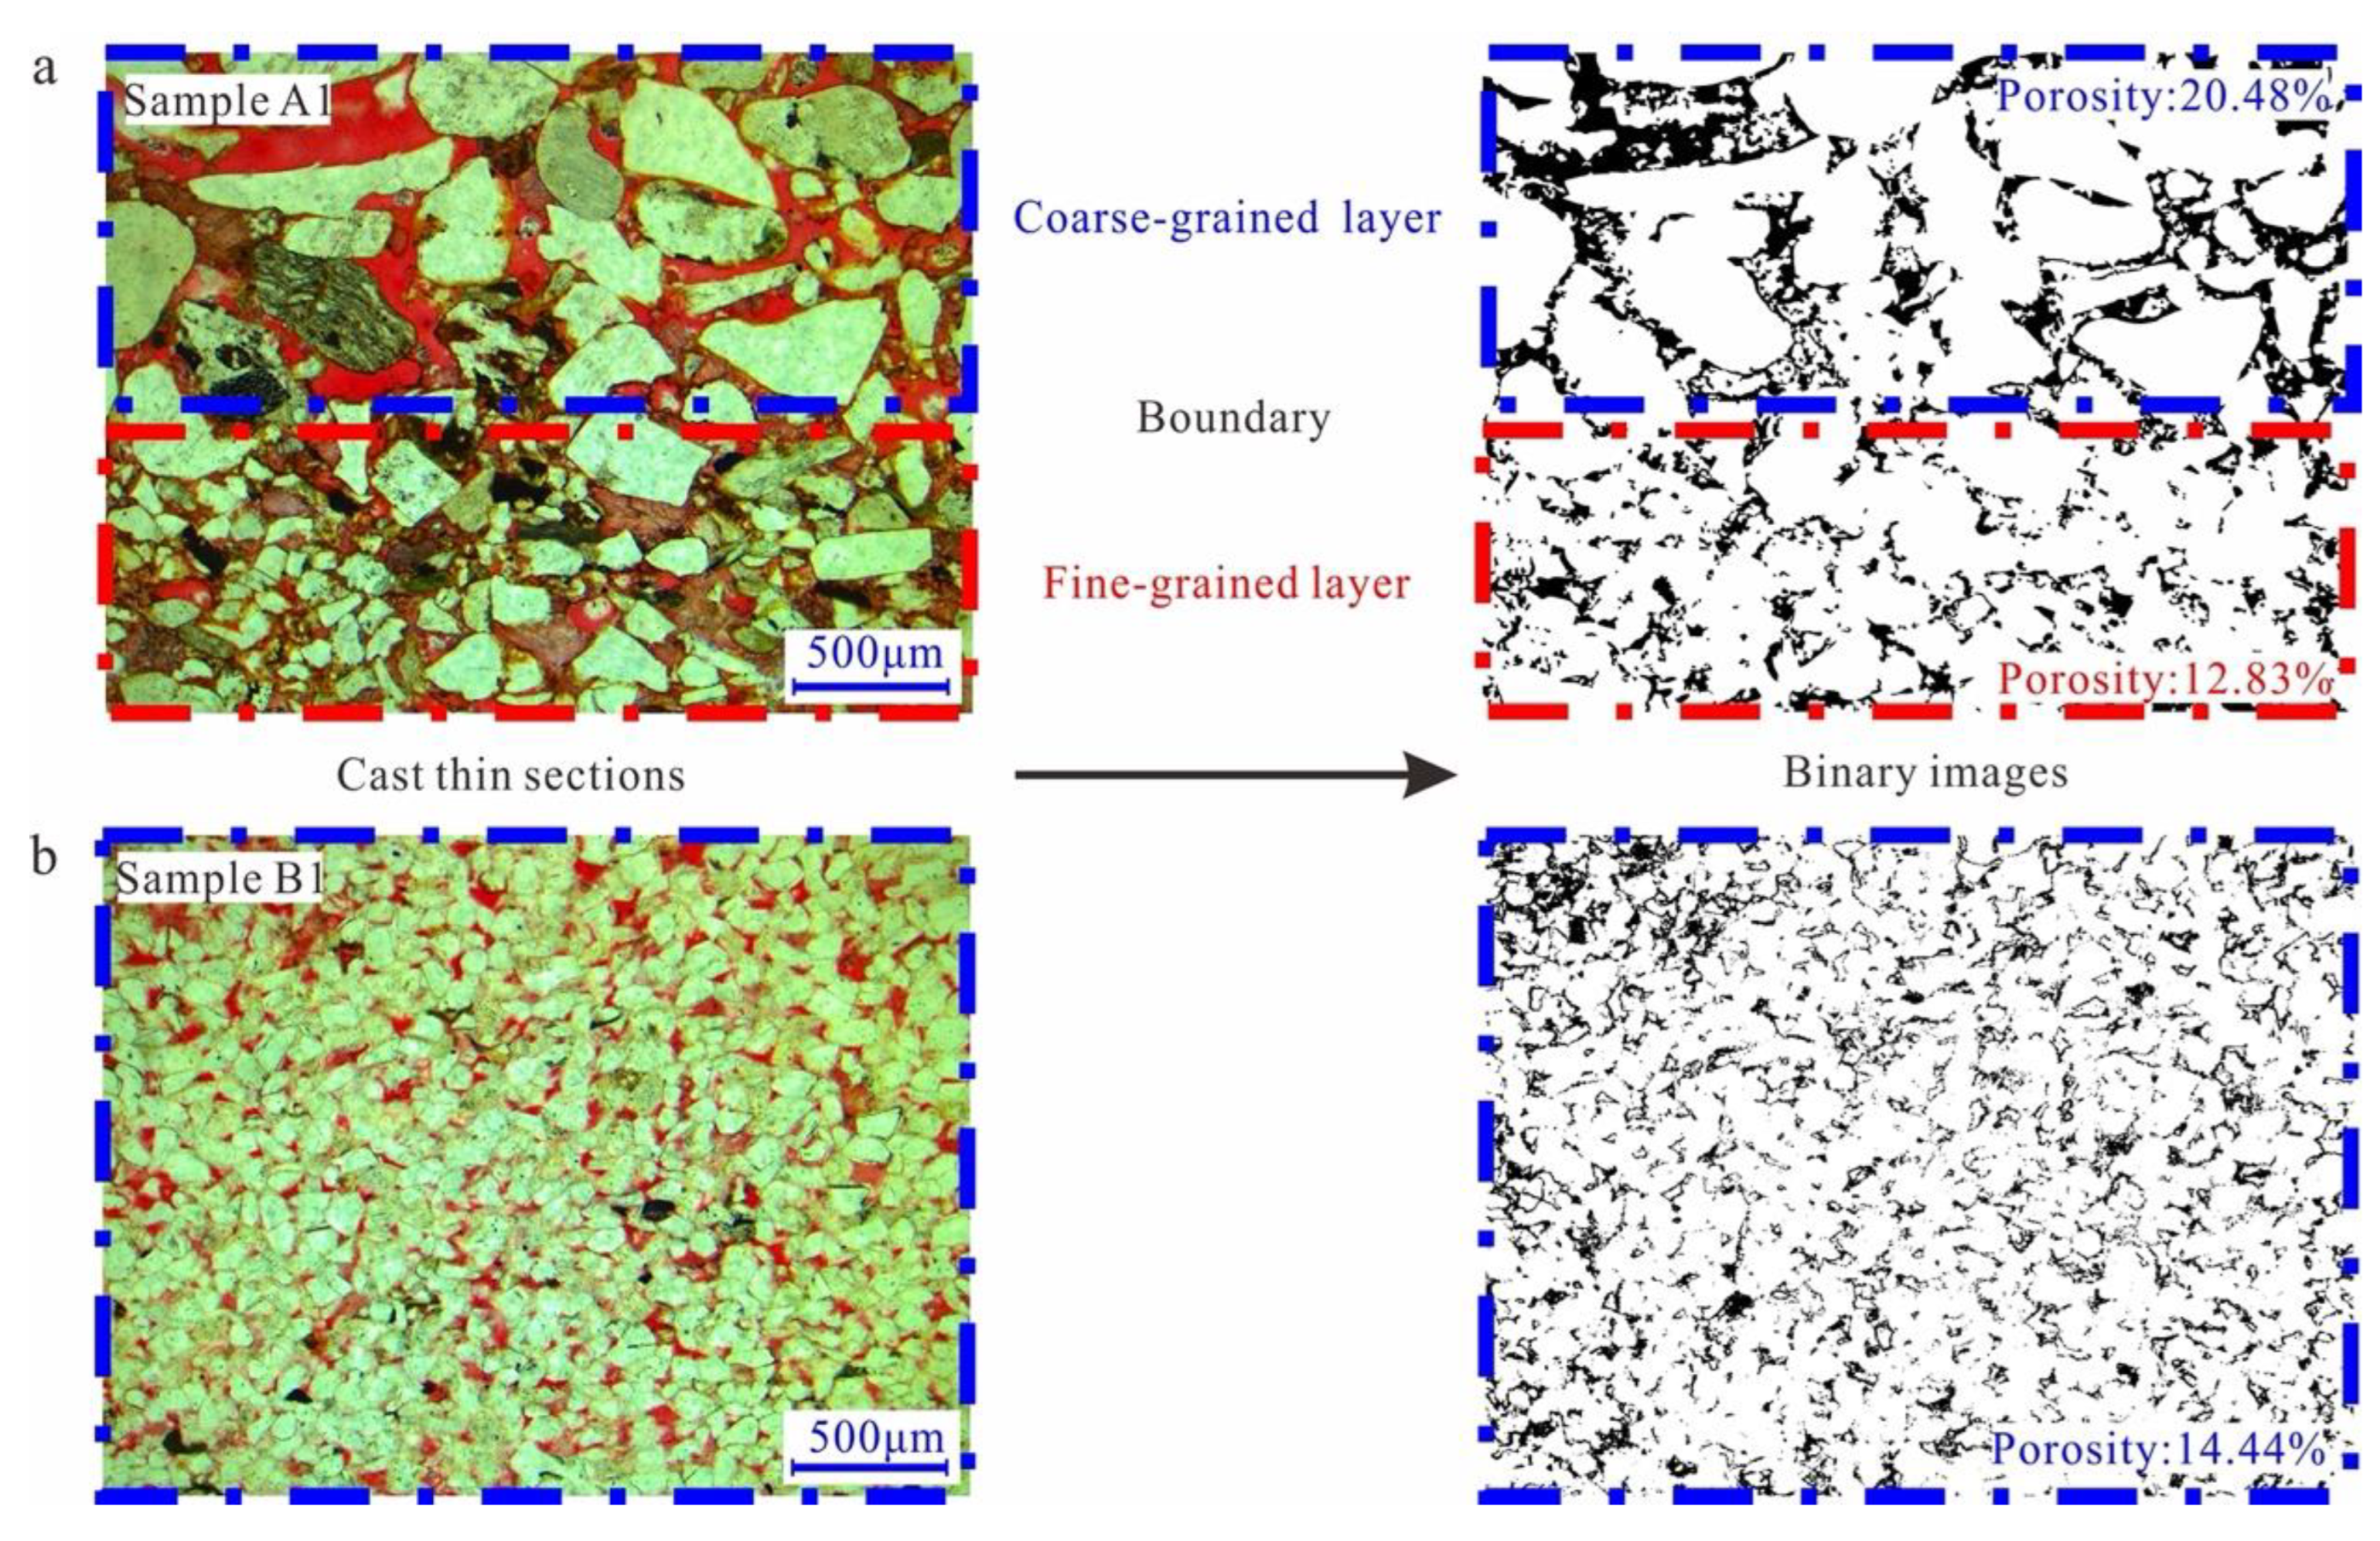
The sandstone samples exhibited a layer structure at the macroscopic scale, which was reflected in different particle arrangements at the microscopic scale. Thus, the samples were cast into thin sections and then observed under the microscope (Figure 10). In the Par sample with well-developed bedding (Sample A1), the difference between the coarse-grained and fine-grained layers was more obvious. In the coarse-grained layer, the quartz particles were mostly angular, less filled with fine grains, and the structure generally showed support from the particles, with large inter-granular voids and good connectivity. There were obvious boundaries between the fine-grained and coarse-grained layers. The mineral particles in the fine-grained layer were mainly sub-angular and the support particles formed a mosaic-like structure, resulting in a significant reduction in pore volume and pore connectivity. The result was processed to obtain a binarized image. Figure 10 shows that the radius of the capillary channels within the coarse-grained layer was larger than those in the fine-grained layer. According to the binarization results, the porosity of the coarse-grained layer was 20.48% and that of the fine-grained layer was 12.83%. For the Par sample with poorly developed bedding (Sample B1), there was no significant difference between the coarse-grained and fine-grained layers. The quartz grains were similar in size and their shapes were mostly sub-angular. A binarized image was obtained after processing, which indicated a porosity of 14.44%.
According to the positive correlation between porosity and permeability [81,82], the pore connectivity of the coarse-grained layer is significantly higher than that of the fine-grained layer. In addition, due to the directivity of mineral grains during sedimentation [83], pore connectivity is usually better along the bedding plane than perpendicular to the bedding plane.
5. Discussion
The major phenomena observed during the capillary imbibition experiments in this study are as follows: (1) the layer structure had a significant effect on the capillary imbibition process by altering water-absorption rate and water redistribution mode; (2) vapor diffused and condensed to fill partial micropores and adsorb on surface of pores ahead of the water absorption front, which was more obvious in samples with well-developed beddings; (3) in the Per sample, internal water migration lagged behind superficial water migration, which was longer in sandstones with well-developed beddings. The mechanisms behind the above phenomena were interpreted by addressing the effects of the pore/layer structure on the water migration process.
5.1. Basic Theories of Capillary Rise in a Tube and Calculation of the Equivalent Radius
When capillary water migrates upward along a tube with a radius of a, based on the law of conservation of momentum, the following equation of motion for the fluid in the tube is obtained [84]:
The solution of this equation was given by Bosanquet [85] as
where z is the height of capillary front from initial height, is the initial height, is the surface tension, a is the tube radius, is the coefficient of the term representing the inertia of fluid in reservoir, is the mass density, is the contact angle, and t represents the time. When the capillary tube is long enough and the flow approaches the Poiseuille flow, as was the case in this study, Equation (3) will reduce to the Lucas–Washburn formula [41]:
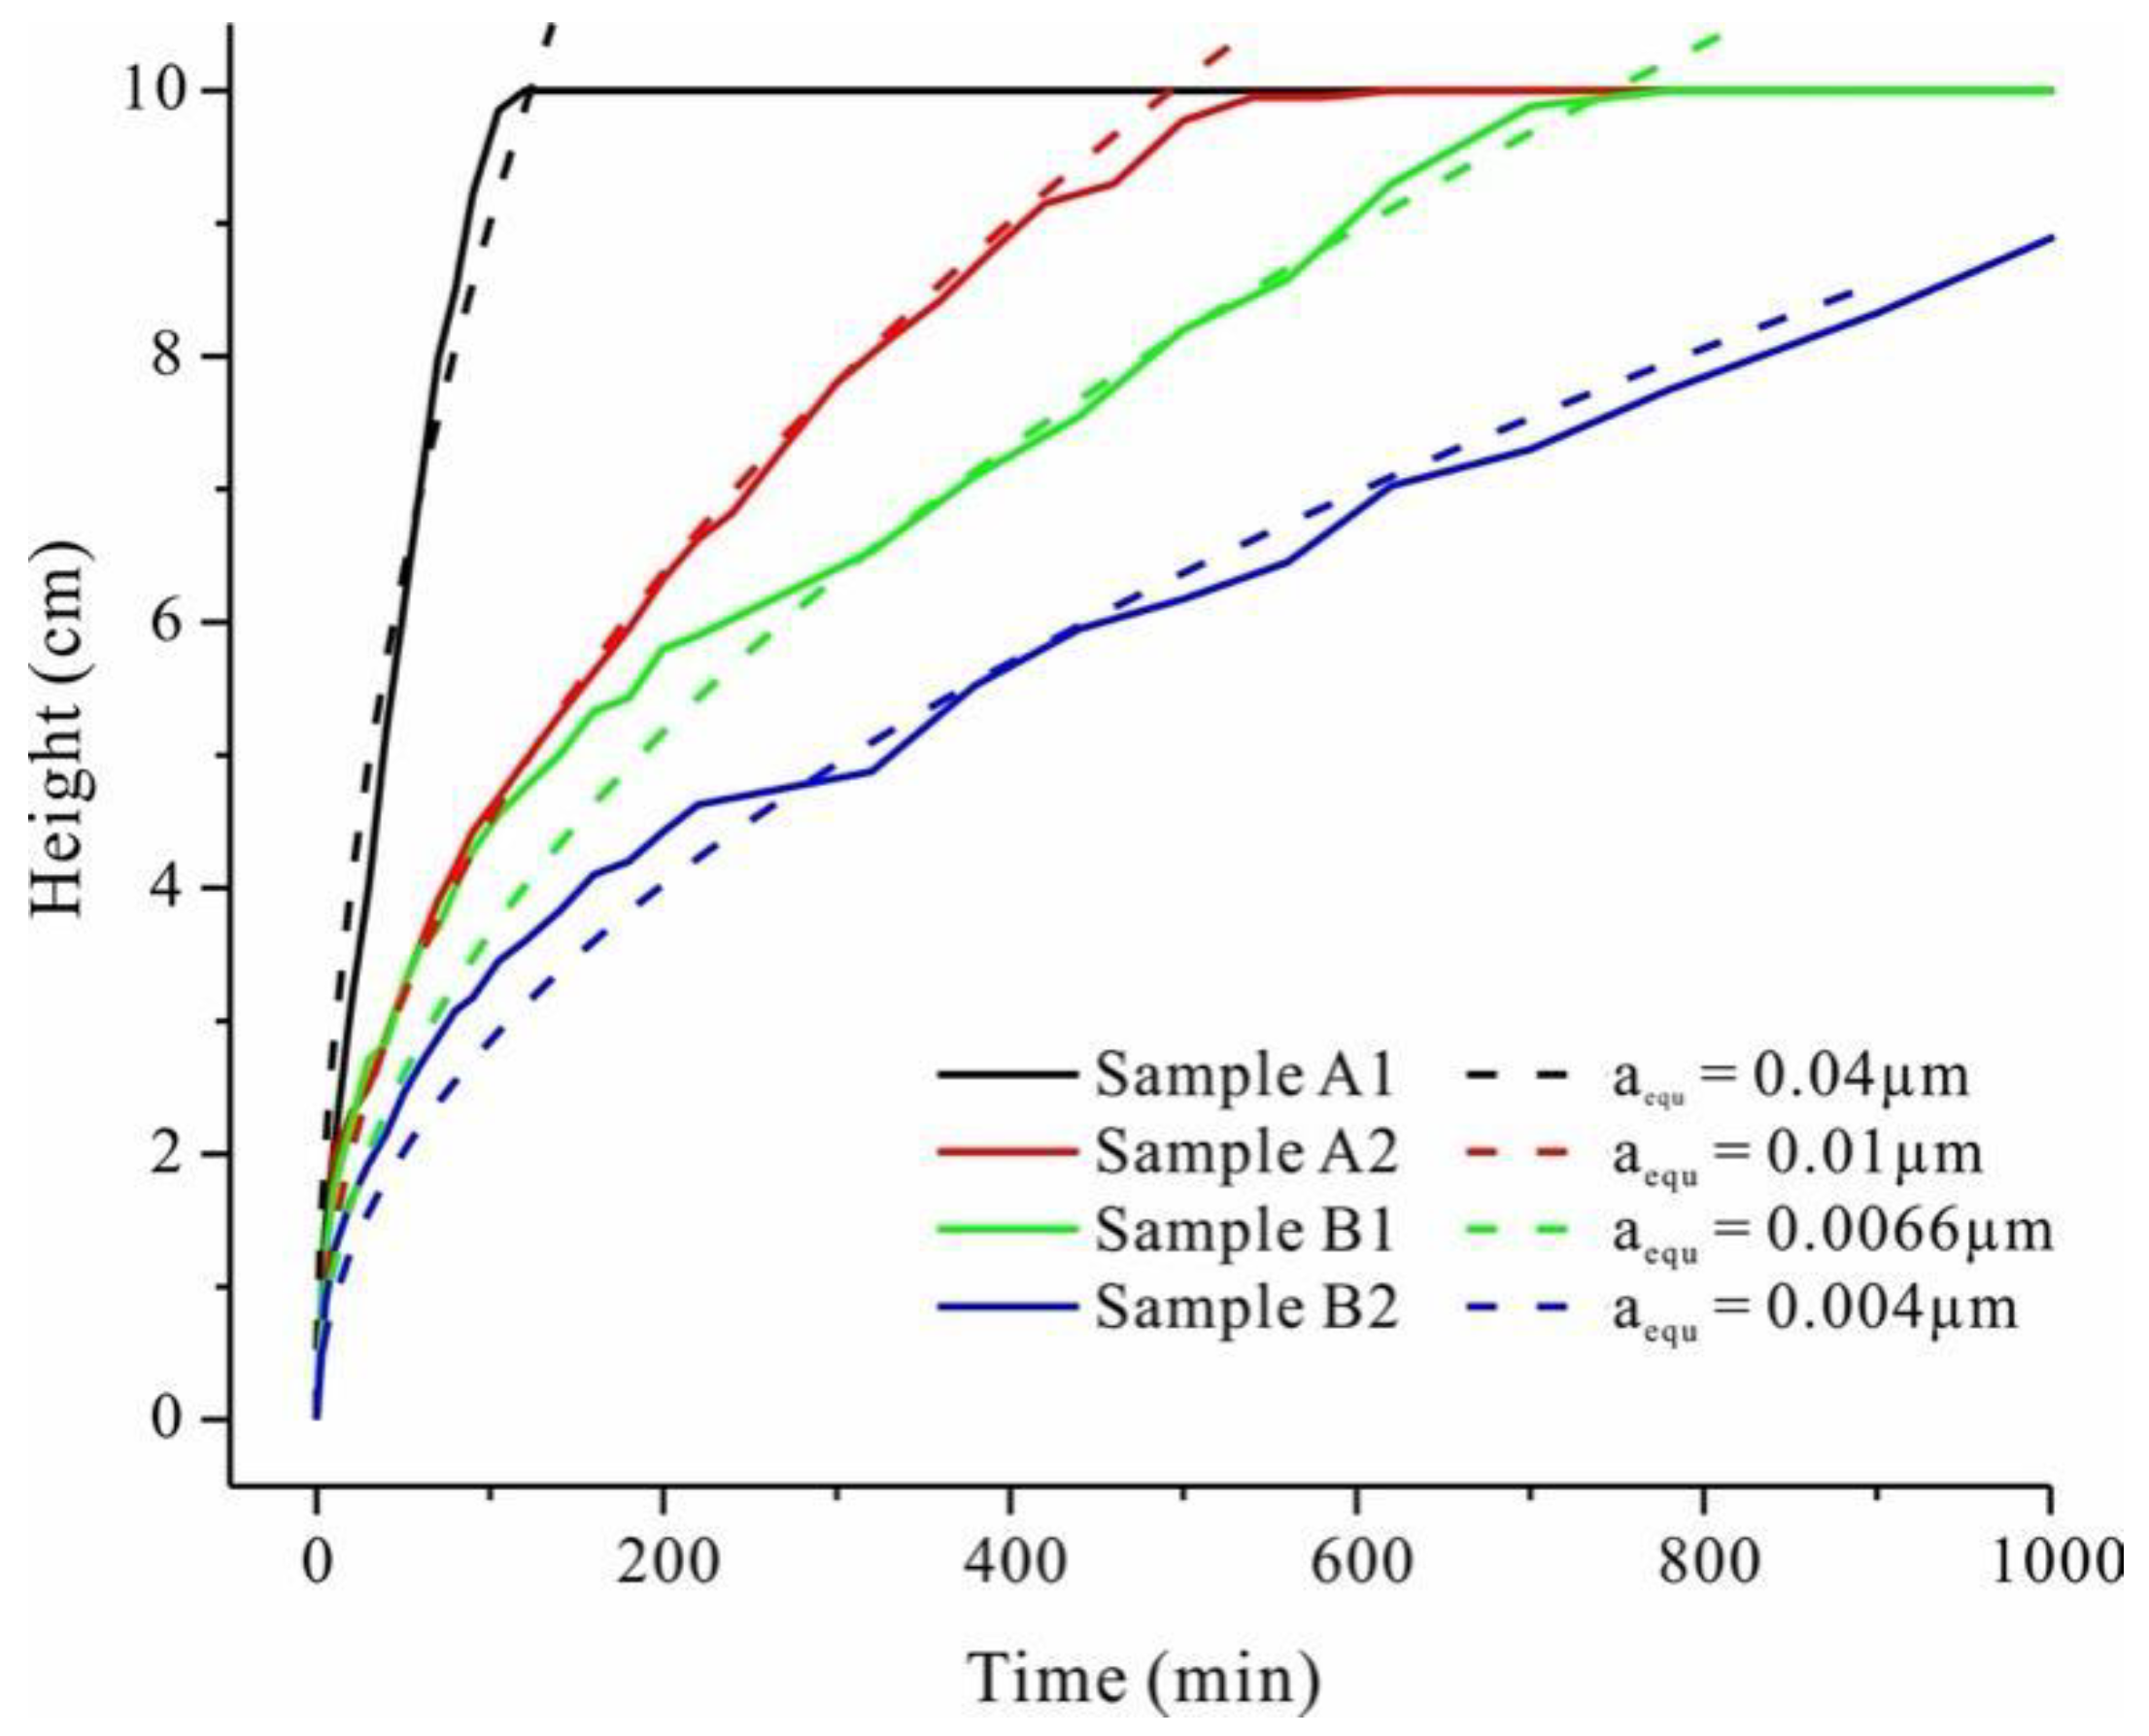
Using Equation (4), assuming , the curves of z vs. t with different tube radii can be obtained. Parameters used in the calculation are as follows: σ is the surface tension (at 25 °C, [86]; η is the coefficient of viscosity (at 25 °C, ) [87]; ρ is the mass density of water ( ); θ is the contact angle (between water and quartz, ) [88].
By approximating the tested z vs. t curves with the calculated curves, an equivalent radius of each sample could be obtained (Figure 11). As we expected, the equivalent radius was larger along the bedding plane than perpendicular to the bedding plane, which is consistent with the results from direct observation with the cast thin sections in Figure 10. The equivalent radii in sandstones with well-developed bedding were much larger than those with poorly developed bedding.
5.2. Interpretating the Effects of the Bedding Plane on Moisture Migration with the Representative Pore-Structure Element
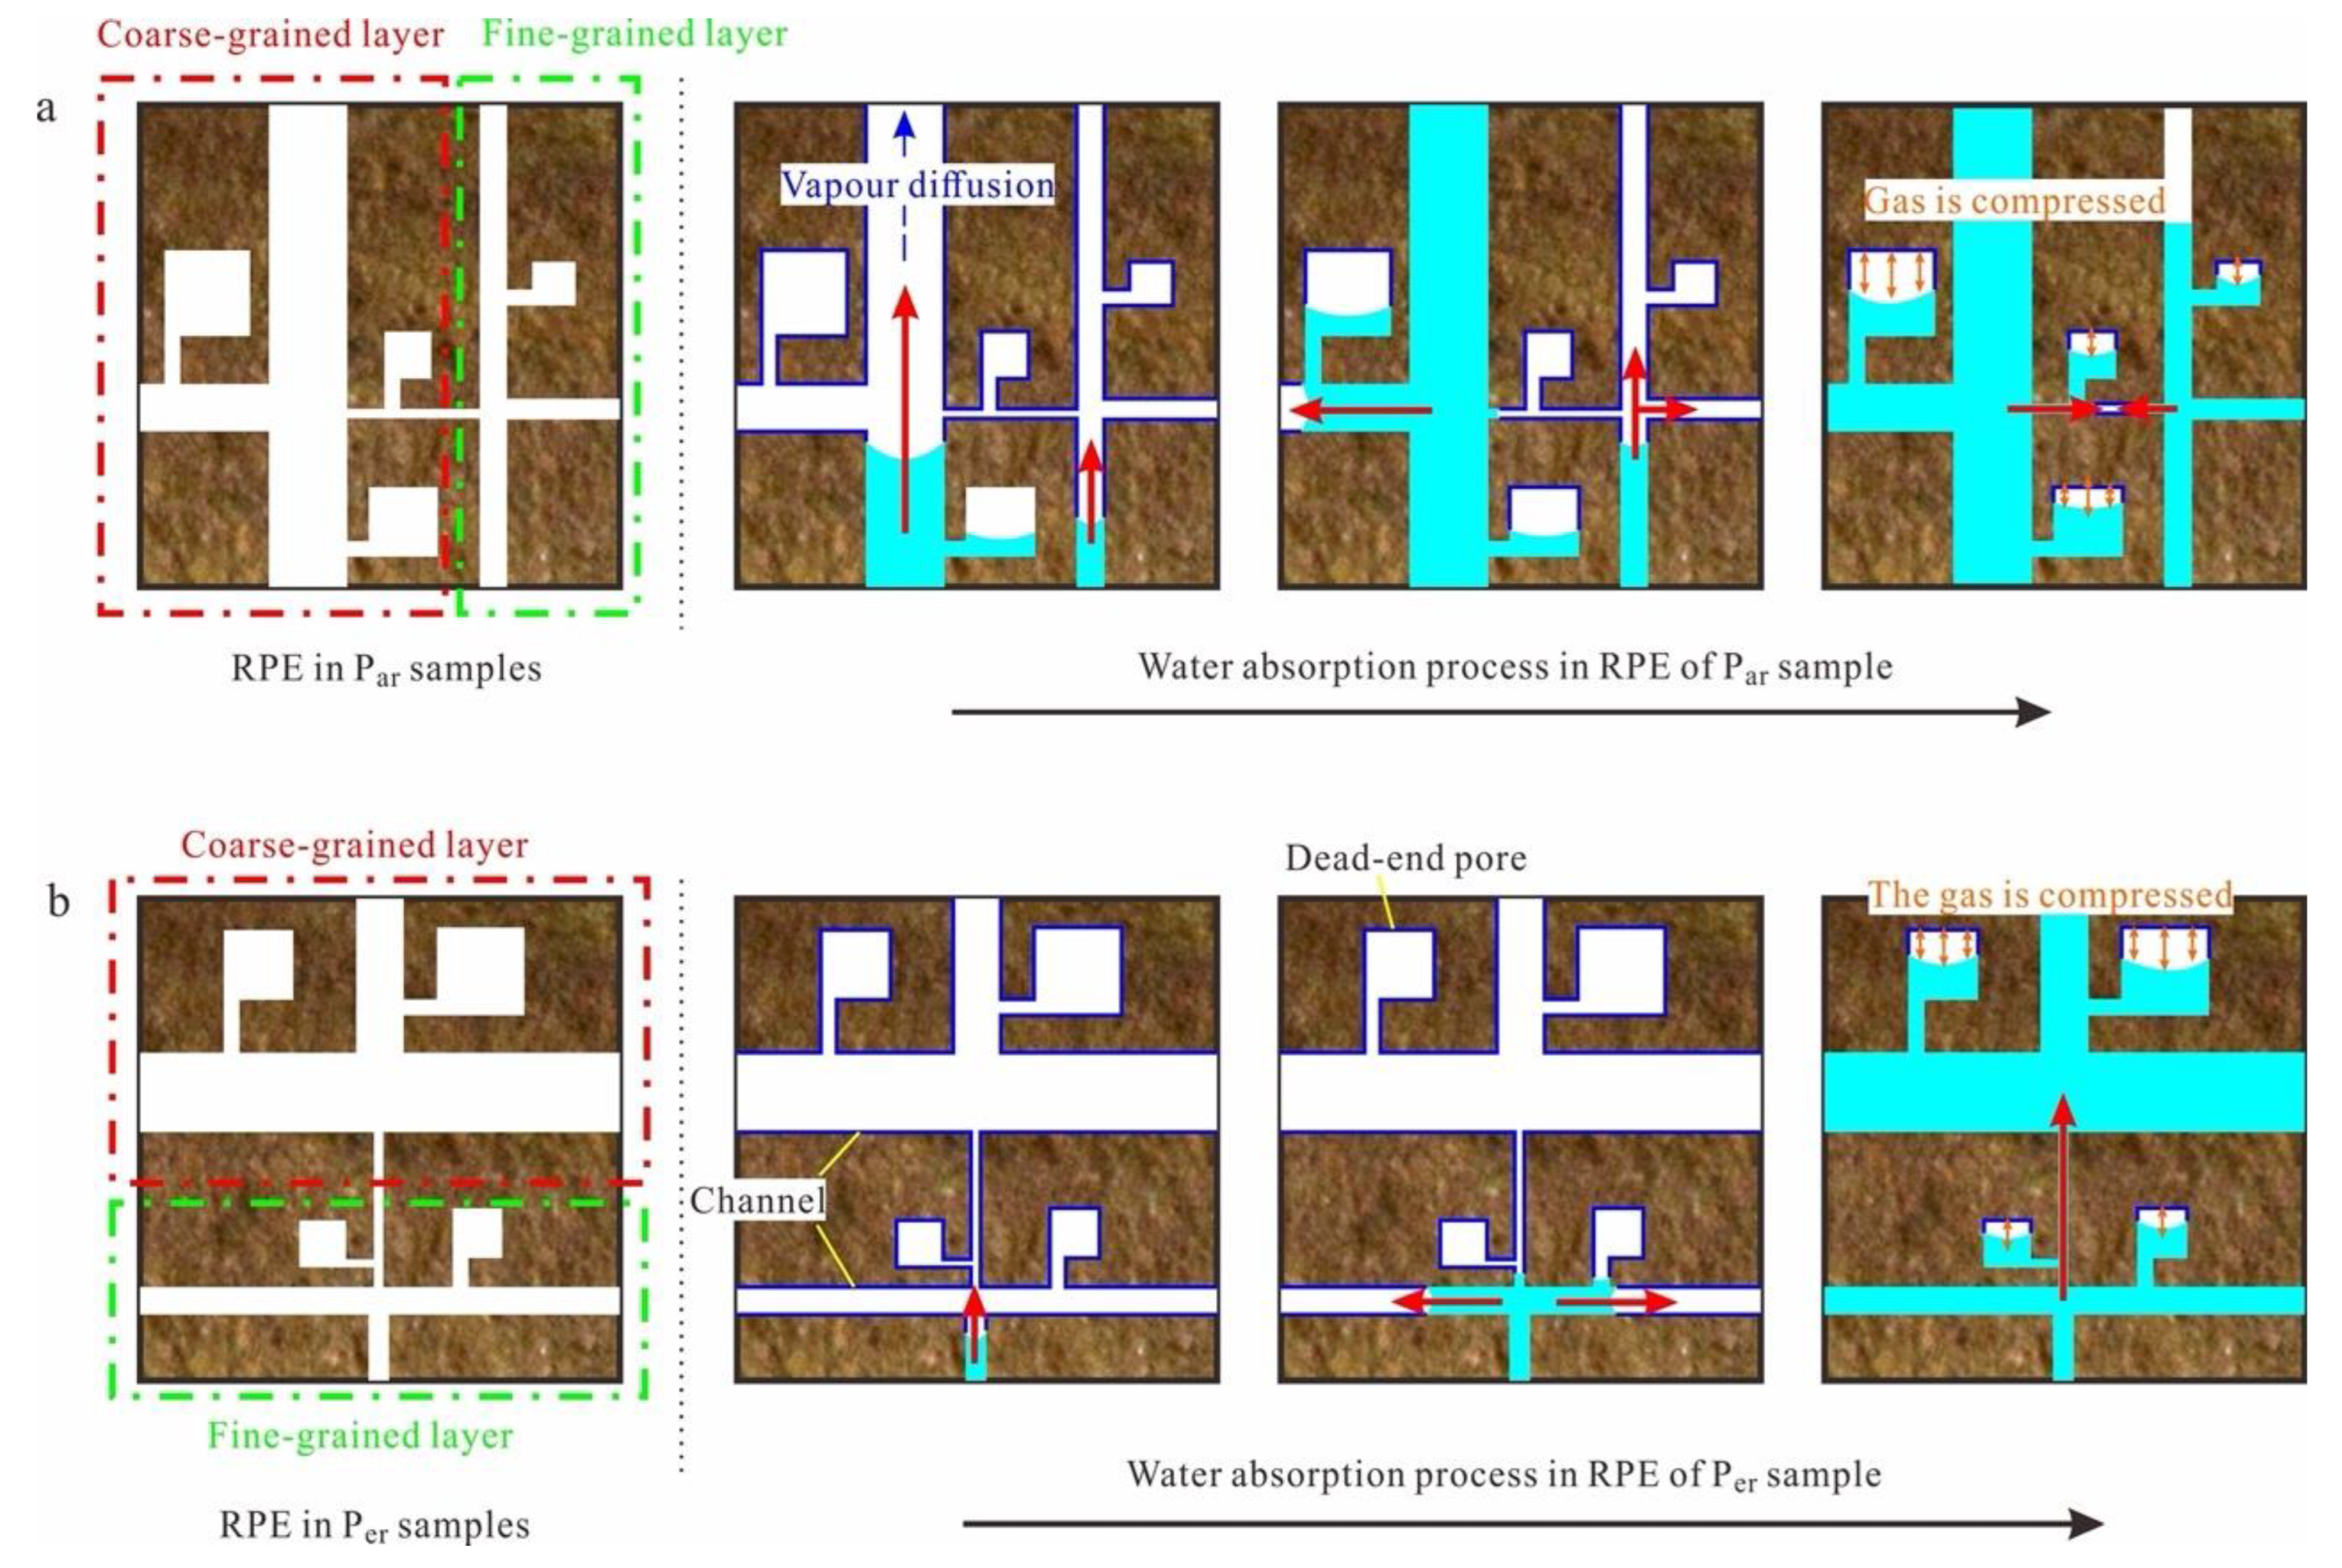
Based on the direct observation of pore structure of layered sandstone samples and calculation of the equivalent radii of samples, we propose the concept of the representative pore-structure element (RPE). An RPE consists of primary capillary channels (both parallel and perpendicular to the bedding plane) embedded in coarse-grained layers, secondary capillary channels embedded in fine-grained layers, and dead-end pores connected to the channels. The sizes of capillaries that develop in parallel to the bedding are larger than at other directions (but of the same magnitude as shown in Figure 11) in one layer (Figure 12). Accordingly, the layer structure of sandstone can be simplified as a combination of numerous RPEs.
By differentiating Equation (4) with t, the rising velocity of capillary water in a tube can be obtained:
As indicated by Equation (5), correlates positively with the radius of the tube a. This correlation stipulates one of the water migration laws in the RPE that water migrates faster in primary capillary channels. Furthermore, when water migration front reaches the branching point, the capillary competition effect should be taken into account, which says water will flow in both branches when sizes of branches are close to that of the root tube but will flow primarily in the narrow branch when the thick branch is larger than the root tube [58]. The water migration process in the RPEs of Par and Per samples are deduced below, following the above migration laws.
In the RPEs of the Par samples, water migrated primarily upwards in larger channels within coarse-grained layers, and upward migration in fine-grained layer was slower. Meanwhile, horizontal water movement in the form of both intra-layer and inter-layer migration was slower than upward migration. Intra-layer horizontal migration in coarse-grained layers was faster than in fine-grained layers as well. Inter-layer horizontal migration from coarse-grained layers to adjacent fine-grained layers may also have occurred. As the water-migration front reached the top of the samples, water migration continued by entering the dead-end pores until pore gas pressure balanced the driving pressure of water migration. The average water-migration rate in the Par samples was mainly determined by the sizes of larger channels. Accordingly, the water-migration mode in Par samples can be simplified as follows: primary upward intra-layer migration followed by intra-layer horizontal migration and then inter-layer horizontal migration.
In the RPEs of the Per samples, horizontal water migration should have been dominant, since it moved along larger channels. Upward water migration was much slower, alternating between intra-layer and inter-layer migration. Due to the slow upward migration rate, there was sufficient time for water entering the dead-end pores. The average water-migration rate in the Per samples was mainly determined by the sizes of smaller channels. Accordingly, the water migration mode in the Per samples can be simplified as follows: primary intra-layer horizontal migration followed by intra-layer upward migration and then inter-layer horizontal migration.
Due to horizontal water migration, pore water at the center of samples was sucked out towards the surface. This suction effect was more significant in Per samples, because horizontal capillaries are the preferential channels for water migration. This explains why internal water migration lagged behind surface water migration and the time lag was longer in sandstones with well-developed beddings. Although prior researchers proposed that capillary imbibition in rocks exhibits features of direction-dependence [84], this study explains in detail the origination of direction-dependence.
Except for capillary movement along pore channels, water-vapor diffusion is an important part of the water-migration process that cannot be ignored; this is consistent with previous studies [89,90]. Ahead of the capillary water front, water vapor diffused to the particle surface, which is shown in blue lines in Figure 12. The driving force of vapor diffusion is the equilibrium tendency between a higher water vapor concentration and a lower one. The water diffusing on the pore walls favored capillary water migration; however, when the vapor condensed at the pore throat, the enclosed space hindered capillary water movement.
6. Conclusions
The following conclusions were obtained.
- (1)
- The layer structure had a significant effect on the capillary imbibition process by altering the water-absorption rate and water-redistribution mode. The water-migration rate along the axis of the cylindrical core was faster in the Par samples, which is evidenced by the variation in water-absorption mass and water height increase. The change of lightness on the top of the samples with time indicated different moisture-redistribution modes in Par samples and Per samples.
- (2)
- Vapor diffused and condensed to fill partial micropores and adsorb on the surface of pores ahead of the water-absorption front. This was more obvious in samples with well-developed bedding. The content of bound water as measured by NMR signals achieved stability before the visible water-absorption front reached the samples’ top; this was attributed to vapor diffusion and condensation above the capillary water front.
- (3)
- In Per sandstone, internal water migration lagged behind superficial water migration. This time lag was longer in sandstones with well-developed beddings. In the Per sample, variation in the NMR-derived height lagged behind the measured height.
- (4)
- According to the calculated results from the Lucas–Washburn equation, the equivalent radius was larger along the bedding plane than perpendicular to the bedding plane. Combining this with the direct observation of the pore structure of layered sandstone, we proposed the concept of the representative pore-structure element (RPE). Water migration in RPEs follows the migration laws in capillary stipulated by both the positive correlation between the pore radius and water-movement rate and the capillary competition effect.
- (5)
- Effects of the layer structure on moisture migration in sandstone were embedded in the different water-migration modes in Par and Per samples. The water-migration mode in Par samples can be simplified as primary upward intra-layer migration followed by intra-layer horizontal migration and then inter-layer horizontal migration. Meanwhile, the mode in Per samples can be simplified as primary intra-layer horizontal migration followed by intra-layer upward migration and then inter-layer horizontal migration.
Author Contributions
Conceptualization, H.J.; methodology, H.J. and B.D.; validation, B.D. and D.W.; formal analysis, H.J.; investigation, B.D., D.W. and Q.S.; resources, H.J.; data curation, Y.W.; writing—original draft preparation, B.D.; writing—review and editing, H.J. and Q.S.; visualization, B.D.; supervision, Y.W.; project administration, Y.W.; funding acquisition, H.J. All authors have read and agreed to the published version of the manuscript.
Funding
This research was funded by [the National Natural Science Foundation of China] grant number [Grant No. 42271148] And [Open Fund of State Key Laboratory of Road Engineering Safety and Health in Cold and High-Altitude Regions] grant number [Grant No. YGY2021KFKT02].
Data Availability Statement
The datasets generated during and/or analyzed during the current study are available from the corresponding author upon reasonable request.
Acknowledgments
Special thanks go to editors and three anonymous reviewers.
Conflicts of Interest
The authors declare that they have no known competing financial interests or personal relationships that could have appeared to influence the work reported in this paper.
References
- Chen, X.; He, P.; Qin, Z. Strength Weakening and energy mechanism of rocks subjected to wet–Dry cycles. Geotech. Geol. Eng. 2019, 37, 3915–3923. [Google Scholar] [CrossRef]
- Hall, K.; Hall, A. Weathering by wetting and drying: Some experimental results. Earth Surf. Process. Landf. 1996, 21, 365–376. [Google Scholar] [CrossRef]
- Jiang, Q.; Deng, H.; Li, J.; Luo, Z.; Assefa, E.; Fang, J.; Xiao, Y. The degradation effect and mechanism by water-rock interaction in the layered sandstone in the Three Gorges reservoir area. Arab. J. Geosci. 2019, 12, 1–11. [Google Scholar] [CrossRef]
- Nishiyama, N.; Yokoyama, T.; Takeuchi, S. Size distributions of pore water and entrapped air during drying infiltration processes of sandstone characterized by water expulsion porosimetry. Water Resour. Res. 2012, 48. [Google Scholar] [CrossRef]
- Ni, H.; Zhang, L.; Zhang, D.; Wu, X.; Fu, X. Weathering of Pisha-sandstones in the wind-water erosion crisscross region on the Loess Plateau. J. Mt. Sci. 2008, 5, 340–349. [Google Scholar] [CrossRef]
- Shi, Q.; Cui, S.; Wang, S.; Mi, Y.; Sun, Q.; Wang, S.; Yu, J. Experiment study on CO2 adsorption performance of thermal treated coal: Inspiration for CO2 storage after underground coal thermal treatment. Energy 2022, 254, 124392. [Google Scholar] [CrossRef]
- Van der Hoven, S.J.; Solomon, D.K.; Moline, G.R. Modeling unsaturated flow and transport in the saprolite of fractured sedimentary rocks: Effects of periodic wetting and drying. Water Resour. Res. 2003, 39. [Google Scholar] [CrossRef]
- Zhang, D.; Chen, A.; Wang, X.; Liu, G. Quantitative determination of the effect of temperature on mudstone decay during wet–dry cycles: A case study of ‘purple mudstone’from south-western China. Geomorphology 2015, 246, 1–6. [Google Scholar] [CrossRef]
- Zhao, F.; Sun, Q.; Zhang, W. Combined effects of salts and wetting–drying cycles on granite weathering. Bull. Eng. Geol. Environ. 2020, 79, 3707–3720. [Google Scholar] [CrossRef]
- Boumaiza, L.; Chesnaux, R.; Walter, J.; Stumpp, C. Assessing groundwater recharge and transpiration in a humid northern region dominated by snowmelt using vadose-zone depth profiles. Hydrogeol. J. 2020, 28, 2315–2329. [Google Scholar] [CrossRef]
- Du, C.; Yu, J.; Wang, P.; Zhang, Y. Analysing the mechanisms of soil water and vapor transport in the desert vadose zone of the extremely arid region of northern China. J. Hydrol. 2018, 558, 592–606. [Google Scholar] [CrossRef]
- Grinevskii, S.O. Modeling root water uptake when calculating unsaturated flow in the vadose zone and groundwater recharge. Mosc. Univ. Geol. Bull. 2011, 66, 189–201. [Google Scholar] [CrossRef]
- Larsbo, M.; Roulier, S.; Stenemo, F.; Kasteel, R.; Jarvis, N. An improved dual-permeability model of water flow and solute transport in the vadose zone. Vadose Zone J. 2005, 4, 398–406. [Google Scholar] [CrossRef]
- Stephens, D.B.; Kron, A.J.; Kron, A. Vadose Zone Hydrology; CRC Press: Boca Raton, FL, USA, 2018. [Google Scholar] [CrossRef]
- Zeng, Y.; Wan, L.; Su, Z.; Saito, H.; Huang, K.; Wang, X. Diurnal soil water dynamics in the shallow vadose zone (field site of China University of Geosciences, China). Environ. Geol. 2009, 58, 11–23. [Google Scholar] [CrossRef]
- Karagiannis, N.; Karoglou, M.; Bakolas, A.; Krokida, M.; Moropoulou, A. Drying kinetics of building materials capillary moisture. Constr. Build. Mater. 2017, 137, 441–449. [Google Scholar] [CrossRef]
- Stück, H.L.; Platz, T.; Müller, A.; Siegesmund, S. Natural stones of the Saale–Unstrut Region (Germany): Petrography and weathering phenomena. Environ. Earth Sci. 2018, 77, 1–29. [Google Scholar] [CrossRef]
- Yang, L.; Gao, D.; Zhang, Y.; Tang, J.; Li, Y. Relationship between sorptivity and capillary coefficient for water absorption of cement-based materials: Theory analysis and experiment. R. Soc. Open Sci. 2019, 6, 190112. [Google Scholar] [CrossRef]
- Beck, K.; Al-Mukhtar, M.; Rozenbaum, O.; Rautureau, M. Characterization, water transfer properties and deterioration in tuffeau: Building material in the Loire valley—France. Build. Environ. 2003, 38, 1151–1162. [Google Scholar] [CrossRef]
- El-Badry, A. Deterioration mechanisms affecting the bricks used in the building of the water wells at karnak temples, luxor, egypt. Egypt. J. Archaeol. Restor. Stud. 2019, 9, 13–25. [Google Scholar]
- Liu, X.; Meng, H.; Wang, Y.; Katayama, Y.; Gu, J.D. Water is a critical factor in evaluating and assessing microbial colonization and destruction of Angkor sandstone monuments. Int. Biodeterior. Biodegrad. 2018, 133, 9–16. [Google Scholar] [CrossRef]
- Martínez-Martínez, J.; Pola, A.; García-Sánchez, L.; Reyes Agustin, G.; Osorio Ocampo, L.S.; Macías Vázquez, J.L.; Robles-Camacho, J. Building stones used in the architectural heritage of Morelia (México): Quarries location, rock durability and stone compatibility in the monument. Environ. Earth Sci. 2018, 77, 1–16. [Google Scholar] [CrossRef]
- Wang, K.; Xu, G.; Li, S.; Ge, C. Geo-environmental characteristics of weathering deterioration of red sandstone relics: A case study in Tongtianyan Grottoes, Southern China. Bull. Eng. Geol. Environ. 2018, 77, 1515–1527. [Google Scholar] [CrossRef]
- Wedekind, W.; Ruedrich, J.; Siegesmund, S. Natural building stones of Mexico–Tenochtitlán: Their use, weathering and rock properties at the Templo Mayor, Palace Heras Soto and the Metropolitan Cathedral. Environ. Earth Sci. 2011, 63, 1787–1798. [Google Scholar] [CrossRef]
- Zhang, J.; Li, Z.; Li, L.; Liu, J.; Liu, D.; Shao, M. Study on weathering mechanism of sandstone statues in Southwest China: Example from the sandstone of Niche of Sakyamuni Entering Nirvana at Dazu Rock Carvings. Nat. Hazards 2021, 108, 775–797. [Google Scholar] [CrossRef]
- Zhang, Y.; Zhang, Y.; Huang, J. Experimental study on capillary water absorption of sandstones from different grotto heritage sites in China. Herit. Sci. 2022, 10, 1–17. [Google Scholar] [CrossRef]
- Angeli, M.; Bigas, J.P.; Benavente, D.; Menéndez, B.; Hébert, R.; David, C. Salt crystallization in pores: Quantification and estimation of damage. Environ. Geol. 2007, 52, 205–213. [Google Scholar] [CrossRef]
- Cardenes, V.; Mateos, F.J.; Fernández-Lorenzo, S. Analysis of the correlations between freeze–thaw and salt crystallization tests. Environ. Earth Sci. 2014, 71, 1123–1134. [Google Scholar] [CrossRef]
- Oguchi, C.T.; Yu, S. A review of theoretical salt weathering studies for stone heritage. Prog. Earth Planet. Sci. 2021, 8, 1–23. [Google Scholar] [CrossRef]
- Cai, J.; Yu, B. A discussion of the effect of tortuosity on the capillary imbibition in porous media. Transp. Porous Media 2011, 89, 251–263. [Google Scholar] [CrossRef]
- Cai, J.; Yu, B.; Mei, M.; Luo, L. Capillary Rise in a Single Tortuous Capillary. Chin. Phys. Lett. 2010, 27, 054701. [Google Scholar] [CrossRef]
- Cai, J.; Yu, B.; Zou, M.; Luo, L. Fractal characterization of spontaneous co-current imbibition in porous media. Energy Fuels 2010, 24, 1860–1867. [Google Scholar] [CrossRef]
- Cai, J.; Jin, T.; Kou, J.; Zou, S.; Xiao, J.; Meng, Q. Lucas–Washburn equation-based modeling of capillary-driven flow in porous systems. Langmuir 2021, 37, 1623–1636. [Google Scholar] [CrossRef] [PubMed]
- Erickson, D.; Li, D.; Park, C.B. Numerical simulations of capillary-driven flows in nonuniform cross-sectional capillaries. J. Colloid Interface Sci. 2002, 250, 422–430. [Google Scholar] [CrossRef]
- Mosquera, M.J.; Rivas, T.; Prieto, B.; Silva, B. Capillary rise in granitic rocks: Interpretation of kinetics on the basis of pore structure. J. Colloid Interface Sci. 2000, 222, 41–45. [Google Scholar] [CrossRef] [PubMed]
- Grant, S.A.; Bachmann, J. Effect of temperature on capillary pressure. Geophys. Monogr.-Am. Geophys. Union 2002, 129, 199–212. [Google Scholar] [CrossRef]
- She, H.Y.; Sleep, B.E. The effect of temperature on capillary pressure-saturation relationships for air-water and perchloroethylene-water systems. Water Resour. Res. 1998, 34, 2587–2597. [Google Scholar] [CrossRef]
- Wilkinson, G.E.; Klute, A. The temperature effect on the equilibrium energy status of water held by porous media. Soil Sci. Soc. Am. J. 1960, 26, 535–540. [Google Scholar] [CrossRef]
- Arbatan, T.; Shen, W. Measurement of the surface tension of liquid marbles. Langmuir 2011, 27, 12923–12929. [Google Scholar] [CrossRef]
- Bell, J.M.; Cameron, F.K. The flow of liquids through capillary spaces. J. Phys. Chem. 2002, 10, 658–674. [Google Scholar] [CrossRef]
- Lucas, R. Rate of capillary ascension of liquids. Kolloid Z. 1918, 23, 15–22. [Google Scholar] [CrossRef]
- Washburn, E.W. The dynamics of capillary flow. Phys. Rev. 1921, 17, 273. [Google Scholar] [CrossRef]
- Dullien, F.A.L. Porous Media: Fluid Transport and Pore Structure; Academic Press: New York, NY, USA, 1979; pp. 291–300. [Google Scholar]
- Hammecker, C.; Jeannette, D. Modelling the capillary imbibition kinetics in sedimentary rocks: Role of petrographical features. Transp. Porous Media 1994, 17, 285–303. [Google Scholar] [CrossRef]
- Hammecker, C.; Mertz, J.D.; Fischer, C.; Jeannette, D. A geometrical model for numerical simulation of capillary imbibition in sedimentary rocks. Transp. Porous Media 1993, 12, 125–141. [Google Scholar] [CrossRef]
- Levine, S.; Lowndes, J.; Reed, P. Two-phase fluid flow and hysteresis in a periodic capillary tube. J. Colloid Interface Sci. 1980, 77, 253–263. [Google Scholar] [CrossRef]
- Leventis, A.; Verganelakis, D.A.; Halse, M.R.; Webber, J.B.; Strange, J.H. Capillary imbibition and pore characterisation in cement pastes. Transp. Porous Media 2000, 39, 143–157. [Google Scholar] [CrossRef]
- Szekely, J.; Neumann, A.W.; Chuang, Y.K. The rate of capillary penetration and the applicability of the Washburn equation. J. Colloid Interface Sci. 1971, 35, 273–278. [Google Scholar] [CrossRef]
- Mason, G.; Morrow, N.R. Capillary behavior of a perfectly wetting liquid in irregular triangular tubes. J. Colloid Interface Sci. 1991, 141, 262–274. [Google Scholar] [CrossRef]
- Mason, G.; Morrow, N.R. Effect of contact angle on capillary displacement curvatures in pore throats formed by spheres. J. Colloid Interface Sci. 1994, 168, 130–141. [Google Scholar] [CrossRef]
- Turian, R.M.; Kessler, F.D. Capillary flow in a noncircular tube. AIChE J. 2000, 46, 695–706. [Google Scholar] [CrossRef]
- Li, C.; Shen, Y.; Ge, H.; Yang, Z.; Su, S.; Ren, K.A.I.; Huang, H. Analysis of capillary rise in asymmetric branch-like capillary. Fractals 2016, 24, 1650024. [Google Scholar] [CrossRef]
- Benavente, D.; Lock, P.; Ángeles García Del Cura, M.; Ordóñez, S. Predicting the capillary imbibition of porous rocks from microstructure. Transp. Porous Media 2002, 49, 59–76. [Google Scholar] [CrossRef]
- Doyen, P.M. Permeability, conductivity, and pore geometry of sandstone. J. Geophys. Res. Solid Earth 1988, 93, 7729–7740. [Google Scholar] [CrossRef]
- Yu, B.; Cheng, P. A fractal permeability model for bi-dispersed porous media. Int. J. Heat Mass Transf. 2002, 45, 2983–2993. [Google Scholar] [CrossRef]
- Yu, B.; Cai, J.; Zou, M. On the physical properties of apparent two-phase fractal porous media. Vadose Zone J. 2009, 8, 177–186. [Google Scholar] [CrossRef]
- Lundblad, A.; Bergman, B. Determination of contact angle in porous molten-carbonate fuel-cell electrodes. J. Electrochem. Soc. 1997, 144, 984. [Google Scholar] [CrossRef]
- Sadjadi, Z.; Jung, M.; Seemann, R.; Rieger, H. Meniscus arrest during capillary rise in asymmetric microfluidic pore junctions. Langmuir 2015, 31, 2600–2608. [Google Scholar] [CrossRef]
- Mehrabian, H.; Gao, P.; Feng, J.J. Wicking flow through microchannels. Phys. Fluids 2011, 23, 122108. [Google Scholar] [CrossRef]
- Liu, F.; Yang, L.; Jia, H. Variation in Anisotropy with Dehydration in Layered Sandstone. Water 2021, 13, 2224. [Google Scholar] [CrossRef]
- Zhao, J.; Plagge, R. Characterization of hygrothermal properties of sandstones—Impact of anisotropy on their thermal and moisture behaviors. Energy Build. 2015, 107, 479–494. [Google Scholar] [CrossRef]
- Keppert, M.; Žumár, J.; Čáchová, M.; Koňáková, D.; Svora, P.; Pavlík, Z.; Černý, R. Water vapor diffusion and adsorption of sandstones: Influence of rock texture and composition. Adv. Mater. Sci. Eng. 2016, 2016, 8039748. [Google Scholar] [CrossRef] [Green Version]
- Pavlík, Z.; Žumár, J.; Medved, I.; Černý, R. Water vapor adsorption in porous building materials: Experimental measurement and theoretical analysis. Transp. Porous Media 2012, 91, 939–954. [Google Scholar] [CrossRef]
- Duan, S.; Li, G. Equilibrium and kinetics of water vapor adsorption on shale. J. Energy Resour. Technol. 2018, 140, 122001. [Google Scholar] [CrossRef]
- Bai, J.; Kang, Y.; Chen, M.; Chen, Z.; You, L.; Li, X.; Chen, G. Impact of surface chemistry and pore structure on water vapor adsorption behavior in gas shale. Chem. Eng. J. 2020, 402, 126238. [Google Scholar] [CrossRef]
- Liang, K.; Zeng, X.; Zhou, X.; Ling, C.; Wang, P.; Li, K.; Ya, S. Investigation of the capillary rise in cement-based materials by using electrical resistivity measurement. Constr. Build. Mater. 2018, 173, 811–819. [Google Scholar] [CrossRef]
- Carpenter, T.A.; Davies, E.S.; Hall, C.; Hall, L.D.; Hoff, W.D.; Wilson, M.A. Capillary water migration in rock: Process and material properties examined by NMR imaging. Mater. Struct. 1993, 26, 286–292. [Google Scholar] [CrossRef]
- Standnes, D.C. Spontaneous imbibition of water into cylindrical cores with high aspect ratio: Numerical and experimental results. J. Pet. Sci. Eng. 2006, 50, 151–160. [Google Scholar] [CrossRef]
- Alyafei, N.; Al-Menhali, A.; Blunt, M.J. Experimental and analytical investigation of spontaneous imbibition in water-wet carbonates. Transp. Porous Media 2016, 115, 189–207. [Google Scholar] [CrossRef]
- Poulsen, M.M.; Kueper, B.H. A field experiment to study the behavior of tetrachloroethylene in unsaturated porous media. Environ. Sci. Technol. 1992, 26, 889–895. [Google Scholar] [CrossRef]
- Ringrose, P.S.; Sorbie, K.S.; Corbett, P.W.M.; Jensen, J.L. Immiscible flow behaviour in laminated and cross-bedded sandstones. J. Pet. Sci. Eng. 1993, 9, 103–124. [Google Scholar] [CrossRef]
- Delage, P. Microstructure features in the behaviour of engineered barriers for nuclear waste disposal. Exp. Unsaturated Soil Mech. 2007, 112, 11–32. [Google Scholar] [CrossRef]
- Romero, E.; Simms, P.H. Microstructure investigation in unsaturated soils: A review with special attention to contribution of mercury intrusion porosimetry and environmental scanning electron microscopy. Geotech. Geol. Eng. 2008, 26, 705–727. [Google Scholar] [CrossRef]
- Romero, E. A microstructural insight into compacted clayey soils and their hydraulic properties. Eng. Geol. 2013, 165, 3–19. [Google Scholar] [CrossRef]
- Lakirouhani, A.; Bakhshi, M.; Zohdi, A.; Medzvieckas, J.; Gadeikis, S. Physical and mechanical properties of sandstones from Southern Zanjan, north-western Iran. Balt. J. 2022, 35, 23–36. [Google Scholar] [CrossRef]
- Jia, H.; Zi, F.; Yang, G.; Li, G.; Shen, Y.; Sun, Q.; Yang, P. Influence of pore water (ice) content on the strength and deformability of frozen argillaceous siltstone. Rock Mech. Rock Eng. 2020, 53, 967–974. [Google Scholar] [CrossRef]
- Wang, T.; Sun, Q.; Jia, H.; Shen, Y.; Li, G. Fracture Mechanical Properties of Frozen Sandstone at Different Initial Saturation Degrees. Rock Mech. Rock Eng. 2022, 55, 3235–3252. [Google Scholar] [CrossRef]
- Jia, H.; Ding, S.; Wang, Y.; Zi, F.; Sun, Q.; Yang, G. An NMR-based investigation of pore water freezing process in sandstone. Cold Reg. Sci. Technol. 2019, 168, 102893. [Google Scholar] [CrossRef]
- Jia, H.; Ding, S.; Zi, F.; Li, G.; Yao, Y. Development of anisotropy in sandstone subjected to repeated frost action. Rock Mech. Rock Eng. 2021, 54, 1863–1874. [Google Scholar] [CrossRef]
- Jia, H.; Ding, S.; Zi, F.; Dong, Y.; Shen, Y. Evolution in sandstone pore structures with freeze-thaw cycling and interpretation of damage mechanisms in saturated porous rocks. Catena 2020, 195, 104915. [Google Scholar] [CrossRef]
- Kristensen, L.; Hjuler, M.L.; Frykman, P.; Olivarius, M.; Weibel, R.; Nielsen, L.H.; Mathiesen, A. Pre-drilling assessments of average porosity and permeability in the geothermal reservoirs of the Danish area. Geotherm. Energy 2016, 4, 1–27. [Google Scholar] [CrossRef]
- Zhang, Z.; Zhang, R.; Xie, H.; Gao, M. The relationships among stress, effective porosity and permeability of coal considering the distribution of natural fractures: Theoretical and experimental analyses. Environ. Earth Sci. 2015, 73, 5997–6007. [Google Scholar] [CrossRef]
- MacNaughton, R.; Beauchamp, B.; Dewing, K.; Smith, I.; Wilson, N.; Zonneveld, J.P. Encyclopedia of sediments and sedimentary rocks. Geosci. Can. 2005, 32, 139–140. [Google Scholar]
- Siegel, R. Transient Capillary Rise in Reduced and Zero-Gravity Fields. J. Appl. Mech. 1961, 28, 165. [Google Scholar] [CrossRef]
- Bosanquet, C.H. LV. On the flow of liquids into capillary tubes. Lond. Edinb. Dublin Philos. Mag. J. Sci. 1923, 45, 525–531. [Google Scholar] [CrossRef]
- Pallas, N.R.; Pethica, B.A. The surface tension of water. Colloids Surf. 1983, 6, 221–227. [Google Scholar] [CrossRef]
- Korosi, A.; Fabuss, B.M. Viscosity of liquid water from 25 to 150. degree. measurements in pressurized glass capillary viscometer. Anal. Chem. 1968, 40, 157–162. [Google Scholar] [CrossRef]
- Englert, A.H.; Rodrigues, R.T.; Rubio, J. Dissolved air flotation (DAF) of fine quartz particles using an amine as collector. Int. J. Miner. Process. 2009, 90, 27–34. [Google Scholar] [CrossRef]
- Záleská, M.; Pavlíková, M.; Pavlík, Z.; Černý, R. Retention curves of different types of sandstone. Adv. Mater. Res. 2014, 982, 44–48. [Google Scholar] [CrossRef]
- Charola, A.E.; Wendler, E. An overview of the water-porous building materials interactions. Restor. Build. Monum. 2015, 21, 55–65. [Google Scholar] [CrossRef]
Figure 1.
Test samples (a) and their pore size distributions and T2 spectra (b).

Figure 2.
Water-absorption mass vs. time in (a) Sample A1; (b) Sample A2; (c) Sample B1 and (d) Sample B2.
Figure 2.
Water-absorption mass vs. time in (a) Sample A1; (b) Sample A2; (c) Sample B1 and (d) Sample B2.

Figure 3.
Water-absorption heights with time in (a) Sample A1; (b) Sample A2; (c) Sample B1 and (d) Sample B2.
Figure 3.
Water-absorption heights with time in (a) Sample A1; (b) Sample A2; (c) Sample B1 and (d) Sample B2.

Figure 4.
Lightness vs. time reflecting the water reaching the top surfaces in (a) Sample A1; (b) Sample A2; (c) Sample B1 and (d) Sample B2.
Figure 4.
Lightness vs. time reflecting the water reaching the top surfaces in (a) Sample A1; (b) Sample A2; (c) Sample B1 and (d) Sample B2.

Figure 5.
T2 spectra during the capillary imbibition process in (a) Sample A1; (b) Sample A2; (c) Sample B1 and (d) Sample B2.
Figure 5.
T2 spectra during the capillary imbibition process in (a) Sample A1; (b) Sample A2; (c) Sample B1 and (d) Sample B2.

Figure 6.
Water signal amplitudes from different types of water in (a) Sample A1; (b) Sample A2; (c) Sample B1 and (d) Sample B2.
Figure 6.
Water signal amplitudes from different types of water in (a) Sample A1; (b) Sample A2; (c) Sample B1 and (d) Sample B2.

Figure 7.
Stratified moisture distribution curves during the capillary imbibition process in (a) Sample A1; (b) Sample A2; (c) Sample B1 and (d) Sample B2.
Figure 7.
Stratified moisture distribution curves during the capillary imbibition process in (a) Sample A1; (b) Sample A2; (c) Sample B1 and (d) Sample B2.

Figure 8.
Comparison of NMR-derived and directly measured water-absorption front heights during the saturation process in (a) Sample A1; (b) Sample A2; (c) Sample B1 and (d) Sample B2.
Figure 8.
Comparison of NMR-derived and directly measured water-absorption front heights during the saturation process in (a) Sample A1; (b) Sample A2; (c) Sample B1 and (d) Sample B2.

Figure 9.
Photographs (left) and MRI images (right) of (a) Sample A1 and (b) Sample B1.

Figure 10.
Cast thin sections and binary images of the pore structures of (a) Samples A1 and (b) B1.
Figure 10.
Cast thin sections and binary images of the pore structures of (a) Samples A1 and (b) B1.

Figure 11.
Comparison of the capillary imbibition curve reflected by the equivalent radius with the actual ones.
Figure 11.
Comparison of the capillary imbibition curve reflected by the equivalent radius with the actual ones.

Figure 12.
Capillary imbibition mechanisms in (a) Par Sample; (b) Per Samples.


Table 1.
Mineral composition in Samples A1 and A2.
| Mineral Name | Content Proportion (%) |
|---|---|
| Quartz | 47.0 |
| Plagioclase | 19.9 |
| Potassium feldspar | 6.4 |
| Calcite | 19.8 |
| Dolomite | 3.6 |
| Chlorite | 3.0 |
| hematite | 0.3 |
Table 2.
Mineral composition in Samples B1 and B2.
| Mineral Name | Content Proportion (%) |
|---|---|
| Quartz | 71 |
| Potassium feldspar | 18 |
| Calcite | 6 |
| Chlorite | 5 |
Table 3.
Water-absorption time and mass of samples at each stage.
| Sample | Variable (Units) | Stage 1 | Stage 2 | Stage 3 |
|---|---|---|---|---|
| A1 | T (min) | 160 | 960 | 8510 |
| M (g) | 20.62 | 1.22 | 3.50 | |
| MR (%) | 81.37% | 4.81% | 13.81% | |
| R (g/min) | 0.12 | 0.0013 | 0.00041 | |
| A2 | T (min) | 140 | 980 | 8510 |
| M (g) | 11.73 | 12.49 | 4.15 | |
| MR (%) | 41.35% | 44.03% | 14.63% | |
| R (g/min) | 0.077 | 0.015 | 0.00022 | |
| B1 | T (min) | 220 | 800 | 7780 |
| M (g) | 10.2 | 8.48 | 3.37 | |
| MR (%) | 46.42% | 38.39% | 15.34% | |
| R (g/min) | 0.046 | 0.0106 | 0.00043 | |
| B2 | T (min) | 220 | 1640 | 6940 |
| M (g) | 7.67 | 10.71 | 2.8 | |
| MR (%) | 36.21% | 50.57% | 13.22% | |
| R (g/min) | 0.035 | 0.0065 | 0.00040 |
Note. T = water-absorption time; M = water-absorption mass within each stage; MR = ratio of water-absorption mass in each stage to total water-absorption mass; R = the increase in the water-absorption mass per unit time = M/T.
Table 4.
Stabilization time for bound water content (Figure 6), water-absorption mass (Figure 2), and height (Figure 3) of the four samples.
| Sample | Bound Water Content Stabilization Time (min) | Mass of Absorption Water Stabilization Time (min) | Height of Absorption Front Stabilization Time (min) |
|---|---|---|---|
| A1 | 120 | 1120 | 120 |
| A2 | 360 | 1120 | 540 |
| B1 | 500 | 1020 | 780 |
| B2 | 1020 | 1860 | 1380 |
Disclaimer/Publisher’s Note: The statements, opinions and data contained in all publications are solely those of the individual author(s) and contributor(s) and not of MDPI and/or the editor(s). MDPI and/or the editor(s) disclaim responsibility for any injury to people or property resulting from any ideas, methods, instructions or products referred to in the content. |
© 2023 by the authors. Licensee MDPI, Basel, Switzerland. This article is an open access article distributed under the terms and conditions of the Creative Commons Attribution (CC BY) license (https://creativecommons.org/licenses/by/4.0/).
Share and Cite
MDPI and ACS Style
Jia, H.; Dong, B.; Wu, D.; Shi, Q.; Wei, Y. Capillary Imbibition in Layered Sandstone. Water 2023, 15, 737. https://doi.org/10.3390/w15040737
AMA Style
Jia H, Dong B, Wu D, Shi Q, Wei Y. Capillary Imbibition in Layered Sandstone. Water. 2023; 15(4):737. https://doi.org/10.3390/w15040737
Chicago/Turabian StyleJia, Hailiang, Biwen Dong, Di Wu, Qingmin Shi, and Yao Wei. 2023. "Capillary Imbibition in Layered Sandstone" Water 15, no. 4: 737. https://doi.org/10.3390/w15040737
Note that from the first issue of 2016, this journal uses article numbers instead of page numbers. See further details here.