
Integration of Marine and Terrestrial Ecological Economies in the Cities of the Bohai Rim, China, Based on the Concept of Viscosity
1
School of Geography, Liaoning Normal University, No. 850, Huanghe Rd, Dalian 116029, China
2
Marine Economies and Sustainable Development Research Center, Liaoning Normal University, No. 850, Huanghe Rd, Dalian 116029, China
*
Author to whom correspondence should be addressed.
Water 2023, 15(4), 749; https://doi.org/10.3390/w15040749
Submission received: 21 December 2022
/
Revised: 7 February 2023
/
Accepted: 9 February 2023
/
Published: 14 February 2023
(This article belongs to the Special Issue Marine Economic Development and Conservation)
Abstract
:The integration of sea and land ecological economies is crucial for the development of a high-quality sea–land economy. This study explores and proposes the concept of a sea–land-integrated ecological economy. By constructing the evaluation index system for developing a sea–land-integrated ecological economy, the development level, evolution process, and development trend prediction of a sea–land-integrated ecological economy were evaluated and analysed in cities around the Bohai Sea from 2009 to 2019 using methods such as a model for assessing the development level, a spatio-temporal autocorrelation model, and an exploratory spatio-temporal data analysis model. The results of the study show that (1) the development level of the ecological economy of the cities of Bohai Rim’s sea–land integration generally had an upward trend; however, the magnitude significantly varied between cities; (2) the spatio-temporal autocorrelation pattern formed three major agglomerations with Dalian in the north, Yantai and Qingdao in the south, and Tianjin and Tangshan in the centre as the core cities and contained low agglomerations and scattered L–H spatio-temporal heterogeneous units; and (3) the integration prediction curve for 2020–2029 indicates that the level value for integration of most cities will improve over time.
1. Introduction
The sea and land are interdependent and interrelated. China has both land and sea, and the implementation of a comprehensive land and marine strategy is conducive to the coordinated development of marine and land-based economies. However, the traditional ‘land-based’ development concept has resulted in the double-track development of land-based and marine economies, and the ocean requires high economic and technological investment. This has led to a lag in oceanic development, ensuing contradictions between the land, sea, and air, as well as competition for resources. Thus, the land–sea economic differentiation contradiction is becoming increasingly evident. Therefore, promoting the marine economy is particularly crucial in driving the land-based economy, leading to the formation of a new pattern of quality development of sea and land integration [1,2,3]. At present, China is in a critical period of strategic adjustment of its economic structure and rapid development of the marine economy. Therefore, high-quality, coordinated, and sustainable development of the regional marine and land economy should be promoted by investigating a new type of marine and land integrated economy that adapts to contemporary development scenarios. Through the empirical measurement of the integration between marine and terrestrial ecological economy in the cities of the Bohai Rim, the characteristics and laws of this model are put forward to guide the coordinated and high-quality development of sea and land economy.
The integrated development of marine- and land-based economies is a decision-making tool for addressing the relationship between the economies. Chinese scholars have proposed the concept of land and marine coordination [4,5], and their research primarily focuses on the impact of the marine economy on the economic development of coastal areas and quantitative analysis of the marine- and land-based economies [6,7,8,9]. International scholars have focused more on the integrated management of coastal zones and the development of the marine economy at a regional or national scale [10,11,12,13]. The inevitable integrated development of marine- and land-based economies is attributed to the following facts: (1) the integration of sea and land and practical technological progress are external environmental factors; and (2) the fundamental connection between sea and land industries is the internal driving force, and industrial integration is an economic development trend that is highly significant for industrial expansion, the optimisation of industrial structure, and the enhancement of industrial competitiveness [14]. Current research on marine- and land-based economies mostly focuses on the qualitative and quantitative analyses of the correlation and coordination of indicators or industrial data under the concepts of sea–land interaction and integration, particularly the synergistic development of sea–land industries, coordinated evaluation of the sea–land economy, and measurement of sea–land integration levels [15,16,17]. However, detailed mechanisms and models for the integrated development of marine- and land-based economies are lacking. A multidisciplinary approach, with cross-regional empirical research at the municipal level, was adopted for this research, particularly from the output characteristics of marine- and land-based economies. The research on a sea–land-integrated economy is scattered and one-sided, lacking a certain degree of systematisation. The research primarily focuses on the qualitative analysis of the realisation path of sea–land integration and the integrated development of a certain aspect of simplification, as well as pure technical integration research [18,19,20,21]. The mutual influence and interaction between the marine and land economic systems were considered.
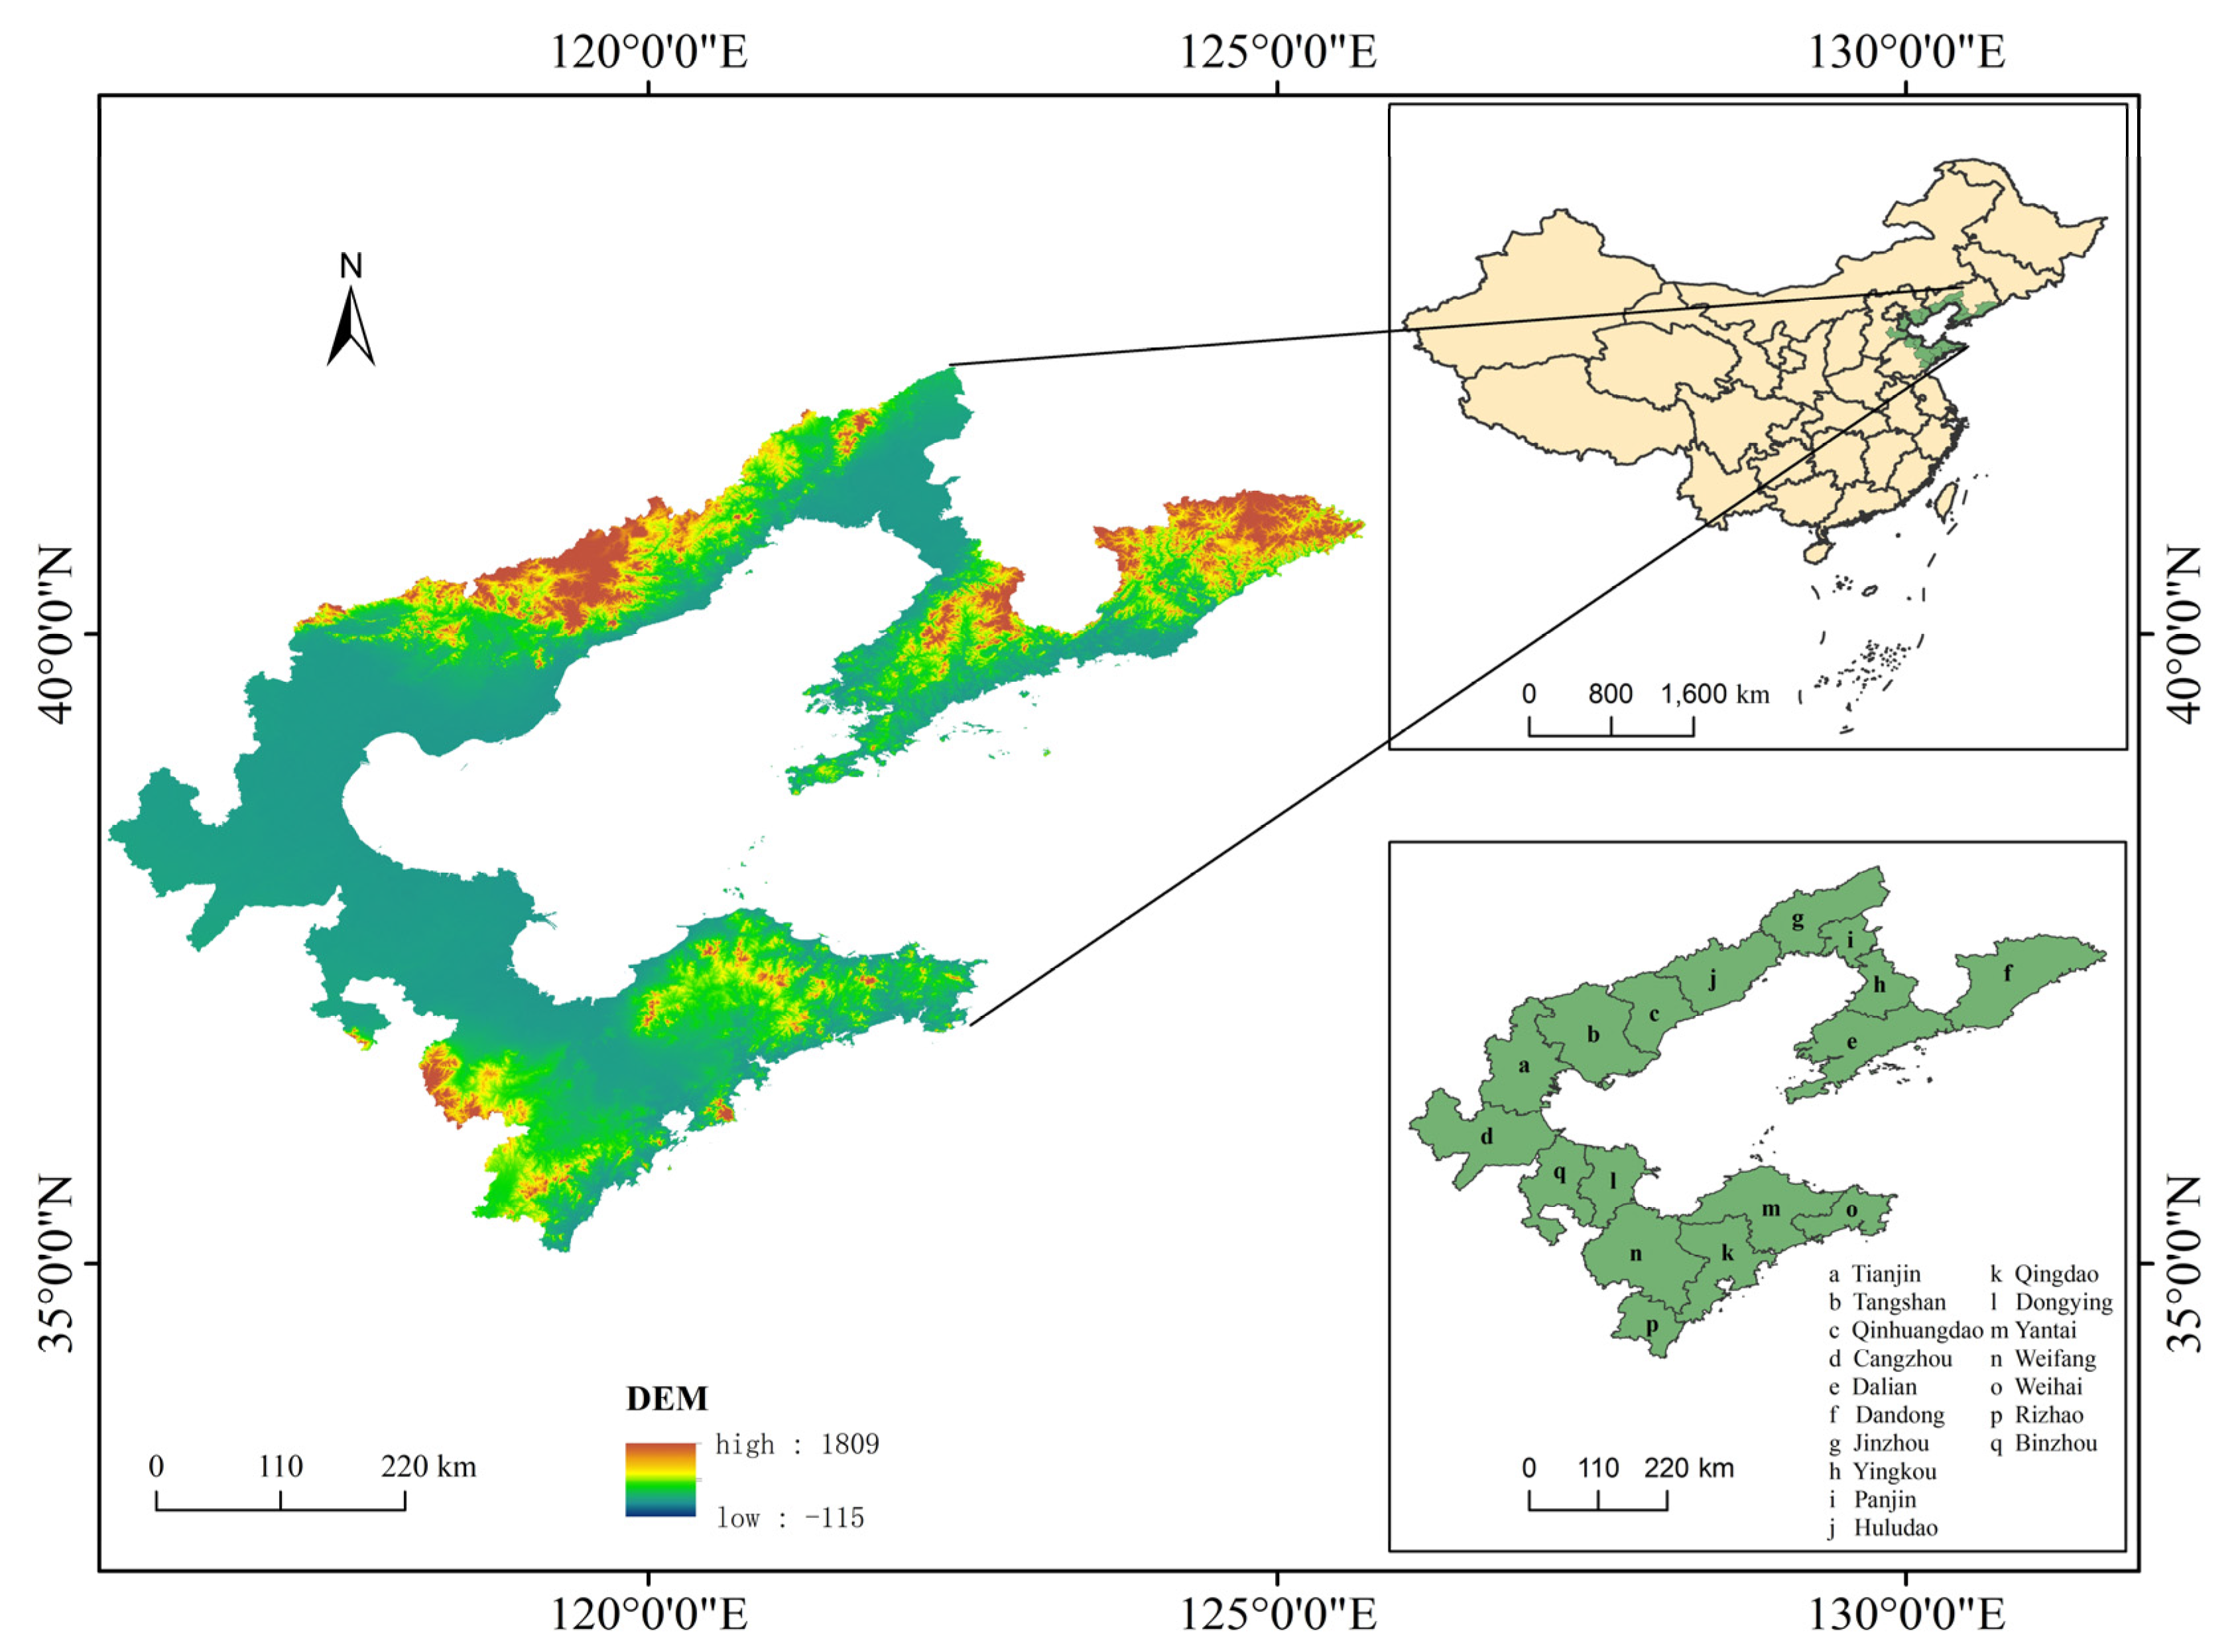
The Bohai Sea region is one of the three major maritime economic regions in China (Figure 1). Owing to its advantageous geographical location, rich and diversified resources, and progressive industry and technology, it has become the backbone of China’s maritime economic development. Before the background of accelerating the high-quality development of China’s marine economy, the evaluation of the sea–land integration ecological economy in cities around the Bohai Sea has important theoretical value and practical significance for accurately understanding the current scenario of the sea–land economic development of coastal cities and formulating measures that conform to the differences between regions. From a systems perspective, the integration of the marine and terrestrial ecological economies is an emerging system of continuous change formed by interconnection, intersection, penetration, competition, and collaboration among several sub-system components within the sea–land interface and its complex system in the spatio-temporal dimensions [22,23]. Considering its complexity, the sea–land issue should be comprehensively analysed and studied. Based on previous study results, this study used the framework of system theory to introduce the viscosity theory as a guide for the in-depth analysis of a mechanism and model for the integration of sea and land ecological economies. This was combined with a structural chart of the marine ecological economic system, and an evaluation index system was constructed for integrating marine and land ecological economies in cities around the Bohai Sea [24,25].
However, because of the limited research regarding scale and samples, research on the integration of marine and land economies is not comprehensive. In this study, 17 prefecture-level cities in the Bohai Rim were selected as the research areas, and the optimal entropy value and polygon quorum were used to measure the integration capacity of the urban sea–land system from 2009 to 2019. The spatial and temporal differentiation characteristics and dynamic change trends of the sea–land integration eco-economic level of cities in the Bohai Rim were explored. To address the spatio-temporal limitations, GeoDa and GIS software combined with spatio-temporal autocorrelation analysis (spatio-temporal Moran’s I), an exploratory spatio-temporal data analysis (ESTDA) model, and spatio-temporal prediction integrated models were applied to analyse the spatio-temporal correlation of the sea–land integration eco-economic level of cities in the Bohai Rim. This study summarises the inner mechanism and evolutionary pattern of the sea–land integration ecological economy and explores the level and agglomeration characteristics in cities around the Bohai Sea, which is conducive to the high-quality growth of China’s sea–land economy under the new scenario.
2. Materials and Methods
2.1. Data Sources
The data sources used in this study include the 2010–2020 editions of the China Marine Statistical Yearbook, China City Statistical Yearbook, Shandong Statistical Yearbook, Liaoning Statistical Yearbook, Hebei Economic Yearbook, Tianjin Statistical Yearbook, Bulletin on Environmental Quality of China’s coastal waters, and the statistical bulletins of the relevant national departments.
2.2. Research Methodology
The extreme difference method was used to normalise the raw data and eliminate the effects of dimensional differences on the results of this study. The marine- and land-based economies are open, large-scale systems with numerous components that both influence and restrict each other. Overall, they have the general characteristics of a complex system: open, dynamic, real-time, and spatial. The basic condition for the benign operation of a complex system is the coordinated development of each component [26].
2.2.1. Entropy Method
The entropy method was employed to calculate the time weights [27].
where is the proportion of the index value of the i-th year under the j-th index of a prefecture-level city to the index value of all years, is the entropy value of the j-th index of a prefecture-level city, is a constant, is the number of schemes, is the difference coefficient of the j-th index of a prefecture-level city, and is the weight of index j of a prefecture-level city.
2.2.2. Model for Assessing the Development Level
The sequential arrangement of the polygon area considers a fixed point as the common point of multiple line segments extending outward to form a polygon, the multiple line segments of the common point represent specific terms, and the length of the line segments is the corresponding index value. The area of each triangle formed by the adjacent line segments of the common point in the sequential arrangement was calculated to obtain the polygon area, and the polygon area was regarded as the value of the comprehensive index. Furthermore, O is the origin, and OI, OC, OE, and OU represent the integration economy development foundation, integration economy resource development, integration economy industry linkage, and integration economy result creation, respectively. The area of this quadrilateral is regarded as the level of sea–land integration ecological economy development [28];
where is the level value of the ecological economy of marine and terrestrial integration.
2.2.3. Spatio-Temporal Autocorrelation Model
Spatial autocorrelation analysis can only explore the aggregation of variables in a region at a given moment; thus, Moran’s I can only be applied to the spatial dimension but cannot determine spatio-temporal autocorrelation properties in the time–space dimension. Wartenberg (1985) proposed a spatio-temporal autocorrelation structure for analysing variables using spatio-temporal Moran’s I; by introducing the time dimension, the global and local spatio-temporal Moran’s I extends and improves Moran’s I [29]. Spatio-temporal autocorrelation analysis commonly uses a spatio-temporal weight matrix to determine the spatio-temporal proximity between objects and a spatio-temporal lag vector to determine the spatio-temporal neighbourhood state of each unit. Spatio-temporal Moran’s I can effectively calculate the spatio-temporal correlation pattern between the original variable x at moment t-k and the spatial lag at moment t, while quantifying the effect of the change in variable x in region i at moment t-k on the impact of variable x around region i at moment t.
2.2.4. Global Spatio-Temporal Autocorrelation Formula
Global spatio-temporal autocorrelation formula
where is the number of study areas; is the time weight from moment to moment , usually set to 1; and represents the elements of the spatio-temporal weight matrix . Owing to the time-invariant nature of the polygon region adjacencies, the spatial weight matrix can be used directly. and are the values of observations in cells and at time ; is the same observation in cell at moment t − k; and and are the average values of the observed quantities at and moment , respectively.
Local spatio-temporal autocorrelation formula
2.2.5. Exploratory Spatio-Temporal Data Analysis Model (ESTDA)
The local indicator of spatial association (LISA) time path is based on the temporal migration of LISA coordinates in a Moran scatter plot. It incorporates the time dimension into the traditional static LISA, making it a dynamic continuous representation and a continuous representation of the LISA spatial Markov transfer matrix. It is typically used to reflect the local spatial and temporal synergistic changes in geographical elements, and reveal the extent and direction of spatial and temporal interactions of regional geographical elements (competing dynamics) and the extent of spatial and temporal dependence effects on the evolution of regional systems.
where is the number of cells, is the annual interval, is the LISA coordinates of city in year , is the distance that city moved from year to year , and is the distance that city moved from year t to the last year. The larger the value of , the longer the movement length and the more dynamic the local spatial dependency and local spatial structure (i.e., the migration path is less stable). As the value of increases, the curvature increases, the local spatial dependency direction and fluctuating growth process become more dynamic, and the fluctuation over time becomes more severe; however, the opposite results in a reduced impact with a more stable fluctuation.
2.2.6. Spatio-Temporal Prediction Integrated Model
Spatio-temporal comprehensive prediction refers to modelling the change in the trends of time and space attributes using different methods according to different data characteristics. The core of the algorithm is spatio-temporal synthesis, which considers both the target object and the influence of adjacent objects. The time series prediction time relationship and the autoregressive integrated moving average (ARIMA) model were used to obtain the time series prediction data from 2021 to 2030. The ARIMA model is a time series prediction method with high accuracy based on the stochastic theory proposed in the Box–Jenkins model [32]. A neural network was established to predict the spatial relationship, and the artificial neural network was used to determine the hidden spatial correlation between all spatial location data. To calculate the stable and reliable spatial relationships, the artificial neural network can be used to learn hidden patterns and relationships. The MATLAB neural network was used for model training, and the time series data predicted by the ARIMA model were then input to obtain the spatial prediction impact results. The time and spatial predictions were combined to determine the final spatio-temporal comprehensive prediction. Furthermore, averaging is the simplest comprehensive method and may be more efficient for the actual data [33].
3. Theory
3.1. Establishing a System for Describing the Conceptual Model
A system is a set of interrelated elements. Studying the problem from a systems perspective may allow for an optimised and comprehensive determination of the problem and an accurate understanding of the ecological economy of sea–land integration. Furthermore, the sea–land economy is a system structure comprising several sub-system elements within a complex system [34,35,36,37]. Industrial integration is a trend in economic development, and its formation requires open systems as a prerequisite as well as innovation as an opportunity, competition and collaboration between subjects, co-evolution between elements, and other external factors that contribute to the integration process. The economic integration of land and sea is attributed to the change in strategic thinking and the advancement of science and technology. Furthermore, the economic relationship between land and sea is closely linked, fundamentally owing to the coexistence and mutually beneficial relationship between sea and land industries. Furthermore, the layout of the industries requires both a marine resource supply and land area as a base; production factors need to flow between sea and land areas and among industries [38,39,40].
Considering industrial integration as a new starting point for the sea–land economy and using systems theory as a research framework to propose an ecological economy of sea–land integration is consistent with the research process of the sea–land economy, drawing from previous studies on sea–land coordination and sea–land economic links but varying from both [41,42]. Sea–land coordination focuses on ideological connotations, overall planning, and coordinated development, whereas sea–land economic links emphasise the reduction in common barriers and obstacles in specific sea–land industrial development links for the joint development of the sea–land economy. Based on the development of economic links, increased international division of labour and socialised mass production have moved national economies from the original economic exchanges to economic cooperation and economic integration. The integration of sea and land is beneficial for the evolution of the entire economic system, particularly to meet the objective of carbon neutrality and peak emissions.
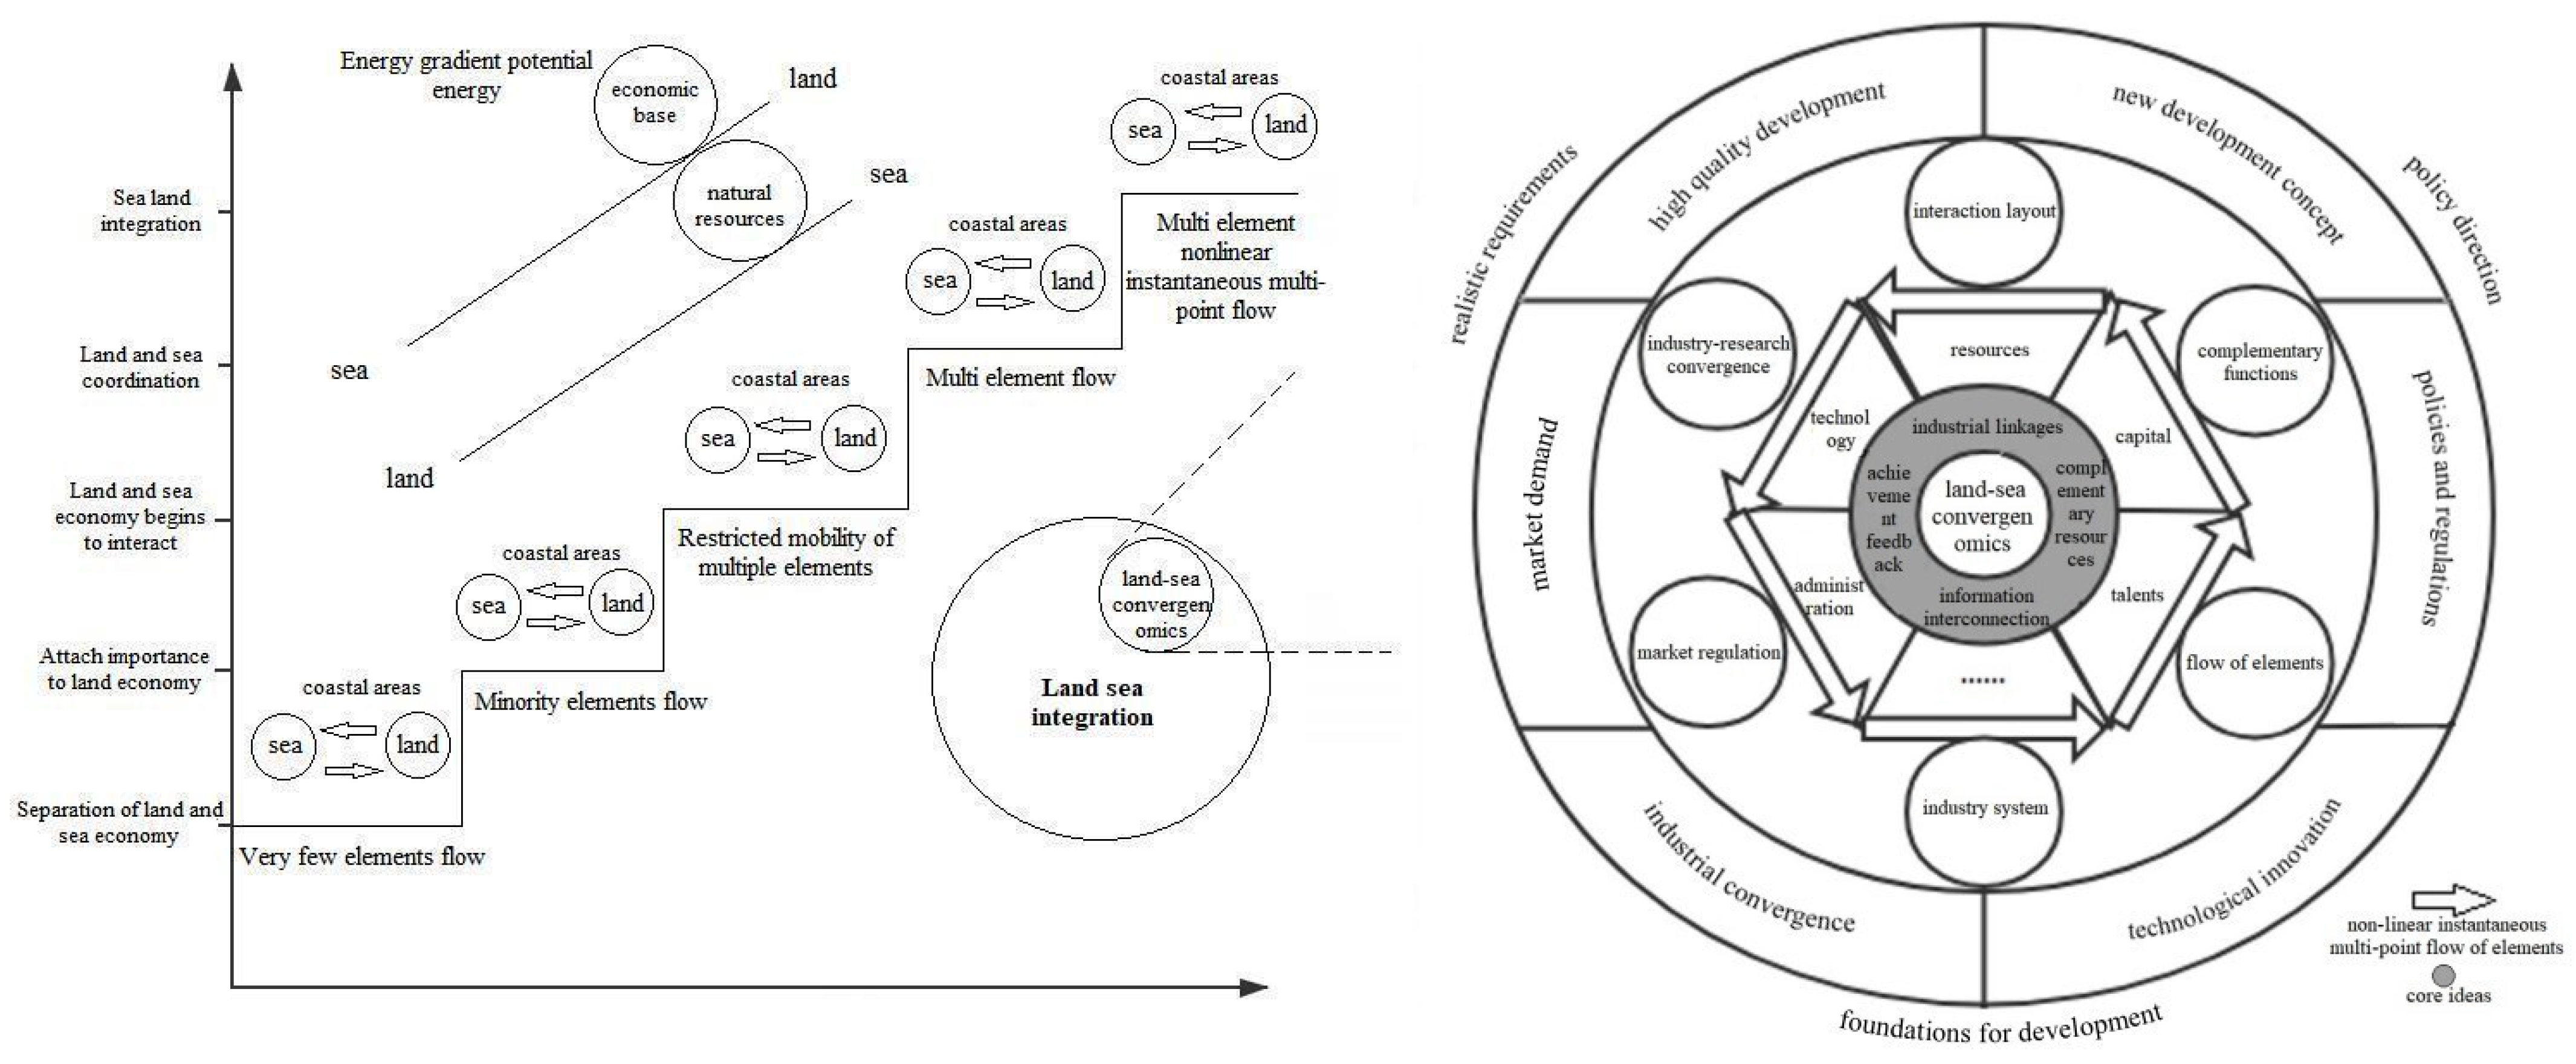
The integration of marine and terrestrial ecological economies necessitates that the economic structure must change; the crossover, integration, and penetration among the elements of the system must evolve into new elements after integration in a new economic model. The organisation and coordination between the elements within the system must also change. These changes will allow the achievement of optimal allocation, which will bring multiple elements to power and promote multiple models, multi-mechanism linkages, multi-industry creation, and economic vitality (Figure 2). These factors are non-linearly correlated and affect the process of integrating land and sea economies, primarily in the form of different production methods and development plans owing to the differences in resource conditions and different development models due to the economic base and advantages of the subjects. In the systems framework, the concept of viscosity is introduced to interpret the ecological economy of sea–land integration and build an indicator system. Viscosity refers to a macroscopic property of real fluids, and there are similarities between physical fluids and land–sea convergence economies based on a linkage perspective [43]. During economic convergence, the connections and constraints within the system form the interaction force within the subject, which organises the system. Although this study refers to a land and sea integration economy that differs from those in previous studies, the phenomenon and essence of the integration economy are consistent with the principles revealed by the theory of viscosity in physics [44].
3.2. Establishing a System for Assessing the Integration Capacity of Marine and Terrestrial Ecological Economies
The analysis of the conceptual model confirms the suitability of introducing the concept of viscosity into the ecological economy of the sea–land integration system. The interaction of the intrinsic elements of land and sea economic agents, resource use and conservation, technological innovation, economic linkage mechanisms, and social development outcomes indicate the development of an integrated system of land and sea economies. By organising and analysing the relevant literature and combining the practice of the sea–land economy, the development process of the sea–land-integrated ecological economy comprises a four-part systematic framework: the basis of integrated economic development, integrated economic resource development, integrated economic industry linkage, and integrated economic outcome creation.
The following system of indices was constructed by incorporating the concept of viscosity into land–sea convergenomics. Consequently, 23 indices were selected for the creation of a comprehensive system of indices that adequately reflected every aspect of the convergence of land and marine economies. The selection criteria for the indices included scientific reproducibility, mutual independence, and measurability (Table 1). With respect to the literature, this study primarily refers to the indicator system reported by Di and Han [45]. The study applies the systemic framework and the viscosity concept and attempts to reflect the purpose of the joint role of cities and oceans, focusing on both comprehensiveness and representativeness in important links [46]. We sought to create an evaluation system comprising 23 indicators combined with quantifiable and available data.
Regarding indicators included in Table 1, the basis of integrated economic development is the basic condition for the development of a sea–land-integrated economy, which provides basic support for the integrated economy and directly affects its future development space and scale. Herein, we adopted the gross domestic product (GDP) of sea and land areas, their respective shares in GDP, and the entropy of sea–land industrial location as the indicators of the current level of economic development and its status in regional economic development. The development of integrated economic resources is an important part of the economic development of sea–land integration. By managing the abundance of marine and land resources, the environment, and ecology, resources that promote sea–land economic development are transformed. We first measured the abundance of marine and land resources using four indicators of resource abundance: greenfield area, area in which crops are sown, production of marine products, and mariculture area. Subsequently, the pressure and carrying capacity of sea and land environments were used to express the state of the sea and land environments, the content of which includes the proportion of four inferior types of seawater, the amount of industrial solid waste generation to express the pressure level, and the environmental quality and seawater pollution absorption capacity as an expression of the carrying capacity. Notably, high-tech and resource development capacity are essential in the development of a sea–land-integrated economy and thus are the two vital indicators of the level of resource development, sea and land science and technological innovation capabilities, research and technology services, and geological exploration practices. In contrast, the energy consumption value of 10,000 Yuan as GDP and the GDP growth rate are the indicators of development capacity and power. The core linkage of the integrated economy is the development of the sea–land-integrated economy. The integration of resources improves the organisation of efficient logistics and industrial linkage, circulation of finished products, and industrial interaction. There are three indicators of the logistics level: port cargo throughput, road freight volume, and access to the transport network (road area per capita). The sea–land industry linkage effect value is a measure of industries’ ability to interact, and it comprises a ratio of the amount of change in the marine-based industry to the amount of change in the land-based industry, that is, reflecting the difference in the rate of change between the two in a natural year. The integration of economic outcome creation is an inevitable requirement for the development of a land and sea integrated economy. Labour and assets are also essential for the development of a land and sea integrated economy, which must consequently benefit society. This study considers urban registered unemployment as the labour force participation indicator, the amount of investment in fixed assets in marine and land areas as the capital participation indicator, and two indicators of the urbanisation rate and quality of life to express social development level.
4. Results
Through data collection and processing, the overall characteristics of the development level of the sea–land integrated ecological economy in cities around the Bohai Sea were described and analysed. Its evolution process was analysed via spatio-temporal autocorrelation and time path methods, and its development trend was forecasted and analysed using the spatio-temporal prediction model.
4.1. Integration Capacity Values of Cities in the Bohai Rim
Based on the measurement model and evaluation index system of the development level of the sea–land integrated ecological economy, the development level of the sea–land-integrated ecological economy in cities around the Bohai Sea from 2009 to 2019 and the proportion of each city at the system level were obtained, as presented in Table 2 and Figure 3. This revealed the overall characteristics of the development level of the sea–land-integrated ecological economy in cities around the Bohai Sea.
Table 2 shows that, from 2009 to 2019, the development level of the ecological economic sea–land integration in Bohai Rim cities was generally increasing; however, the magnitude varied significantly between cities. The value of the development level of ecological economic sea–land integration in Bohai Rim cities ranged from 1.333 to 3.613 and increased from 2009 to 2018, with a slight decrease in 2019. Although the trends of all cities increased, each city exhibited a different starting point and rate of increase, with some cities showing a large fluctuating upward trend, most cities showing a small fluctuating rise, and all cities ranging between 0.017 and 0.186, including Weifang, Weihai, Cangzhou, Dongying, Rizhao, Binzhou, Qinhuangdao, Yingkou, Jinzhou, Dandong, Panjin, and Huludao—all cities with a high starting point. The cities that exhibited a large increase included Tianjin, Qingdao, Dalian, Yantai, and Tangshan, with Tianjin exhibiting the highest value among cities. This value increased to 0.883 after 2011, until 2017 when it slightly dropped. Qingdao and Dalian exhibited an upward trend during the early stage; however, after 2014, the Dalian value began to fluctuate more. After 2015, Qingdao surpassed Dalian and continued to stabilise. After 2015, Qingdao surpassed Dalian and continued to grow steadily until it reached 0.658. Despite a slight increase, the subsequent value for Dalian significantly differed from that for Qingdao. Furthermore, in 2019, when the level of most cities declined, Dalian was surpassed by Yantai and was almost on par with Tangshan. Figure 3 shows that in terms of the proportion of each city’s effectiveness in the sub-system layer, the integration economy development foundation layer remained high and increased steadily. The integrated economy resource development layer had a low value of effectiveness and grew gradually; the integrated economy industry linkage layer exhibited the highest growth and the highest value of effectiveness but with small fluctuations. The integrated economy outcome creation layer had a low starting point but remained relatively stable and then exhibited rapid growth. Among the systems, the development base was relatively stable, level of resource development was low, industrial linkage effectiveness value was high and rapidly developing, and outcome creation was influenced by the first three to show a comprehensive low level of rapid growth. In the proportion of cities in each system in each year, the cities with a high starting point and a large increase in the level of development of the ecological economy of land and sea integration were Tianjin, Qingdao, Dalian, and Yantai; these cities accounted for a relatively high proportion in each layer of the system. Tangshan accounted for a smaller proportion than the four aforementioned cities in the development of resources and the creation of outcomes but accounted for a larger proportion in industrial linkages and an increasing proportion in the creation of outcomes, indicating that this city plays a more optimised role in industrial linkages and makes full use of its benefits.
Summary of considerations: the development of the sea–land-integrated ecological economy of Bohai Rim cities was not optimal, and most cities were at a low level. The gap between cities was too large; only a few large cities exhibited a high and rapid growth trend, and most cities exhibited a low trend and gradual growth. The development of a sea–land-integrated ecological economy was too dependent on the original foundation of the city, thereby not allowing for the exploration of new development models, innovation, and a resource development system layer. The low efficiency and gradual growth of the systemic layer of resource development suggest that the focus on science, technology, and the environment has to be enhanced. To better investigate the changing characteristics and development patterns of the sea–land-integrated ecological economy of Bohai Rim cities, further map visualisation analysis was performed on the spatial changes of the hierarchy of the sea–land-integrated ecological economy of Bohai Rim cities from 2009 to 2019.
4.2. Spatio-Temporal Autocorrelation in Integration Capacity
It is necessary to further explore the spatio-temporal characteristics of the development of the sea–land integration eco-economy in cities around the Bohai Sea to comprehensively explain its regional aggregation and heterogeneity. Therefore, spatio-temporal autocorrelation analysis was conducted on the development level of the sea-land integration eco-economy in cities around the Bohai Sea, and the correlation pattern of its development was studied from a spatio-temporal perspective. Data analysis was conducted using the development level of the sea-land integration eco-economy in cities around the Bohai Sea (Table 2).
4.2.1. Global Spatio-Temporal Autocorrelation
The global spatio-temporal autocorrelation Moran’s I index was obtained by substituting the values of the level of ecological and economic development of the Bohai Rim cities into Equation (5) (Table 3).
The overall index changed from negative to positive spatio-temporal correlation (i.e., from spatio-temporal heterogeneity to spatio-temporal aggregation), with negative spatio-temporal correlation dominating until 2014 and positive spatio-temporal correlation after 2014 (i.e., showing a high or low spatio-temporal aggregation pattern). As shown in Table 3, the Moran index gradually increased as the time step between 2011 and 2018 increased, and the influence of moment t on moment t + k increased as the value of k increased. The level of ecological and economic development of sea–land integration reached new peaks in 2018 and 2019, with a positive effect on the overall mutual and coordinated development of the region. However, firstly, the distribution of cities around the Bohai Sea is primarily in the form of a belt structure owing to topographical factors, and secondly, the number of cities in the study sample is limited.
4.2.2. Local Spatio-Temporal Autocorrelation
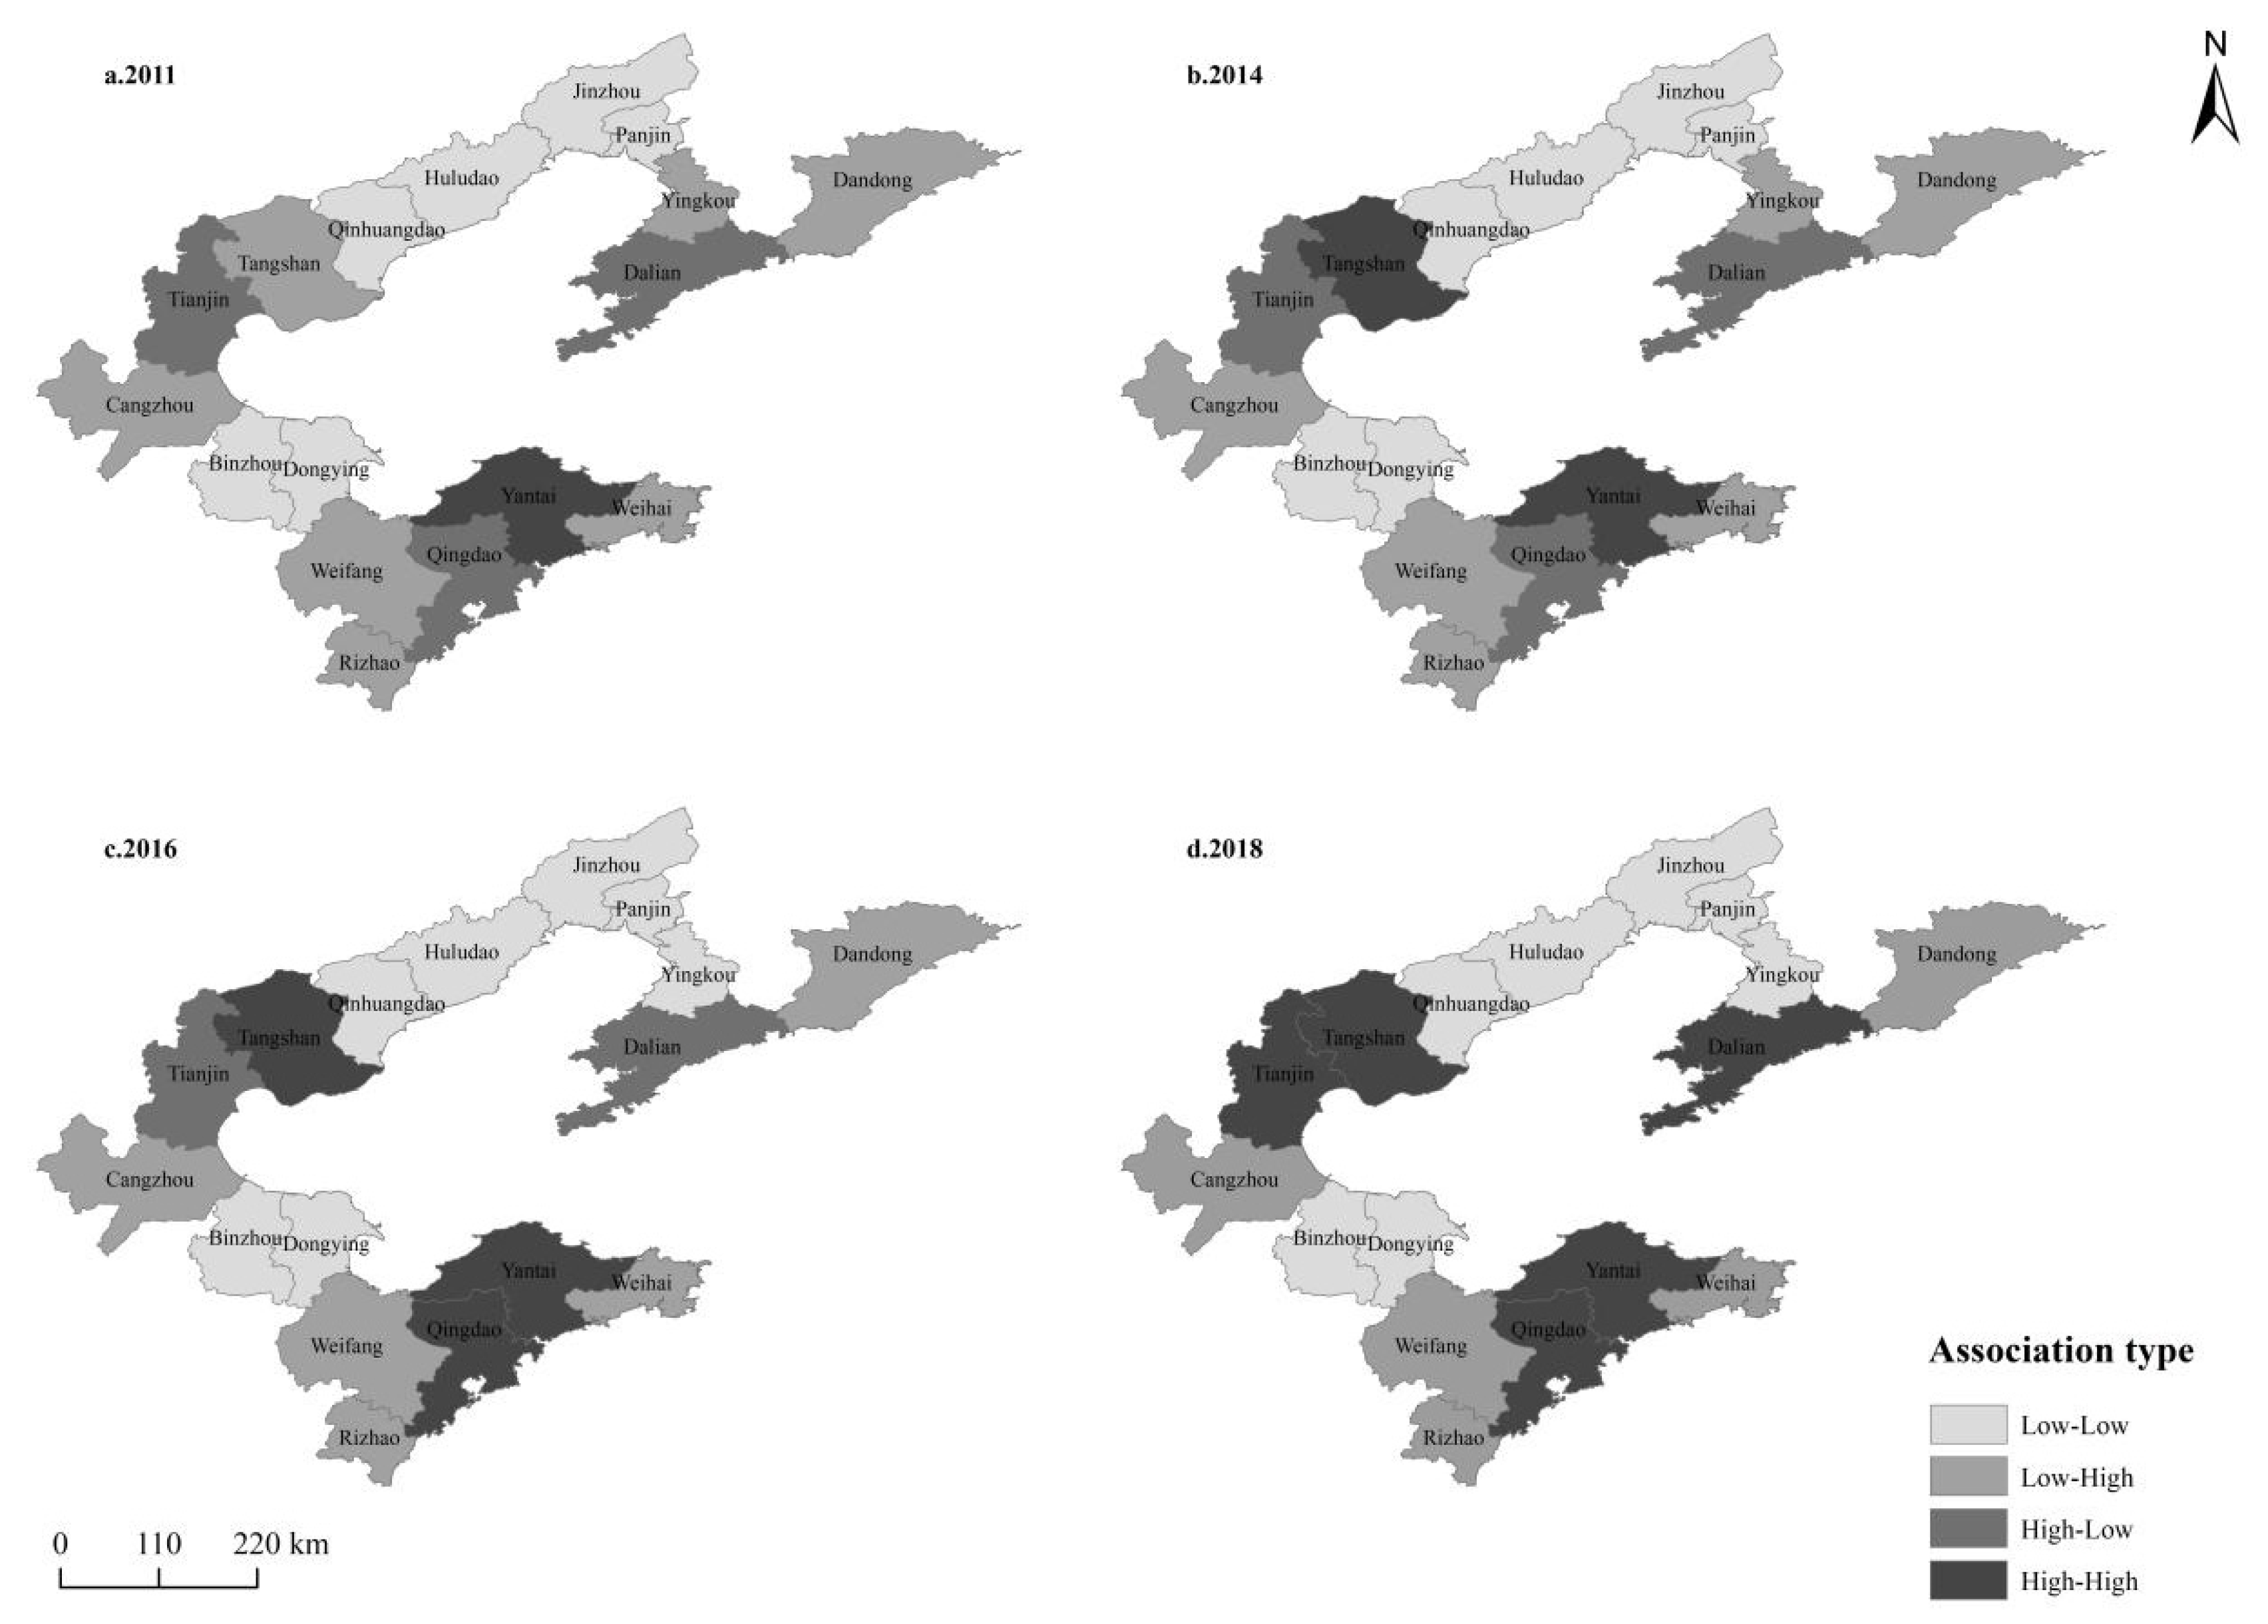
The global spatio-temporal autocorrelation index analyses revealed the overall regional spatio-temporal association pattern of the Bohai Rim cities’ sea–land-integrated eco-economy (Figure 4). However, the spatio-temporal associations among cities within a specific region could not be explored and thus require further analysis using a local spatio-temporal autocorrelation index.
In terms of relative length (Figure 4), during the study period, Yantai maintained the H–H spatio-temporal association and a more stable agglomeration effect. In 2011, Dalian, Qingdao, and Tianjin exhibited the H–L type of association, indicating that big cities had not formed a kind of agglomeration drive at the time. The surrounding cities remained in the L–L type or L–H type. In 2018, three H–H type agglomerations were formed in the north, centre, and south, containing Dalian, Tianjin, Tangshan, Qingdao, and Yantai as the central cities. The distribution of the L–L type associations was relatively stable and followed the line from Qinhuangdao to Yingkou, including the two adjacent cities of Binzhou and Dongying. Only Yingkou was of the L–H type before 2014 and became L–L after 2018, a phenomenon that indicates the reduced aggregation effect of adjacent large cities. The distribution of cities in the local spatio-temporal heterogeneity H–L and L–H types was more dispersed and relatively variable, with Qingdao in 2016 and Dalian and Tianjin in 2018 entering the H–H type association from the H–L type. These three cities are surrounded by the dispersed distribution of Dandong, Cangzhou, Tangshan, Weifang, Rizhao, and Weihai, L–H type cities, with Tangshan entering the H–H type association from the L–H type in 2014.
Summary of considerations from the spatial-temporal autocorrelation analysis of the development level of the sea-land integration ecological economy in cities around the Bohai Sea: First, the global spatiotemporal autocorrelation index of cities around the Bohai Sea changed from negative to positive spatio-temporal correlation (i.e., from spatio-temporal heterogeneity to spatio-temporal aggregation). Secondly, the spatio-temporal association pattern of cities around the Bohai Sea (H–L and H–H types) changed frequently, whereas the rest of the spatio-temporal units did not change significantly. The development of the sea and land integration ecological economies of cities around the Bohai Sea basically formed three major agglomerations, with Dalian in the north, Yantai and Qingdao in the south, and Tianjin and Tangshan in the centre as the core cities. However, it also contains the L–L type area along the line from Qinhuangdao to Yingkou, Binzhou, and Dongying, and L–H type spatio-temporal heterogeneous units attached to the dispersed distribution of H–H type cities. Therefore, large cities should strengthen their agglomeration effect and develop their role as a radiating force for the surrounding cities, creating an integrated economy that is efficient, energy-saving, green, technological, and dynamic.
4.3. Analysis of Spatio-Temporal Dynamic Patterns in Terms of Integration Capacity
The LISA time path is based on the temporal migration of LISA coordinates in a Moran scatter plot. The spatio-temporal cooperative changes within the local area of elements are described, and the spatio-temporal dynamics of their local spatial differences were determined. The GeoDaV1.20 operation programme was used to output LISA coordinates of the development level of sea–land integration ecological economy in cities around the Bohai Sea based on the original data of the sea–land integration economy in cities around the Bohai Sea (Table 2).
4.3.1. LISA Time Path Geometry Features
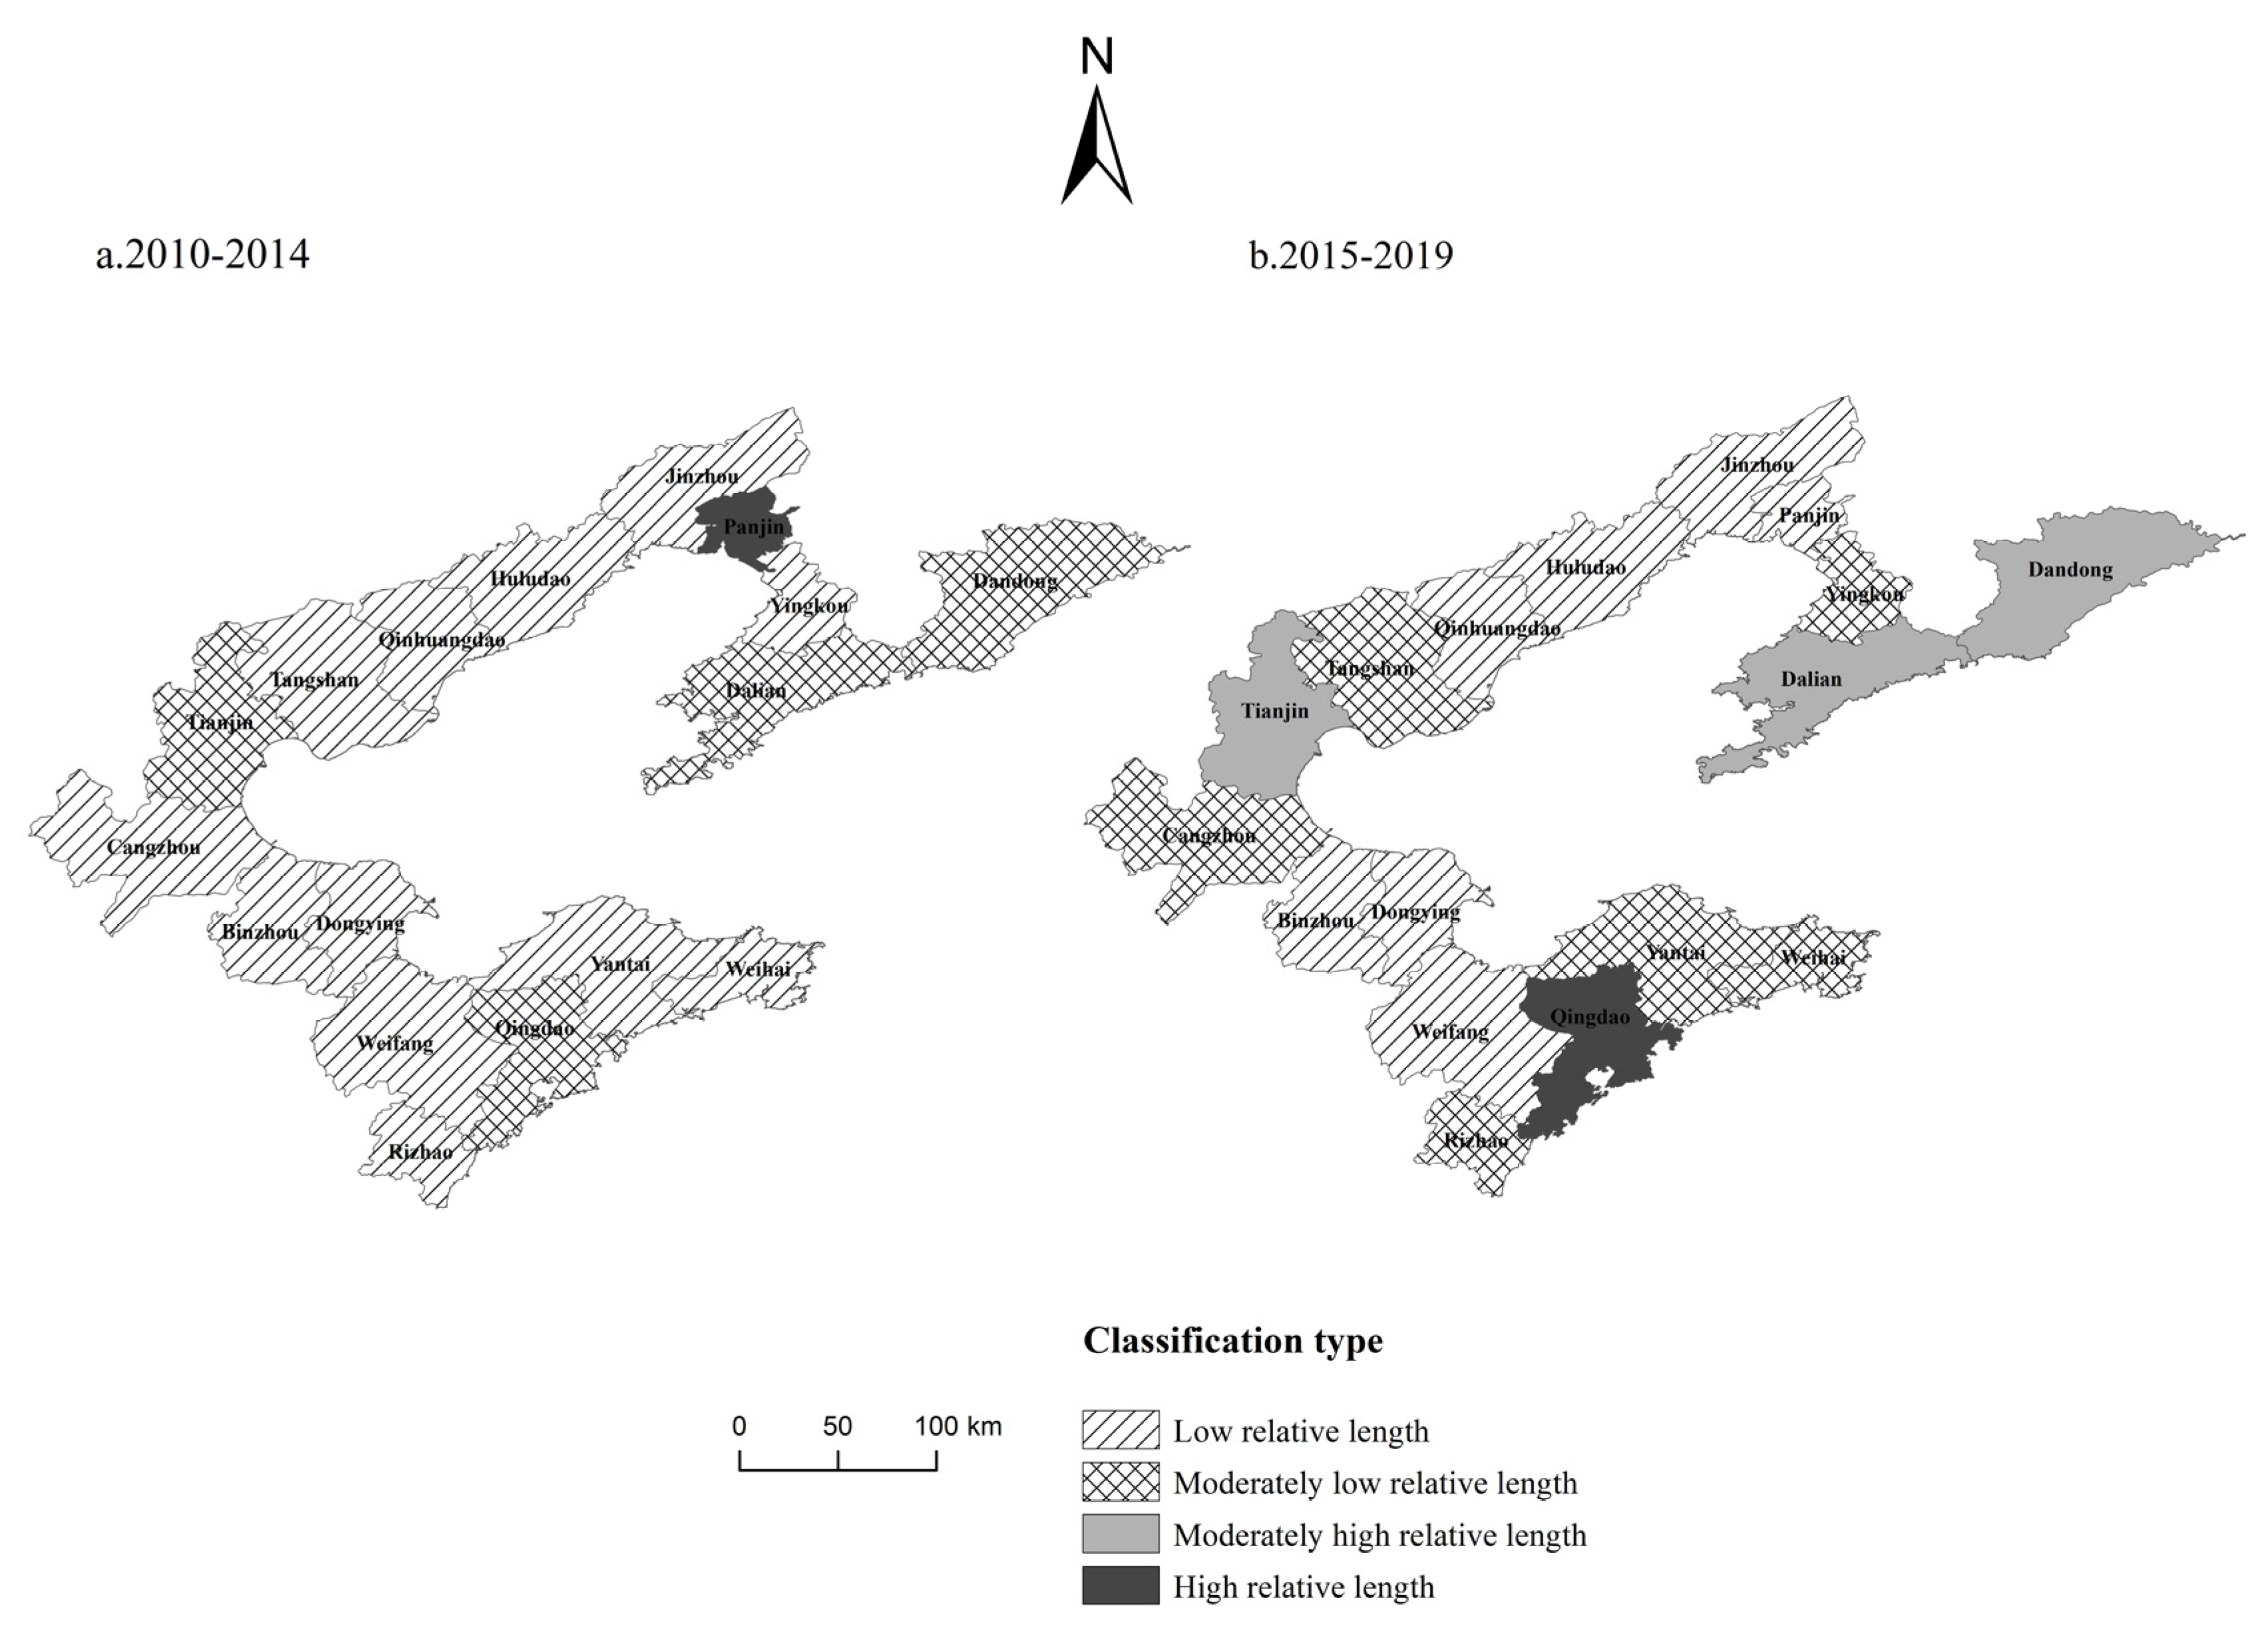
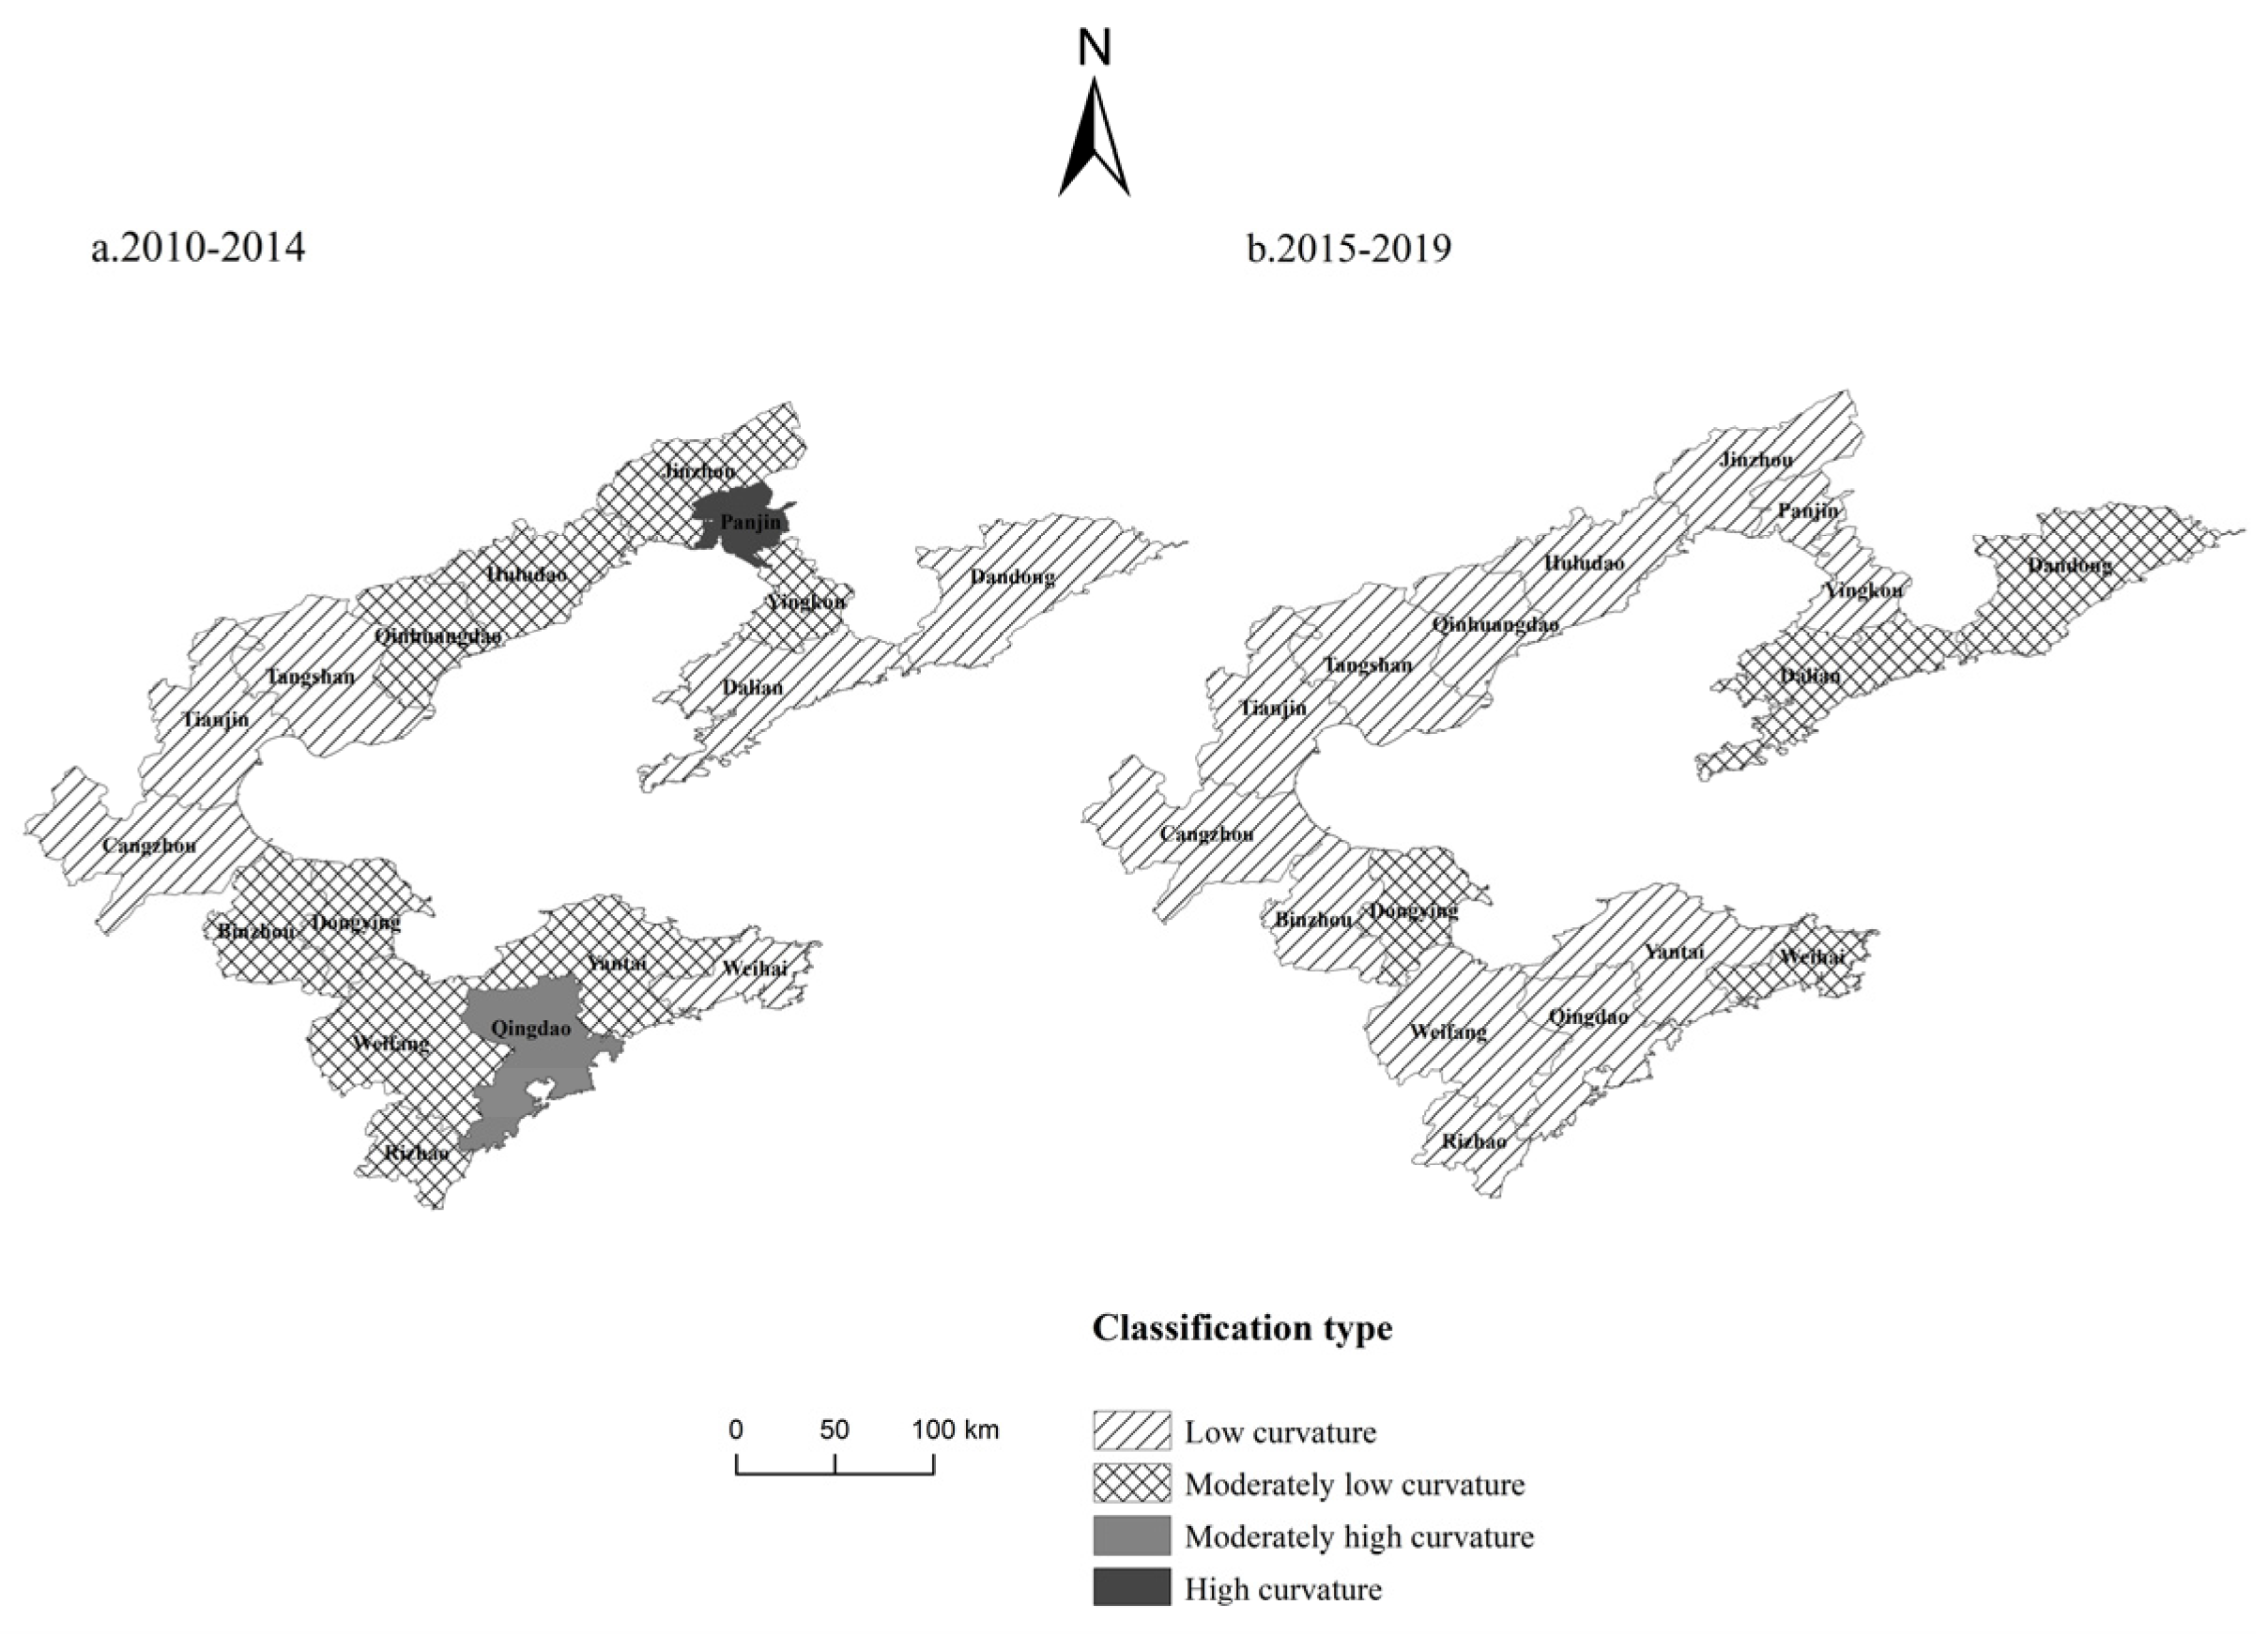
LISA time path analysis was carried out for two time periods: 2010–2014 and 2015–2019, using Equation (5). The results were normalised to low relative length (low curvature), moderately low relative length (moderately low curvature), moderately high relative length (moderately high curvature), and high relative length (high curvature). ArcGIS 10.2 software was used to visualise the relative length (curvature) of the LISA time path (Figure 5 and Figure 6).
In terms of relative length (Figure 5), the local spatial structure of the ecological economy of sea–land integration in Bohai Rim cities was highly stable. Panjin was a high relative length city in 2010–2014 and was highly unstable. Dandong, Dalian, Tianjin, and Qingdao had a moderately low relative length and more stable local spatial structure; most cities were of low relative length and had a highly stable local spatial structure. The number of cities with high relative lengths remained relatively unchanged from 2015 to 2019; however, Qingdao and Panjin significantly shifted to have low relative lengths. Dandong, Dalian, and Tianjin shifted to a moderately high relative length, and Yingkou, Tangshan, Cangzhou, Rizhao, Yantai, and Weihai shifted from low relative lengths to moderately low relative lengths. Qingdao, Tianjin, and Dalian shifted to moderately high relative lengths and high relative lengths, and the local spatial structures had a strong dynamic in which their aggregation effects increased, further contributing to their driving radiative role to surrounding cities which have low relative lengths (from 12 to 7), primarily including Tangshan, Yingkou Line, Cangzhou, and the Rizhao region. The local spatial structure in these cities was the most stable, primarily because these cities have a similar urban base. The low and moderately low relative lengths were 15 and 13 in the two periods, indicating that the Bohai Rim is an area with a stable ecological and economic local spatial structure of land and sea integration.
In terms of curvature (Figure 6), the process of local spatially dependent change in the ecological economy of sea–land integration in cities around the Bohai Sea is stable. From 2010 to 2014, Panjin, a high-curvature city, had the most volatile process of local spatial dependence; Qingdao, a moderately high-curvature city, had more volatile growth and local spatial dependence; Dandong, Dalian, Tangshan, Tianjin, Cangzhou, and Weihai, low-curvature cities, had the most stable growth and local spatial dependence; and the remaining cities were all moderately low-curvature. From 2015 to 2019, Dalian, Dandong, and Weihai evolved into moderately low-curvature cities; the number of low-curvature cities increased from 6 to 13, showing an upward trend. Regarding spatial distribution, high curvature and moderately high curvature cities disappeared, and low curvature cities showed a clear trend of contiguity in their spatial distribution.
4.3.2. LISA Time Path Transfer Direction
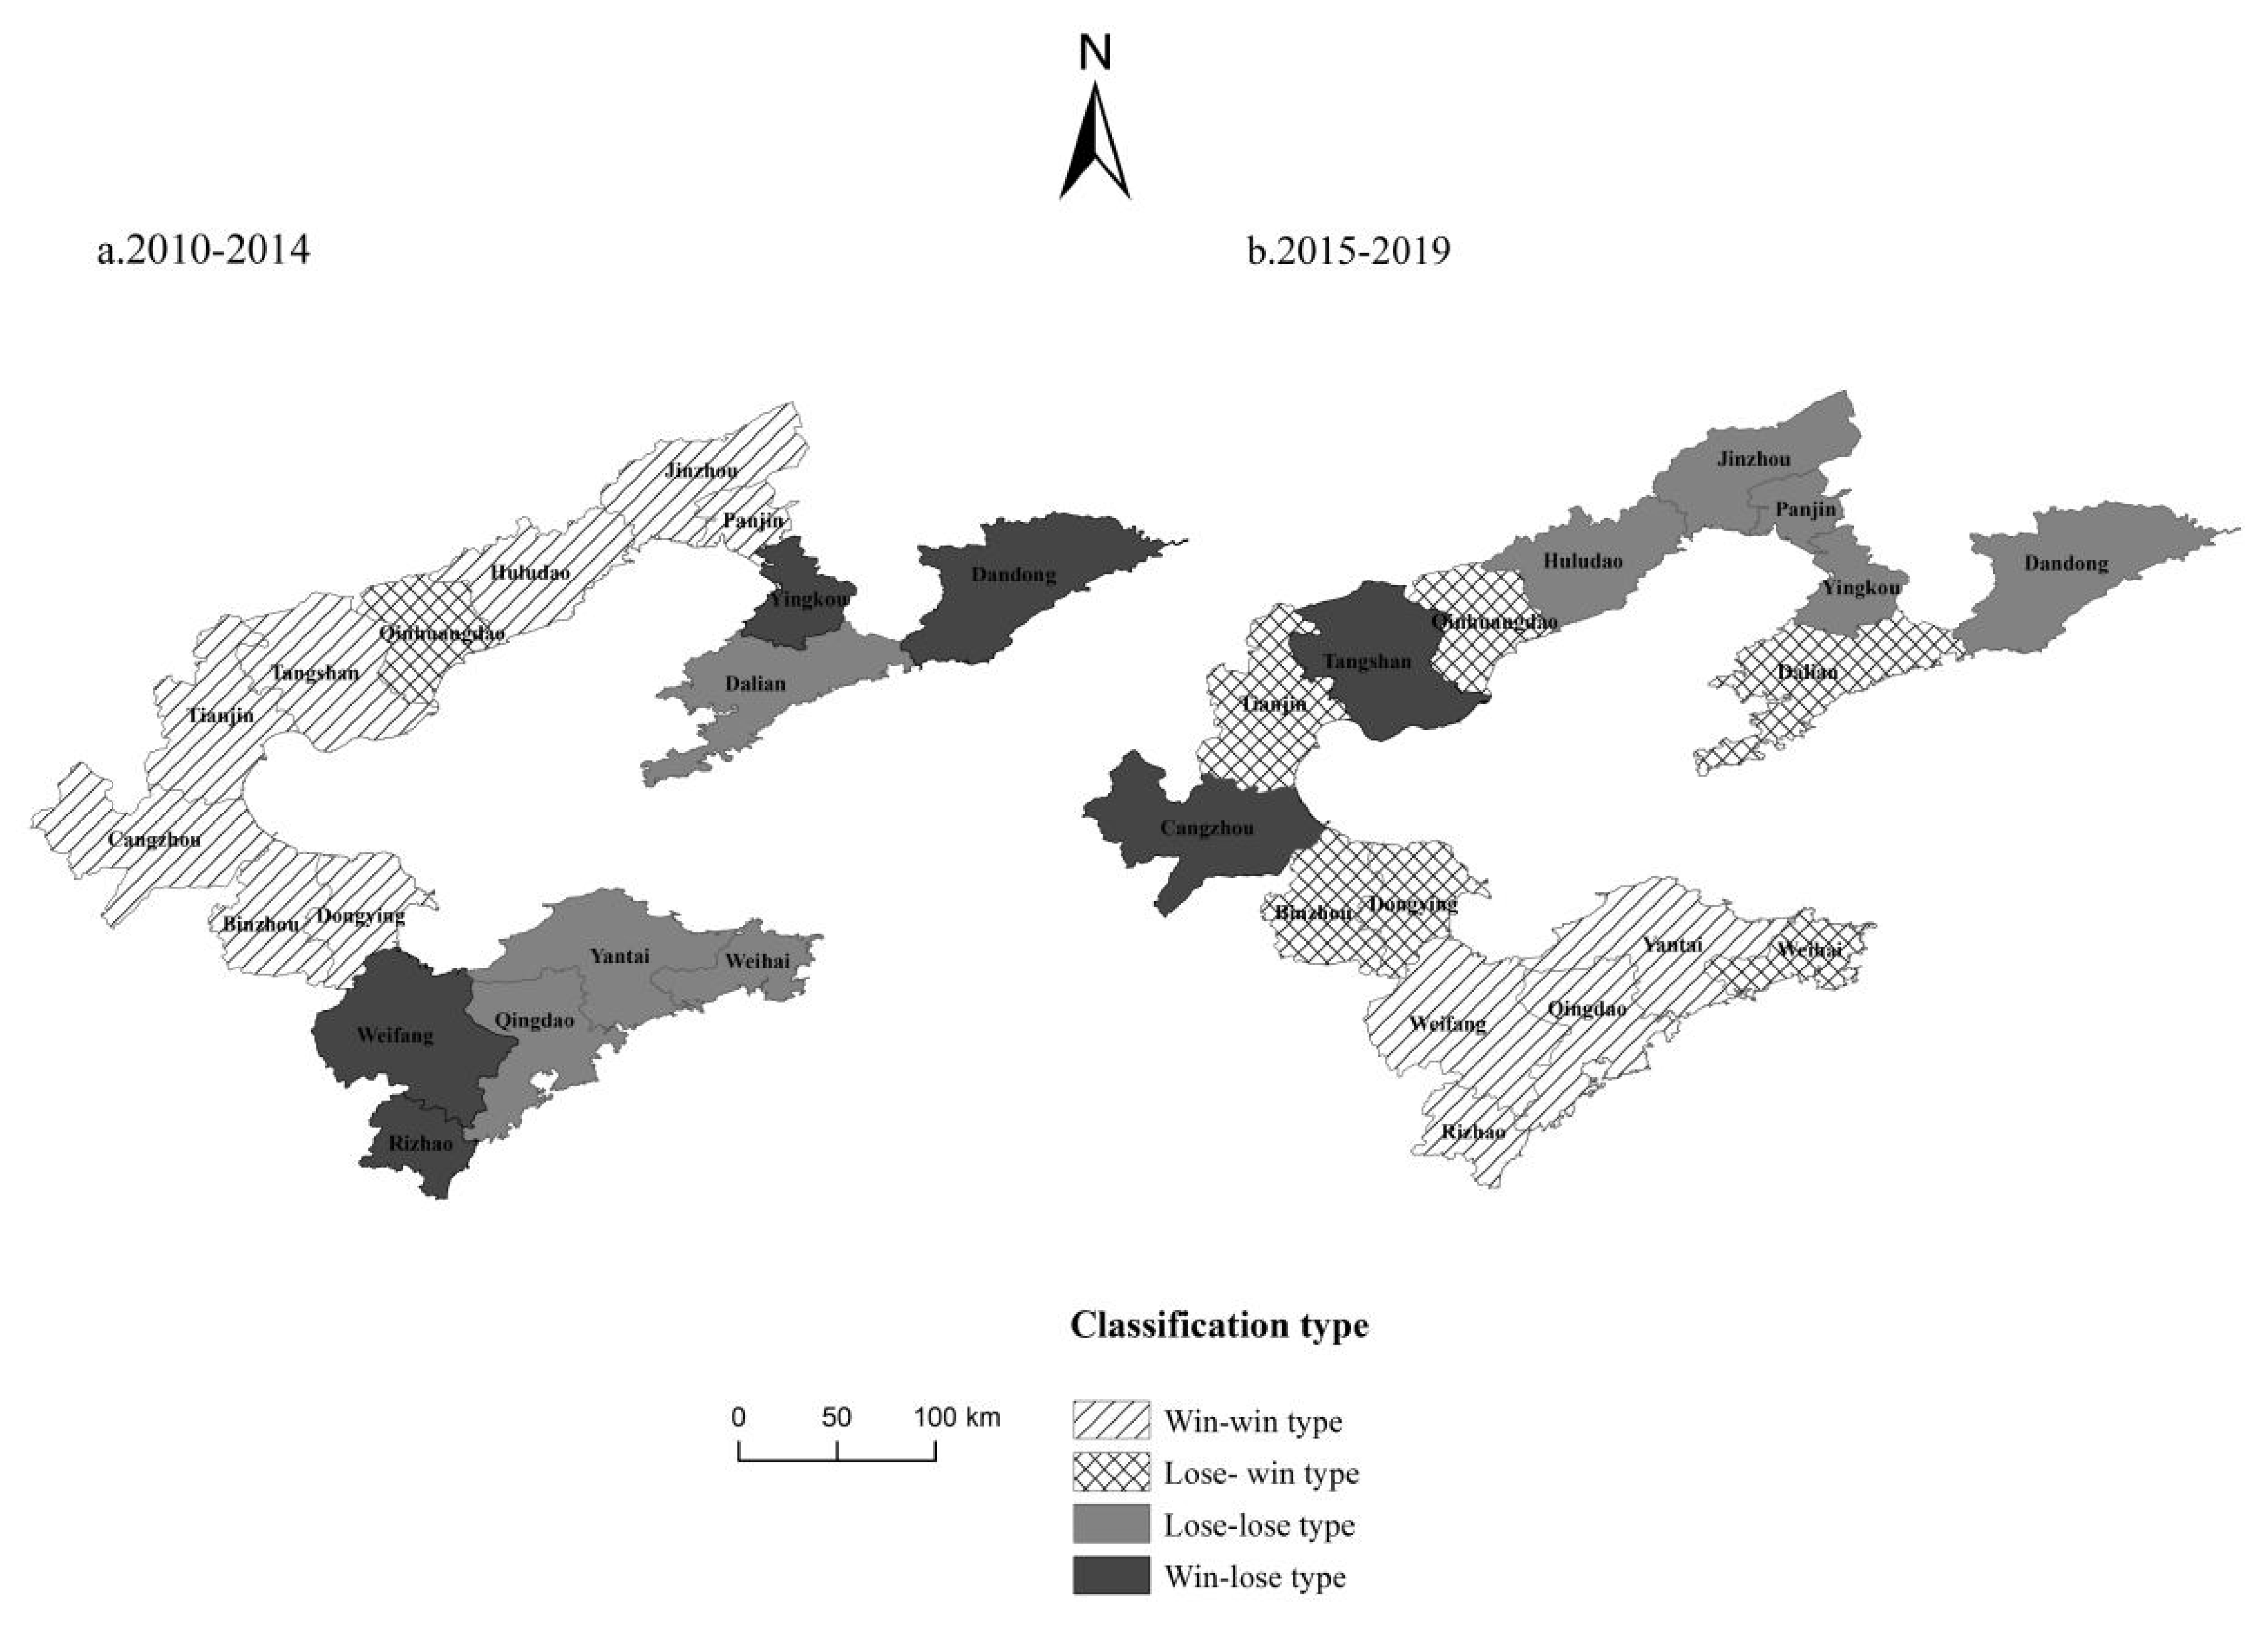
The LISA time path movement directions can be used to reveal the spatial integration characteristics of the changes in the local spatial patterns of geographical elements. By comparing the positions of Moran’s I scatter diagrams in 2010, 2014, 2015, and 2019, the movement directions of LISA coordinates in Bohai Rim cities were calculated and classified into four categories, among which 0–90° was the mutually beneficial type, indicating a synergistic positive growth trend of geographical elements in a region and its neighbouring regions; 90–180° and 270–360° were lose–win and win–lose types, respectively, indicating a reverse growth trend; and 180–270° was a lose–lose type, indicating a synergistic negative growth trend. The results are shown in Figure 7.
In terms of the direction of the LISA shift (Figure 7), the spatial integration of the Bohai Rim cities in the spatial pattern of the ecological and economic integration of land and sea is decreasing, and the pattern of synergy and competition is increasingly prominent. From 2015 to 2019, the number of mutually beneficial cities decreased to four, and they were located in Shandong with an overall shift to the south, where the cities exhibited relatively rapid development. Five cities were lose–lose, with a spatial distribution that shows a spreading trend to the north. The number of cities with coordinated growth declined from 8 in 2010–2014 to 4 in 2015–2019, indicating a shift from a synergistic growth-led ecological economy to a pattern of synergy and competition and a decline in spatial integration in Bohai Rim cities.
Summary of considerations from analysing the development level of sea-land integration ecological economy in cities around the Bohai Sea through the exploratory spatio-temporal data analysis model: First, in terms of relative length, the Bohai Rim is an area with a stable ecological and economic local spatial structure of land and sea integration. Secondly, in terms of curvature, the process of local, spatially dependent change in the ecological economy of sea-land integration in cities around the Bohai Sea is stable. Last, in terms of the direction of the LISA shift, a shift from a synergistic growth-led ecological economy to a pattern of synergy and competition and a decline in spatial integration in Bohai Rim cities is indicated.
4.4. Predicting Trends in the Development of Integration Capacity
The MATLAB 9.0 software suite was used to develop a spatio-temporal prediction programme model for the level of the ecological economy of marine and terrestrial integration of each Bohai Rim city. The MATLAB programme was verified and executed in a MATLAB window. The predictions were based on the integration level data for Bohai Rim cities as shown in Table 2. The predictions are depicted in Figure 8. Before predicting, the data had to be validated, and the programme was only executed after verifying the feasibility of the modelling method.
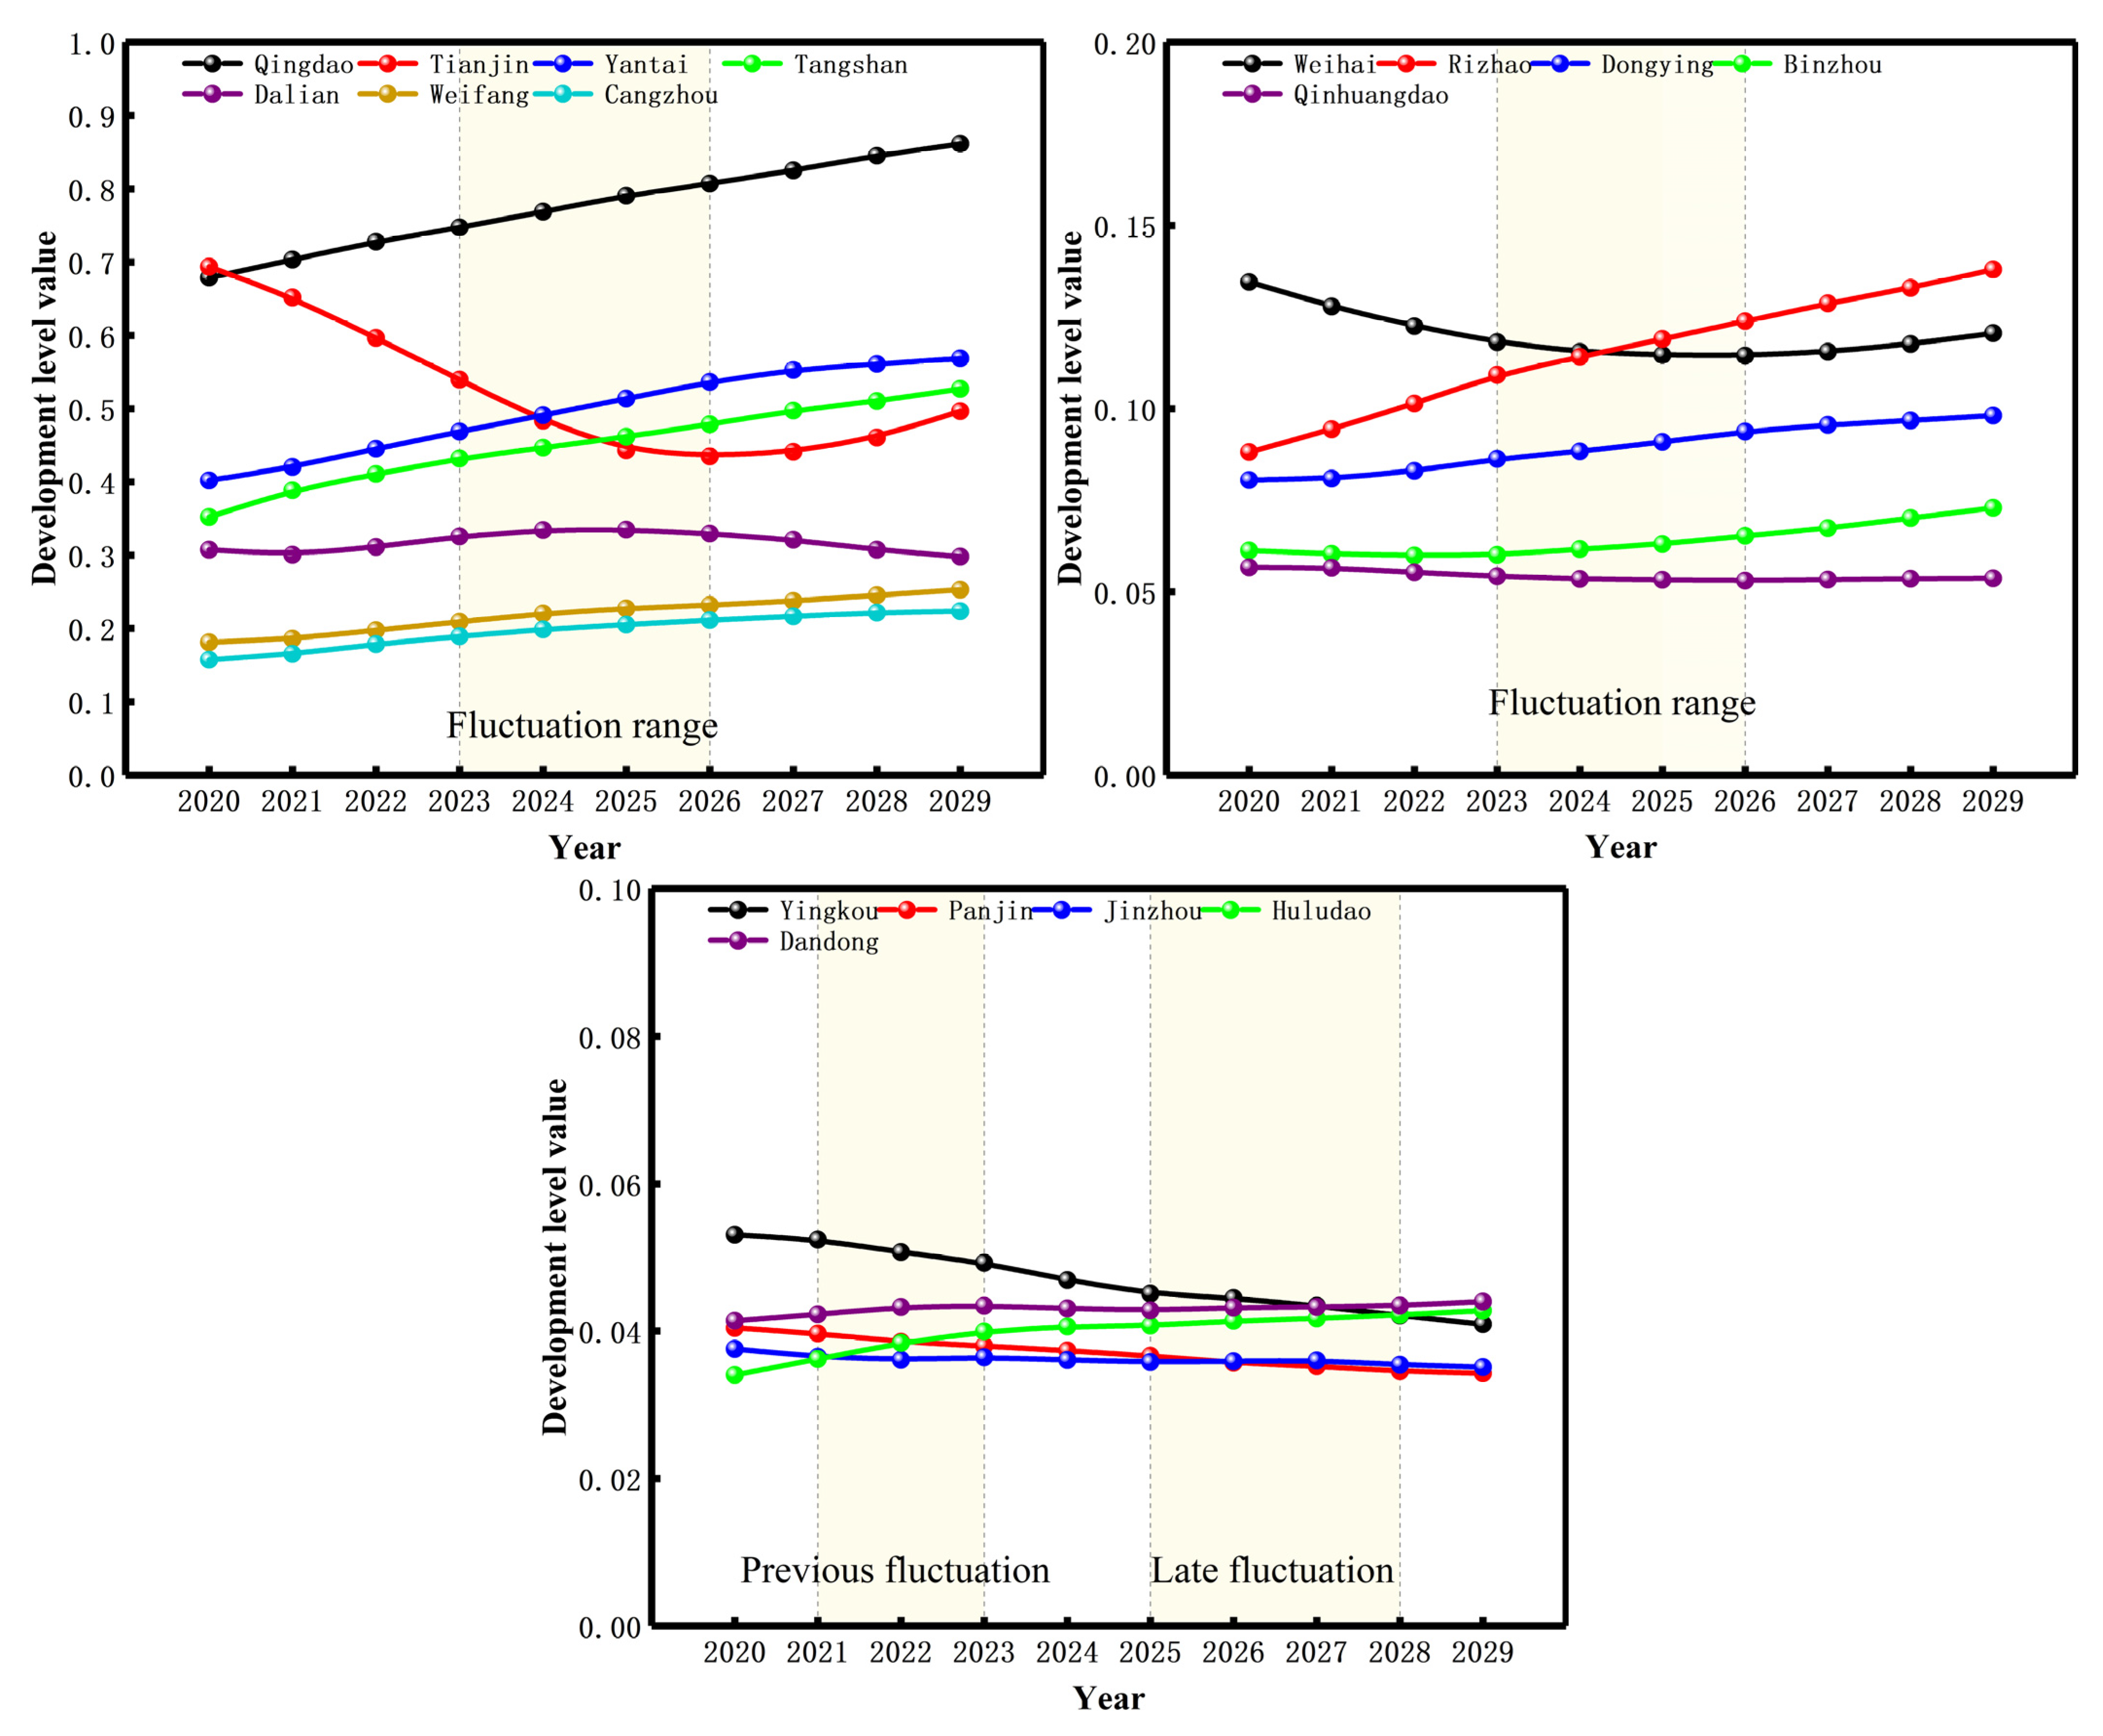
The prediction results of the operation output show that the development level range was [0.86, 0.034] from 2020 to 2029, which is a development period (Figure 8). During this period, the development gap between cities around the Bohai Sea increases; however, most cities exhibit an upward trend, indicating that the current series of measures for marine economic development are conducive to integrated development. However, different cities have different rising ranges and a significant gap. In the past, the gap gradually widened, such as in Panjin, Jinzhou, and Huludao. The forecast value of Dandong was low, and those of Weifang, Cangzhou, Tangshan, and Yantai sharply increased. The values for Tianjin and Dalian exhibited a fluctuating trend; however, they always maintained a high level. Qingdao maintained a stable growth trend and a high level of integration.
The predicted development level of economic integration between sea and land in Bohai Rim cities is divided into three levels: the high-, medium-, and low-value zones. As shown in Figure 8, the high-value zone contains Qingdao, Tianjin, Yantai, Tangshan, Dalian, Weifang, and Cangzhou, with fluctuations primarily between 2023 and 2026, Yantai and Tangshan increasing more than Tianjin, Tianjin decreasing and then increasing again, and Qingdao maintaining a high level. The medium-value zone contains Weihai, Rizhao, Dongying, Binzhou, and Qinhuangdao, with fluctuations primarily between 2023 and 2026. In 2023–2025, the development level of Rizhao exceeds that of Weihai, whereas that of the other cities remains relatively stable. The low-value zone contains Yingkou, Panjin, Jinzhou, Huludao, and Dandong, and it has a smaller overall value range and smaller fluctuation areas. In the low-value zone, Huludao increases more than Jinzhou and Panjin during 2021–2023, Yingkou declines, and Dandong and Huludao increased from 2015–2018. Overall, the forecasted values for the level of economic integration between sea and land in Bohai Rim cities maintained the trend and pattern of the original study period, with several high-value cities remaining at a high level and some cities having smaller differences between fluctuations.
Summary of considerations seen from the predicted value of development levels: The development gap between cities around the Bohai Sea increased; however, most cities exhibited an upward trend. These results call for attention to the development of the sea and land economies of big cities and the surrounding cities to ensure balance in large regions. Notably, the sea and land economic development of big cities should play a leading role in maintaining the steady growth of the integration level and contributing to the steady progress of the regional sea and land economies.
5. Discussion
A series of analyses showed that the sea–land integrated ecological economy of Bohai Rim cities is not optimal and that most cities are at a low level of slow growth; only some large cities exhibit high and rapid growth. The development of the ecological economy of a city’s land and sea integration is dependent on the city’s original economic resources and transportation, among other foundational factors; new development models and innovation cannot be explored, and the resource development system layer level is low and has slow growth. These factors indicate the need for improvements in science, technology, and the ecological environment.
The development of the ecological economy of sea–land integration in cities around the Bohai Sea has resulted in the formation of three major radiation circles with Tianjin, Qingdao, and Dalian as the core cities, indicating the need to strengthen the radiation role of the core cities. According to the actual situation of the core cities and the surrounding cities, we could enhance the economic development of sea–land integration and better promote the high-quality development of the sea–land economy.
The analysis of a spatio-temporal autocorrelation model shows that the interconnection and establishment of cooperation and communication between the regions of the sea–land-integrated ecological economy in the early stages of development is crucial for ultimate mutual development. Regional differentiation leads to a complexity of changes in spatial and temporal associations. However, positive and negative spatio-temporal effects indicated by Moran’s I and the spatial complexity of the distribution of each city indicate that the sea–land-integrated eco-economies of the Bohai Rim cities are interconnected, however, they have not formed a coordinated development model with close interconnection.
According to LISA time path analysis, the central Bohai Sea is a region with a stable local spatial structure of the sea–land-integrated ecological economy. The decline in the number of cities with coordinated growth indicates that cities around the Bohai Sea have changed from an ecological economy dominated by coordinated growth to a cooperative competition model, and the degree of spatial integration has declined.
6. Conclusions
From 2009 to 2019, the development level of the sea–land integrated ecological economy in cities around the Bohai Sea trended upward. However, significant differences were observed among cities, as each one had different starting points and incremental changes. Although certain cities showed large fluctuating uptrends, most showed small changes with low viscosity (0.017–0.186).
The global spatio-temporal Moran’s I for the Bohai Rim cities changed from negative to positive spatio-temporal correlations, however, it always remained at a low level. The local spatio-temporal Moran’s I and H–L and H–H types of spatio-temporal correlations significantly varied, whereas the remaining spatio-temporal units did not.
The low and moderately low relative lengths were 15 and 13 in the two periods, respectively. In terms of spatial distribution, high curvature and moderately high curvature cities disappeared, and low curvature cities showed a clear trend of contiguity in their spatial distribution. The number of cities with coordinated growth declined from 8 in 2010–2014 to 4 in 2015–2019. The prediction results of the operation output coordination degree showed that the coordination degree range was [0.86, 0.034] from 2020 to 2029, which is a development period.
Author Contributions
Conceptualisation, Z.Y.; Methodology, Z.Y.; Software, Z.Y. and X.C.; Validation, Z.Y. and Q.D.; Investigation, Q.D.; Data curation, Z.Y. and X.C.; Writing—original draft preparation, Z.Y.; Writing—review and editing, Z.Y. and Q.D.; Supervision, Q.D.; Funding acquisition, Q.D. All authors have read and agreed to the published version of the manuscript.
Funding
This work was funded by the National Natural Science Foundation of China [grant number 42076222], Major Project in Key Research Base for Humanities and Social Sciences of Ministry of Education [grant number 17JJD790010], and Marine Special General Project of Liaoning Provincial Department of Education [grant number H201783629].
Institutional Review Board Statement
Not applicable.
Informed Consent Statement
Not applicable.
Data Availability Statement
The data presented in this study are not publicly available due to confidentiality agreements.
Conflicts of Interest
The authors declare no conflict of interest.
References
- Tang, H.X.; Zhang, X.Z.; Wang, L.X. Research on temporal-spatial evolution and mechanism of integration of marine and terrestrial economy in China. China Soft Sci. Mag. 2020, 12, 130–144. [Google Scholar]
- Xiao, L. Land and sea coordination, Constructing “one belt, one road”. Pac. J. 2014, 22, 2–4. [Google Scholar]
- Xu, Z.; Yang, P.; Xiao, Q.Q.; Li, K.Q. An empirical study on the relationship between marine tertiary industry and regional economic development in coastal areas. Ocean Dev. Manag. 2021, 38, 73–78. [Google Scholar]
- Li, X.Y.; Yang, Y.; Liu, Y.; Chen, Y.Y.; Xia, S.Y. The systematic structure and trend simulation of China’s man-land relationship until 2050. Sci. Geogr. Sin. 2021, 41, 187–197. [Google Scholar]
- Zhang, H.F. Developing a powerful country by coordinating the sea and land: Implementing the strategy of coordinating the sea and land and establishing a scientific outlook on energy. Pac. J. 2005, 3, 27–33. [Google Scholar]
- Di, Q.B.; Sun, Y. Correlation of marine economy and social change in coastal areas: A case study in Liaoning Province. Prog. Geogr. 2014, 33, 713–720. [Google Scholar]
- Ma, R.F.; Hou, B.; Zhang, W.Z.; Yuan, H.H.; Dou, S.M. Estimates of marine industry impact on provincial economic growth and its identification of differentiation dynamics in 2006–2015. Sci. Geogr. Sin. 2018, 38, 177–185. [Google Scholar]
- Qu, L.L.; Wang, X.Y.; Cheng, Y.Y. The effect research of marine technology innovation on regional economic growth. Sci. Technol. Ind. 2021, 21, 15–22. [Google Scholar]
- Sun, C.Z.; Guo, K.M. Chinese marine economic polarization based on DER-Wolfson index. Sci. Geogr. Sin. 2019, 39, 920–928. [Google Scholar]
- Cristina, I.O.M.; Nicoleta, C.; Cătălin, D.R.; Margareta, F. Regional development in romania: Empirical evidence regarding the factors for measuring a prosperous and sustainable economy. Sustainability 2021, 13, 3942. [Google Scholar] [CrossRef]
- Pasquali, D.; Marucci, A. The effects of urban and economic development on coastal zone management. Sustainability 2021, 13, 6071. [Google Scholar] [CrossRef]
- Pickaver, A.H.; Gilbert, C.; Breton, F. An indicator set to measure the progress in the implementation of integrated coastal zone management in Europe. Ocean Coast. Manag. 2004, 47, 449–462. [Google Scholar] [CrossRef]
- Whisnant, R.; Vandeweerd, V. Investing in the new blue economy: The changing role of international development organizations in catalyzing private sector investment in support of regional strategic action programmes for the sustainable development of coasts and oceans. J. Ocean Coast. Econ 2019, 6, 8. [Google Scholar] [CrossRef]
- Di, Q.B.; Liang, Q.Y. Spatiotemporal difference of marine eco-efficiency and identification of its response relationship with marine industrial structure in China. Sci. Geogr. Sin. 2018, 38, 1606–1615. [Google Scholar]
- Di, Q.B.; Yu, Z.; Xu, L.X. Spatial-temporal coordination mode of marine economic development under the background of high quality growth: Based on the empirical study of prefecture-level cities in Circum-Bohai Sea. Sci. Geogr. Sin. 2019, 39, 1621–1630. [Google Scholar]
- Yu, Z.; Di, Q.B. The coordination between maritime economies and marine carrying capacity and their spatiotemporal evolution in the cities of the bohai rim in china. Ecol. Model. 2020, 438, 109192. [Google Scholar] [CrossRef]
- Zhao, Y.P.; Cao, G.Z. A correlative analysis of the economic and envirnmental coupling in Shenyang economic zone. Areal Res. Dev. 2014, 33, 21–26+48. [Google Scholar]
- Li, Q.Y. Promoting high-quality economic development with the power of creative destruction “integration—System and mechanism innovation to solve the” two skins “of science and technology and economy”. Res. Financ. Econ. Issues 2022, 462, 128–129. [Google Scholar]
- Zhang, W.; Zhang, X.J.; Li, X.; Tong, J.; Fan, Z.L. Fusion and evaluation of airborne gravity data and ground gravity data in sea-land transition zone. Acta Geol. Sin. 2020, 94, 2545–2555. [Google Scholar] [CrossRef]
- Jupiter, S.D.; Wenger, A.; Klein, C.J.; Albert, S.; Mangubhai, S.; Nelson, J.; Teneva, L.; Tulloch, V.J.; White, A.T.; Watson, J.E.M. Opportunities and constraints for implementing integrated land–sea management on islands. Environ. Conserv. 2017, 44, 254–266. [Google Scholar] [CrossRef]
- Harris, L.R.; Bessinger, M.; Dayaram, A.; Holness, S.; Kirkman, S.; Livingstone, T.C.; Lombard, A.T.; Lück-Vogel, M.; Pfaff, M.; Sink, K.J. Advancing land-sea integration for ecologically meaningful coastal conservation and management. Biol. Conserv. 2019, 237, 81–89. [Google Scholar] [CrossRef]
- Mensah, P.; Katerere, D.; Hachigonta, S.; Roodt, A. Systems analysis approach for complex global challenges. Resil. Meas. Ecosyst. Socioecon. Netw. 2018, 11, 183–208. [Google Scholar] [CrossRef]
- Moiseev, S.; Kalinina, N.; Shevchenko, L.; Poryadina, V. Management models for complex socioeconomic systems. E3S Web Conf. 2021, 244, 11002–110022. [Google Scholar] [CrossRef]
- Pamplona, E.; Fiirst, C.; Silva, T.; Zonatto, V. Sticky costs in cost behavior of the largest companies in Brazil, Chile and Mexico. Contaduría Y Adm. 2016, 61, 682–704. [Google Scholar] [CrossRef]
- Takuya, M.; Eiji, H. On kinetic theory viscosity in a rotating gas. Prog. Theor. Phys. 2004, 112, 357–362. [Google Scholar] [CrossRef]
- Di, Q.B.; Han, Y.X. Sustainable development ability of China’s marine ecosystem in the perspective of entropy. J. Geogr. Sci. 2014, 34, 664–671. [Google Scholar] [CrossRef]
- Sherwin, W.B.; Prat I Fornells, N. The introduction of entropy and information methods to ecology by Ramon Margalef. Entropy 2019, 21, 794. [Google Scholar] [CrossRef] [PubMed]
- Liu, Y.H.; Xue, Y. Geographical identification and classification of multidimensional poverty in rural China. Acta Geogr. Sin. 2015, 70, 993–1007. [Google Scholar]
- Wartenberg, D. Multivariate spatial correlation- a method for exploratoty geographical analysis. Geogr. Anal. 1985, 17, 263–283. [Google Scholar] [CrossRef]
- Shao-Kuan, C.; Wei, W.; Bao-Hua, M.; Wei, G. Analysis on urban traffic status based on improved spatio—temporal Moran’s I. Acta Phys. Sin. 2013, 62, 527–533. [Google Scholar] [CrossRef]
- Wang, J.F. Spatial Analysis; Science Press: Beijing, China, 2006. [Google Scholar]
- Xue, J.; Ding, J.; Zhao, L.; Zhu, D.; Li, L. An option pricing model based on a renewable energy price index. Energy 2022, 239, 117–122. [Google Scholar] [CrossRef]
- Yang, J.B.; Ma, X.Q. Prediction of forest fire in Guangdong Province Based on artificial neural network. Sci. Silvae Sin. 2005, 4, 127–132. [Google Scholar]
- Gan, L.; Shi, H.; Hu, Y.; Lev, B.; Lan, H. Coupling coordination degree for urbanization city-industry integration level: Sichuan case. Sustain. Cities Soc. 2020, 58, 102–136. [Google Scholar] [CrossRef]
- Ginis, L.A. The use of fuzzy cognitive maps for the analysis of structure of social and economic system for the purpose of its sustainable development. Mediterr. J. Soc. Sci. 2015, 6, 113–118. [Google Scholar] [CrossRef]
- Da, Q.L.; He, J.M.; Xu, N.R. The multiobjective hierarchical planning of a regional water environment-economy system. IFAC Proc. Vol. 1989, 22, 531–536. [Google Scholar] [CrossRef]
- Li, Y.P.; Liu, D.H.; Luo, T. The internal logic and developing direction of land-sea coordination in land space planning: From the perspective of complex system theory. Geogr. Res. 2021, 40, 1902–1916. [Google Scholar]
- Duan, Z.X.; Wang, M. A study on sea-land industry interactive development in Shandong peninsula blue economic zone. J. Ocean Univ. China 2016, 4, 9–13. [Google Scholar]
- Jacob, F. Preparing industrial suppliers for customer integration. Ind. Mark. Manag. 2006, 35, 45–56. [Google Scholar] [CrossRef]
- Polleux, L.; Guerassimoff, G.; Marmorat, J.P.; Sandoval-Moreno, J.; Schuhler, T. An overview of the challenges of solar power integration in isolated industrial microgrids with reliability constraints. Renew. Sustain. Energ. Rev. 2022, 155, 111955. [Google Scholar] [CrossRef]
- Chen, H.L.; Shi, X.L.; Li, J.L. A summary of the research on the social and economic relationship between land sea and its evolution. Ocean Dev. Manag. 2020, 37, 84–92. [Google Scholar]
- Sun, C.; Tong, Y.; Zou, W. The evolution and a temporal-spatial difference analysis of green development in China. Sustain. Cities Soc. 2018, 41, 52–61. [Google Scholar] [CrossRef]
- Lin, D.A.; Ruan, X.D.; Chen, B.G. Book review: Environmental hydraulics of open channel flows. Environ. Fluid Mech. 2005, 5, 387–391. [Google Scholar] [CrossRef]
- Guo, L. An analysis of the cohesion of regional industrial transfer. Econ. Geogr. 2009, 29, 395–398. [Google Scholar]
- Di, Q.B.; Han, Z. Discussion on the quantification of the carrying capacity of marine region—Taking the marine region of Liaoning for example. Bull. Mar. Sci. 2005, 24, 47–55. [Google Scholar] [CrossRef]
- Fan, J.; Zhou, K.; Wang, Y.F. Basic points and progress in technical methods of early-warning of the national resource and environmental carrying capacity. Prog. Geogr. 2017, 36, 266–276. [Google Scholar] [CrossRef] [Green Version]
Figure 1.
Location of the study area and the Circum-Bohai Sea, China. Source: geospatial data cloud.
Figure 1.
Location of the study area and the Circum-Bohai Sea, China. Source: geospatial data cloud.

Figure 2.
Conceptual relationship of the sea–land integration economy and evolution of the related development context. Source: own elaboration on the basis of 3.1 Chapter literature and theory.
Figure 2.
Conceptual relationship of the sea–land integration economy and evolution of the related development context. Source: own elaboration on the basis of 3.1 Chapter literature and theory.

Figure 3.
Proportion of Bohai Rim city system-level index (2009–2019). Source: own elaboration on the base of a system for assessing the development of a city’s capacity to integrate its marine and terrestrial ecological economies and formula (1), (2), (3), (4).
Figure 3.
Proportion of Bohai Rim city system-level index (2009–2019). Source: own elaboration on the base of a system for assessing the development of a city’s capacity to integrate its marine and terrestrial ecological economies and formula (1), (2), (3), (4).

Figure 4.
Local spatio-temporal Moran’s I of the sea–land integration ecological economic development level of cities around the Bohai Sea. Source: own study.
Figure 4.
Local spatio-temporal Moran’s I of the sea–land integration ecological economic development level of cities around the Bohai Sea. Source: own study.

Figure 5.
Relative length of the local indicators of the spatial association time path. Source: own study.
Figure 5.
Relative length of the local indicators of the spatial association time path. Source: own study.

Figure 6.
Tortuosity of the local indicators of the spatial association time path. Source: own study.
Figure 6.
Tortuosity of the local indicators of the spatial association time path. Source: own study.

Figure 7.
Movement direction of the local indicators of the spatial association time path. Source: own study.
Figure 7.
Movement direction of the local indicators of the spatial association time path. Source: own study.

Figure 8.
Prediction value of the integration capacity of each city in the Bohai Rim (2020–2029). Source: own study.
Figure 8.
Prediction value of the integration capacity of each city in the Bohai Rim (2020–2029). Source: own study.


Table 1.
System for assessing the development of a city’s capacity to integrate its marine and terrestrial ecological economies. Source: the data sources used in this study include the 2010–2020 editions of the China Marine Statistical Yearbook, China City Statistical Yearbook, Shandong Statistical Yearbook, Liaoning Statistical Yearbook, Hebei Economic Yearbook, Tianjin Statistical Yearbook, Bulletin on Environmental Quality of China’s coastal waters, and the statistical bulletins of the relevant national departments.
| Target Layer | System Layer | Index Layer |
|---|---|---|
| Basis of development fundamentals (OI) | Gross oceanic product (GOP) | |
| Share of GOP in GDP | ||
| Gross terrestrial product (GTP) | ||
| Share of GTP in GDP | ||
| Location entropy of the maritime industries | ||
| Location entropy of the terrestrial industries | ||
| Integrated economic resource development (OC) | Extent of resource abundance | |
| Marine and terrestrial environmental pressure | ||
| Capacity to integrate the marine and terrestrial ecological economy | Marine and terrestrial environmental carrying capacity | |
| Level of resource development | ||
| Resource development capacity | ||
| Resource development drive | ||
| Integrated economic industry linkage (OE) | Port cargo throughput | |
| Road cargo transport volume | ||
| Accessibility of transportation networks | ||
| Primary sector linkage effect values for sea and land | ||
| Secondary sector linkage effect values for sea and land | ||
| Tertiary sector linkage effect values for sea and land | ||
| Integrated economic outcome creation (OU) | Urbanisation rate | |
| Urban registered unemployed persons | ||
| Marine fixed asset investment | ||
| Terrestrial fixed asset investment | ||
| Life quality index |
Table 2.
Integration capacity values of cities in the Bohai Rim (2010–2019). Source: own elaboration on the basis of a system for assessing the development of a city’s capacity to integrate its marine and terrestrial ecological economies and formula (1), (2), (3), (4).
Table 2.
Integration capacity values of cities in the Bohai Rim (2010–2019). Source: own elaboration on the basis of a system for assessing the development of a city’s capacity to integrate its marine and terrestrial ecological economies and formula (1), (2), (3), (4).
| 2010 | 2011 | 2012 | 2013 | 2014 | 2015 | 2016 | 2017 | 2018 | 2019 | Average | |
|---|---|---|---|---|---|---|---|---|---|---|---|
| Dalian | 0.2887 | 0.3281 | 0.3983 | 0.4473 | 0.4580 | 0.4055 | 0.3559 | 0.3804 | 0.4166 | 0.3425 | 0.3821 |
| Yingkou | 0.0395 | 0.0414 | 0.0517 | 0.0578 | 0.0648 | 0.0624 | 0.0579 | 0.0642 | 0.0632 | 0.0573 | 0.0560 |
| Panjin | 0.0242 | 0.0265 | 0.0315 | 0.0372 | 0.0430 | 0.0419 | 0.0412 | 0.0368 | 0.0414 | 0.0421 | 0.0366 |
| Jinzhou | 0.0306 | 0.0372 | 0.0402 | 0.0446 | 0.0492 | 0.0458 | 0.0430 | 0.0496 | 0.0480 | 0.0465 | 0.0435 |
| Huludao | 0.0195 | 0.0213 | 0.0271 | 0.0298 | 0.0293 | 0.0306 | 0.0305 | 0.0343 | 0.0376 | 0.0364 | 0.0296 |
| Dandong | 0.0281 | 0.0330 | 0.0342 | 0.0402 | 0.0423 | 0.0423 | 0.0364 | 0.0453 | 0.0413 | 0.0377 | 0.0381 |
| Qinhuangdao | 0.0445 | 0.0498 | 0.0523 | 0.0554 | 0.0618 | 0.0621 | 0.0610 | 0.0632 | 0.0658 | 0.0625 | 0.0578 |
| Tangshan | 0.1093 | 0.1318 | 0.1563 | 0.1940 | 0.2028 | 0.2158 | 0.2419 | 0.2628 | 0.2919 | 0.3395 | 0.2146 |
| Cangzhou | 0.0506 | 0.0608 | 0.0670 | 0.0854 | 0.0893 | 0.0871 | 0.1130 | 0.1256 | 0.1440 | 0.1557 | 0.0979 |
| Tianjin | 0.3368 | 0.4110 | 0.5312 | 0.6576 | 0.7510 | 0.8419 | 0.8738 | 0.8834 | 0.8729 | 0.8331 | 0.6992 |
| Binzhou | 0.0365 | 0.0459 | 0.0493 | 0.0584 | 0.0546 | 0.0577 | 0.0645 | 0.0711 | 0.0744 | 0.0674 | 0.0580 |
| Dongying | 0.0449 | 0.0496 | 0.0573 | 0.0708 | 0.0791 | 0.0826 | 0.0825 | 0.0947 | 0.1005 | 0.0910 | 0.0753 |
| Weifang | 0.0723 | 0.0846 | 0.1050 | 0.1254 | 0.1382 | 0.1330 | 0.1550 | 0.1728 | 0.1863 | 0.1778 | 0.1350 |
| Yantai | 0.1599 | 0.1783 | 0.2027 | 0.2259 | 0.2533 | 0.2694 | 0.3127 | 0.3532 | 0.3916 | 0.3720 | 0.2719 |
| Weihai | 0.0816 | 0.0868 | 0.1002 | 0.1140 | 0.1174 | 0.1268 | 0.1500 | 0.1565 | 0.1589 | 0.1478 | 0.1240 |
| Qingdao | 0.2245 | 0.2680 | 0.2775 | 0.3525 | 0.4043 | 0.4127 | 0.4638 | 0.5193 | 0.5884 | 0.6580 | 0.4169 |
| Rizhao | 0.0327 | 0.0374 | 0.0410 | 0.0546 | 0.0575 | 0.0628 | 0.0745 | 0.0828 | 0.0901 | 0.0901 | 0.0624 |
Table 3.
Global spatio-temporal Moran’s I of the integration capacity between the marine and terrestrial ecological economies. Source: own study.
Table 3.
Global spatio-temporal Moran’s I of the integration capacity between the marine and terrestrial ecological economies. Source: own study.
| T + k t | 2012 | 2013 | 2014 | 2015 | 2016 | 2017 | 2018 | 2019 |
|---|---|---|---|---|---|---|---|---|
| 2011 | −0.0706 | −0.0603 | −0.0541 | −0.0314 | 0.0060 | 0.0145 | 0.0210 | 0.0509 |
| 2014 | −0.0319 | 0.0044 | 0.0117 | 0.0186 | 0.0520 | |||
| 2016 | 0.0442 | 0.0521 | 0.0894 | |||||
| 2018 | 0.1027 |
Disclaimer/Publisher’s Note: The statements, opinions and data contained in all publications are solely those of the individual author(s) and contributor(s) and not of MDPI and/or the editor(s). MDPI and/or the editor(s) disclaim responsibility for any injury to people or property resulting from any ideas, methods, instructions or products referred to in the content. |
© 2023 by the authors. Licensee MDPI, Basel, Switzerland. This article is an open access article distributed under the terms and conditions of the Creative Commons Attribution (CC BY) license (https://creativecommons.org/licenses/by/4.0/).
Share and Cite
MDPI and ACS Style
Yu, Z.; Chen, X.; Di, Q. Integration of Marine and Terrestrial Ecological Economies in the Cities of the Bohai Rim, China, Based on the Concept of Viscosity. Water 2023, 15, 749. https://doi.org/10.3390/w15040749
AMA Style
Yu Z, Chen X, Di Q. Integration of Marine and Terrestrial Ecological Economies in the Cities of the Bohai Rim, China, Based on the Concept of Viscosity. Water. 2023; 15(4):749. https://doi.org/10.3390/w15040749
Chicago/Turabian StyleYu, Zhe, Xiaolong Chen, and Qianbin Di. 2023. "Integration of Marine and Terrestrial Ecological Economies in the Cities of the Bohai Rim, China, Based on the Concept of Viscosity" Water 15, no. 4: 749. https://doi.org/10.3390/w15040749
Note that from the first issue of 2016, this journal uses article numbers instead of page numbers. See further details here.