1. Introduction
In both natural as well as agroecosystems, biogeochemical element cycles are closely connected to the water cycle. However, unlike natural systems, element cycling in agroecosystems relies on anthropogenic interventions such as the application of fertilizers (synthetic or organic manure) and the removal of biomass during the harvesting of crops. These specific ecosystem input and output fluxes characteristically affect solute leaching, erosion, denitrification, and the volatilization of nitrogen, among other soil physical and biogeochemical processes [
1]. Even if the amount of fertilizer is adapted to the water dynamics (i.e., climatic conditions or irrigation), an additional input of plant nutrients can cause a shift in the soil element balance, such that a chemical elements’ equilibrium in soil is characterized by a gradual and closely corresponding release and plant uptake of elements that can hardly be reached within shorter periods of time such as the growing season. Therefore, when there is enough soil water to generate drainage, dissolved nutrient surplus from inadequate fertilizer application and insufficient plant uptake is leached from agricultural soils. Nutrient leaching depends on nutrient total concentration and mobility in soil defined by the element chemistry and soil characteristics such as clay percentage, pH, organic matter, the presence of organic and inorganic ligands [
2], as well as soil hydraulic properties and hydrological processes. Nutrient leaching describes vertical transport with percolating water from a certain upper point in the soil (e.g., soil surface) to the subsoil below the root zone from where they cannot be taken up by plants. Several methods are available for measuring the soil solution and estimating solute fluxes in and below the root zone, and wick lysimeters are often used for variably-saturated soils and quantifying solute leaching under unsaturated conditions [
3]. Most importantly, considering wick lysimeter methodology for studying nutrient fluxes [
3], solutions sampled from wick lysimeters may be considered as leachates per se (i.e., soil solution moving vertically). Since the chemical composition of percolating soil water is affected by sorption and precipitation or dissolution processes when vertically passing through the soil porous matrix [
3], the amount and flow velocity of percolating water is highly relevant for quantifying plant nutrient leaching.
Force fields of soil particles hold water with different strengths depending on soil texture and structure [
4]. The total energy state of soil water is defined by its equivalent potential energy, determined by the forces acting on the water per unit quantity. Soil water flow thus originates from the gradient of the total potential of soil water under saturated (saturated flow) or unsaturated conditions (unsaturated flow). Therefore, water and solute fluxes depend on soil hydraulic properties that may dynamically change due to management and horizon-specific pedologic processes [
5]. For the fluxes of certain nutrients, a change in soil saturation state, i.e., from unsaturated to saturated conditions, is especially important, as it can cause mineralization flushes of nitrate and sulfate at the rewetting of dry soil [
6]. This change in soil saturation state also affects other nutrient chemistry through for example, the shift in the redox state as the speciation (chemical form) and the mobility of certain nutrients can be modified by a change in redox conditions, but microbial activity in the soil and the decomposition of organic matter is also affected. Therefore, when biophysical soil properties related to the gas phase (e.g., emission of carbon dioxide, methane, and nitrous oxide) are also considered, it can be stated that most nutrient fluxes in soil are driven by bio-physicochemical processes [
7].
Nutrient solutes disperse in a porous media such as soil because of hydrodynamic dispersion comprised of mechanical (convective) dispersion resulting from differences in pore size, path length/tortuosity (pore distribution, i.e., soil structure) and transfer velocities, and molecular dispersion, i.e., diffusion because of concentration gradients in the soil solution [
8], which are affected by adsorption/desorption and degradation depending on the solute. Nitrogen (N) losses from agricultural soils may occur via different pathways, depending on the abundance of N forms in soil, e.g., organic N, nitrate, ammonium, gaseous nitrous oxide, ammonia [
9], as well as on soil characteristics, fertilizers applied, microbial activity (important for N transformations), crop uptake, etc. Through fertilizers, N is added as organic N or various forms of ammonium and nitrate, characterized by different soil chemistry. Unlike nitrate, leaching is usually not a primary soil process when describing phosphorus (P) losses from agricultural soils. Instead, erosion processes, often connected to hillslope soils and also to the eutrophication of surrounding waterbodies, are frequently recognized as an important method of P transport and a significant environmental issue [
10]. Phosphorus cycling in soils is quite complex as it is influenced by the inorganic and organic solid phases, biological activity, soil solution chemistry (pH, ionic strength, redox potential), and environmental factors such as soil moisture and temperature [
11]. Through N-P-K fertilizers, P is commonly applied in its available form (PO
43−), thus the concentration applied, as well as the soil water flow (not considering plant uptake and removal of biomass), may influence P distribution in the soil profile. Potassium (K) is another major nutrient applied in N-P-K fertilizers, with mobility ranging between that of NO
3− and that of P, and its spatial distribution can be influenced by soil water flow. Generally, K in soils may be found in an exchangeable form, i.e., adsorbed on clay particles, where it participates in cation exchange (sorption and desorption) processes, in non-exchangeable form, fixed in clay lattices characterized by slow K release and fixation processes, and in unavailable mineral forms [
12].
Agriculture at the sloped landscape has a specific aspect in nutrient leaching because the relative position for any given point at the hillslope can affect the redistribution of water, solutes, and sediments [
13], with certain selectivity during the erosion and sediment transfer processes along hillslopes [
14]. Multiple vadose zone processes frequently identified at hillslopes are relevant for potential nutrient loss, such as surface runoff, vertical flow (leaching), and erosion, subsurface preferential flow affected by soil structure and layering, and non-linear chemical behavior [
15,
16,
17,
18]. Frequently located on hillslopes, vineyards are intensively managed agroecosystems. Management includes the use of fertilizers and pesticides, tillage, and trafficking with subsequent subsoil compaction [
19], because of which an extensive lateral preferential flow network can be formed on top of a compaction layer, e.g., the plough pan. Thus, nutrient loss at sloped vineyards frequently occurs, not only via leaching, but also via surface or subsurface runoff [
20]. Cover crops can decrease erosion and surface runoff [
21], and therefore minimize the transport of nutrients to the surrounding environment, with greater reduction of erosion confirmed for cover formed by grass than other plant species, such as legumes [
22]. Nutrient leaching from agricultural soils presents an economic loss for farmers and can degrade the quality of the surrounding environment. Considering the possible effect from grass cover on nutrient losses, it is important to determine the differences in nutrient leaching between intra- and grassed inter-row vineyard areas.
The chemical composition of the soil solution collected by wick lysimeters was analyzed with the aim to (i) quantify losses of major plant nutrient ions (i.e., ammonium, nitrate, orthophosphate, and potassium) via leaching below 40 cm soil depth from a sloping vineyard at hilltop, backslope, and footslope positions; and (ii) compare leaching from locations within vine plant rows (intra-row) with those of grassed areas between vine rows (inter-row).
2. Materials and Methods
2.1. Experimental Site
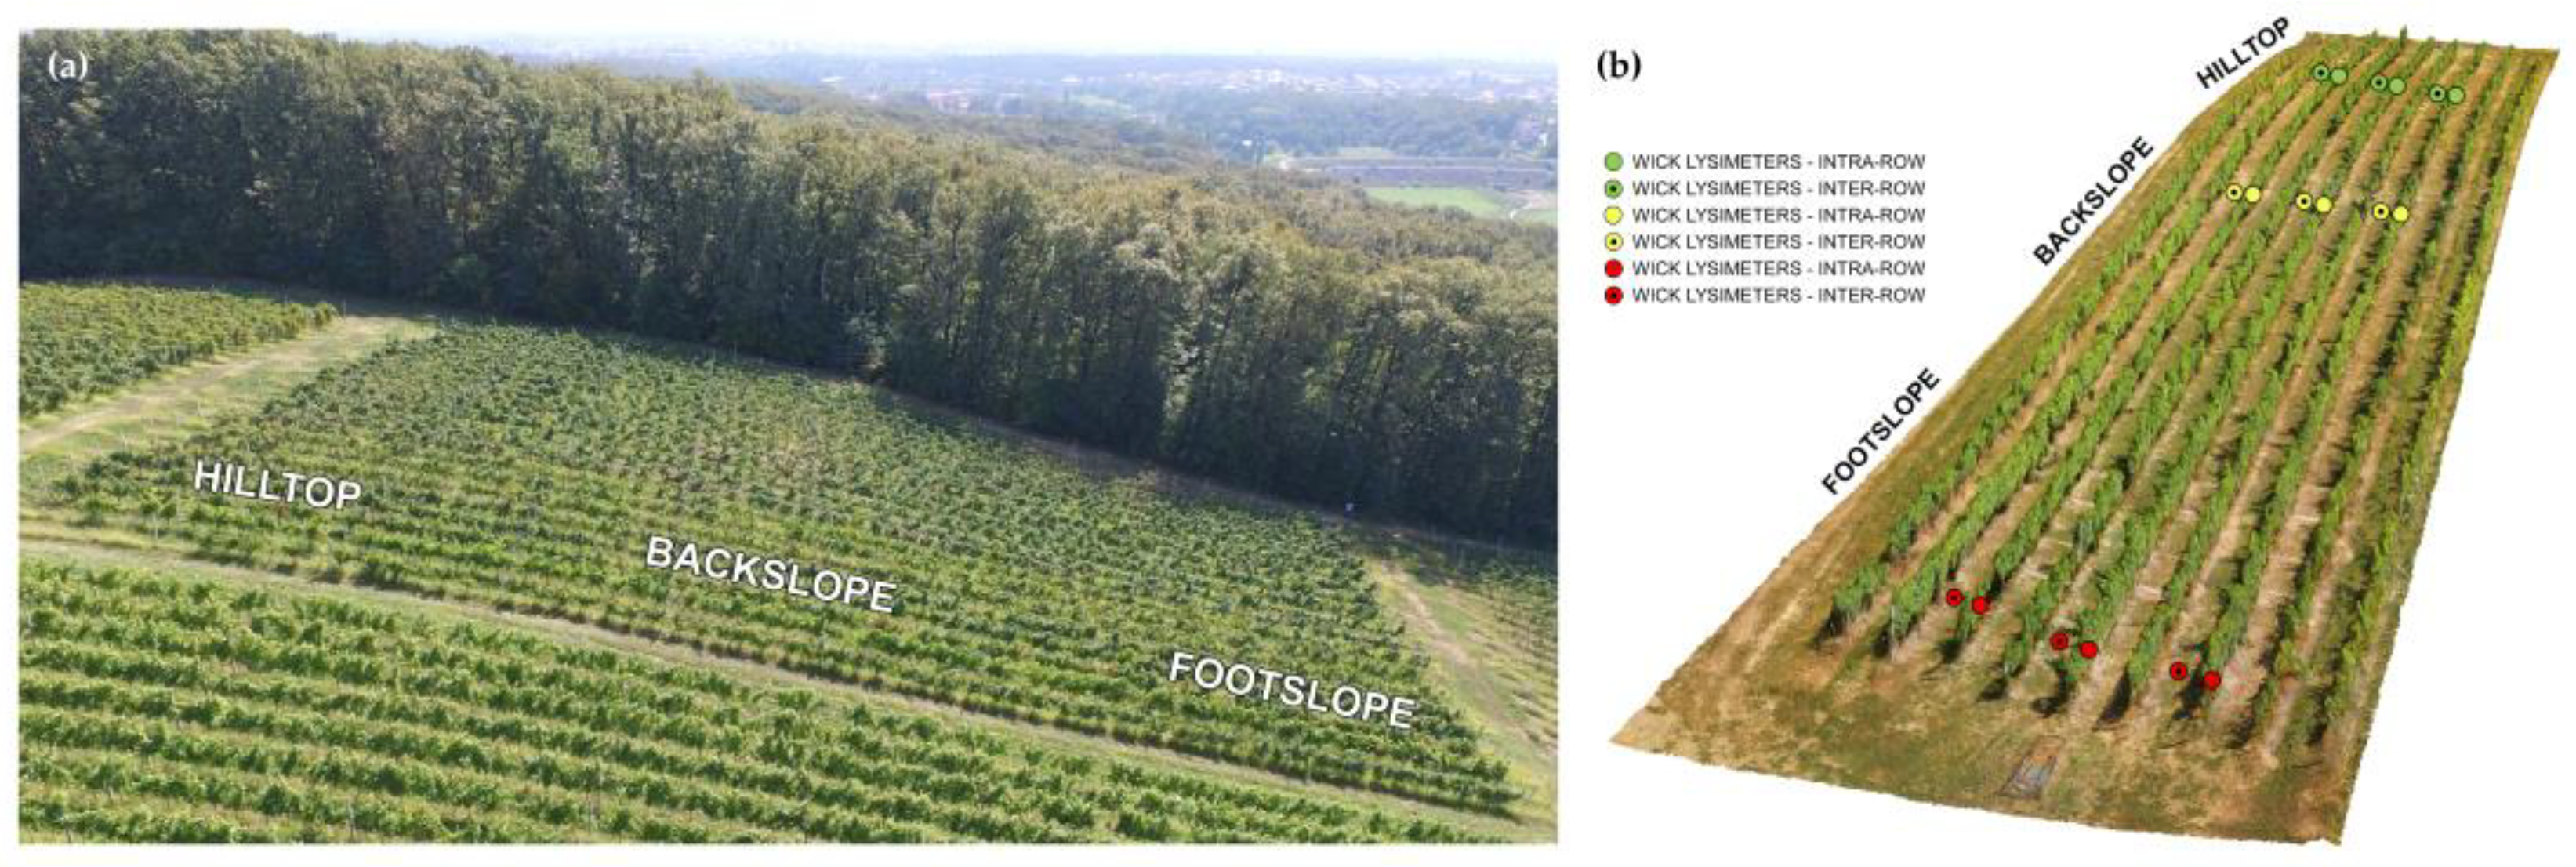
The experimental site is a sloped agricultural (vineyard) field-scale critical zone observatory SUPREHILL (
https://sites.google.com/view/suprehill, accessed on 31 January 2023), located in Zagreb, Croatia (45°51′24″ N 16°00′22″ E). The SUPREHILL observatory was established in 2020, and all field experiments have been operative since the end of 2020. The observatory is placed in a 15-year-old vineyard on a hillslope with a southwest exposition. Vines are planted along the slope in rows with a spacing of 1.2 m between the vines. The inter-row area is a 2 m wide grassed spacing between the rows. The experimental plot is separated into three segments: hilltop, backslope, and footslope, each with wick lysimeters installed in the vineyard intra- and inter-row area (
Figure 1). The slope between hilltop and backslope wick lysimeters is 17.5%, and between backslope and footslope wick lysimeters is 25.4%, as determined using an unmanned aerial vehicle (UAV) and Agisoft Metashape software (Agisoft LLC., ver. 1.7.5). The soil at the site is silt loam (at soil depth of 0–30 cm and 30–60 cm for all virtual segments), classified as Dystric Luvic Stagnosol soil type [
23]. The details about the soil classification and soil hydraulic properties can be found in Filipović et al. [
24]. No irrigation system is installed at the site and the average annual precipitation is 857 mm, with an average annual air temperature 11.2 °C (1970–2020), as recorded on the nearby meteorological station Maksimir (Zagreb, Croatia). No tillage was applied at the studied site after the start of the experiment (2020), and the grapes were manually harvested in September 2021 and 2022. Fertilization at the SUPREHILL site during the studied years was applied to the vines (intra-row) in December 2020 and November 2021 (by spreading on the soil surface 280 kg ha
−1 of NPK 3:15:13; 100% organic N, P
2O
5, and K
2O, Vinodar Bio, Agrifumax).
2.2. Field Equipment
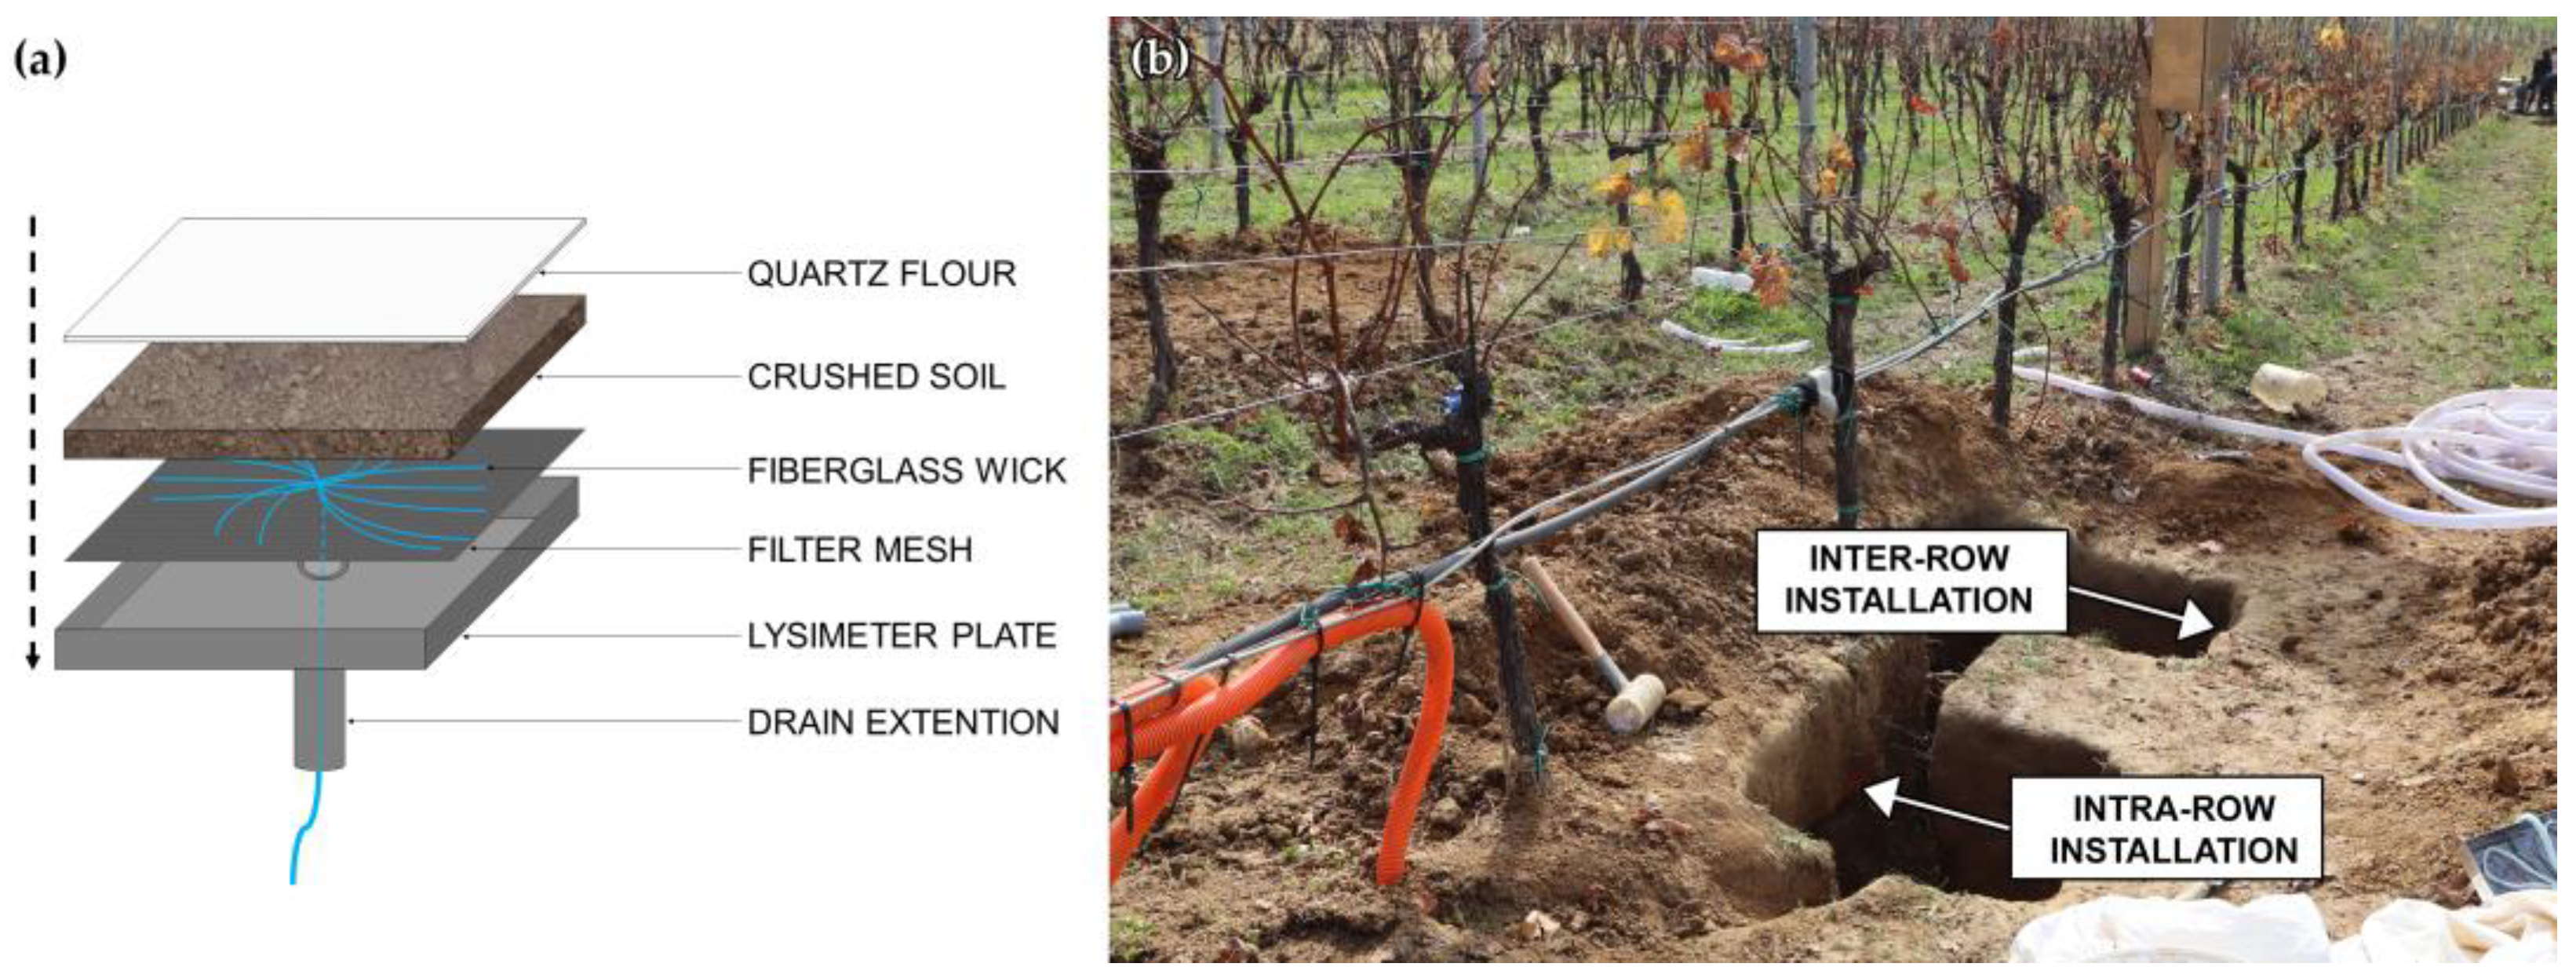
Passive wick lysimeters were installed at the hilltop, backslope, and footslope in triplicates, in an intra- and inter-row area (
Figure 2b), at 40 cm of soil depth, i.e., at an intermediate depth that allows calibrating solute transport models that can predict the deep drainage and final leaching for the total soil profile (total of 18 passive wick lysimeters). Wick lysimeters were self-constructed from 1.5 mm thick stainless steel (250 mm × 250 mm × 40 mm) with a drain extension at the center point (100 mm length, 30 mm ø) [
3]. Filter mesh was placed at the bottom of the lysimeter to prevent clogging, and fiberglass was placed to ensure a small negative pressure which enables drainage seepage (
Figure 2a). Wick lysimeters were filled with pre-dried soil taken from the same soil profile, then a layer of quartz flour (71 µm) was applied on top, and was then placed in a razor-sharp groove using a hammer and lifted to ensure contact with the upper soil using hard material and metal brackets. Wick lysimeters were connected to the leachate tanks placed 50 cm deeper in the soil so that the solution is continuously collected in leachate tanks.
2.3. Leachate Sampling and Chemical Analyses
The sampling of wick lysimeter leachates was performed monthly as a part of the ongoing monitoring of leachate chemical quality (one leachate sample per lysimeter), with the total volume of leachate also measured. Sampling was conducted using a submersible pump for two years (2 November 2020 to 25 November 2022). A total of 312 leachate samples were collected during 19 sampling events, with a total number of samples collected per sampling event depending on soil moisture and rainfall. After the sampling, leachate samples were transported to the laboratory in a cooling container and stored at 4 °C until analysis.
Leachate samples were analyzed for ionic composition, i.e., NH4+, NO3−, PO43−, and K+ concentrations, expressed as such. Potassium concentrations were determined using atomic emission spectroscopy (Atomic Absorption Spectrometer 3110, Perkin Elmer, Waltham, MA, USA), and NH4+, NO3−, and PO43− concentrations were measured using segmented flow analysis (San++ Continuous Flow Auto-Analyzer, Skalar, Breda, The Netherlands). Leachate samples were also analyzed for pH and electrical conductivity using a pH/EC-meter (MPC 227, Mettler Toledo). The pH of the leachates was in the range of 6.4–6.5, and electrical conductivity was 14.4–19.0 mS m−1. The quality control procedure consisted of duplicate samples and referenced water samples from the inter-laboratory calibration program (IFA-Proficiency Testing Scheme, Tulln, Austria).
2.4. Data Processing and Statistical Analysis
Leached nutrient cumulative masses for the studied two years were calculated from measured concentrations and leachate total volumes per sampling event.
A statistical analysis was undertaken using Statistical Analysis Software (SAS Institute Inc., Version 8.3 Update 1, Cary, NC, USA, 2019–2020), first with the position on the slope (hilltop, backslope, and footslope) as the main factor, followed by a statistical analysis with the same main factor, but with the grouping of data according to the wick lysimeter placement in vineyard (intra- or inter-row). Another statistical analysis was done separately for intra- and inter-row, again with the position on the slope as the main factor, but with a grouping of data according to the month. An analysis of variance for all statistical analyses was done using one-way ANOVA, with the significance of differences between the means determined using Tukey`s Honestly Significant Difference (HSD) test at p < 0.05.
3. Results
Nitrate and PO
43− concentrations were significantly higher in leachates collected at the footslope, with no difference between the hilltop and backslope (
Table 1). Potassium leachate concentration was also the highest at the footslope, but with the lowest concentration recorded at the backslope. Ammonium concentration was not significantly different between leachates collected at the hilltop, backslope, and footslope (
Table 1).
A separation of leachate nutrient ion concentrations into those from intra- or inter-row (
Table 2) clearly point to vineyard intra-row as the spatial cause of differences between the hilltop, backslope, and footslope. This means that the statistical difference found for ion concentrations in leachates at the vineyard hillslope (intra- and inter-row;
Table 1) was also found for the vineyard intra-row (
Table 2), but not for the vineyard inter-row (
Table 2).
Further analysis of data was performed to identify temporal changes in leachate ion concentrations between the hilltop, backslope, and footslope during the study period of two years, with consideration of the previously identified difference between the intra- and inter-row (
Table 3). At the vineyard intra-row, March was identified as the most significant month for leachates NO
3− concentration, May and December for PO
43− concentration, and December for K
+ concentration at the hillslope (
Table 3). More precisely, March was the only month when NO
3− concentrations in leachates at the footslope intra-row were significantly higher than at hilltop and backslope, with no difference between hilltop and backslope (
Table 3). Orthophosphate concentrations during December were significantly higher in leachates at footslope in intra-row compared to leachates from hilltop and backslope (with no difference between them), as well as during May, when the differences between PO
43− concentrations were found only between leachates at the footslope and hilltop in intra-row. Also, December was identified as the only month when K
+ concentration in leachates from intra-row at the footslope was significantly higher than in leachates from the hilltop and backslope, without a significant difference between the hilltop and backslope (
Table 3).
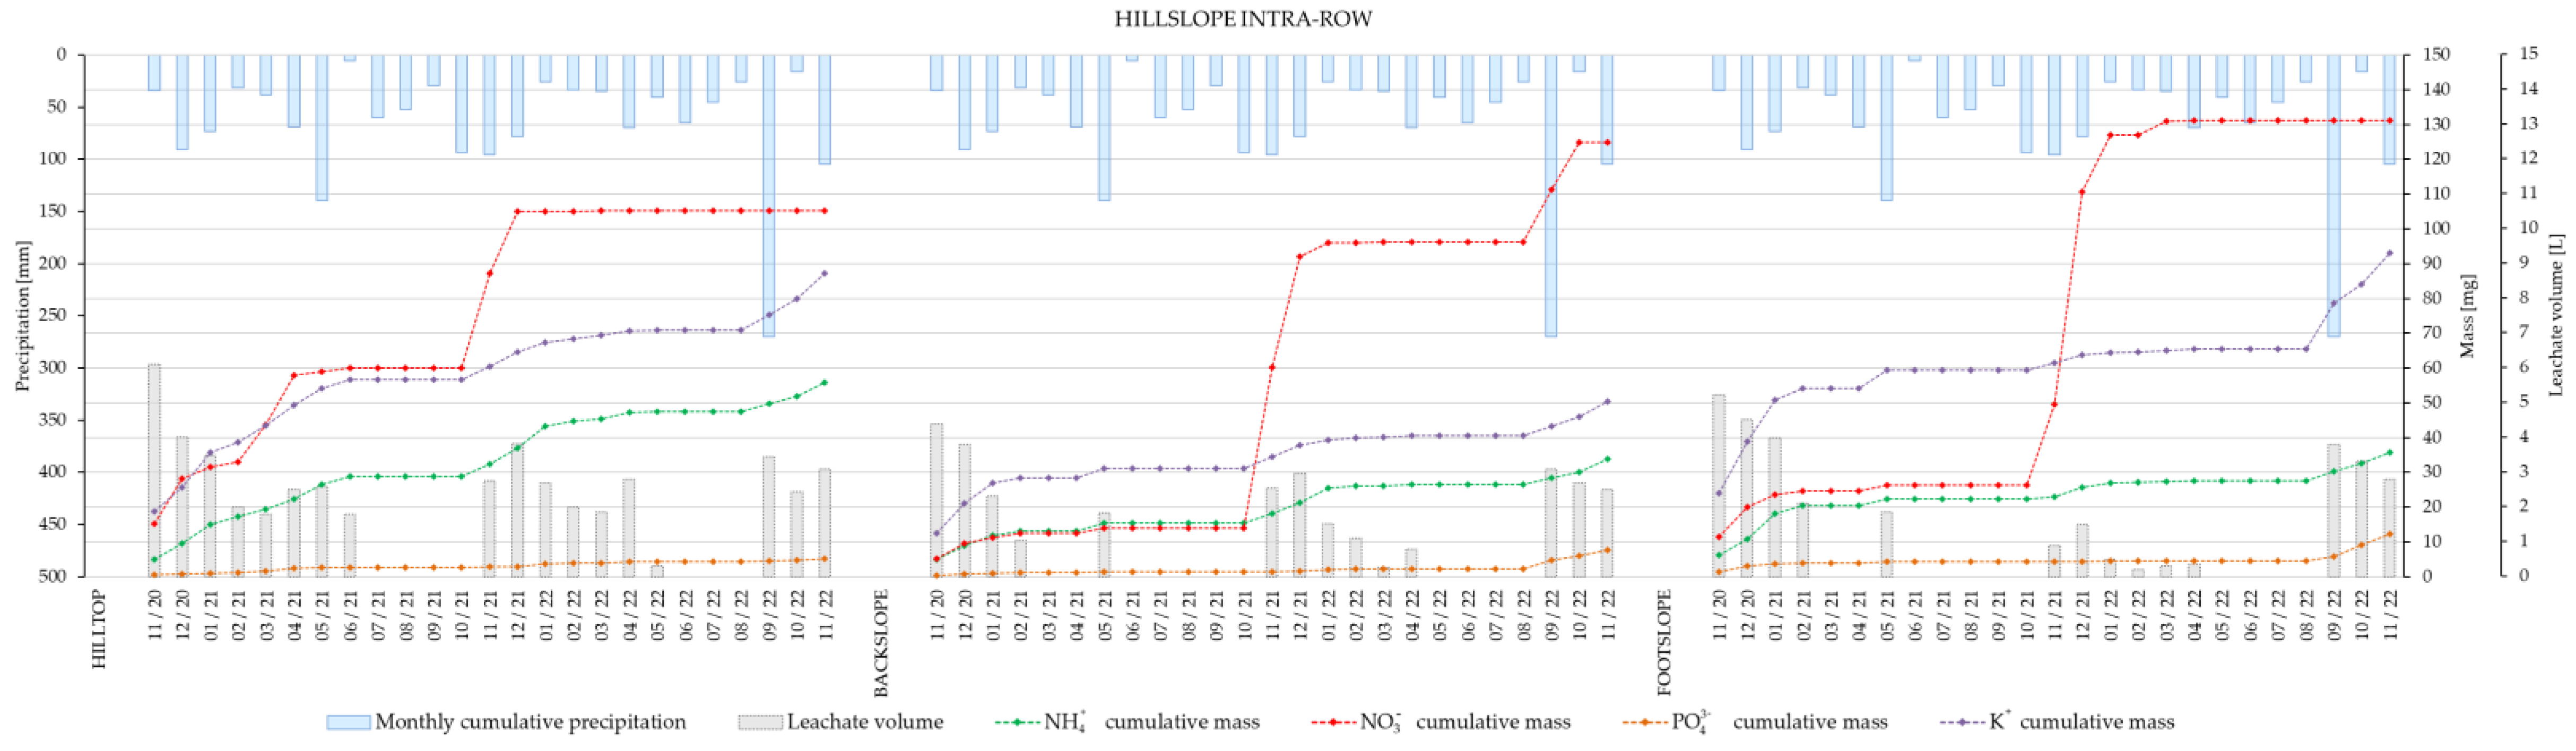
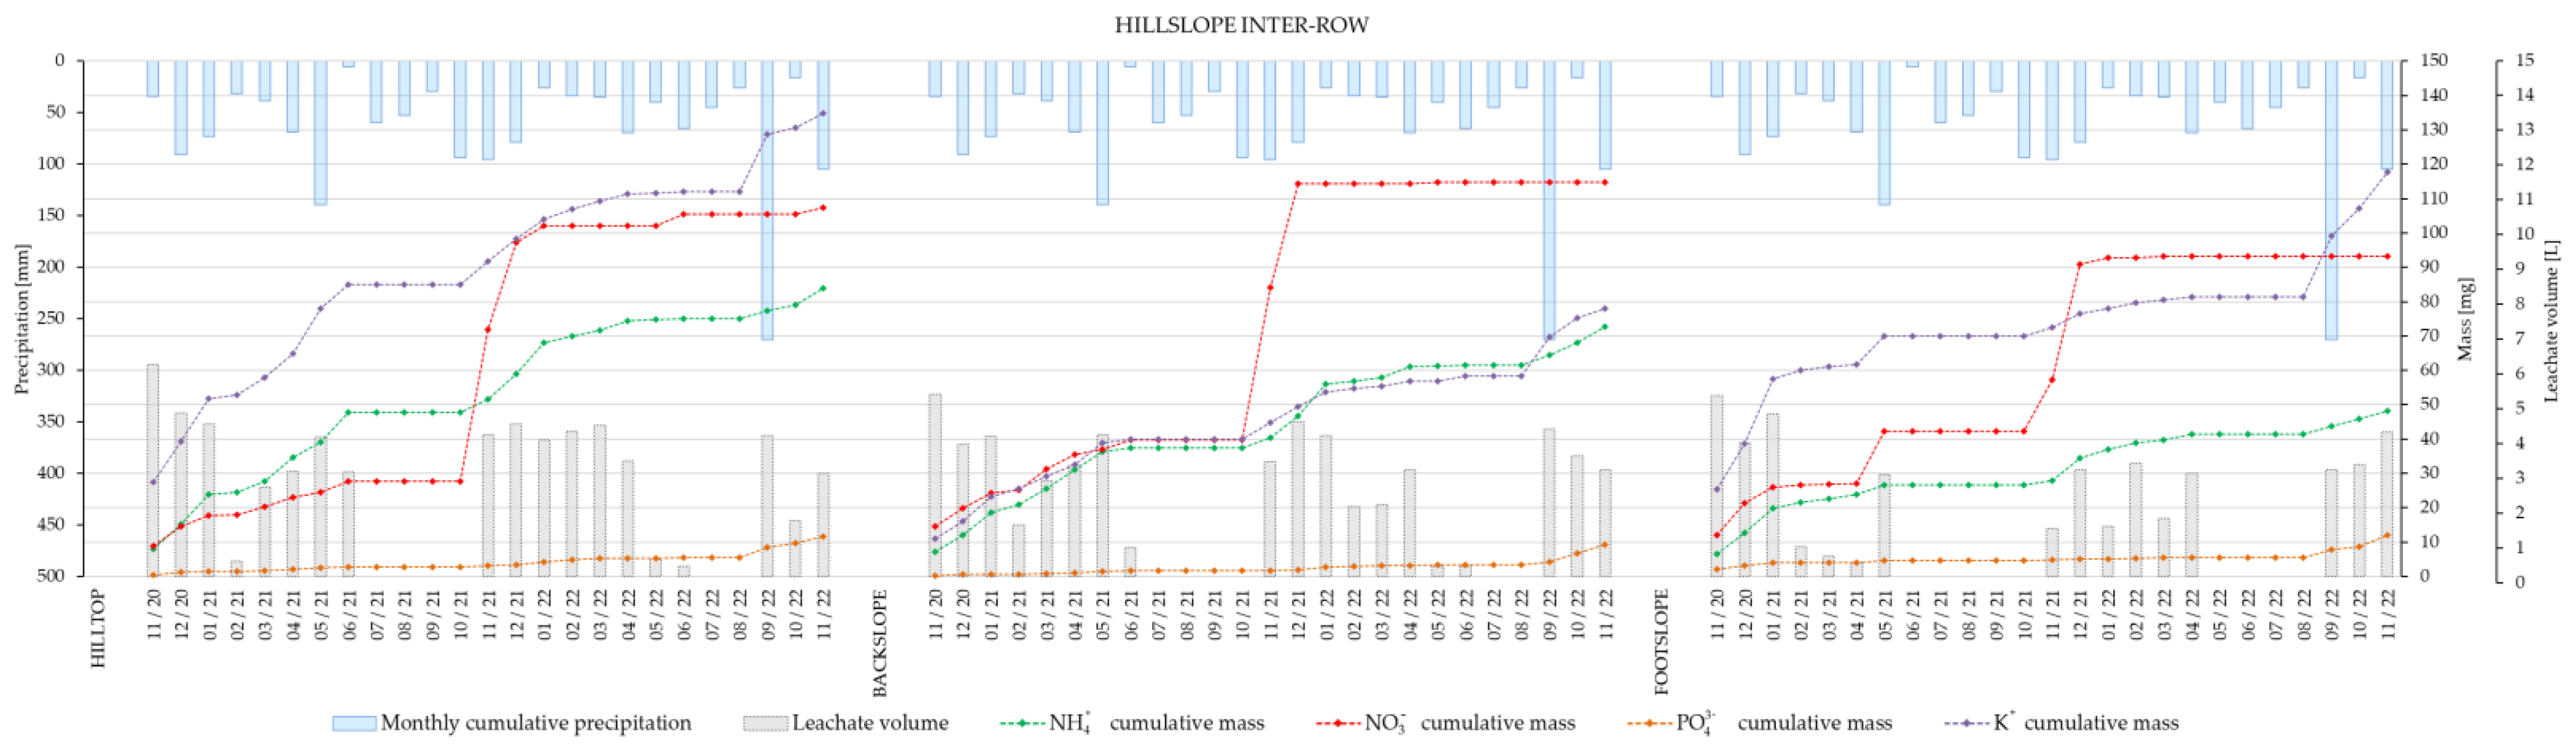
The cumulative masses of the nutrient ions in leachates from wick lysimeters installed at the hilltop, backslope and footslope of the vineyard intra- (
Figure 3) and inter-row (
Figure 4) after two years showed that, with the exception of ammonium, cumulative masses of major nutrient ions were higher at the footslope of the vineyard intra-row, which was not the case for the inter-row area. It is worthy of note that fertilization was applied to the vines (intra-row) in December 2020 and November 2021.
4. Discussion
Ammonium is adsorbed onto soil particles and may participate in cation exchange reactions; thus, vertical leaching is not frequent, either from vineyard intra- or inter-row. Note that the sorption of NH
4+ may as well occur as fixation in clay mineral lattices, with silt fraction also reported to adsorb NH
4+ in the non-exchangeable form [
25]. In this study, no significant seasonal effect was found for NH
4+ concentration in leachates from the hilltop, backslope, and footslope of vineyard intra- or inter-row during the investigated two years.
For highly soluble and non-sorbing nitrate, leaching could be assumed when looking at the concentration peaks and mass fluxes mainly at the intra-row footslope position (
Table 1 and
Table 2). Gramlich et al. discussed drainage and other effects on plant nutrient leaching from agricultural fields and presented multiple studies demonstrating high losses of NO
3− from mineral soils, attributed to increased mineralization and decreased denitrification rates because of improved soil aeration after subsurface drainage [
9]. Nitrate concentration in leachates from wick lysimeters installed at the footslope was more than twice than that of those installed at the hilltop and backslope, while NO
3− concentrations at the hilltop and backslope positions were similar. Being highly soluble, NO
3− leaching depends on the soil water flux rates stimulated by infiltration of either rain or irrigation water. Thus, an extensive preferential flow network frequently formed in soils may affect the distribution of vertical NO
3− concentration. The spatial cause of significant differences in leachate NO
3− concentrations at the hilltop, backslope, and footslope, was the vineyard intra-row. This finding is important emphasize, as it supports the hypothesis that grass in the vineyard inter-row area decreases surface erosion processes [
21] and reduces the leaching of NO
3− from sloped soils, thus maintaining the grass cover could reduce the potentially negative effect of the fertilizers applied on hillslope vineyards on the surrounding environment. The reason for this is possibly the uptake of NO
3− by the grass roots, but the fact that in practice fertilizers were largely added to the vines in intra-row could also be the reason for observed differences in NO
3− leaching between the intra- and inter-row. Furthermore, during the studied two years, statistical analyses of NO
3− concentrations with respect to the month showed that the difference in NO
3− concentration in the vineyard intra-row, i.e., between the hilltop and backslope compared to the footslope, was only significant in March, which is well after the annual autumn fertilization (November/December), however right after the period of increased soil moisture because of rainfall/snow. And yet, N was added as organic N, suggesting that a delay in NO
3− leaching is possible because the mineralization of organic matter must occur first, a process depending on microbial activity (often related to optimal conditions in the soil, i.e., water/air relations, temperature, etc.). Here it should be noted that even though several-fold higher average NO
3− concentrations were indeed recorded at the footslope of the intra-row area in November, December, and January (i.e., after the annual fertilization), the high variability of data between the repetitions resulted in statistical insignificance. This means that during these months only one or two of the wick lysimeters installed (in triplicates) at the footslope in intra-row captured the NO
3− influx, possibly further suggesting that soil heterogeneities affecting water flow and NO
3− distribution with it are present at the studied vineyard hillslope [
24].
A statistically significant difference in leachate PO
43− concentration between wick lysimeters installed at the hilltop and footslope of the vineyard intra-row was also recorded. In their study focusing on P leaching in relation to soil type and soil P content which lasted for three years, Djodjic et al. demonstrated that no correlation could be found between total P leached from undisturbed soil columns of five soils and soil tests (total and available P concentration), and further showed that in the soil where the preferential flow was dominant, water and P both bypassed the sorption capacity of the subsoil and resulted in high leached P concentration [
26]. However, Djodjic et al. also showed that P leaching from other soils was low due to the high sorption capacity of the subsoil, even when high P concentrations were applied [
26]. This study is somewhat in agreement with the mentioned study by demonstrating differences in PO
43− leaching in vineyard intra-row depending on the position on the slope, supporting the hypothesis that soil water flow can be significant for P leaching under certain conditions [
11], i.e., at hillslopes. Enhanced P leaching is recognized from soils receiving frequent fertilizer applications because preferential P transport can occur after fertilizer application through soil macropores and cracks [
27]. However, it is also possible that after PO
43− was transferred by erosion processes along the soil surface to the footslope where the highest concentration was recorded in leachates, then this eroded material with a relatively high PO
43− initial concentration along with the preferential water flow resulted in higher leached PO
43− concentrations at the footslope of the vineyard intra-row as compared to those at the hilltop. Further supporting the possibility of soil water flow affecting P leaching, the statistically significant increase in leached PO
43− concentration at the intra-row footslope compared to the hilltop was confirmed in December and May, and therefore a seasonality in P leaching at the hillslope was recorded, i.e., during months when high-intensity rain events were frequent. Here it should be noted that the annual fertilizer application in November/December probably affected PO
43− concentrations in leachates in December, however this effect is not probable in May, when no fertilization was applied. Regardless, all recorded leached PO
43− concentrations remained relatively low during the studied two years, which is in agreement with other studies [
11].
Potassium ions, with ongoing sorption and desorption processes in soil, are considered mobile in the soil, and thus transport via water flow and leaching can occur. For example, in their study focusing on factors affecting K leaching in different soils, Alfaro et al. showed that after K application, total K loss from the clay soil was more than twice that of the sandy soil because of the formation of preferential flow in the clay soil [
28]. In this study, again, the highest K
+ concentrations were found in the leachates at the intra-row footslope compared to the hilltop and backslope, with December confirmed as the only month when this difference was significant, which was probably affected by the fertilization in November/December and a subsequent formation of preferential flow.
Plant nutrient leaching data from the hilltop, backslope and footslope of vineyard intra- and inter-row showed that, with the exception of ammonium, cumulated masses of major nutrient ions after two years were higher at the footslope of the vineyard intra-row. This was especially true for NO3−, which was most noticeably affected by the fertilization in November 2021. Therefore, the present results suggest that vineyard management on sloped terrains should be modified in a way that accounts for slope effects on nutrient leaching. This should also take into account the differences between the intra- and inter-row areas, i.e., by maintaining a permanent grass cover, as well as the optimization of timing, frequency, and quantity of applied fertilizers. The spatially heterogeneous contribution of hillslope sections to plant nutrients’ leaching suggests that vineyard field experiments should separately analyze hillslope and plant row position for soil water and solute transport processes when trying to collect basic data for optimizing vineyard soil and crop management practices.

 ,
, 


