Article

Temporal Changes and Spatial Driving Mechanisms of Water Ecological Footprints in the Context of Urbanization: Taking Three Major Urban Agglomerations in China’s Yangtze River Economic Belt as an Example

School of Public Administration and Policy, Renmin University of China, Beijing 100872, China
*
Author to whom correspondence should be addressed.
Water 2023, 15(4), 760; https://doi.org/10.3390/w15040760
Submission received: 9 January 2023 / Revised: 5 February 2023 / Accepted: 11 February 2023 / Published: 14 February 2023
(This article belongs to the Section Water Use and Scarcity)

Abstract

:
Urbanization, which is accompanied by the flow of various production factors, leads to increasingly close spatial linkages between cities, and exerts profound influences on water resource use. This study focuses on the three major urban agglomerations in China’s Yangtze River Economic Belt, and examines the temporal changes and spatial variations of its water resource use based on an improved water ecological footprints (WEFs) model that uses city-level data to calculate yield factors and considers the recycling of water resources. Moreover, this study investigates the spatial autocorrelation of WEFs and explores the spatial correlations between WEFs and three dimensions of urbanization (population, economy, land) in three urban agglomerations. The results show that the WEF is the highest in the downstream of the Yangtze River and the lowest in the upper stream. City-level WEFs have significant spatial autocorrelations, and cities with high water use are often concentrated. In some regions, urbanization and WEFs have significant spatial correlations, indicating the environmental externality of urbanization on water resource use. This study contributes to the methodology of developing localized water use evaluation indices, and provides insights into the driving factors of WEFs and the environmental externality of urbanization at different spatial scales. Its findings provide empirical support for formulating and implementing more targeted water resources protection measures in the upper, middle, and lower reaches of the Yangtze River.

1. Introduction

Urbanization is accompanied by the flow of population and resources, the upgrading of industrial structures, and land use changes. On a global scale, urbanization profoundly influences the use of water resources. The water ecological footprint (WEF) is an important approach to understanding the regional characteristics of water use in the context of urbanization [1,2]. Existing studies have pointed out that both urbanization and WEF are multidimensional, and the influences of urbanization on water resource use vary in different stages of urbanization; therefore, the relationship between urbanization and WEFs is complex and shows substantial regional variations [3,4,5].
In terms of the calculation of WEFs and the relationships between WEFs and urbanization, many issues remain to be explored. Most studies on WEF assessment are based on national and provincial data, and use global and national-level factors; however, these approaches do little to demonstrate the differences in the demand for and use of water resources at the city level [6]. In addition, from the supply side, the total water resources of a region include not only surface water and groundwater in nature but also recycled water from the treatment of wastewater in water recycling facilities [7]. However, existing studies rarely consider recycled water when measuring the total amount of water resources [8]. Since wastewater treatment has become increasingly important, the ignorance of recycled water may significantly underestimate the total amount of water resources.
Moreover, urbanization leads to the flow of various production factors such as labor, capital, natural resources, and technology, which creates increasingly close spatial linkages among cities [9]. Therefore, the urbanization process in one region may affect the use of water resources in other regions. This issue reflects the spatial externalities of urbanization on the environment. In particular, there are often several urban agglomerations in large river basins [10,11], and water use between different urban agglomerations and between the cities within each urban agglomeration may have mutual influences [12]. The studies on the spatial correlations of water use in the background of urbanization, however, remain insufficient.
This study enriches the existing literature by studying the WEF in three major urban agglomerations in China’s Yangtze River Economic Belt. The Yangtze River is often considered the most important river in China, and three urban agglomerations (Chengdu–Chongqing, middle Yangtze River, and the Yangtze River Delta) are located in its upper, middle, and lower streams, respectively [13]. Three urban agglomerations have populations of 95 million, 125 million, and 220 million and rank 12th, 9th, and 3rd in the world’s metropolitan belts in terms of GDP, respectively [14]. With a large population and a rapidly developing economy, the Yangtze River Economic Zone has a huge demand for water resources, and its water ecological situation deserves close attention.
The main purposes of this study are as follows. First, to generate a localized WEF index that considers the recycling of water, we modify the WEF model by including the amount of wastewater treatment in the index and using city-level data to measure the yield factor. Second, we divide water use into four categories (agricultural, industrial, domestic, and ecological) and analyze the WEFs of three major urban agglomerations using city-level data from 2005 to 2019. For each urban agglomeration, the spatial auto-correlation of WEFs between cities is also examined. Third, we conduct bivariate spatial autocorrelation analysis between three dimensions of urbanization (population, economy, and land) and WEFs to explore the spatial externalities of urbanization on water resource use within each urban agglomeration.
This paper contributes to the literature in many aspects. By studying the city-level water resource use in three urban agglomerations of China’s Yangtze River Economic Belt, this study helps to understand the characteristics of water resource use in China’s most important economic belt. The modified WEF model can more accurately reflect the water use conditions and the water supply capacity at the city level, and may contribute to the methodology of developing localized water use evaluation indices. Moreover, by examining the spatial externality of urbanization on WEFs, this paper provides insights into the mechanisms via which urbanization influences regional water use, and sheds light on the dynamics of water resource use across multiple urban agglomerations in large river basins. In terms of practical implications, our conclusions may inform policy making to enhance the sustainable use of water resources and promote eco-friendly urbanization in the Yangtze River Economic Belt.
The paper is divided into five sections. Section 2 reviews the relevant literature. Section 3 describes the research methodology, including the measurement of WEF and urbanization levels, data sources, and data analysis methods. The results are given in Section 4, and discussions and conclusions are presented in Section 5.

2. Literature Review

2.1. Water Ecological Footprint: Temporal–Spatial Characteristics and Driving Factors

The concept of the ecological footprint was introduced in the 1990s [14], using the “global hectare (gha)” as the unit of area, representing one hectare of biologically productive land at the global average productivity level. In the basic model, the ecological footprint of waters refers only to the ecological footprint of fisheries (the area of water in which fishery products are produced), which does not fully reflect the amount of water consumed by human activities [15]. Therefore, Hoekstra [1] proposed the concept of the water ecological footprint (WEF), which represents the amount of freshwater required for various human activities; the unit of measurement is “cubic meters/year”.
China is one of the hotspots for WEF research [16]. Some studies have examined the spatial and temporal characteristics of China’s WEF to understand the country’s water use conditions and their sustainability. Other studies have focused on specific regions such as the capital metropolitan area [17] and the Yangtze River Delta urban agglomeration [18] to understand the characteristics, dynamic evolution, and spatial variation of water use at the regional level. All of the above studies are based on provincial-level data, while a recent trend is to perform city-level and even county-level analyses to understand the regional characteristics of WEF in more detail [19]. The spatial autocorrelation and spatial heterogeneity of WEF have also attracted great attention. For example, a significant agglomeration effect has been found in the agricultural WEF between the cities of the Yangtze River basin [3]; positive spatial autocorrelations are found in both the size and the depth of the WEF among 38 cities in the Central Plains [20]; and the per capita WEF in the Beijing–Tianjin–Hebei region presents significant spatial variability at the county level [21].
The WEF is shaped by a wide range of factors. For example, a study shows that GDP per capita, total investment in fixed assets, the income of rural residents, the proportion of farmland used for planting crops, and irrigation technology have significant positive effects on agricultural WEF [3]; while the proportion of secondary and tertiary industries, retail sales of consumer goods, the level of urbanization, expenditure on technology innovation, and the proportion of farmland with effective irrigation systems have significant negative effects. Demographic and economic factors have been the focus of attention in the WEF literature. An increase in population tends to increase the WEF [22]. Economic development tends to expand the demand for water resources, but technological upgrading and economies of scale contribute to the intensity of water use, thus reducing the WEF [23,24,25]. In addition to demographic and economic factors, natural factors, especially climate changes, profoundly affect the WEF [26].
The method of measuring WEFs is also a hot topic of research [27,28]. The majority of WEF models use uniform equalization factors and yield factors, while an increasing number of authors have tried to develop more localized indices to accurately measure the regional WEF [29]. For example, Wang et al. [30] used equalization and yield factors that considered regional differences, and proposed a modified WEF model to calculate the per capita WEF at the city level; and Chen et al. [31] proposed an improved model of water balance factors that took into account regional and annual differences in water use. Others have attempted to use multi-dimensional indicators to examine the WEF comprehensively [32]. For example, Liang et al. [33] proposed a three-dimensional WEF model, and Yang & Cai [19] added three sub-accounts that represent water resources for domestic, production, and eco-environment uses into the WEF model.

2.2. Urbanization, Water Use, and Water Ecological Footprint

Urbanization refers to the process by which settlements with low population density are gradually transformed into cities along with the agglomeration of population, the development of economic activities, and the expansion of infrastructure. Therefore, urbanization is multi-dimensional and involves changes in multiple domains [9]. From the perspective of population migration, urbanization is accompanied by the flow of labor from rural to urban areas and the agglomeration of the population within urban areas; from the perspective of economic development, urbanization involves the continuous transformation of industrial structure from agriculture to secondary and tertiary industries; from the perspective of land use changes, the economic prosperity of cities increases the demand for land, and urbanization is the process of transforming rural land to urban construction land [21,34,35].
As the largest developing country in the world, China has paid great attention to the role of urban agglomerations in its urbanization policy [36]. China’s Basic Terminology and Standard for Urban Planning in 1998 defines urban agglomerations as “densely distributed urban areas within a certain territory”, and one urban agglomeration includes several metropolitan areas. The 14th Five-Year Plan for National Economic and Social Development and the Outline of Vision 2035, published in March 2021, mentions “promoting the coordinated linkage and differentiated development of large, medium, small cities and small towns based on urban agglomerations and metropolitan areas”. In this document, the development of three major urban agglomerations in the Yangtze River Economic Belt, including the Yangtze River Delta, middle Yangtze River, and Chengdu–Chongqing, are given policy priorities.
From 1997 to 2019, the urbanization rate in China increased from 26.41 to 60.60% [37]. During the same period, the efficiency of water use for economic production increased, and the water consumption per CNY 10,000 of GDP decreased from 698 to 61.04 m³; however, the comprehensive water use per capita only decreased by less than 20 m³ during this period [38]. The total amount of water used to improve the environment and optimize ecological landscapes is small, but it is constantly increasing [39]. The total amount of wastewater discharge has the same trend of changes as that of industrial water use, and wastewater disposal is still one of the constraints on urban development [40]. It should be noted that wastewater is the general term for runoff and discharged water in production and living activities, while sewage refers to discharged water that has been polluted in production and living activities. In China, wastewater and sewage are often considered equivalent, and include industrial wastewater, domestic sewage, sewage from business activities, surface runoff, etc. Therefore, this paper uses wastewater consistently.
Urbanization affects the use of water resources through multiple mechanisms. In the early stages of urban construction, rapid urbanization leads to increased demand for water resources, inducing water scarcity [34]. More specifically, as the industrial structure changes from agricultural to industrial, and a large number of resource-consuming enterprises emerges, industrial water use increases [24]. Urban construction also induces the demand for water for urban ecological landscapes [41]. As urbanization continues, however, the upgrading of the industrial structure, the transformation of consumption patterns, and advances in production technology may increase water use efficiency and reduce the WEF. Therefore, in the middle and late stages of urbanization, the environmental impact of urbanization may be positive [17,42,43], and zero or negative growth in demand for water resources occurs. Evidence from China suggests that, although the economic development and population increases associated with urbanization lead to increased water use [44], water-saving measures in the industrial sector improve urban water use efficiency [23], and technological progress also contributes to decreasing the per capita WEF of urban residents in China [42]. It is important to note that urbanization has different effects on different types of WEFs. For example, some studies have shown that urbanization increases the WEF of urban water use [24] but decreases the WEF of rural water use [3]. Yu et al. [4] found that urbanization rates showed a negative correlation with the ecological footprint of freshwater resources but a positive correlation with the ecological footprint of water pollution. Moreover, urbanization itself is multi-dimensional [9], and different dimensions of urbanization may have different impacts on water use. For example, the effects of economic urbanization and landscape urbanization on water scarcity have been found to be opposite [5].

2.3. Comment

The extant literature contributes to understanding the spatial and temporal evolution and driving mechanisms of the WEF in different regions of the world. These studies suggest that water use is highly localized and spatially heterogeneous [6]. The impact of urbanization on water use is complex and has salient regional variations. However, there are some limitations in the existing literature that require further research. The majority of WEF studies have been conducted at the national and regional levels, while studies conducted at the city level remain limited [3,6,45]. In the case of WEF studies in China, they tend to focus on northern China [16], and many of these analyses are made at the provincial level. However, there is insufficient research exploring trends in WEF changes at the city level and focusing on the different urban agglomerations in the Yangtze River basin, where water resource use pressure has been increasing fast.
Moreover, more research is needed to investigate the spatial autocorrelation of WEFs and the spatial externality of urbanization on water resource use. Urbanization has accelerated the flow of various production factors between cities, which has led to increasingly close spatial linkages within the urban agglomeration. Therefore, the urbanization process of one city is likely to have an impact on the water resource use of neighboring cities, which is the spatial externality of urbanization on WEF, and the attention paid to this issue remains insufficient in the WEF literature. In addition, urbanization involves changes in many dimensions, such as population migration, industrial development, and land use changes [46]; however, the existing studies on the relationship between urbanization and WEFs mostly focus on population urbanization but rarely discuss the impact of other dimensions of urbanization.
This study endeavors to enrich the literature from the following aspects. We focus on the three urban agglomerations in the Yangtze River Economic Belt and explores the temporal changes and spatial variations of its water use conditions. For this purpose, an improved WEF model, which uses city-level data to calculate yield factors and considers the recycling of wastewater, was proposed. Moreover, the spatial autocorrelation of WEFs and the spatial correlation between WEFs and three dimensions of urbanization (population, economy, and land) were investigated in order to understand the interdependency of regional water use and the spillover effects of urbanization on regional water use.

3. Methods

3.1. Research Area

This paper focuses on 73 cities at or above the prefecture level in the three major urban agglomerations (Chengdu–Chongqing, the middle Yangtze River, and the Yangtze River Delta) in China’s Yangtze River Economic Belt. According to the relevant national policy documents, 26, 31, and 16 cities are classified as being in the Yangtze River Delta urban agglomeration, the middle Yangtze River urban agglomeration, and the Chengdu–Chongqing urban agglomeration, respectively [13]. The Appendix A lists the cities in each urban agglomeration in detail, as well as the national policy documents that specify the cities in each urban agglomeration.

3.2. Measurement of WEF

3.2.1. Basic WEF Model

The basic model involves the measurement of the water ecological footprint (WEF) and water ecological carrying capacity (WEC) [24]. WEF refers to the area of water resources land that humans occupy; WEC refers to the capacity of the study area to support various human activities and the eco-environment [41]. WEF and WEC reflect the consumption and supply of water resources, respectively. The basic model of WEF is as follows.
W E F = N × w e f = γ × W / P w
W E C = N × w e c = 0.4 × φ × γ × Q / P w
W E S = W E F W E C
W E P I = W E F / W E C  
where W E C and W E F are in 10,000 hm2, N is the population, w e f is the per capita WEF (hm2/cap), w e c is the per capita WEC (hm2/cap), γ is the global equalization factor of water resources, φ is the global yield factor of water resources, W is the total amount of water consumption (m3), Q is the total amount of water resources (m3), P w is the global average production capacity of water resources (m3/ hm2), which is the ratio of the total area of water resources to the whole area of the region, W E S is the ecological surplus (10,000 hm2), W E P I is the pressure index, and 0.4 is the ratio of water resources in nature that can be appropriated by humans, since 60% of total water resources should be reserved to maintain ecological equilibrium [47].

3.2.2. Improvement of the WEF Model

In line with its research purposes, this paper modifies the base model in three aspects: equalization factor measurement, yield factor measurement, and carrying capacity measurement, which are now explained in detail.
The equalization factor is a coefficient that converts the productivity of different types of bioproductive land into a comparable standard so as to sum up the area of different types of bioproductive land [30]. This study involves nine provinces in three major urban agglomerations in the Yangtze River Economic Belt, and the total water resources and water resources utilization efficiency of different provinces vary in different periods. To examine the temporal variations in WEF, it is necessary to measure the equalization factors in different years, so as to convert the areas with different productivity of water resources into land with the same productivity and make the city-level WEFs in different provinces comparable. Due to the large volatility of annual water runoff and precipitation in different provinces, this paper takes five years as an interval and sets 2005–2009, 2010–2014, and 2015–2019 as three time periods (1, 2, and 3) to measure the average provincial-level water equalization factor for each period. The calculation formula is as follows.
γ j , z = p j , z W G D P j , z / P w , z W G D P z
where j is the province, z is the period ( z = 1, 2, 3), γ j , z is the equalization factor of province j at time z , p j , z is production capacity of water resources (m3/ hm2) of province j at time z , W G D P j , z is the water consumption per CNY 10,000 of GDP (m3/ CNY 10,000), and the division of the two means the water production capacity of province j at time z ; P w , z is the national-level average production capacity of water resources (m3/ hm2) at time z; W G D P z is the national-level average water consumption per CNY 10,000 of GDP (m3/ CNY 10,000). The calculation results are shown in Table 1.
To make the land with different water productivity comparable, yield factors are needed [48]. The yield factor in this study is used to reflect the water supply capacity within the study area. This paper improves the measurement of yield factors by using city-level data. The calculation formula is as follows.
φ i , z = p i , z / p j , z
where p i , z is the production capacity of water resources (m3/ hm2) of city i at time z , and p j , z is the production capacity of water resources (m3/ hm2) of province j at time z ; the division of different periods is the same as that used for measuring the equalization factor.
Finally, this paper introduces the total amount of recycled water from sewage treatment in the measurement of WEC to measure water-carrying capacity more accurately.
Due to the large variations in the populations of different provinces and cities, this paper uses per capita indicators to better compare the water resource utilization status of different regions. The improved model of WEF is as follows.
w e f i , k = γ j , z × w i , k / p j , k
w e c i , k = γ j , z × φ i , z × ( 0.4 × q i , k + s i , k ) / p j , k
w e s i , k = w e f i , k w e c i , k
w e p i i , k = w e f i , k /   w e c i , k
Based on the literature [49], this paper introduces size and depth indicators to distinguish water resources flow and stock. The small size and large depth suggest that the use of water resources is unsustainable.
The size formula is as follows.
w s i , k = min w e f i , k ,   w e c i , k
where w s i , k denotes the size (hm2).
The depth formula is as follows.
w d i , k = 1 + max w e f i , k w e c i , k , 0 w e c i , k
where w d i , k denotes depth. The product of WEF size and depth is the three-dimensional WEF (hm2), which is shown as follows.
w e f i , k 3 d = w s i , k × w d i , k
The indicators used in this paper are shown in Table 2.

3.3. Spatial Driving Mechanism of Urbanization on Water Ecological Footprint

Population migration, economic development, and land use changes are three important manifestations of urbanization [46]; therefore, this paper examines urbanization from these three dimensions. In line with the literature, this paper uses “gross output of secondary industry/gross GDP” to measure economic urbanization [50], “urban permanent resident population/total permanent resident population” to measure demographic urbanization [44], and “urban built-up area/total area of the administrative district” to measure land urbanization [51].
The spatial autocorrelation of the WEFs of three major urban agglomerations will be investigated using GeoDa software based on data from 2005 and 2019. To examine the spatial externality of urbanization on water resource use within each urban agglomeration, Moran’s I index is calculated based on the data in 2019. Moran’s I index can be used to quantify the potential interdependence between observations in different regions [52]. In this study, it is used to estimate the bivariate global spatial autocorrelation coefficient of urbanization and WEF. Since adjacent regions often have strong correlations in water use, this paper uses queen contiguity to assign spatial weights, and the rank for adjacent cities is set to be 1. The significance of Moran’s I index indicates that at the global level, for the regions whose urbanization levels are high, their surrounding areas tend to have higher WEFs. However, it cannot demonstrate in which areas the aggregation is concentrated. To identify the areas where urbanization has significant spatial externalities on regional water use, the local spatial autocorrelation coefficient is calculated based on the data from 2019 to measure the degree of spatial autocorrelation between the urbanization level of one city and the WEF of the areas adjacent to the city.

3.4. Data Sources

Data on the water resources, water use, and recycled water of each city are obtained from water resources bulletins at the national, provincial, and city levels. Data on population and economic development, which are used to measure urbanization indicators, are obtained from the statistical yearbooks of provinces and cities. The data on urban built-up areas and administrative district areas are obtained from the urban construction yearbook.

4. Results

4.1. Trends of Changes in the WEF of the Yangtze River Economic Belt

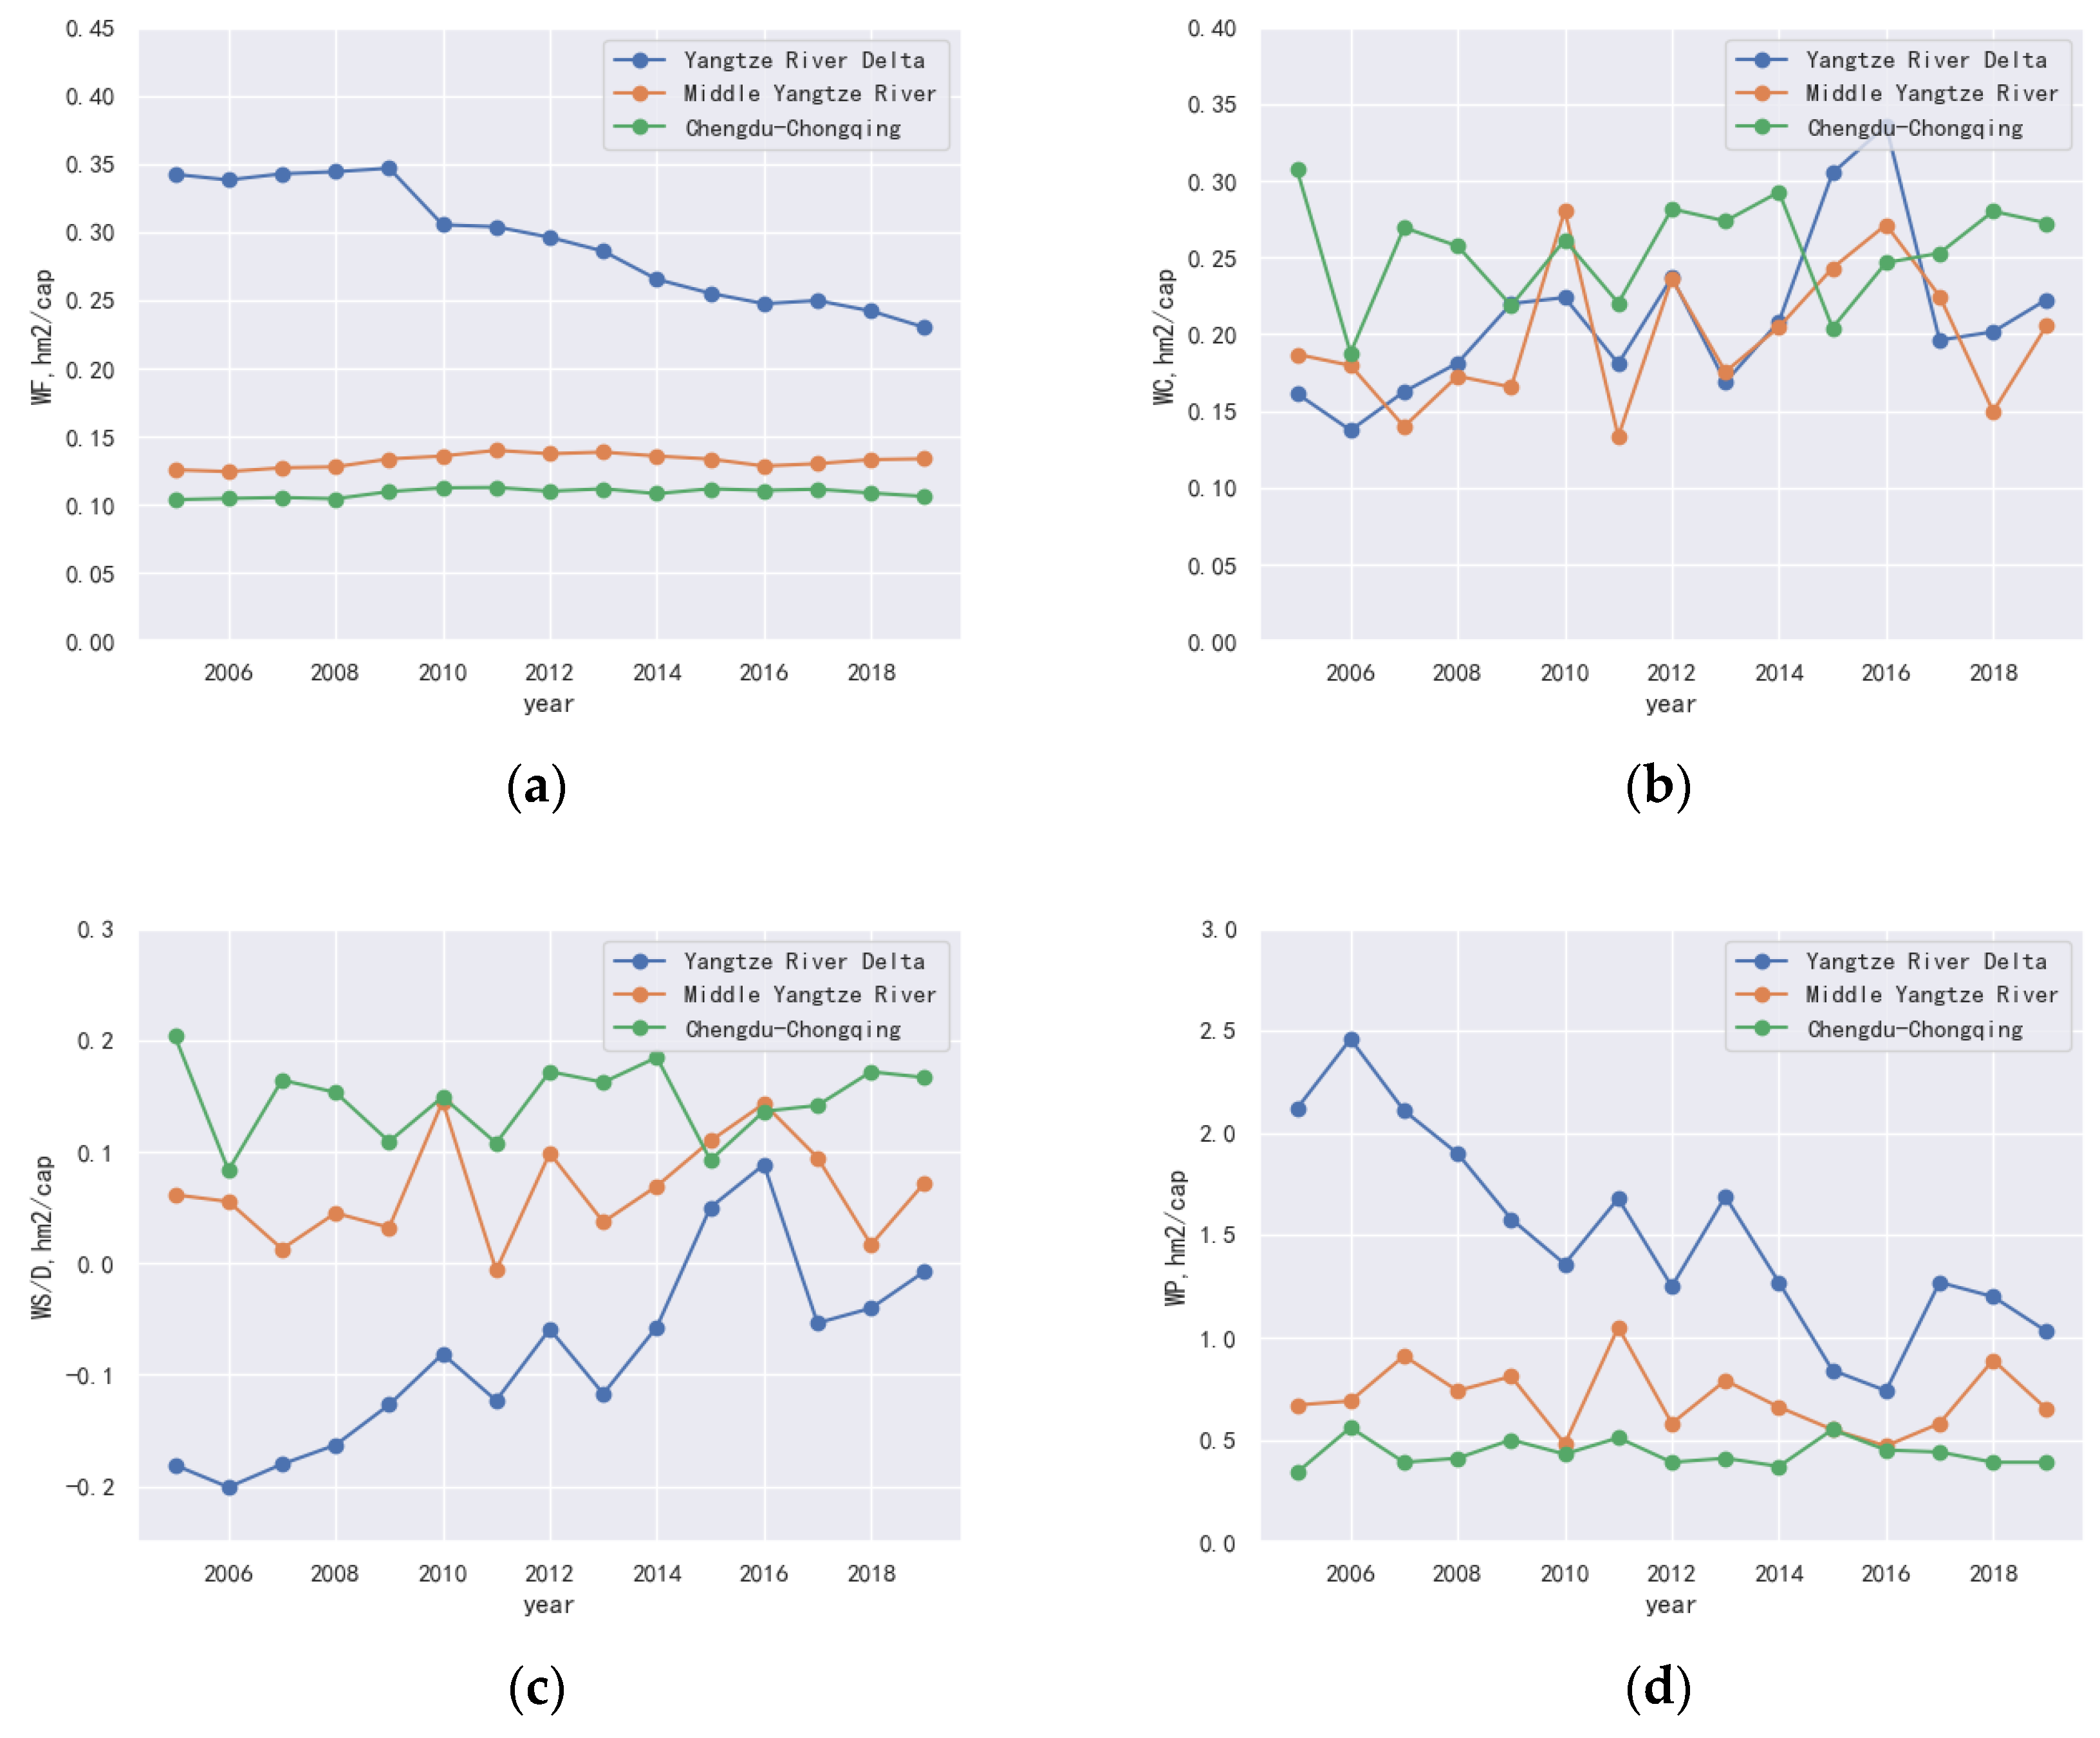
4.1.1. Trends of Changes in the WEFs of the Three Major Urban Agglomerations

As shown in Figure 1a, the WEF of the Yangtze River Delta urban agglomeration was relatively stable until 2009 and then showed a relatively large decreasing trend, with a 33.68% decrease from 2009 to 2019. In contrast, as shown in Figure 1b, the WEFs of the middle Yangtze River urban agglomeration and the Chengdu–Chongqing urban agglomeration experienced very limited changes. Overall, the WEF of the Yangtze River Delta urban agglomeration is much higher than that of the other two urban agglomerations, and the Chengyu urban agglomeration has the lowest WEF. Compared with the WEF, the pattern of changes in the WEC for three urban agglomerations is less obvious.
The water ecological surplus is determined by the difference between the WEF and WEC. As shown in Figure 1c, the Yangtze River Delta urban agglomeration has been in ecological deficit for a long time, but the scale of the ecological deficit shows a decreasing trend, and there is even an ecological surplus in 2015 and 2016. Except for 2011, the middle Yangtze River urban agglomeration generally has an ecological surplus, with little pressure on water resource utilization. The WEF of the Chengdu–Chongqing urban agglomeration is much lower than the WEC and is in an ecological surplus state. The results of the water resources ecological pressure index in Figure 1d are similar to those of ecological surplus. The water resources ecological pressure index in the Yangtze River Delta urban agglomeration is significantly larger than that of the other two urban agglomerations, but shows a decreasing trend overall.
Table 3 shows that in the Yangtze River Delta urban agglomeration, the WEF size roughly shows an increasing trend, indicating that water resources flow increases and provides more support for human activities; the depth of WEF roughly shows a decreasing trend, indicating that the human appropriation of water resources capital stocks gradually decreases and the sustainability of water resources utilization increases. The WEF depth of the middle Yangtze River urban agglomeration is 1.0000 hm2/cap in all years (except 2011). Similarly, the WEF depth of the Chengdu–Chongqing urban agglomeration is 1.0000 hm2/cap in all years, and the WEF size is consistent with the three-dimensional WEF. This indicates that for these two urban agglomerations, the flow of water resources capital can meet the water demand, and there is no need to deplete the water stock; therefore, the water use is sustainable.

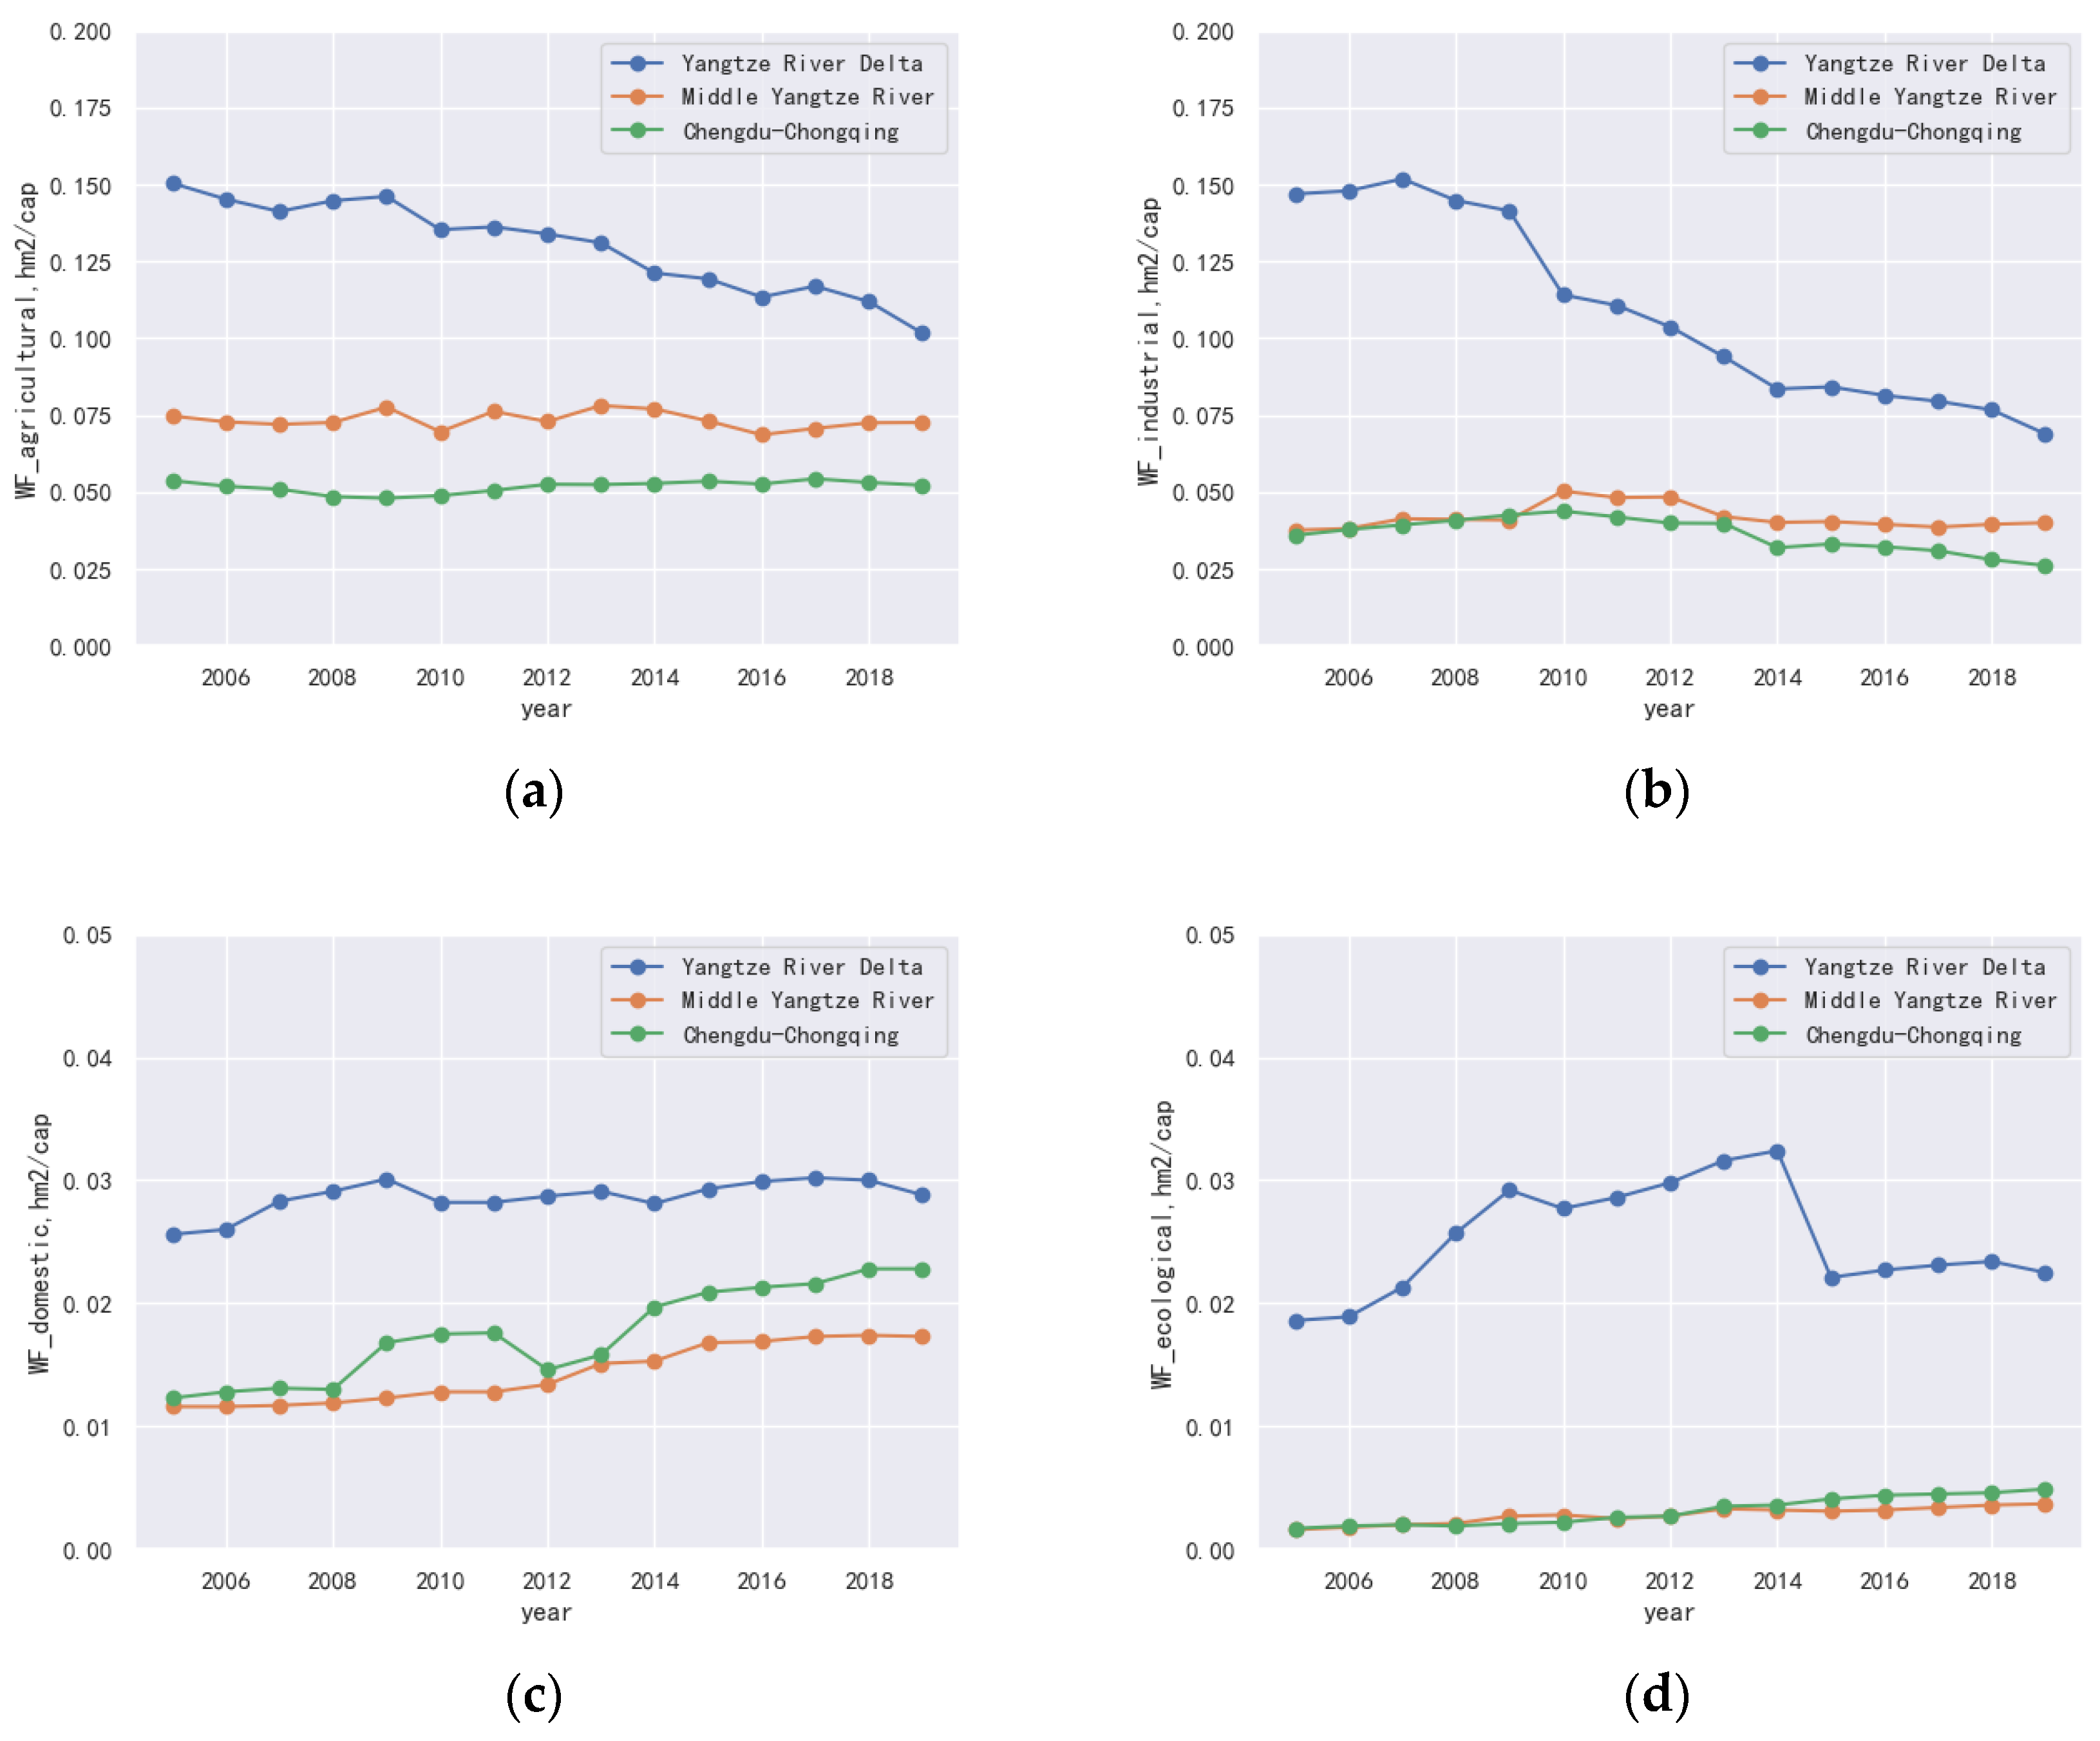
4.1.2. Trends of Changes in WEFs by Water Use Types for the Three Urban Agglomerations

Figure 2a shows that in terms of the agricultural WEF, the three major urban agglomerations in descending order are the Yangtze River Delta, the middle Yangtze River, and Chengdu–Chongqing. The WEF for agricultural use in the Yangtze River Delta urban agglomeration shows a decreasing trend, while that in the middle Yangtze River and the Chengdu–Chongqing urban agglomerations shows less fluctuation during the study period.
In terms of the industrial WEF, Figure 2b shows that this is much higher in the Yangtze River Delta urban agglomeration than in the other two urban agglomerations. The industrial WEF of the Yangtze River Delta urban agglomeration remained stable from 2005 to 2009 and declined rapidly after 2009. The middle Yangtze River urban agglomeration generally has the same industrial WEF as the Chengdu–Chongqing urban agglomeration from 2005 to 2009, but a slightly higher industrial WEF than the Chengdu–Chongqing urban agglomeration after 2009. During the study period, the fluctuations of industrial WEFs are limited for both urban agglomerations.
In terms of the WEF for domestic use, Figure 2c shows that the three urban agglomerations in descending order are the Yangtze River Delta, Chengdu–Chongqing, and the middle Yangtze River. The domestic WEF of the Yangtze River Delta urban agglomeration increased from 2005 to 2009 and remained generally stable after 2009. The Chengdu–Chongqing urban agglomeration maintained an increasing trend in all years except for 2012 when there was a significant decline. The middle Yangtze River urban agglomeration experienced stable but slow growth during the study period.
In terms of the WEF for eco-environmental uses, as shown in Figure 2d, the Yangtze River Delta urban agglomeration is much higher than the other two urban agglomerations. The eco-environment WEF of the Yangtze River Delta urban agglomeration increased rapidly from 2005 to 2014, then experienced a large decrease in 2015 and remained stable afterwards. The middle Yangtze River and the Chengdu–Chongqing urban agglomerations are very low in terms of WEF for ecological use and this showed very slow growth during the study period.

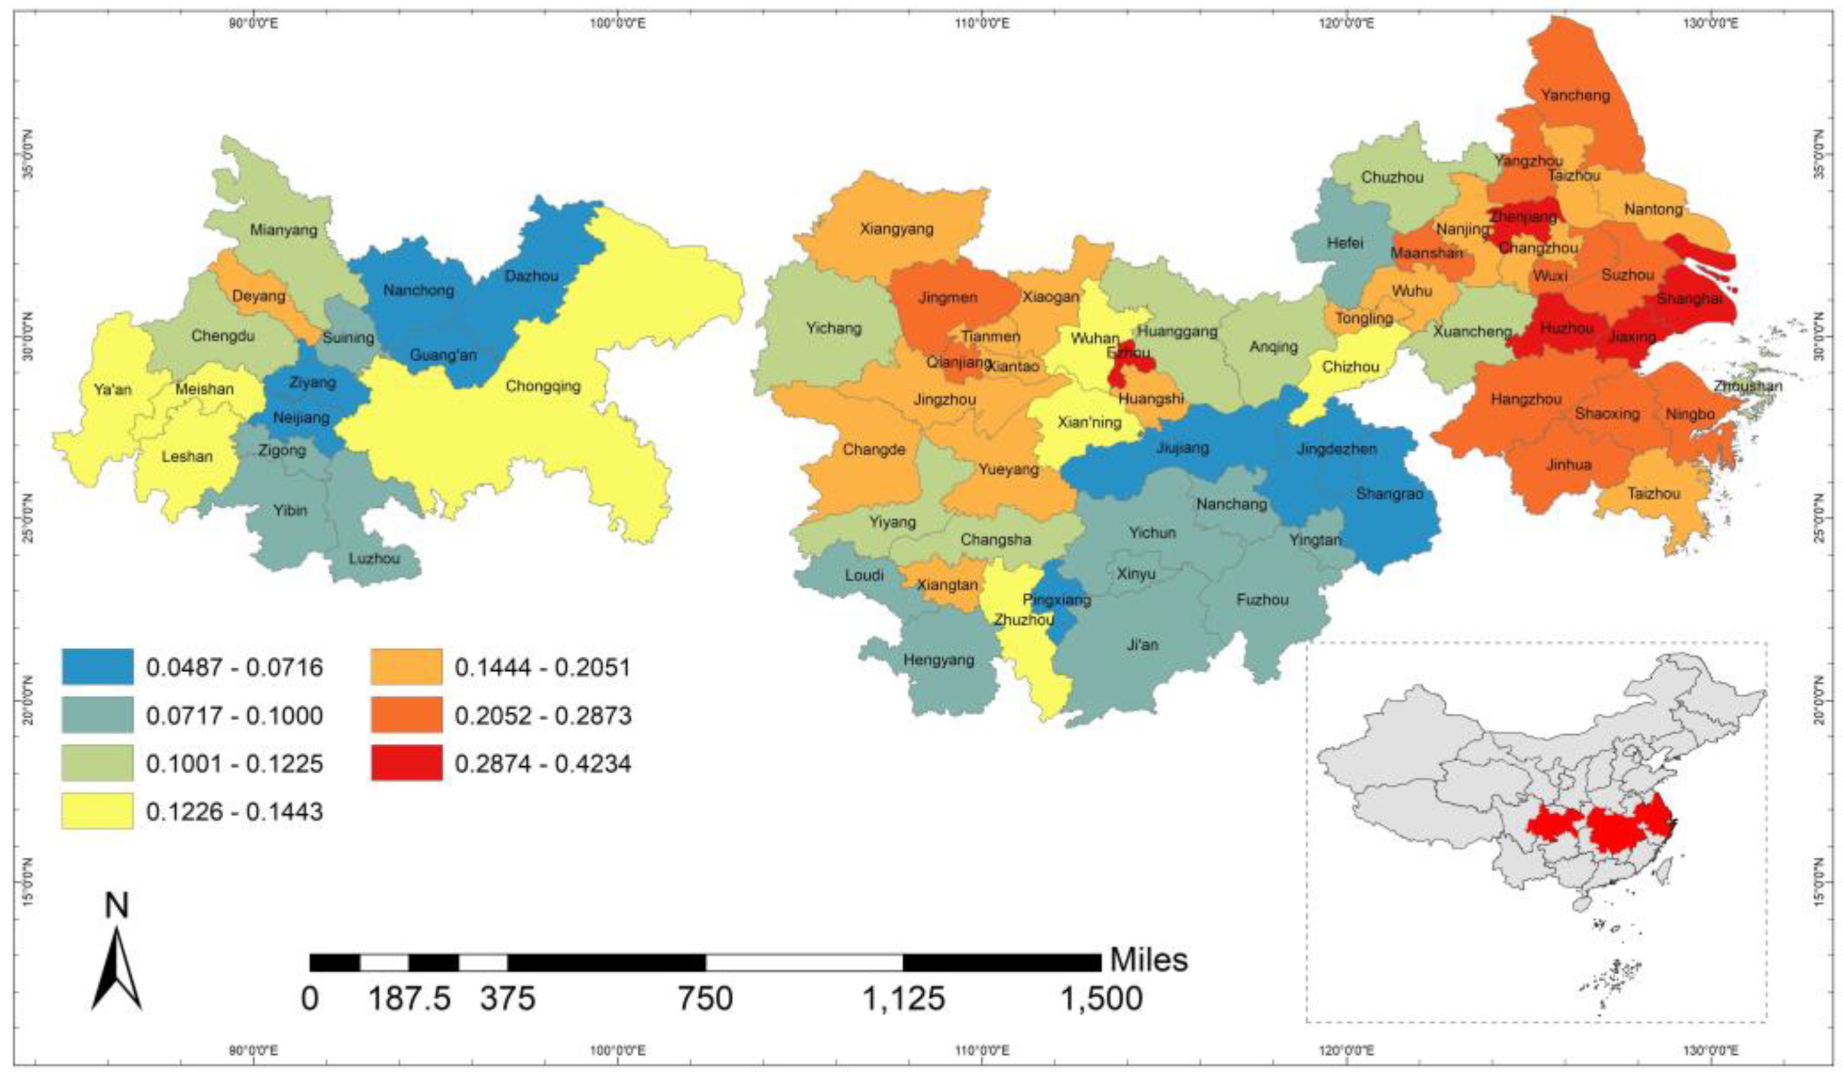
4.2. Spatial Distribution Characteristics of Water Ecological Footprint in the Yangtze River Economic Zone

4.2.1. Spatial Distribution Characteristics of the Water Ecological Footprint of the Three Major Urban Clusters

As shown in Figure 3, the WEF of the three major urban agglomerations in the Yangtze River Economic Belt has the characteristics of being high in the east and low in the west in the spatial distribution. The WEFs of different cities within each urban agglomeration also show some distinctions.
The overall WEF of the Yangtze River Delta urban agglomeration is high, showing the spatial distribution characteristics of high in the middle and low at the two ends. Specifically, there are two local “peaks” in the WEF. One is the area formed by Zhenjiang City as the center and its surrounding cities. The second is the area at the junction of three provinces: Jiangsu, Zhejiang, and Anhui, including the cities of Shanghai, Huzhou, and Jiaxing. The WEF is low in the northeast, southeast, and west of the Yangtze River Delta urban agglomeration. The WEFs of Anhui Province, except Maanshan City, are much lower than those of Jiangsu Province, Zhejiang Province, and Shanghai.
The WEF of the middle Yangtze River urban agglomeration roughly decreases from northwest to southeast in its spatial distribution. In this urban agglomeration, there are also two “peak” areas of WEF. The first one is the area composed of Ezhou City and Huangshi City. The second is the area composed of Jingmen City, Xiantao City, and their neighboring cities. Some cities in Hunan Province such as Changde, Yueyang, Changsha, and Zhuzhou, which border with Hubei and Jiangxi provinces, have medium WEFs. The WEF of cities in Jiangxi province is low.
Compared with the cities in the Yangtze River Delta and middle Yangtze River urban agglomerations, cities in the Chengdu–Chongqing urban agglomeration have significantly smaller WEFs. Figure 3 shows that the WEFs of the Chengdu–Chongqing urban agglomeration are relatively high on the west and east sides and low in the middle in terms of spatial distribution.

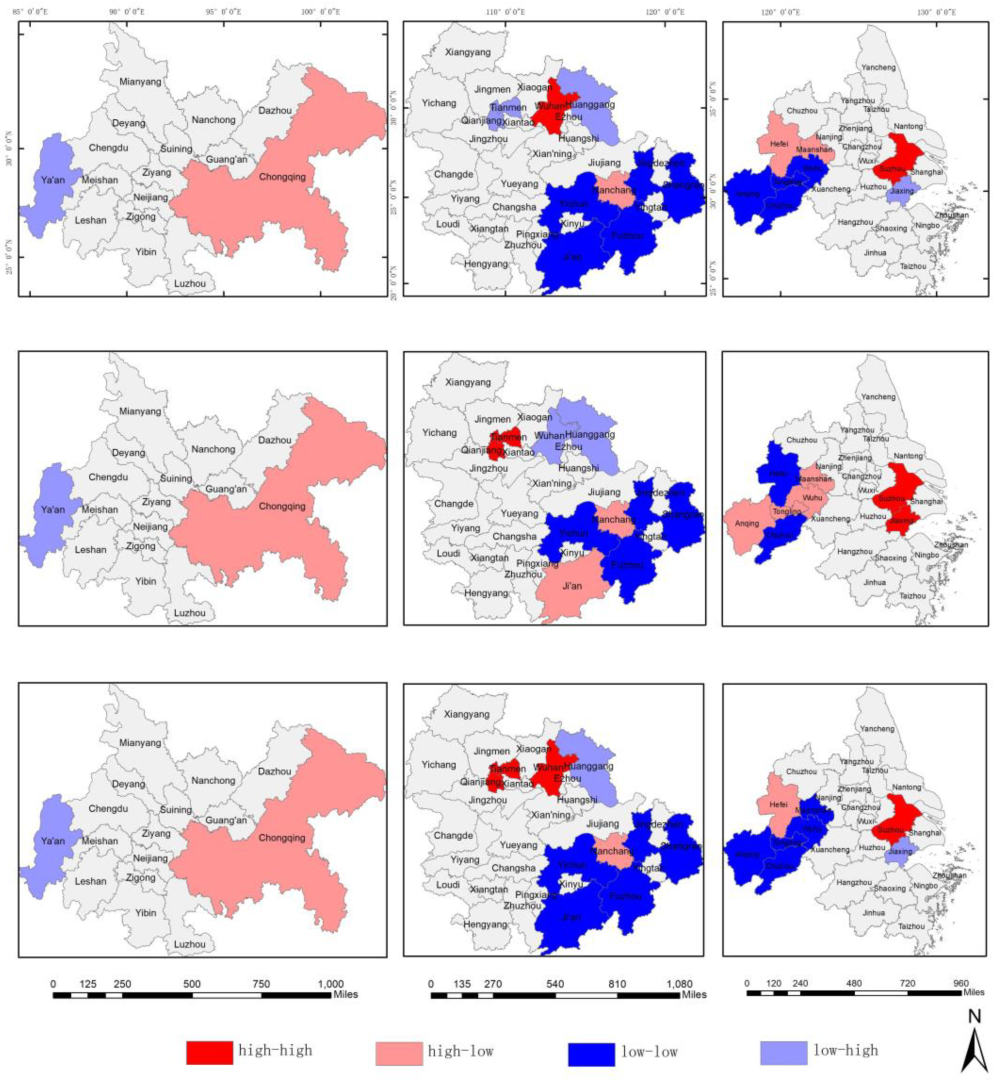
4.2.2. Spatial Autocorrelation Analysis of the WEFs of the Three Major Urban Agglomerations

Table 4 shows the results of the global spatial autocorrelation of the WEFs of three major urban agglomerations. In terms of the spatial weights for the 26 cities in the Yangtze River Delta urban agglomeration, the maximum number of neighbors is 8 and the minimum number is 1. As shown in Table 4, the WEF of the Yangtze River Delta urban agglomeration exhibited significant spatial autocorrelation during the study period. The spatial autocorrelation is the highest in 2005 and 2007 and is significant at the 1% confidence level. The spatial autocorrelation decreases between 2009 and 2019 but is still significant at the 5% confidence level. The Global Moran’s I index is positive, indicating that the spatial autocorrelation of WEF in this urban agglomeration is positive at the global level. This result implies that cities with higher WEFs tend to have higher WEFs in their neighboring cities.
Spatial weights are assigned to 31 cities in the middle Yangtze River urban agglomeration: the maximum number of neighbors is 9 and the minimum number is 1. As shown in Table 4, the Global Moran’s I index for the middle Yangtze River urban agglomeration in 2005 and 2007 is negative but not significant. After 2009, the Global Moran’s I index turns positive, implying a significant positive spatial autocorrelation: cities with higher WEFs tend to have higher WEFs in their neighboring cities.
Spatial weights are assigned to the 16 cities in the Chengdu–Chongqing urban agglomeration: the maximum number of neighbors is 6 and the minimum number is 3. As shown in Table 4, the Global Moran’s I index of WEF for the Chengdu–Chongqing urban agglomeration is positive and significant at the 5% confidence level from 2005 to 2017, showing a significant positive spatial autocorrelation. However, the Global Moran’s I index decreased to 0.085 in 2019 and is no longer significant.

4.3. Spatial Externality of Urbanization on WEF

4.3.1. Population Urbanization

As shown in Table 5, population urbanization in the Yangtze River Delta urban agglomeration has a significantly positive spatial correlation with the WEF in 2019 (Moran’s I = 0.233, p-value = 0.008). Areas with higher levels of population urbanization also have higher WEFs in their surrounding areas. Figure 4 presents the results of the local spatial autocorrelation analysis. In 2019, Suzhou City is characterized by “high–high” clustering, with a high level of population urbanization and a high WEF in its surrounding areas. This indicates that Suzhou is attractive to the population and places large pressure on the water resources in the surrounding areas. The cities of Tongling, Anqing, and Chihuahua are characterized by “low–low” clustering, with a low level of population urbanization and a low WEF in their surrounding areas. Hefei and Maanshan show a type of “high–low” clustering, with a high level of population urbanization but a low WEF in their surrounding areas. Jiaxing is characterized by “low–high” clustering, with a low level of population urbanization and a high WEF in its surrounding area.
The spatial correlation between population urbanization and WEF is not significant for the middle Yangtze River and Chengdu–Chongqing urban agglomerations. The reason for this is probably that the two urban agglomerations have abundant water resources but are less attractive to populations from other regions; therefore, the population increase in these two urban agglomerations has very limited influences on the water resource use in their surrounding areas. Figure 4 shows that for the middle Yangtze River urban agglomeration, in 2019, Wuhan is characterized by “high–high” clustering, Yichun, Fuzhou, Shangrao, and Ji’an show a “low–low” type of clustering, Nanchang shows a “high–low” type of clustering, and Qianjiang, Tianmen, and Huanggang are characterized by “low–high” clustering. For the Chengdu–Chongqing urban agglomeration, Chongqing and Ya’an are characterized by “high–low” and “low–high” clustering, respectively.

4.3.2. Economic Urbanization

Table 5 shows that for the Yangtze River Delta urban agglomeration, the spatial correlation between economic urbanization and WEF is not significant. Figure 4 shows that Suzhou and Jiaxing in the east are characterized by “high–high” clustering. Hefei and Chizhou in the west are characterized by “low–low” clustering. Anqing, Tongling, Wuhu, and Maanshan show “high–low” clustering characteristics.
For the middle Yangtze River urban agglomeration, the spatial correlation between economic urbanization and the WEF is not significant. Figure 4 shows that in 2019, only Tianmen and Qianjiang have significant “high–high” clustering characteristics. Yichun, Fuzhou, and Shangrao have a “low–low” type of clustering. Ji’an and Nanchang show “high–low” clustering characteristics, while Wuhan and Huanggang have “low–high” clustering characteristics.
For the Chengdu–Chongqing urban agglomeration, economic urbanization and WEF are significantly negatively correlated in 2019 (Moran’s I = −0.159, Z-value = −1.423, and p-value = 0.074). This result indicates that economic urbanization contributes to improving water resource use and decreasing WEF in the region. Figure 4 shows that in 2019, Chongqing has a “high–low” type of clustering, while Ya’an has a “low–high” type of clustering.

4.3.3. Land Urbanization

As shown in Table 5, the spatial correlation between land urbanization and the WEF is significantly positive for the Yangtze River Delta urban agglomeration in 2019 (Moran’s I = −0.137, Z-value = −1.734, p-value = 0.050). Figure 4 shows that in 2019, Suzhou has a “high–high” type of clustering. Wuhu, Maanshan, Tongling, and Anqing are characterized by “low–low” clustering. Hefei shows a “high–low” type of clustering, while Jiaxing shows a “low–high” type of clustering.
For the middle Yangtze River urban agglomeration, land urbanization has a significant positive correlation with WEF (Moran’s I = −0.113, Z-value = −1.424, p-value = 0.085). Figure 4 shows that in 2019, Wuhan, Tianmen, and Qianjiang have a “high–high “type of clustering. Yichun, Shangrao, Fuzhou, and Ji’an have a “low–low” type clustering. Nanchang and Huanggang are characterized by “high–low” and “low–high” types of clustering, respectively.
For the Chengdu–Chongqing urban agglomeration, the spatial correlation between land urbanization and WEF is not significant. Figure 4 shows that Chongqing has a “high–low” type of clustering in 2019, while Ya’an has a “low–high” type of clustering.

5. Discussion and Conclusions

5.1. Discussion

This study examined the trends of changes in the WEF of three major urban agglomerations in China’s Yangtze River Economic Belt. The WEF of the Yangtze River Delta urban agglomeration has spatial distribution characteristics of high in the middle and low at both ends. The Yangtze River Delta urban agglomeration has a water ecological deficit, and its WEFs for all of the four water use types are significantly higher than those of the other two major urban agglomerations, indicating a severe situation of water resource utilization. However, the optimistic aspect is that the agricultural and industrial WEFs of the Yangtze River Delta urban agglomeration have significantly decreased, indicating an increase in the efficiency of water use [50]. The WEF of the middle Yangtze River urban agglomeration is high in the northwest and low in the southeast. There is an ecological surplus, and in the study period, there are only limited increases in WEFs for all water use types. It is noteworthy that the WEC of this urban agglomeration fluctuates greatly, indicating that water resource use in this region may be occasionally under pressure. The WEF of the Chengdu–Chongqing urban agglomeration has the spatial distribution characteristics of being high on the west and east sides and low in the middle, and its water resources are abundant. However, there is a rapidly increasing demand for water for domestic water use, suggesting a need to increase the water conservation awareness of the residents in this region. These results indicate the significant spatial variations of water resource use in the Yangtze River Economic Belt and also echo the findings of the extant literature that water resource security is higher in the western region than in the central and western regions of China [18]. The global spatial autocorrelation analysis of the WEFs shows that for each of the three urban agglomerations, the city-level WEFs generally show significant positive spatial autocorrelations, suggesting that the three urban agglomerations are characterized by the clustering of water resource use. This result is consistent with the findings of many previous studies, which show the spatial spillover effect of WEFs [20,44,49].
The results of the global spatial correlation analysis of urbanization and WEF show that population urbanization and WEF show a significant positive spatial correlation in the Yangtze River Delta urban agglomeration, indicating that the concentration of population in cities has led to the spillover of water use demand, resulting in increased pressure on water use in surrounding cities. Economic urbanization and WEF show a significantly negative spatial correlation in the Chengdu–Chongqing urban agglomeration, which indicates the positive environmental externality of industrialization on water use. The reason may be that industrial agglomeration contributes to the upgrading of industrial structures and the advancement of production technology, which increases the water use efficiency of the cities in the Chengdu–Chongqing urban agglomeration. Land urbanization and WEF show a significantly positive correlation in the Yangtze River Delta urban agglomeration and the middle Yangtze River urban agglomeration, which indicates that the expansion of urban built-up areas will lead to an increase in water demand in surrounding cities. Local spatial autocorrelation analysis shows that, overall, Suzhou and Wuhan have “high–high” clustering characteristics, while Jiaxing, Huanggang, and Ya’an have “low–high” clustering characteristics. The common feature of these three cities is their proximity to the provincial capital city; therefore, they not only suffer from a flow of population and resources but also have to share part of the water use burden of provincial capital cities. The low sustainability of water resource use in these five cities needs more attention from policymakers. In contrast, Hefei, Maanshan, Nanchang, and Chongqing have “high–low” clustering characteristics, showing significant positive environmental externalities of urbanization, and their urbanization strategies are worthy of reference by other cities.
The spatial spillover effects of urbanization have drawn increasing attention in the recent literature. Evidence from sub-Saharan Africa shows that areas surrounded by highly urbanized countries tend to have higher WEFs [5]. The essence of spatial externality is that a change in the state of one city affects the state of other cities, and it is driven by multiple factors. Urbanization involves the flow of information, population, technology, resources, capital, and other factors of production between cities, which leads to increasingly close spatial connections between cities. The results of the bivariate Moran’s I index in this paper suggest that only a small number of cities shows a significant spatial correlation between urbanization and WEF, indicating that the spatial linkage effect of urbanization within the urban agglomerations of the Yangtze River Economic Belt is not yet significant. More research is needed to understand the reasons for the variations in the spatial externalities of urbanization on water resource use across cities and urban agglomerations, so that policy instruments can be designed and optimized to expand positive spatial externalities and reduce negative externalities.
Our findings have direct policy implications. The Yangtze River Delta urban agglomeration, especially Shanghai and some cities in Jiangsu Province, has been under a long-term water ecological deficit. Therefore, for the Yangtze River Delta urban agglomeration, it is necessary to accelerate industrial transformation and develop green industries. The middle Yangtze River urban agglomeration has a water ecological surplus, but some cities in Hubei Province still have pressure on water resource use. For these cities, especially those in the Wuhan metropolitan area, it is necessary to set strict sewage discharge standards, strengthen sewage treatment, and promote the recycling of water. The Chengdu–Chongqing urban agglomeration has a stable water ecological surplus, but there is still some water ecological pressure in the Chengdu metropolitan area. In this area, it is necessary to improve the efficiency of water use, enhance investment in constructing sewage treatment plants, and increase the proportion of water for public ecological landscape use. For the whole Yangtze River Economic Belt, a unified water resource property rights trading platform can be established to realize the efficient flow of water rights within and between urban agglomerations.

5.2. Conclusions

Based on an improved water ecological footprint (WEF) model, this study focuses on the three major urban agglomerations in the Yangtze River Economic Belt, and measures the WEF and other relevant indicators of three urban agglomerations from 2005 to 2019. The temporal–spatial variations and spatial auto-correlations of water resource utilization in the Yangtze River Economic Belt are examined. Moreover, this study decomposes urbanization into three dimensions (population, economy, and land) and analyzes the spatial correlation between urbanization and water resources utilization. The results show that among the three major urban agglomerations in the Yangtze River Economic Zone, the water ecological footprint is the highest in the downstream area of the Yangtze River and the lowest in the upstream area. The Yangtze River Delta urban agglomeration has large water use pressure; however, its situation is improving over time. Jiangsu Province, Shanghai City, Hubei Province, and Chengdu City have obvious water resources ecological pressure. The WEF at the city level has a significant spatial autocorrelation, and cities with high water use are often concentrated. In some regions, urbanization and WEF show significant spatial correlation, indicating the environmental externality of urbanization on water resource use.
This paper has both theoretical and practical implications. This study uses city-level data to assess and compare the WEFs of three major urban agglomerations in the Yangtze River Economic Belt of China, which may inform research on the water use of urban agglomerations. The analysis of the spatial autocorrelation of WEFs and the spatial externality of urbanization on water resource use may contribute to understanding the environmental externality of urbanization and the driving factors of WEFs. In terms of methodology, this paper improves the classic WEF model by introducing water balance and yield factors that accommodate regional differences, and by incorporating recycled water into the water supply side; therefore, our approach may more accurately measure the water ecological carrying capacity of different regions. In terms of policy implications, by examining the changing trends and spatial distribution of water resource use at the city level in three urban agglomerations, this paper sheds light on the differences in water use characteristics and demands in different regions, and provides empirical support for implementing more targeted water resources protection measures in the upper, middle, and lower reaches of the Yangtze River.
Based on this paper, future research can be conducted from the following perspectives. First, this paper examines the spatial correlation between urbanization and WEF within each urban agglomeration. More theoretical explorations are needed to understand the drivers of this spatial correlation to gain a deeper understanding of the reasons why urbanization exhibits positive or negative spatial externalities on water use. Second, this paper decomposed urbanization into three dimensions and explored their respective spatial correlations with WEF. However, there is still room for improvement in measuring the three dimensions of urbanization. Future studies could select more indicators to measure urbanization and examine the spatial externalities of urbanization on water use more accurately. Third, this paper considers water recycling in the calculation of water ecological carrying capacity. However, due to the difficulty in obtaining water pollution data such as COD, total phosphorus concentrations, and total nitrogen concentrations at the city level, this paper does not assess the water quality in the Yangtze River Economic Zone, which is to be explored in future studies.

Author Contributions

Conceptualization, X.Z., D.Z. and Z.Y.; methodology, D.Z.; software, D.Z.; validation, D.Z. and Z.Y.; formal analysis, D.Z. and Z.Y.; writing—original draft preparation, X.Z. and D.Z.; writing—review and editing, X.Z. and Z.Y.; visualization, D.Z.; supervision, X.Z. All authors have read and agreed to the published version of the manuscript.

Funding

This research was funded by the National Science and Technology Project of Water Pollution Control and Governance, grant number 2014ZX07323-001-03.

Data Availability Statement

Data used in this study are of open access and can be found from the sources described in Section 3.4 (Data Sources).

Conflicts of Interest

The authors declare no conflict of interest.

Appendix A

Table A1. List of provinces and cities corresponding to three urban agglomerations.
Study AreaYangtze River Delta (Downstream)Middle Yangtze River (Middle Stream)Chengdu–Chongqing (Upper Stream)
Policy basisThe Yangtze River Delta Urban Agglomeration Development Plan, approved at the State Council executive meeting on 11 May 2016The Development Plan of the Middle Yangtze River Urban Agglomeration, approved by the State Council on 26 March 2015Development Plan of Chengdu–Chongqing Urban Agglomeration, issued by the State Council on 12 April 2016
Provinces and cities (in parenthesis is the number of cities)Shanghai (1)
Jiangsu Province (9): Nanjing City, Wuxi City, Changzhou City, Suzhou City, Nantong City, Yancheng City, Yangzhou City, Zhenjiang City, Taizhou City
Zhejiang Province (8): Hangzhou City, Ningbo City, Jiaxing City, Huzhou City, Shaoxing City, Jinhua City, Zhoushan City, Taizhou City
Anhui Province (8): Hefei City, Wuhu City, Maanshan City, Tongling City, Anqing City, Chuzhou City, Chizhou City, Xuancheng City
Hubei Province (13): Wuhan City, Huangshi City, Ezhou City, Huanggang City, Xiaogan City, Xianning City, Xiantao City, Qianjiang City, Tianmen City, Xiangyang City, Yichang City, Jingzhou City, Jingmen City
Hunan Province (8): Changsha City, Zhuzhou City, Xiangtan City, Yueyang City, Yiyang City, Changde City, Hengyang City, Loudi City
Jiangxi Province (10): Nanchang City, Jiujiang City, Jingdezhen City, Yingtan City, Xinyu City, Yichun City, Pingxiang City, Shangrao City, Fuzhou City, Ji’an City
Chongqing (1)
Sichuan Province (15): Chengdu City, Zigong City, Luzhou City, Deyang City, Mianyang City, Suining City, Neijiang City, Leshan City, Nanchong City, Meishan City, Yibin City, Guang’an City, Dazhou City, Ya’an City, Ziyang City

References

  1. Hoekstra, A.Y. Human Appropriation of Natural Capital: A Comparison of Ecological Footprint and Water Footprint Analysis. Ecol. Econ. 2009, 68, 1963–1974. [Google Scholar] [CrossRef]
  2. Gómez-Llanos, E.; Matías-Sánchez, A.; Durán-Barroso, P. Wastewater Treatment Plant Assessment by Quantifying the Carbon and Water Footprint. Water 2020, 12, 3204. [Google Scholar] [CrossRef]
  3. Cai, J.; Xie, R.; Wang, S.; Deng, Y.; Sun, D. Patterns and Driving Forces of the Agricultural Water Footprint of Chinese Cities. Sci. Total Environ. 2022, 843, 156725. [Google Scholar] [CrossRef] [PubMed]
  4. Yu, D.J.; Anderies, J.M.; Lee, D.; Perez, I. Transformation of Resource Management Institutions under Globalization: The Case of Songgye Community Forests in South Korea. Ecol. Soc. 2014, 19, 1–15. [Google Scholar] [CrossRef]
  5. Kassouri, Y. Monitoring the Spatial Spillover Effects of Urbanization on Water, Built-up Land and Ecological Footprints in Sub-Saharan Africa. J. Environ. Manag. 2021, 300, 113690. [Google Scholar] [CrossRef]
  6. Paterson, W.; Rushforth, R.; Ruddell, B.; Konar, M.; Ahams, I.; Gironás, J.; Mijic, A.; Mejia, A. Water Footprint of Cities: A Review and Suggestions for Future Research. Sustainability 2015, 7, 8461–8490. [Google Scholar] [CrossRef]
  7. Carmona, L.G.; Whiting, K.; Carrasco, A. The Water Footprint of Heavy Oil Extraction in Colombia: A Case Study. Water 2017, 9, 340. [Google Scholar] [CrossRef]
  8. Morera, S.; Corominas, L.; Poch, M.; Aldaya, M.M.; Comas, J. Water Footprint Assessment in Wastewater Treatment Plants. J. Clean. Prod. 2016, 112, 4741–4748. [Google Scholar] [CrossRef]
  9. Bao, C.; Fang, C. Water Resources Flows Related to Urbanization in China: Challenges and Perspectives for Water Management and Urban Development. Water Resour. Manag. 2012, 26, 531–552. [Google Scholar] [CrossRef]
  10. Sarker, S.; Veremyev, A.; Boginski, V.; Singh, A. Critical Nodes in River Networks. Sci. Rep. 2019, 9, 1–11. [Google Scholar]
  11. Gao, Y.; Sarker, S.; Sarker, T.; Leta, O.T. Analyzing the Critical Locations in Response of Constructed and Planned Dams on the Mekong River Basin for Environmental Integrity. Environ. Res. Commun. 2022, 4, 101001. [Google Scholar] [CrossRef]
  12. Bao, C.; He, D. Scenario Modeling of Urbanization Development and Water Scarcity Based on System Dynamics: A Case Study of Beijing–Tianjin–Hebei Urban Agglomeration, China. Int. J. Environ. Res. Public Health 2019, 16, 3834. [Google Scholar] [CrossRef] [PubMed]
  13. Luo, Q.; Zhou, J.; Li, Z.; Yu, B. Spatial Differences of Ecosystem Services and Their Driving Factors: A Comparation Analysis among Three Urban Agglomerations in China’s Yangtze River Economic Belt. Sci. Total Environ. 2020, 725, 138452. [Google Scholar] [CrossRef] [PubMed]
  14. Wackernagel, M.; Rees, W. Our Ecological Footprint: Reducing Human Impact on the Earth; New Society Publishers: Gabriola Island, BC, Canada, 1998. [Google Scholar]
  15. Hoekstra, A.Y. Water Footprint Assessment: Evolvement of a New Research Field. Water Resour. Manag. 2017, 31, 3061–3081. [Google Scholar] [CrossRef]
  16. Zhu, Y.; Jiang, S.; Han, X.; Gao, X.; He, G.; Zhao, Y.; Li, H. A Bibliometrics Review of Water Footprint Research in China: 2003–2018. Sustainability 2019, 11, 5082. [Google Scholar] [CrossRef]
  17. Sun, S. Water Footprints in Beijing, Tianjin and Hebei: A Perspective from Comparisons between Urban and Rural Consumptions in Different Regions. Sci. Total Environ. 2019, 647, 507–515. [Google Scholar] [CrossRef] [PubMed]
  18. Jing, P.; Sheng, J.; Hu, T.; Mahmoud, A.; Guo, L.; Liu, Y.; Wu, Y. Spatiotemporal Evolution of Sustainable Utilization of Water Resources in the Yangtze River Economic Belt Based on an Integrated Water Ecological Footprint Model. J. Clean. Prod. 2022, 358, 132035. [Google Scholar] [CrossRef]
  19. Yang, Y.; Cai, Z. Ecological Security Assessment of the Guanzhong Plain Urban Agglomeration Based on an Adapted Ecological Footprint Model. J. Clean. Prod. 2020, 260, 120973. [Google Scholar] [CrossRef]
  20. Hu, M.; Yuan, J.; Chen, L. Water Ecological Footprint Size, Depth and Its Spatial Pattern Correlation in the “Four-City Area in Middle China”. Ecol. Indic. 2021, 133, 108387. [Google Scholar] [CrossRef]
  21. Cheng, X.; Chen, L.; Sun, R.; Jing, Y. Identification of Regional Water Resource Stress Based on Water Quantity and Quality: A Case Study in a Rapid Urbanization Region of China. J. Clean. Prod. 2019, 209, 216–223. [Google Scholar] [CrossRef]
  22. An, M.; Fan, L.; Huang, J.; Yang, W.; Wu, H.; Wang, X.; Khanal, R. The Gap of Water Supply—Demand and Its Driving Factors: From Water Footprint View in Huaihe River Basin. PLoS ONE 2021, 16, e0247604. [Google Scholar] [CrossRef] [PubMed]
  23. Zhang, L.; Dong, H.; Geng, Y.; Francisco, M.-J. China’s Provincial Grey Water Footprint Characteristic and Driving Forces. Sci. Total Environ. 2019, 677, 427–435. [Google Scholar] [CrossRef] [PubMed]
  24. Feng, L.; Chen, B.; Hayat, T.; Alsaedi, A.; Ahmad, B. The Driving Force of Water Footprint under the Rapid Urbanization Process: A Structural Decomposition Analysis for Zhangye City in China. J. Clean. Prod. 2017, 163, S322–S328. [Google Scholar] [CrossRef]
  25. Skouteris, G.; Ouki, S.; Foo, D.; Saroj, D.; Altini, M.; Melidis, P.; Cowley, B.; Ells, G.; Palmer, S.; O’Dell, S. Water Footprint and Water Pinch Analysis Techniques for Sustainable Water Management in the Brick-Manufacturing Industry. J. Clean. Prod. 2018, 172, 786–794. [Google Scholar] [CrossRef]
  26. Darrel Jenerette, G.; Larsen, L. A Global Perspective on Changing Sustainable Urban Water Supplies. Glob. Planet. Change 2006, 50, 202–211. [Google Scholar] [CrossRef]
  27. Konar, M.; Marston, L. The Water Footprint of the United States. Water 2020, 12, 3286. [Google Scholar] [CrossRef]
  28. Stoeglehner, G.; Edwards, P.; Daniels, P.; Narodoslawsky, M. The Water Supply Footprint (WSF): A Strategic Planning Tool for Sustainable Regional and Local Water Supplies. J. Clean. Prod. 2011, 19, 1677–1686. [Google Scholar] [CrossRef]
  29. Hogeboom, R.J.; Hoekstra, A.Y. Water and Land Footprints and Economic Productivity as Factors in Local Crop Choice: The Case of Silk in Malawi. Water 2017, 9, 802. [Google Scholar] [CrossRef]
  30. Wang, H.; Huang, J.; Zhou, H.; Deng, C.; Fang, C. Analysis of Sustainable Utilization of Water Resources Based on the Improved Water Resources Ecological Footprint Model: A Case Study of Hubei Province, China. J. Environ. Manag. 2020, 262, 110331. [Google Scholar] [CrossRef] [PubMed]
  31. Chen, M.; Zhou, Q.; Duan, W.; Xue, Q.; Chen, C. Using an Improved Ecological Footprint Model to Analyze the Sustainable Utilization of Water Resources in Beijing–Tianjin–Hebei Region. Environ. Dev. Sustain. 2022. epub ahead of print. [Google Scholar] [CrossRef]
  32. Cruz-Pérez, N.; Santamarta, J.C.; García-Gil, A.; Rodríguez-Martín, J.; Miralles-Wilhelm, F.; Hernández-Alemán, A.; Aldaya, M.M. Water Footprint of the Water Cycle of Gran Canaria and Tenerife (Canary Islands, Spain). Water 2022, 14, 934. [Google Scholar] [CrossRef]
  33. Liang, D.; Lu, H.; Feng, L.; Qiu, L.; He, L. Assessment of the Sustainable Utilization Level of Water Resources in the Wuhan Metropolitan Area Based on a Three-Dimensional Water Ecological Footprint Model. Water 2021, 13, 3505. [Google Scholar] [CrossRef]
  34. Luo, W.; Bai, H.; Jing, Q.; Liu, T.; Xu, H. Urbanization-Induced Ecological Degradation in Midwestern China: An Analysis Based on an Improved Ecological Footprint Model. Resour. Conserv. Recycl. 2018, 137, 113–125. [Google Scholar] [CrossRef]
  35. Gober, P. Desert Urbanization and the Challenges of Water Sustainability. Curr. Opin. Environ. Sustain. 2010, 2, 144–150. [Google Scholar] [CrossRef]
  36. Li, W.; Hai, X.; Han, L.; Mao, J.; Tian, M. Does Urbanization Intensify Regional Water Scarcity? Evidence and Implications from a Megaregion of China. J. Clean. Prod. 2020, 244, 118592. [Google Scholar] [CrossRef]
  37. Ouyang, H.; Li, Z.; Li, P. Trend and Policy Implication of Urbanization Rate in China During the 14th Five Year Plan Period. Urban Dev. Stud. 2021, 28, 1–9. [Google Scholar]
  38. Tong, J.; Ma, J.; Liu, G. Analysis of Variations and Factors of Water Use Amount per Ten Thousand Yuan GDP in China Based on a Complete Decomposition Model. Resour. Sci. 2011, 33, 1870–1876. [Google Scholar]
  39. Wang, M.; Yin, S.; Lu, L. Simulation and Prediction of Water Supply and Demand Matching in Water-Deficient Cities: A Case Study of Lanzhou City of Gansu Province. Econ. Geogr. 2020, 40, 89–96. [Google Scholar] [CrossRef]
  40. Jin, L.; Zhang, G.; Tian, H. Current State of Sewage Treatment in China. Water Res. 2014, 66, 85–98. [Google Scholar] [CrossRef]
  41. Li, H.; Zhao, F.; Li, C.; Yi, Y.; Bu, J.; Wang, X.; Liu, Q.; Shu, A. An Improved Ecological Footprint Method for Water Resources Utilization Assessment in the Cities. Water 2020, 12, 503. [Google Scholar] [CrossRef]
  42. Cai, B.; Liu, B.; Zhang, B. Evolution of Chinese Urban Household’s Water Footprint. J. Clean. Prod. 2019, 208, 1–10. [Google Scholar] [CrossRef]
  43. Danish; Ulucak, R.; Khan, S.U.-D. Determinants of the Ecological Footprint: Role of Renewable Energy, Natural Resources, and Urbanization. Sustain. Cities Soc. 2020, 54, 101996. [Google Scholar] [CrossRef]
  44. Kan, D.; Lv, L. Study on the Impact of Urbanization on Water Resources Utilization in China: A Perspective based on Water Footprint and Spatial Dynamic Panel Data. Shanghai Econ. Res. 2017, 848, 37–46+84. [Google Scholar] [CrossRef]
  45. Volkova, T.; Krasnogorskaya, N. Calculation of water footprint consumption for determining impact on water resources. In Proceedings of the 14th International Multidisciplinary Scientific GeoConference SGEM 2014, Albena, Bulgaria, 17–26 June 2014; pp. 105–110. [Google Scholar]
  46. Lu, W.; Sarkar, A.; Hou, M.; Liu, W.; Guo, X.; Zhao, K.; Zhao, M. The Impacts of Urbanization to Improve Agriculture Water Use Efficiency—An Empirical Analysis Based on Spatial Perspective of Panel Data of 30 Provinces of China. Land 2022, 11, 80. [Google Scholar] [CrossRef]
  47. Li, Y.; Xue, D.; Song, Y. Spatio-temporal Characteristics and Trend Warnings of Water Resources Carrying Capacity in China. Resour. Environ. Yangtze Basin 2021, 30, 1574–1584. [Google Scholar]
  48. Su, Y.; Gao, W.; Guan, D.; Su, W. Dynamic Assessment and Forecast of Urban Water Ecological Footprint Based on Exponential Smoothing Analysis. J. Clean. Prod. 2018, 195, 354–364. [Google Scholar] [CrossRef]
  49. Sun, C.; Zhang, Z. Assessment of water ecological footprint size, depth, and spatial pattern in China. Acta Ecol. Sin. 2017, 37, 108387. [Google Scholar] [CrossRef]
  50. Huang, L.; Wu, C. Industrial green development efficiency and spatial driven mechanism in cities of the Yangtze River Economic Belt. China Popul. Resour. Environ. 2019, 29, 40–49. [Google Scholar]
  51. Li, X.; Wen, J.; Lin, J. Review of Research on Land Urbanization and Related Studies. Prog. Geogr. 2012, 31, 1042–1049. [Google Scholar]
  52. Li, H.; Calder, C.A.; Cressie, N. Beyond Moran’s I: Testing for Spatial Dependence Based on the Spatial Autoregressive Model. Geogr. Anal. 2007, 39, 357–375. [Google Scholar] [CrossRef]
Figure 1. Trends of changes in WEF-related indicators in three urban agglomerations: (a) water ecological footprint; (b) water ecological capacity; (c) water ecological surplus/deficit; and (d) water resources ecological pressure index.
Water 15 00760 g001
Figure 2. Trends of changes in WEFs by water use types for three major urban agglomerations: (a) agricultural WEF; (b) industrial WEF; (c) domestic WEF; and (d) eco-environment WEF.
Water 15 00760 g002
Figure 3. Per capita water ecological footprints of the three major urban agglomerations in the Yangtze River Economic Belt in 2019.
Water 15 00760 g003
Figure 4. Spatial correlation analysis of urbanization and WEF. Note: The top, middle, and bottom three sub-figures represent the result of population urbanization, economic urbanization, and land urbanization, respectively. For each of three sets of sub-figures, from the left to the right are the three urban agglomerations of Chengdu–Chongqing, the Middle Yangtze River, and the Yangtze River Delta.
Water 15 00760 g004
Table 1. Water resources equalization factors for nine provinces, 2005–2019.
Urban AgglomerationProvincial Districts2005–20092010–20142015–2019
Yangtze River DeltaAnhui1.291.281.56
Jiangsu1.651.451.75
Shanghai4.623.876.76
Zhejiang6.497.778.15
Middle Yangtze RiverHubei1.431.491.72
Hunan1.782.102.21
Jiangxi1.762.132.22
Chengdu–ChongqingChongqing3.143.313.97
Sichuan1.972.061.81
Note(s): Shanghai and Chongqing are direct-controlled municipalities, which are provincial districts.
Table 2. Water ecological footprint (WEF) measurement indicators.
IndicatorsMeaningData to Be Collected
WEFWater ecological footprint
Agricultural WEFWater production area required for agricultural/industrial/domestic/ public ecological usesAgricultural water consumption (m3), regional WREF (Water Resources Equalization Factor), WRAPC (Water Resources Average Production Capacity, m3/hm2)
Industrial WEFIndustrial water consumption (m3), regional WREF, WRAPC
Domestic WEFDomestic water consumption (m3), regional WREF, WRAPC
Eco-environment WEFPublic ecological water consumption (m3), global WREF, WRAPC
WEC (water ecological carrying capacity)Maximum regional water resources supplyRegional WREF, city-level water yield factor, total amount of water resources (m3), regional rate of water resources utilization (maximum 40%)
Water resources ecological pressure indexMeasures the sustainability level of water resource use in the regionWEF/WEC
WEF sizeHuman appropriation of water resources capital flowsMinimum of WF and WC
WEF depthHuman appropriation of water resources capital stocksIf WEF ≤ WEC, the WEF depth is 1; if WEF > WEC, the WEF depth is 1 + (WEF − WEC)/WEC. Higher depth means the higher appropriation of water resource capital stocks and lower sustainability of water resource use.
Table 3. Size and depth of WEF and three-dimensional WEF.
Yangtze River DeltaMiddle Yangtze RiverChengdu–Chongqing
YearSizeDepth3D-WEFSizeDepth3D-WEFSizeDepth3D-WEF
20050.14282.39640.34230.12551.00000.12550.10361.00000.1036
20060.11882.84710.33820.12421.00000.12420.10451.00000.1045
20070.14312.39530.34270.12701.00000.12700.10521.00000.1052
20080.15812.17750.34420.12771.00000.12770.10431.00000.1043
20090.19351.79230.34680.13351.00000.13350.10951.00000.1095
20100.20101.51910.30530.13561.00000.13560.11231.00000.1123
20110.15681.93730.30380.12841.08830.13980.11261.00000.1126
20120.21171.39830.29610.13731.00000.13730.10981.00000.1098
20130.14331.99470.28590.13851.00000.13850.11161.00000.1116
20140.18121.46420.26530.13561.00000.13560.10801.00000.1080
20150.25501.00000.25500.13341.00000.13340.13341.00000.1334
20160.24741.00000.24740.12831.00000.12830.15331.00000.1533
20170.16401.52260.24970.12191.00000.12190.12191.00000.1219
20180.16851.43620.24200.12511.00000.12510.12511.00000.1251
20190.18931.21490.23000.12571.00000.12570.12571.00000.1257
Note(s): Size: WEF size (hm2/cap); depth: WEF depth; 3D-WEF: three-dimensional water ecological footprint (hm2/cap).
Table 4. Global spatial autocorrelation results of WEFs of three urban agglomerations from 2005–2019.
Yangtze River DeltaMiddle Yangtze RiverChengdu–Chongqing
YearMoran’s IZ-valuep-valueMoran’s IZ-valuep-valueMoran’s IZ-valuep-value
20050.528 ***4.60580.0010−0.086−0.47030.32500.342 ***2.84810.0090
20070.428 ***3.66470.0010−0.042−0.08140.49600.226 **2.17370.0230
20090.219 **2.05730.02800.209 **2.08870.02200.279 **2.36140.0180
20110.299 ***2.68470.00600.339 ***3.14550.00100.215 **1.96600.0350
20130.228 **2.12070.02500.109 *1.47060.07200.281 **2.37180.0200
20150.246 **2.41960.01600.238 **2.60810.00700.229 **1.98010.0360
20170.255 **2.29350.01600.365 ***3.56390.00100.236 **2.02820.0360
20190.256 **2.37820.01400.294 ***3.33090.00200.0851.02470.1470
Note(s): * p < 0.1, ** p < 0.05, *** p < 0.01.
Table 5. Global bivariate spatial autocorrelation analysis of urbanization and WEF.
Yangtze River DeltaMiddle Yangtze RiverChengdu and Chongqing
Moran’s IZ-valuep-valueMoran’s IZ-valuep-valueMoran’s IZ-valuep-value
Population urbanization0.233 ***2.46260.008−0.052−0.63350.264−0.0010.25650.388
Economic urbanization−0.029−0.35080.3650.0010.11160.434−0.159 *−1.42290.074
Land urbanization0.137 **1.73420.0500.113*1.42420.0850.080.7950.208
Note(s): * p < 0.1; ** p < 0.05; *** p < 0.01.
Disclaimer/Publisher’s Note: The statements, opinions and data contained in all publications are solely those of the individual author(s) and contributor(s) and not of MDPI and/or the editor(s). MDPI and/or the editor(s) disclaim responsibility for any injury to people or property resulting from any ideas, methods, instructions or products referred to in the content.

