
Adsorption of Pb, Cu and Cd from Water on Coal Fly Ash-Red Mud Modified Composite Material: Characterization and Mechanism
 ,
, 
Abstract
:1. Introduction
2. Materials and Method
2.1. Experiment Materials and Instruments
2.2. Preparation of Modified Composite Material
2.3. Batch Sorption Experiments
2.3.1. Experimental Setup in the Single System
2.3.2. Experimental Setup in the Ternary System
3. Results and Discussion
3.1. Material Characterization
3.1.1. SEM Analysis
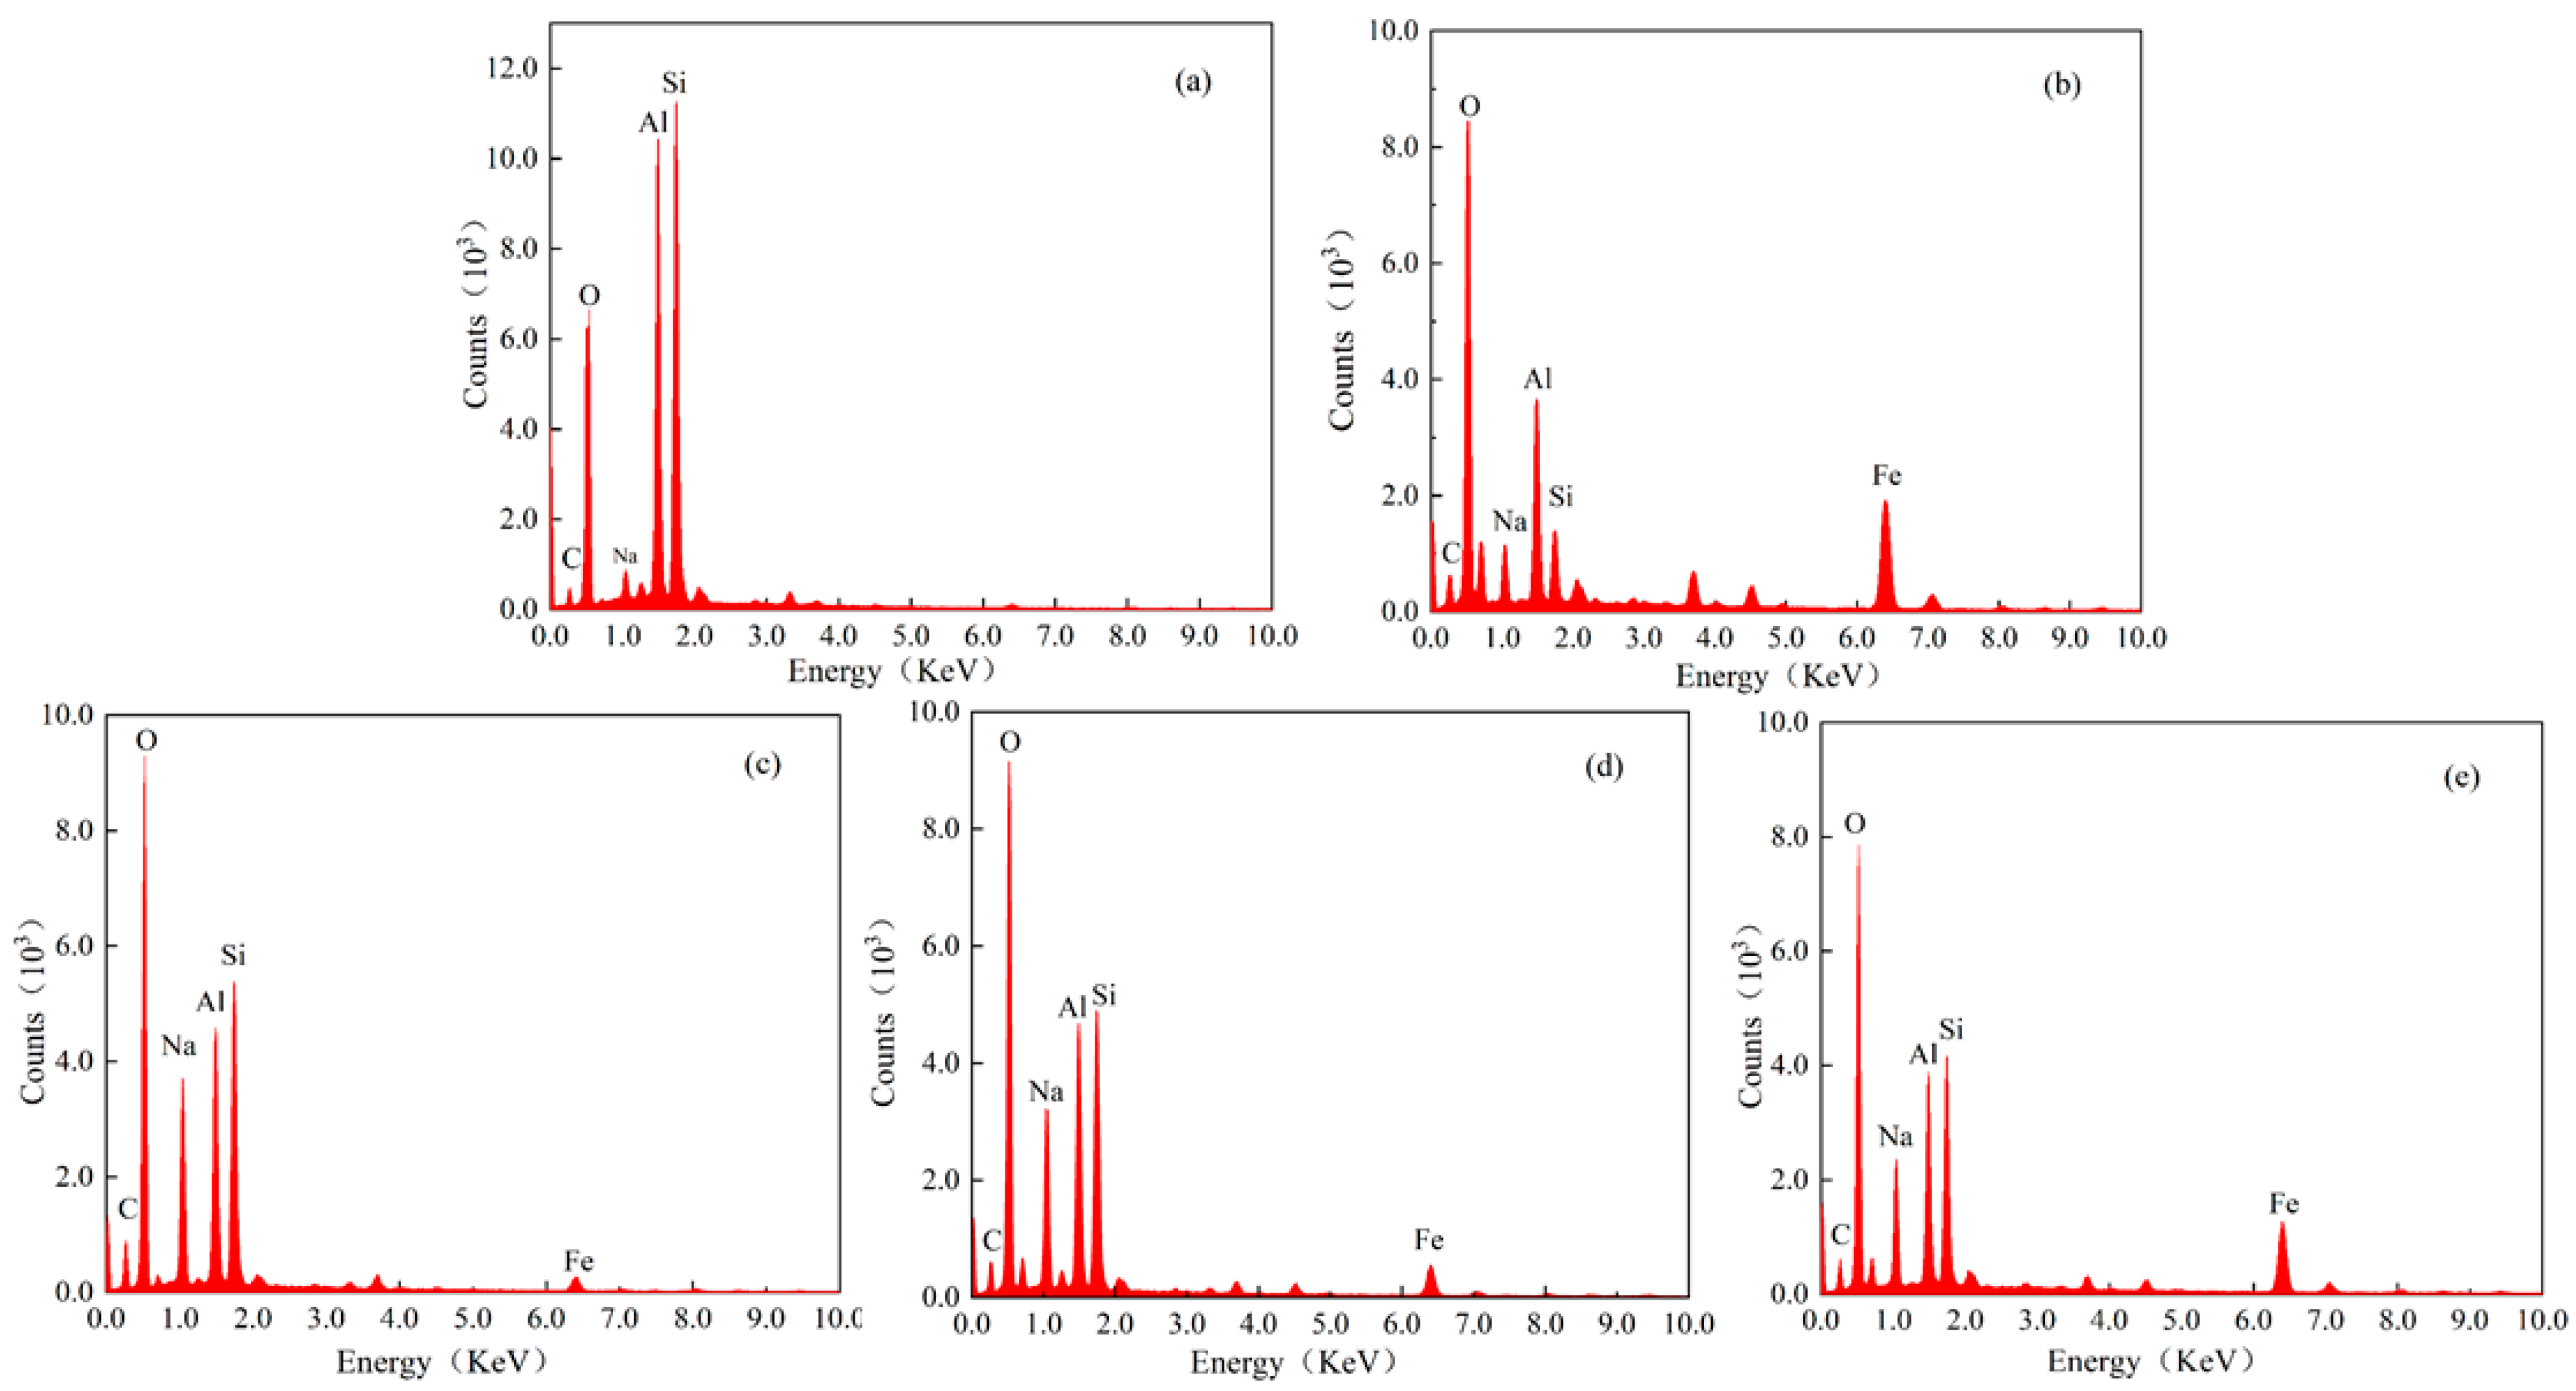
3.1.2. EDS Analysis
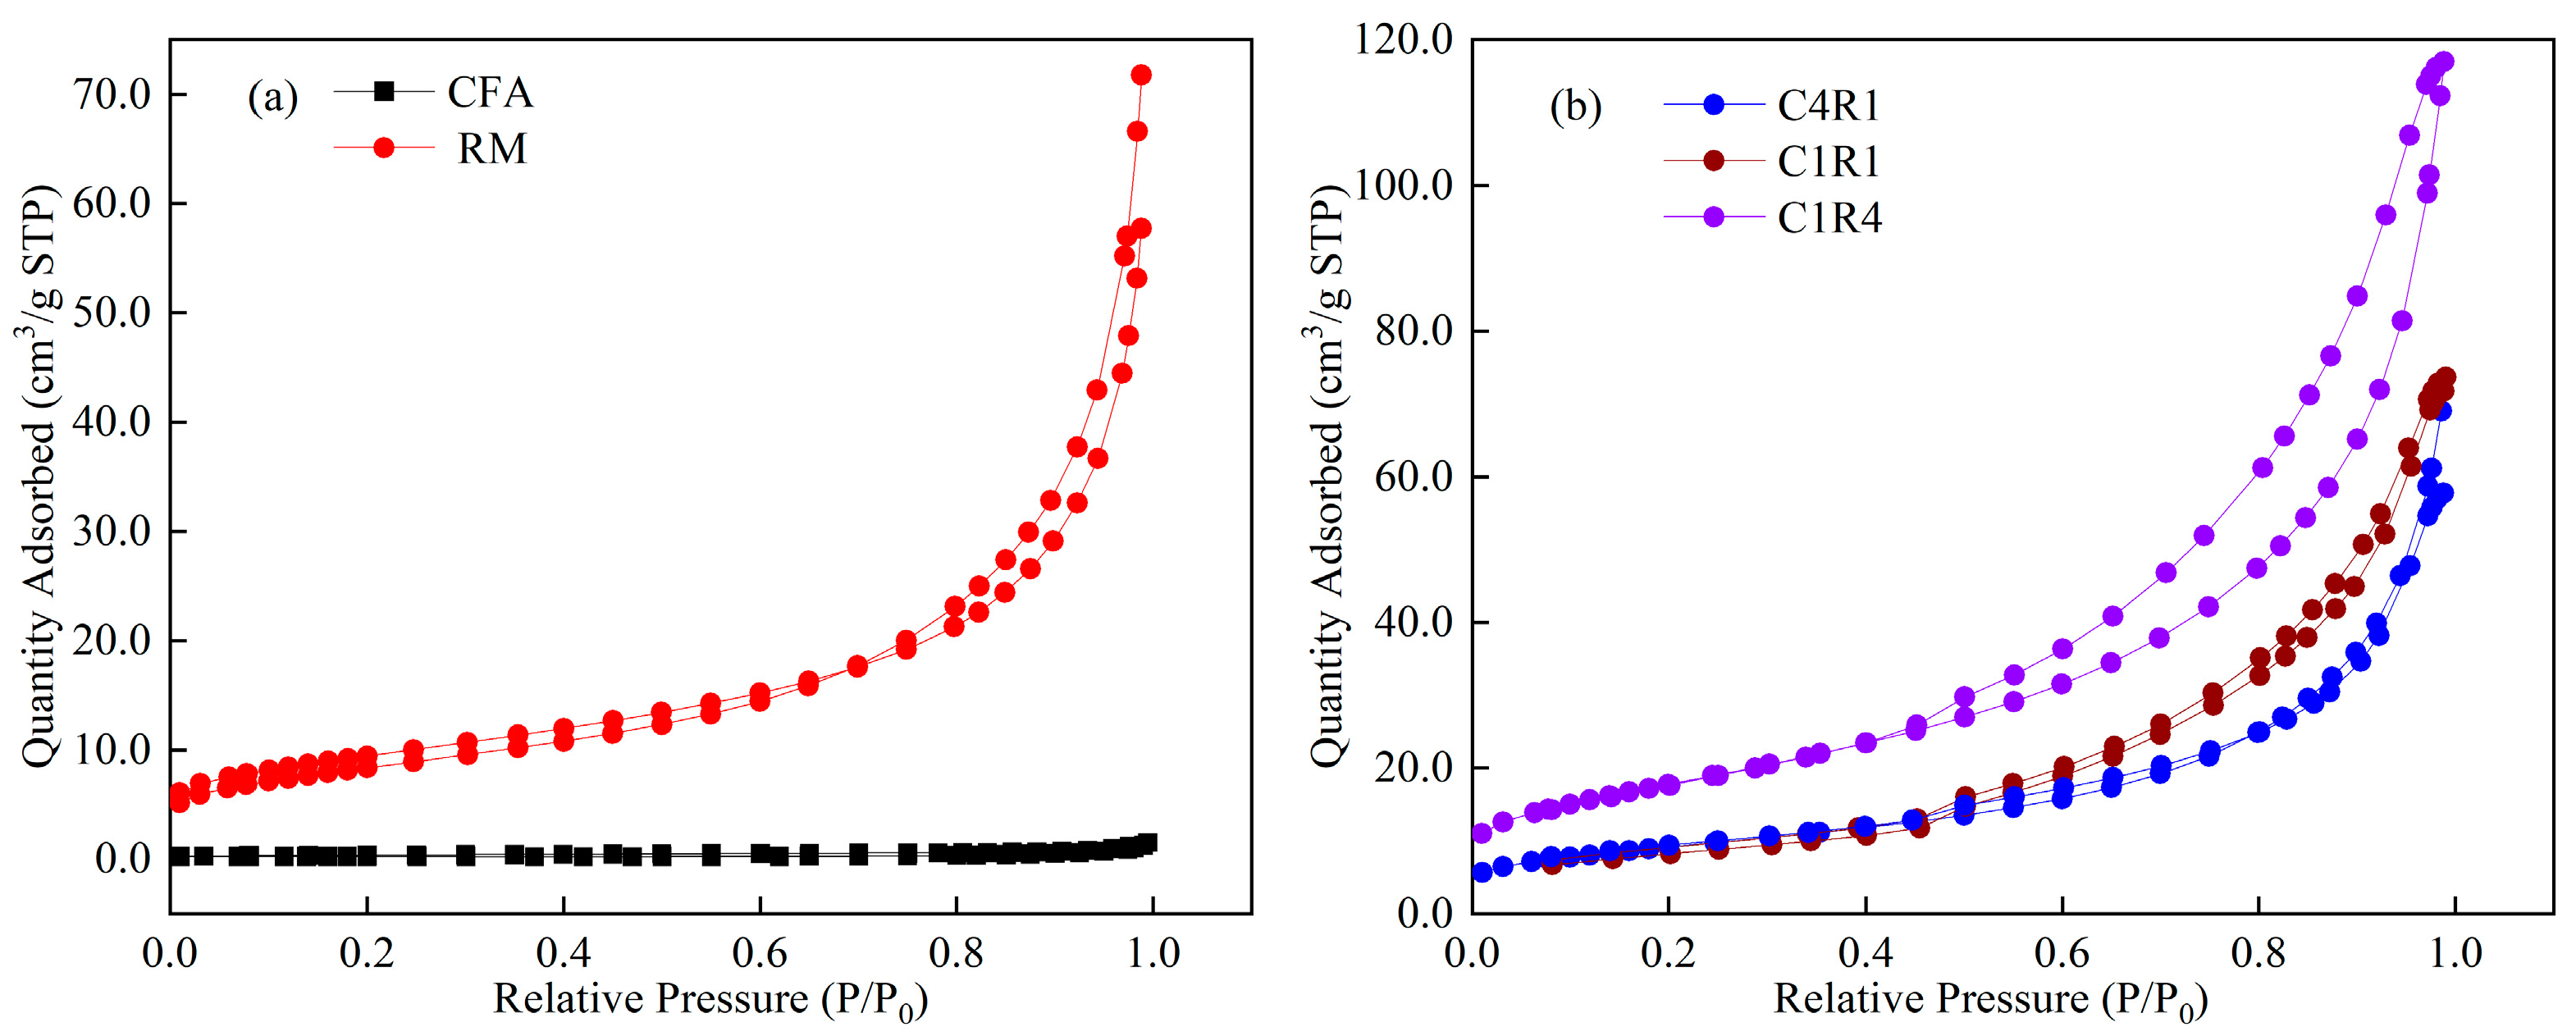
3.1.3. BET Analysis
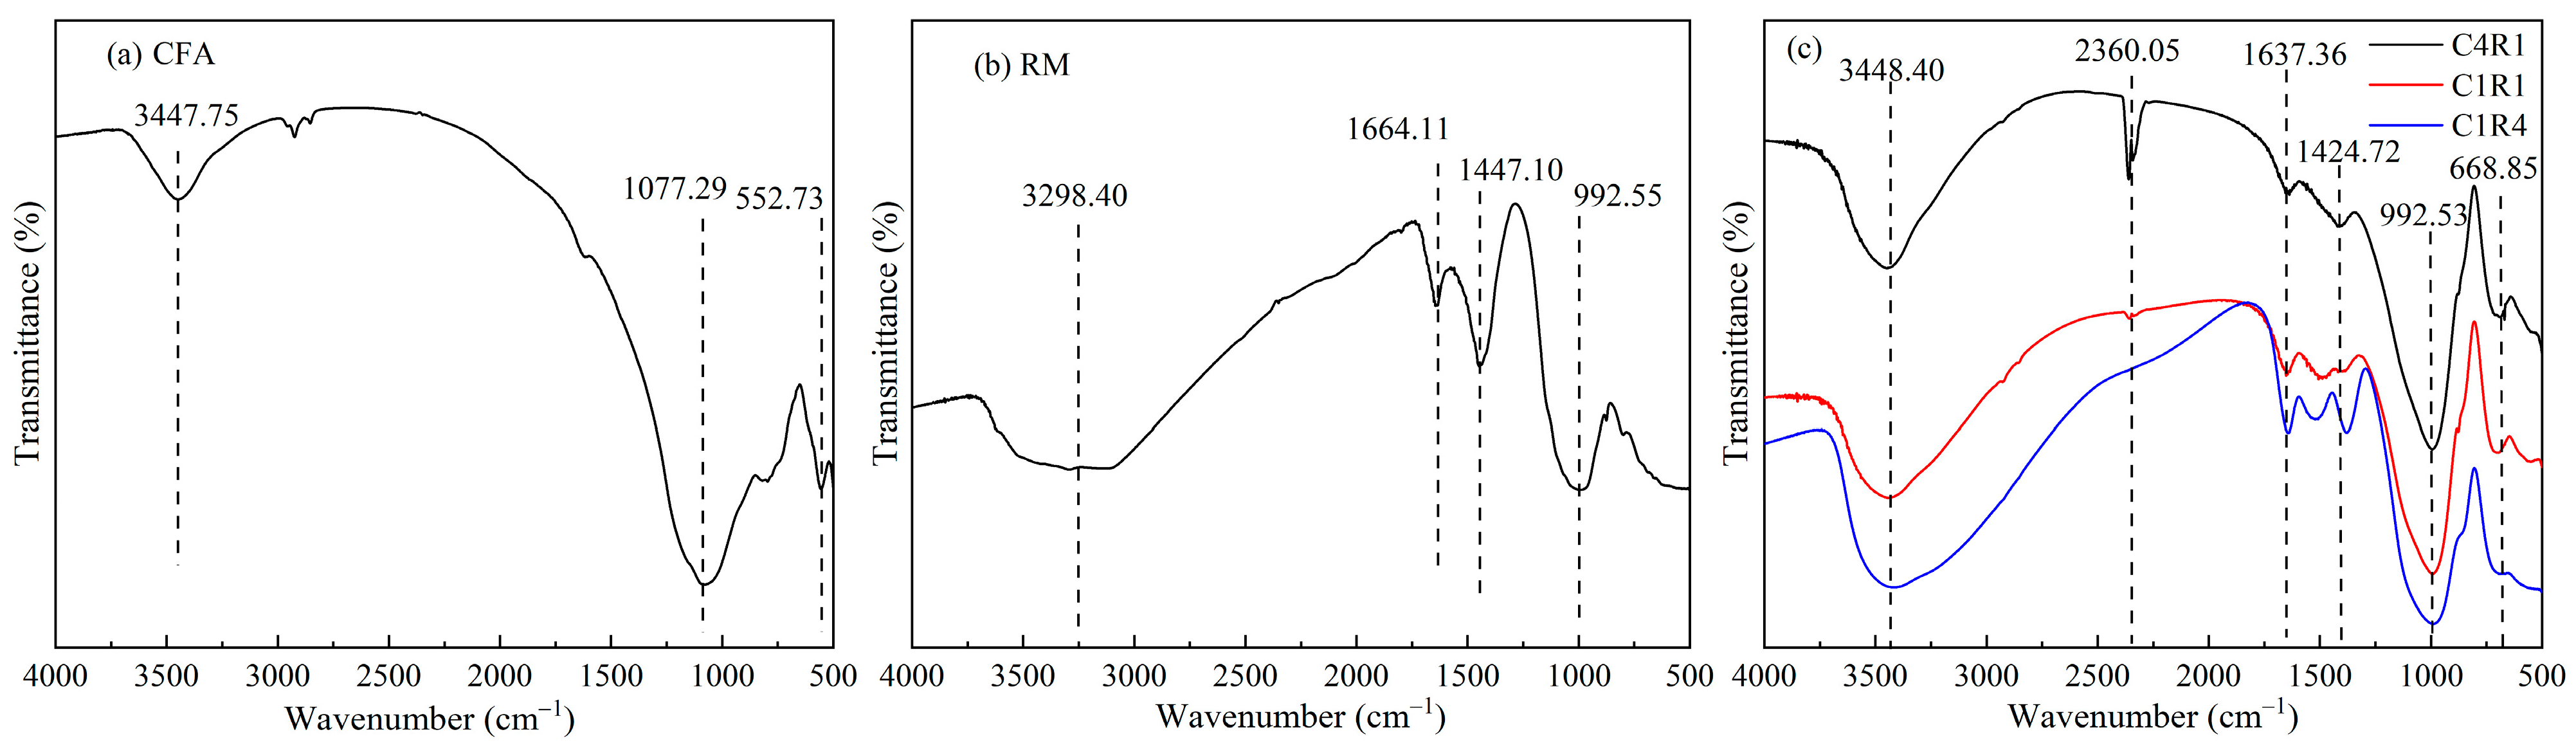
3.1.4. FTIR Analysis
3.1.5. Magnetic Analysis
3.2. Adsorption Analysis in the Single System
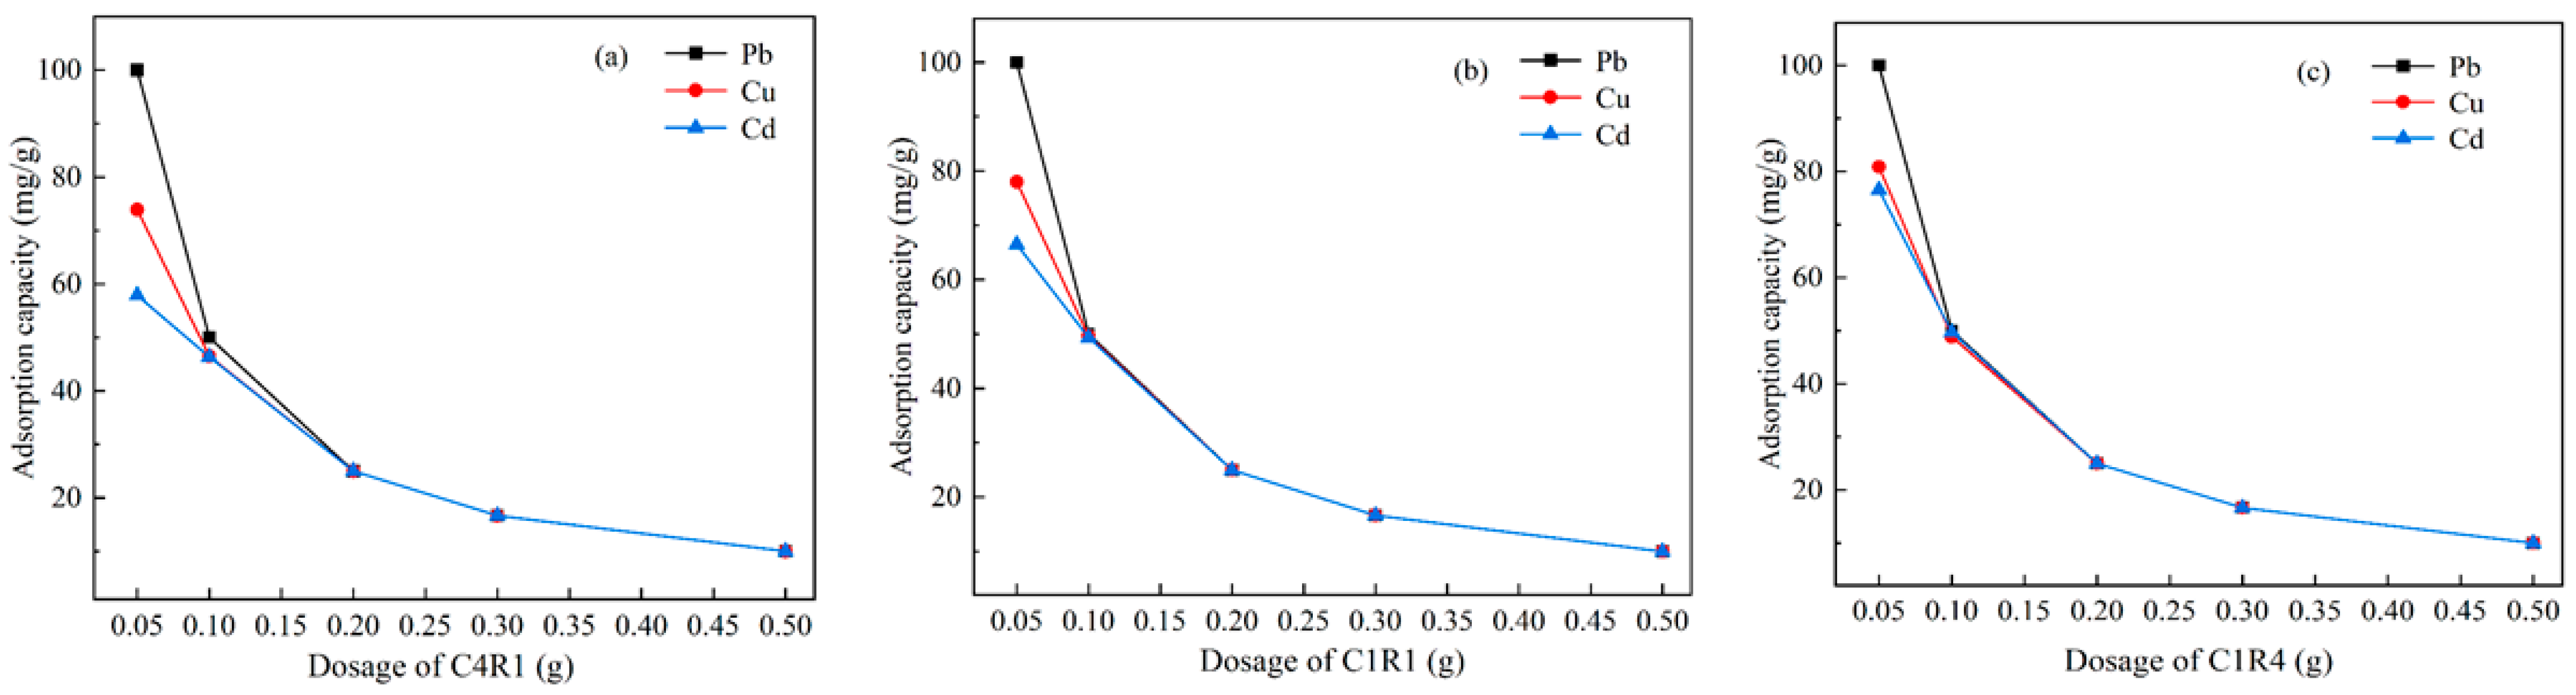
3.2.1. Influence of the Dosage of C4R1, C1R1, and C1R4
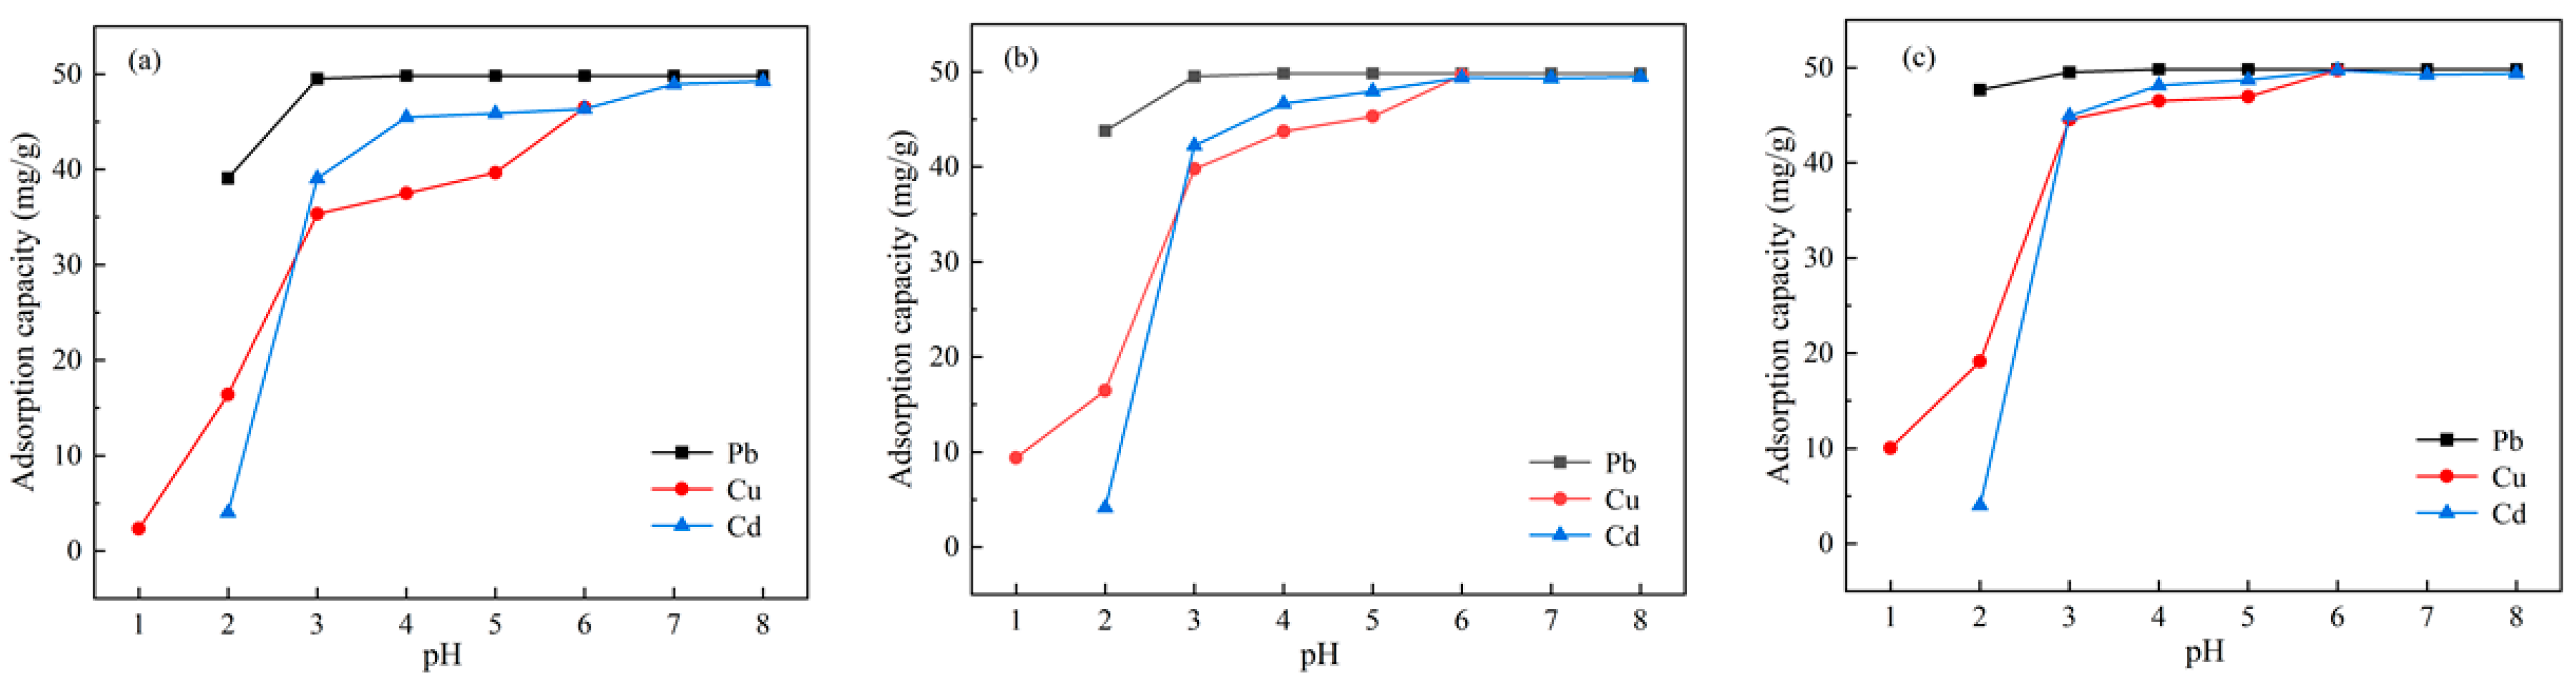
3.2.2. Impact of pH
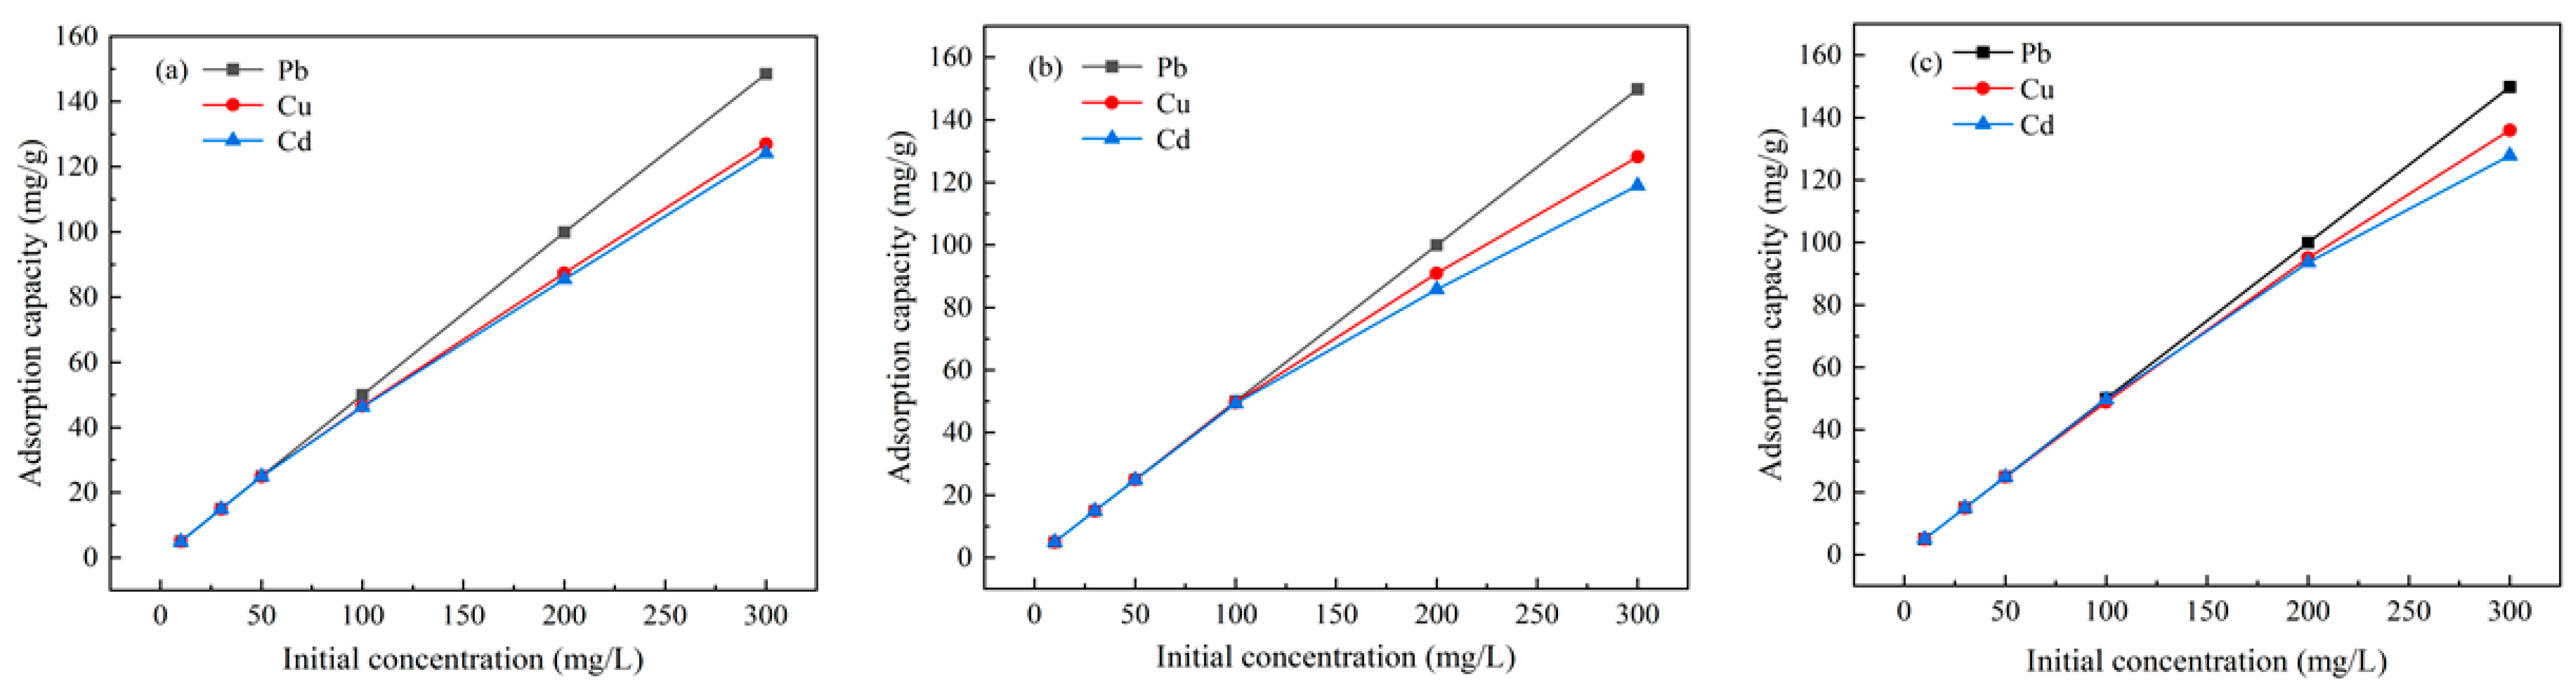
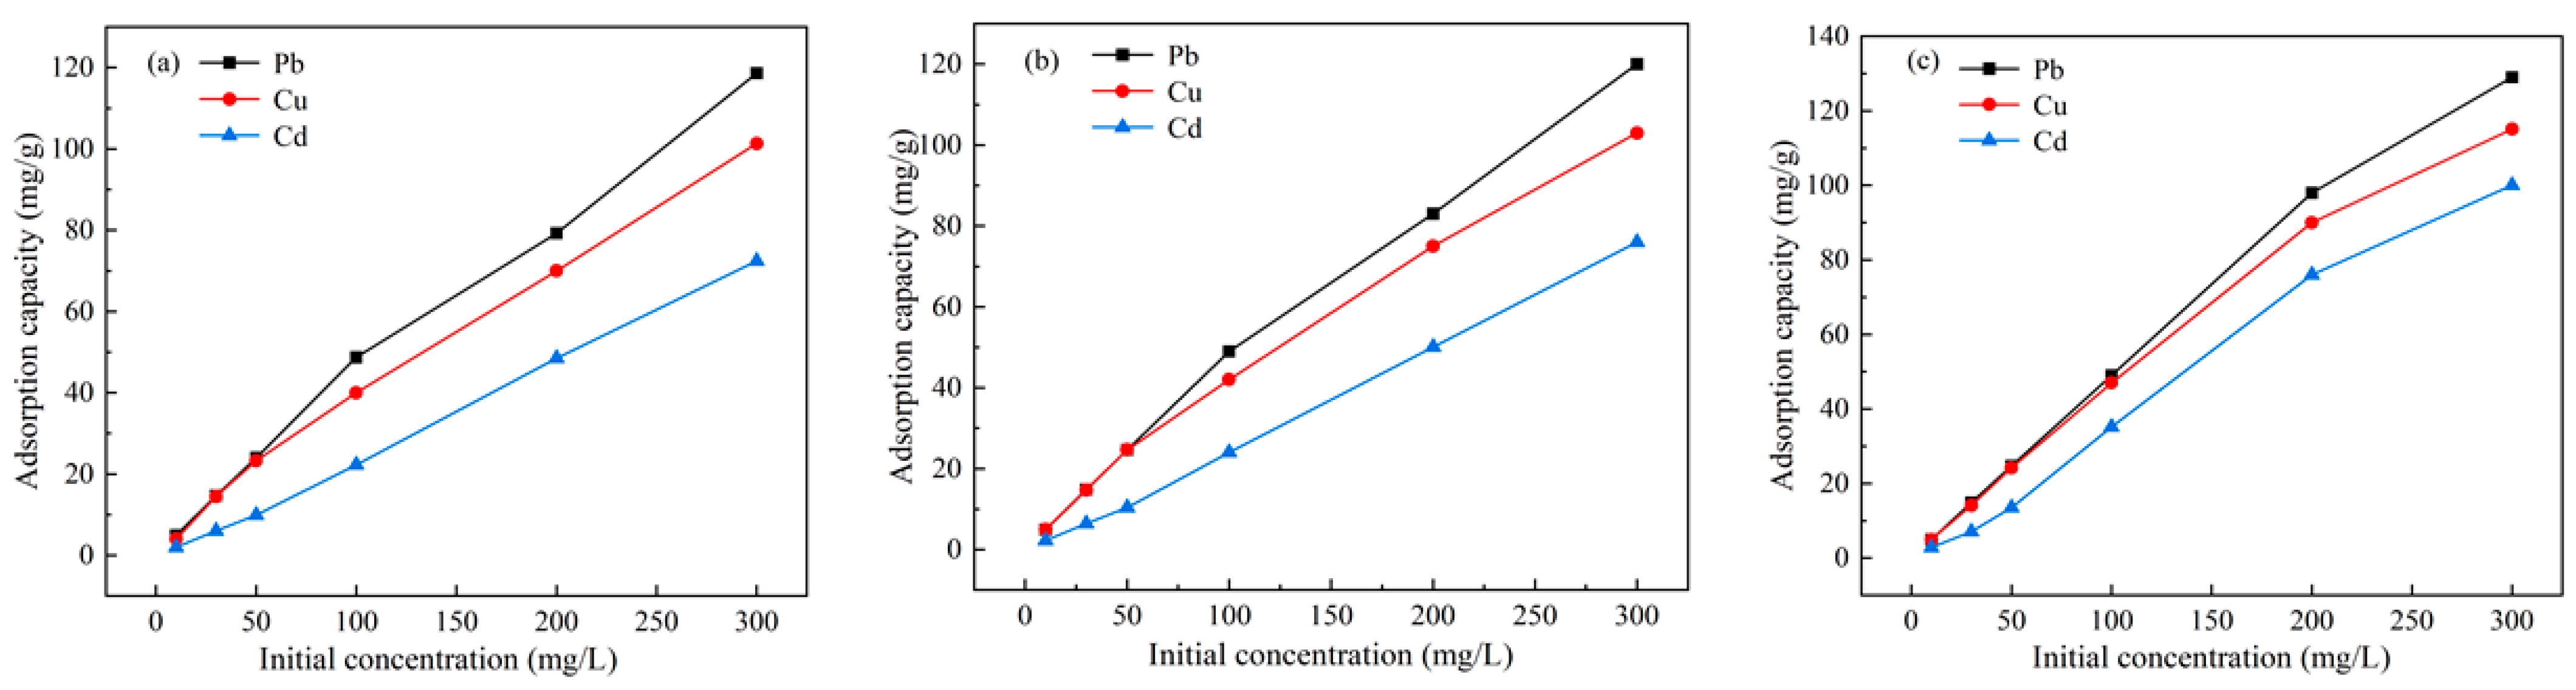
3.2.3. Effect of the Initial Concentration of Pb, Cu, and Cd
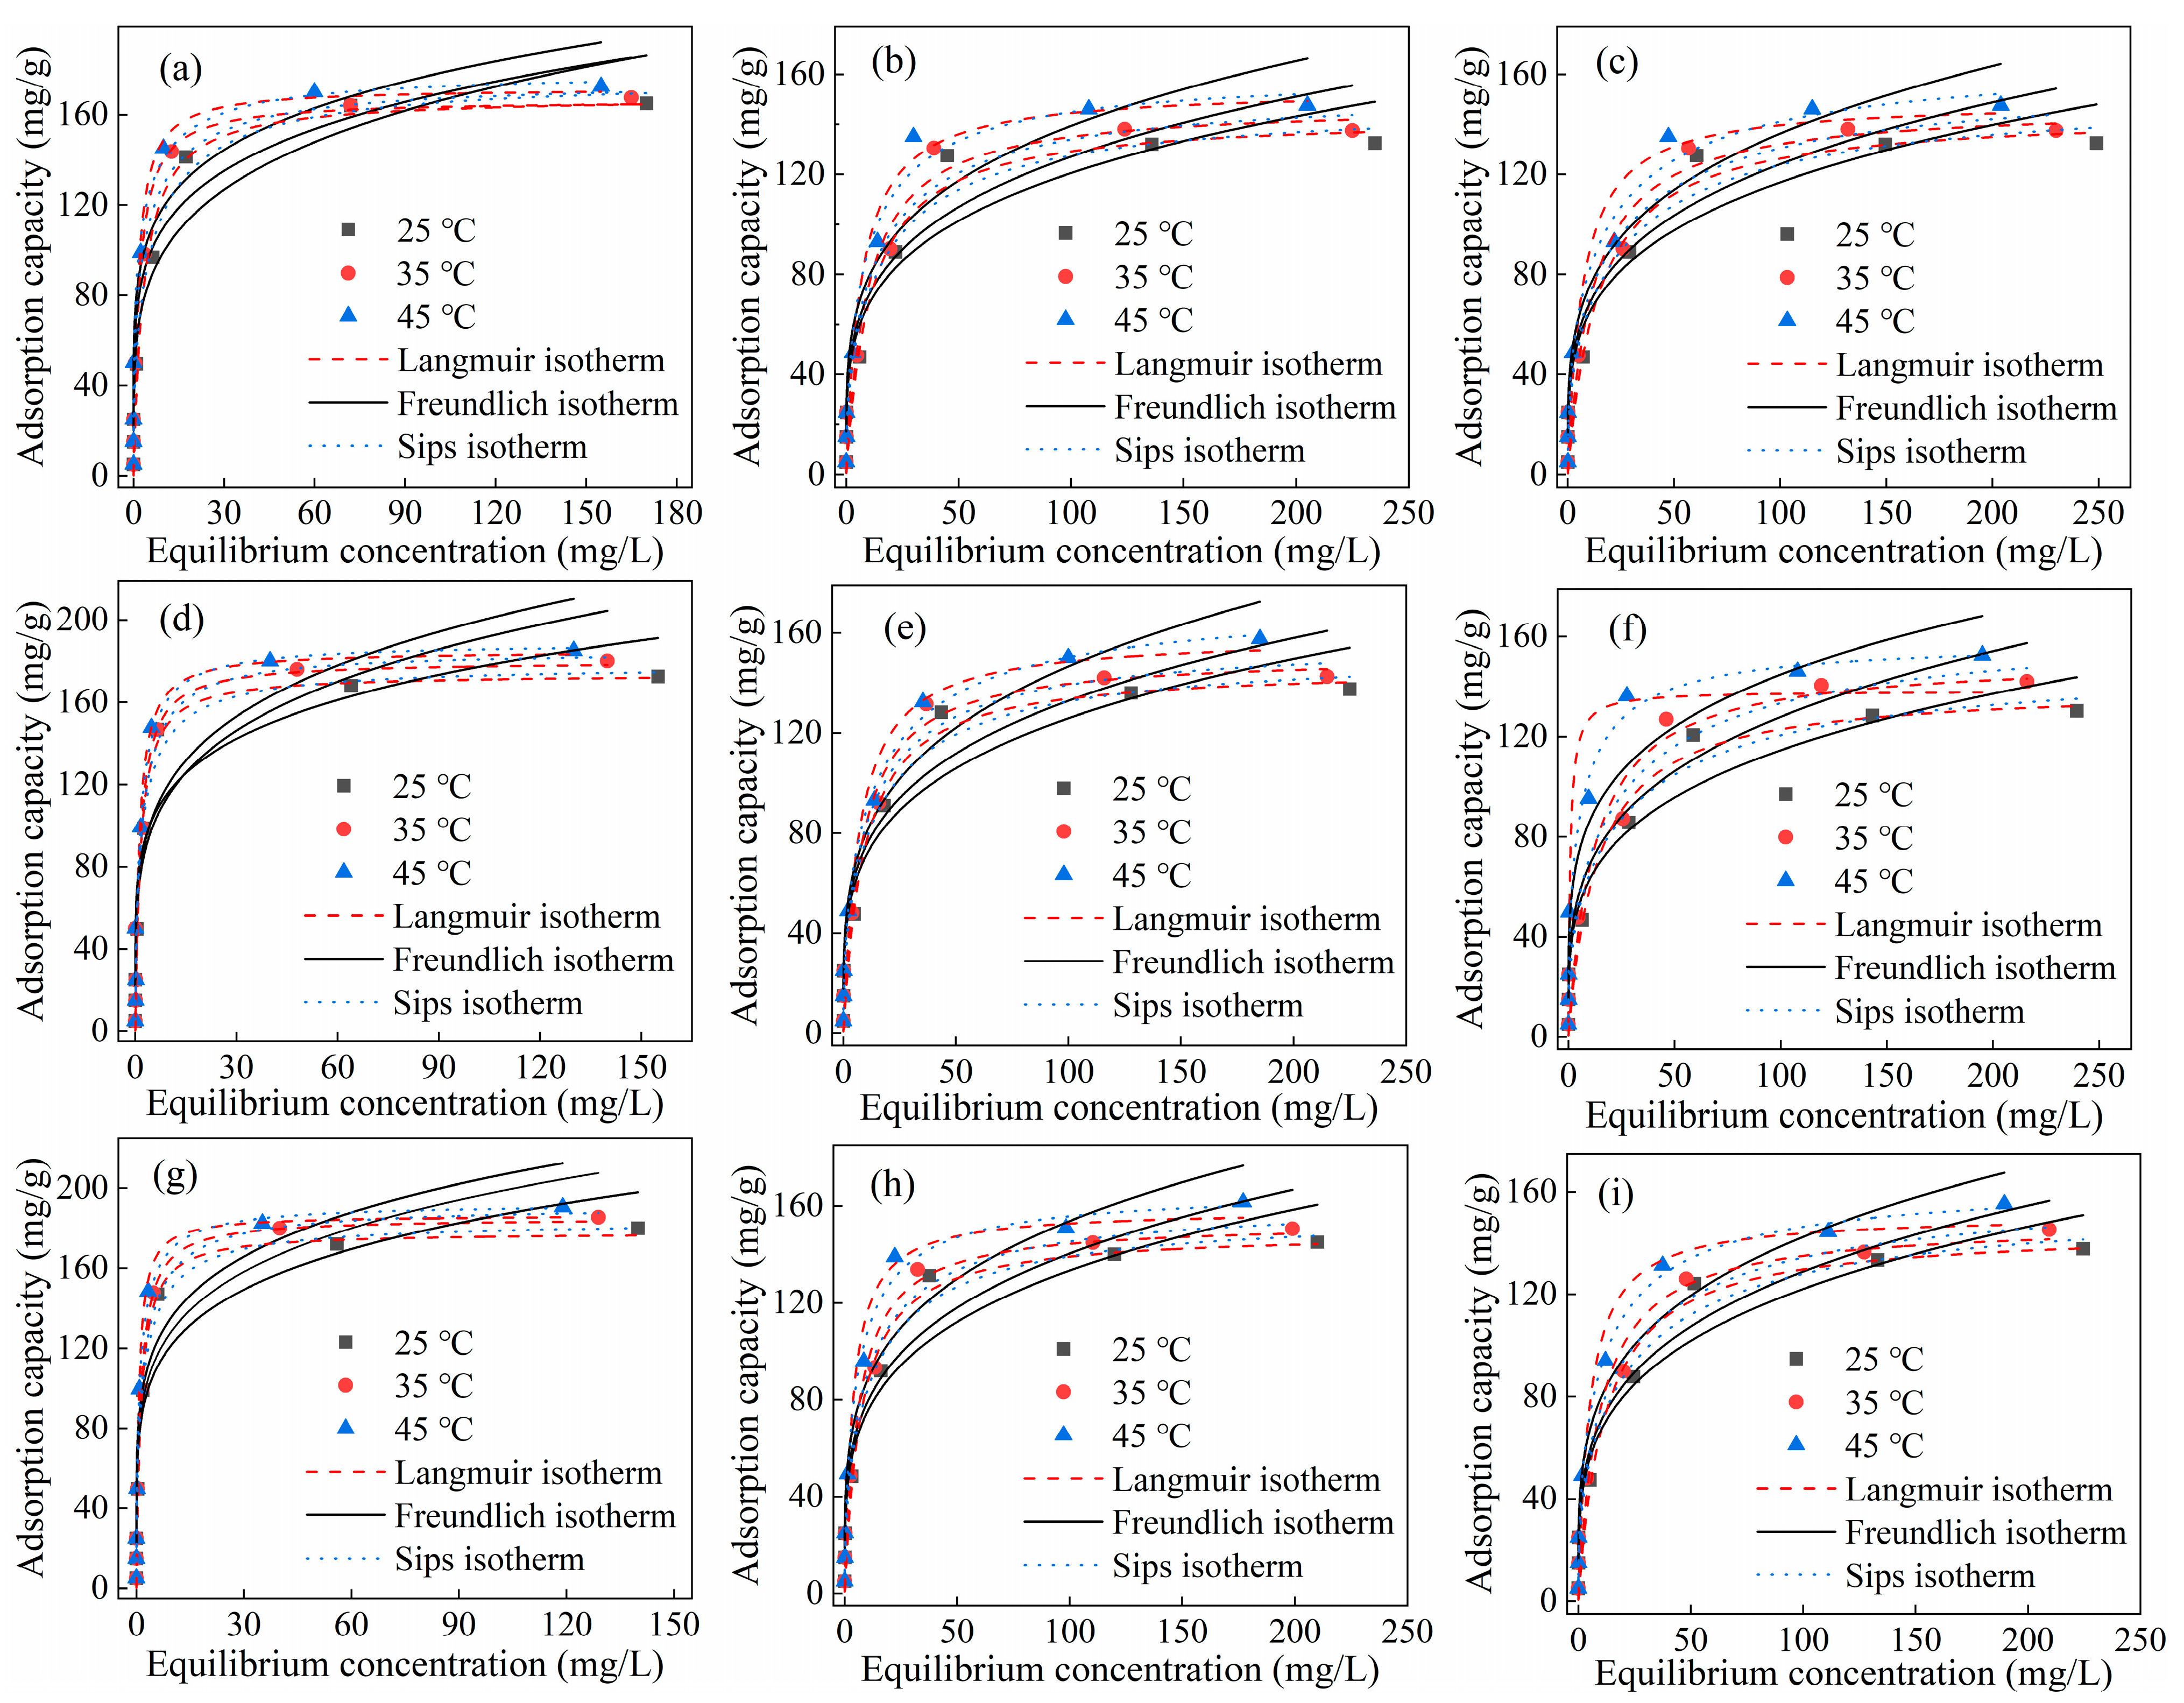
3.2.4. Adsorption Isotherms
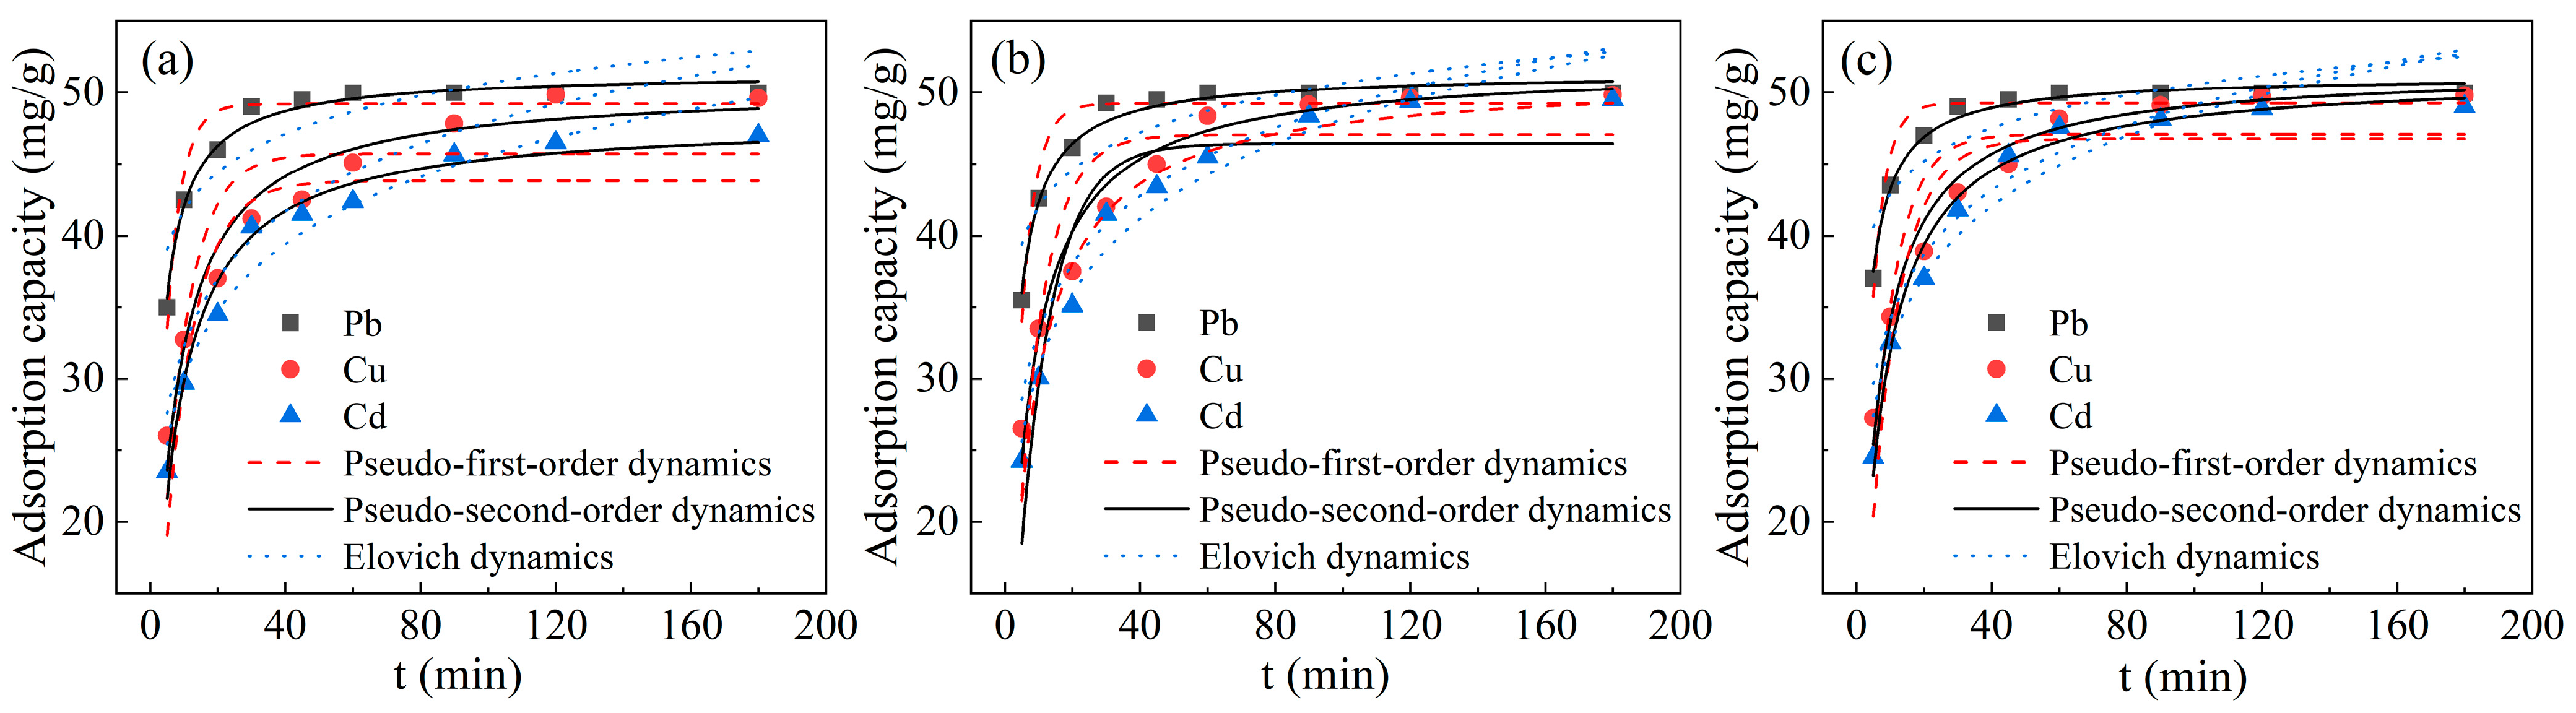
3.2.5. Adsorption Kinetics
3.3. Adsorption Analysis in the Ternary System
3.3.1. Influence of the Dosage of C4R1, C1R1, and C1R4
3.3.2. Impact of pH
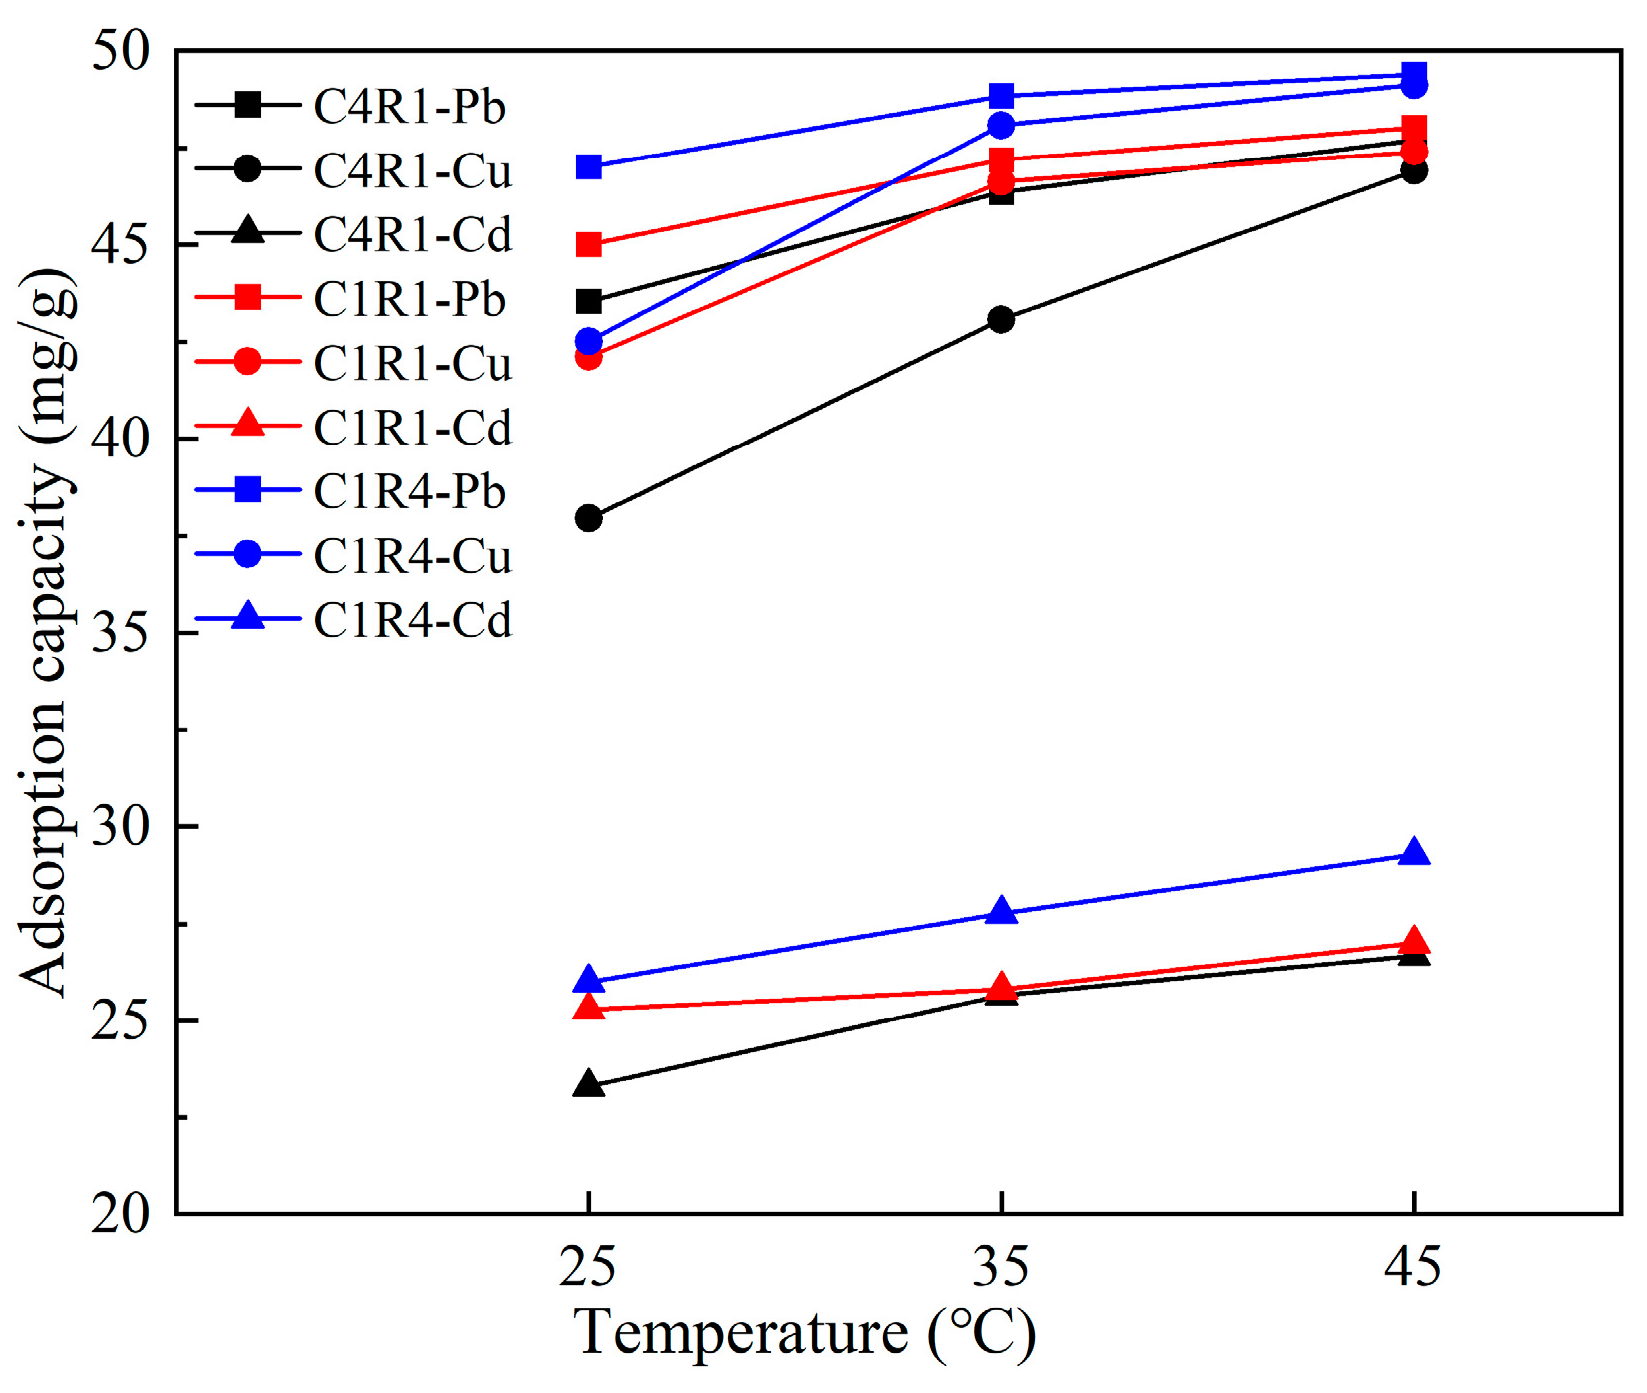
3.3.3. Effect of the Initial Concentration and Temperature
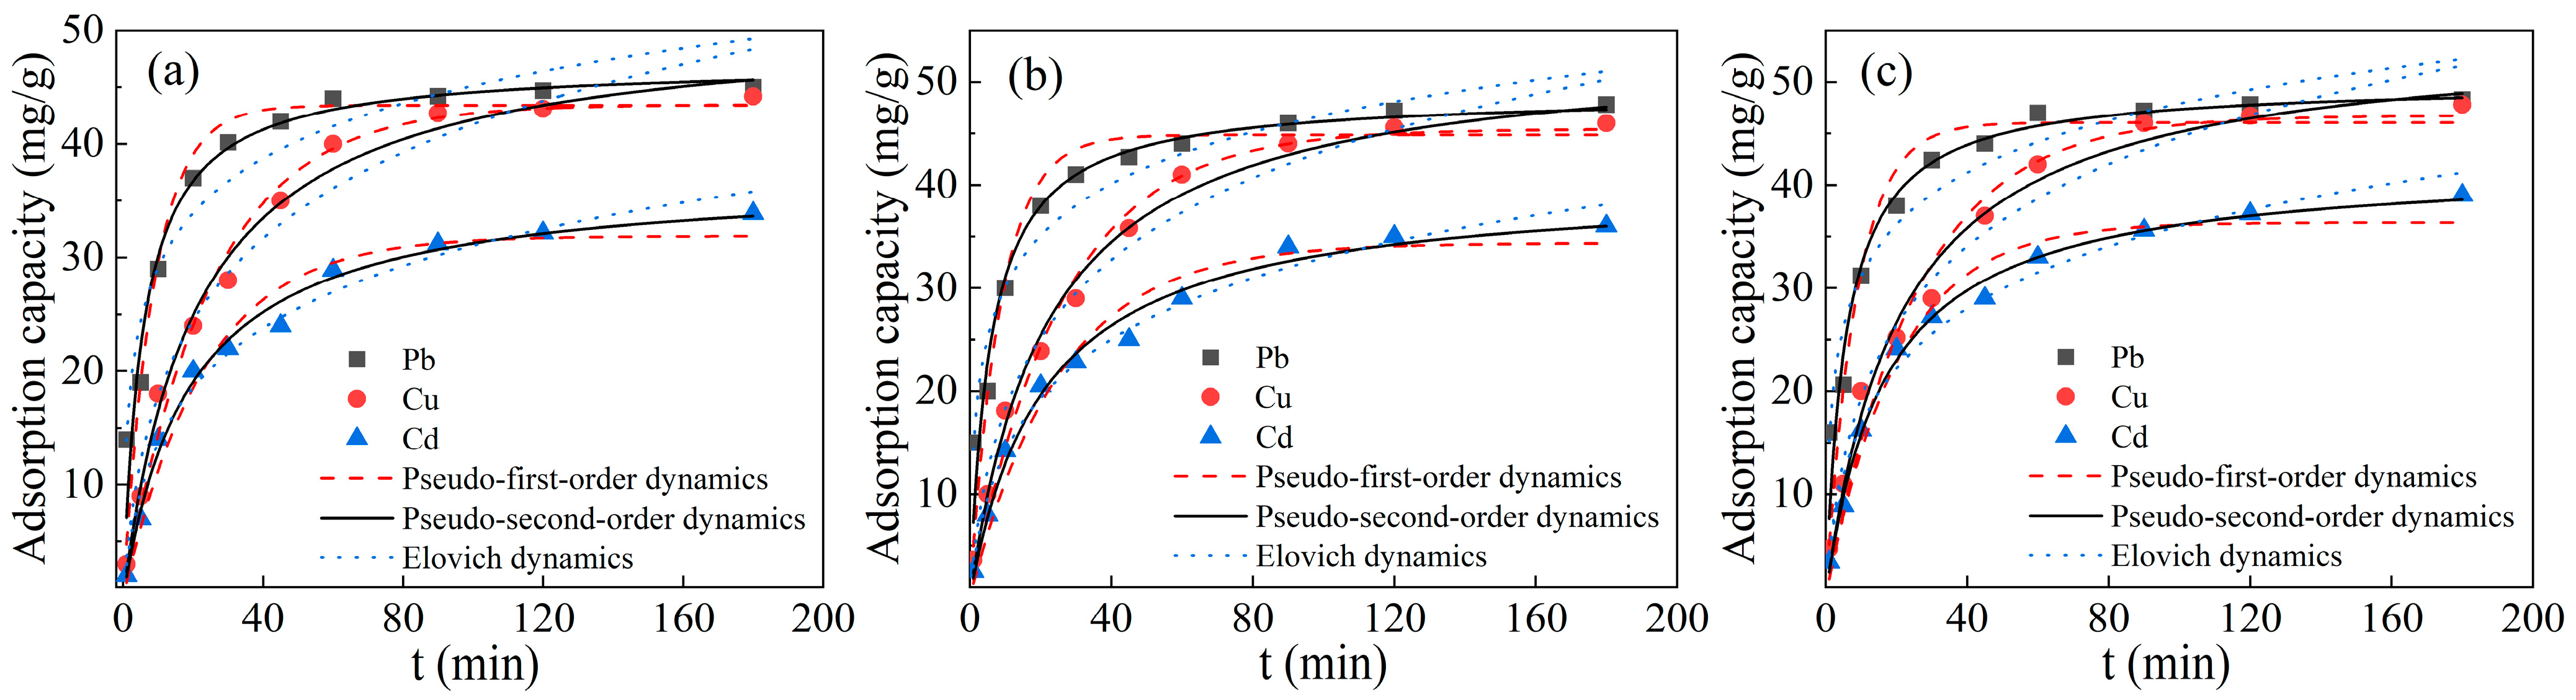
3.3.4. Adsorption Kinetics
3.4. Comparison of Single and Ternary Systems
4. Conclusions
Supplementary Materials
Author Contributions
Funding
Data Availability Statement
Conflicts of Interest
References
- Chen, X.; Song, H.; Guo, Y.; Wang, L.; Cheng, F. Converting waste coal fly ash into effective adsorbent for the removal of ammonia nitrogen in water. J. Mater. Sci. 2018, 53, 12731–12740. [Google Scholar] [CrossRef]
- Gautam, R.K.; Sharma, S.K.; Mahiya, S.; Chattopadhyaya, M.C. CHAPTER 1. Contamination of Heavy Metals in Aquatic Media: Transport, Toxicity and Technologies for Remediation. In Heavy Metals in Water; Royal Society of Chemistry: Cambridge, UK, 2014; pp. 1–24. [Google Scholar]
- Shang, Z.; Zhang, L.; Zhao, X.; Liu, S.; Li, D. Removal of Pb(II), Cd(II) and Hg(II) from aqueous solution by mercapto-modified coal gangue. J. Environ. Manag. 2019, 231, 391–396. [Google Scholar] [CrossRef] [PubMed]
- Bilal, M.; Ihsanullah, I.; Ul Hassan Shah, M.; Younas, M. Enhanced removal of cadmium from water using bio-sorbents synthesized from branches and leaves of Capparis decidua and Ziziphus mauritiana. Environ. Technol. Innov. 2021, 24, 101922. [Google Scholar] [CrossRef]
- Huang, H.; Liu, J.; Ding, L. Recovery of phosphate and ammonia nitrogen from the anaerobic digestion supernatant of activated sludge by chemical precipitation. J. Clean. Prod. 2015, 102, 437–446. [Google Scholar] [CrossRef]
- Meng, X.; Khoso, S.A.; Jiang, F.; Zhang, Y.; Yue, T.; Gao, J.; Lin, S.; Liu, R.; Gao, Z.; Chen, P.; et al. Removal of chemical oxygen demand and ammonia nitrogen from lead smelting wastewater with high salts content using electrochemical oxidation combined with coagulation–flocculation treatment. Sep. Purif. Technol. 2020, 235, 116233. [Google Scholar] [CrossRef]
- Verma, R.; Sarkar, S. Trace Cr(VI) Removal: Evidence of Redox-Active Ion Exchange by a Weak-Base Anion Exchanger. Ind. Eng. Chem. Res. 2020, 59, 21187–21195. [Google Scholar] [CrossRef]
- Adam, M.R.; Othman, M.H.D.; Abu Samah, R.; Puteh, M.H.; Ismail, A.F.; Mustafa, A.; Rahman, M.A.; Jaafar, J. Current trends and future prospects of ammonia removal in wastewater: A comprehensive review on adsorptive membrane development. Sep. Purif. Technol. 2019, 213, 114–132. [Google Scholar] [CrossRef]
- Zhang, H.; Wang, X.; Li, N.; Xia, J.; Meng, Q.; Ding, J.; Lu, J. Synthesis and characterization of TiO2/graphene oxide nanocomposites for photoreduction of heavy metal ions in reverse osmosis concentrate. RSC Adv. 2018, 8, 34241–34251. [Google Scholar] [CrossRef] [Green Version]
- Wang, S.; Peng, Y. Natural zeolites as effective adsorbents in water and wastewater treatment. Chem. Eng. J. 2010, 156, 11–24. [Google Scholar] [CrossRef]
- Shi, Q.; Sterbinsky, G.E.; Prigiobbe, V.; Meng, X. Mechanistic Study of Lead Adsorption on Activated Carbon. Langmuir 2018, 34, 13565–13573. [Google Scholar] [CrossRef]
- Sipos, P.; Kis, V.K.; Balázs, R.; Tóth, A.; Németh, T. Effect of pedogenic iron-oxyhydroxide removal on the metal sorption by soil clay minerals. J. Soil Sediment 2021, 21, 1785–1799. [Google Scholar] [CrossRef]
- Morosanu, I.; Teodosiu, C.; Paduraru, C.; Ibanescu, D.; Tofan, L. Biosorption of lead ions from aqueous effluents by rapeseed biomass. New Biotechnol. 2017, 39, 110–124. [Google Scholar] [CrossRef] [PubMed]
- Yurak, V.; Apakashev, R.; Dushin, A.; Usmanov, A.; Lebzin, M.; Malyshev, A. Testing of Natural Sorbents for the Assessment of Heavy Metal Ions’ Adsorption. Appl. Sci. 2021, 11, 3723. [Google Scholar] [CrossRef]
- Wang, P.; Liu, D.-Y. Physical and Chemical Properties of Sintering Red Mud and Bayer Red Mud and the Implications for Beneficial Utilization. Materials 2012, 5, 1800–1810. [Google Scholar] [CrossRef] [Green Version]
- Wang, S.; Wu, H. Environmental-benign utilisation of fly ash as low-cost adsorbents. J. Hazard. Mater. 2006, 136, 482–501. [Google Scholar] [CrossRef]
- Pang, Y.; Zhao, C.; Li, Y.; Li, Q.; Bayongzhong, X.; Peng, D.; Huang, T. Cadmium adsorption performance and mechanism from aqueous solution using red mud modified with amorphous MnO2. Sci. Rep. 2022, 12, 4424. [Google Scholar] [CrossRef]
- Du, Y.; Dai, M.; Cao, J.; Peng, C. Fabrication of a low-cost adsorbent supported zero-valent iron by using red mud for removing Pb(ii) and Cr(vi) from aqueous solutions. RSC Adv. 2019, 9, 33486–33496. [Google Scholar] [CrossRef] [Green Version]
- Bai, B.; Bai, F.; Li, X.; Nie, Q.; Jia, X.; Wu, H. The remediation efficiency of heavy metal pollutants in water by industrial red mud particle waste. Environ. Technol. Innov. 2022, 28, 102944. [Google Scholar] [CrossRef]
- Huang, X.; Zhao, H.; Zhang, G.; Li, J.; Yang, Y.; Ji, P. Potential of removing Cd(II) and Pb(II) from contaminated water using a newly modified fly ash. Chemosphere 2020, 242, 125148. [Google Scholar] [CrossRef]
- Wen, W.; Jia, L.; Xie, J.; Zhao, W.; Feng, H.; Cao, D.; Sun, F.; Han, P.; Bai, X.; He, B. Electrochemical response of solidification Cu2+ contaminated soil influenced by red mud/fly ash ratio. Heliyon 2022, 8, e10971. [Google Scholar] [CrossRef]
- Li, Y.; Min, X.; Ke, Y.; Liu, D.; Tang, C. Preparation of red mud-based geopolymer materials from MSWI fly ash and red mud by mechanical activation. Waste Manag. 2019, 83, 202–208. [Google Scholar] [CrossRef] [PubMed]
- Adra, A.; Morin, G.; Ona-Nguema, G.; Brest, J. Arsenate and arsenite adsorption onto Al-containing ferrihydrites. Implications for arsenic immobilization after neutralization of acid mine drainage. Appl. Geochem. 2016, 64, 2–9. [Google Scholar] [CrossRef]
- Buema, G.; Harja, M.; Lupu, N.; Chiriac, H.; Forminte, L.; Ciobanu, G.; Bucur, D.; Bucur, R.D. Adsorption Performance of Modified Fly Ash for Copper Ion Removal from Aqueous Solution. Water 2021, 13, 207. [Google Scholar] [CrossRef]
- Luu, T.-T.; Dinh, V.-P.; Nguyen, Q.-H.; Tran, N.-Q.; Nguyen, D.-K.; Ho, T.-H.; Nguyen, V.-D.; Tran, D.X.; Kiet, H.A.T. Pb(II) adsorption mechanism and capability from aqueous solution using red mud modified by chitosan. Chemosphere 2022, 287, 132279. [Google Scholar] [CrossRef]
- Xue, Q.; Li, J.-S.; Wang, P.; Liu, L.; Li, Z.-Z. Removal of Heavy Metals from Landfill Leachate Using Municipal Solid Waste Incineration Fly Ash as Adsorbent. CLEAN-Soil Air Water 2014, 42, 1626–1631. [Google Scholar] [CrossRef]
- Lyu, F.; Niu, S.; Wang, L.; Liu, R.; Sun, W.; He, D. Efficient removal of Pb(II) ions from aqueous solution by modified red mud. J. Hazard. Mater. 2021, 406, 124678. [Google Scholar] [CrossRef]
- Wang, L.; Huang, X.; Zhang, J.; Wu, F.; Liu, F.; Zhao, H.; Hu, X.; Zhao, X.; Li, J.; Ju, X.; et al. Stabilization of lead in waste water and farmland soil using modified coal fly ash. J. Clean. Prod. 2021, 314, 127957. [Google Scholar] [CrossRef]
- Nguyen, T.C.; Tran, T.D.M.; Dao, V.B.; Vu, Q.-T.; Nguyen, T.D.; Thai, H. Using Modified Fly Ash for Removal of Heavy Metal Ions from Aqueous Solution. J. Chem. 2020, 2020, 8428473. [Google Scholar] [CrossRef]
- Guo, R.; Yao, W.; Ma, H.; Yuan, J. Two-step hydrothermal synthesis of nano-kaolinite from fly ash: Thermodynamics and mechanism. J. Clean. Prod. 2020, 271, 122567. [Google Scholar] [CrossRef]
- Lakshmi Narayanan, S.; Venkatesan, G.; Vetha Potheher, I. Equilibrium studies on removal of lead (II) ions from aqueous solution by adsorption using modified red mud. Int. J. Environ. Sci. Technol. 2017, 15, 1687–1698. [Google Scholar] [CrossRef]
- Jiang, X.; Fan, W.; Li, C.; Wang, Y.; Bai, J.; Yang, H.; Liu, X. Removal of Cr(vi) from wastewater by a two-step method of oxalic acid reduction-modified fly ash adsorption. RSC Adv. 2019, 9, 33949–33956. [Google Scholar] [CrossRef] [PubMed] [Green Version]
- Yang, T.; Wang, Y.; Sheng, L.; He, C.; Sun, W.; He, Q. Enhancing Cd(II) sorption by red mud with heat treatment: Performance and mechanisms of sorption. J. Environ. Manag. 2020, 255, 109866. [Google Scholar] [CrossRef] [PubMed]
- Zhou, C.; Wang, X.; Wang, Y.; Song, X.; Fang, D.; Ge, S. The sorption of single- and multi-heavy metals in aqueous solution using enhanced nano-hydroxyapatite assisted with ultrasonic. J. Environ. Chem. Eng. 2021, 9, 105240. [Google Scholar] [CrossRef]
- Carvalheiras, J.; Novais, R.M.; Labrincha, J.A. Metakaolin/red mud-derived geopolymer monoliths: Novel bulk-type sorbents for lead removal from wastewaters. Appl. Clay Sci. 2023, 232, 106770. [Google Scholar] [CrossRef]
- Langmuir, I. The adsorption of gases on plane surfaces of glass, mica and platinum. J. Am. Chem. Soc. 1918, 40, 1361–1403. [Google Scholar] [CrossRef] [Green Version]
- Freundlich, H.M.F. Over the Adsorption in Solution. J. Phys. Chem. 1906, 57, 385–470. [Google Scholar]
- Sips, R. On the Structure of a Catalyst Surface. J. Chem. Phys. 1948, 16, 490–495. [Google Scholar] [CrossRef]
- Sips, R. On the structure of a catalyst surface. II. J. Chem. Phys. 1950, 18, 1024–1026. [Google Scholar] [CrossRef]
- Sun, L.; Chen, D.; Wan, S.; Yu, Z. Performance, kinetics, and equilibrium of methylene blue adsorption on biochar derived from eucalyptus saw dust modified with citric, tartaric, and acetic acids. Bioresour. Technol. 2015, 198, 300–308. [Google Scholar] [CrossRef]
- Liu, Y.; Chen, M.; Yongmei, H. Study on the adsorption of Cu(II) by EDTA functionalized Fe3O4 magnetic nano-particles. Chem. Eng. J. 2013, 218, 46–54. [Google Scholar] [CrossRef]
- Simonin, J.-P. On the comparison of pseudo-first order and pseudo-second order rate laws in the modeling of adsorption kinetics. Chem. Eng. J. 2016, 300, 254–263. [Google Scholar] [CrossRef]
- Gao, X.; Guo, C.; Hao, J.; Zhao, Z.; Long, H.; Li, M. Adsorption of heavy metal ions by sodium alginate based adsorbent-a review and new perspectives. Int. J. Biol. Macromol. 2020, 164, 4423–4434. [Google Scholar] [CrossRef] [PubMed]
- Wang, R.; Shafi, M.; Ma, J.; Zhong, B.; Guo, J.; Hu, X.; Xu, W.; Yang, Y.; Ruan, Z.; Wang, Y.; et al. Effect of amendments on contaminated soil of multiple heavy metals and accumulation of heavy metals in plants. Environ. Sci. Pollut. Res. Int. 2018, 25, 28695–28704. [Google Scholar] [CrossRef] [PubMed]
- Park, J.H.; Ok, Y.S.; Kim, S.H.; Cho, J.S.; Heo, J.S.; Delaune, R.D.; Seo, D.C. Competitive adsorption of heavy metals onto sesame straw biochar in aqueous solutions. Chemosphere 2016, 142, 77–83. [Google Scholar] [CrossRef]


Disclaimer/Publisher’s Note: The statements, opinions and data contained in all publications are solely those of the individual author(s) and contributor(s) and not of MDPI and/or the editor(s). MDPI and/or the editor(s) disclaim responsibility for any injury to people or property resulting from any ideas, methods, instructions or products referred to in the content. |
© 2023 by the authors. Licensee MDPI, Basel, Switzerland. This article is an open access article distributed under the terms and conditions of the Creative Commons Attribution (CC BY) license (https://creativecommons.org/licenses/by/4.0/).
Share and Cite
Zhao, Y.; Luan, H.; Yang, B.; Li, Z.; Song, M.; Li, B.; Tang, X. Adsorption of Pb, Cu and Cd from Water on Coal Fly Ash-Red Mud Modified Composite Material: Characterization and Mechanism. Water 2023, 15, 767. https://doi.org/10.3390/w15040767
Zhao Y, Luan H, Yang B, Li Z, Song M, Li B, Tang X. Adsorption of Pb, Cu and Cd from Water on Coal Fly Ash-Red Mud Modified Composite Material: Characterization and Mechanism. Water. 2023; 15(4):767. https://doi.org/10.3390/w15040767
Chicago/Turabian StyleZhao, Yuyan, Hanwen Luan, Binghan Yang, Zhenghe Li, Meitong Song, Bing Li, and Xiaodan Tang. 2023. "Adsorption of Pb, Cu and Cd from Water on Coal Fly Ash-Red Mud Modified Composite Material: Characterization and Mechanism" Water 15, no. 4: 767. https://doi.org/10.3390/w15040767