Article

InSAR Displacement with High-Resolution Optical Remote Sensing for the Early Detection and Deformation Analysis of Active Landslides in the Upper Yellow River

1
GNSS Research Center, Wuhan University, Wuhan 430079, China
2
School of Geodesy and Geomatics, Wuhan University, Wuhan 430079, China
3
School of Emergency Management, Institute of Disaster Prevention, Sanhe 065201,China
*
Author to whom correspondence should be addressed.
Water 2023, 15(4), 769; https://doi.org/10.3390/w15040769
Submission received: 27 January 2023 / Revised: 10 February 2023 / Accepted: 12 February 2023 / Published: 15 February 2023
(This article belongs to the Special Issue Geohazards Monitoring Assessment: Earth-Observation Techniques)

Abstract

:
Frequent landslides and other geological disasters pose a serious threat to human life and infrastructure in the Upper Yellow River. Detecting active landslides and ascertaining their impact necessitate the determination of deformation characteristics. In this study, we developed an integrated method combining interferometric synthetic aperture radar and high-resolution optical satellite remote sensing to detect active landslides in the Upper Yellow River region from Longyang Gorge to Lijia Gorge. Sentinel-1 satellite data from January 2019 to April 2021 with ascending and descending orbits were adopted to obtain deformation using the STACKING and interferometric point target analysis techniques. A 97.08% overlap rate in the detected results from the two InSAR technologies confirmed the suitability of both approaches. The missing detection rates (6.79% & 8.73%) from single line-of-sight (LOS) InSAR results indicate the necessity of different orbit direction data. Slight deformation rate changes (<4 mm/month) before and after rainy seasons of the Lijia Gorge landslide group indicate that precipitation exerted little impact on slope activity. This study supports the feasibility of integrated methods for the detection and analysis of active landslides in the Upper Yellow River and other regions.

1. Introduction

Landslides are natural slope movement phenomena caused by gravity and influenced by fluvial scouring, groundwater, structural activity, rainfall, and other factors [1]. The upper reaches of the Yellow River are in the transition zone between the Qinghai–Tibet Plateau and the Loess Plateau [2]. In this region, the Yellow River flows through the Longyang Gorge, the Gonghe, Degui, and Jianzha Basin, and the Lijia Gorge, and is the site of important hydropower and water management infrastructure (e.g., the Longyang Gorge, Laxiwaku, and Lijia Gorge dams). Geohazards frequently occur under the complex geological and geomorphic conditions [3]. Early identification of active landslides in the area is crucial for protecting human life and infrastructure and for the security of water conservancy facilities [4]. However, the high mountains and deep, steep-sided valleys make it difficult to investigate and monitor geohazards.
Landslide characteristics are influenced by geomorphology, vegetation, hydrology, and atmospheric conditions [5]. However, the identification and monitoring of active landslides using traditional manual surveys is challenging [6]. Recently, high-resolution satellite remote sensing, unmanned aerial vehicle remote sensing, and ground-based detection techniques have been applied in landslide research. However, individual approaches are restricted by the associated observation model and platform ability, and cannot detect all of the relevant variables. As such, integrated remote sensing technologies (e.g., combining interferometric synthetic aperture radar [InSAR], high-resolution optical remote sensing, and aerial surveys) have been applied to detect geological hazards based on deformation, morphological characteristics, and other factors [7,8]. However, the multiple technologies used have performed differently in different regions owing to the influence of local natural conditions (e.g., geomorphology, vegetation, hydrology, and atmospheric conditions). As such, the feasibility of using a combination of techniques to identify landslides in the Upper Yellow River region need to be further researched.
InSAR has been applied to detect active landslides and monitor their deformation [9,10,11]. Differential InSAR (DInSAR) can determine slight surface deformation along the line-of-sight (LOS) direction by analyzing multi-time phase information of radar images in the same area. Advanced InSAR techniques can retrieve high-accuracy time series of deformation, including STACKING InSAR [12], Persistent Scatterer InSAR (PS-InSAR) [13,14], Small Baseline Subset InSAR (SBAS-InSAR) [15], and Distributed Scatterer InSAR (DS-InSAR) [16]. Among them, STACKING InSAR can show deformation in low-coherence areas; PS-InSAR can acquire time-series deformation with high accuracy, but relies on coherent radar backscattering properties; SBAS-InSAR combines short spatiotemporal baseline and time-series analysis, but reduces the spatial resolution because multi-look and spatial filters are adopted; and DS-InSAR is suitable for natural target deformation detection through adopted distributed scatter (DS) targets that widely exist in nature [17]. Interferometric point target analysis (IPTA) was developed based on PS-InSAR and SBAS-InSAR, and increases the number of interferometric points based on the coherence and stability of the spectrum. Linear regression analysis has been applied to eliminate atmospheric phase and elevation errors in InSAR methods [18], rendering this technique more suitable than PS-InSAR for the acquisition of deformation information in natural environments.
High-resolution optical remote sensing techniques can directly detect landslide surface characteristics by identifying the position, scope, slide scrap, slope toe, back fracture, slide fronts, active fractures, and vegetation cover [19]. Multi-series high-resolution images can help trace slope surface change characteristics [20].
This study aimed to explore the feasibility of combining InSAR with optical satellite remote sensing techniques for active landslide mapping [7,8] and to define the detailed interpretation criteria comprising of multiple remote sensing characteristics for the Upper Yellow River area. We developed an integrated framework for detecting and analyzing the characteristics of active landslides from high revolution optical satellite images and C-band Sentinel-1 satellite images with ascending and descending orbits. Data were taken from January 2019 to April 2021. By analyzing the deformation detection abilities of the STACKING and IPTA techniques, we compared the suitability of both InSAR methods. This is the first study to detect and analyze active landslides along the Longyang Gorge to Lijia Gorge segment of the Upper Yellow River, and the results offer a reference for hazard management in this and other regions.
The active landslides detected and deformation characteristics determined could facilitate the study of landslide mechanisms, allowing the monitoring and prediction of local landslides. By analyzing and comparing the abnormal deformation detection ability of STACKING and IPTA techniques and the InSAR results in ascending and descending directions, we aimed to identify the feasibility of the two InSAR methods and the utility of the combination of both orbit direction images in the Upper Yellow River for active landslide detection.

2. Study Area and Data
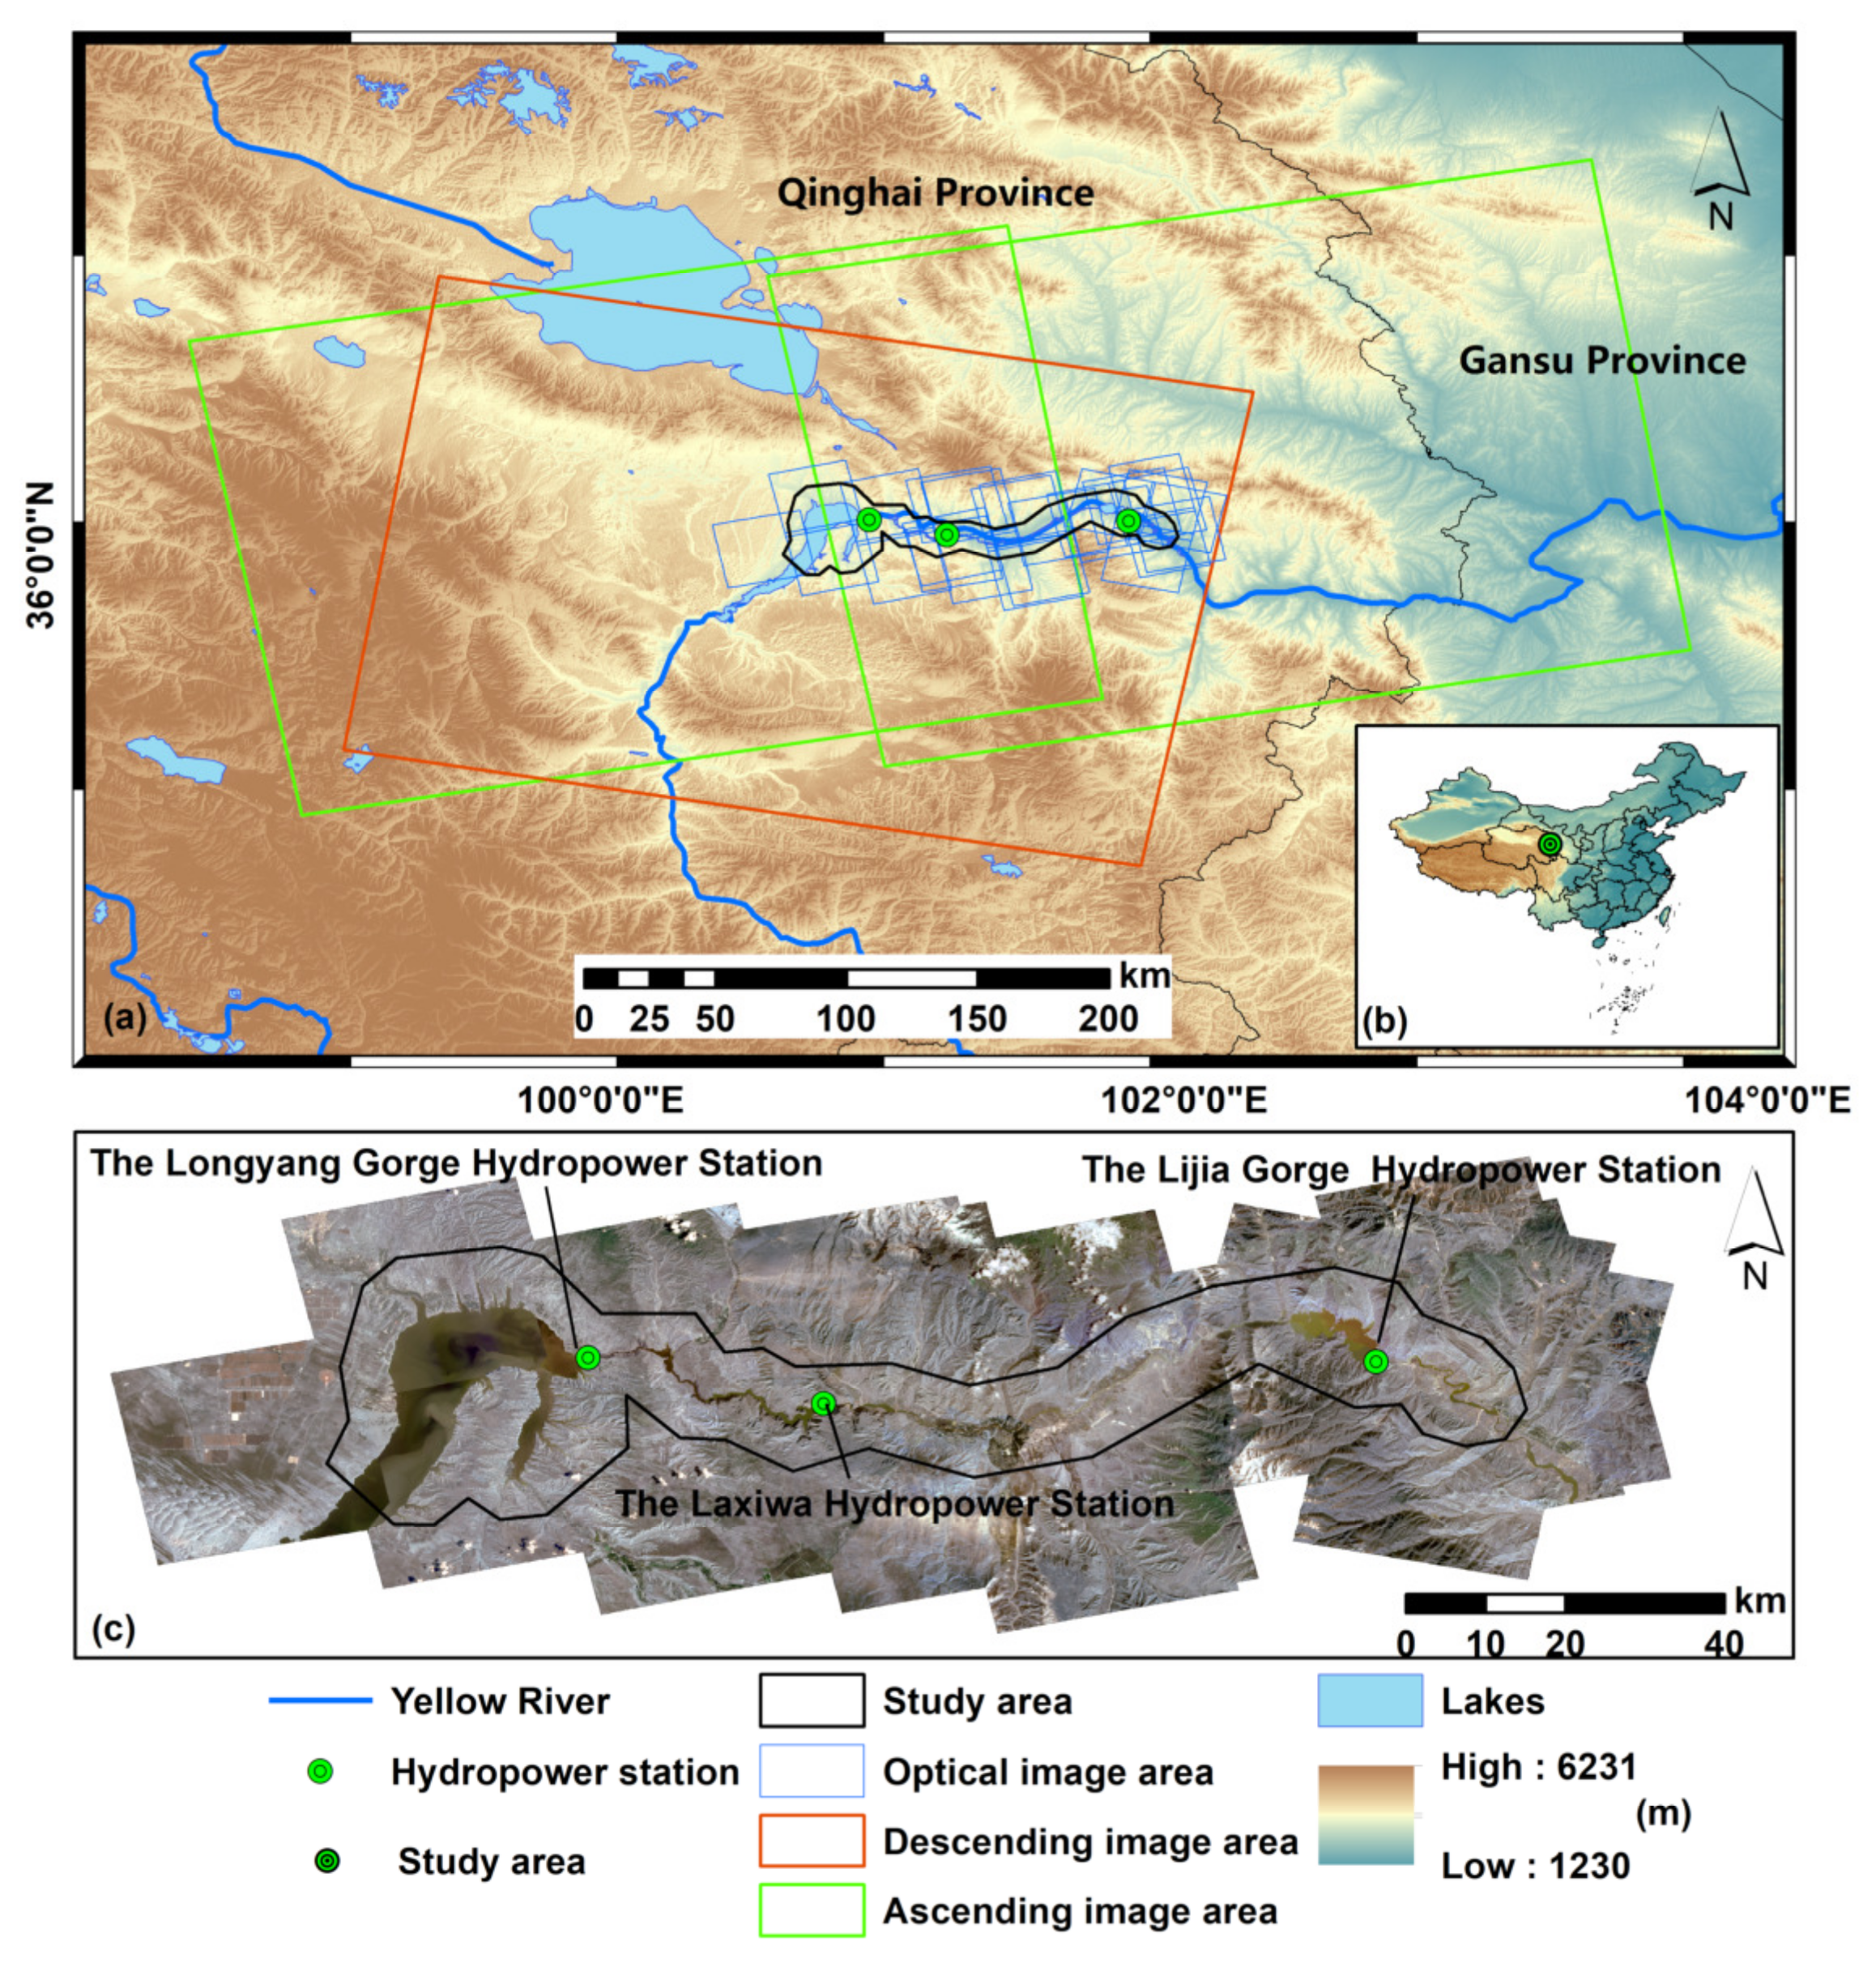
2.1. Study Area

The upper reaches of the Yellow River, located on the eastern Qinghai–Tibet Plateau (eastern Qinghai Province, China), extend from Longyang Gorge to Lijia Gorge. The terrain is high in the north, south, and west but low in central and eastern areas. Mountains along both sides of the Yellow River follow a general E–W orientation. In the study area, the Yellow River cuts through the Longyang Gorge and Lijia Gorge from W to E, passing through the Gonghe, Degui, and Jianzha basins and forming a landform with alternating valleys and basins (Figure 1a,b). The river valley is narrow and steep-sided. The area is strongly affected by tectonic activity on the eastern Qinghai–Tibet Plateau, river erosion, and heavy seasonal rainfall, and is prone to geological disasters [21]. Several large landslide groups exist, including the Longyang Gorge Chana, Donglong, Songba Gorge, and Lijia Gorge landslide groups [22]. The revival of old landslides endangers human life and infrastructure in the region as well as the safe operation and construction of water conservation facilities, such as the Longyang Gorge, Laxiwaku, and Lijia Gorge hydropower stations [23]. The displacement of the Guobu landslide near Laxiwaku was identified by SAR pixel offset tracking [24], time-series point-like target offset tracking [25], and D-InSAR technology [26]. Its mechanism has been analyzed through numerical modeling [27]. Although several detailed studies on massive landslide and the areas surrounding the dam sites [28], there is a lack of in-depth analysis of geological hazards over the wider study area.

2.2. Study Data

We used three image frames from January 2019 to April 2021 (Table 1), with a total of 190 scenes of Sentinel-1 data including 120 ascending images and 70 descending images (red and green boxes in Figure 1a, respectively).
TripleSat-2 (BJ-2) and Gaofen-2 (GF-2) satellite imagery products (Figure 2) from 2019 to 2021 were used for comprehensive remote sensing interpretation. Among the images, the GF-2 satellite L4-level products have two scenes, and the BJ-2 satellite L4 products have 16 scenes. The detailed satellite parameters and data collection times are listed in Table 2. A composite optical image is shown in Figure 1b.

3. Methods

The framework presented in Figure 2 illustrates the proposed method for active landslide detection and analysis, including the extraction of topographic features from digital elevation model (DEM) data, InSAR deformation data (vertical and E–W displacement acquired using InSAR technology applied to ascending and descending Sentinel-1 synthetic aperture radar [SAR] data), and image features from high-resolution optical images. Topography of the study area was obtained from the Shuttle Radar Topography Mission (SRTM) 30 m digital elevation model (DEM) which was a branch of the digital terrain model (DTM). Well-defined interpretation criteria for active landslides were summarized based on known active landslides analyzed using InSAR deformation, optical imaging, and geomorphology and were applied to directly detect active landslides in the study area. Landslide activity was then characterized based on the integrated datasets, and the potential triggering factors were identified.

3.1. Time-Series InSAR Technology

The InSAR technique acquires deformation information by calculating the difference in phase information between two SAR images. The phase of the interferogram can be summarized as follows:
Ψ = φ r e f + φ d e f + φ t o p + φ a t m + φ n o i s e
where Ψ denotes the InSAR interferometric phase, φ r e f is the reference ellipsoid phase contribution, φ d e f denotes the contribution of the deformation phase, φ t o p o is the topographic phase contribution, φ a t m represents the contribution of the atmospheric phase, and φ n o i s e is the decorrelation noise.
The STACKING technique was initially proposed by Sandwell [29], and assumes that the phase noise (including the atmospheric phase) is random in time and ground deformation is nearly linear. The average displacement model can be expressed as [30]:
V d i s p = λ · ϕ c u m 4 π · t c u m
where V d i s p is the average displacement velocity along the LOS, λ is the wavelength, ϕ c u m is the cumulative unwrapped phase, and t c u m is the total acquisition time interval.
After removing the flat-Earth, topographic, and atmospheric phases, the residual phase contains the deformation phase and noise. The ground deformation rate was obtained by unwrapping the residual phase and calculating the weighted average of the phase changes. Although the STACKING technique has the disadvantage of removing errors, it has the advantages of low-coherence and radical movement [31].
The IPTA technique calculates time-series deformation by analyzing the interferometric point targets [32]. A multi-reference stack with short time intervals was adopted as it is better suited for natural situations. The single-pixel and multi-look phases were combined. A linear model was applied to separate the deformation and atmospheric path-delay phases. The deformation phase model for each interfered target point was as follows [13]:
μ ( x , t i ) = 4 π λ ν ( x ) · t i + μ N L ( x , t i )  
where x is a 2-D vector specifying the position of the pixel in the image, t i is the temporal baseline of the i th interferogram, μ ( x , t i ) is the phase contribution because of a possible motion of the target x in the LOS direction, and μ N L ( x ,   t i ) is the residual (nonlinear) motion.
We used the Shuttle Radar Topography Mission 30 m DEM and precise orbit data to remove flat-Earth and topographic phases. MT-InSAR data were processed using the GAMMA software.

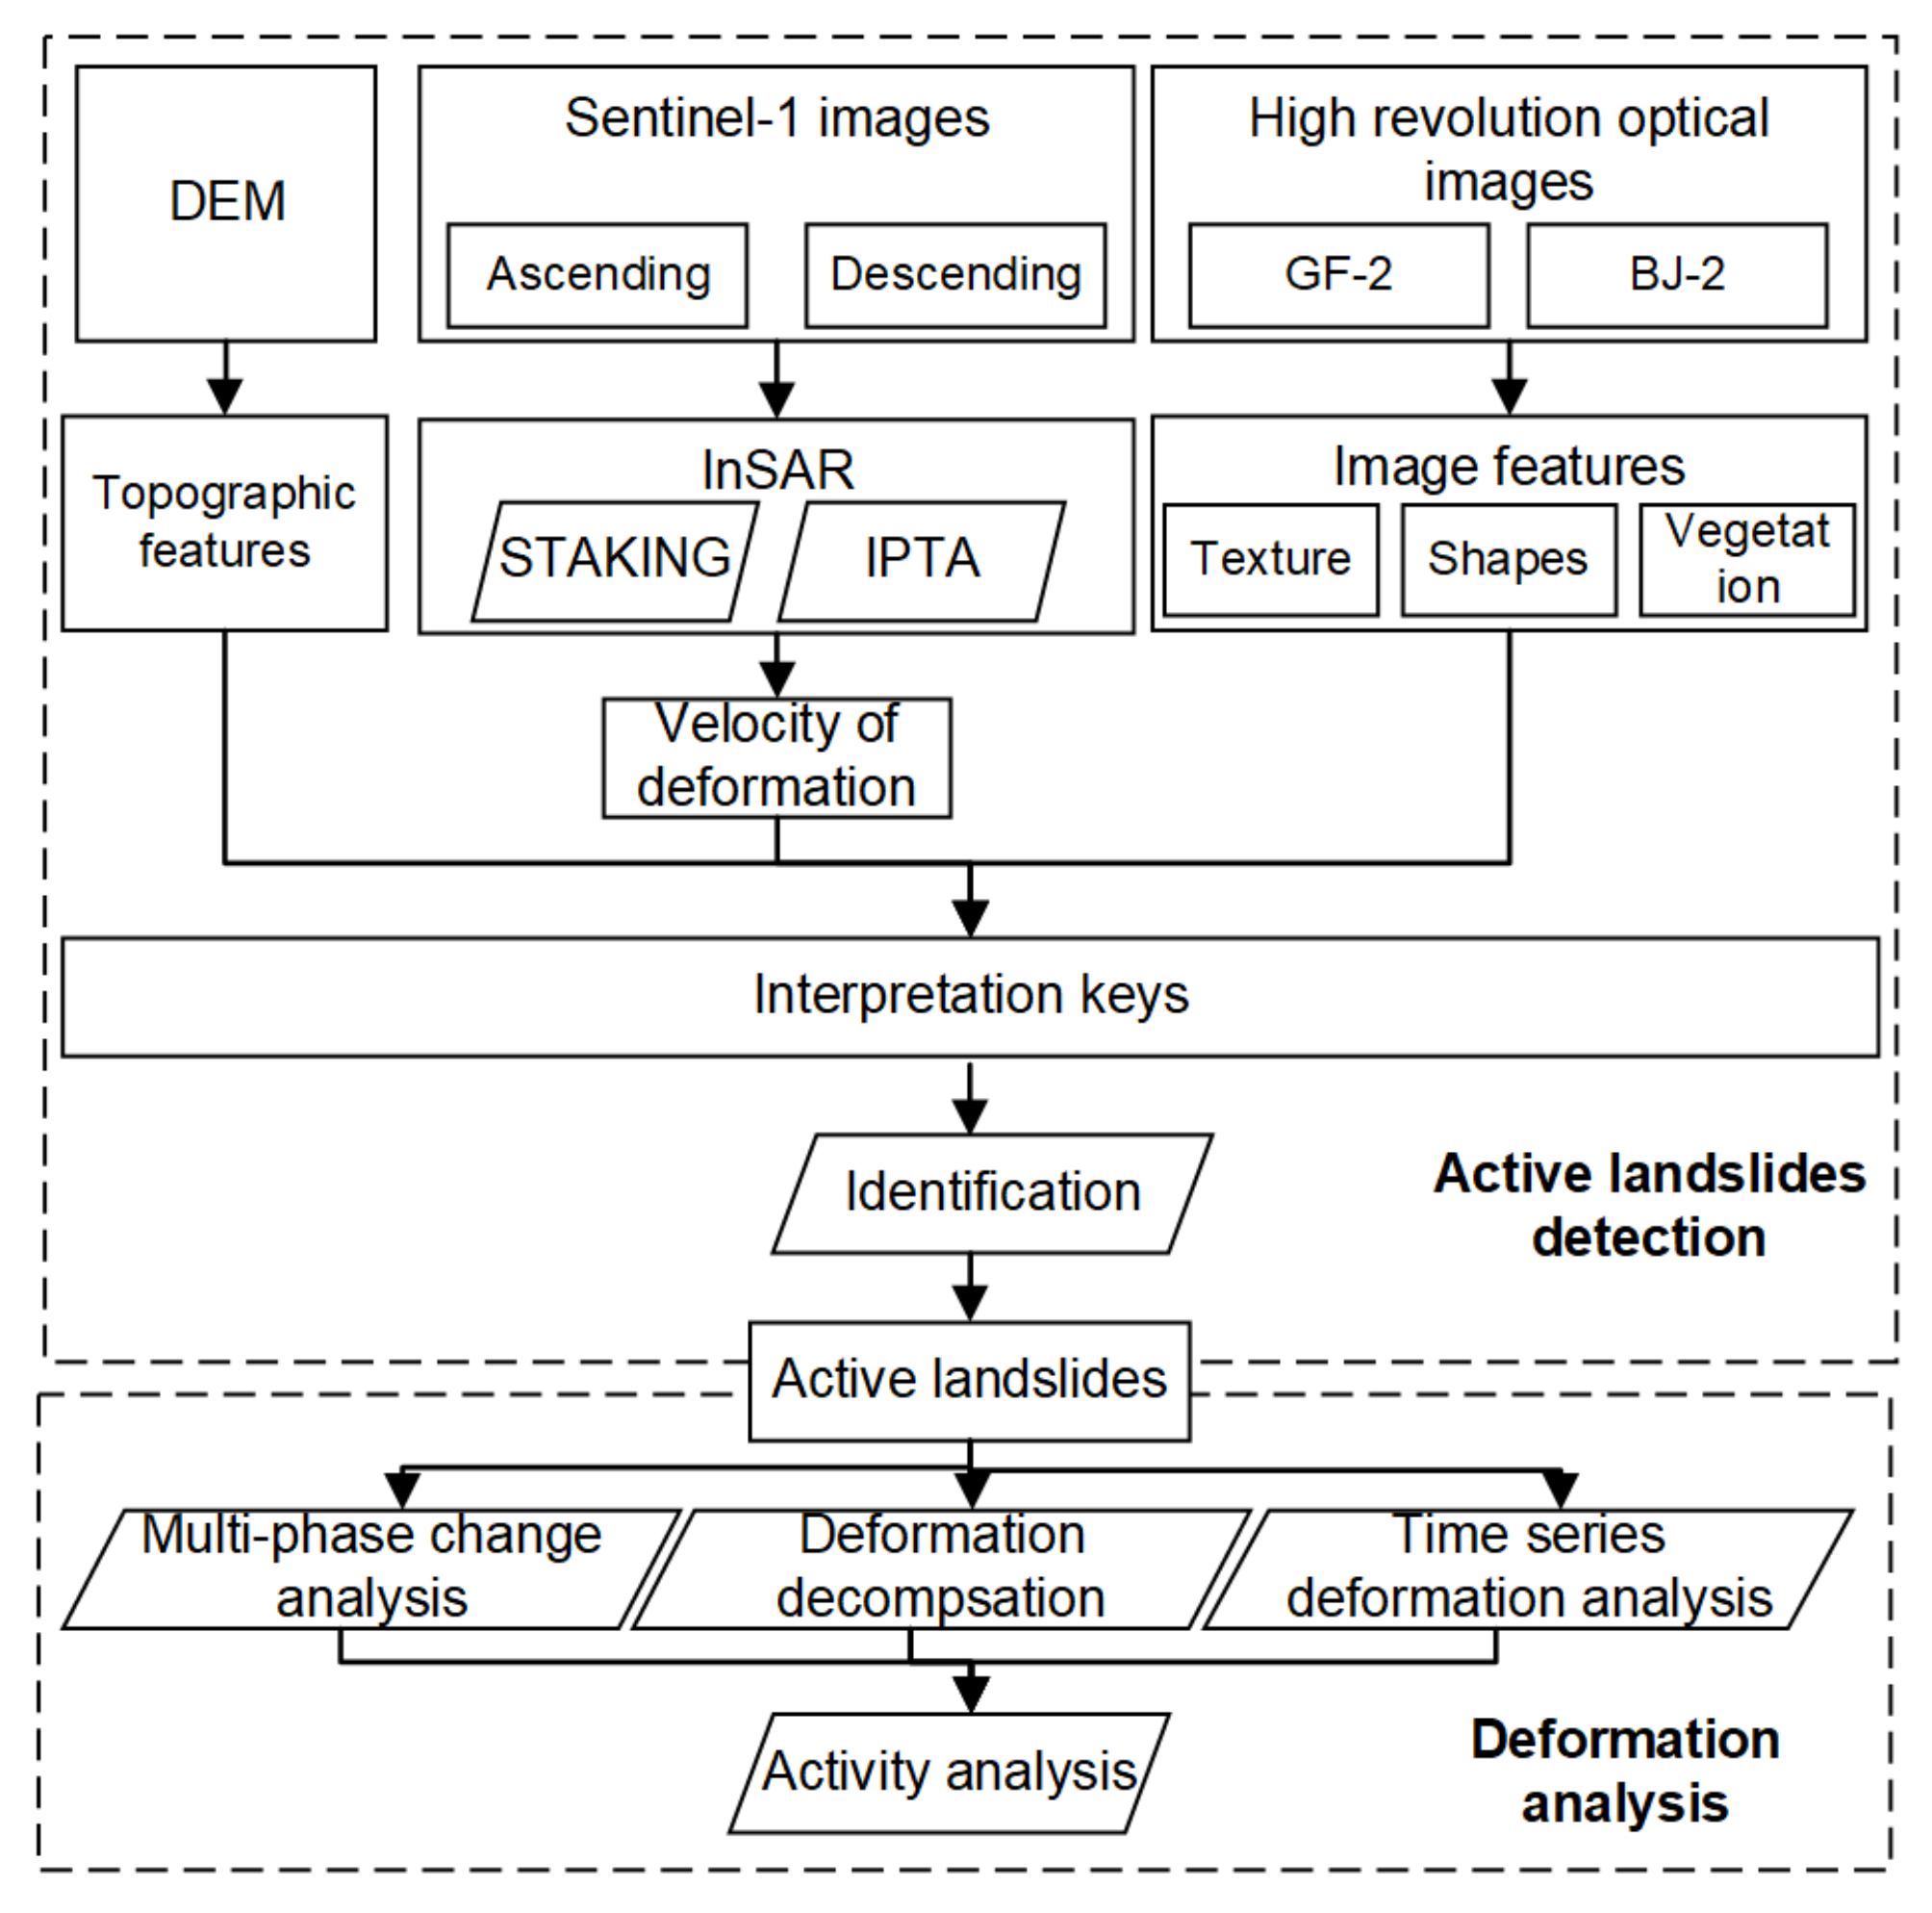
3.2. Integrated Active Landslide Detection

The known active landslides in the study area have notable features in high-resolution spectral satellite images, such as shape, size, tone, shadow, texture, topography, and vegetation. The visual interpretation method was adopted to effectively detect active landslides and integrate deformation in different directions and image features in high-resolution optical images [33]. InSAR deformation results help detect the location of deformation, and high-resolution optical images contribute to identifying the source of deformation. IPTA results and high-resolution spectral images promote analysis of the deformation characteristics of active landslides.
In terms of morphology, landslides in the study area are mostly dustpan-shaped, pear-shaped, tongue-shaped, or fan-shaped, with apparent landslide walls, landslide steps, and trailing edge cracks (Figure 3a,b). The terrain is often chair-shaped, with gullies stemming from the same source developed on both sides. In terms of image color, slopes often have an apparent discrepancy with the surrounding environments because of water erosion and the absence of vegetation; for example, the Longyang landslide (Figure 3g).
There are two types of landslides in the study area: reservoir- and non–reservoir-bank landslides. Reservoir-bank landslides are affected by gravity and water erosion at the foot of the slope and are accompanied by specific surface deformation characteristics. The deformation rate of the reservoir-bank slope is significantly higher than that of the surrounding environment, with apparent deformation anomalies. Deformation is concentrated in the toe and middle of slopes, as seen in the Longyang landslide (Figure 3e,f). In contrast, bank slopes mostly slide as a whole, such as the Guobu bank slope (Figure 3b,c). Non–reservoir-bank landslides are distributed far from the river channel, on both sides of the valley and seasonal rivers. The height difference of the landslides is significant, and the front edge has air-side conditions that are affected by gravity, human engineering activities, rainfall, and tectonic activity. The different stability conditions lead to various InSAR deformation characteristics. Compared with reservoir-bank landslides, deformation anomalies of this type of landslide are primarily concentrated where there are sudden changes in terrain, such as the rear side of the slope and the toe of the slope (i.e., close to the shearing mouth). For example, three landslides on the northern side of the Li-Kan Highway landslide group all move integrally, while landslides on the southern side slide at the top.
Based on the characteristics of typical landslide hazards (e.g., the Chana landslide, Longyang landslide group, and Guobu bank slope), active landslide interpretation characteristics were established. As an example, Figure 3 shows the interpretation characteristics of the Longyang landslide group and Guobu bank slope. For the Longyang landslide, the slope is pear-shaped and back-edge cracks are apparent. The landslide wall is steep, and shadows are found within the image. A closed depression has developed on the back side of the slope. Tension cracks extended along the strike direction (NW–SE). Two groups of shear crapes in the accumulation of the slide spread out in a fan shape near the N–S section. The toe of the slope is continuously eroded by river water year-round and the bank slopes have retreated. Escarpments are the products of rockfalls. The locations of the collapse and cracks in Figure 3g correspond to the high-deformation images in Figure 3e,f.
Based on our analyses, we adopted an InSAR deformation rate threshold of ±20 mm/a for landslide identification. Even if one block of a slope’s absolute deformation value exceeded this threshold, we identified the source of the displacement through the optical and topographic images to estimate if it was an active landslide. While adding to the workload, this step improved the detection accuracy.

3.3. Inversion of 3D Displacements

Changing reservoir water level and gravity are the primary sources of influences on slope deformation. In this study, vertical deformation was the main displacement component. The slip directions of the Lijia Gorge landslides were near E–W, while the deformation of slopes in the S–N direction was not significant. In addition, owing to Sentinel-1’s near-polar orbit and right-view imaging mode, deformation obtained in the LOS directions was near the E–W or W–E directions, and was not sensitive to the deformation in the S–E direction [34].
In the present study, two components typically corresponded to the results of the ascending and descending LOS directions. Hence, the directions of the two observed components differed significantly. The 3D displacement field was calculated based on the two indicated LOS displacement components (from ascending and descending orbits) and under the assumption that the N–S motion was zero. Therefore, displacement could be expressed as an E–W and up–down motion. The deformation equations can be expressed as follows [35]:
[ D L O S a D L O S d ] = [ c o s θ i n c a s i n θ i n c a     s i n ( α a z i a 3 π 2 ) c o s θ i n c d s i n θ i n c d     s i n ( α a z i d 3 π 2 ) ] [ D U D E ] #
where D L O S is deformation in the LOS direction; θ i n c is the incidence angle of the satellite; α a z i is the azimuth angle of the satellite; superscripts a and d indicate the parameters of the ascending and descending orbital images, respectively; and D U and D E are deformation occurring in the vertical and eastern directions, respectively.

4. Results

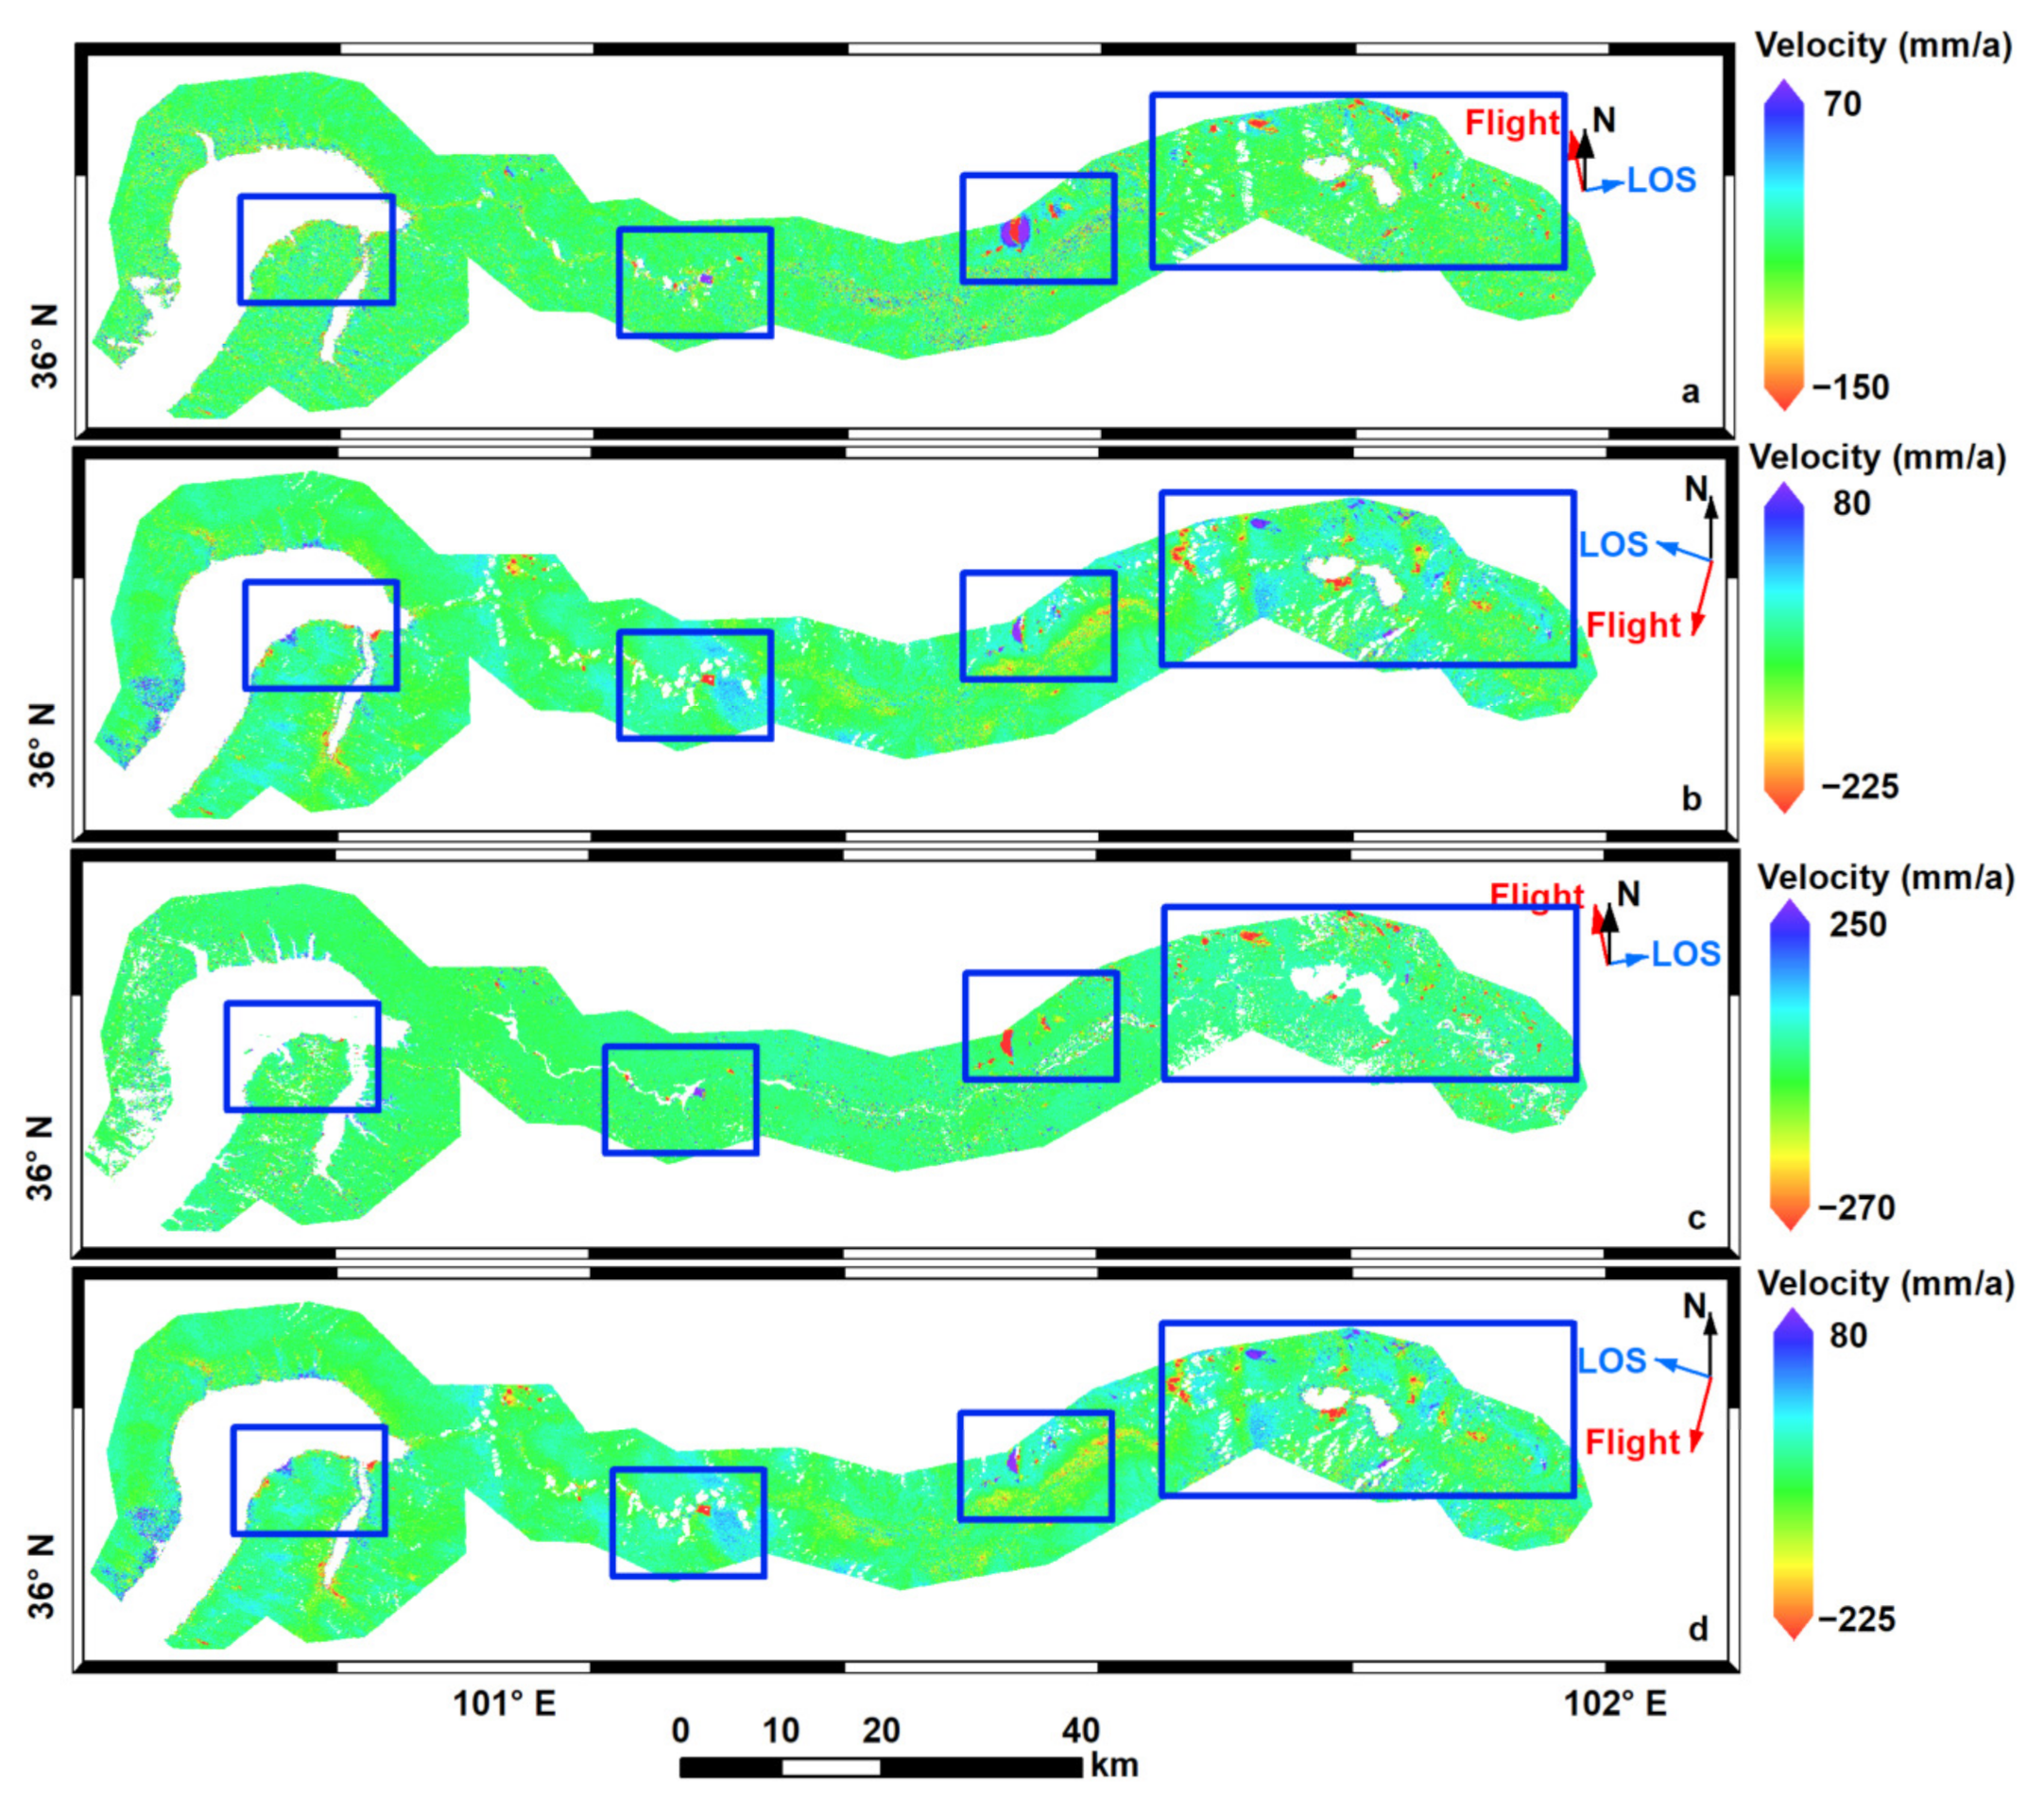
4.1. Deformation from Ascending and Descending Orbital Images

In mountainous areas, radar data from a single satellite flight direction contain extensive regions of geometric distortion consisting of shadows, layover, and foreshortening. Figure 4 shows the geometric distortions of the Sentinel-1 satellite from the ascending and descending orbits. The layover and shadow areas from the ascending and descending orbits were 215.92 km2 and 243.16 km2, respectively. Critically, the distorted areas were those regions with significant topographic changes and the highest risk of landslides. However, when ascending and descending images were combined, the layover and shadow area decreased to 3.24 km2, indicating a reduction of 98.5%.
The InSAR results indicate that most of the regions in the study area were relatively stable, with local deformation caused by active landslides, engineering activities, and other factors. Figure 5 shows the average annual deformation velocity of the study area using the STACKING and IPTA techniques with ascending and descending orbits. Deformation was consistent in the layover areas of the two ascending image frames. Deformation anomalies were primarily concentrated in the section from Laxiwaku Reservoir to Lijia Gorge Reservoir, passing through Degui County. The annual deformation rate from the STACKING technique in the ascending LOS direction ranged from −152 to 69 mm/a (Figure 5a). The annual deformation rate from the IPTA technique in the ascending LOS direction ranged from −271 to 248 mm/a (Figure 5c). The STACKING and IPTA deformation regions were also consistent in both LOS directions. The annual deformation rate from the STACKING technique ranged from −205 to 113 mm/a (Figure 5b) and that from the IPTA technique ranged from −224 to 79 mm/a (Figure 5d). The consistency of the results across the two approaches in both ascending and descending LOS directions verified the accuracy of the deformation calculation results.

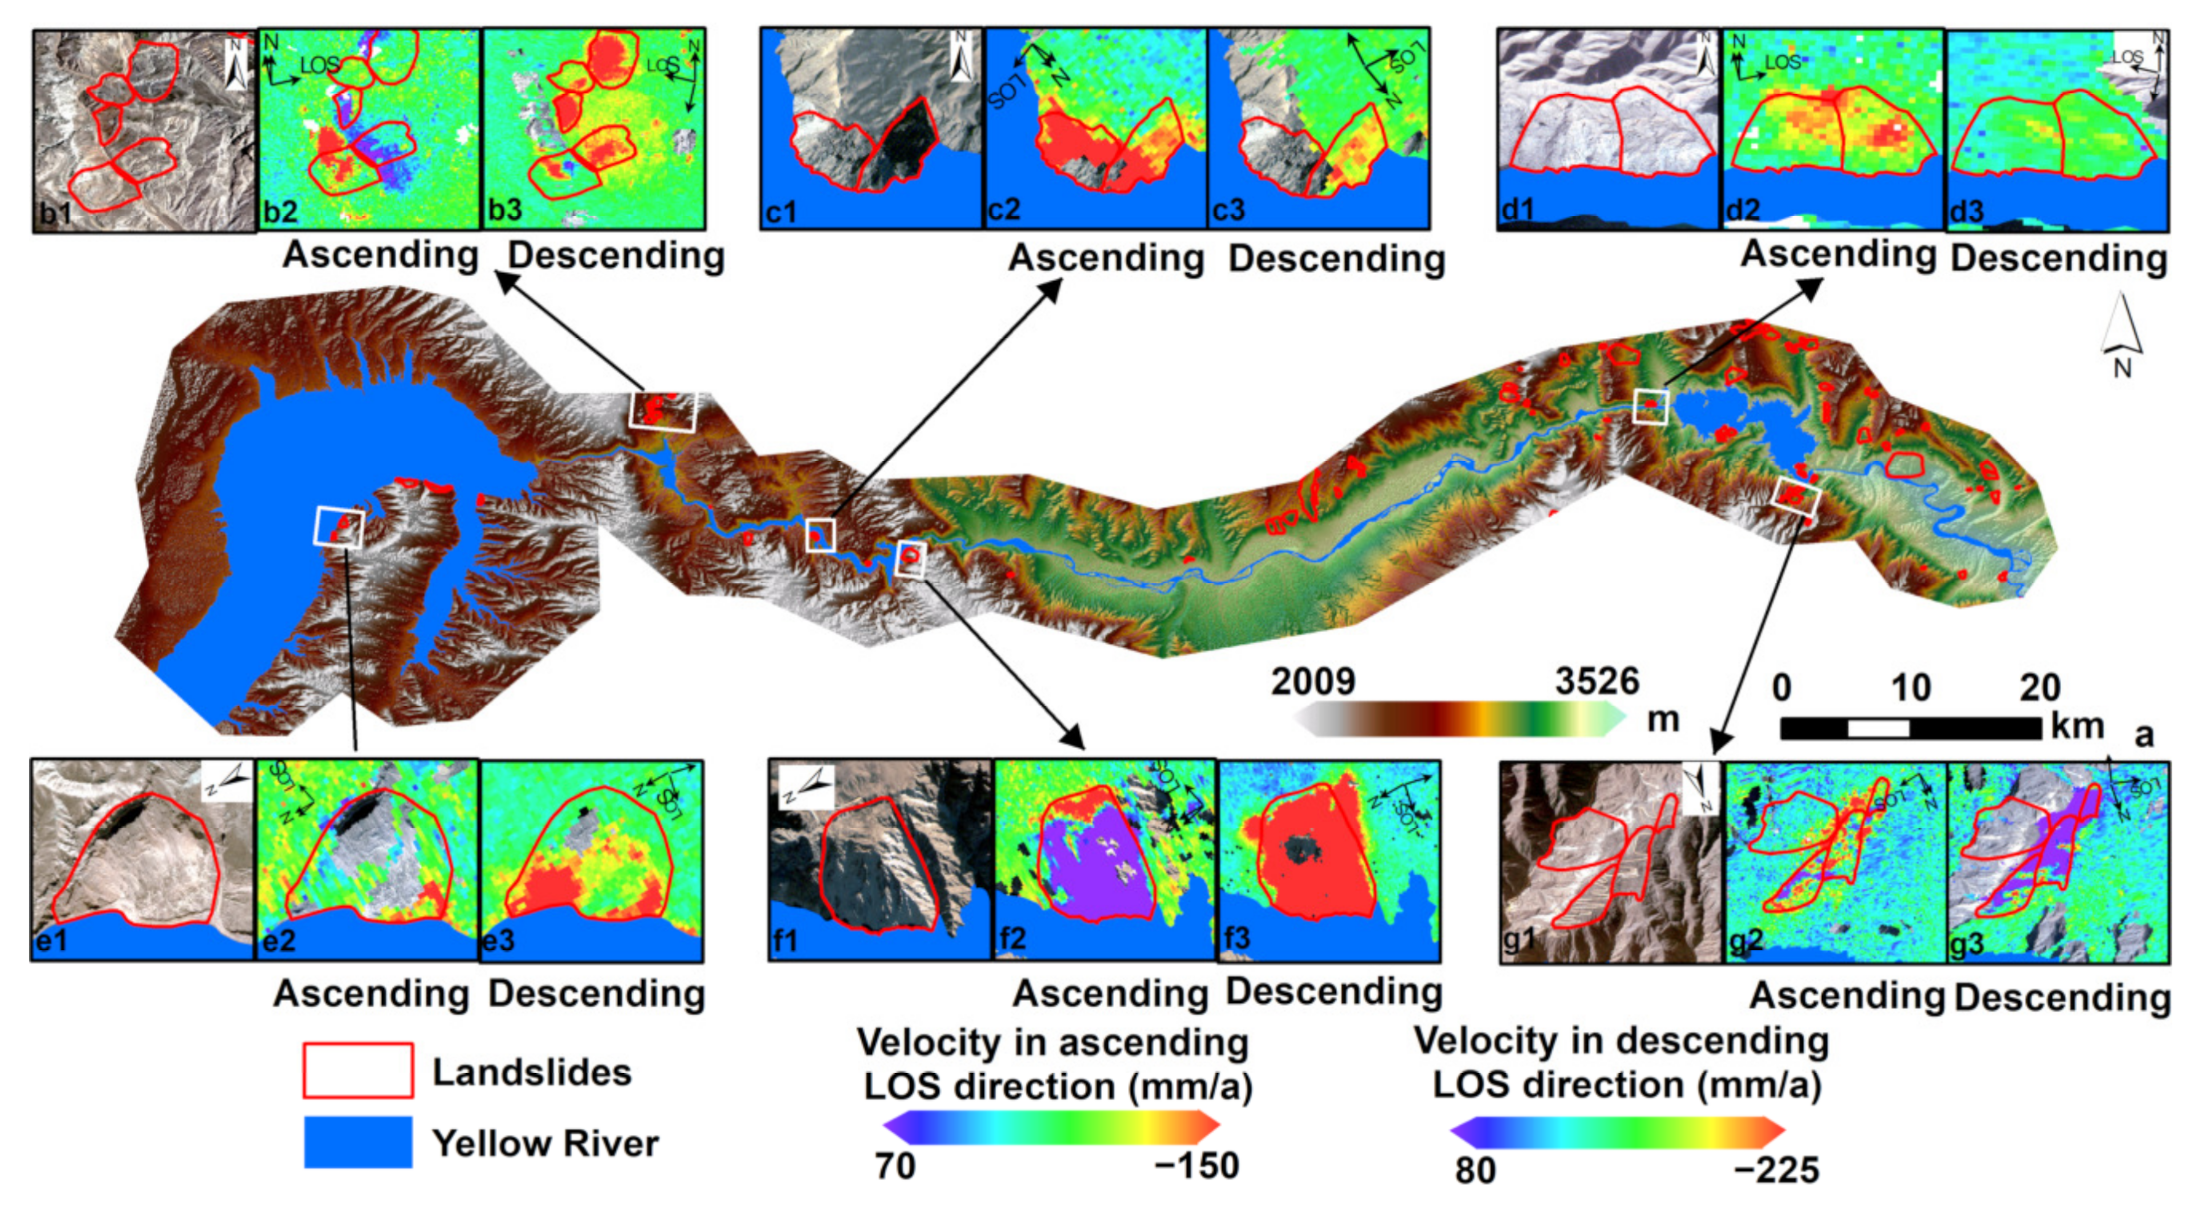
4.2. Active Landslide Detection

By combining the InSAR deformation results with high-resolution spectral images, 103 active landslides were detected in the study area (Figure 6a). Among them, 87 (84.46% of all identified landslides) had specific deformation abnormalities in the surrounding environment in both ascending and descending LOS directions, 7 (6.79%) had deformation characteristics only in the ascending LOS direction, and 9 (8.73%) had deformation characteristics only in the descending LOS direction.
The STACKING and IPTA results had high consistency (Figure 7a–d). Of the 103 active landslides, 100 (97.08%) showed deformation in the InSAR results of both techniques. Just 3 (2.92%) showed deformation in the IPTA results but not in the STACKING results, and these differences reflect the differences in the removal effect of atmospheric errors.
Six typical active landslides were selected for further analysis (Figure 6b–g). Among them, four were reservoir-bank landslides located along the Yellow River (Figure 6c–f) and two were non–reservoir-bank landslides (Figure 6b,g).

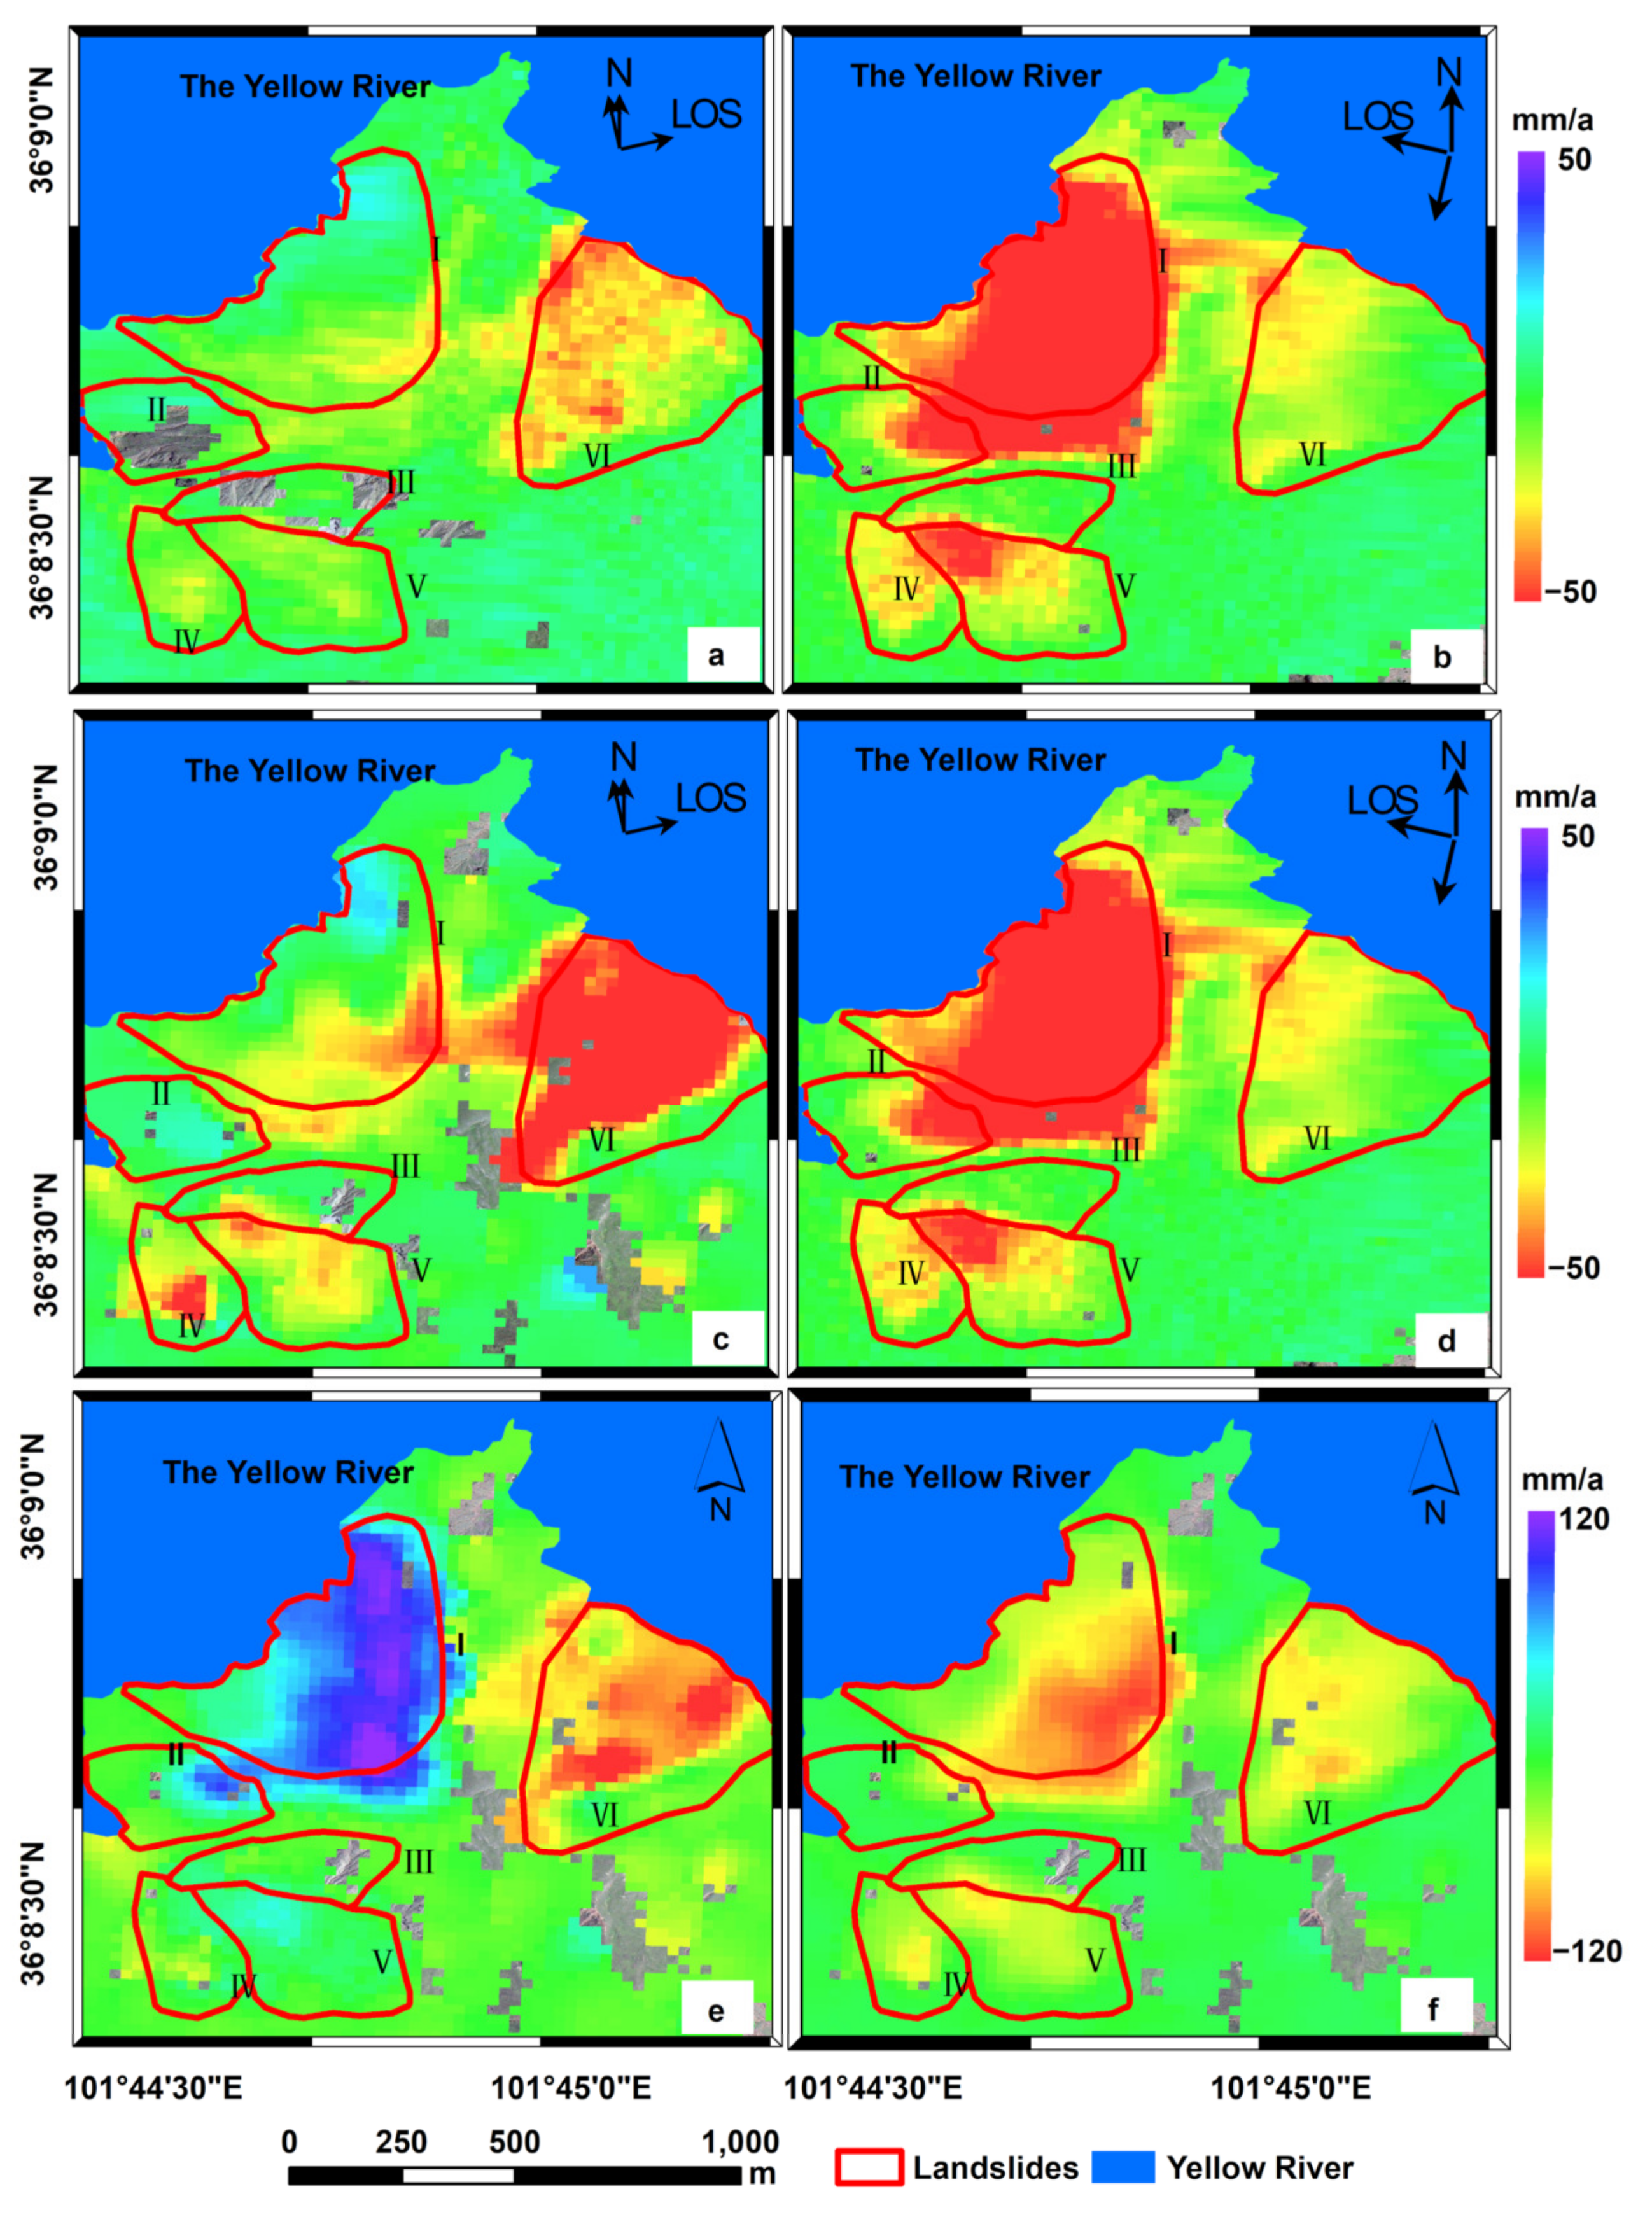
4.3. Deformation of the Lijia Gorge Landslides Group

Figure 7e shows deformation of the Lijia Gorge landslide group along the E–W direction, where positive values indicate movement in the W–E direction and negative values indicate movement in the E–W direction. Deformation rates in the E–W direction ranged from −77 to 116.8 mm/a, concentrated in three landslides (No. I, No. II, and No. VI) in the north. Figure 7d shows deformation in the vertical direction, where negative values indicate downward movement; vertical deformation ranged from 0 to 116.2 mm/a. Downward movement was the most significant for landslides No. I, No. IV, No. V, and No. VI slopes.
When vertical and E–W deformation were combined (Figure 7e,f), the No. I landslide had significant deformation in both the E–W and vertical directions. However, the No. VI landslide primarily moved eastward, but downward movement was not apparent. The rear block of landslide No. II had two deformation directions, confirming its active status.

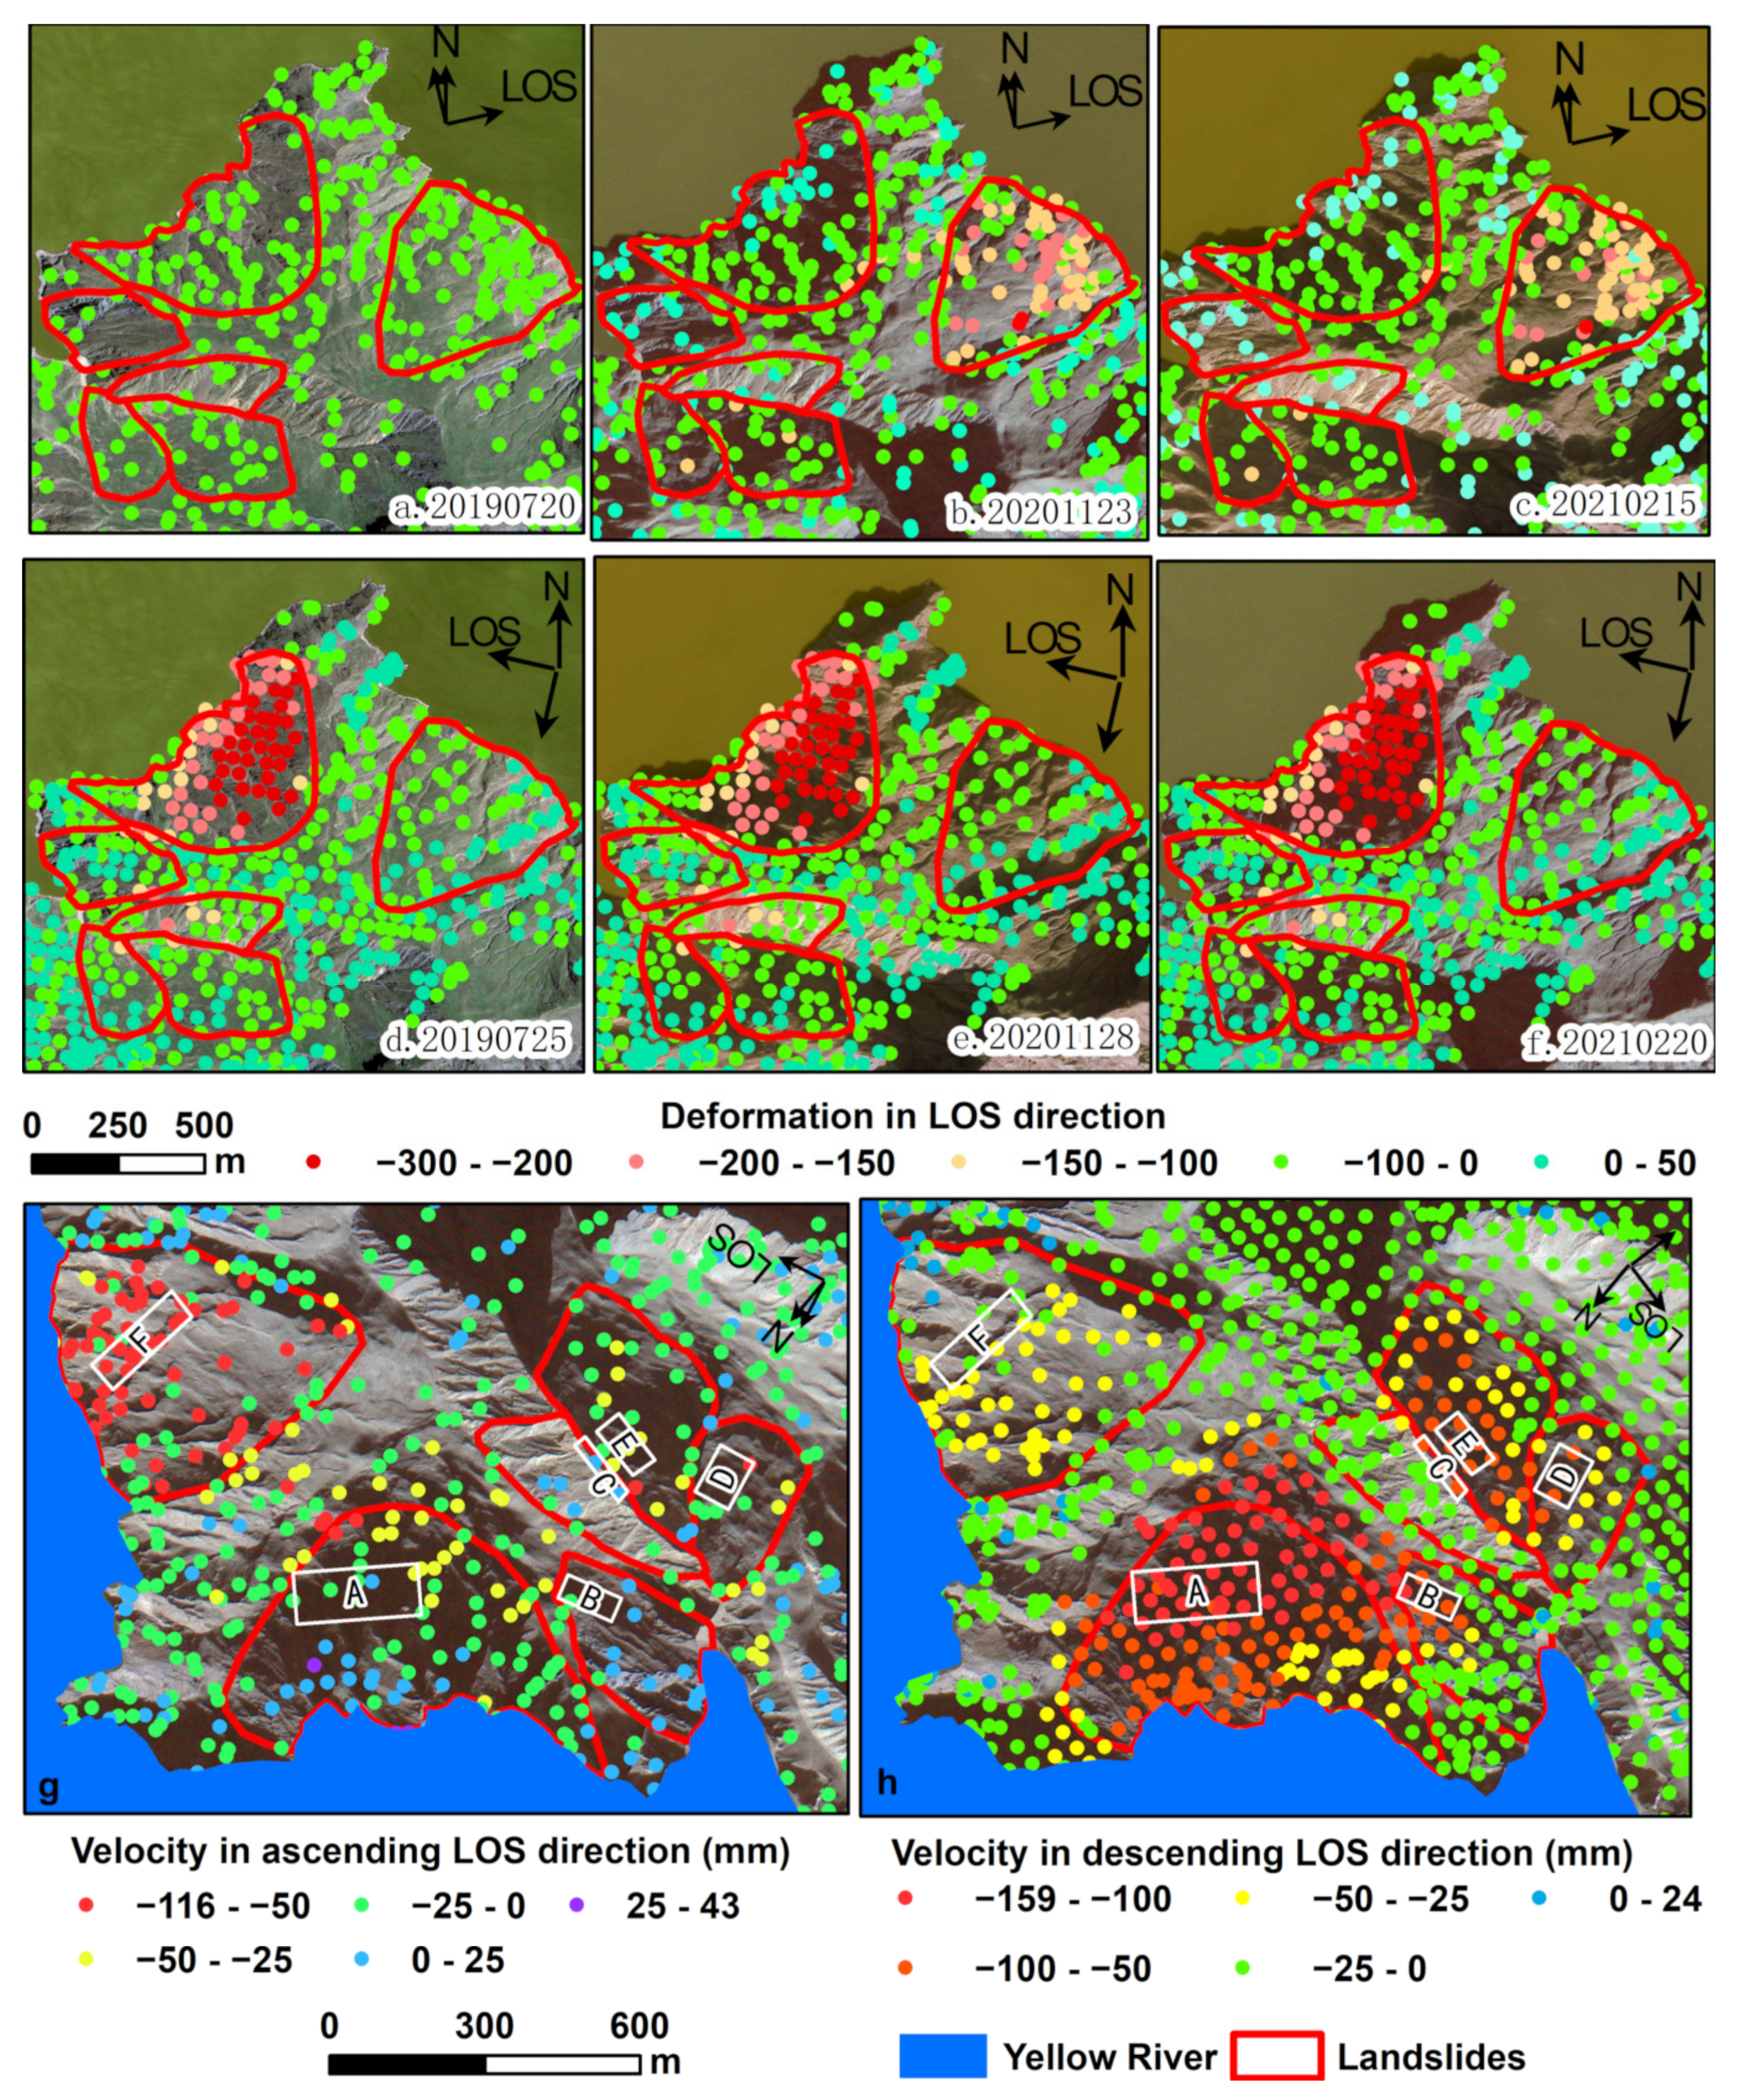
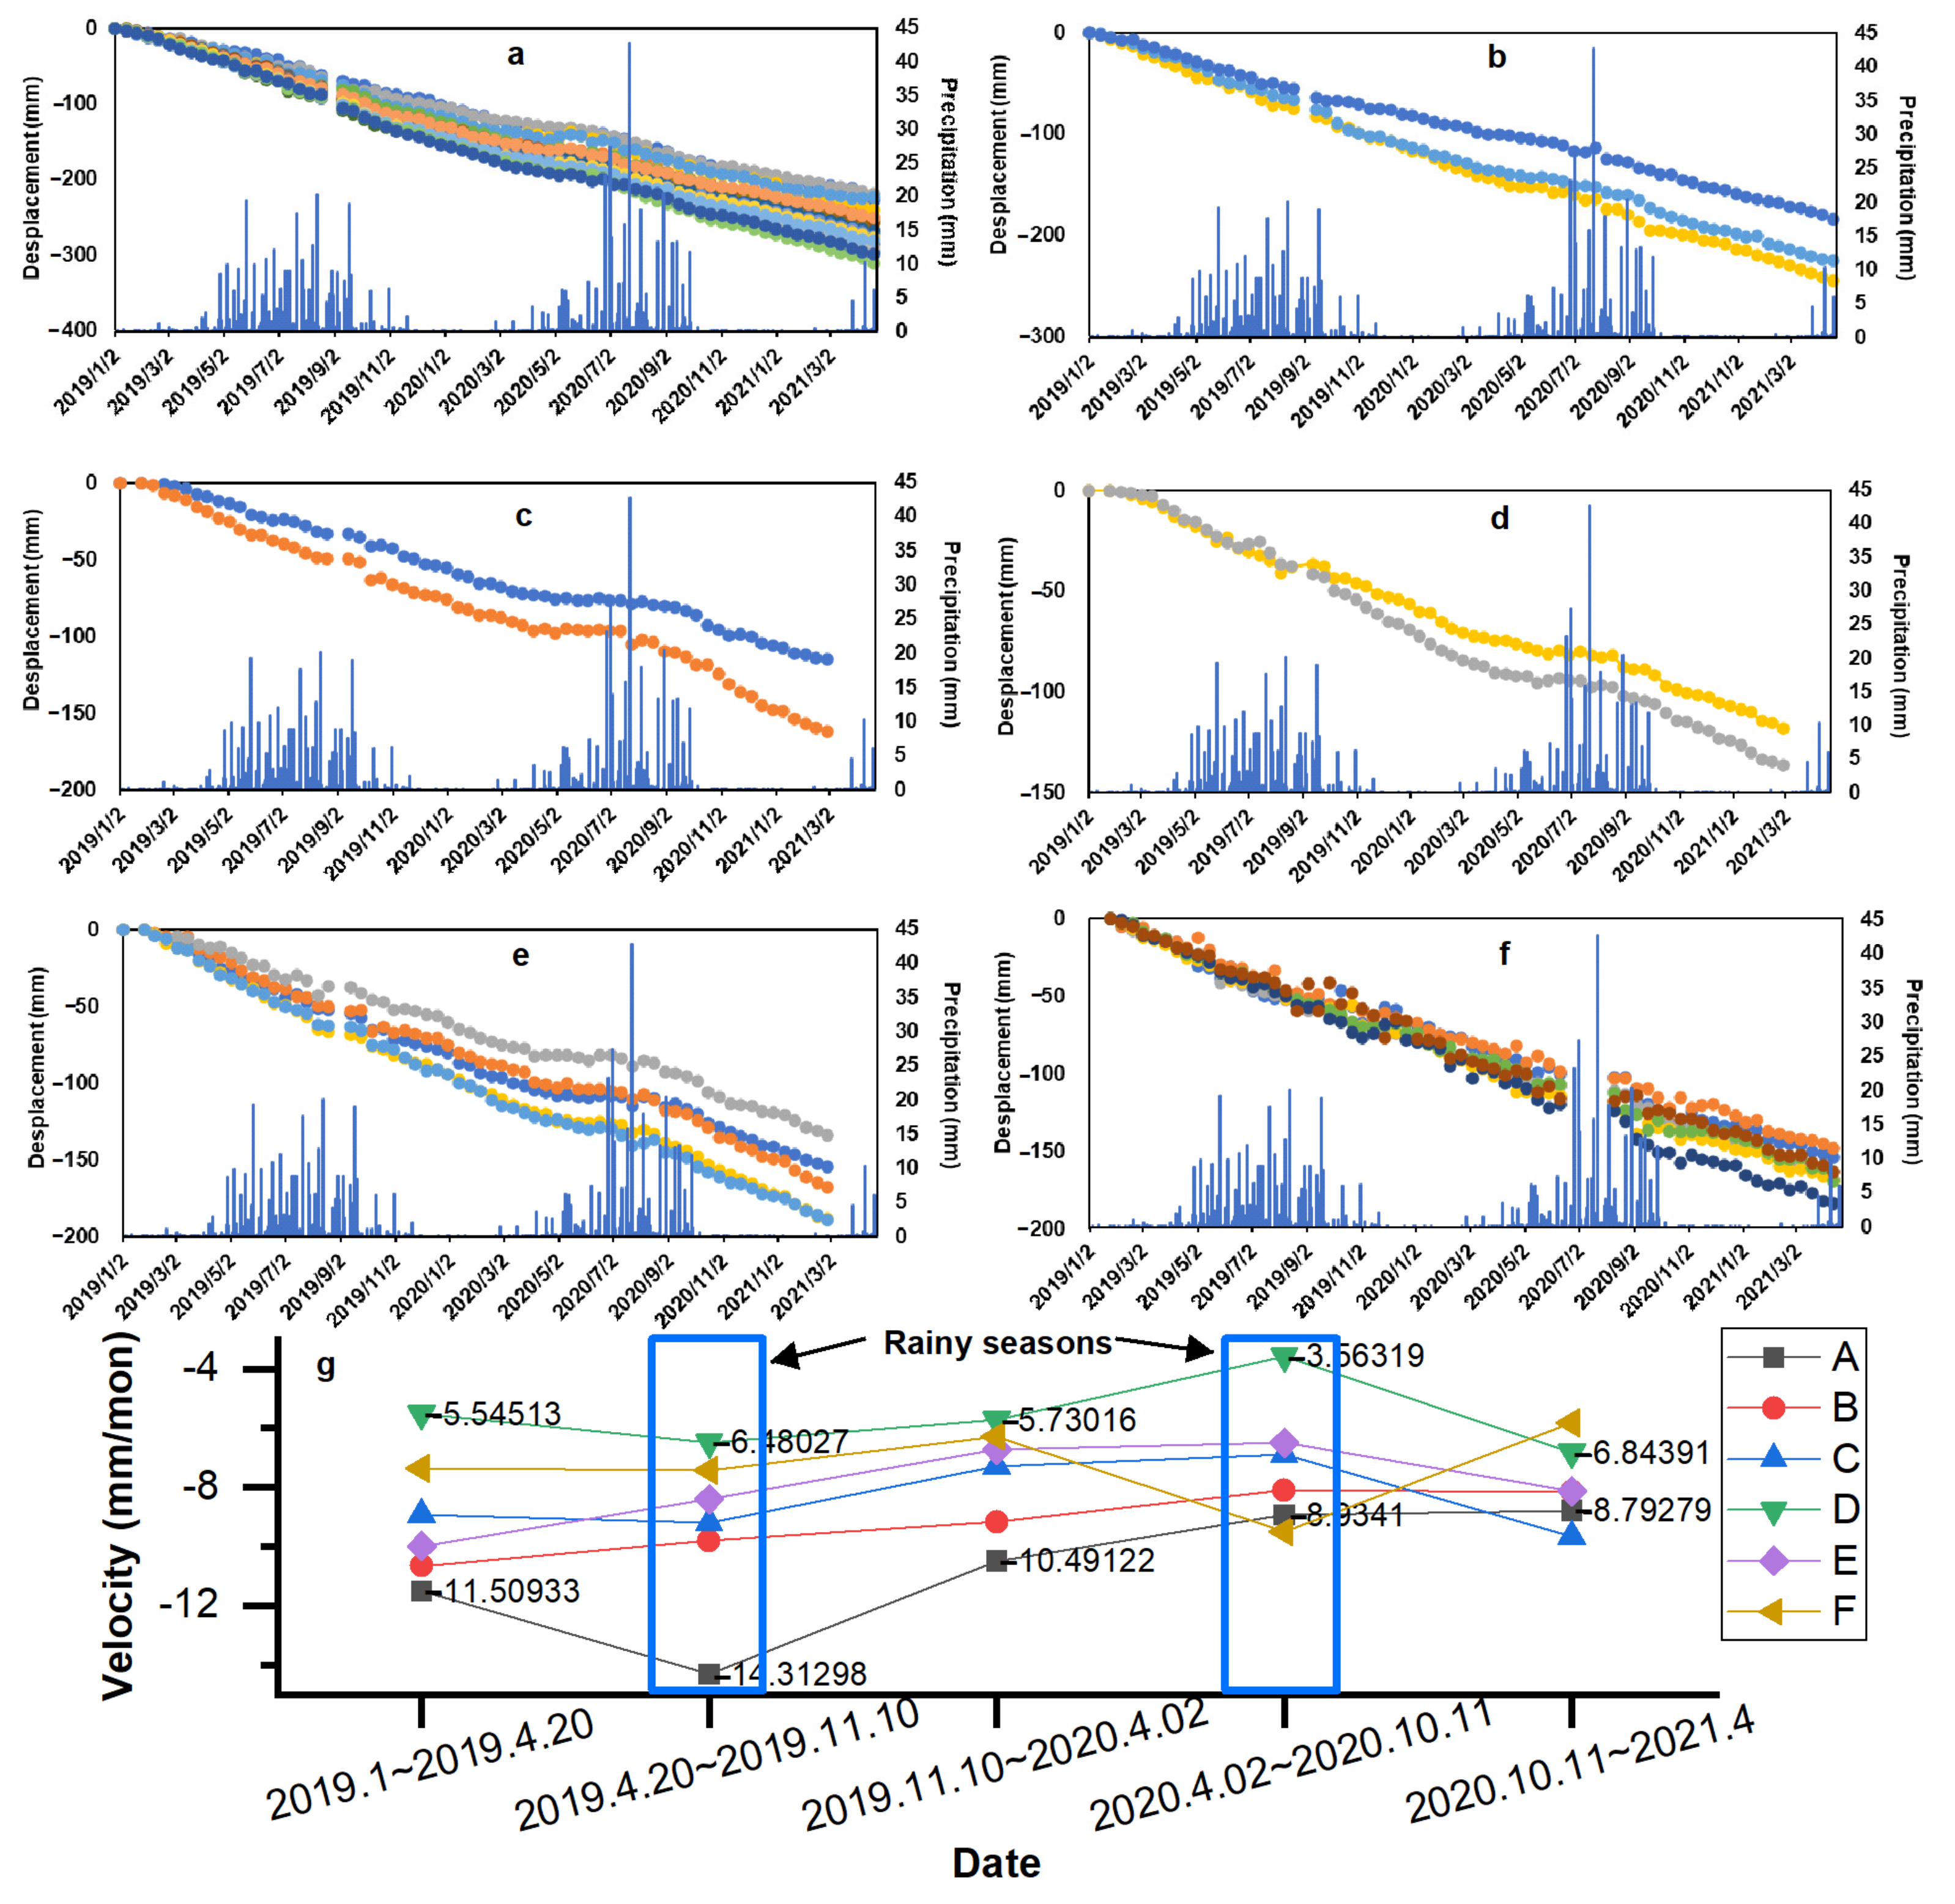
4.4. Deformation Characteristics of the Lijia Gorge Landslides Group

High-resolution optical images from the third phase TripleSat-2 satellite (3:31 UTC on 26 July 2019; 3:13 UTC on 24 November 2020; and 3:14 UTC on 19 February 2021) revealed the change characteristics of the Lijia Gorge landslide group (Figure 8a–c). The sun-incidence angles were similar among the images, and changes in shadows primarily reflected terrain changes. As shown in Figure 8a, there were no shadows in the image obtained on 26 July 2019. From Figure 8b,c, the shadows became increasingly evident on 24 November 2020, and 19 February 2021, in the centers of the No. I, No. II, and No. V landslides, and the rear of the No. VI landslide. These changes qualitatively reflect the downward movement of the slopes.
Although affected by the shadow, surface features of the landslide bodies could still be identified from the multistage images. Landslides No. I, No. IV, No. V, and No. VI showed prominent scarps and gullies stemming from the same source developed along both sides. Landslide No. II had a main scarp and cracks. Significant debris flows existed on the surface of the No. III landslide. There were multilevel steps on these slopes and different degrees of disintegration at the front edges of the slopes.
We identified landslide No. I as having the most typical deformation characteristics of the Lijia Gorge landslide group based on multistage optical remote sensing images. The No. I landslide body was chair-shaped (Figure 8d). Tension cracks were observed on the rear side of the slope. The slope was steeper in the center and the height difference varied significantly. The front part had accumulations adjacent to the Yellow River and was affected by river erosion and the fluctuating reservoir water level. The foot of the slope was collapsed, and many gullies were developed on its surface. As shown in Figure 8e, the cracks at the rear side of landslide No. I on 26 July 2019, appeared as thin lines that were difficult to measure; the length of the cracks was approximately 36 m, calculated directly from the image. On 24 November 2020 (Figure 8f), the length of the cracks was approximately 46 m, and the width was approximately 1.5 m. On 19 February 2021 (Figure 8g), the length of the cracks was approximately 52 m, and the width was approximately 2.2 m. These significant increases in the length and width of the cracks confirmed the continuous activity of the slope.
InSAR deformation was observed in both ascending and descending LOS directions, suggesting that the deformation of each landslide within the Lijia Gorge landslide group increased gradually. In the ascending InSAR results, the deformation of the No. I and VI landslides increased from 20 July 2019, to 15 February 2021 (Figure 9a–c). In the descending InSAR results, deformation of the No. II, III, IV, and V landslides increased from 25 July 2019, to 20 February 2021 (Figure 9d–f). Overall, when both ascending and descending data were considered, the No. I and VI landslides continued to deform between 2019 and 2021. The No. II, III, IV, and V landslides were partly deformed, with deformation concentrated on the rear side of the No. II landslide, the foot of the No. III landslide, and the center of the No. IV and No. V landslides.
Using InSAR technology, deformation time-series data were obtained in the ascending and descending LOS directions. Deformation of the No. III and No. VI landslides were apparent only in the ascending LOS direction (Figure 9a,b). We then applied time-series InSAR results with the ascending orbit only to analyze the deformation characteristics of the two landslides. Deformation of the No. I, II, IV, and V landslides was evident in the InSAR descending LOS direction, but not in the ascending LOS direction. We then applied time-series InSAR results with the descending orbit only to analyze the multi-temporal deformation characteristics of the four landslides.
Figure 10 and Table 3 show the multi-series deformation results for different landslides within the Lijia Gorge landslide group. Time-series deformation results showed that the Lijia Gorge landslide group sustained deformation from January 2019 to April 2021.
Overall, the deformation rates of the Lijia Gorge landslide group were relatively stable. Among the landslides, part of the No. I landslide shown in Figure 9a exhibited the most rapid deformation and most significant cumulative deformation; its InSAR deformation characteristics and optical image change characteristics over the time series had good consistency (Figure 8 and Figure 9). The No. I and No. VI landslides moved integrally with maximum LOS displacement rates of 152 mm/a and 116 mm/a, respectively. The No. I landslide had movement in both the vertical and E–W directions. The No. VI landslide primarily moved eastward, with a slight movement in the vertical direction (Figure 7e–f). The remaining landslides in the Lijia Gorge landslide group slowly deformed at a uniform speed, with a maximum LOS displacement rate of 66–106 mm/a.

5. Discussion

5.1. Deformation Impact Factors

During the observation period, displacements of the Lijia Gorge landslide group had no distinct relationships with daily precipitation (2 January 2019 to 15 April 2021; https://gpm.nasa.gov (accessed on 10 August 2022); Figure 10a–f). For example, slope velocities remained stable before and after the rainy season (January 2019 to April 2019, November 2019 to April 2020, and October 2020 to April 2021), indicating that precipitation in the area exerted little impact on the slope activity. Taking the No. I and No. VI landslides as examples, the LOS monthly velocity of the No. I landslide increased by 2.80 mm/month in the 2019 rainy season and decreased by 1.56 mm/month in the 2020 rainy season (Figure 10g). The LOS monthly velocity of the No. VI slope increased by 0.08 and 3.23 mm/month in the 2019 and 2020 rainy seasons, respectively. The velocity variations of other landslides in the Lijia Gorge landslide group between the rainy and dry seasons were <2.17 mm/month. Slight deformation rate changes (<4 mm/month) before and after rainy seasons provide further evidence that precipitation exerted little impact on slope activity.
The displacement velocities of most landslides slowed from May to August 2020. During this period, water infiltrated the rock cracks and changed the pore water pressure, which in turn decreased the stability of the slopes [36,37]. As the Lijia Gorge landslide group is located on the banks of the Lijia Gorge Reservoir, we suggest that the slower movement was associated with changes in water level and moisture; precipitation changes the water level in the reservoir, which affects slope stress condition. This is consistent with many other reservoir landslides [38,39], such as the Muyubao landslide alongside the Yangtze River (China), and the Lorenzo-1 and Rules Viaduct landslides of the Rules Reservoir, southern Spain. Based on the continuous uniform deformation characteristics, we suggest that the triggering factors of the Lijia Gorge landslide group are primarily gravity and river erosion.
Figure 10. (af) Multi-series deformation of points corresponding to the areas shown in Figure 9g,h. (g) Velocity characteristics before and after the rainy season for the areas shown in Figure 9g,h.
Water 15 00769 g010

5.2. Deformation Results from Two InSAR Techniques

Owing to variations in satellite flight direction, radar orientation, and slope inclination, ascending and descending InSAR results show deformation differences. In practical active landslide detection, the significance of these differences must be analyzed and generalized. For the Lijia Gorge landslide group, located on the right bank of the Lijia Gorge Reservoir, deformation anomalies were apparent in InSAR results from both ascending and descending orbits (Figure 7a–d). Among the active landslides detected, 87 were detected based on deformation in both the ascending and descending images, 7 could only be detected in ascending images, and 9 could only be detected in descending images. The missing detection rates were 6.79% and 8.73%, based on InSAR results using ascending or descending LOS directions only, respectively.
In the ascending InSAR results (Figure 7a,c), the rear side of the No. I and No. II landslide bodies, the toe of the No. III landslide, the central and lower parts of the No. IV and No. V landslide bodies, and the entire No. VI landslide body underwent deformation. In the descending InSAR results (Figure 7b,d), significant deformation occurred on the entire No. I landslide body, the rear of the No. II landslide body, the toe of the No. III landslide, the entirety of the No. IV and No. V landslide bodies, and the left portion of the No. VI landslide body.
However, the STACKING and IPTA techniques revealed different deformation characteristics in terms of scale and range (Figure 7b,d). The IPTA results were more refined than the STACKING results in the ascending LOS direction, while both sets of results were similar for descending LOS (Figure 7a,c). We found that 97.08% of the active landslides identified showed deformation in the InSAR results of both techniques, which confirms the suitability of both approaches. The remaining differences highlight the advantage of IPTA in detecting small-scale deformation. However, our results differ from those of a past study in which the two techniques showed apparent differences in southwestern Sichuan Province, China [31]; these differences arose from the geographical conditions. As such, the applicability of each InSAR approach needs to be verified before active landslide investigation in a given region.

5.3. Integrated Framework for Detecting Active Landslides along the Upper Yellow River

InSAR has clear advantages in quantifying landslide deformation [9,11]; however, it cannot reveal the source information about deformation, for which qualitative analysis technologies are need. The lack of standards and accepted defined best practices in landslide interpretation limit the accuracy of landslides detection [33]. In the study area, we found that deformation is primarily distributed on the banks of the Yellow River, terraces, and river valleys. This deformation can be classified into two types: geohazard- and non–geohazard-related. Geohazard-related deformation is caused by geological activity, whereas non–geohazard-related deformation is related to engineering activities, dune movement, noise, and other non–geohazard-related factors. Using multi-series high-resolution spectral images and DEM, we were able to distinguish deformation types and exclude non–geohazard-related deformation from further analysis. Large-scale deformation on the left bank of the Longyang Gorge Reservoir was primarily caused by dune movement. Deformation on the shore of the Yellow River in Degui County was found to be related to irrigation. As shown in Figure 7, geohazard-related deformation was associated with terrain and textural features in the high-resolution images. The detailed well-defined interpretation criteria summarized will contribute to landslides mapping this region.
Previous field studies have identified 33 landslides along the Yellow River from Chana village to Lijia Gorge [40]. Among them, 25 are consistent with the results identified in this study, with an overlap rate of 75.8%, verifying the accuracy of the results detected.
Landslides of the Lijia Gorge landslide group primarily move in the NEE and NWW directions; movement in the S–N direction is not significant. However, many slopes do have a S–N direction along the upper reaches of the Yellow River. To detect deformation in the S–N direction effectively, InSAR detection over more orbits or other deformation detection technologies need to be adopted. Long-term time-series observations of the Lijia Gorge landslide group are required to fully analyze the deformation mechanisms of the slopes further.

6. Conclusions

Based on Sentinel-1 ascending and descending images, high-resolution optical images, and InSAR data, active landslides along the upper reaches of the Yellow River (from Longyang Gorge to Lijia Gorge) were detected. The main conclusions are as follows:
(1)
Using Sentinel-1 images and high-resolution optical images, well-defined interpretation criteria of active landslides in the study area were summarized, and 103 active landslides were detected. The coincidence rate with the previous survey results was 76.8%, thereby verifying the availability of the integrated framework for detecting active landslides in the Upper Yellow River.
(2)
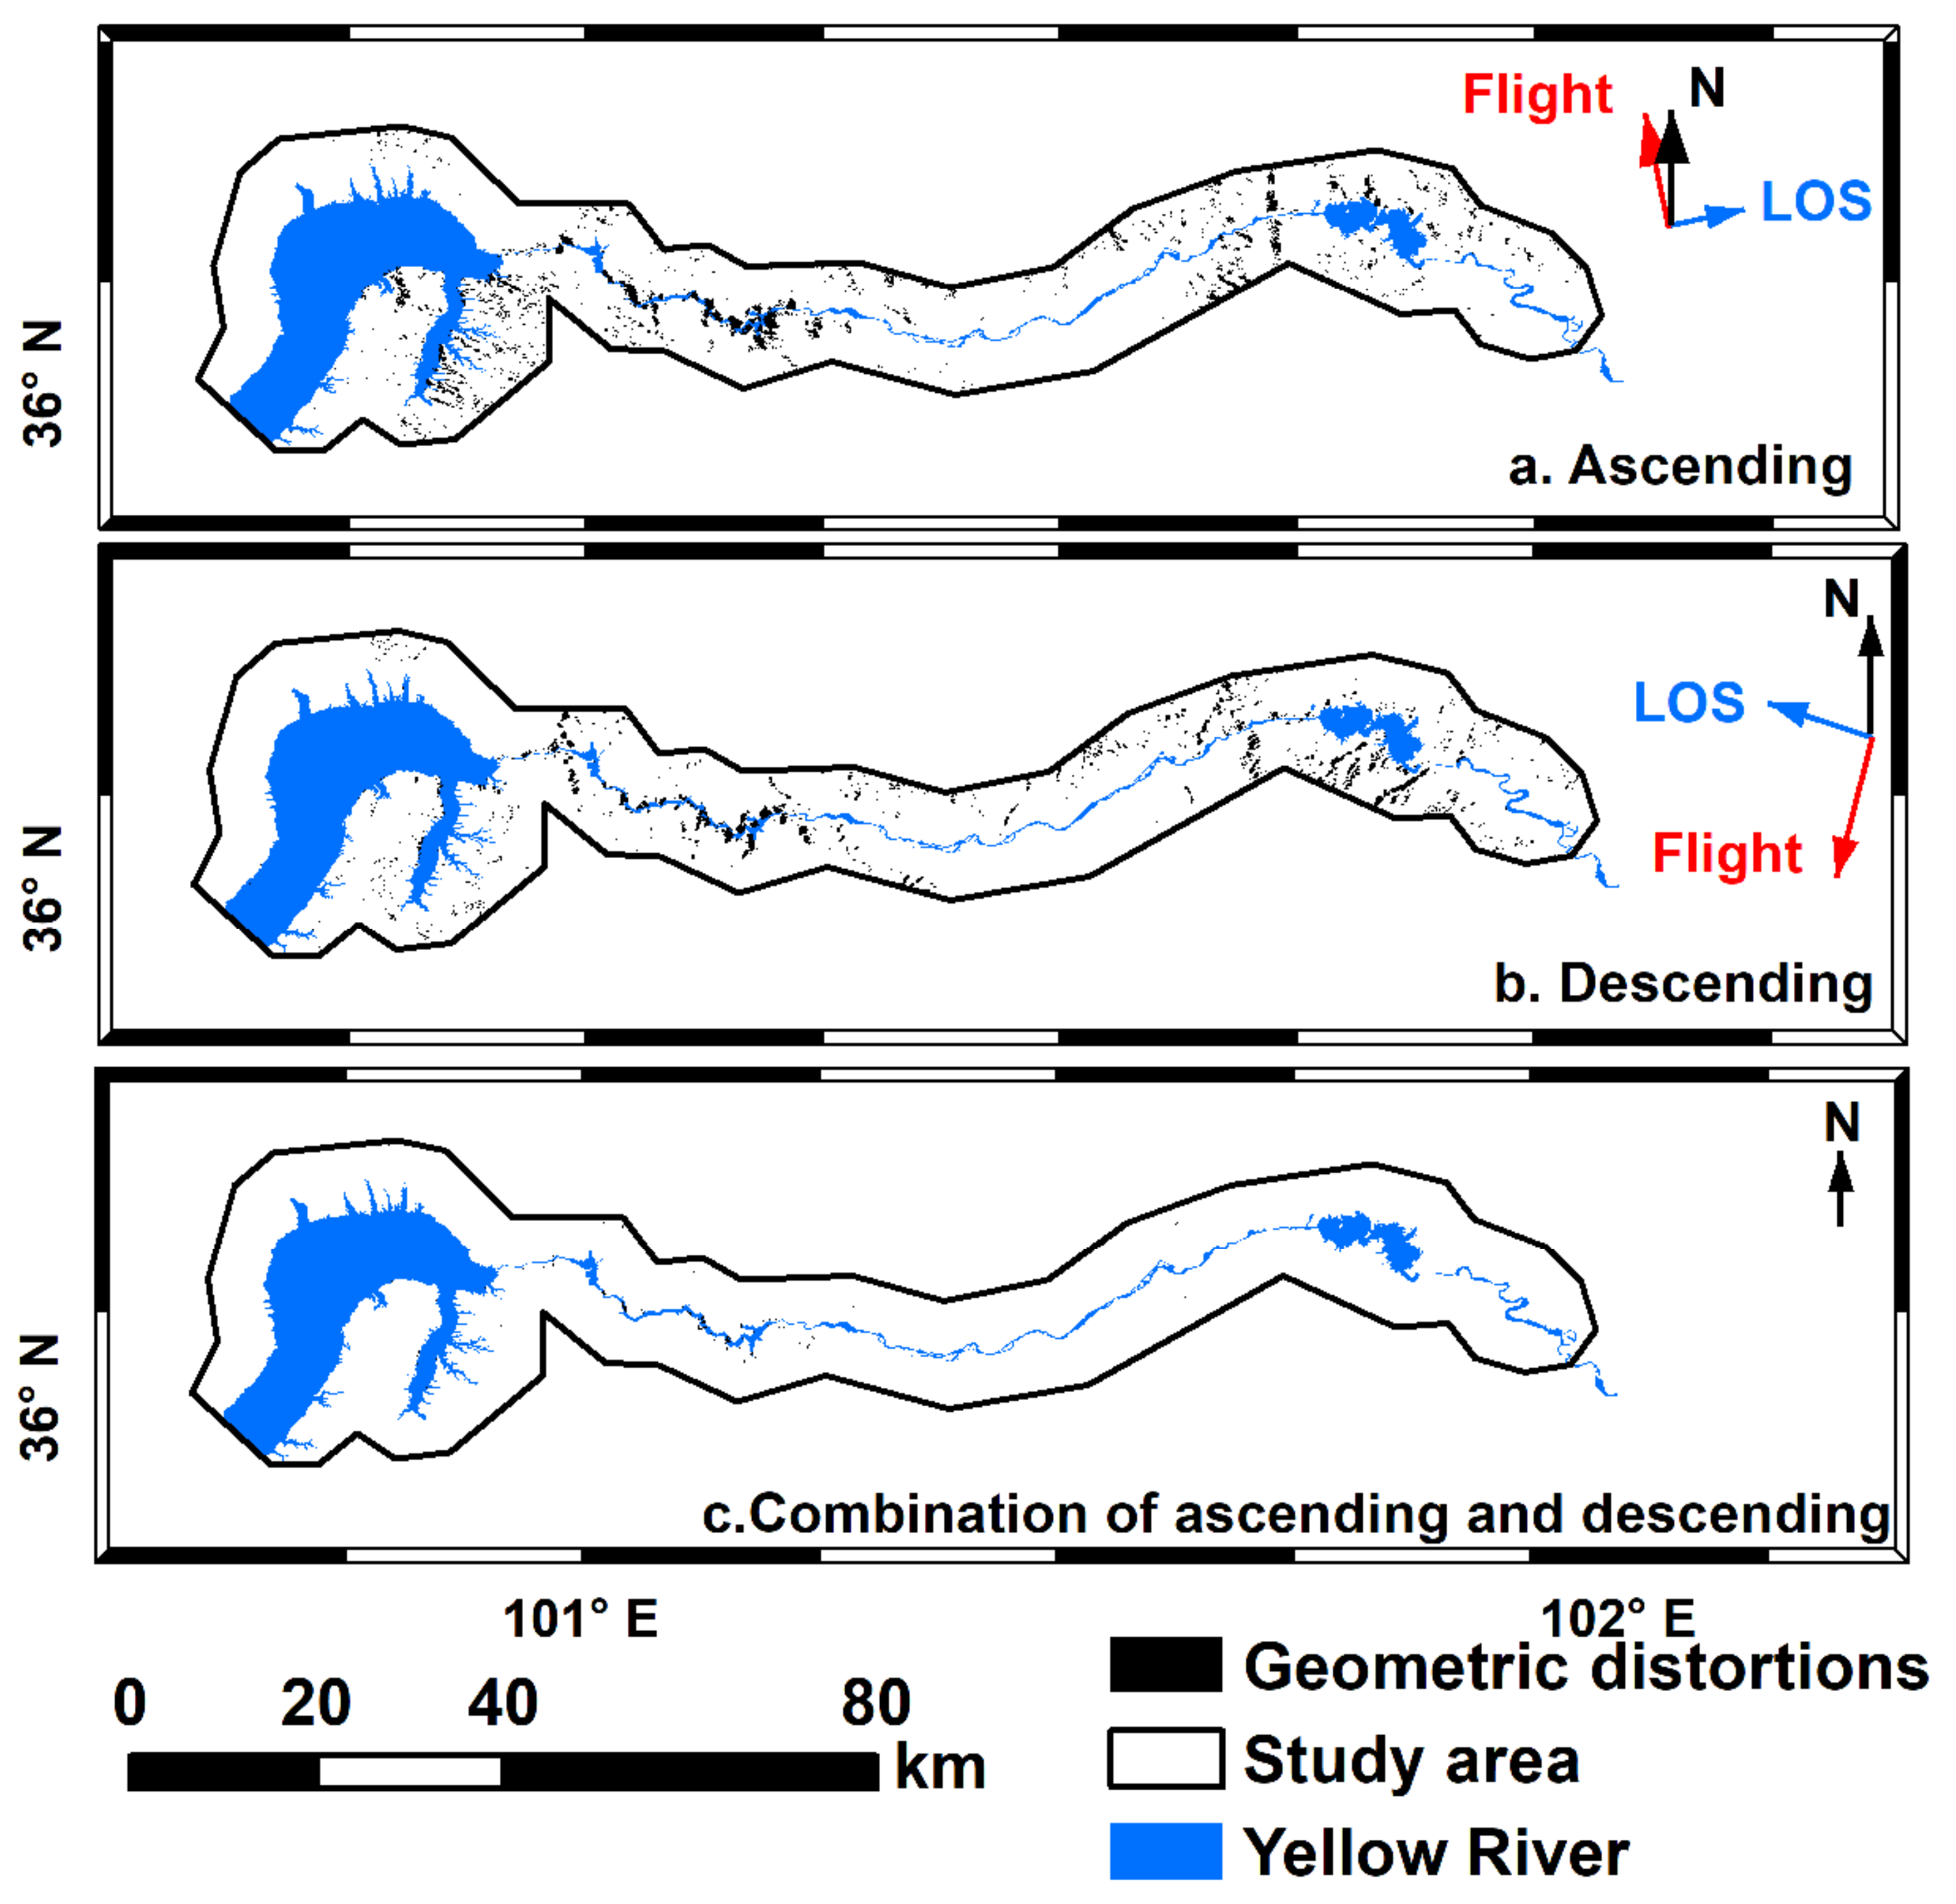
Among the detected active landslides, 87 were detected based on deformation in both ascending and descending images, 7 could only be detected in ascending images, and 9 could only be detected in descending images. The results indicate that active landslides can remain undetected in single-orbit radar data. The combination of ascending and descending radar images improves our ability to detect active landslides in alpine gorge regions. The comparison of two InSAR methods showed very similar landslide detection results.
(3)
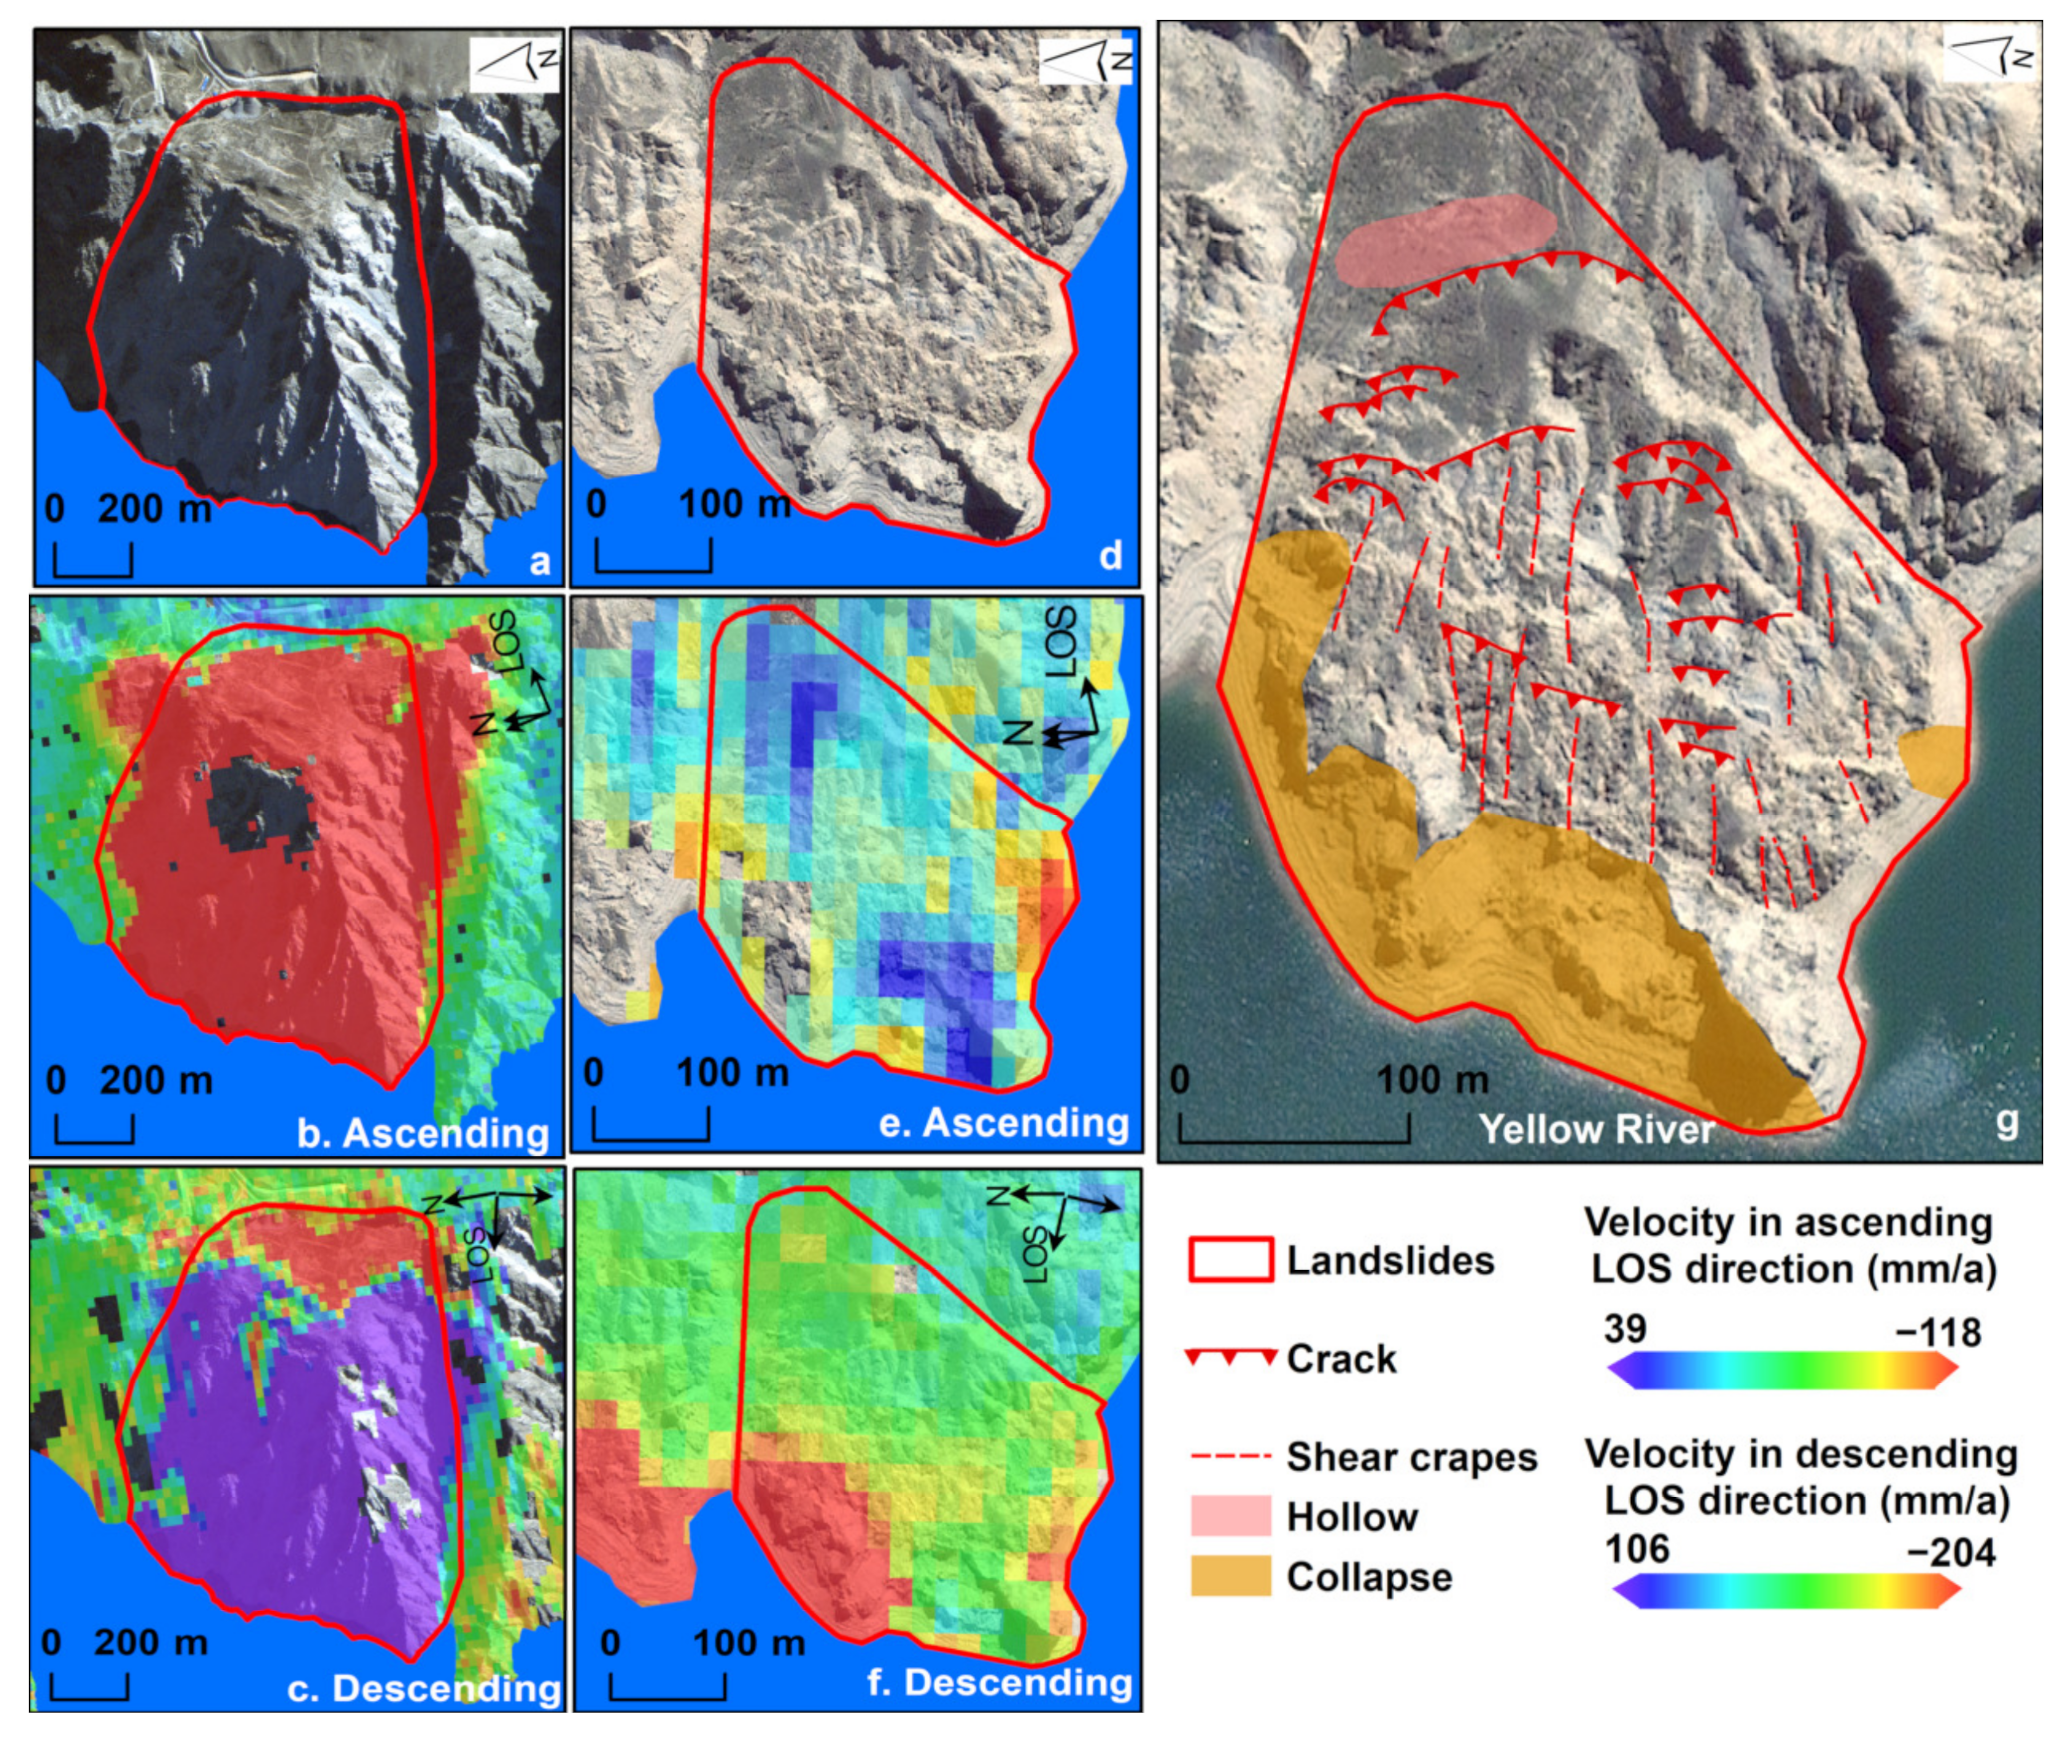
InSAR deformation and temporal changes in surface morphology confirmed that the Lijia Gorge landslide group is active. Among the landslides within the group, the No. I and No. VI landslides move rapidly, with maximum LOS displacement rates of 152 and 116 mm/a, respectively. The No. I landslide has significant deformation in the E–W and vertical directions. The No. VI landslide primarily moves eastward, but downward movement is not apparent. River erosion and gravity are the main triggering factors; however, rainfall has no significant impact on deformation. Based on our results, the stability of these two landslides must be closely monitored.
(4)
The results of this study confirm the importance of combining multiple remote sensing techniques for the detection and analysis of active landslides. The well-defined interpretation criteria summarized in the present study could facilitate the detection and mapping of active landslides in Upper Yellow River area.

Author Contributions

Conceptualization, K.T. and S.Y.; methodology, K.T.; validation, J.Z.; formal analysis, K.T. and J.Z.; investigation, K.T.; data curation, C.H.; writing—original draft preparation, K.T.; writing—review and editing, J.G.; visualization, C.H.; supervision and project administration, S.Y.; funding acquisition, S.Y. All authors have read and agreed to the published version of the manuscript.

Funding

This research was funded by the National Key Research and Development Program of China (No. 2019YFC1509603 & 2021YFE0116800) and the Key R&D projects of Anhui Province of China (No. 2022m07020014).

Institutional Review Board Statement

Not applicable.

Informed Consent Statement

Not applicable.

Acknowledgments

The authors thank ESA for Sentinel-1 data, NASA for 30 m Shuttle Radar Topography Mission digital elevation model and Global Precipitation Measurement (GPM) data, and Twenty First Century Aerospace Technology Co., Ltd. for optical images. The authors also thank the reviewers and editors for their suggestions.

Conflicts of Interest

The authors declare no conflict of interest.

References

  1. Froude, M.J.; Petley, D.N. Global fatal landslide occurrence from 2004 to 2016. Nat. Hazard. Earth Syst. Sci. 2018, 18, 2161–2181. [Google Scholar] [CrossRef] [Green Version]
  2. Zhao, B.; Wang, Y.; Chen, M.; Luo, Y.; Liang, R.; Li, J. Typical characteristics of large-scale landslides in the transition belt between the Qinghai-Tibet Plateau and the Loess Plateau. Arab. J. Geosci. 2019, 12, 470. [Google Scholar] [CrossRef]
  3. Yin, Z.; Qin, X.; Yin, Y.; Zhao, W.; Wei, G. Landslide Developmental Characteristics and Response to Climate Change since the Last Glacial in the Upper Reaches of the Yellow River, NE Tibetan Plateau. Acta Geol. Sin. 2014, 88, 635–646. [Google Scholar] [CrossRef]
  4. Carla, T.; Intrieri, E.; Raspini, F.; Bardi, F.; Farina, P.; Ferretti, A.; Colombo, D.; Novali, F.; Casagli, N. Perspectives on the prediction of catastrophic slope failures from satellite InSAR. Sci. Rep. 2019, 9, 14137. [Google Scholar] [CrossRef] [Green Version]
  5. Griffiths, J. Proving the occurrence and cause of a landslide in a legal context. Bull. Eng. Geol. Environ. 1999, 58, 75–85. [Google Scholar] [CrossRef]
  6. Xu, Q.; Dong, X.J.; Li, W.L. Integrated Space-Air-Ground Early Detection, Monitoring and Warning System for Potential Catastrophic Geohazards. Geomat. Inf. Sci. Wuhan Univ. 2019, 44, 957–966. [Google Scholar] [CrossRef]
  7. Xu, Q. Understanding and Consideration of Related Issues in Early Identification of Potential Geohazards. Geomat. Inf. Sci. Wuhan Univ. 2020, 45, 1651–1659. [Google Scholar] [CrossRef]
  8. Ge, D.Q.; Dai, K.R.; Guo, Z.C.; Li, Z.H. Early Identification of Serious Geological Hazards with Integrated Remote Sensing Technologies: Thoughts and Recommendations. Geomat. Inf. Sci. Wuhan Univ. 2019, 44, 949–956. [Google Scholar]
  9. Crippa, C.; Valbuzzi, E.; Frattini, P.; Crosta, G.B.; Spreafico, M.C.; Agliardi, F. Semi-automated regional classification of the style of activity of slow rock-slope deformations using PS InSAR and SqueeSAR velocity data. Landslides 2021, 18, 2445–2463. [Google Scholar] [CrossRef]
  10. Urgilez Vinueza, A.; Handwerger, A.L.; Bakker, M.; Bogaard, T. A new method to detect changes in displacement rates of slow-moving landslides using InSAR time series. Landslides 2022, 19, 2233–2247. [Google Scholar] [CrossRef]
  11. Cascini, L.; Fornaro, G.; Peduto, D. Advanced low- and full-resolution DInSAR map generation for slow-moving landslide analysis at different scales. Eng. Geol. 2010, 112, 29–42. [Google Scholar] [CrossRef]
  12. Sandwell, D.T.; Price, E.J. Phase gradient approach to stacking interferograms. J. Geophys. Res. Solid Earth 1998, 103, 30183–30204. [Google Scholar] [CrossRef] [Green Version]
  13. Ferretti, A.; Prati, C.; Rocca, F. Nonlinear subsidence rate estimation using permanent scatterers in differential SAR interferometry. IEEE Trans. Geosci. Remote Sens. 2000, 38, 2202–2212. [Google Scholar] [CrossRef] [Green Version]
  14. Ferretti, A.; Prati, C.; Rocca, F. Permanent Scatterers in SAR Interferometry. IEEE Trans. Geosci. Remote Sens. 2001, 39, 8–20. [Google Scholar] [CrossRef]
  15. Berardino, P.; Fornaro, G.; Lanari, R.; Sansosti, E. A new algorithm for surface deformation monitoring based on small baseline differential SAR interferograms. IEEE Trans. Geosci. Remote Sens. 2002, 40, 2375–2383. [Google Scholar] [CrossRef] [Green Version]
  16. Ferretti, A.; Fumagalli, A.; Novali, F.; Prati, C.; Rocca, F.; Rucci, A. A New Algorithm for Processing Interferometric Data-Stacks: SqueeSAR. IEEE Trans. Geosci. Remote Sens. 2011, 49, 3460–3470. [Google Scholar] [CrossRef]
  17. Perissin, D.; Wang, T. Repeat-Pass SAR Interferometry With Partially Coherent Targets. IEEE Trans. Geosci. Remote Sens. 2012, 50, 271–280. [Google Scholar] [CrossRef]
  18. Zhu, J.J.; Li, Z.W.; Hu, J. Research Progress and Methods of InSAR for Deformation Monitoring. Acta Geod. Cartogr. Sin. 2017, 46, 1717–1733. [Google Scholar] [CrossRef]
  19. He, K.; Liu, B.; Hu, X.; Zhou, R.; Xi, C.; Ma, G.; Han, M.; Li, Y.; Luo, G. Rapid Characterization of Landslide-Debris Flow Chains of Geologic Hazards Using Multi-method Investigation: Case Study of the Tiejiangwan LDC. Rock Mech. Rock Eng. 2022, 55, 5183–5208. [Google Scholar] [CrossRef]
  20. Ding, C.; Feng, G.; Liao, M.; Tao, P.; Zhang, L.; Xu, Q. Displacement history and potential triggering factors of Baige landslides, China revealed by optical imagery time series. Remote Sens. Environ. 2021, 254, 112253. [Google Scholar] [CrossRef]
  21. Zhang, C.S.; Zhang, Y.C.; Ma, Y.S.; Hu, J.J.; Gao, Q.Z. Distribution Regularity and Regionalization of Geological Hazards in the Upper Yellow River Valley. Acta Geosci. Sin. 2003, 24, 155–160. [Google Scholar]
  22. Li, X.L.; Guo, X.H.; Li, W.H. Mechanism of Giant Landslides from Longyangxia Valley to Liujiaxia Valley Along Upper Yellow River. J. Eng. Geol. 2011, 19, 516–529. [Google Scholar]
  23. Li, X.L.; Ma, J.Q.; Hu, G.S. Genetic analysis on huge landslides along the section from Longyang Gorge to Liujia Gorge of the Yellow River. Chin. J. Geol. Hazard Control 2007, 18, 28–32. [Google Scholar]
  24. Shi, X.G.; Zhang, L.; Tang, M.G.; Li, M.H.; Liao, M.S. Investigating a reservoir bank slope displacement history with multi-frequency satellite SAR data. Landslides 2017, 14, 1961–1973. [Google Scholar] [CrossRef]
  25. Li, M.H.; Zhang, L.; Shi, X.G.; Liao, M.S.; Yang, M. Monitoring active motion of the Guobu landslide near the Laxiwa Hydropower Station in China by time-series point-like targets offset tracking. Remote Sens. Environ. 2019, 221, 80–93. [Google Scholar] [CrossRef]
  26. Zhang, D.; Wang, G.; Yang, T.; Zhang, M.; Chen, S.; Zhang, F. Satellite remote sensing-based detection of the deformation of a reservoir bank slope in Laxiwa Hydropower Station, China. Landslides 2012, 10, 231–238. [Google Scholar] [CrossRef] [Green Version]
  27. Lin, P.; Liu, X.; Hu, S.; Li, P. Large Deformation Analysis of a High Steep Slope Relating to the Laxiwa Reservoir, China. Rock Mech. Rock Eng. 2016, 49, 2253–2276. [Google Scholar] [CrossRef]
  28. Bai, J.G.; Lv, S.D.; Han, J.S. Stability prediction of reservoir landslide of Lijiaxia Hydropower station before and after reservoir impounding. Rock Soil Mech. 2008, 29, 1723–1731. [Google Scholar] [CrossRef]
  29. Price, E.J.; Sandwell, D.T. Small-scale deformations associated with the 1992 Landers, California, earthquake mapped by synthetic aperture radar interferometry phase gradients. J. Geophys. Res. Solid Earth 1998, 103, 27001–27016. [Google Scholar] [CrossRef]
  30. Strozzi, T.; Wegmuller, U.; Werner, C.; Wiesmann, A. Measurement of Slow Uniform Surface Displacement with mm/year Accuracy. In Proceedings of the IEEE 2000 International Geoscience and Remote Sensing Symposium, Honolulu, HI, USA, 24–28 July 2000. [Google Scholar]
  31. Zhang, L.L.; Dai, K.R.; Deng, J.; Ge, D.Q.; Liang, R.B.; Li, W.L.; Xu, Q. Identifying Potential Landslides by Stacking-InSAR in Southwestern China and Its Performance Comparison with SBAS-InSAR. Remote Sens. 2021, 13, 3662. [Google Scholar] [CrossRef]
  32. Werner, C.; Wegmüller, U.; Strozzi, T.; Wiesmann, A. Interferometric Point Target Analysis for Deformation Mapping. In Proceedings of the IGARSS 2003. 2003 IEEE International Geoscience and Remote Sensing Symposium. Proceedings (IEEE Cat. No.03CH37477), Toulouse, France, 21–25 July 2003. [Google Scholar]
  33. Guzzetti, F.; Mondini, A.C.; Cardinali, M.; Fiorucci, F.; Santangelo, M.; Chang, K.-T. Landslide inventory maps: New tools for an old problem. Earth Sci. Rev. 2012, 112, 42–66. [Google Scholar] [CrossRef] [Green Version]
  34. Wright, T.J. Toward mapping surface deformation in three dimensions using InSAR. Geophys. Res. Lett. 2004, 31, L01607. [Google Scholar] [CrossRef] [Green Version]
  35. Hu, B.; Li, Z. Time-Series InSAR Technology for Ascending and Descending Orbital Images to Monitor Surface Deformation of the Metro Network in Chengdu. IEEE J. Sel. Top. Appl. Earth Obs. Remote Sens. 2021, 14, 12583–12597. [Google Scholar] [CrossRef]
  36. Confuorto, P.; Di Martire, D.; Centolanza, G.; Iglesias, R.; Mallorqui, J.J.; Novellino, A.; Plank, S.; Ramondini, M.; Thuro, K.; Calcaterra, D. Post-failure evolution analysis of a rainfall-triggered landslide by multi-temporal interferometry SAR approaches integrated with geotechnical analysis. Remote Sens. Environ. 2017, 188, 51–72. [Google Scholar] [CrossRef]
  37. Paronuzzi, P.; Rigo, E.; Bolla, A. Influence of filling–drawdown cycles of the Vajont reservoir on Mt. Toc slope stability. Geomorphology 2013, 191, 75–93. [Google Scholar] [CrossRef]
  38. Zhou, C.; Cao, Y.; Yin, K.; Wang, Y.; Shi, X.; Catani, F.; Ahmed, B. Landslide Characterization Applying Sentinel-1 Images and InSAR Technique: The Muyubao Landslide in the Three Gorges Reservoir Area, China. Remote Sens. 2020, 12, 3385. [Google Scholar] [CrossRef]
  39. Reyes-Carmona, C.; Barra, A.; Galve, J.P.; Monserrat, O.; Pérez-Peña, J.V.; Mateos, R.M.; Notti, D.; Ruano, P.; Millares, A.; López-Vinielles, J.; et al. Sentinel-1 DInSAR for Monitoring Active Landslides in Critical Infrastructures: The Case of the Rules Reservoir (Southern Spain). Remote Sens. 2020, 12, 809. [Google Scholar] [CrossRef] [Green Version]
  40. Shi, L.Q.; Wei, G.; Yin, Z.Q.; Yuan, C.D.; Wu, X.N.; Li, Z.C. Characteristics and formation of Simencun Landslides in Jianzha Basin of Qinghai province. Chin. J. Geol. Hazard Control 2020, 31, 15–21. [Google Scholar] [CrossRef]
Figure 1. Nested study area maps. Red and green boxes in (a) denote the footprints of ascending and descending Sentinel-1 images, respectively. (b) shows the location of the study area. (c) show the optical images’ location.
Water 15 00769 g001
Figure 2. Framework of active landslide detection and deformation analysis.
Water 15 00769 g002
Figure 3. Interpretation characteristics of active landslides from ascending and descending Sentinel-1 radar data. (a) optical image of Guobu landslide; (b,c) InSAR deformation in ascending and descending LOS direction of Guobu landslide; (d) optical image of Longyang landslide; (e,f) InSAR deformation in ascending and descending LOS direction of Longyang landslide; (g) interpretation features of Longyang landslide.
Water 15 00769 g003
Figure 4. Radar geometric distortion regions of Sentinel-1 satellite from ascending and descending orbits. (a) Synthetic aperture radar (SAR) geometric distortions of Sentinel-1 ascending images; (b) SAR geometric distortions of Sentinel-1 descending images; and (c) SAR geometric distortion following the combination of Sentinel-1 ascending and descending images.
Water 15 00769 g004
Figure 5. Annual interferometric synthetic aperture radar (InSAR) deformation rate maps of the study area. (a) Displacement rate in the ascending line-of-sight (LOS) direction acquired using the STACKING technique; (b) displacement rate in the descending LOS direction acquired using the STACKING technique; (c) displacement rate in the ascending LOS direction acquired using interferometric point target analysis (IPTA); and (d) displacement rate in the descending LOS direction acquired using IPTA.
Water 15 00769 g005
Figure 6. Distribution of active landslides detected in the study area. (a) Topography of the study area obtained from the Shuttle Radar Topography Mission (SRTM) 30 m digital elevation model (DEM); (b1g1) optical images of typical active landslides; (b2g2) deformation rates of typical active landslides in the ascending line-of-sight (LOS) direction; and (b3g3) deformation rates of typical active landslides in the descending LOS direction.
Water 15 00769 g006
Figure 7. Deformation of the Lijia Gorge landslide group. (a) Deformation in the ascending line-of-sight (LOS) direction acquired using the STACKING technique; (b) deformation in the descending LOS direction acquired using the STACKING technique; (c) deformation in the ascending LOS direction acquired using interferometric point target analysis (IPTA); (d) deformation in the descending LOS direction acquired using IPTA; (e) deformation in the E–W direction; and (f) vertical deformation.
Water 15 00769 g007
Figure 8. Multi-phase optical images of the Lijia Gorge landslide group. (a) Optical image of the Lijia Gorge landslide group on 26 July 2019, at 03:31:35 UTC. (b) Optical image of the Lijia Gorge landslide group on 24 November 2020, at 03:13:35 UTC. (c) Optical image of the Lijia Gorge landslide group on 19 February 2021, at 03:14:01 UTC. (d) Optical image of the No. I landslide on 19 February 2021, at 03:14:01 UTC. (eg) Optical images of a zoomed-in section (see white box in d) of the No. I landslide on (e) 26 July 2019, (f) 24 November 2020, and (g) 19 February 2021.
Water 15 00769 g008
Figure 9. Interferometric point target analysis (IPTA) results for the Lijia Gorge landslide group from ascending and descending orbits. (a) Deformation in the ascending line-of-sight (LOS) direction on 20 July 2019. (b) Deformation in the ascending LOS direction on 23 November 2020. (c) Deformation in the ascending LOS direction on 15 February 2021. (d) Deformation in the descending LOS direction on 25 July 2019. (e) Deformation in the descending LOS direction on 28 November 2020. (f) Deformation in the descending LOS direction on 20 February 2021. (g) Deformation velocity in the ascending LOS direction. (h) Deformation velocity in the descending LOS direction.
Water 15 00769 g009
Table 1. Sentinel-1 image parameters.
SatellitePolarizationStartEndPath IDTrackAverage Incident AngleNumber of Scenes
Sentinel-1VV2019-012021-0226Ascending43.627154
2019-012021-04128Ascending34.368666
2019-012021-0433Descending35.824170
Table 2. Basic parameters of optical images.
SatelliteImage TypeSpatial Revolution (m)Acquisition Time
Gaofen-2
(GF-2)
Optical image120201129
20191125
TripleSat-2
(BJ-2)
0.820181004, 20190726, 20190928, 20191103, 20191107, 20191219, 20200510, 20200516, 20200629, 20200726, 20200819, 20200918, 20201124, 20210128, 20210219, 20210506
Table 3. Deformation and stability of each landslide in the Lijia Gorge landslide group.
Landlside No.Corresponding FigureDeformation Rate (mm/a)Cumulative Movement (mm)Slope StabilityKey
IFigure 9a96–152220–310Water 15 00769 i001Water 15 00769 i002 Landslide moved integrally and rapidly
Water 15 00769 i003 Landslide slowly deformed at a uniform speed.
IIFigure 9b78–106185–250Water 15 00769 i004
IIIFigure 9c54–97128–232Water 15 00769 i005
IVFigure 9d55–66134–158Water 15 00769 i006
VFigure 9e64–87155–216Water 15 00769 i007
VIFigure 9f65–116154–199Water 15 00769 i008
Disclaimer/Publisher’s Note: The statements, opinions and data contained in all publications are solely those of the individual author(s) and contributor(s) and not of MDPI and/or the editor(s). MDPI and/or the editor(s) disclaim responsibility for any injury to people or property resulting from any ideas, methods, instructions or products referred to in the content.

