
Development of a Distributed Control System for the Hydrodynamic Processes of Aquifers, Taking into Account Stochastic Disturbing Factors


System Analysis and Control Department, Saint Petersburg Mining University, 199106 Saint Petersburg, Russia
*
Author to whom correspondence should be addressed.
Water 2023, 15(4), 770; https://doi.org/10.3390/w15040770
Submission received: 29 December 2022
/
Revised: 11 February 2023
/
Accepted: 13 February 2023
/
Published: 15 February 2023
(This article belongs to the Special Issue Advances in Aquifer Systems Analysis: Flows, Interactions, Quality Status, and Remediation)
Abstract
:Uncontrolled, intensive extraction of water from mineral water deposits can lead to negative consequences, the penetration of sewage beyond the water-resistant layers, the destruction of the structure of aquifers and the further loss of the mineral water source. This paper deals with the issues of control of hydrodynamic processes under random impacts in the aquifers of mineral water deposits using mathematical models. The analysis of the technological process of mineral water extraction and statistical analysis of retrospective monitoring data of the deposit were carried out in order to confirm the hypothesis of the stationarity of the processes under consideration. A mathematical model of hydrogeological processes occurring under random disturbances has been constructed. The influence of such disturbances is expressed in deviations of the head in the aquifer from the desired value. Controlling consists of maintaining the head of aquifers at a given level in order to preserve the hydro-mineral base of the region. Lumped and distributed controllers are proposed as corrective blocks, the parameters of which are calculated by frequency methods of controller synthesis. The use of a closed loop control system minimizes the influence of random effects.
1. Introduction
To date, there is active production of heavy water in mining companies, and the demand for it continues to grow. At the same time, uncontrolled intensive exploitation can cause negative changes in the aquifer complex: the penetration of sewage outside the aquifers or the disruption of the structure of aquifers. Therefore, it is necessary to consider hydrogeological processes as control objects with their inherent elements and control links, taking into account random effects occurring in a hydrogeological object. Random factors affecting the study object are: resource consumption per debit of water consumption, stochastic change in water flow rate, increased seismic activity [1,2,3,4,5,6].
When describing a mineral water deposit, its extent in space should be taken into account, as a result of which it is required to represent the control object as a system with distributed parameters. In addition, when studying the system, it is necessary to consider the influence of random factors on hydrogeological processes.
The most detailed basic information about the methods for constructing mathematical models of hydrological processes is found in the works of Gavich I.K., Antonov V.V., Lomakin E.A., Konosavsky P.K. and others. Their work has made a great contribution to the development of methods for constructing two-dimensional models. However, these works in their pure form cannot be used to build three-dimensional models of spatially distributed objects. Methodology for the analysis of distributed objects, in particular representation in the frequency domain, was carried out by such scientists as Butkovsky A.G., Sirazetdinov T.K. and others [7]. Among the studies of recent years in the field of control systems with distributed parameters, a significant role was played by the studies of Malkov A.V. and Pershin I.M., who, in their works solve the problems of improving the theoretical foundations of the management of hydro-geological objects [8]. In the study of stochastic systems, there are the works of many scientists, among which are Ostrem K., Evlanov L.G., Konstantinov V.M. and others. The listed works in the field of controls, both lumped [9,10,11] and distributed systems [12,13,14,15], do not address the analysis of stochastic processes in distributed control objects and specifically the control of hydrodynamic processes, taking into account the random nature of the change in object parameters.
Thus, the main tasks aimed at increasing the economic efficiency of mineral water extraction while minimizing the environmental threats [16,17] are the analysis of hydrogeological processes under random impacts, the search for control methods and algorithms, and the laws of optimal functioning of the technological process.
2. Topical Area Analysis and Formulation of the Problem
Analyzing hydrolithospheric processes as a control object, it is possible to reveal the structure of the interaction of aquifers in a hydrogeological object and identify parameters that may have a random change in time and complicate the process of maintaining pressure in the aquifer at a given level. Allowing the head to drop below the maximum acceptable rate, water from the upper aquifers begins to abundantly seep into the lower ones, especially from the groundwater layer. The quality of mineral water in the exploited aquifer worsens. This will lead to a high risk of losing the exploited source of mineral water entirely.
The exploited area of the Kislovodsk mineral water deposit is considered as the object of study. Monitoring in observation wells showed systematic fluctuations in water pressure over time. There can be several reasons for this: damage to equipment, precipitation, changes in porosity, and human factors.
These systematic fluctuations due to various factors can be described and considered as uncertain or random processes, and these processes should be included when designing a mathematical model of hydrogeological objects. Additionally, it is worth considering seismic activity, which also has an uncertain or random impact. The assumed random factors have a stochastic effect on the flow rate of water in the aquifer and on the level of head drawdown. Analyzing the dynamics of levels and their systematic fluctuations, it is possible to suggest some limitation for the mathematical model of the object, that the simulated random processes will be considered as stationary. To test this hypothesis a statistical analysis of piezometric level monitoring data in observation wells of the considered area of the field was performed.
The purpose of this study was to develop a control system for the hydrolithospheric process under random impacts, aimed at maintaining the quality and reserves of the mineral water of the deposit by controlling the piezometric level in the exploited aquifer.
It is required to carry out a detailed analysis of a hydrogeological object with an analysis of its inherent random processes that affect the hydrodynamic parameters during the operation in the field. This requires system-analytical modeling of the technical and physical elements of the object of study at different levels of management with the further development of a mathematical model that takes into account random disturbances in the geofiltration processes of aquifers of a mineral water deposit. The mathematical model is supplemented with initial and boundary conditions and verified with data obtained experimentally in a real mineral water production facility.
3. Study Area Description
The study area is located in the territory of two regional taxonomic units of hydrogeological zoning of the 1st order (according to L.K. Ostrovsky): the Crimean Ciscaucasian province of complex basins of reservoirs and block-stratal waters and the Crimean Ciscaucasian province of complex basins of reservoir-block, reservoir, karst-block, vein-block and cover-flow groundwater. The boundaries between them pass along the system of Ciscaucasian deep faults in the basement. Within the first province, two basins of groundwater of the second order are located: there are the Azov–Kuban and East Ciscaucasian. And within the second province there are the Greater Caucasus and the Central Caucasian.
The territory of the Greater Region of the Caucasian Mineral Waters (CMW) is located in the junction zone of the indicated hydrogeological provinces along the boundaries of the Greater Caucasus and East Ciscaucasian artesian basins. The Kislovodsk mineral water deposit is located within the Bolshekavkazsky artesian basin.
In geological and structural terms, the territory of the Greater CMW region is part of the northern wing of the Greater Caucasus meganticlinorium, known as the North Caucasian monocline, and is located in the region of the meridional Mineralovodsky uplift. This uplift has the appearance of a wide and gently sloping anticline, gradually plunging to the north. The arch of the uplift, up to 60 km wide, is complicated in places by transverse folds and faults in the longitudinal and transverse directions. The eastern and western wings of the Mineralnye Vody uplift plunge into the Terek–Kuma and Kuban depressions, respectively.
In tectonic terms the study area is a part of the Alpine folding, within which two structural stages are distinguished: the crystalline basement and the sedimentary cover.
The crystalline basement of the Lower Paleozoic age is represented by dislocated crystalline greenish–gray chlorite–albite and mica-chlorite schists. The basement is divided by a system of tectonic discontinuities of northeastern strike with an amplitude of faults and reverse faults up to 20–50 m, and is complicated by felsic intrusions, mainly pink coarse-grained granites.
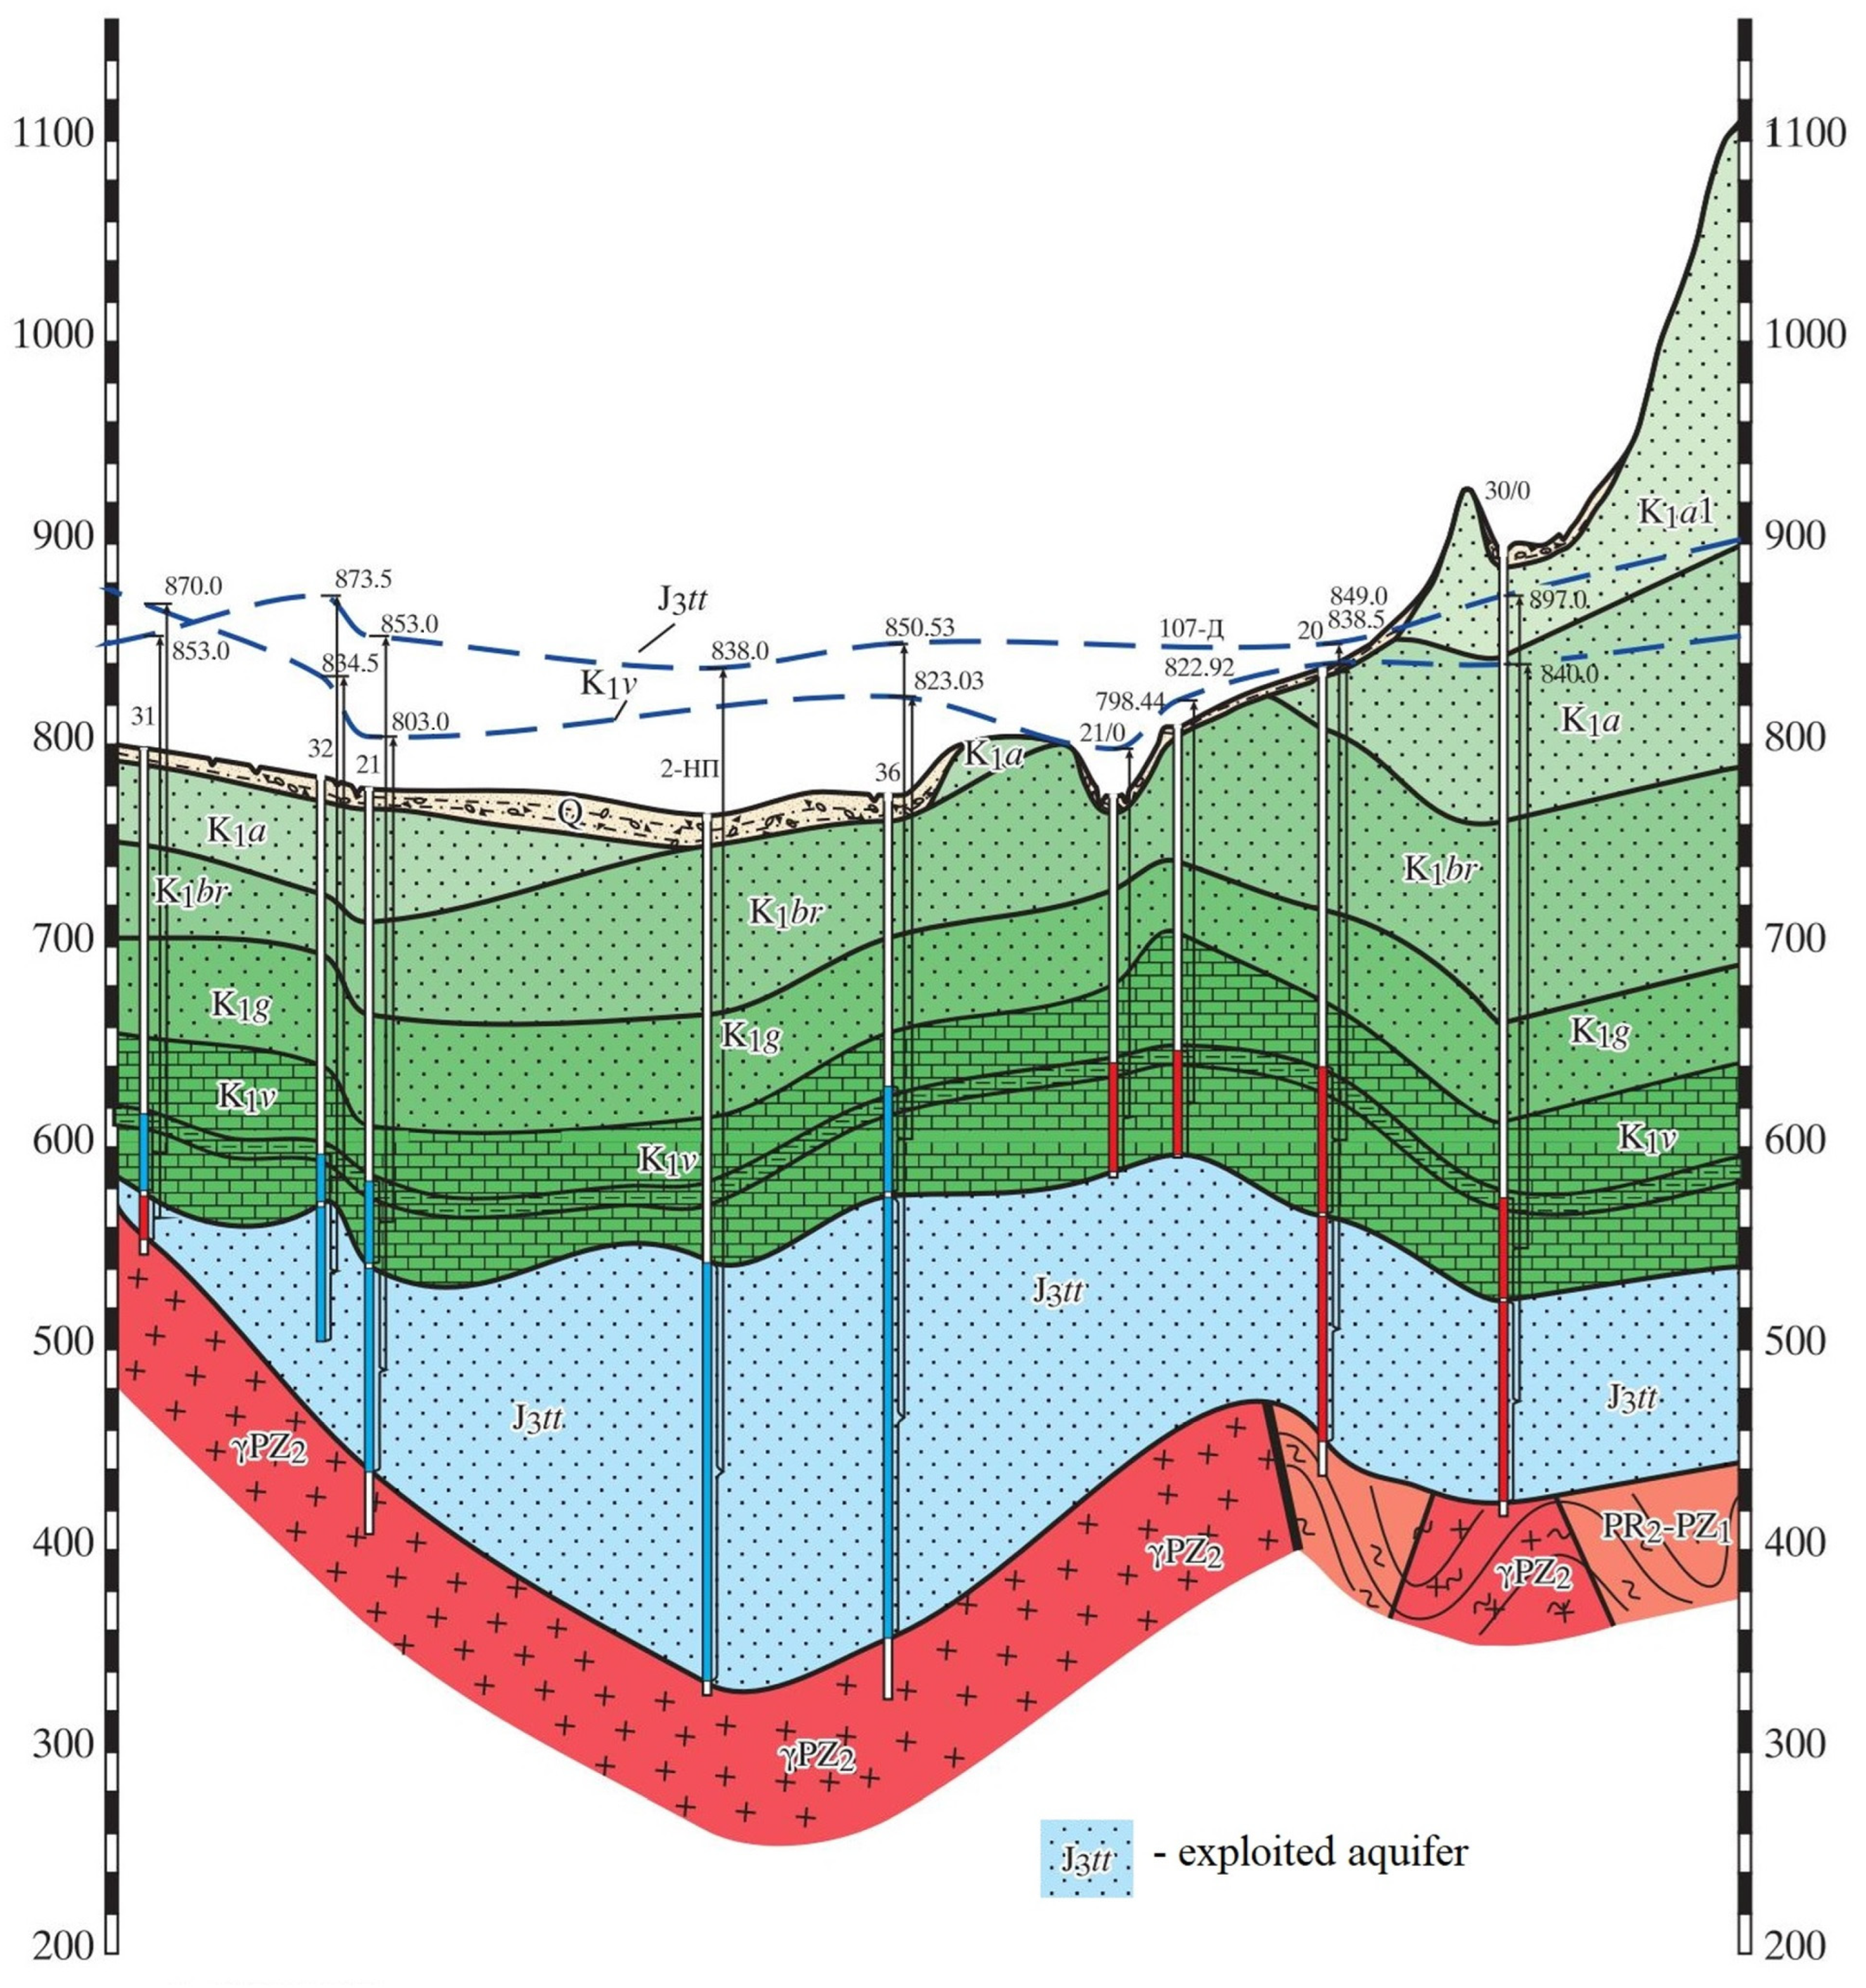
The general patterns of occurrence of aquifers are clear from the geological and hydrogeological profile (Figure 1).
The oldest rocks on the territory of the Kislovodsk deposit are Lower Paleozoic (PZ1) crystalline schists and Upper Paleozoic (PZ) granites. They were discovered by wells at depths ranging from 80 m in the southern and up to 400 m in the northern parts of the deposit.
Jurassic system (J): The sediments of the Jurassic system lie with angular and stratigraphic unconformity on the Paleozoic sediments and are represented by the Toarcian stage of the Lower Jurassic and the Tithonian stage of the Upper Jurassic. The remaining stratigraphic sediments of the Jurassic system are eroded.
Toarcian Stage (J1t): Toarcian sediments are found only in the upper southern part of the Berezovskaya Gully. To the north, they are cut off by the pre-Tithonian transgression.
This provides a basis for believing that the Toarcian sediments, lying on the surface of the crystalline basement and performing irregularities in its relief, formed lenses during subsequent erosion, one of which lies in the area of the Berezovsky section of the Kislovodsk deposit. The sediments are represented by mudstones and sandstones which are up to 70 m thick.
Tithonian Stage (J3tt): The sediments of the Tithonian stage hide on the eroded surface of the basement. They were discovered by wells at depths from 100 to 400 m, increasing in a northerly direction. The Tithonian variegated sequence consists of loose sandstones, clays, and granite gruss. The sediments of the Tithonian stage are divided by researchers into three sequences: the lower one, which is dominated by coarse-grained variegated sandstones with rare interlayers of gruss and clays; the middle one, consisting of granite gruss with interlayers of sandstones and clays, and the upper one, composed of red–brown clayey sandstones with gypsum inclusions. The thickness of the sediments of the Tithonian stage is inversely related to the relief of the top of the Paleozoic basement. In areas where the basement surface forms depressions, the thickness of the variegated stratum increases, and, conversely, in the elevated areas of the basement, it is minimal.
Cretaceous system (K): The sediments of the Cretaceous system are represented by the lower section. The Upper Cretaceous section in the area of the site is completely eroded. The Lower Cretaceous sediments are represented by the Valanginian, Hauterivian, Barremian, Aptian, and Albian stages.
Valanginian Stage (K1v). Valanginian sediments, represented in the section by dolomitic limestones, overlie the variegated Tithonian sequence. They are exposed on the surface in a small area in the southern part of the deposit, along the valleys of the rivers Berezovaya, Kabardinka and Olkhovka.
Dolomitized limestones were discovered in the deposit at depths from 5 to 300 m, increasing from south to north. Their thickness is quite consistent over the area and varies within insignificant limits—from 80 to 90 m.
Hauterivian Stage (K1g): The sediments of the Hauterivian stage lie on the dolomitic limestones of the Valanginian and are important in terms of sandy-clay composition. The sediments were formed by a number of shell limestones and argillaceous sandstones with limestone interbeds and outcrops in the main and northern parts of the field, as well as in rarely elevated areas.
The total thickness of the Hauterivian sediments is about 50 m, and like the underlying sediments, have a slight slope to the northeast.
Barremian (K1br): The sediments of the Barremian Stage are represented by a sequence of dense oolitic limestones interbedded with limestone–argillaceous sandstones. Above are calcareous sandstones with a small number of thin layers of oolitic limestones. They are overlain by argillaceous siltstones, which in some places change into strongly argillaceous dark brown sandstones and higher up are replaced by grayish-yellow fine-grained, argillaceous sandstones. The section of the Barremian sediments ends with red ferruginous sandstones. Sediment thickness about 40 m.
Aptian Stage (K1a): The Aptian stage is represented by clays (lower substage) overlain by sands and sandstones (upper substage). The total thickness of the sediments of the Aptian stage is 245 m.
Albian Stage (K1al): The sediments of the Albian stage are found in the north and west of the described territory. In the lower part, they are represented by sands and sandstones (lower substage), and in the upper part, by black calcareous clays (upper substage). The thickness of the Albian Stage is 150–200 m.
To the north, the Lower Cretaceous sediments subside under the Upper Cretaceous sediments.
Cenozoic era (KZ): In the area of the Kislovodsk deposit, it is represented by eluvial, deluvial and alluvial formations of the Upper Quaternary system (QIV), which are distributed mainly along the thalwegs of permanent and temporary watercourses. Eluvial sediments are widespread in the watershed areas north and south of the Berezovaya, Alikonovka, Podkumok rivers. They are represented by yellowish-gray compacted loams, containing crushed sandstones mainly in the lower part of the section.
Deluvial sediments are most developed along the slopes of the valleys of the rivers mentioned above, especially in the lower part of the slopes. In the upper part of the slopes, deluvial sediments are insignificantly thick, and often completely absent. They are represented mainly by yellowish-gray and reddish-brown loams with a large number of fragments of dolomitic limestones of different sizes: from small gravel to huge blocks. There are especially many blocks in the middle part of the valleys, where their slopes are completely composed of dolomitic limestones. Here, these blocks often reach the riverbeds and, cluttering them up, change the direction of the river flow. The thickness of deluvial sediments varies from 0.2 to 50 m.
Alluvial sediments fill the bottom of river valleys and ravines flowing into them. Here they are represented by alternating clays, loams, sand and poorly rounded pebbles and gravel. Boulders of various sizes are also found in alluvial sediments. In the region of the river Berezovaya at the foot of the right slope there are often silt-loam sediments, as well as buried soils and travertines. The mountainous nature of the river channels and their destructive activity during flood periods create unfavorable conditions for the accumulation of precipitation, which generally determines the insignificant thickness of alluvial sediments—no more than 5–10 m, with the exception of some areas where it reaches 40 m.
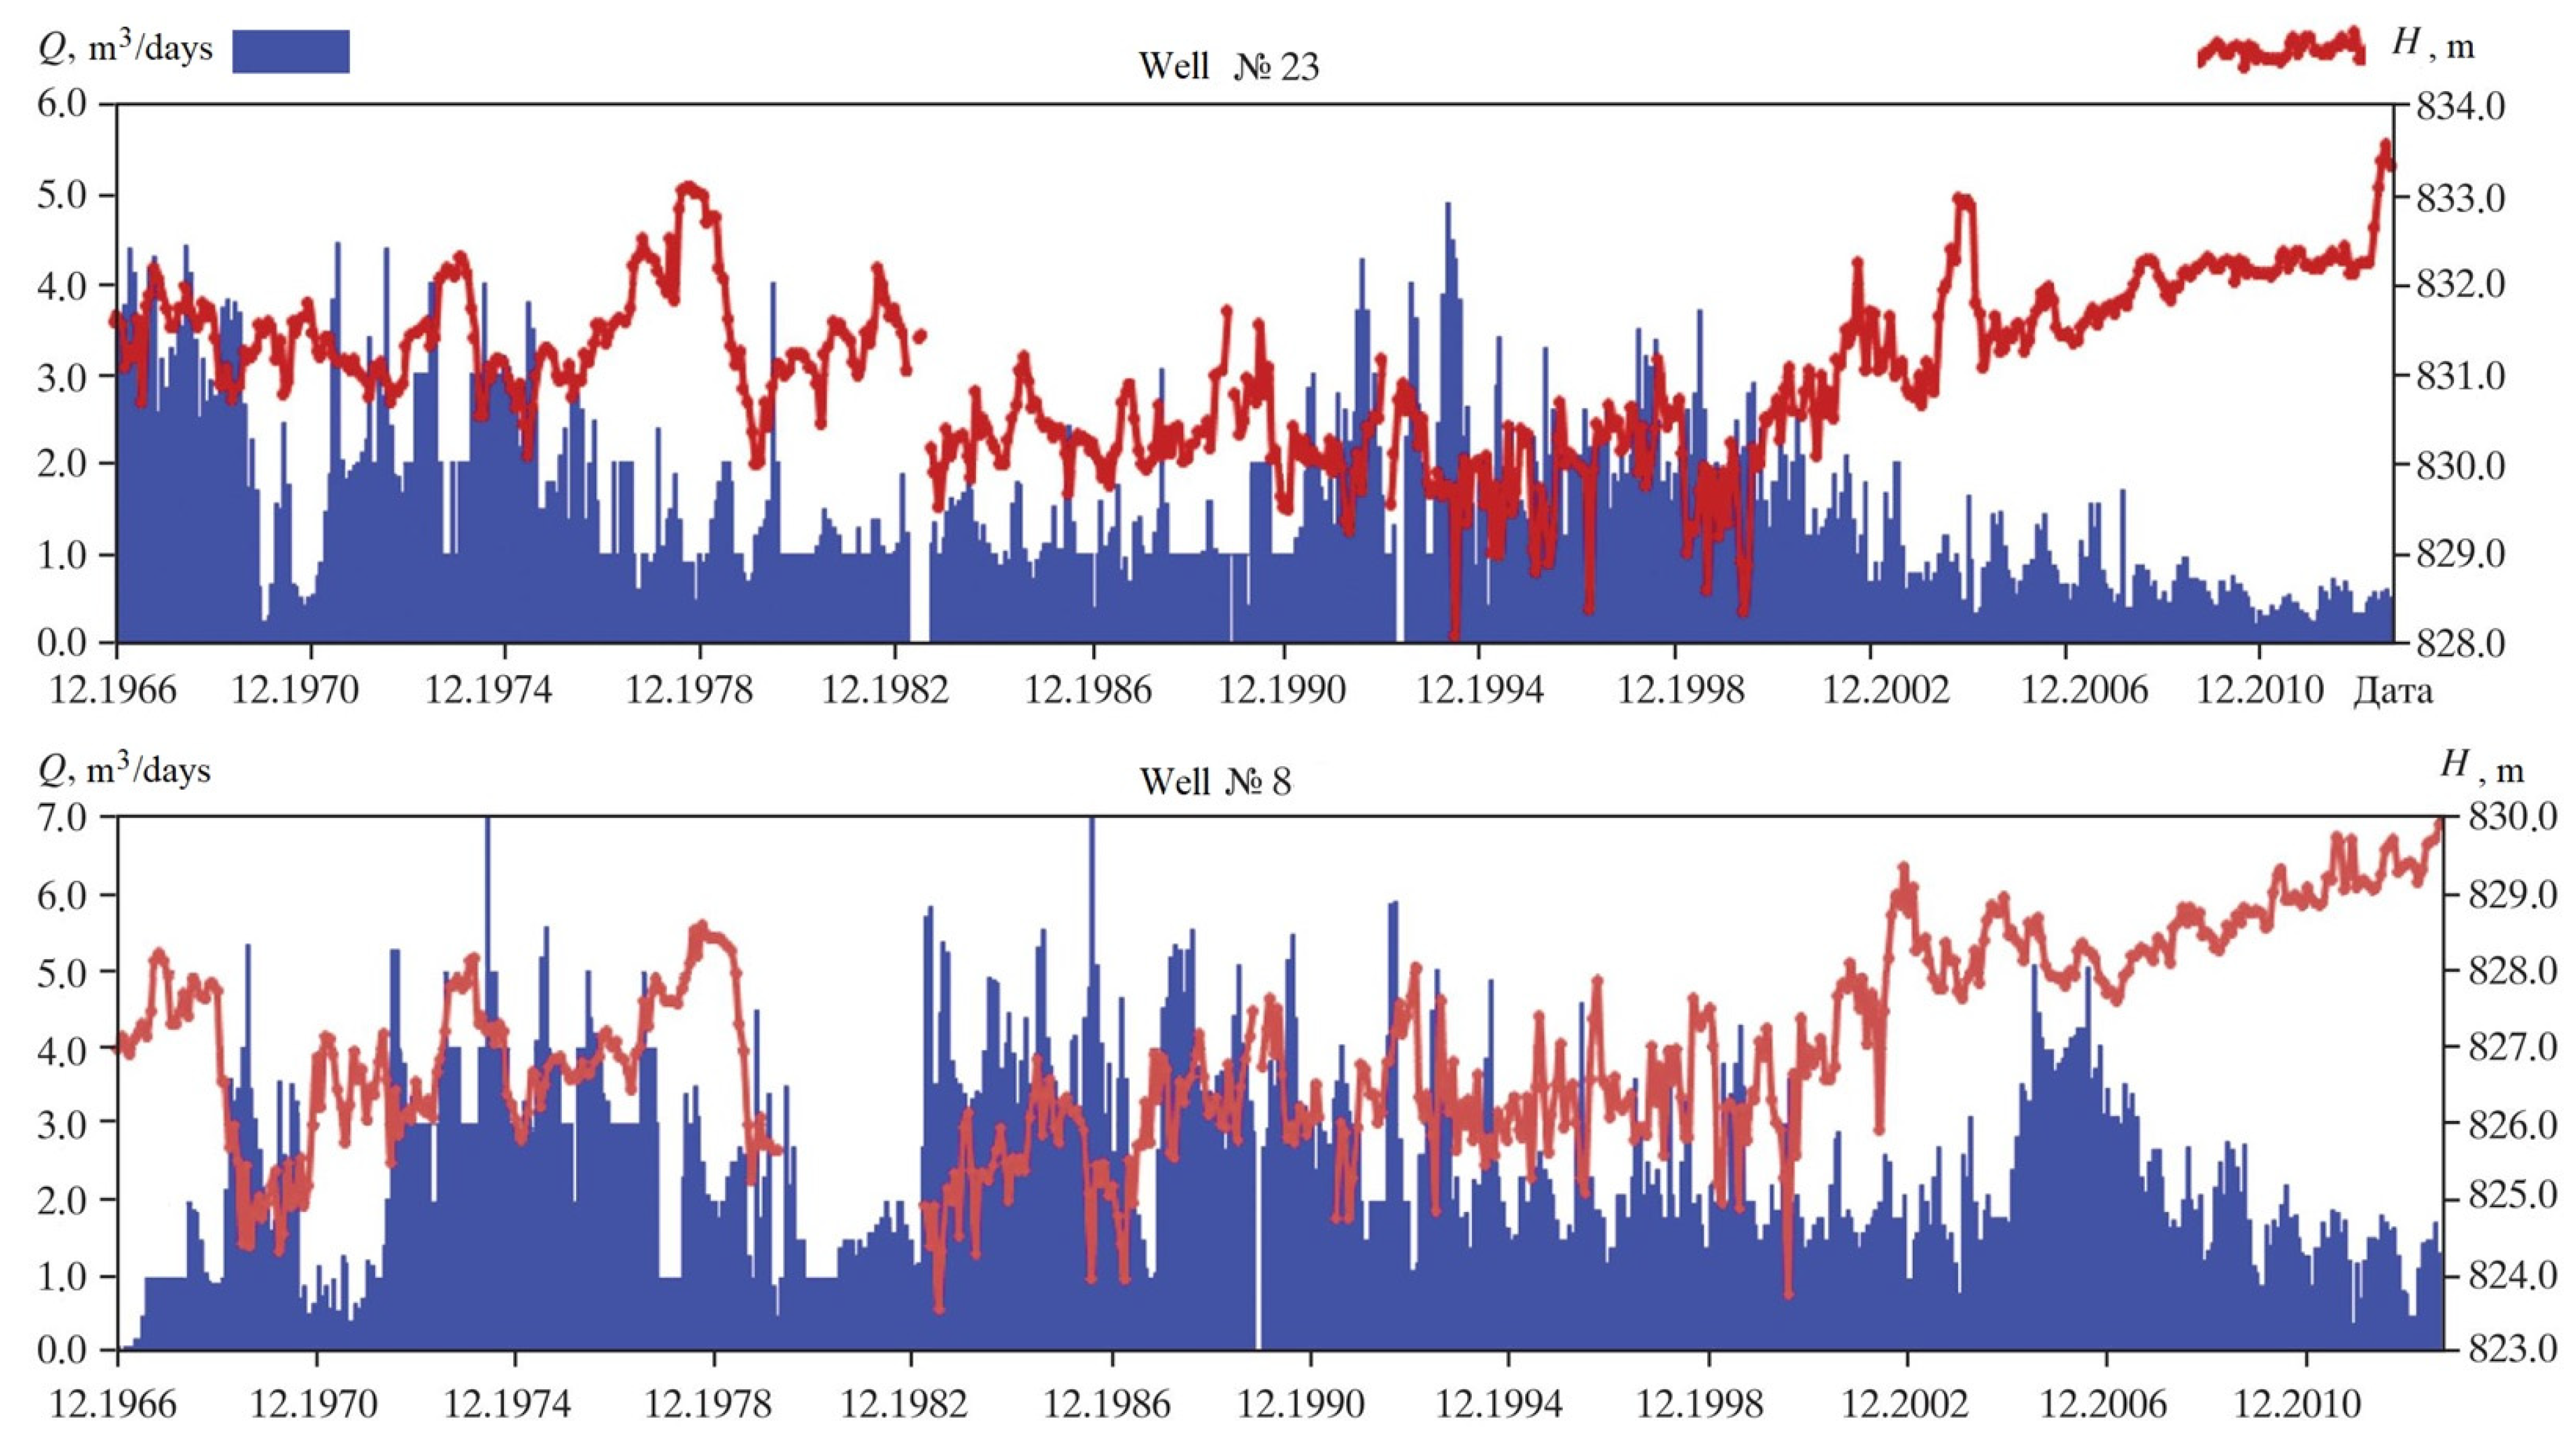
In addition to the geological characteristics of the deposit, information about the mineral water reserves of the research aquifer is in Table 1. There are some producing wells, which are produced from water of the Tithonian aquifer.
The state of the aquifer exploitation and piezometric monitoring are shown in Figure 2.
4. Research Methods
Analysis of modern research has made it possible to determine a set of effective methods for modeling hydrogeological objects, which are most often used to solve problems in this subject area [8,13]. As a result of the presented method’s effectiveness, the method using a mathematical description of the hydrogeological object in the form of a three-dimensional geo-filtration model was chosen for analysis of the further research. The experiment carried out on the prototype of the hydrogeological object model showed convergence values of the real data with the model ones by 80 to 90%. Errors in the modeling of geo-filtration processes can lead to errors in controlling the aquifer system’s exploitation. Due to its effectiveness, this method of modeling is used for synthesis distributed control systems.
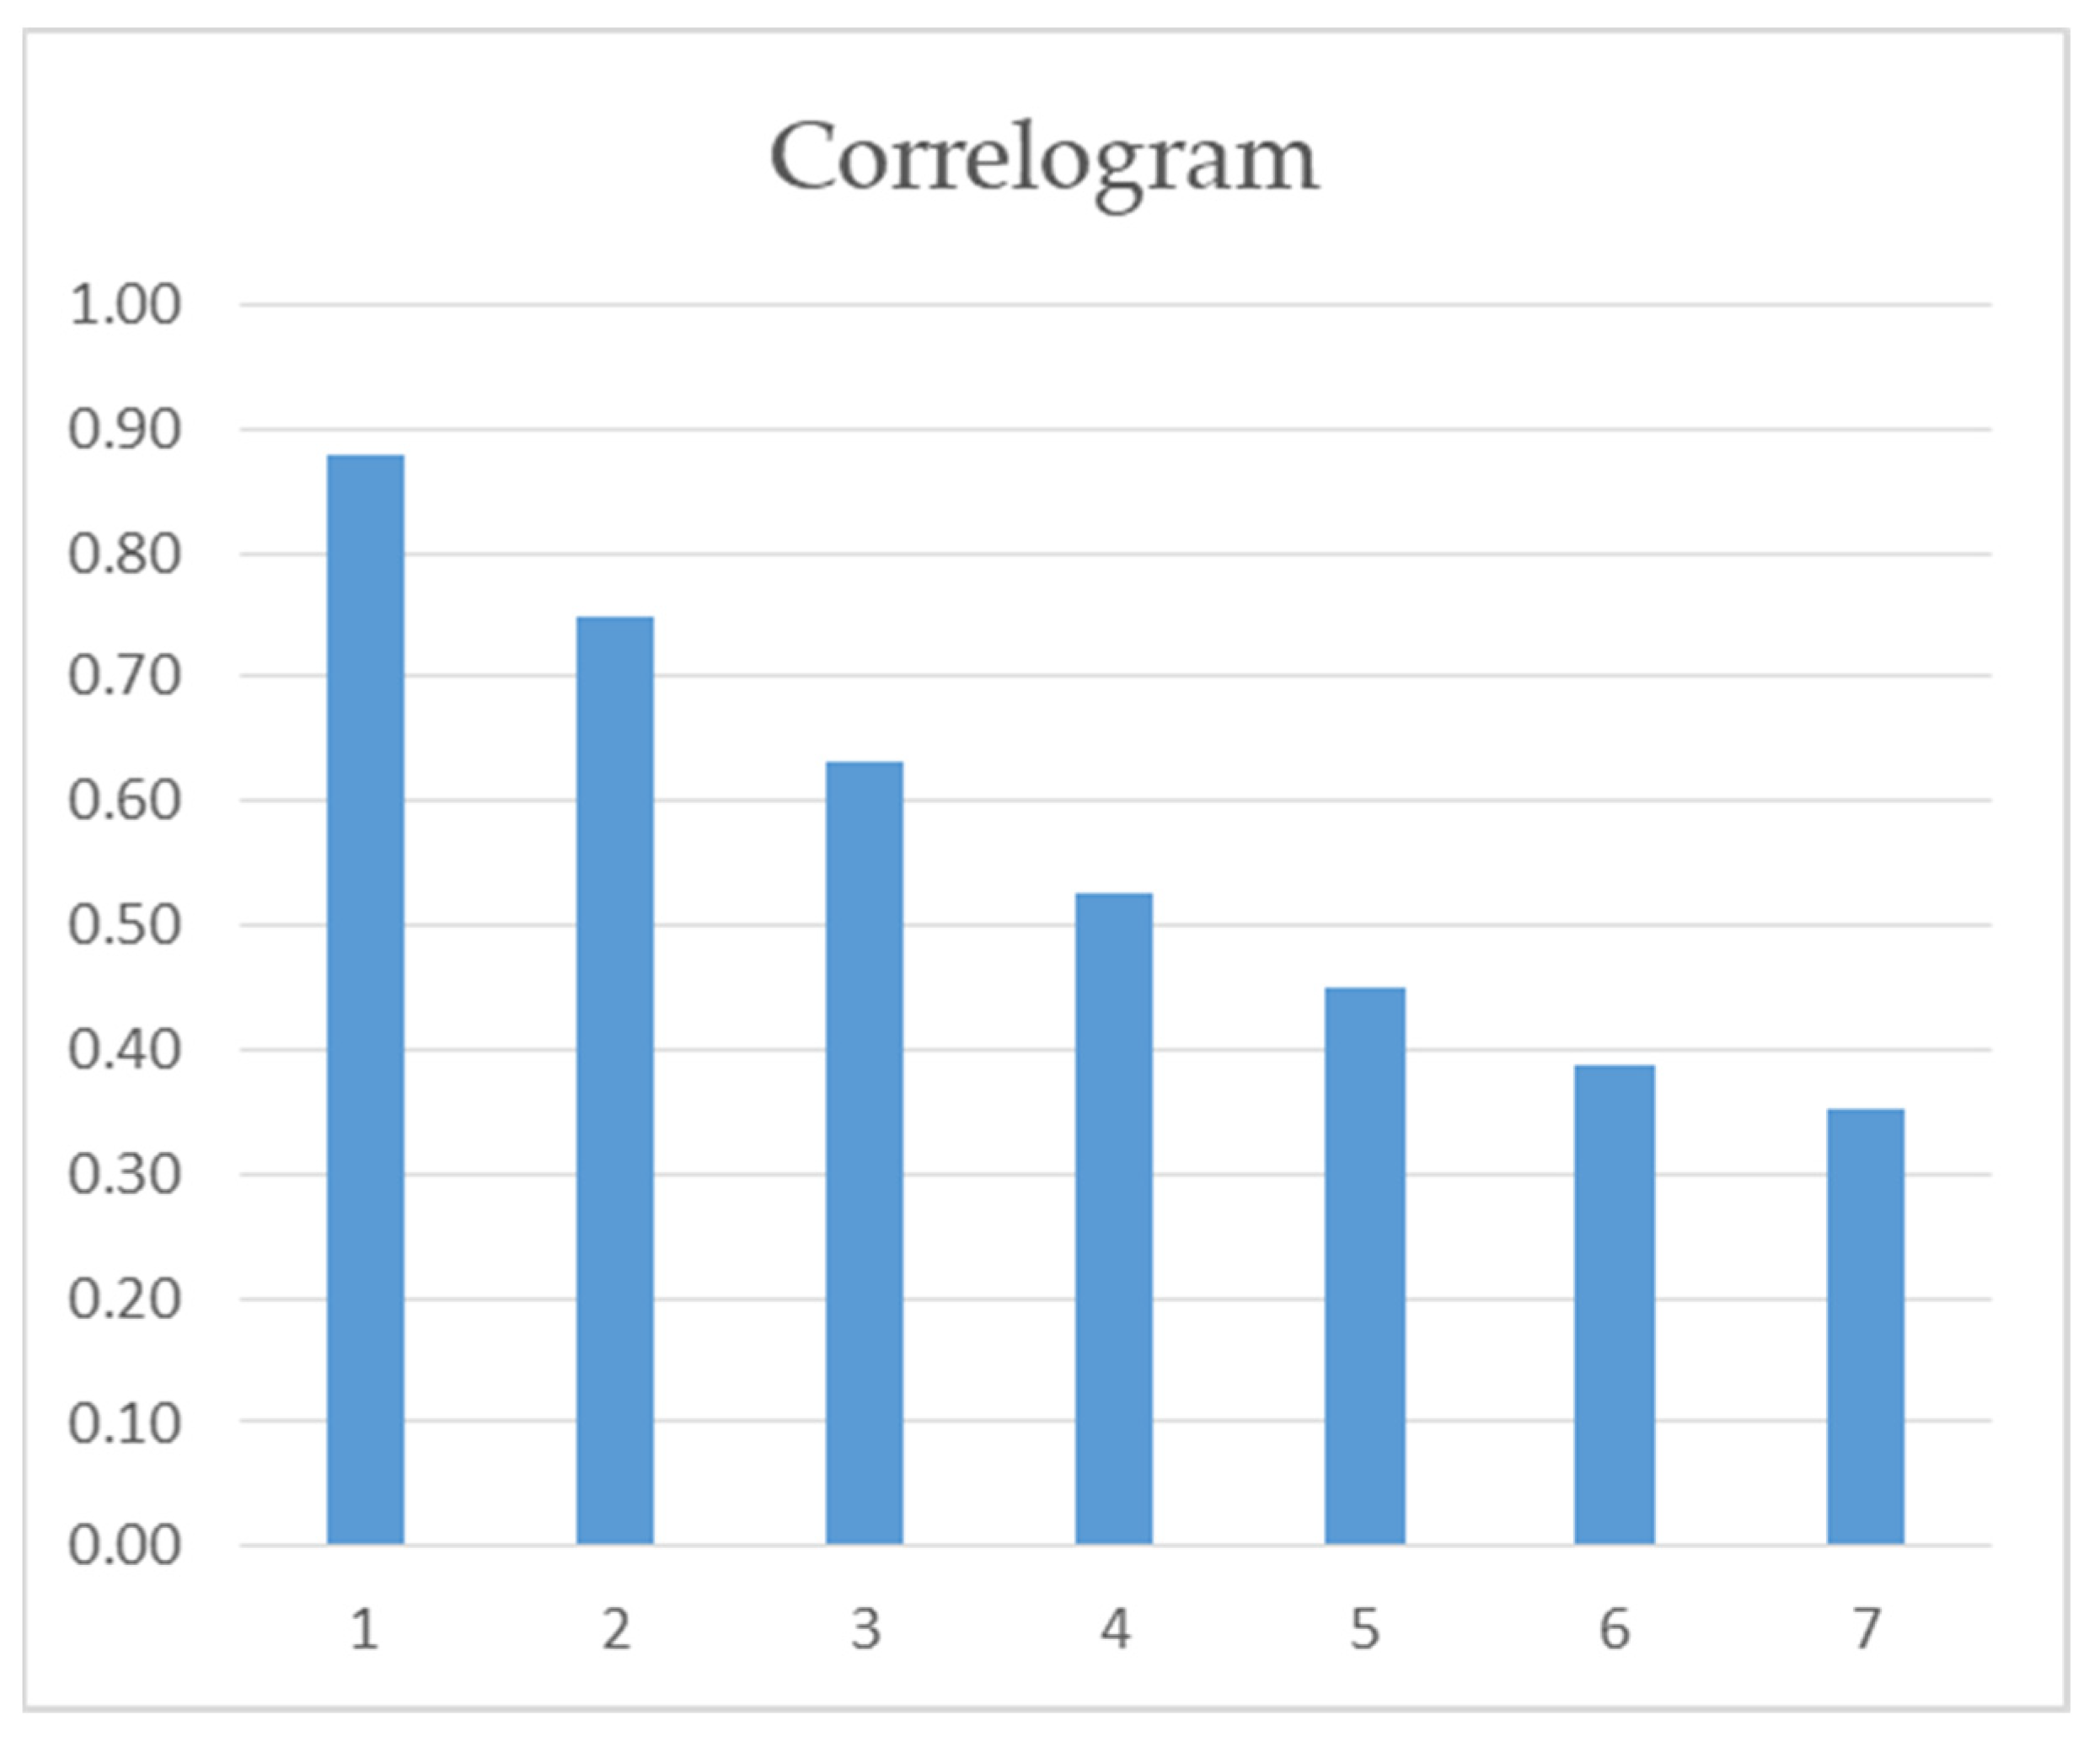
Before proceeding to the mathematical model of the object, studies of the piezometric level in observation wells should be conducted. It is necessary in order to put forward a hypothesis about the stationarity of the considered random processes and take these processes into account when modeling the object. Most of the methods of analysis and forecasting of dynamic processes are applicable to stationary time series. After analyzing the hydrogeological object of study, it was concluded that a sufficient method for studying stationarity would be to evaluate the series relative to its central trend. Often, to detect the non-stationarity of a series, it is enough to consider the process plot. At the same time, for statistically valid proof of stationarity, it is necessary to use special methods, such as compiling a correlogram of the process and splitting into successive groups of observations to compare them with each other.
For the analysis of a series of dynamics of the piezometric level from observation well No. 87 in the field using the correlogram, it is necessary to supplement the initial series of dynamics with series from the levels of this series shifted in time (Table 2). Calculating the correlation coefficients of the initial series Yt with other ones, a resulting correlogram can be presented in the following form in Figure 3. Since the first-order autocorrelation coefficient turned out to be the highest, the time series contains a trend. As the delay increases, the correlation monotonically decreases, which indicates the stationarity of the series, the probabilistic properties of which do not change with time. To confirm the results, the second method was used for estimating the stationarity of the series.
To begin, data must be selected and grouped. Thus, for the observation period from 2008 to 2020 (150 observations) we divided the series into three equal segments (50 values each). Differences in the means of the series are insignificant (t = 0.96, df = 98, p > 0.05), where t is Student’s t-test, df is the degree of freedom, and p is the level of significance. The data was grouped by 100 observations; as an example two segments were chosen (2004–2012 and 2012–2020). The differences in the means of the series are also insignificant (t = 0.64, df = 198, p > 0.05). Thus, the stationarity of the time series according to the observation well data is proven. A number of other control wells of the field were analyzed using the same methods.
The conducted studies were systematized and presented in the form of a methodology that was recommended to be used for the statistical processing of data on observation wells of a hydrogeological object in order to assess the stationarity of processes. Having conducted a study of the effect of random disturbances in the reservoir, we moved on to a system analysis of a hydrogeological object for the subsequent development of a mathematical model.
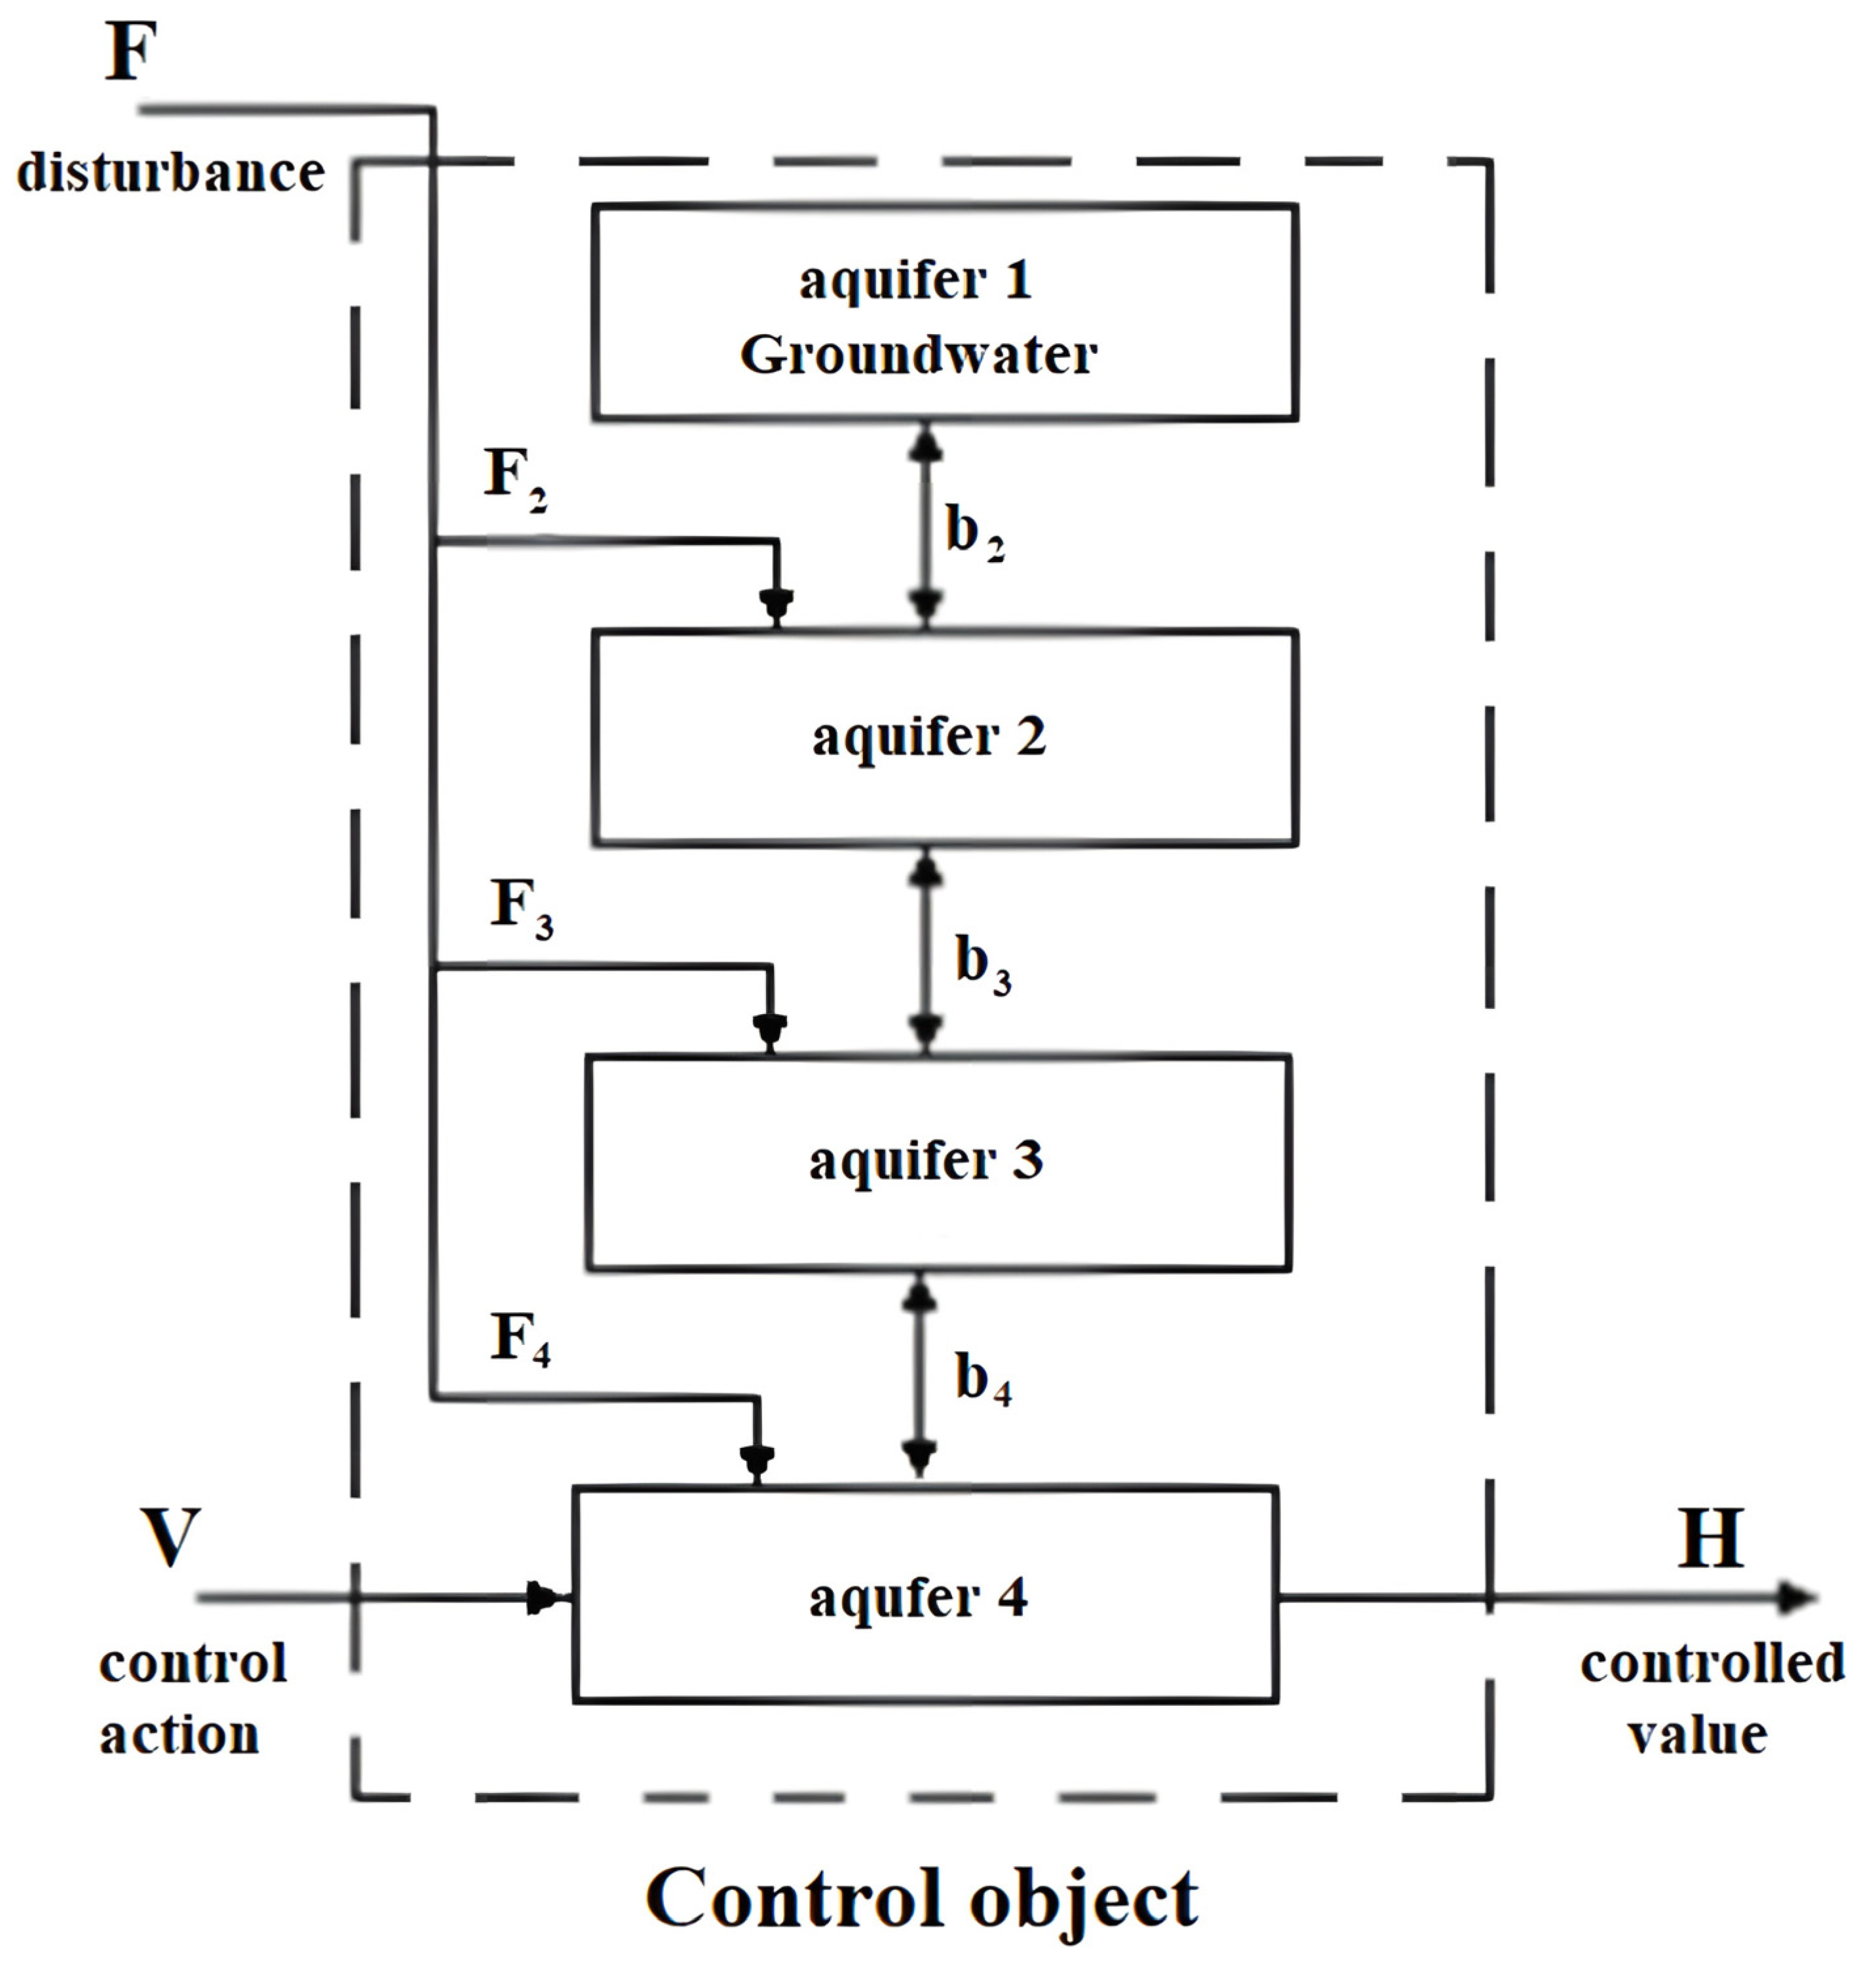
To simplify the description and to highlight the disturbing and input effects, a visual model is proposed in the form of a block diagram (Figure 4), which displays not only the effects on the exploited aquifer, but also the interaction between the layers.
In many literary sources [8,18,19,20,21], the basic principles of mathematical modeling of aquifer systems and various modeling options are given. Preference was given to describing the object using a three-dimensional model. This type of mathematical model describes filtration processes in aquifers and interactions between them through various coefficients. The mathematical model of the central area of the Kislovodsk deposit with four producing wells and four observation wells can be written as a system of differential equations that determine the geofiltration processes of the aquifer system. Let be the head in the groundwater and be the head in i-th aquifer (i = 2,3,4), then the mathematical model of the field can be written as follows:
where: —elastic capacity parameter of the i-th aquifer; —flow speed of the i-th aquifer, represented as the sum of the deterministic and random components, respectively; —head reduction in producing wells, represented as the sum of the deterministic and random components, respectively; ki,x, ki,y, ki,z—filtration coefficients; —coordinates of the location of producing wells (j = 1,2,3,4); —parameter that is equal to one when x = xj, y = yj, z = zj, otherwise it is equal to zero.
In the considered mathematical model, the filtration parameter k (m/day) is the most important, since it determines not only the nature of water overflow in the horizon, but also makes it possible to quantify its volume. The indicator of this parameter is determined by the hydro-chemical components of water and the porosity of the studied rock. This parameter is determined using experimental filtration works. Based on measurements at certain points (location of observation wells), the average value of the parameter in the study area is found.
The geo-filtration model is complicated by the fact that it takes into account the random nature of external factors in the form of 10% stochastic noise head reduction at the locations of production wells and at flow speed in the aquifers.
The mathematical model is also supplemented with boundary conditions [22].
Boundary conditions between aquifers (Darcy conditions):
where —overflow parameter (i = 1…3).
Lower boundary of the lower aquifer:
An assumption in the model is that the thickness of the reservoirs along the y coordinate is so high that the impacts from production wells do not significantly affect the reservoir pressure at the horizon boundaries. Then the boundary conditions of the side boundaries are written in the following order:
where , —initial states of unperturbed aquifers.
The geometric and physical data of the deposit (in meters) are given in [22]. To assess the dynamics of hydrodynamic processes, using a difference scheme, the object model is converted to a discrete form, since for the system of equations of geo-filtration processes in this setting taking into account the given boundary and initial conditions of the modeled area, it is difficult to obtain an analytical solution [23,24,25,26,27].
To compile a discrete form of the above-described mathematical model of the field, the area under study was divided by some grids with the following parameters: , , —discrete steps to the respective coordinate axes (i = 1…4), where , , —the number of discrete points (in our case , , ).
For the exploited lower aquifer, the equation in discrete form will be:
The remaining equations are written in a similar way.
Using a discrete model, software was developed that numerically simulates the hydrodynamic processes of aquifers under random impacts. The simulation results are used to analyze the dynamic characteristics of the object and the subsequent synthesis of the control system for the mineral water production process.
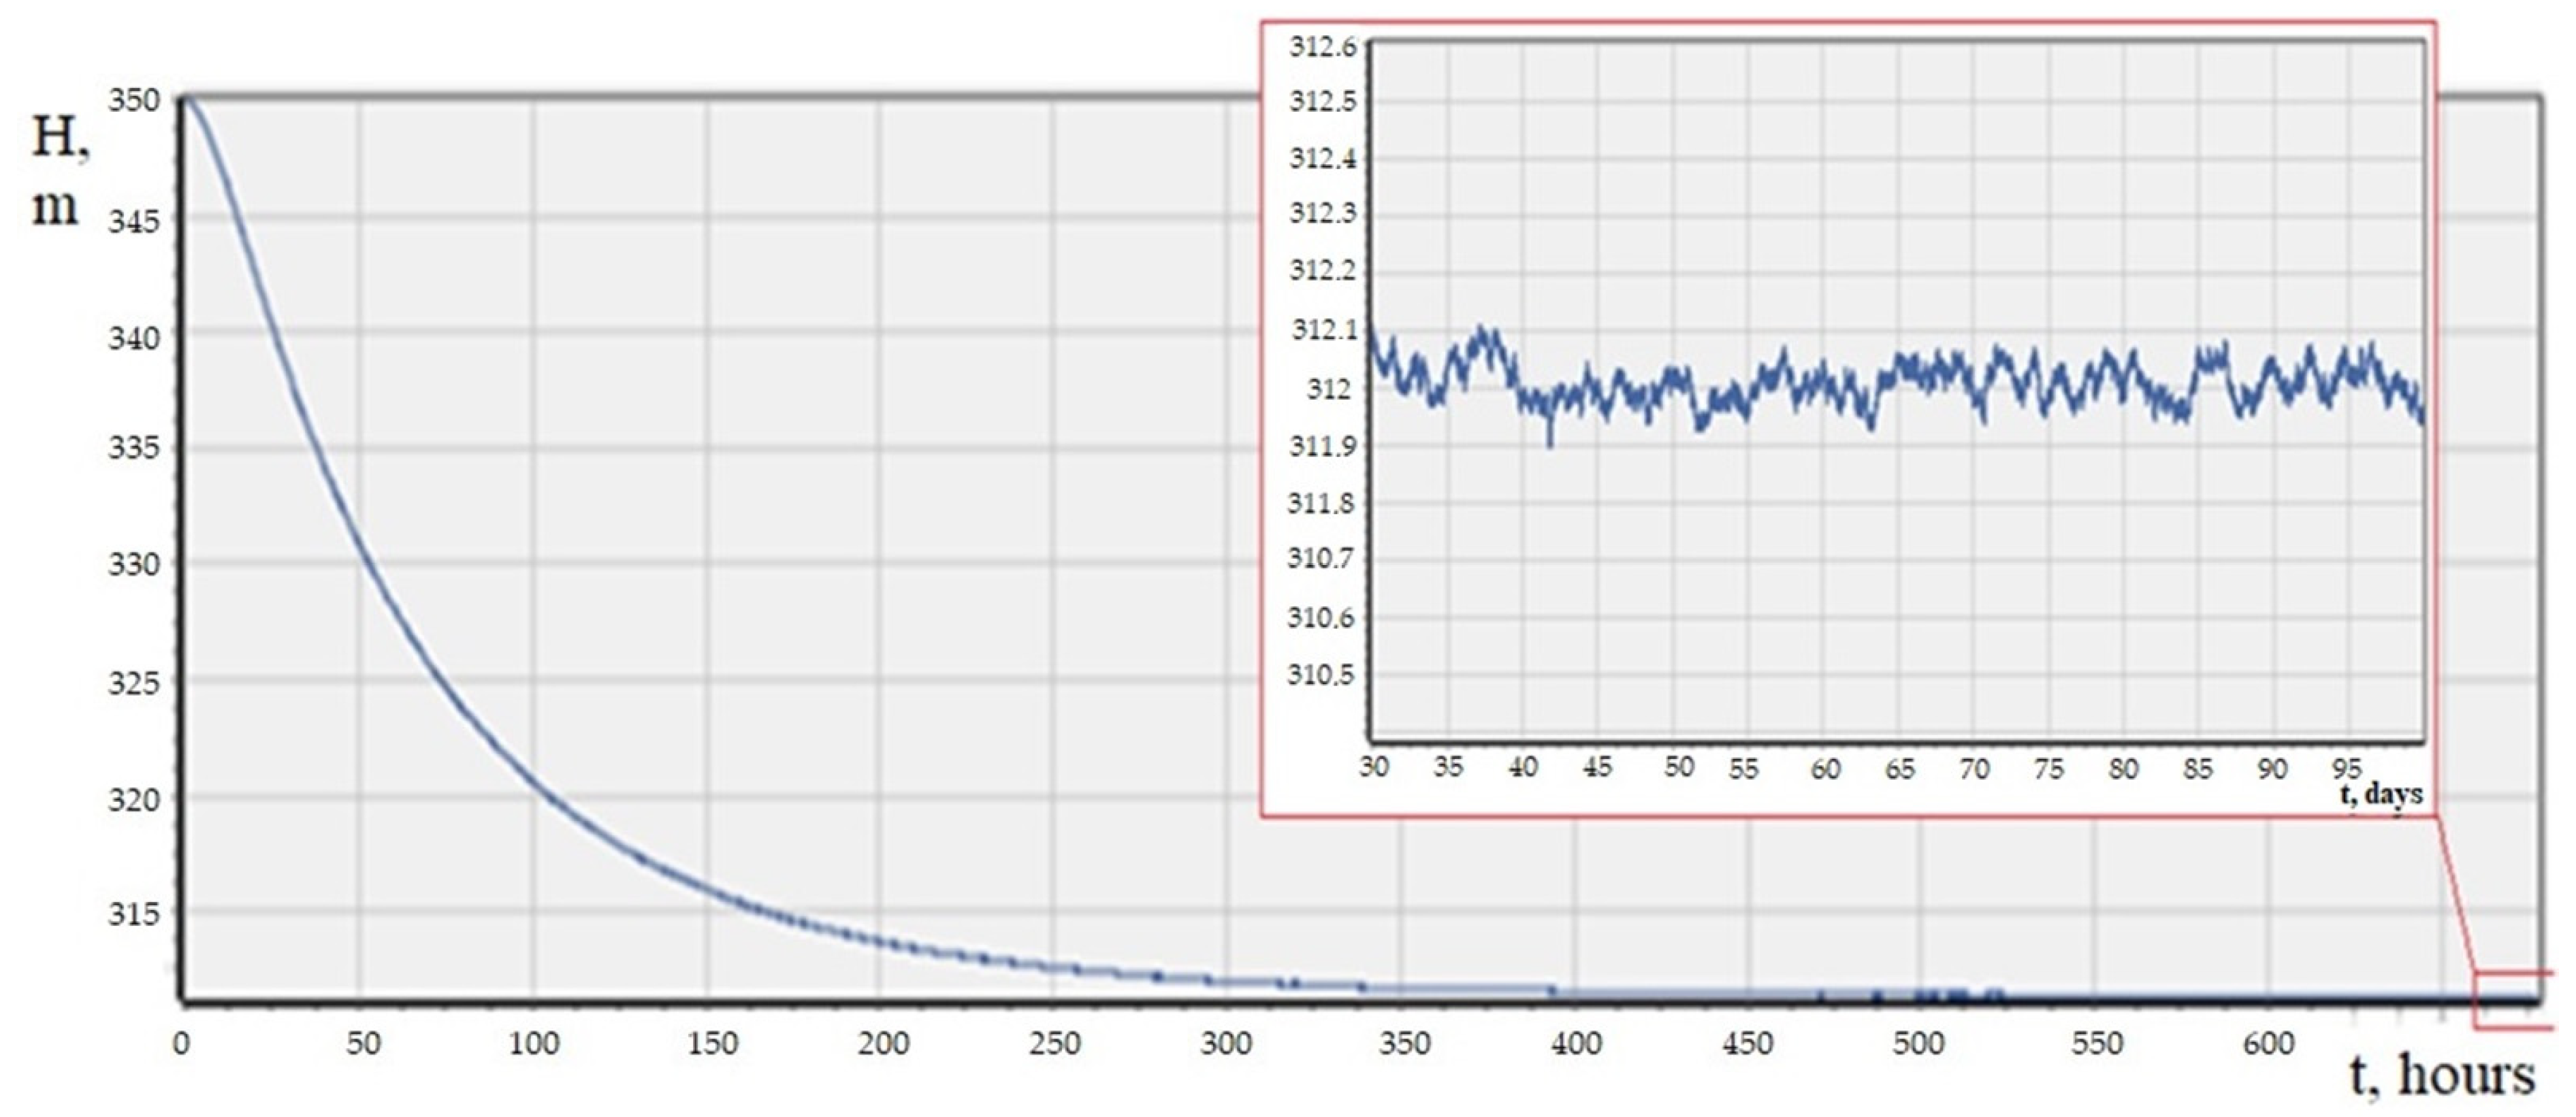
The graph of the object’s response to the first spatial harmonic of the input action, obtained at the location of the second observation well, and the dynamics of the head deviation under the effects of random disturbances are illustrated in Figure 5.
The head deviation in the steady state reaches 0.12 m, which can lead to the penetration of sewage into the exploited aquifer. The problem is to control the hydrodynamic process and reduce the effect of random disturbances on maintaining the head of the exploited reservoir at a given level in order to preserve the reserves and quality of mineral water.
The frequency method for the synthesis of distributed controllers was developed for distributed objects, the models of which are determined using experimental data [8]. This method has shown itself effective in controlling various objects of thermal and electromagnetic natures. Additionally, this method can be applied to controlling hydrogeological research objects, the model of which is obtained using experimental data.
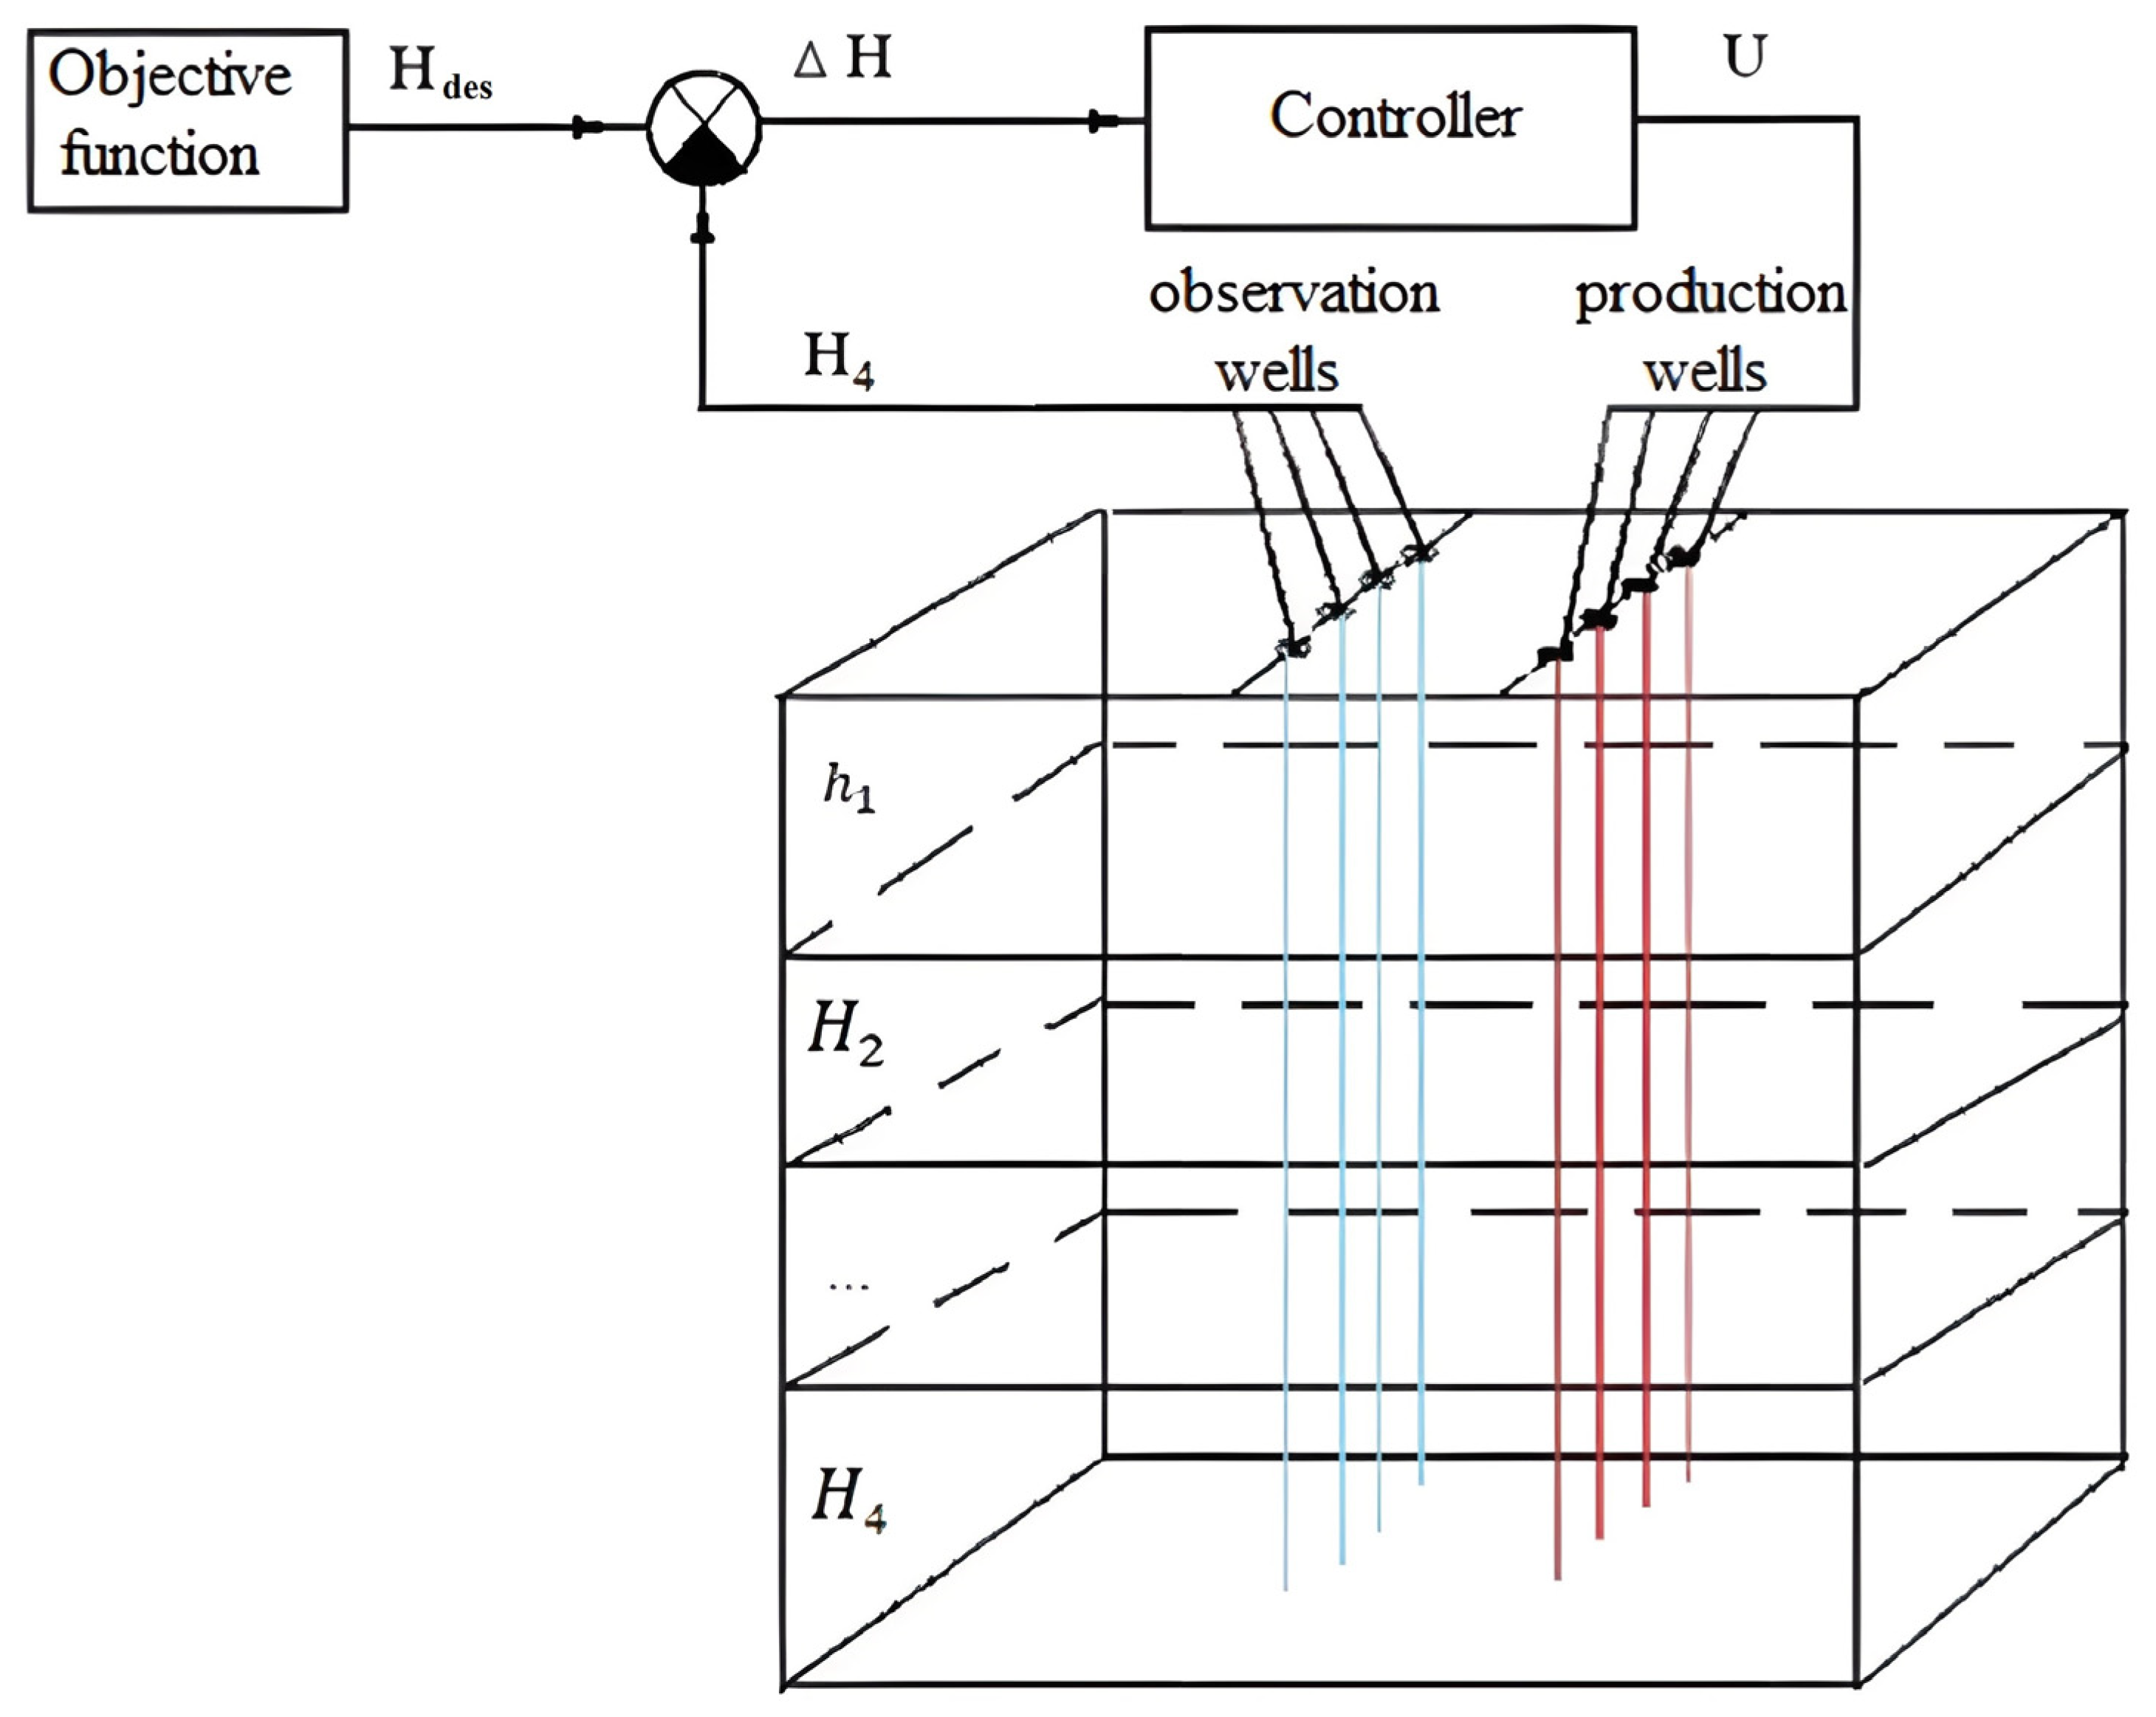
The structure of a distributed control system can be presented as in Figure 6.
The control problem is solved by two methods: by the synthesis of lumped controllers from the position of considering the object as a multidimensional system and by the synthesis of distributed controllers using frequency synthesis methods of systems with distributed parameters. Using approximating functions that describe the reactions of the object to the input action [28,29,30,31,32], the following controllers are synthesized.
Transfer function of calculated PID controller:
where Kp—proportional gain, Td—derivative time constant, Tin—integral time constant.
The transfer function of the calculated distributed controller:
Transfer function of calculated PID controller:
where ,—gains and weight coefficients, respectively.
5. Results
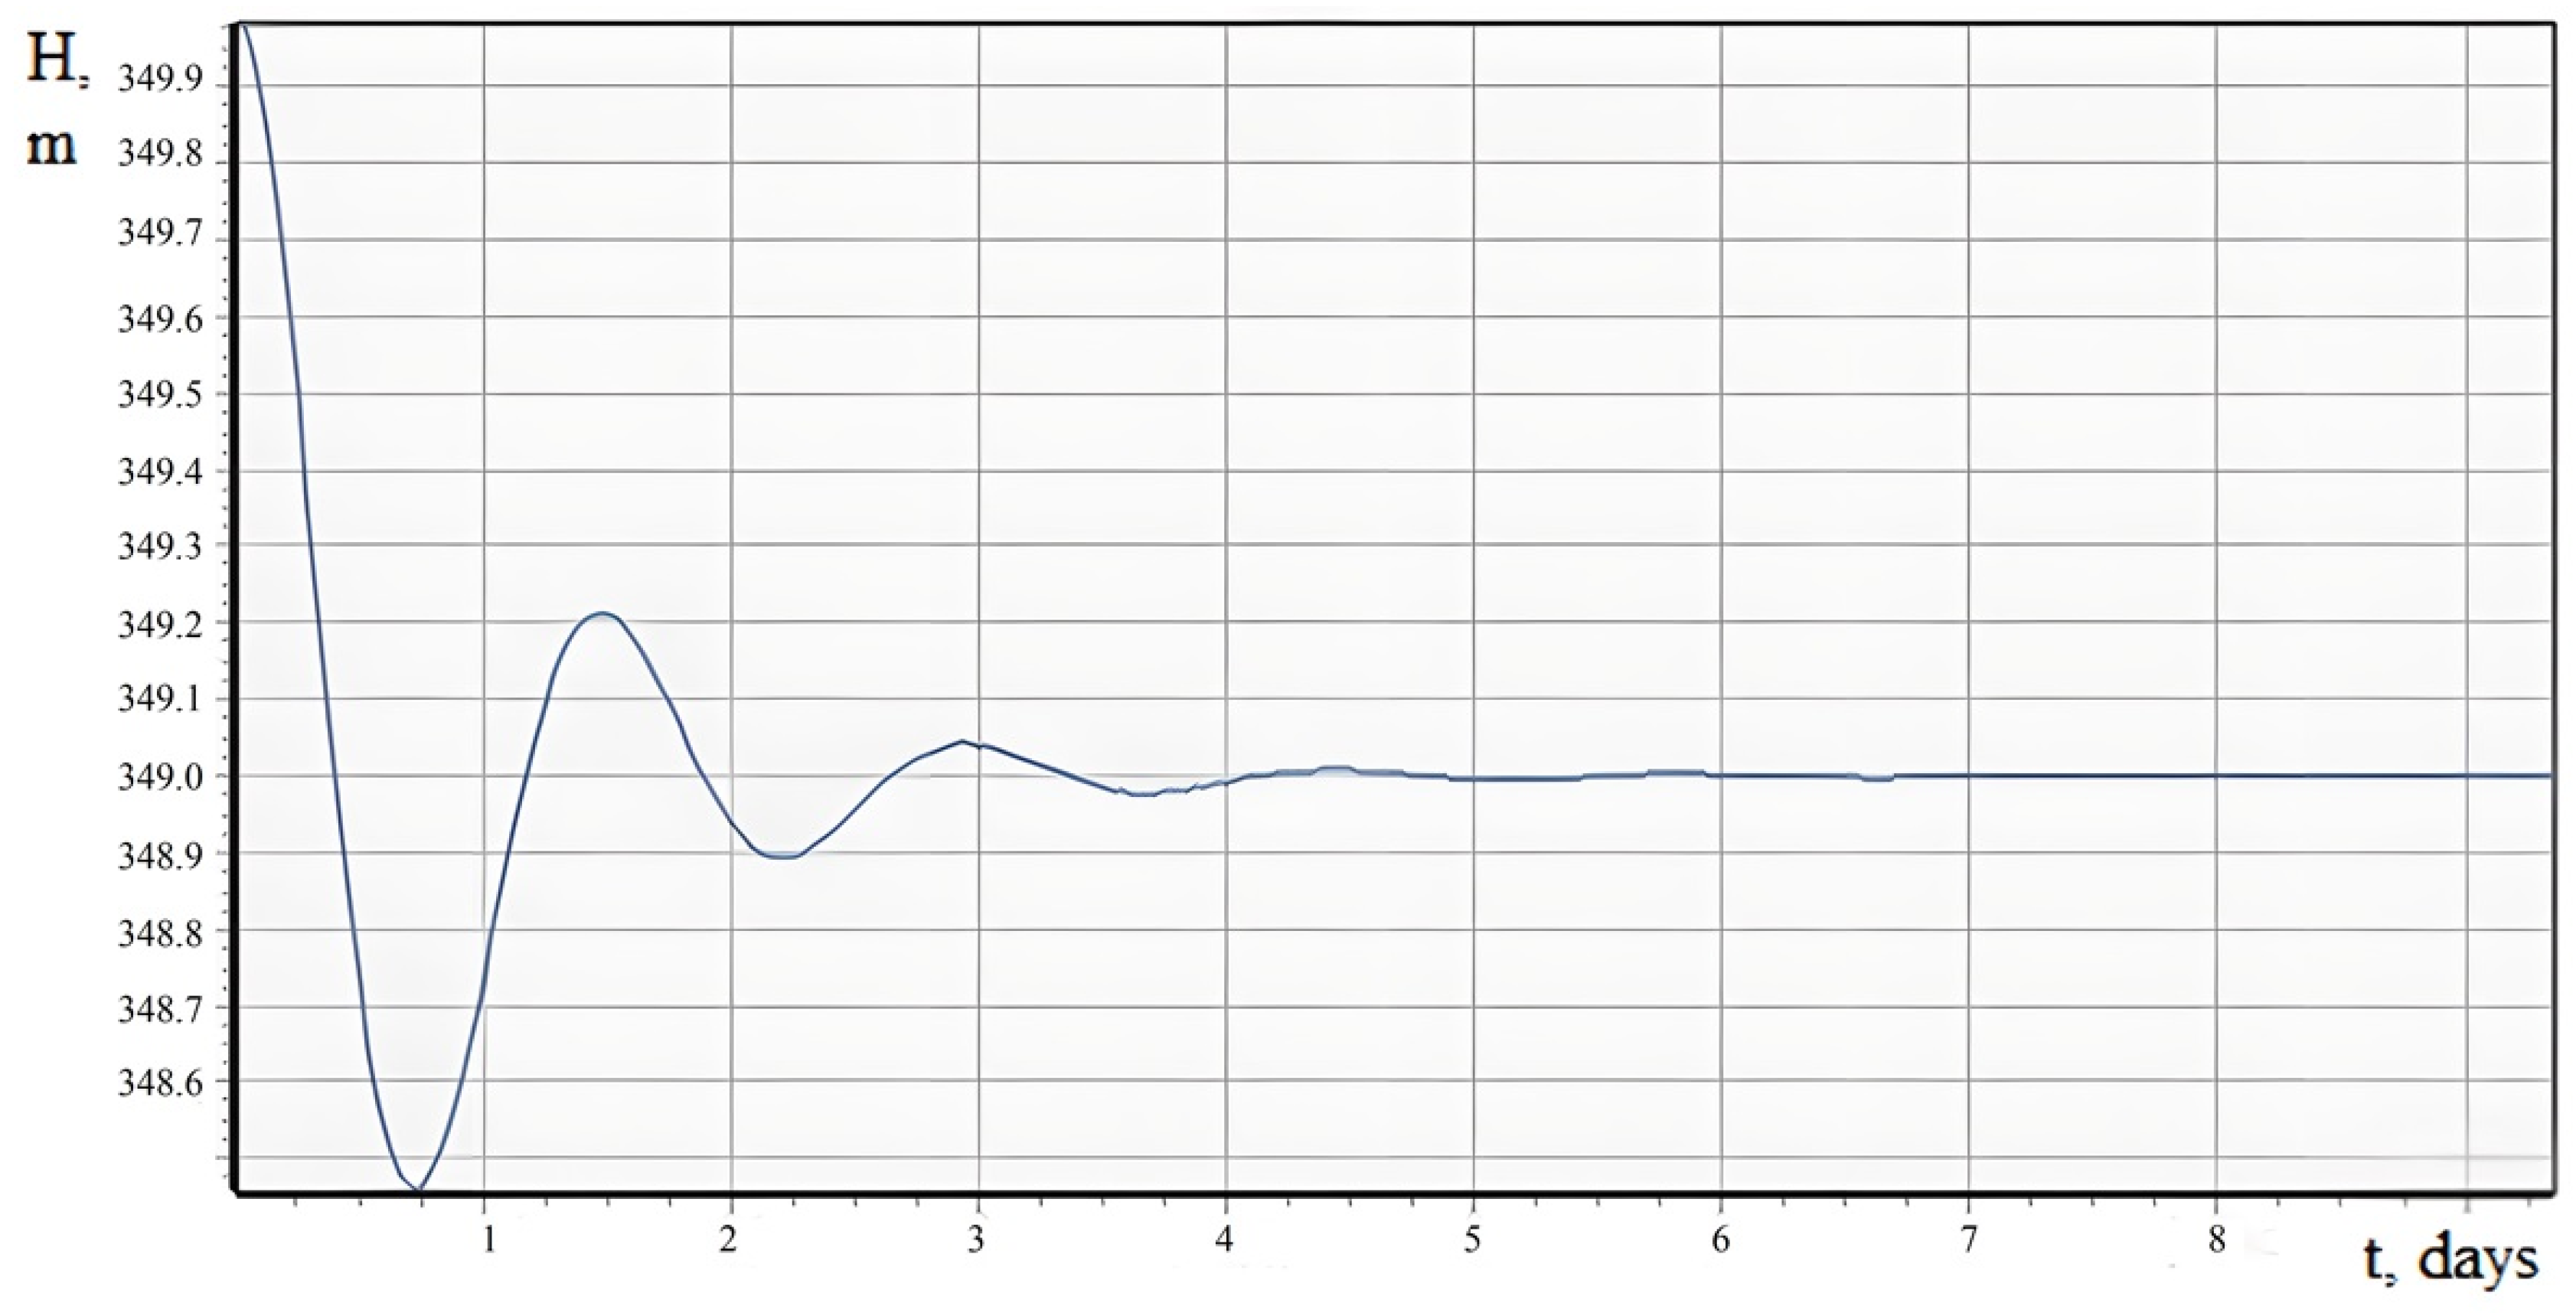
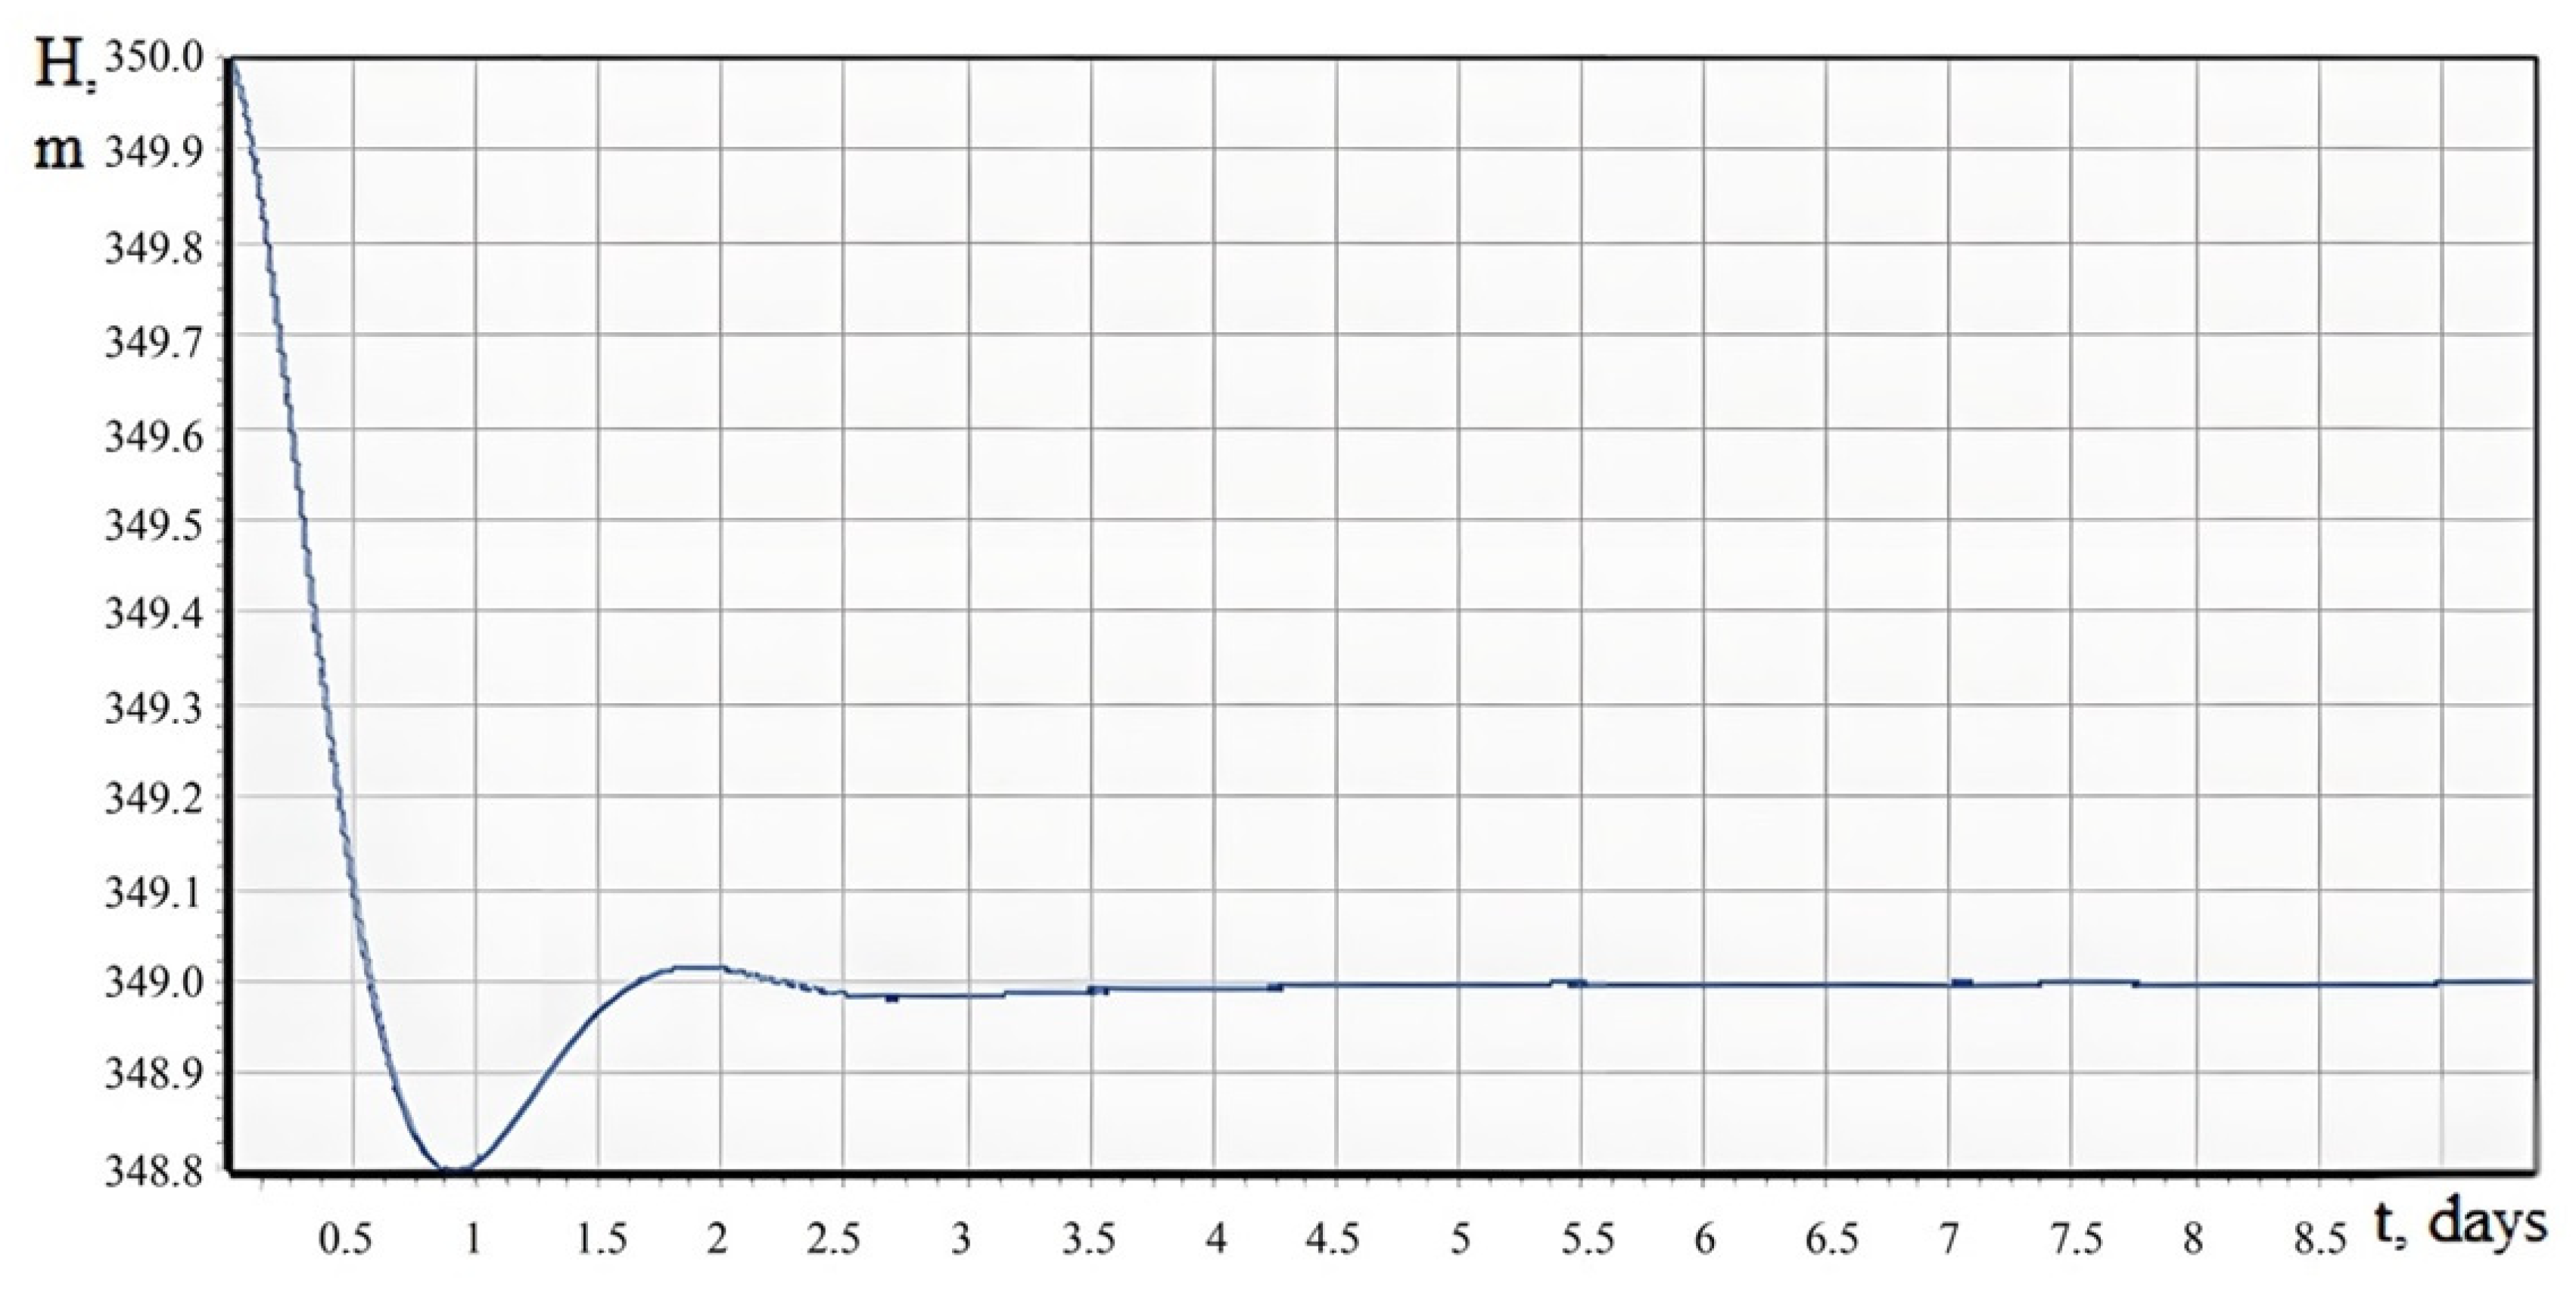
By forming control actions and representing them in a discrete form, algorithms for controlling hydrodynamic processes were obtained. This algorithm was implemented in software that simulates the behavior of a closed loop control system. Figure 7 and Figure 8 show the transient processes of the system using the developed controllers.
The results of simulation of closed loop systems show that the parameters of the synthesized controllers are found correctly, and the systems ensure that the pressure is maintained at a given level. But it is worth highlighting the advantage of a distributed controller over a lumped one, since the overshoot is much less (σdis = 20% < σpid = 53%), and the system reaches a steady state faster.
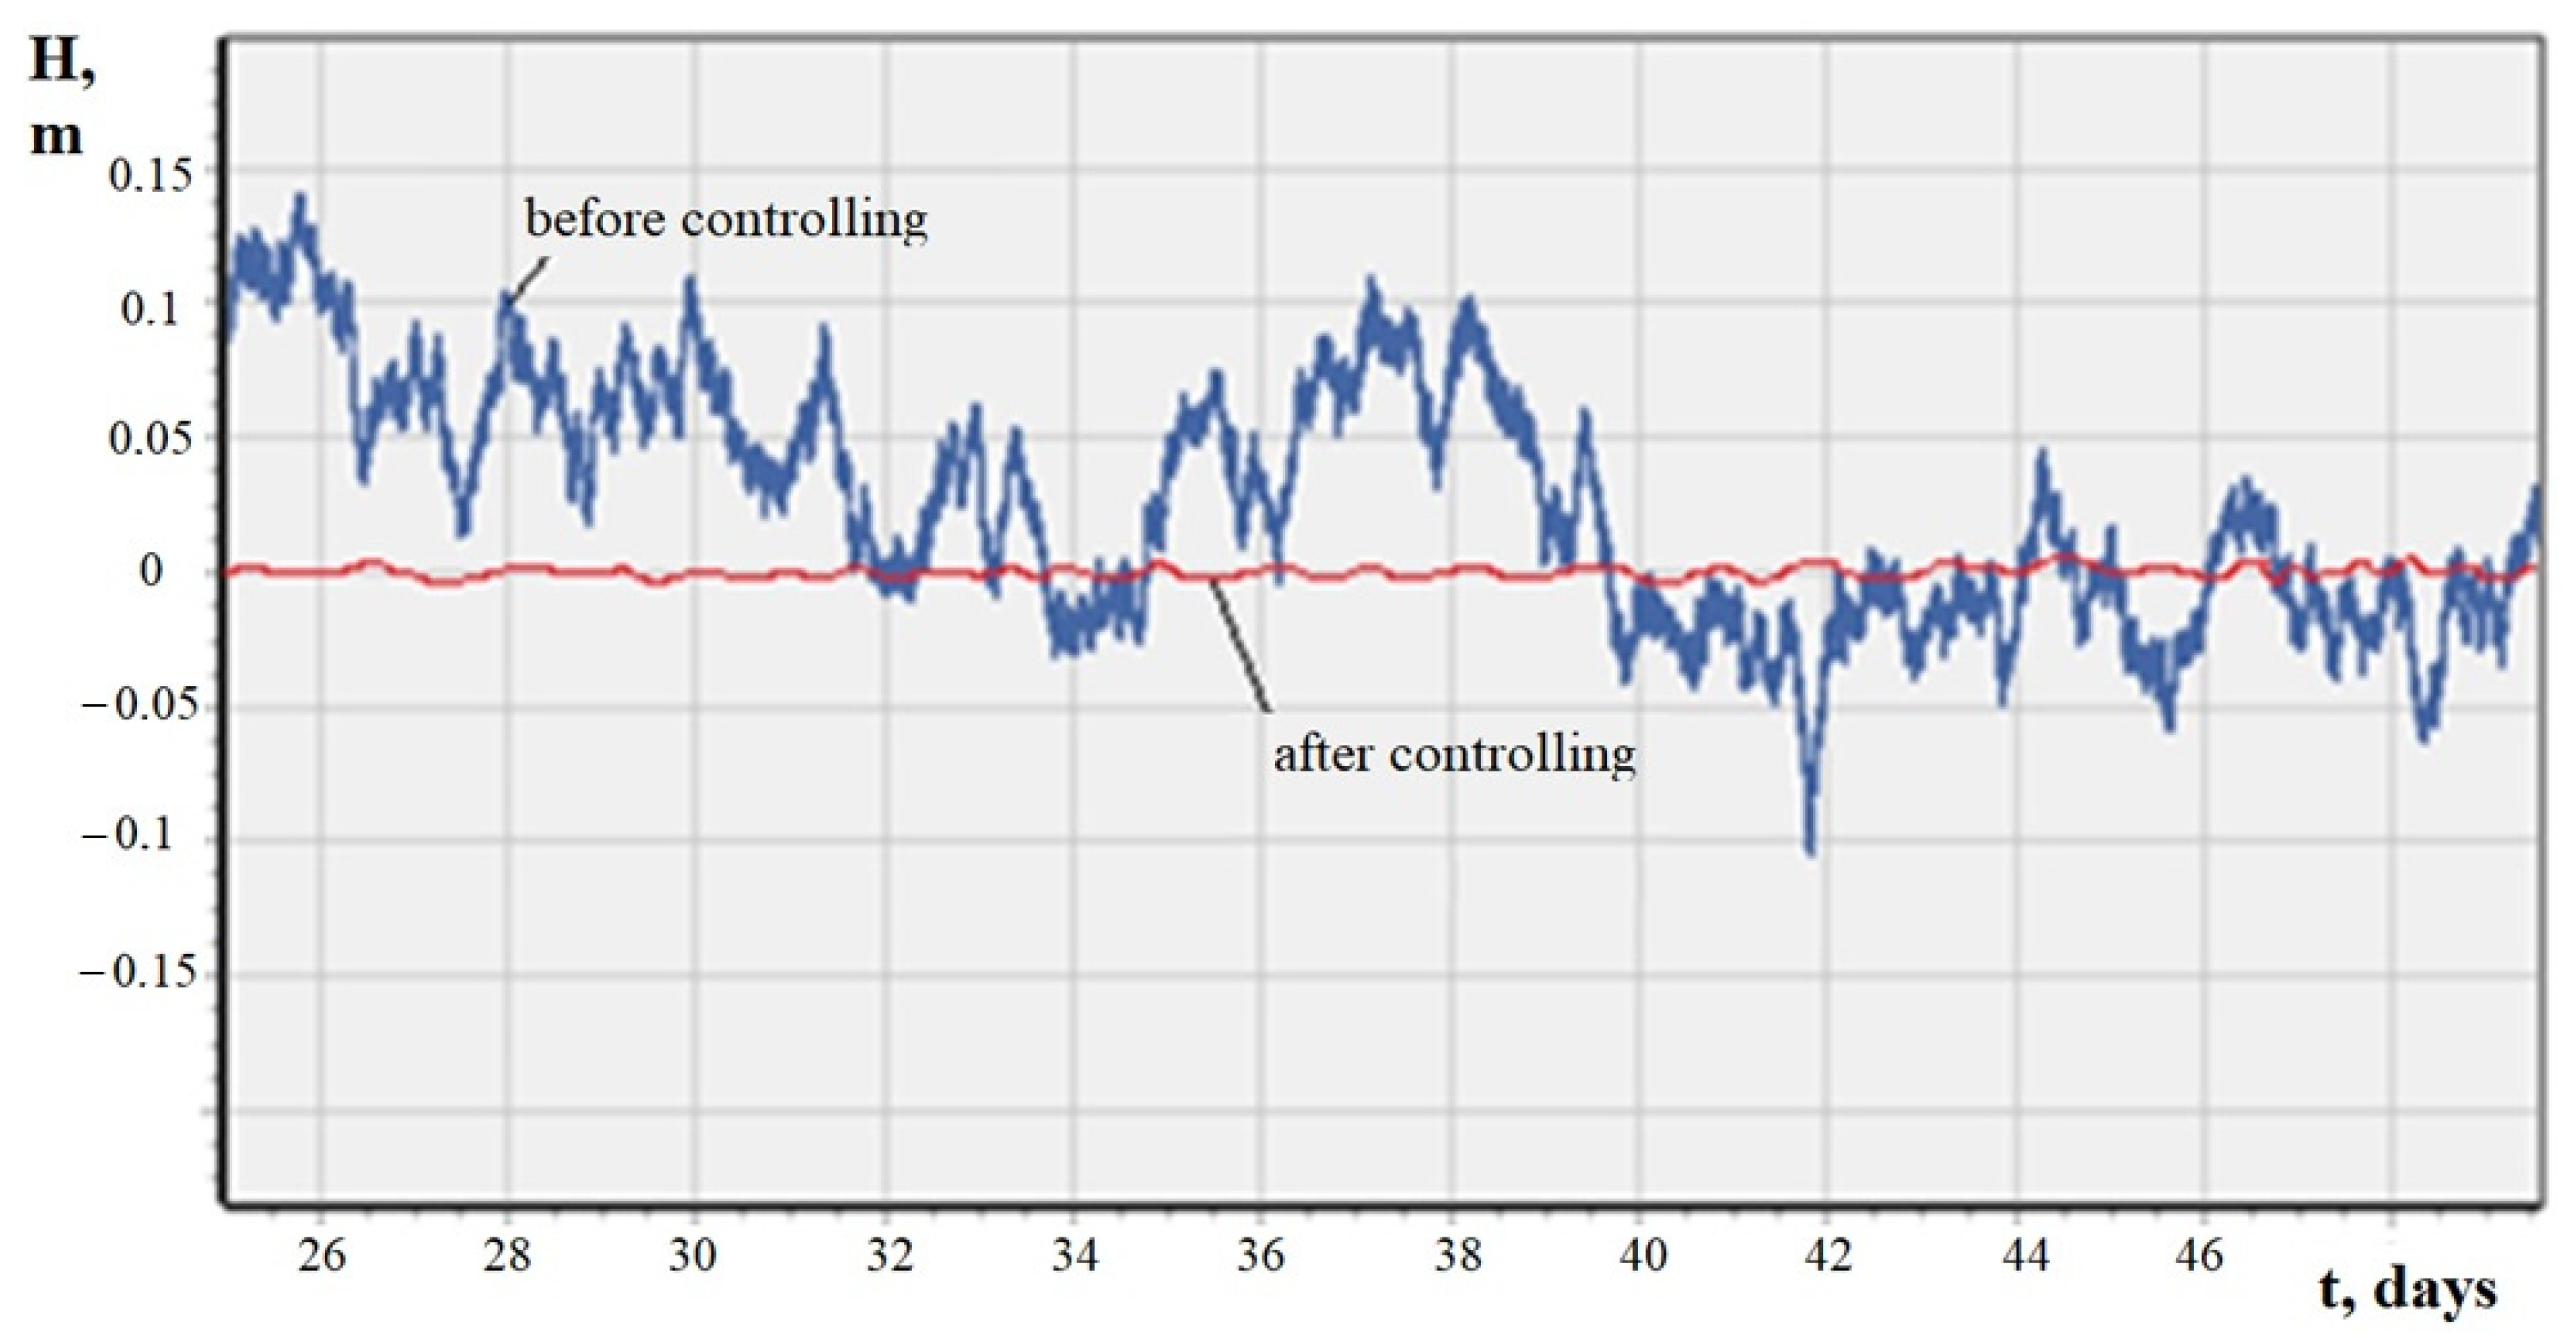
It is worth noting how small the effects of random disturbances on the control system are. Comparison of the random signal at the output of the system and at the output of the object before applying the distributed controller in Figure 9 illustrates that the random effect was reduced (from ±0.15 m to ±0.005 m).
Geofiltration parameters of the simulated area of the field may change over time. Therefore, there was a check of the stability of a distributed control system to parametric disturbances. The developed control system did not lose its operability with a decrease or increase in filtration coefficients by ten times.
These methods can be applied in the regulation of water resources considering the effect of random disturbing factors [15,16]. In addition, the obtained results can be also used in related areas, where objects can be represented in the context of a class of control systems with distributed parameters [33,34,35,36,37,38,39,40,41,42], for human–machine systems [43,44,45,46], and especially for the oil and gas industry [47,48,49,50,51]. The use of these methods will expand the possible ways of solving some economic issues [52,53,54].
6. Discussion
Recently, there has been an increase in the extraction of mineral waters for industrial bottling and for resort purposes. Irrational water intake can lead to a deterioration in the quality of produced water. From the experimental data of the producing company, there are systematic fluctuations in water head. There can be several reasons: damage to equipment, precipitation, changes in porosity, and human factors. This deposit is located near Mount Elbrus, so seismic influence is not excluded. In addition, anthropogenic impacts play an important role. Regarding the latter, the following should be added: since 2010, there has been active development, both in the central part of the city Kislovodsk and its outskirts. Due to the lack of central sewerage, many people use cesspools, which, under the influence of precipitation, leaks into groundwater. Since 2012, contamination of mineral springs has been systematically observed. With a sufficiently high reservoir pressure, contamination is minimized. But due to uncontrolled water withdrawal, a drop in pressure (head) occurs, which leads to an aggravation of the situation.
All these disturbances in this study are considered as a systematic (or possible) effect on the flow rate of water in the aquifer and the head in the wells. As a result, the piezometric level deviates from the desired value. If the deviations are large, then the risk of flow of contaminants into the exploited aquifer increases. This problem can be solved by reducing water production and increasing the set head value, but at the same time, the profit of the producing company will also decrease. However, the use of a synthesized distributed control system shows minimization of the influence of random processes, thus increasing the profitability.
The advantage of the method of considering random effects in the mathematical model makes it possible to reduce their influence. However, fluctuations can be intermittent and take various forms. Therefore, a feedback control system was applied which is able to control the process under uncertain changes. For example, several experiments were carried out with a sharp increase in the parameters of the model. With such uncertain influences, the system is stable and goes into a static mode, but with a longer regulation time.
The advantage of distributed controller, as was mentioned, is less overshoot than with a lumped controller. When using a lumped controller, the head drops significantly lower than when using a distributed controller. This fact increases the risk of flow of contaminants into the aquifer from the upper ones (due to the head difference). Speed plays an important role, because it shows how quickly the control system stabilizes the production process under uncertain disturbances.
However, the advantage of lumped controllers is a simpler implementation compared to distributed controllers.
7. Conclusions
The paper considers methods for the study of hydrogeological objects, distributed control systems and systems under random influences. On the basis of the study performed, conclusions were drawn about the effectiveness of the use of controllers to regulate the processes of pumping mineral water from the exploited aquifer. The main tasks implemented in the framework of the study included:
- A mathematical model that was developed for the study area of the Kislovodsk mineral water deposit, which took into account the impact of random factors on the flow speed and water debits in aquifers.
- A closed loop system was developed for controlling the hydrolithospheric process under random influences. In addition, the use of distributed controllers minimized the deviation of a random variable at the output of the control system.
- Software was developed for modeling a distributed control system of the hydrodynamic process in aquifers under random impacts.
Author Contributions
Conceptualization, Y.V.I. and M.-A.M.A.; methodology, M.-A.M.A.; software, Y.V.I. and M.-A.M.A.; validation, M.-A.M.A.; formal analysis, Y.V.I.; investigation, M.-A.M.A.; resources, Y.V.I.; data curation, M.-A.M.A.; writing—original draft preparation, M.-A.M.A.; writing—review and editing, Y.V.I. and M.-A.M.A.; visualization, M.-A.M.A.; supervision, Y.V.I.; project administration, M.-A.M.A.; funding acquisition, Y.V.I. All authors have read and agreed to the published version of the manuscript.
Funding
This research received no external funding.
Institutional Review Board Statement
Not applicable.
Informed Consent Statement
Not applicable.
Data Availability Statement
Not applicable.
Conflicts of Interest
The authors declare no conflict of interest.
References
- Malkov, A.V.; Pershin, I.M.; Pomelyaiko, I.S. Kislovodskoe Deposit of Carbonic Mineral Waters: System Analysis, Diagnostics, Forecast, Control; Nauka: Moscow, Russia, 2015; 283p. (In Russian) [Google Scholar]
- Lubentsova, E.V.; Masyutina, G.V.; Lubentsov, V.F. Ensuring the compatibility of automated process control systems with related automation systems and automated control systems. Mod. Prob. W. Sol. Sc. Pr. Ed. 2018, 6, 32–34. (In Russian) [Google Scholar]
- Pershin, M.I. Investigation of errors in the dynamic characteristics of distributed objects during approximation. Mod. Sci. Innov. 2014, 4, 46–50. (In Russian) [Google Scholar]
- Pomelyayko, I.S. The evaluation of the size of anthrotechnogenic load on the city territory (on the example of resorts of Caucasian mineral waters). In Proceedings of the XIII International Scientific and Practical Conference of Students, Graduate Students and Young Scientists: Geology in the Developing World, Perm, Russia, 15–17 April 2020; pp. 545–548. (In Russian). [Google Scholar]
- Pomelyayko, I.S.; Malkov, A.V. Problems of the quality of surface and underground waters of the resorts of the Kavkazskie Mineralnye Vody region and ways to solve them. Water Resour. 2019, 46, 178–190. (In Russian) [Google Scholar] [CrossRef]
- Shakhrai, E.A.; Lubentsov, V.F. Analysis of methods for the synthesis of multi-mode control systems for dynamic objects. In Proceedings of the XII International Scientific Conference, Krasnodar, Russia, 25–27 November 2021; pp. 107–113. (In Russian). [Google Scholar]
- Voronin, A.Y. Modified frequency method for searching parameters of a distributed high-precision controller. Mechatron. Autom. Control 2015, 16, 89–95. (In Russian) [Google Scholar]
- Malkov, A.V.; Pershin, I.M. Systems with Distributed Parameters. Analysis and Synthesis; Nauchnyi Mir: Moscow, Russia, 2012; 476p. (In Russian) [Google Scholar]
- Abramkin, S.E.; Dushin, S.E. Study of the hydrogen production unit as a control object. In Proceedings of the X All-Russian Scientific Conference: System Synthesis and Applied Synergetics, Nizhny Arkhyz, Russia, 28 September 2021; pp. 337–341. (In Russian). [Google Scholar] [CrossRef]
- Imaev, D.K.; Smirnov, R.I.; Shestopalov, M.Y.; Kvashnin, S.V. Optimal placement of control system components in the field of intensive physical influences. In Proceedings of the Mathematical Theory of Control and Its Applications (MTUiP-2020), (In Russian). Saint Petersburg, Russia, 7–8 October 2020; pp. 336–339. [Google Scholar]
- Krylova, E.L.; Nemudruk, M.L.; Fedorov, M.S.; Novozhilov, I.M.; Shchurov, D.A. The Use of OPC UA technology in the study of computer models of control objects in the educational process. In Proceedings of the X All-Russian Scientific Conference: System Synthesis and Applied Synergetics, Nizhny Arkhyz, Russia, 28 September 2021; pp. 306–310. (In Russian). [Google Scholar] [CrossRef]
- Chernyshov, S.E.; Galkin, V.I.; Ulyanova, Z.V.; Macdonald, D.I.M. Development of mathematical models to control the technological properties of cement slurries. J. Min. Inst. 2020, 242, 179–190. [Google Scholar] [CrossRef]
- Drovosekova, T.I.; Pershin, I.M. Peculiarities of modeling hydro-lithospheric processes in the region of Kavkazskiye mineralnye vody (Caucasus mineral springs). In Proceedings of the 19th International Conference on Soft Computing and Measurements, Saint Petersburg, Russia, 25–27 May 2016; pp. 215–217. [Google Scholar] [CrossRef]
- Golovina, E.; Shchelkonogova, O. Possibilities of Using the Unitization Model in the Development of Transboundary Groundwater Deposits. Water 2023, 15, 298. [Google Scholar] [CrossRef]
- Golovina, E. Environmental Peculiarities of Transboundary Groundwater Management. Int. J. Mech. Eng. Technol. 2019, 10, 511–519. [Google Scholar]
- Golovina, E.I.; Grebneva, A.V. Management of groundwater resources in transboundary territories (on the example of the Russian Federation and the Republic of Estonia). J. Min. Inst. 2021, 252, 788–800. [Google Scholar] [CrossRef]
- Romasheva, N.V.; Babenko, M.A.; Nikolaichuk, L.A. Sustainable development of the Russian Arctic region: Environmental problems and ways to solve them. Min. Inf. Anal. Bull. 2022, 2022, 78–87. [Google Scholar] [CrossRef]
- Martirosyan, A.V.; Martirosyan, K.V.; Chernyshev, A.B. Application of Fourier Series in Distributed Control Systems Simulation. In Proceedings of the IEEE Conference of Russian Young Researchers in Electrical and Electronic Engineering, Saint Petersburg, Russia, 28–31 January 2019; pp. 609–613. [Google Scholar] [CrossRef]
- Martirosyan, A.V.; Ilyushin, Y.V.; Afanaseva, O.V. Development of a Distributed Mathematical Model and Control System for Reducing Pollution Risk in Mineral Water Aquifer Systems. Water 2022, 14, 151. [Google Scholar] [CrossRef]
- Palyanitsina, A.; Tananykhin, D.; Masoud, R. Strategy of water-flooding enhancement for low-permeable polymictic reservoirs. J. Appl. Eng. Sci. 2021, 19, 307–317. [Google Scholar] [CrossRef]
- Palyanitsina, A.; Sukhikh, A. Peculiarities of assessing the reservoir propties of clayish reservoirs depending on the water of reservoir pressure maintenance system properties. J. Appl. Eng. Sci. 2020, 18, 10–14. [Google Scholar] [CrossRef] [Green Version]
- Asadulagi, M.M.; Vasilkov, O.S. The Use of Distributed and Lumped Type Controllers for the Hydro-lithospheric Process Control System of the Kislovodskoye Field. In Proceedings of the 3rd International Conference on Control in Technical Systems, Saint Petersburg, Russia, 30 October 2019; pp. 7–10. [Google Scholar] [CrossRef]
- Grigoriev, V.V.; Bystrov, S.V.; Mansurova, O.K. Exponential stability regions estimation of nonlinear dynamical systems. Mekhatronika Avtom. Upr. 2020, 21, 131–135. [Google Scholar] [CrossRef]
- Pershin, I.M.; Papush, E.G.; Malkov, A.V.; Kukharova, T.V.; Spivak, A.O. Operational Control of Underground Water Exploitation Regimes. In Proceedings of the 3rd International Conference on Control in Technical Systems, Saint Petersburg, Russia, 1 November 2019; pp. 77–80. [Google Scholar] [CrossRef]
- Kukharova, T.V.; Pershin, I.M. Conditions of Application of Distributed Systems Synthesis Methods to Multidimensional Object. In Proceedings of the International Multi-Conference on Industrial Engineering and Modern Technologies, Vladivostok, Russia, 3–4 October 2018. [Google Scholar] [CrossRef]
- Khabarov, N.; Smirnov, A.; Balkovič, J.; Skalský, R.; Folberth, C.; Van Der Velde, M. Heterogeneous Compute Clusters and Massive Environmental Simulations Based on the EPIC Model. Modelling 2020, 1, 215–224. [Google Scholar] [CrossRef]
- Kupfersberger, H.; Rock, G.; Draxler, J.C. Combining Groundwater Flow Modeling and Local Estimates of Extreme Groundwater Levels to Predict the Groundwater Surface with a Return Period of 100 Years. Geosciences 2020, 10, 373. [Google Scholar] [CrossRef]
- Leigh, J.R. Control Theory: A Guided Tour, 3rd ed.; The Institution of Engineering and Technology: Stevenage, UK, 2012; 472p. [Google Scholar] [CrossRef]
- Richard, A.B. Spectra of digraphs. Linear Algebra Appl. 2009, 432, 2181–2213. [Google Scholar] [CrossRef]
- Rapoport, E.Y.; Pleshivtseva, Y.E. Technology of solving multi-objective problems of control of systems with distributed parameters. Optoelectron. Instrum. Data Process. 2017, 53, 316–328. [Google Scholar] [CrossRef]
- Shestopalov, M.Y.; Smirnov, R.I.; Imaev, D.H. Approximation of the Natural Gas Pumping Compressor Characteristics using a Multi-layer Neural Network. In Proceedings of the 2021 IEEE Conference of Russian Young Researchers in Electrical and Electronic Engineering, Moscow, Russia, 26–28 January 2021; pp. 1088–1091. [Google Scholar] [CrossRef]
- Tsapleva, V.V.; Masyutina, G.V.; Danchenko, I.V. Construction of a mathematical model for the extraction of mineral raw materials. In Proceedings of the IOP Conference Series: Earth and Environmental Science, Veliky Novgorod, Russia, 22 October 2020. [Google Scholar] [CrossRef]
- Klizas, P. Geofiltration studies of clay at the future radioactive waste repository for Ignalina nuclear power plant. J. Environ. Eng. Land. Manag. 2014, 22, 219–225. [Google Scholar] [CrossRef] [Green Version]
- Jensen, J.K.; Nilsson, B.; Engesgaard, P. Numerical Modeling of Nitrate Removal in Anoxic Groundwater during River Flooding of Riparian Zones. Groundwater 2021, 59, 866–877. [Google Scholar] [CrossRef]
- Kondrasheva, N.K.; Eremeeva, A.M. Production of biodiesel fuel from vegetable raw materials. J. Min. Inst. 2023, 300, 1–9. [Google Scholar] [CrossRef]
- Korshunov, G.I.; Eremeeva, A.M.; Drebenstedt, C. Justification of the use of a vegetal additive to diesel fuel as a method of protecting underground personnel of coal mines from the impact of harmful emissions of diesel-hydraulic locomotives. J. Min. Inst. 2021, 247, 39–47. [Google Scholar] [CrossRef]
- Pershin, I.M.; Kukharova, T.V.; Tsapleva, V.V. Designing of distributed systems of hydrolithosphere processes parameters control for the efficient extraction of hydromineral raw materials. J. Phys. Conf. Ser. 2021, 1728, 012017. [Google Scholar] [CrossRef]
- Martirosyan, A.V.; Kukharova, T.V.; Fedorov, M.S. Research of the hydrogeological objects’ connection peculiarities. In Proceedings of the 4th International Conference on Control in Technical Systems, Saint Petersburg, Russia, 21–23 September 2021; pp. 34–38. [Google Scholar] [CrossRef]
- Litvinenko, V.S.; Petrov, E.I.; Vasilevskaya, D.V.; Yakovenko, A.V.; Naumov, I.A.; Ratnikov, M.A. Assessment of the role of the state in the management of mineral resources. J. Min. Inst. 2022, 260, 1–17. [Google Scholar] [CrossRef]
- Martirosyan, K.V.; Chernyshev, A.B.; Martirosyan, A.V.; Tatyana, K.V. Formation of the Anterior Heating Function under the Action of Uniformly Distributed Sources. In Proceedings of the 2020 IEEE Conference of Russian Young Researchers in Electrical and Electronic Engineering, Saint Petersburg, Russia, 27–30 January 2020; pp. 755–760. [Google Scholar] [CrossRef]
- Ilyushin, Y.; Mokeev, A. Technical realization of the task of controlling the temperature field of a tunnel furnace of a conveyor type. Int. J. App. Eng. R. 2017, 12, 1500–1510. [Google Scholar]
- Kukharova, T.V.; Ilyukhina, Y.A.; Shestopalov, M.Y. Development of a Methodology for Controlling the Process of Heating Metal Blanks in a Methodical Furnace. In Proceedings of the 2022 Conference of Russian Young Researchers in Electrical and Electronic Engineering, Saint Petersburg, Russia, 25–28 January 2022; pp. 718–721. [Google Scholar] [CrossRef]
- Arefiev, I.B.; Afanaseva, O.V. Implementation of Control and Forecasting Problems of Human-Machine Complexes on the Basis of Logic-Reflexive Modeling. In Proceedings of the International Conference System Analysis in Engineering and Control, Nanjing, China, 24–26 June 2022. [Google Scholar] [CrossRef]
- Dagaev, A.; Pham, V.D.; Kirichek, R.; Afanaseva, O.; Yakovleva, E. Method of Analyzing the Availability Factor in a Mesh Network. Commun. Comput. Inf. Sci. 2022, 1552, 346–358. [Google Scholar] [CrossRef]
- Kukharova, T.V.; Utkin, V.A.; Pershin, I.M. Modeling of a Decision Support System for a Psychiatrist Based on the Dynamics of Electrical Conductivity Parameters. In Proceedings of the 2021 IEEE Conference of Russian Young Researchers in Electrical and Electronic Engineering, Saint Petersburg, Russia, 26–29 January 2021; pp. 975–978. [Google Scholar] [CrossRef]
- Zlotnikov, K.A.; Afanaseva, O.V.; Shestopalov, M.Y.; Skorobogaty, A.S. Enhancement of Automated Training Systems for Improvement of Staff Training Quality. In Proceedings of the 17th Russian Scientific and Practical Conference on Planning and Teaching Engineering Staff for the Industrial and Economic Complex of the Region, Saint Petersburg, Russia, 14–15 November 2018; pp. 33–35. [Google Scholar] [CrossRef]
- Islamov, S.R.; Bondarenko, A.V.; Korobov, G.Y.; Podoprigora, D.G. Complex algorithm for developing effective kill fluids for oil and gas condensate reservoirs. J. Civ. Eng. Technol. 2019, 10, 2697–2713. [Google Scholar]
- Legkokonets, V.A.; Islamov, S.R.; Mardashov, D.V. Multifactor analysis of well killing operations on oil and gas condensate field with a fractured reservoir. In Proceedings of the International Forum-Contest of Young Researchers: Topical Issues of Rational Use of Mineral Resources, Saint Petersburg, Russia, 18–20 April 2018; pp. 111–118. [Google Scholar]
- Sultanbekov, R.; Denisov, K.; Zhurkevich, A.; Islamov, S. Reduction of Sulphur in Marine Residual Fuels by Deasphalting to Produce VLSFO. J. Mar. Sci. Eng. 2022, 10, 1765. [Google Scholar] [CrossRef]
- Korshunov, G.I.; Eremeeva, A.M.; Seregin, A.S. Justification of reduction in air requirement in ventilation of coal roadways with running diesel engines. Min. Inf. Anal. Bull. 2022, 3, 47–59. [Google Scholar] [CrossRef]
- Eremeeva, A.M.; Korshunov, G.I.; Kondrasheva, N.K. Method to reduce harmful emissions when diesel locomotives operate in coal mines. In Proceedings of the XV International Forum-Contest: Topical Issues of Rational Use of Natural Resources, Saint Petersburg, Russia, 13–17 May 2019; pp. 10–16. [Google Scholar] [CrossRef]
- Gerasimova, I.G.; Oblova, I.S.; Golovina, E.I. The Demographic Factor Impact on the Economics of the Arctic Region. Resources 2021, 10, 117. [Google Scholar] [CrossRef]
- Golovina, E.; Pasternak, S.; Tsiglianu, P.; Tselischev, N. Sustainable Management of Transboundary Groundwater Resources: Past and Future. Sustainability 2021, 13, 12102. [Google Scholar] [CrossRef]
- Tarabarinova, T.A.; Golovina, E.I. Capitalization of mineral resources as an innovation ecological strategy. Geol. Min. Resour. Sib. 2021, 4, 86–96. [Google Scholar] [CrossRef]
Figure 1.
The geological and hydrogeological profile of the Kislovodsk deposit.

Figure 2.
Dynamics of aquifer exploitation.

Figure 3.
Statistical processing of data.

Figure 4.
Schematic model of the field as a control object. F—flow velocity in the aquifer (disturbance); V—decrease in the piezometric level at the locations of production wells (control action); , —sums of deterministic and random components of processes; bi—overflow parameters (constant coefficients obtained experimentally on a real object, characterizing the rate of fluid overflow through aquicludes between layers); H—head in the aquifer (controlled value at the points of location of control wells).

Figure 5.
Object response to the first harmonic and the effect of random disturbance.

Figure 6.
Control system structure. Hdes—desired water head.

Figure 7.
Control process with PID controller.

Figure 8.
Control process with distributed controller.

Figure 9.
Head dynamics before and after controlling.


Table 1.
Information about the mineral water reserves of the Kislovodsk deposit.
| Well № | Exploitation Reserves, m3/Days | Drilling Year |
|---|---|---|
| 23 | 3 | 1955 |
| 8 | 2 | 1963 |
Table 2.
The initial series of level dynamics (in meters) with shifted series for statistical processing.
Table 2.
The initial series of level dynamics (in meters) with shifted series for statistical processing.
| Yt | Yt-1 | Yt-2 | Yt-3 | Yt-4 | Yt-5 | Yt-6 | Yt-7 |
|---|---|---|---|---|---|---|---|
| 821.05 | |||||||
| 821.12 | 821.05 | ||||||
| 821.29 | 821.12 | 821.05 | |||||
| 820.96 | 821.29 | 821.12 | 821.05 | ||||
| 820.89 | 820.96 | 821.29 | 821.12 | 821.05 | |||
| 820.89 | 820.89 | 820.96 | 821.29 | 821.12 | 821.05 | ||
| 820.89 | 820.89 | 820.89 | 820.96 | 821.29 | 821.12 | 821.05 | |
| 820.75 | 820.89 | 820.89 | 820.89 | 820.96 | 821.29 | 821.12 | 821.05 |
| 820.75 | 820.75 | 820.89 | 820.89 | 820.89 | 820.96 | 821.29 | 821.12 |
| 820.75 | 820.75 | 820.75 | 820.89 | 820.89 | 820.89 | 820.96 | 821.29 |
| 821.22 | 820.75 | 820.75 | 820.75 | 820.89 | 820.89 | 820.89 | 820.96 |
| 821.67 | 821.22 | 820.75 | 820.75 | 820.75 | 820.89 | 820.89 | 820.89 |
| 822.05 | 821.67 | 821.22 | 820.75 | 820.75 | 820.75 | 820.89 | 820.89 |
| 822.44 | 822.05 | 821.67 | 821.22 | 820.75 | 820.75 | 820.75 | 820.89 |
| 822.08 | 822.44 | 822.05 | 821.67 | 821.22 | 820.75 | 820.75 | 820.75 |
| 821.55 | 822.08 | 822.44 | 822.05 | 821.67 | 821.22 | 820.75 | 820.75 |
| 821.58 | 821.55 | 822.08 | 822.44 | 822.05 | 821.67 | 821.22 | 820.75 |
| 822.22 | 821.58 | 821.55 | 822.08 | 822.44 | 822.05 | 821.67 | 821.22 |
| 822.91 | 822.22 | 821.58 | 821.55 | 822.08 | 822.44 | 822.05 | 821.67 |
| 823.07 | 822.91 | 822.22 | 821.58 | 821.55 | 822.08 | 822.44 | 822.05 |
| 823.18 | 823.07 | 822.91 | 822.22 | 821.58 | 821.55 | 822.08 | 822.44 |
| 823.52 | 823.18 | 823.07 | 822.91 | 822.22 | 821.58 | 821.55 | 822.08 |
| 823.94 | 823.52 | 823.18 | 823.07 | 822.91 | 822.22 | 821.58 | 821.55 |
| 824.06 | 823.94 | 823.52 | 823.18 | 823.07 | 822.91 | 822.22 | 821.58 |
| 824.06 | 824.06 | 823.94 | 823.52 | 823.18 | 823.07 | 822.91 | 822.22 |
| 823.85 | 824.06 | 824.06 | 823.94 | 823.52 | 823.18 | 823.07 | 822.91 |
| 822.86 | 823.85 | 824.06 | 824.06 | 823.94 | 823.52 | 823.18 | 823.07 |
| 823.2 | 822.86 | 823.85 | 824.06 | 824.06 | 823.94 | 823.52 | 823.18 |
| 822.97 | 823.2 | 822.86 | 823.85 | 824.06 | 824.06 | 823.94 | 823.52 |
| 822.25 | 822.97 | 823.2 | 822.86 | 823.85 | 824.06 | 824.06 | 823.94 |
| 822.15 | 822.25 | 822.97 | 823.2 | 822.86 | 823.85 | 824.06 | 824.06 |
| 821.79 | 822.15 | 822.25 | 822.97 | 823.2 | 822.86 | 823.85 | 824.06 |
| 821.91 | 821.79 | 822.15 | 822.25 | 822.97 | 823.2 | 822.86 | 823.85 |
| 822.25 | 821.91 | 821.79 | 822.15 | 822.25 | 822.97 | 823.2 | 822.86 |
| 822.34 | 822.25 | 821.91 | 821.79 | 822.15 | 822.25 | 822.97 | 823.2 |
| 822.29 | 822.34 | 822.25 | 821.91 | 821.79 | 822.15 | 822.25 | 822.97 |
Disclaimer/Publisher’s Note: The statements, opinions and data contained in all publications are solely those of the individual author(s) and contributor(s) and not of MDPI and/or the editor(s). MDPI and/or the editor(s) disclaim responsibility for any injury to people or property resulting from any ideas, methods, instructions or products referred to in the content. |
© 2023 by the authors. Licensee MDPI, Basel, Switzerland. This article is an open access article distributed under the terms and conditions of the Creative Commons Attribution (CC BY) license (https://creativecommons.org/licenses/by/4.0/).
Share and Cite
MDPI and ACS Style
Ilyushin, Y.V.; Asadulagi, M.-A.M. Development of a Distributed Control System for the Hydrodynamic Processes of Aquifers, Taking into Account Stochastic Disturbing Factors. Water 2023, 15, 770. https://doi.org/10.3390/w15040770
AMA Style
Ilyushin YV, Asadulagi M-AM. Development of a Distributed Control System for the Hydrodynamic Processes of Aquifers, Taking into Account Stochastic Disturbing Factors. Water. 2023; 15(4):770. https://doi.org/10.3390/w15040770
Chicago/Turabian StyleIlyushin, Yury Valeryevich, and Mir-Amal Mirrashidovich Asadulagi. 2023. "Development of a Distributed Control System for the Hydrodynamic Processes of Aquifers, Taking into Account Stochastic Disturbing Factors" Water 15, no. 4: 770. https://doi.org/10.3390/w15040770
Note that from the first issue of 2016, this journal uses article numbers instead of page numbers. See further details here.