
Evaluation of Soil-Water Characteristic Curves for Different Textural Soils Using Fractal Analysis
by
 , , , and
Chunliu Yang
1,2,3,
Jianhua Wu
1,2,3,*,
Peiyue Li
1,2,3,* ,
,
Yuanhang Wang
1,2,3 and
Ningning Yang
1,2,3 1
School of Water and Environment, Chang’an University, No. 126 Yanta Road, Xi’an 710054, China
2
Key Laboratory of Subsurface Hydrology and Ecological Effects in Arid Region of the Ministry of Education, Chang’an University, No. 126 Yanta Road, Xi’an 710054, China
3
Key Laboratory of Eco-hydrology and Water Security in Arid and Semi-arid Regions of the Ministry of Water Resources, Chang’an University, No. 126 Yanta Road, Xi’an 710054, China
*
Authors to whom correspondence should be addressed.
Water 2023, 15(4), 772; https://doi.org/10.3390/w15040772
Submission received: 28 January 2023
/
Revised: 10 February 2023
/
Accepted: 14 February 2023
/
Published: 15 February 2023
(This article belongs to the Topic Hydrosphere under the Driving of Human Activity and Climate Change: Status, Evolution and Strategies)
Abstract
:The soil-water characteristic curve (SWCC) is an essential tool to determine hydraulic and mechanical properties of unsaturated soils. As an inherent influencing factor, soil texture controls the characteristics of SWCCs. Fractal theory can quantitatively describe the physical characteristics of soil. This study used particle size distribution data and water content data contained in the UNSODA2.0 database to explore the fractal characteristics of 12 soil types with different textures under different matrix suctions. The SWCC fractal model was adopted to characterize the hydraulic properties of soil with various soil textures. The findings revealed that the mass fractal dimensions of particles from these 12 different soil types significantly differed and were closely related to the clay content. Fractal dimension increased with increasing clay content. The fractal dimension established a good relationship between soil structure and hydraulic properties. Fractal analysis can be used to determine the connection between physical properties and soil hydraulic parameters. The estimated results of the SWCC fractal model indicated that it had a good performance regarding the description of SWCCs for the 12 soil textures. The soil structure could be described through fractal dimensions, which can effectively indicate soil hydraulic characteristics. The estimated fractal dimension of this model could be obtained by particle size distribution. Furthermore, using the SWCC fractal model, we found that the SWCC of coarse textured soil changed sharply in the low suction stage and its residual water content was small, and the SWCC of fine textured soil changed gently with a large residual water content. The water retention capacity followed the order clay > silty clay > sandy clay > clay loam > silty clay loam > sandy clay loam > loam > silt loam > sandy loam > silt > loamy sand > sand.
1. Introduction
Unsaturated soils have been extensively studied in environmental science and geotechnical engineering for revealing their hydraulic and mechanical characteristics [1,2,3,4,5,6]. Some of the major properties of unsaturated soil could be represented by the soil-water characteristic curve (SWCC), which describes the complex relationship between matrix suction and water content in the soil [7,8,9,10]. Scientists have carried out numerous studies on the SWCC to better understand water infiltration, soil erosion, shear strength, and slope stability of soils [11]. For example, Zeng et al. [12] measured the SWCC of disintegrated carbonaceous mudstone (DCM) for highway embankments in southwest China to determine stability problems. Wang et al. [13] established the SWCC model of mine wastes to assess the incidents of tailing dams under conditions of rainfall or flood. Moazeni-Noghondar et al. [14] predicted the soil water conditions after rainfall in eastern Iran by transforming the SWCC from the soil water-suction curve to the suction-time curve to study soil erosion. These studies indicated that the strength and hydraulic properties of soil can be described quantitatively by the SWCC, which plays a crucial role in engineering construction and environmental improvement.
The SWCC of unsaturated soils is greatly influenced by different conditions, such as drying and wetting cycles [15] soil texture [16], soil dry density [17,18], initial water content, particle sizes [19], and pore structure [20,21]. Iyer et al. [22] measured the two finely grained soils’ SWCCs (kaolin soil and bentonite soil) under different initial water contents by changing the ratio of water weight to dry soil weight, and found that its SWCCs showed significant differences only when soil suction was below 500 kPa, whereas the SWCCs of soils overlap when soil matrix suction was above 1000 kPa. Li et al. [23], analyzing the SWCCs of 120 soil samples of seven soil types, concluded that the available water content (AW) of finely textured soil was higher, whereas the values for sandy soils were lower. Mahmoodlu et al. [24] employed the van Genuchten model to estimate the mixed sand’s SWCC curves with different particle sizes and found that the shape parameters of the SWCC (α) decreased with decreasing porosity, which indicated that sand with a larger porosity had a smaller air-entry value. Shen et al. [25] explored SWCCs of calcareous silty sand, and they showed some differences in the boundary effect stage (0–5 kPa) and the residual stage (10–750 kPa), whereas the SWCCs were similar in the transition stage. Fine particle content affects SWCCs by mainly controlling the number of soil pores. When fine particle content increases, the pore size formed in the soil decreases, but the porosity may increase [26]. Zhu et al. [27] researched the impacts of soil particle size on SWCCs for the Gaomiaozi (GZM) bentonite pellet-contained material, a Na-bentonite found from Inner Mongolia, China, under different suction ranges. Based on their results, the SWCC was less affected by soil particle distribution under high suction, but was more sensitive to particle size under low suction. These findings showed that the SWCCs of soils with different textures are significantly different, which will further affect the soil water retention capacity. Soil texture was universally divided into 12 types based on the weight ratio of clay fraction (<2 µm), silt fraction (2–50 µm), and sand fraction (>50 µm) [28], and any soil sample can be classified into one of these types. However, there are few studies on the differences of the SWCCs for all soil textures, and identifying the differences of SWCC performance in all soil textures can help in understanding the variations in the water retention capacity of soils and the problems of soil pollution and soil stability.
Considering the importance of SWCCs in geotechnical engineering, the SWCC has been estimated using experimental methods and mathematical models [29,30,31,32]. For example, Matlan et al. [33] evaluated the performance of four empirical models (Van Genuchten model, Kosugi model, Brooks and Corey model, and Modified Gardner model) to forecast the SWCCs of sand, clay, and silt. Soltani et al. [34] developed a new method to determine two parameters describing SWCC changes using soil of different textures, including air-entry value and residual matrix suction. Tao et al. [35] optimized two prediction methods of the SWCC for sandy loam with different dry densities considering soil water evaporation, reducing the workload of measuring SWCCs. However, these above empirical models contain parameters whose physical meanings are unclear. In 1967, Mandelbrot [36] proposed the fractal theory to specifically describe complex and irregular objects. The application of this theory solves the problem of the unclear physical meanings of parameters in the empirical models. In this theory, soil is considered a complex natural fractal medium with self-similarity, and its particles and pores both have fractal characteristics [37,38,39,40]. Fractal dimension, a parameter characterizing the fractal property of an object, can describe soil structure quantitatively, such as pore and particle of soil [41,42,43,44,45,46]. Furthermore, fractal dimension can also establish a link between soil structure and soil-water characteristic curves (SWCC) [47,48], thus providing a convenient method to settle the problem of time-consuming and laborious SWCC measurement. For example, Tyler and Wheatcraft [49] deduced a fractal model of SWCC to represent the volumetric distribution of soil pores through the Sierpinski carpet. Bird et al. [50] established the relationship of the SWCC with the fractal characteristics of soil particle mass distribution. Huang et al. [51] analyzed the fractal dimensions of the soil structure with different textures based on fractal theory and established an equation for the connection between the fractal dimensions of soil particle mass and the clay content. Using the SWCC fractal model, Tao et al. [52] conducted a study on the impacts of clay content and initial porosity on hydraulic properties of soil and provided a theoretical explanation for the effects of the two elements on the SWCCs. Zhou et al. [53] provided a straightforward physical model using fractal theory to evaluate the effect of initial porosity on the soil-water characteristic curve and the hydraulic conductivity of unsaturated soil. Zhang et al. [54] applied this theory to loess and reported that the fractal dimension of soil particles closely depended on soil water distribution, which was an effective tool to explain soil hydraulic characteristics in the loess region. The application of fractal theory in soil property studies simplifies the quantitative expression of soil complex structures (particles and pores) and provides a reliable parameter for accurately predicting soil water holding capacity and for revealing soil-water transport law by establishing the relationship between soil’s physical properties and hydraulic properties. In general, fractal theory is an effective analytical method in soil property studies and should be worthy of extensive application.
The water retention capacity and hydraulic parameters of soil are different for soil with different textures. Traditionally, the hydraulic properties can be expressed directly by the SWCC, the determination of which, however, is time-consuming. The SWCC can also indirectly reflect the property of soil structure distribution (pore and particle). Considering this, the fractal theory, which is a simple tool to combine soil structure with hydraulic properties, was used in this research to study the SWCCs for various types of soil, hoping to finding an easier way to quantify the hydraulic properties of soil. In this sense, the purposes of this article are (1) to analyze fractal properties of soil particles to study the structural differences of soil with various textures, and (2) to establish an SWCC fractal model to study the difference of hydraulic characteristics for soil with various textures. The research could provide a basis for accurate prediction of SWCCs and contribute to solving some engineering problems and the management of the ecological environment.
2. Materials and Methods
2.1. Fractal Theory
Fractal theory can quantitatively characterize soil structural characteristics, such as soil particles and pore structures, by the fractal dimension (D), according to Mandelbrot [36]. There are two methods to figure out the fractal dimension of soil particles, including the particle mass fractal dimension and the particle volume fractal dimension. Generally, soil particle mass can be obtained easily and is therefore generally used for calculation. Fractal objects have two main features. One is its magnitude M(L), in which the measured scale L obeys the following scaling relationship:
In the above equation, Df is the fractal parameter, M(L) can represent the mass, volume, or length of a fractal object, and L is the scale.
The second feature is that the cumulative number N can be expressed by its size distribution, using the following relation:
For soil particles, λ and λmax are the grain size and the maximum particle size, respectively. Following Turcotte [55], a fractal model of the soil particle number was proposed to characteristic soil structure, which can be shown as follows:
In Equation (3), N (> R) indicates the number of particles with grain size greater than R, C is a constant dependent upon the soil properties, and D1 is the particles’ fractal dimension of soil particles’ number. If the sum number of soil particles of different particle sizes and each particle size are obtained, the fractal dimension of the soil particle size can be solved by using Equation (3). However, it is rather difficult to obtain the number of each soil particle, because it is often subject to large error in the actual operation process.
Generally, the particle size distribution and its cumulative percentage curve can be used to represent a soil’s particle size distribution. Tyler and Wheatcraft [56] believed that the distribution of soil particle mass could account for fractal dimension in the model, which is easy to obtain, to derive a fractal model of particle mass distribution.
Mandelbrot [36] gave the fractal formula for particle surface area, in which the particle size is larger than a certain scale R:
In this formula, A (r > R) is the particle surface area with a particle size greater than R, R is particle size, Ca and λa are both constants related to soil particle shape and size, and D1 is the same as in Equation (3). The formula indicates that area A tends to be constant as the particle size decreases. By introducing it into a three-dimensional domain, we can obtain the expression of soil particle size and particle volume as follows:
where, CV and λV describe the particle shape and size. If we assume soil density ρ being a constant, the particle mass with particle size greater than R is expressed as follows:
Therefore, the total soil particle mass is:
The combination of Equations (5) and (6) can yield:
Here, λV can be calculated through the upper limit of the maximum particle scale RL, and when R is equal to RL, we could get M (r > R)/MT = 0, and λV equals RL. Consequently, Equation (8) could also be expressed by:
Equation (10) is the fractal model based on particle mass distribution established by Tyler and Wheatcraft [56], and the D1 in Equation (10) is the mass particle fractal dimension. Through the linear fitting calculation of Equation (10), taking M (r > R)/MT and R/RL as the vertical and horizontal coordinates, respectively, the mass fractal dimensions with different soil textures can be obtained.
2.2. Fractal Model of the SWCC
Many fractal models for understanding SWCCs were established. A widely used SWCC fractal model was derived by Bird [50] using the soil particle mass distribution and combined the pore-solid fractal (PSF) model with the Young–Laplace equation. The Pore-Solid Fractal (PSF) model was established by Perrier et al. [57], which was a generalized fractal model describing soil particle mass distribution. This model describes soil complexity and divides the soil into three parts, i.e., pore set (P), solid set (S), and fractal set (F). The proportions of these three parts satisfy the relation of p + s + f = 1. Assuming that there is a fractal object with a characteristic length of L, the fractal set (F) consists of Nf sub-regions of size rf(1). Correspondingly, the pore set (P) and the solid set (S) are also made up of Np sub-regions of size rp(1) and Ns sub-regions of size rs(1), respectively. Based on the assumption, Bird et al. [50] presented a fractal model to predict SWCC as follows:
where, Φ is soil total porosity, D2 is fractal dimension, h is matrix suction, and hmin is air-entry value of soil. θ and θs represent the volumetric water content and saturated volumetric water content, respectively.
Consequently, Equation (11) suits the three dimensions:
Equation (13) is a generalized fractal model of SWCCs according to the PSF model. D2 is the fractal dimension of mass or volume, and the other parameters have the same meanings as Equation (11). Compared to other complex SWCC models, such as the Van Genuchten model and the Fredlund & Xing model [58,59], this fractal model is simple in its expression form. The model is fully consistent with the empirical Brooks-Corey model [30] and the Campbell model [60]. The advantage of this model is that it gives clear physical meaning to the fitting parameters and closely links the soil’s basic physical properties with its hydraulic properties.
Three main parameters are important in Equation (13), namely saturated volumetric water content (θs), fractal dimension (D2), and air-entry value (hmin). The UNSODA 2.0 database provided the values of saturated volumetric water content (θs) for different types of soil, and the fractal dimension (D2) could be theoretically computed using Equation (10). The air-entry value (hmin) is also researched by many researchers, and refers to the difference value between the water pressure and air pressure in soil when the maximum pore starts to drain water [61]. It is a threshold on the SWCC and can display soil pore structure features and water infiltration characteristics in soil [62]. The determination of soil air-entry value is of important meaning to explore the permeability of unsaturated soil. Soils with different textures have different air-entry values; for example, the air-entry value of clay is larger than sand [63]. Rawls et al. [64] provided a series of typical air-entry values for soils with different textures (Table 1).
2.3. Data Sources
The U.S. Salinity Laboratory has developed a database of UNSODA 2.0 on unsaturated soil from many regions of the world (http://www.ussl.ars.usda.gov/, accessed on 10 November 2022). The database has 790 soil samples and provides details about the basic properties and hydraulic properties of each soil sample, including saturated hydraulic conductivity (Ks), particle size distribution data, and volumetric water content (θ) under different pressure (h) values [65]. Soil particle size distribution (PSD) was measured via dry sieving, and the relationship between volumetric water content (θ) and pressure head (h) was measured using pressure plate extractors. As per the American Soil Texture Classification Standard, the soil types in the database can be divided into sand (0.05–2 mm), silt (0.002–0.05 mm), and clay (< 0.002 mm) [66]. Therefore, these 790 soil samples from the UNSODA 2.0 database can be classified into 12 types of soil textures, namely sandy clay, silty clay, silty clay loam, sandy clay loam, sand, loamy sand, sandy loam, silt, silt loam, clay loam, loam, and clay.
In this research, 357 soil samples covering 12 soil textures from the UNSODA 2.0 database were randomly selected to study the fractal characteristics of soils of different textures. Moreover, the SWCC fractal model was established by using the water retention data (θ–h) of these 357 samples contained in the database. To do this, the mass fractal dimension (D1) of each soil texture was initially obtained by using soil particle distribution data and the logarithmic fitting of Equation (10). Subsequently, the changes in the SWCC with different soil textures were analyzed using the above same data (θ–h) and the SWCC fractal model.
For the SWCCs for different soil textures, we used statistical parameter (R2) to quantify the performance of this SWCC fractal model, and the expression of goodness of fitting (R2) could be shown as follows:
where, n is the sample number, θi is measured soil volumetric water content, is estimated soil water content, is average of measured soil water content, and is the average of estimated soil water content.
3. Results and Discussion
3.1. Fractal Dimension of Different Textural Soil
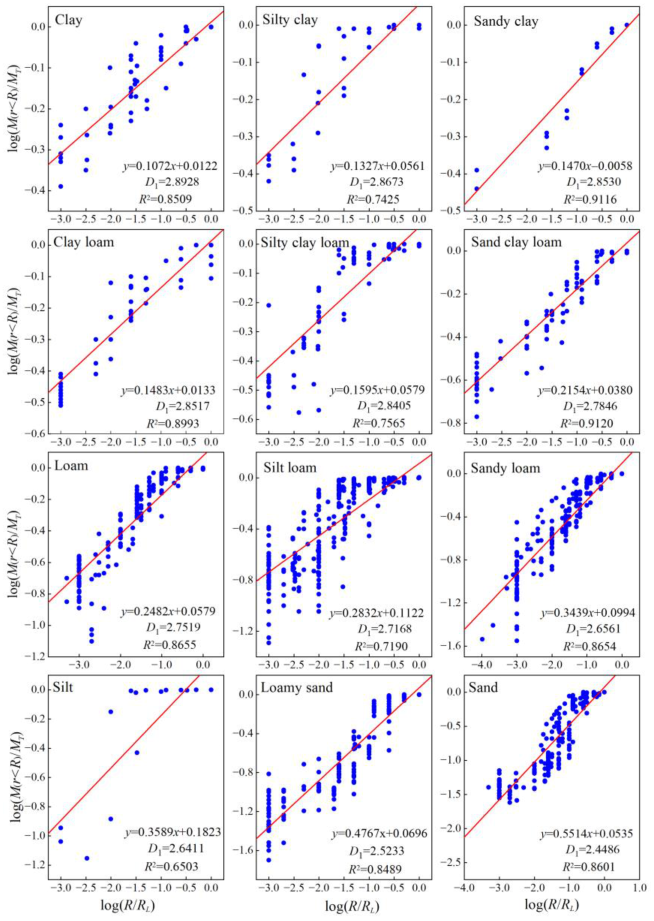
The results of the fractal dimensions for soils with different textures, obtained using the particle mass distribution data of 357 soil samples, were shown in Figure 1 and Table 2. There was a good linear correlation between log (M (r < R)/MT) and log(R/RL), and we can know that the value goodness of fitting (R2) varied from 0.6503 for silt to 0.9120 for sandy clay loam (Table 2). Figure 1 shows that the slopes of the fitting lines (k) for soil with different soil textures were different. The mass fractal dimensions (D1) of soils with different textures were calculated by D1 = 3-k, and the mass fractal dimension (D1) decreased as the slope of this fitting line increased.
As shown in Figure 1, clay has the steepest fitting line with the largest D1, whereas the sand has the smallest D1. Overall, the values of D1 for the soils with different textures ranged between 2.4024 and 2.8928 (Table 2) and followed the order (from largest to the smallest) clay, silty clay, sandy clay, clay loam, silty clay loam, sandy clay loam, loam, silt loam, sandy loam, silt, loamy sand, and sand. Huang and Zhang [41] obtained some similar results by investigating the fractal characteristics with 12 textural soils.
Correlation analysis was applied to study the relationship between D1 and three particle size fractions (clay content, silt content, and sand content) of 12 different soil textures. As shown in Table 3, the mass fractal dimension (D1) had different degrees of correlation with three particle contents. Specifically, the value of D1 was correlated with clay content and silt content positively (p < 0.01), while it was correlated with sand content negatively (p < 0.01). Particularly, fractal dimension was strongly dependent on clay content. The finding of this research is similar to the results of Millán et al. [67] and Zhao et al. [68]. Millán et al. [67] even explored a linear relationship between the fractal dimensions of soils with different textures and the clay content.
A soil’s fractal dimension reflects its capacity to fill pore spaces with soil particles. Smaller pore size is usually observed in soil associated with a higher ratio of finer particles (i.e., clay content), and the soil structure with a higher ratio of finer particles would be more compacted, thus showing a larger fractal dimension [69]. Conversely, a looser soil structure leads to a smaller fractal dimension. Therefore, it can be concluded that the fractal dimension is a representative index for soil particle composition. Some scholars have used the fractal dimension to describe the spatial variability of soil textures and to monitor the degree of soil erosion and desertification [70,71].
3.2. Fractal Modeling of the SWCC
The SWCC fractal model presented in Equation (13) was proposed by Bird [50] to estimate soil water retention data with different textures. Table 4 showed the results of estimated SWCCs with different soil textures. The average goodness of fitting (R2) ranged from 0.8584 to 0.9419, showing that the SWCC fractal model exhibited a good prediction performance. The estimated fractal dimension (D2) of soils is identical with that of the mass fractal dimension (D1) calculated. However, we found that the mass fractal dimension (D1) is not equivalent to the estimated fractal dimension (D2), and the D1 value calculated by using PSD data was slightly lower than the fitted D2 value (Table 4).
The relative error range of these two fractal dimensions was 1.59%–7.34%, and the mean relative error of 4.09% was less than 5%. Similarly, Huang and Zhan [72], investigating the relationship between mass fractal dimension (D1) and estimated fractal dimension (D2), suggested that the D2 of the SWCC fractal model can be replaced by D1. In the subsequent research on the differences in hydraulic properties in soils with different textures, the SWCC fractal model expressed in Equation (13) was adopted, and the values of D1 calculated in Section 3.1 were used as parameters in this model. Considering the applicability of the fractal model in this study, the air-entry values (hmin) in Equation (13) were selected from the empirical values recommended by Rawls et al. [64], as shown in Table 1.
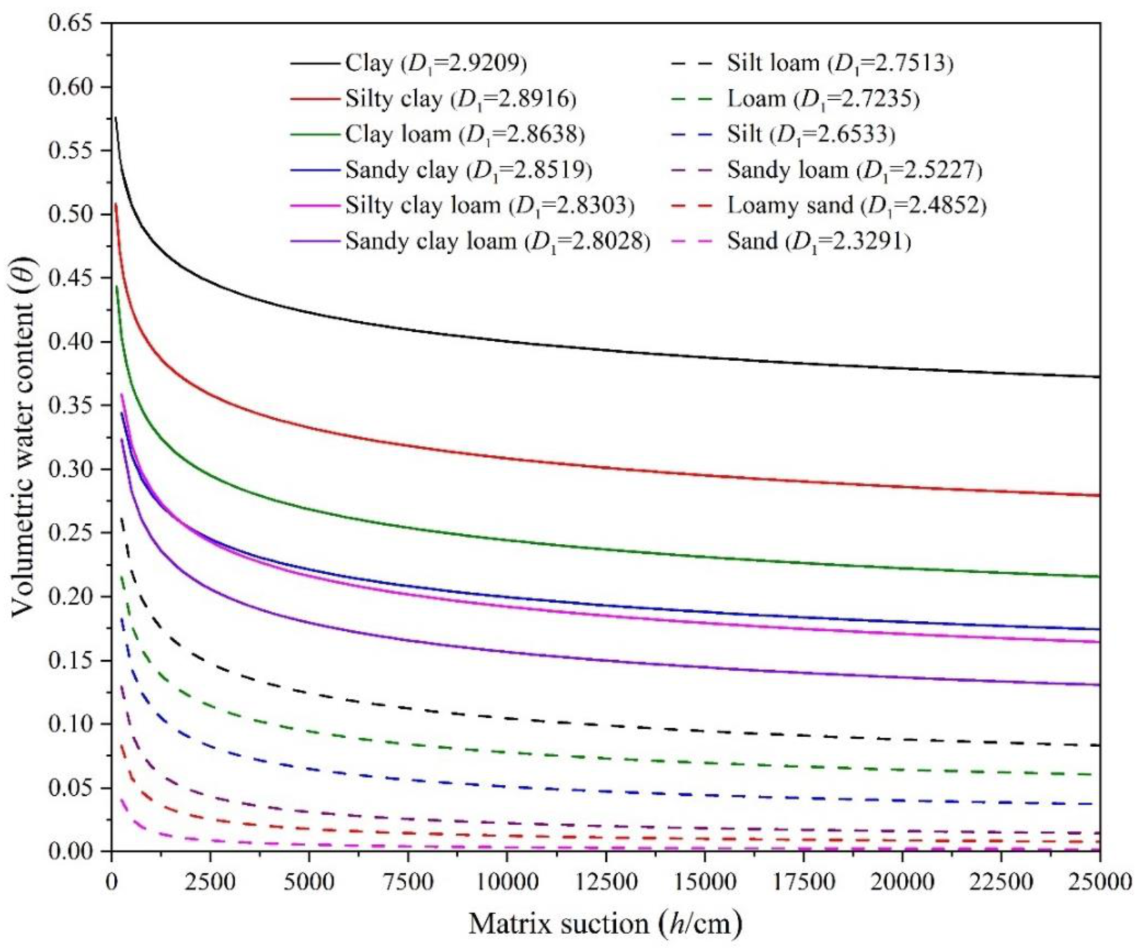
Overall, we selected 12 representative soil samples to evaluate the differences in SWCCs (Table 5). These 12 representative samples’ basic physical properties were similar, with particle densities between 2.54 and 2.78 and porosity between 0.34 and 0.56. None of these physical properties of sandstone were provided in the database. We introduced the three parameters (θs, D1, and hmin) of each sample into Equation (13) to obtain the expression of the SWCC and generated the corresponding graph using Origin 8.0. Figure 2 shows the SWCCs for these 12 representative soil samples.
As seen in Figure 2, the volumetric water content decreased gradually as matrix suction increased. In the low matrix suction section (h < 2500 cm), the SWCC changed sharply. It indicates that a smaller increase of matrix suction will lead to a rapid decline in volumetric water content. However, the curve changed gently in the high suction stage (h > 2500 cm), and the volumetric water content changed slightly with the increase of matrix suction. The change trend of coarse textured soil (sand, loamy sand, sandy loam) was the strongest in all 12 types of soils, followed by medium textured soil (silt, loam, silt loam, sandy clay loam, silty clay loam) and fine textured soil (sandy clay, clay loam, silty clay, clay). Generally, soil water can be retained by both soil adsorption force and capillary force. However, the capillary force usually attracts water molecules in the low suction stage, while water molecules were retained by soil particles mainly by the adsorption force in the high suction stage [73]. Therefore, soil with different textures showed different trends in SWCCs.
There was an apparent inflection point in SWCCs of all soil samples, which is in connection with residual water content [74]. The corresponding volumetric water content and matrix suction at the inflection points of soils with different textures significantly differed. The order of the volumetric water content at the inflection point was consistent with the order of the fractal dimension of different textures. In addition, under the same water content, soil with a larger fractal dimension had a larger matrix suction. Similarly, the soil volumetric water content was higher for a larger fractal dimension of soil under the same suction condition. This suggests that the fractal dimension may control the shape of the SWCCS with fractal characteristics [75]. The SWCC reflects the water retention capacity of soil. In this study, clay had the strongest water retention capacity while sand had the weakest, and the order of other textures was consistent with the fractal dimension order. Rusell [76] put forward that the water retention capacity of soil was mostly achieved through the adsorption of soil particles and that smaller particles have a larger surface area and a better capacity to attract water molecules. Consequently, soil with higher clay content has better water retention ability. Correspondingly, the clay contents in silt, sandy loam, loamy sand, and sand are less than 10%, and the SWCC, therefore, reflects the poor soil water retention capacity. The water retention capacities for the 12 soil textures were consistent with soil’s fractal characteristics. It could draw a conclusion that the fractal dimension is sensitive to soil texture and hydraulic properties [77]. The shape and parameter changes of SWCCs with different textures could be determined by the value of fractal dimension. Specifically, soil with larger fractal dimension indicated a higher soil clay content, which corresponded to higher residual water content. This is actually caused by the different compositions and structures of soil particles. The specific surface area of soil particles gradually increased with the thinning of soil particles, but the number of macropores in soil decreased accordingly. Thus, water molecules were retained in small pores and were not easy to seepage. Therefore, fine textured soil usually has higher water retention capacity, which can be indicated using fractal dimension. Furthermore, the SWCC changed gently in the high matrix suction stage. In short, the SWCC changes are obviously due to the difference of soil textures, resulting in different water retention capacities. This finding can be particularly helpful for understanding the changes in hydraulic properties in loess undergoing tremendous human disturbance, such as land creation projects currently underway in China [78], facilitating the sustainable management of water resources and soil erosions in loess areas [79]. In addition, SWCC is also a key tool to understand the infiltration of rainfall and irrigation water, which helps in establishing various hydraulic models for understanding the laws and mechanisms of soil water seepage [80].
4. Conclusions
In the present study, the fractal characteristics of soil particles and the SWCCs of soils with different soil textures were analyzed with the help of the fractal theory. Many soil samples from UNSODA2.0 database containing particle size distribution data and SWCC data were adopted to check the performance of the fractal model. The following conclusions can be achieved:
- The fractal characteristic of soil with different textures was significantly different, and fractal dimension was strongly dependent on the clay content in the soil. The average fractal dimensions of the 12 different textures ranged from 2.4024 to 2.8928. Clay had the largest fractal dimension, whereas sand had the lowest one. The particle size composition of soil will significantly change the fractal dimension of soil. The fractal dimension of finely textured soil was larger than that of medium and coarse textured soil. Correlation analysis also suggests that the fractal dimension of soil particles is intensively related to the contents of clay, silt, and sand (p < 0.01). A higher ratio of clay content in the soil can produce a greater mass fractal dimension of soil particles. Fractal theory can quantitatively describe the features of soil particle composition.
- The SWCC of unsaturated soil was strongly dependent on soil texture. The relationship of soil structure with hydraulic properties can be established using fractal analysis. The fractal model representing SWCC has good fitting results for soils of different textures, and the estimated fractal dimension (D2) in this fractal model can be obtained by particle size distribution. The fitting results of the SWCC fractal model showed that soil with different textures had different changes in SWCC. The soil water retention capacity gradually increased with increasing fractal dimension. In the low suction stage, the changes in the SWCC of coarse textured soil were steeper than those of fine textured soil. Fine textured soil had a larger residual moisture content, while coarse textured soil had a smaller one.
This study will provide a theoretical and practical basis for scholars to explore soil-related issues such as soil water infiltration, pollution transport, and soil stability, and will be helpful for water and soil resource management and protection. It will also deepen the application of fractal theory in soil science, benefiting the development of soil science.
Author Contributions
Research conceptualization, C.Y., J.W., P.L.; data curation, C.Y., Y.W. and N.Y.; methodology, C.Y.; writing—original draft, C.Y.; writing—review and editing, J.W., P.L., Y.W., N.Y., supervision, J.W., P.L. All authors have read and agreed to the published version of the manuscript.
Funding
The financial support from the National Natural Science Foundation of China (42272302, 42072286, 41761144059 and 42090053), the Qinchuangyuan “Scientist + Engineer” Team Development Program of the Shaanxi Provincial Department of Science and Technology (2022KXJ-005), the Fok Ying Tong Education Foundation (161098), and the National Ten Thousand Talent Program (W03070125).
Data Availability Statement
All the raw data are available in the database of UNSODA 2.0 developed by the U.S. Salinity Laboratory, which is available at http://www.ussl.ars.usda.gov/, accessed on 10 November 2022.
Acknowledgments
We are grateful for the useful comments and suggestions rendered by the editors and reviewers, which are essential for us to further improve the quality of the manuscript. Finally, we thank the U.S. Salinity Laboratory for sharing the database of UNSODA 2.0 on unsaturated soils. The first author is also grateful for the educational and scientific resources provided by Chang’an University, which enabled her to conduct this research.
Conflicts of Interest
The authors declare no conflict of interest.
References
- Xu, J.; Yang, X. Three-dimensional stability analysis of slope in unsaturated soils considering strength nonlinearity under water drawdown. Eng. Geol. 2018, 237, 102–115. [Google Scholar] [CrossRef]
- Rahardjo, H.; Kim, Y.; Satyanaga, A. Role of unsaturated soil mechanics in geotechnical engineering. Int. J. Geo-Eng. 2019, 10, 8. [Google Scholar] [CrossRef] [Green Version]
- Tian, K.; Yang, A.; Nie, K.Y.; Zhang, H.; Xu, J.; Wang, X. Experimental study of steady seepage in unsaturated loess soil. Acta Geotech. 2020, 15, 2681–2689. [Google Scholar] [CrossRef]
- Wang, C.; Li, S.Y.; He, X.; Chen, Q.; Zhang, H.; Liu, X.Y. Improved prediction of water retention characteristic based on soil gradation and clay fraction. Geoderma 2021, 404, 115293. [Google Scholar] [CrossRef]
- Karakan, E. Comparative Analysis of Atterberg Limits, Liquidity Index, Flow Index and Undrained Shear Strength Behavior in Binary Clay Mixtures. Appl. Sci. 2022, 12, 8616. [Google Scholar] [CrossRef]
- Fiori, A.; Pomarico, I.; Zarlenga, A.; Catani, V.; Leone, G. Extending the Overlay and Index: A Simple Method for Assessing Aquifer Vulnerability in a Combined Vadose Zone—Groundwater Flow System. Water 2023, 15, 364. [Google Scholar] [CrossRef]
- Leong, E.C.; Rahardjo, H. Review of Soil-Water Characteristic Curve Equations. Geotech. Geol. Eng. 1997, 123, 1106–1117. [Google Scholar] [CrossRef] [Green Version]
- Rudiyanto; Sakai, M.; van Genuchten, M.T.; Alazba, A.A.; Setiawan, B.I.; Minasny, B. A complete soil hydraulic model accounting for capillary and adsorptive water retention capillary and film conductivity and hysteresis. Water Resour. Res. 2015, 51, 8757–8772. [Google Scholar] [CrossRef] [Green Version]
- Wu, T.; Wu, G.; Wang, D.; Shi, Z. Soil-hydrological properties response to grazing exclusion in a steppe grassland of the Loess Plateau. Environ. Earth Sci. 2013, 71, 745–752. [Google Scholar] [CrossRef]
- Li, Y.; Liu, Y.; Nie, W.; Ma, X. Inverse Modeling of Soil Hydraulic Parameters Based on a Hybrid of Vector-Evaluated Genetic Algorithm and Particle Swarm Optimization. Water 2018, 10, 84. [Google Scholar] [CrossRef] [Green Version]
- Chen, P.; Wei, C. Numerical procedure for simulating the two-phase flow in unsaturated soils with hydraulic hysteresis. Int. J. Geomech. 2016, 16, 04015030. [Google Scholar] [CrossRef]
- Zeng, L.; Li, F.; Liu, J.; Gao, Q.; Bian, H. Effect of initial gravimetric water content and cyclic wetting-drying on soil-water characteristic curves of disintegrated carbonaceous mudstone. Trans. Saf. Environ. 2019, 1, 230–240. [Google Scholar] [CrossRef] [Green Version]
- Wang, H.; Chen, Q.; Zhang, L.; Li, X. A framework to determine soil-water retention relation for mine wastes and its applications in emergency risk assessment. Hydrol. Res. 2021, 52, 389–413. [Google Scholar] [CrossRef]
- Moazeni-Noghondar, S.; Golkarian, A.; Azari, M.; Lajayer, B.A. Study on soil water retention and infiltration rate: A case study in eastern Iran. Environ. Earth Sci. 2021, 80, 474. [Google Scholar] [CrossRef]
- Wen, T.; Shao, L.; Guo, X.; Zhao, Y. Experimental investigations of the soil water retention curve under multiple drying-wetting cycles. Acta Geotech. 2020, 15, 3321–3326. [Google Scholar] [CrossRef]
- Liu, Q.; Yasufuku, N.; Omine, K.; Hazarika, H. Automatic soil water retention test system with volume change measurement for sandy and silty soils. Soils Found. 2012, 52, 369–380. [Google Scholar] [CrossRef] [Green Version]
- Fattah, M.Y.; Salim, N.M.; Irshayyid, E.J. Determination of the soil-water characteristic curve of unsaturated bentonite-sand mixtures. Environ. Earth Sci. 2017, 76, 201. [Google Scholar] [CrossRef]
- Dang, M.; Chai, J.; Xu, Z.; Qin, Y.; Cao, J.; Liu, F. Soil water characteristic curve test and saturated-unsaturated seepage analysis in Jiangcungou municipal solid waste landfill, China. Eng. Geol. 2019, 264, 105374. [Google Scholar] [CrossRef]
- Zhang, F.; Zhao, C.; Lourenco, S.D.N.; Dong, S.; Jiang, Y. Factors affecting the soil-water retention curve of Chinese loess. Bull. Eng. Geol. Environ. 2021, 80, 717–729. [Google Scholar] [CrossRef]
- Chen, P.; Liu, J.; Wei, C.; Xue, W.; Tian, H. Approach to Rapidly Determining the Water Retention Curves for Fine-Grained Soils in Capillary Regime Based on the NMR Technique. J. Eng. Mech. 2017, 143, 04017032. [Google Scholar] [CrossRef]
- Lu, P.; He, Y.; Zhang, Z.; Ye, W. Predicting chemical influence on soil water retention curves with models established based on pore structure evolution of compacted clay. Comput. Geotech. 2021, 138, 104360. [Google Scholar] [CrossRef]
- Iyer, K.; Jayanth, S.; Gurnani, S.; Singh, D.N. Influence of Initial Water Content and Specimen Thickness on the SWCC of Fine-Grained Soils. Int. J. Geomech. 2013, 13, 894–899. [Google Scholar] [CrossRef]
- Li, D.; Gao, G.; Shao, M.; Fu, B. Predicting available water of soil from particle-size distribution and bulk density in an oasis-desert transect in northwestern China. J. Hydrol. 2016, 538, 539–550. [Google Scholar] [CrossRef]
- Mahmoodlu, M.G.; Raoof, A.; Sweijen, T.; van Genuchten, M.T. Effects of Sand Compaction and Mixing on Pore Structure and the Unsaturated Soil Hydraulic Properties. Vadose Zone J. 2016, 15, 1–11. [Google Scholar] [CrossRef]
- Shen, J.; Hu, M.; Wang, X.; Zhang, C.; Xu, D. SWCC of Calcareous Silty Sand Under Different Fines Contents and dry Densities. Front. Environ. Sci. 2021, 9, 682907. [Google Scholar] [CrossRef]
- Jiang, X.; Wu, L.; Wei, Y. Influence of Fine Content on the Soil-Water Characteristic Curve of Unsaturated Soils. Geotech. Geol. Eng. 2020, 38, 1371–1378. [Google Scholar] [CrossRef]
- Zhu, J.; Su, Z.; Zhang, H. Soil-water characteristic curves and hydraulic conductivity of Gaomiaozi bentonite pellet-contained materials. Environ. Earth Sci. 2022, 81, 92. [Google Scholar] [CrossRef]
- Bockheim, J.G. Genesis of soils with an abrupt textural contrast in the United States. Catena 2016, 137, 422–431. [Google Scholar] [CrossRef]
- Gardner, W.R. Some steady state solutions of the unsaturated moisture flow equation with application to evaporation from a water table. Soil Sci. 1958, 85, 228–232. [Google Scholar] [CrossRef]
- Brooks, R.H.; Corey, A.T. Hydraulic properties of porous medium and Their Relation to Drainage Design. Trans. ASAE 1964, 7, 26–28. [Google Scholar] [CrossRef]
- Castellini, M.; Prima, S.D.; Iovino, M. An assessment of the BEST procedure to estimate the soil water retention curve. Geoderma 2018, 320, 82–94. [Google Scholar] [CrossRef]
- Gao, Y.; Li, Z.; Sun, D.; Yu, H. A simple method for predicting the hydraulic properties of unsaturated soils with different void ratios. Soil Till. Res. 2021, 209, 104913. [Google Scholar] [CrossRef]
- Matlan, S.J.; Taha, M.R.; Mukhlisin, M. Assessment of Model Consistency for Determination of Soil-Water Characteristic Curves. Arab. J. Sci. Eng. 2016, 41, 1233–1240. [Google Scholar] [CrossRef]
- Soltani, A.; Azimi, M.; Deng, A.; Taheri, A. A simplified method for determination of the soil–water characteristic curve variables. Int. J. Geotech. Eng. 2019, 13, 316–325. [Google Scholar] [CrossRef]
- Tao, G.; Lei, D.; Liu, L.; Li, Y.; Zhu, X. Prediction of Soil Water Characteristic Curve Based on Soil Water Evaporation. Adv. Civ. Eng. 2021, 2021, 6686442. [Google Scholar] [CrossRef]
- Mandelbrot, B.B. How long is the coast of Britain? Statistical self-similarity and fractional dimension. Science 1967, 156, 636–638. [Google Scholar] [CrossRef] [Green Version]
- Yu, B. Analysis of Flow in Fractal Porous Media. Appl. Mech. Rev. 2008, 61, 050801. [Google Scholar] [CrossRef]
- Wang, L.; Yang, R.; Zhang, S.; Zhang, G. Fractal features and infiltration characteristics of the soil from different land uses in a small watershed in a rocky, mountainous area in Shandong Province. J. For. Res. 2019, 31, 1017–1024. [Google Scholar] [CrossRef]
- Zhu, J. Impact of fractal characteristics on evaporation and infiltration in unsaturated heterogeneous soils. Hydrol. Sci. J. 2020, 65, 1872–1878. [Google Scholar] [CrossRef]
- Echogdali, F.Z.; Boutaleb, S.; Abioui, M.; Aadraoui, M.; Bendarma, A.; Kpan, R.B.; Ikirri, M.; El Mekkaoui, M.; Essoussi, S.; El Ayady, H.; et al. Spatial Mapping of Groundwater Potentiality Applying Geometric Average and Fractal Models: A Sustainable Approach. Water 2023, 15, 336. [Google Scholar] [CrossRef]
- Huang, G.; Zhang, R. Evaluation of soil water retention curve with the pore-solid fractal model. Geoderma 2005, 127, 52–61. [Google Scholar] [CrossRef]
- Peng, G.; Xiang, N.; Lv, S.; Zhang, G. Fractal characterization of soil particle-size distribution under different land-use patterns in the Yellow River Delta Wetland in China. J. Soil Sediment. 2014, 14, 1116–1122. [Google Scholar] [CrossRef]
- Zolfaghari, A.A.; Taghizadeh-Mehrjardi, R.; Asadzadeh, F.; Hajabbasi, M.A. Soil structure changes due to different land-use practices in the central Zagruos region, Iran. Arch. Agron. Soil Sci. 2016, 62, 163–175. [Google Scholar] [CrossRef]
- Qi, F.; Zhang, R.; Liu, X.; Niu, Y.; Zhang, H.; Li, H.; Li, J.; Wang, B.; Zhang, G. Soil particle size distribution characteristics of different land-use types in the Funiu mountainous region. Soil Till. Res. 2018, 184, 45–51. [Google Scholar] [CrossRef]
- Qiu, S.; Yang, M.; Xu, P.; Rao, B. A new fractal model for porous media based on low-field nuclear magnetic resonance. J. Hydrol. 2020, 586, 124890. [Google Scholar] [CrossRef]
- Dai, L.; Wang, G.; He, Y. Assessing soil fractal and sorting characteristics based on geostatistics and modeling approaches in a typical basin of North China plain. Earth Sci. Inform. 2021, 14, 819–829. [Google Scholar] [CrossRef]
- Russell, A.R.; Buzzi, O. A fractal basis for soil-water characteristics curves with hydraulic hysteresis. Géotechnique 2012, 62, 269–274. [Google Scholar] [CrossRef] [Green Version]
- Niu, X.; Gao, P.; Wang, B.; Liu, Y. Fractal Characteristics of Soil Retention Curve and Particle Size Distribution with Different Vegetation Types in Mountain Areas of Northern China. Int. J. Environ. Res. Public Health 2015, 12, 15379–15389. [Google Scholar] [CrossRef] [Green Version]
- Tyler, S.W.; Wheatcraft, S.W. Fractal processes in soil water retention. Water Resour. Res. 1990, 26, 1047–1056. [Google Scholar] [CrossRef]
- Bird, N.R.A.; Perrier, E.; Rieu, M. The water retention function for a model of soil structure with pore and solid fractal distributions. Eur. J. Soil Sci. 2000, 51, 51–63. [Google Scholar] [CrossRef]
- Huang, G.; Zhang, R.; Huang, Q. Modeling Soil Water Retention Curve with a Fractal Method. Pedosphere 2006, 16, 137–146. [Google Scholar] [CrossRef]
- Tao, G.; Chen, Y.; Kong, L.; Xiao, H.; Chen, Q.; Xia, Y. A Simple Fractal-Based Model for Soil-Water Characteristic Curves Incorporating Effects of Initial Void Ratios. Energies 2018, 11, 1419. [Google Scholar] [CrossRef] [Green Version]
- Zhou, A.; Fan, Y.; Cheng, W.; Zhang, J. A Fractal Model to Interpret Porosity-Dependent Hydraulic Properties for Unsaturated Soils. Adv. Civ. Eng. 2019, 2019, 3965803. [Google Scholar] [CrossRef] [Green Version]
- Zhang, X.; Zhao, W.; Wang, L.; Liu, Y.; Liu, Y.; Feng, Q. Relationship between soil water content and soil particle size on typical slopes of the Loess Plateau during a drought year. Sci. Total Environ. 2019, 648, 943–954. [Google Scholar] [CrossRef] [Green Version]
- Turcotte, D.L. Fractals in geology and geophysics. Pure Appl. Geophys. 1989, 131, 171–196. [Google Scholar] [CrossRef]
- Tyler, S.W.; Wheatcraft, S.W. Fractal scaling of soil particle-size distributions: Analysis and limitations. Soil Sci. Soc. Am. J. 1992, 56, 362–369. [Google Scholar] [CrossRef]
- Perrier, E.; Bird, N.R.A.; Rieu, M. Generalizing the fractal model of soil structure: The pore-solid fractal approach. Geoderma 1999, 88, 137–164. [Google Scholar] [CrossRef]
- Van Genuchten, M.T. A closed-form equation for predicting the hydraulic conductivity of unsaturated soils. Soil Sci. Soc. Am. J. 1980, 44, 892–898. [Google Scholar] [CrossRef] [Green Version]
- Fredlund, D.G.; Xing, A. Equations for the soil-water characteristic curve. Can. Geotech. J. 1994, 31, 521–532. [Google Scholar] [CrossRef]
- Campbell, G.S. A simple method for determining unsaturated hydraulic conductivity from moisture retention data. Soil Sci. 1974, 177, 311–314. [Google Scholar] [CrossRef]
- Pasha, A.Y.; Khoshghalb, A.; Khalili, N. Pitfalls in Interpretation of Gravimetric Water Content-Based Soil-Water Characteristic Curve for Deformable Porous Media. Int. J. Geomech. 2016, 16, D4015004. [Google Scholar] [CrossRef]
- Soltani, A.; Azimi, M.; Boroomandnia, A.; O’Kelly, B.C. An objective framework for determination of the air-entry value from the soil-water characteristic curve. Results Eng. 2021, 12, 100298. [Google Scholar] [CrossRef]
- Tao, G.; Wu, Z.; Li, W.; Li, Y.; Dong, H. Simplified Relation Model of Soil Saturation Permeability Coefficient and Air-Entry Value and Its Application. Fractal Fract. 2021, 5, 180. [Google Scholar] [CrossRef]
- Rawls, W.J.; Brakensiek, D.L.; Saxtonn, K.E. Estimation of Soil Water Properties. Trans. Am. Soc. Agri. Eng. 1982, 25, 1316–1320. [Google Scholar] [CrossRef]
- Nemes, A.; Schaap, M.G.; Leij, F.J. Description of the unsaturated soil hydraulic database UNSODA version 2.0. J. Hydrol. 2001, 251, 151–162. [Google Scholar] [CrossRef]
- Soil Survey Staff. Keys to Soil Taxonomy, 12th ed.; USDA: Washington, DC, USA; National Resources Conservation Service: Washington, DC, USA; National Soil Survey Center: Lincoln, NE, USA, 2014. [Google Scholar]
- Millán, M.; González-Posada, M.; Aguilar, M.; Domínguez, J.; Céspedes, L. On the fractal scaling of soil data. Particle-size distributions. Geoderma 2003, 117, 117–128. [Google Scholar] [CrossRef]
- Zhao, Y.; Feng, Q.; Yang, H. Soil salinity distribution and its relationship with soil particle size in the lower reaches of Heihe River, Northwestern China. Environ. Earth Sci. 2016, 75, 810. [Google Scholar] [CrossRef]
- Ding, D.; Zhao, Y.; Feng, H.; Si, B.; Hill, R.L. A user-friendly modified pore-solid fractal model. Sci. Rep. 2016, 6, 39029. [Google Scholar] [CrossRef] [Green Version]
- Xia, D.; Deng, Y.; Wang, S.; Ding, S.; Cai, C. Fractal features of soil particle-size distribution of different weathering profiles of the collapsing gullies in the hilly granitic region, south China. Nat. Hazards 2015, 79, 455–478. [Google Scholar] [CrossRef]
- Mohammadi, M.; Shabanpour, M.; Mohammadi, M.H.; Davatgar, N. Characterizing Spatial Variability of Soil Textural Fractions and Fractal Parameters Derived from Particle Size Distributions. Pedosphere 2019, 29, 224–234. [Google Scholar] [CrossRef]
- Huang, G.; Zhan, W. Modeling the soil water retention curve with fractal theory. Adv. Water Sci. 2002, 13, 55–60. (In Chinese) [Google Scholar]
- Peng, Y.; Yin, Z.; Zhou, C.; Ding, X. Micromechanical analysis of capillary suction effect on bearing capacity of unsaturated fine granular foundation soil using coupled CFD-DEM method. Comput. Geotech. 2022, 153, 105092. [Google Scholar] [CrossRef]
- Li, X.; Hu, C.; Li, F.; Gao, H. Determining soil water characteristic curve of lime treated loess using multiscale structure fractal characteristic. Sci. Rep. 2020, 10, 21569. [Google Scholar] [CrossRef]
- Tao, G.; Chen, Y.; Xiao, H.; Chen, Q.; Wan, J. Determining Soil-Water Characteristic Curves from Mercury Intrusion Porosimeter Test Data Using Fractal Theory. Energies 2019, 12, 752. [Google Scholar] [CrossRef] [Green Version]
- Rusell, A.R. How water retention in fractal soils depends on particle and pore sizes, shapes, volumes and surface areas. Geotechnique 2014, 64, 379–390. [Google Scholar] [CrossRef]
- Fuentes, C.; Chavez, C.; Brambila, F. Relating Hydraulic Conductivity Curve to Soil-Water Retention Curve Using a Fractal Model. Mathematics 2020, 8, 2201. [Google Scholar] [CrossRef]
- Li, P.; Qian, H.; Wu, J. Accelerate research on land creation. Nature 2014, 510, 29–31. [Google Scholar] [CrossRef] [Green Version]
- Li, P.; Qian, H. Water in loess. In Encyclopedia of Sustainability Science and Technology; Meyers, R.A., Ed.; Springer: New York, NY, USA, 2018; pp. 1–17. [Google Scholar] [CrossRef]
- Su, F.; Wu, J.; Wang, D.; Zhao, H.; Wang, Y.; He, X. Moisture movement, soil salt migration, and nitrogen transformation under different irrigation conditions: Field experimental research. Chemosphere 2022, 300, 134569. [Google Scholar] [CrossRef]
Figure 1.
Fitting relationships between log (M(r < R)/MT) and log(R/RL) for all soil textures in UNSODA 2.0.
Figure 1.
Fitting relationships between log (M(r < R)/MT) and log(R/RL) for all soil textures in UNSODA 2.0.

Figure 2.
Soil-water characteristic curves (SWCCs) of 12 soil textures predicted using the SWCC fractal model.
Figure 2.
Soil-water characteristic curves (SWCCs) of 12 soil textures predicted using the SWCC fractal model.


Table 1.
Empirical values of the air-entry values for all soil textures.
| Soil Texture | Clay | Silty Clay | Sandy Clay | Clay Loam | Silty Clay Loam | Sandy Clay Loam | Loam | Silt Loam | Sandy Loam | Silt | Loamy Sand | Sand |
|---|---|---|---|---|---|---|---|---|---|---|---|---|
| Value | 37.30 | 34.19 | 29.17 | 25.89 | 32.56 | 28.08 | 11.15 | 20.76 | 14.66 | 20.00 | 8.69 | 7.26 |
Table 2.
Fractal dimension (D1) values of soils with different textures.
| Soil Textures | Number | Slope | Fractal Dimension | Clay Content | R2 |
|---|---|---|---|---|---|
| Clay | 15 | 0.1072 | 2.8928 | 51.01 | 0.8509 |
| Silty clay | 12 | 0.1327 | 2.8673 | 40.33 | 0.7425 |
| Sandy clay | 3 | 0.1470 | 2.8530 | 39.13 | 0.9116 |
| Clay loam | 14 | 0.1483 | 2.8517 | 37.32 | 0.8993 |
| Silty clay loam | 20 | 0.1595 | 2.8405 | 36.65 | 0.7565 |
| Sandy clay loam | 24 | 0.2154 | 2.7846 | 24.60 | 0.9120 |
| Loam | 50 | 0.2482 | 2.7519 | 21.49 | 0.8655 |
| Silt loam | 78 | 0.2832 | 2.7168 | 18.59 | 0.7190 |
| Sandy loam | 50 | 0.3439 | 2.6561 | 13.16 | 0.8654 |
| Silt | 3 | 0.3589 | 2.6411 | 9.10 | 0.6503 |
| Loamy sand | 34 | 0.4767 | 2.5233 | 6.72 | 0.8489 |
| Sand | 53 | 0.5976 | 2.4024 | 3.02 | 0.7875 |
Table 3.
Correlation between fractal dimension of soils and soil mechanical composition.
| Index | D1 | Clay Content | Silt Content | Sand Content |
|---|---|---|---|---|
| D1 | 1.000 | |||
| Clay content | 0.943 ** | 1.000 | ||
| Silt content | 0.449 ** | 0.474 ** | 1.000 | |
| Sand content | −0.678 ** | −0.726 ** | −0.917 ** | 1.000 |
** indicates significant correlation at p < 0.01; n = 357.
Table 4.
Average estimated fractal dimension (D2) and mass fractal dimension (D1) values for 12 soil textures.
Table 4.
Average estimated fractal dimension (D2) and mass fractal dimension (D1) values for 12 soil textures.
| Soil Textures | Number | D1 | D2 | Relative Error (%) | R2 |
|---|---|---|---|---|---|
| Clay | 15 | 2.8928 | 2.9497 | 1.92 | 0.8911 |
| Silty clay | 12 | 2.8673 | 2.9152 | 1.64 | 0.9365 |
| Sandy clay | 3 | 2.8530 | 2.9113 | 2.00 | 0.8539 |
| Clay loam | 14 | 2.8517 | 2.9105 | 2.02 | 0.9419 |
| Silty clay loam | 20 | 2.8405 | 2.8865 | 1.59 | 0.9222 |
| Sandy clay loam | 24 | 2.7846 | 2.8854 | 3.49 | 0.9083 |
| Loam | 50 | 2.7519 | 2.8836 | 4.56 | 0.9208 |
| Silt loam | 78 | 2.7168 | 2.8798 | 5.66 | 0.9008 |
| Sandy loam | 50 | 2.6561 | 2.8650 | 7.29 | 0.8786 |
| Silt | 3 | 2.6411 | 2.8504 | 7.34 | 0.8584 |
| Loamy sand | 34 | 2.5233 | 2.6751 | 5.03 | 0.9304 |
| Sand | 53 | 2.4024 | 2.5712 | 6.56 | 0.8625 |
Table 5.
Basic physical parameters of representative soil samples.
| Soil Textures | Code | Particle Density | Porosity | D1 | Clay Content |
|---|---|---|---|---|---|
| Clay | 2362 | 2.65 | 0.56 | 2.9249 | 63.0% |
| Silty clay | 3030 | 2.66 | 0.50 | 2.8916 | 42.0% |
| Sandy clay | 1135 | — | — | 2.8568 | 41.0% |
| Clay loam | 2701 | 2.61 | 0.34 | 2.8325 | 31.2% |
| Silty clay loam | 3110 | 2.54 | 0.47 | 2.8195 | 31.0% |
| Sandy clay loam | 2630 | 2.72 | 0.53 | 2.8028 | 25.8% |
| Loam | 2591 | 2.65 | 0.43 | 2.7809 | 21.8% |
| Silt loam | 2671 | 2.78 | 0.49 | 2.7513 | 17.3% |
| Sandy loam | 2560 | 2.61 | 0.48 | 2.6567 | 9.4% |
| Silt | 4670 | 2.65 | 0.46 | 2.4931 | 9.0% |
| Loamy sand | 2763 | 2.67 | 0.43 | 2.4852 | 2.8% |
| Sand | 4660 | 2.56 | 0.46 | 2.3291 | 2.0% |
Disclaimer/Publisher’s Note: The statements, opinions and data contained in all publications are solely those of the individual author(s) and contributor(s) and not of MDPI and/or the editor(s). MDPI and/or the editor(s) disclaim responsibility for any injury to people or property resulting from any ideas, methods, instructions or products referred to in the content. |
© 2023 by the authors. Licensee MDPI, Basel, Switzerland. This article is an open access article distributed under the terms and conditions of the Creative Commons Attribution (CC BY) license (https://creativecommons.org/licenses/by/4.0/).
Share and Cite
MDPI and ACS Style
Yang, C.; Wu, J.; Li, P.; Wang, Y.; Yang, N. Evaluation of Soil-Water Characteristic Curves for Different Textural Soils Using Fractal Analysis. Water 2023, 15, 772. https://doi.org/10.3390/w15040772
AMA Style
Yang C, Wu J, Li P, Wang Y, Yang N. Evaluation of Soil-Water Characteristic Curves for Different Textural Soils Using Fractal Analysis. Water. 2023; 15(4):772. https://doi.org/10.3390/w15040772
Chicago/Turabian StyleYang, Chunliu, Jianhua Wu, Peiyue Li, Yuanhang Wang, and Ningning Yang. 2023. "Evaluation of Soil-Water Characteristic Curves for Different Textural Soils Using Fractal Analysis" Water 15, no. 4: 772. https://doi.org/10.3390/w15040772
Note that from the first issue of 2016, this journal uses article numbers instead of page numbers. See further details here.