Article

Assessment of Water Ecosystem Integrity (WEI) in a Transitional Brazilian Cerrado–Atlantic Forest Interface

Center for Water Resources and Environmental Studies (CRHEA), University of São Paulo, São Carlos 13566-590, SP, Brazil
*
Author to whom correspondence should be addressed.
Water 2023, 15(4), 775; https://doi.org/10.3390/w15040775
Submission received: 22 December 2022 / Revised: 7 February 2023 / Accepted: 10 February 2023 / Published: 16 February 2023
(This article belongs to the Special Issue Application of Remote Sensing Technology to Water-Related Ecosystems)

Abstract

:
Although healthy ecosystems are vital to sustaining human society, the Brazilian Cerrado and Atlantic Forest biomes have suffered from disorderly human development and the intense use of natural resources. Thus, cost-effective studies are needed to develop tools to assess environmental conservation and the integrity of water courses to inform decisions for ensuring their recovery where ecosystem maintenance is deficient. This study sought to develop a methodology in which the Watershed Habitat Evaluation and Biotic Integrity Protocol (WHEBIP) and Rapid Assessment Protocol for Habitat Diversity (RAP) could be used in an integrated, adaptive manner to evaluate the Water Ecosystem Integrity (WEI) in courses of rivers and streams in tropical regions of the Brazilian Cerrado–Atlantic Forest interface undergoing intense agricultural exploitation. Accordingly, a spatial assessment using geographic information systems was followed by a field visit to apply the methodology. A preliminary assessment of the soil conditions in the Lobo Reservoir Hydrographic Basin was conducted, identifying stretches of rivers and streams that were suitable for payment for environmental services and for recovery from the impact of anthropic activities. Such activities were present in 50.23% of the basin’s total area, and intensive degradation was found in stretches of the water courses, primarily where the head springs of the Itaqueri River and Lobo Stream, the principal tributaries of the Lobo Reservoir, lie. Native vegetation, Brazilian Cerrado, and reforestation occupy a total of 38.5% of the basin, comprising areas of intense conservation activity by the Brazilian government.

1. Introduction

Covering the Amazon, São Francisco, and Prata River basins, three of the largest in South America, the Brazilian Cerrado is a global biodiversity hot spot, with its Amazon, Paraná-Paraguay, and São Francisco rivers contributing almost half of Brazil’s surface water [1]. Despite its importance for the conservation of species and provision of ecosystem services, only about 880 thousand km2 have been preserved as a result of extensive land-use/land-cover (LULC) changes. This constitutes less than half of the vegetation cover native to the Brazilian Cerrado, with only 20% unchanged and less than 7% within protected areas [2,3].
Another biome following the same trajectory is the Atlantic Forest, in which the continuous loss of older native forests is masked by increasing younger native forest cover, mainly in lands marginal to mechanized agriculture [4,5,6]. These forests correspond largely to the legal reserve and permanent protection areas (PPAs) that inhibit the entry of sedimentary material into water course rivers and reservoirs [7,8], and contribute to the healthy water ecosystems critical to sustaining human society. Habitat loss and diffuse pollution, common consequences of fragmented landscapes, pose significant threats to water ecosystems [9,10,11], and have become the focus of conservation efforts to preserve native freshwater biodiversity [6]. The integrity of water courses depends on the impact that multi-scale environmental properties (e.g., soil–water–plant interactions) have on the state of the biological communities and ecological processes that occur in the watersheds [8,12,13,14].
The Lobo Reservoir Hydrographic Basin (LRHB), hereafter the basin, is formed by the streams and rivers that drain the water that feeds the Lobo Reservoir. It is located between the cities of Brotas and Itirapina, in the state of São Paulo (Brazil), a region with significant agricultural, mining, and industrial development, in the midst of Brazilian Cerrado vegetation and fragments of the Atlantic Forest. It lies just over 200 km from the city of São Paulo, a leading corporate, commercial, and financial center in South America. In regions of this type, the management of natural resources depends on numerous data from diverse sources. Each discipline involves extensive and specialized knowledge that reflects in its totality the environment’s complex interactions [8,14]. Understanding the dynamics of loss and gain of native forests is essential for the conservation of biodiversity and the ecosystem services provided by the Brazilian Cerrado and Atlantic Forest biomes, particularly in regions undergoing intense forest transformations resulting from human development [9].
Consequently, assessment tools that enable a practical large-scale approximation of the ecological integrity of water courses have been continuously developed and revised [13,15,16,17,18,19,20,21,22,23,24,25,26]. Accordingly to [6], several field-based protocols were developed based on site-specific surveys of fish assemblages [15,18,22,26], macroinvertebrate communities [15,17,20,23], and physical habitats [15,24,25,27]. An alternate approach to assessing waterway integrity is through the physical characteristics of the respective watershed, based on the ecosystem relationships between the watercourse, the riparian LULC, and the geomorphology [13].
The Watershed Habitat Evaluation and Biotic Integrity Protocol (WHEBIP) [12] was developed to provide an assessment based on geographic information systems (GIS), in which water course integrity was based on the characteristics of the riverside landscape and the hydrographic basin as a whole, primarily interpreted from remote sensing. The effectiveness of the WHEBIP in predicting the ecological integrity of water courses was evaluated using correlation analyses derived from data on macroinvertebrate biotic indices and physicochemical parameters along a watershed in Bregalnica in Eastern Macedonia. Statistical analysis confirmed the ability of the WHEBIP to predict the spatial integrity of water courses with considerable accuracy [12].
Remote sensing in conjunction with algorithms incorporating machine learning offer the potential for effectively classifying satellite images [28]. The algorithms can process high-dimensional data and map LULC classes with interpretative and predictive complexity, corresponding to their natural characteristics [29]. In addition, the free availability of medium–high spatial resolution imagery, such as data from the Sentinel-2 satellite, can facilitate the mapping of ecosystem services and water course integrity at a fine scale (10 m) and low cost [30,31,32,33,34].
The forest remnants and many deforested areas of the Brazilian Cerrado and Atlantic Forest are abandoned, resulting in the formation of a mosaic of secondary forests of great importance in preserving biodiversity and affecting CO2 absorption [34]. Accordingly, use of the Rapid Assessment Protocol for Habitat Diversity (RAP) is recommended. This protocol is based on proposals from the Ohio Environmental Protection Agency (EPA) [35,36] and has been adapted for Brazil by [37]. The RAP evaluates the ecological integrity in stretches of rivers and streams, which is defined using such parameters as the quality and conservation of the aquatic habitats related to LULC in watersheds [38,39,40], based on field observations. In prior studies, the RAP was used to assess the environmental conditions of rivers [40], using the structure of macroinvertebrate communities as an indicator of ecological integrity [39] and water quality [38]. It can also assess the dynamics of environmental conservation when used as a methodological validation [14] and identify the susceptibility of water ecosystems to degradation [13].
The WHEBIP and RAP identify and evaluate spatial and environmental parameters, enabling validation of LULC mapping and indicating adverse impacts from anthropic activities. However, the two protocols use differing methods of landscape analysis, with the WHEBIP focusing on spatial analyses and the RAP on field analysis. Thus, this study developed a methodology in which an integrated and adaptive Water Ecosystem Integrity (WEI) protocol was used to validate the LULC map and evaluate the integrity of rivers and streams in tropical regions of the Brazilian Cerrado–Atlantic Forest interface undergoing intense agricultural exploitation. Consequently, a GIS-based spatial assessment was followed with a field visit to validate the proposed methodology. The two protocols were rigorously applied to attain results that can potentially inform the environmental and territorial management of watersheds and identify stretches of rivers and streams that are suitable for payment for environmental services and for recovery from the impact of anthropic activities. The study contributes to national research, as the basin is part of the Brazilian National Council for Scientific and Technological Development’s long-term ecological research program, which promotes advances in environmental and ecological research [7,41].

2. Study Area

The Lobo Reservoir Hydrographic Basin (LRHB), officially designated the Carlos Botelho Reservoir, has an area of approximately 230 km2, a drainage density of 0.75 km/km2, a maximum altitude of 800 m, and a slope of 0.0075 m/m [4]. LRHB is located in the central–west region of the state of São Paulo, between Brotas and Itirapina, at coordinates 22°15′ S and 47°49′ W (Figure 1).
Constructed in 1936 to generate electricity and currently also used for irrigation, tourism, and research, the Lobo Reservoir is one of Brazil’s most studied reservoirs. Internationally known as the Broa Model, the reservoir has been the focus of scientific research by the University of São Paulo (USP) and the Federal University of São Carlos (UFSCar) since the 1970s [41]. The Lobo impoundment is principally formed by the contributions of the Itaqueri River and the Lobo Stream, augmented with those of the Perdizes, Água Branca, Limoeiro, and Geraldo streams. The region belongs to the Tietê/Jacaré Water Resources Management Unit (UGRHI–TJ) number 13 (01). It is inserted in the hydrographic basin of the Tietê River and consequently in the hydrographic basins of the Paraná and Prata rivers.
The climate in the region is classified by Köppen as Cwa of the subtropical mesothermal type. The climate is controlled by equatorial and tropical air masses, comprising two distinct annual periods: a dry period from May to October, with temperatures between 15 °C and 17 °C, and a humid period, from November to April, with temperatures between 21 °C and 23 °C and annual precipitation of 1500 mm. According to [7], these periods and the relatively intense winds are key factors in the entry of sedimentometric material into the aquatic system from precipitation and runoff.
The LRHB is included as a special use (term used in the law) in the environmental protection area of Corumbataí. Created under State Decree 20,960 [42], it is an extensive conservation area with a degree of human occupation that is regulated to ensure the sustainability of the site (art. 15). The Ecological and Experimental Stations in Itirapina are also located in the basin and are under the responsibility of the Brazilian Forestry Institute. The Ecological Station was created by State Decree 22,335 in 1984 and the Experimental Station by expropriation. Their areas are 23 and 32 km2, respectively [43].
The Ecological and Experimental Stations in Itirapina are focused on preservation and environmental conservation through forest management activities, environmental education, research, visitation, and regulation of activities that could adversely impact the environment, such as hunting, fishing, road construction, fire, vandalism, and agriculture. The ecological station plays a significant role in the conservation of the Brazilian Cerrado, typically the savannah and countryside. The biome is marked by characteristic soil and climate. It encompasses formations that originated during the glacial periods when the global temperatures dropped and the climate became drier, favoring the retraction of forests and, consequently, the expansion of open vegetation requiring less humidity and adapting to the new environmental conditions [43]. The environmental degradation of areas of the Brazilian Cerrado has paced a series of endemic species at risk. Accordingly, it is vital to regulate the use of areas that has not yet been preserved [2,3].

3. Materials and Methods

The study’s methodology can be characterized as follows. Section 3.1 describes the elaboration and acquisition of spatial data for GIS validation and evaluation, and Section 3.2 describes the integrated protocol for assessing the ecosystem integrity of rivers and streams in tropical watersheds in the transitional Brazilian Cerrado–Atlantic Forest interface.

3.1. Elaboration and Acquisition of Spatial Data for GIS Validation and Evaluation

Table 1 presents the information and acquisition of spatial data used to identify the basin’s water ecosystem integrity, with LULC primarily used to evaluate environmental changes.
The integrity of the basin’s water course was evaluated using the available remote sensing data. A scenario was used to characterize the significant spatial changes in land use and conservation, which frequently reflects annual agricultural cycles of planting and soil management. As the harvest begins in September, this month was chosen to represent the entire year. In addition, September is the month with the lowest precipitation and cloud cover.
The land-use map was compiled from the 10 m spectral bands B02, B03, B04 and 20 m spectral bands B05, B06, B07, B8A, B11, and B12 of the visible and infrared regions of the Sentinel-2A satellite sensors. The image was attained free of charge from the website of the Copernicus Open Access Hub of the European Space Agency. The LULC map was generated with the Random Forest (RF) machine learning algorithm using R software and the SIRGAS 2000 geodetic reference system in the Universal Transverse Cartographic Projection of Mercator, Zone 23 South. For RF, the Ntree parameters were defined to 500 and Mtry to the square root of the number of input variables [34]. Fifty samples were collected for each land-use class, identified according to their expressive distribution. The identified classes were agriculture, water, flooded area, urban area, Brazilian Cerrado, native vegetation, pasture, reforestation, and exposed soil. The study classified native vegetation and Brazilian Cerrado separately to better understand their development and relevance.
In each of the 11 sites where the WEI protocol was applied, different types of land use were observed to verify the map’s accuracy. From field observations, 50 training samples were collected for each class as a classification reference. The map’s accuracy was verified through classifier training collections with 50 samples per class, interpretation of satellite images, and use of high-resolution images via Google Earth [10,13,14,46,47]. Land uses were observed and identified in each stretch of the water course, using the integrated protocol for assessing Water Ecosystem Integrity (WEI) in tropical basins in the Brazilian Cerrado–Atlantic Forest interface, hereafter the integrated basin protocol, to validate the LULC map. The analysis of the results obtained with the classifications was carried out through the confusion matrix. The confusion matrix represents one of the ways to evaluate the accuracy of a classification, through the comparison between the classification results and reference data [48]. From the transition matrix of the reference and prediction data, we attained the values of producer and user accuracy, and omission and inclusion errors per identified thematic class, as well as the overall accuracy of the classification. After verifying its concordance, the LULC map was used as a database to interpret the basin’s general characteristics and the integrity of its water courses. After the field visit to apply the WEI protocol, we performed a correlation test to verify the association between field results and the LULC map.

3.2. Integrated Protocol for Assessing Water Ecosystem Integrity (WEI) in the Cerrado–Atlantic Forest Interface

A GIS-based field-visit approach was used to assess the integrity of the basin’s water courses after the LULC data were analyzed to determine the basin’s general characteristics, such as the areas of LULC classes, percentage of native vegetation in relation to the basin’s total area, and integrity and support of the riparian forest (permanent protection area, PPA, protected by law) along the water course, particularly in areas with springs. LULC data from the basin were also used as a reference map during the field visit to apply the WEI protocol.
Based on this, WHEBIP was adapted to the LULC characteristics of the basin and the transitional Brazilian Cerrado–Atlantic Forest interface (Table 2). The protocol comprised 12 metrics scored for stream segments defined using an upstream source or tributary confluence and a downstream confluence with another stream segment or terminal water body [12]. In item 1, the basin’s LULC classes described the dominant riparian coverage in the stretch. In addition, we added item 4 to identify the sequential stage of the native vegetation of the riparian forest along the water course, according to Brazilian legislation [49].
Table 3 presents RAP, composed of a questionnaire with 10 parameters used to verify environmental characteristics and their alterations, and 12 parameters used to assess aquatic habitat conditions and anthropogenic changes. Some parameters were excluded from the WEI protocol to avoid obtaining repetitive data due to joint use with WHEBIP. In sum, 23 parameters of the basin’s water ecosystem integrity were evaluated through these means. The WEI protocol was applied by five members of the Hydrometry Center from the Center for Water Resources and Environmental Studies at the University of São Paulo, São Carlos’s School of Engineering.
The parameters obtained during application of the WEI were weighted to reflect the expected relative importance of each attribute in determining the integrity of the local flow [12]. For each metric, the scoring criteria that best described the features interpreted from LULC and field visit were used. For example, when scoring the first metric, dominant riverine land cover, assume that the segment of interest flows through pasture or agriculture. The score assigned to this metric would be 5. However, if the stretch flowed through native vegetation or Brazilian Cerrado, but there were indications that cattle routinely entered the forest (as evidenced by a network of trails), the score would be recorded as 20 to reflect the riverside vegetation composed of a wooded pasture [12]. This score represented the average value for an area characterized by forest (35) and pasture (5). The sum of the scores for all metrics was compared with the associated score ranges and health ratings, viz. ≤180 poor, 181–359 fair, 360–575 good, 576–710 very good, and 711–815 excellent. WEI ratings were intended to reflect the specific habitat and community characteristics noted in Table 4.
Table 5 describes the waterway and geographic coordinates of the integrated basin protocol application points.

4. Results

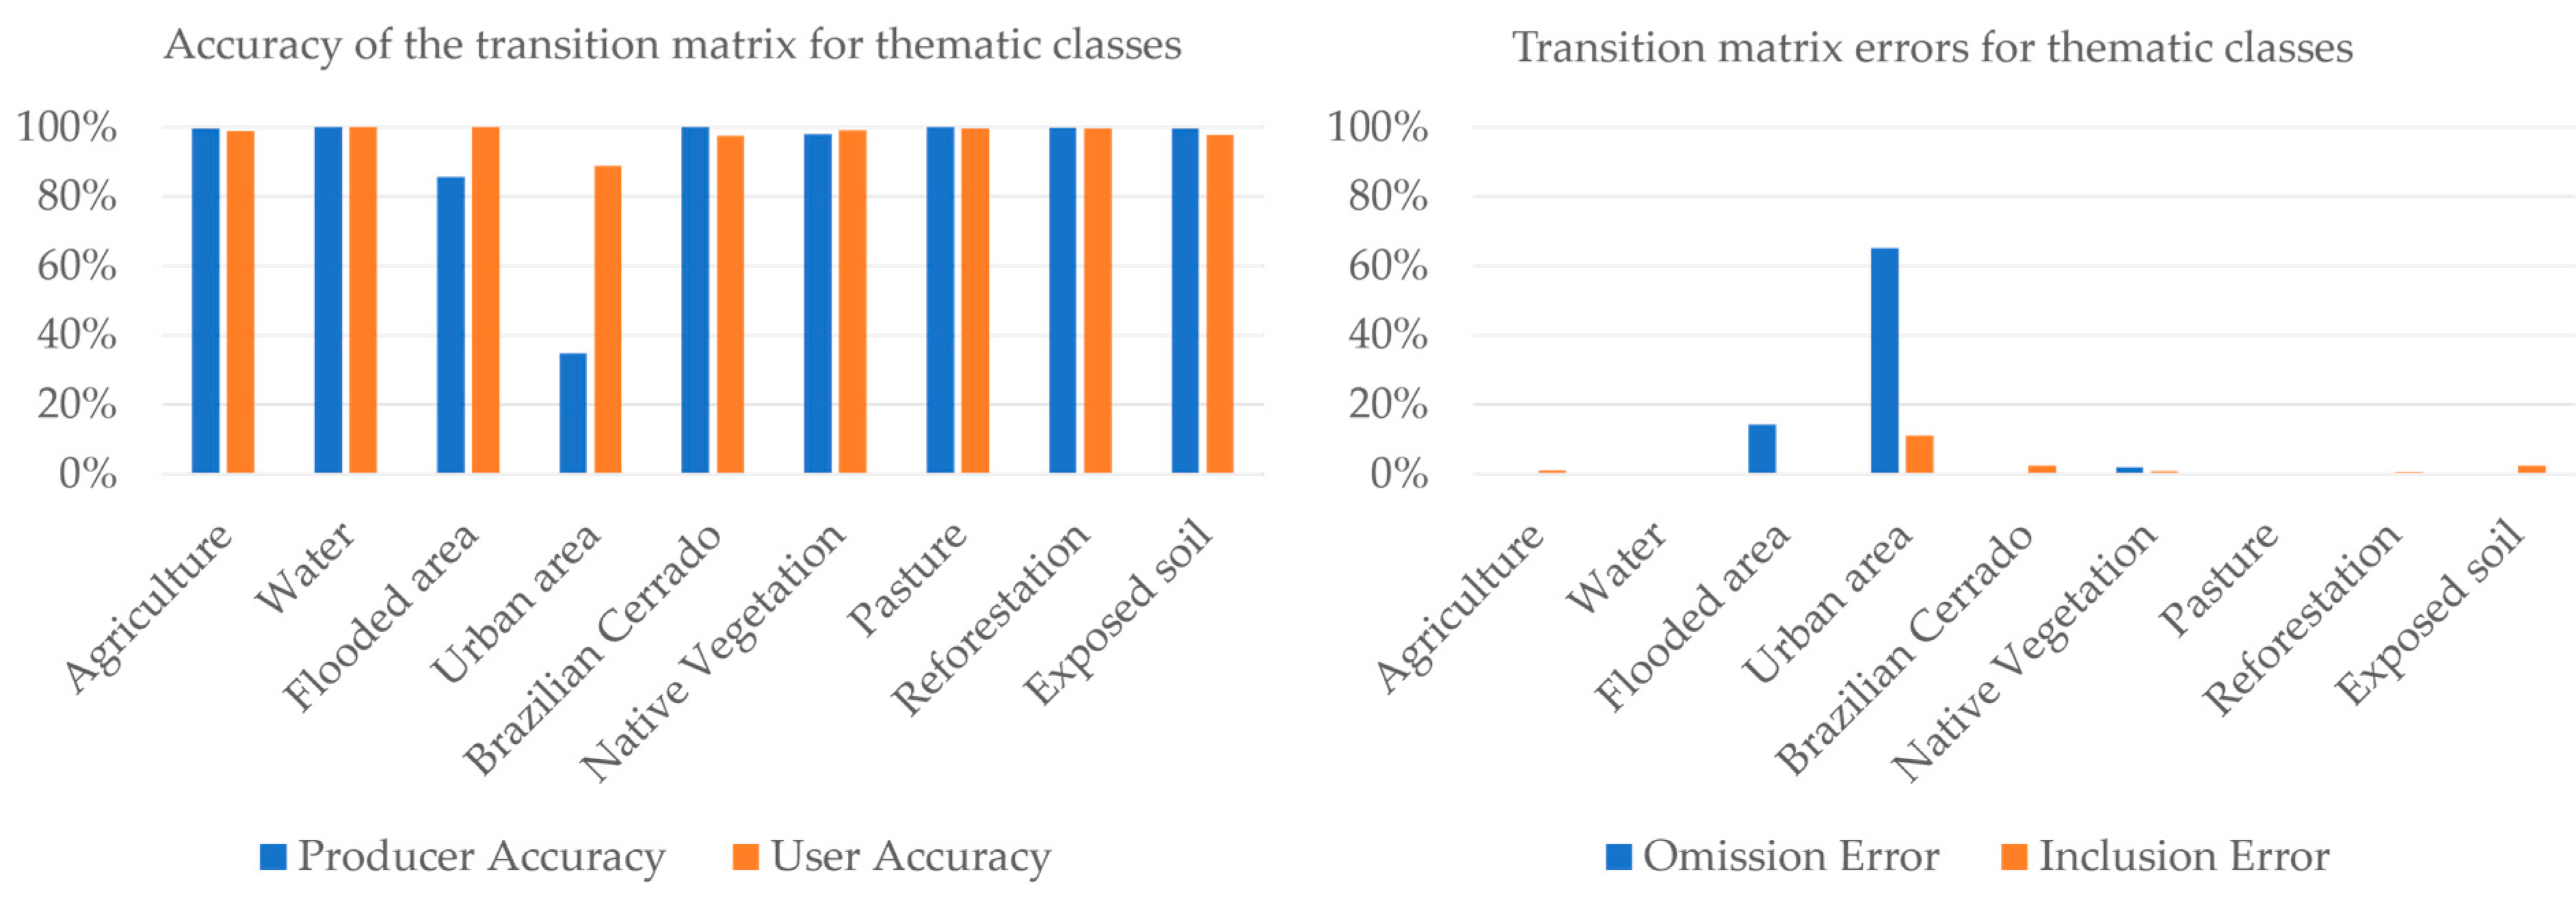
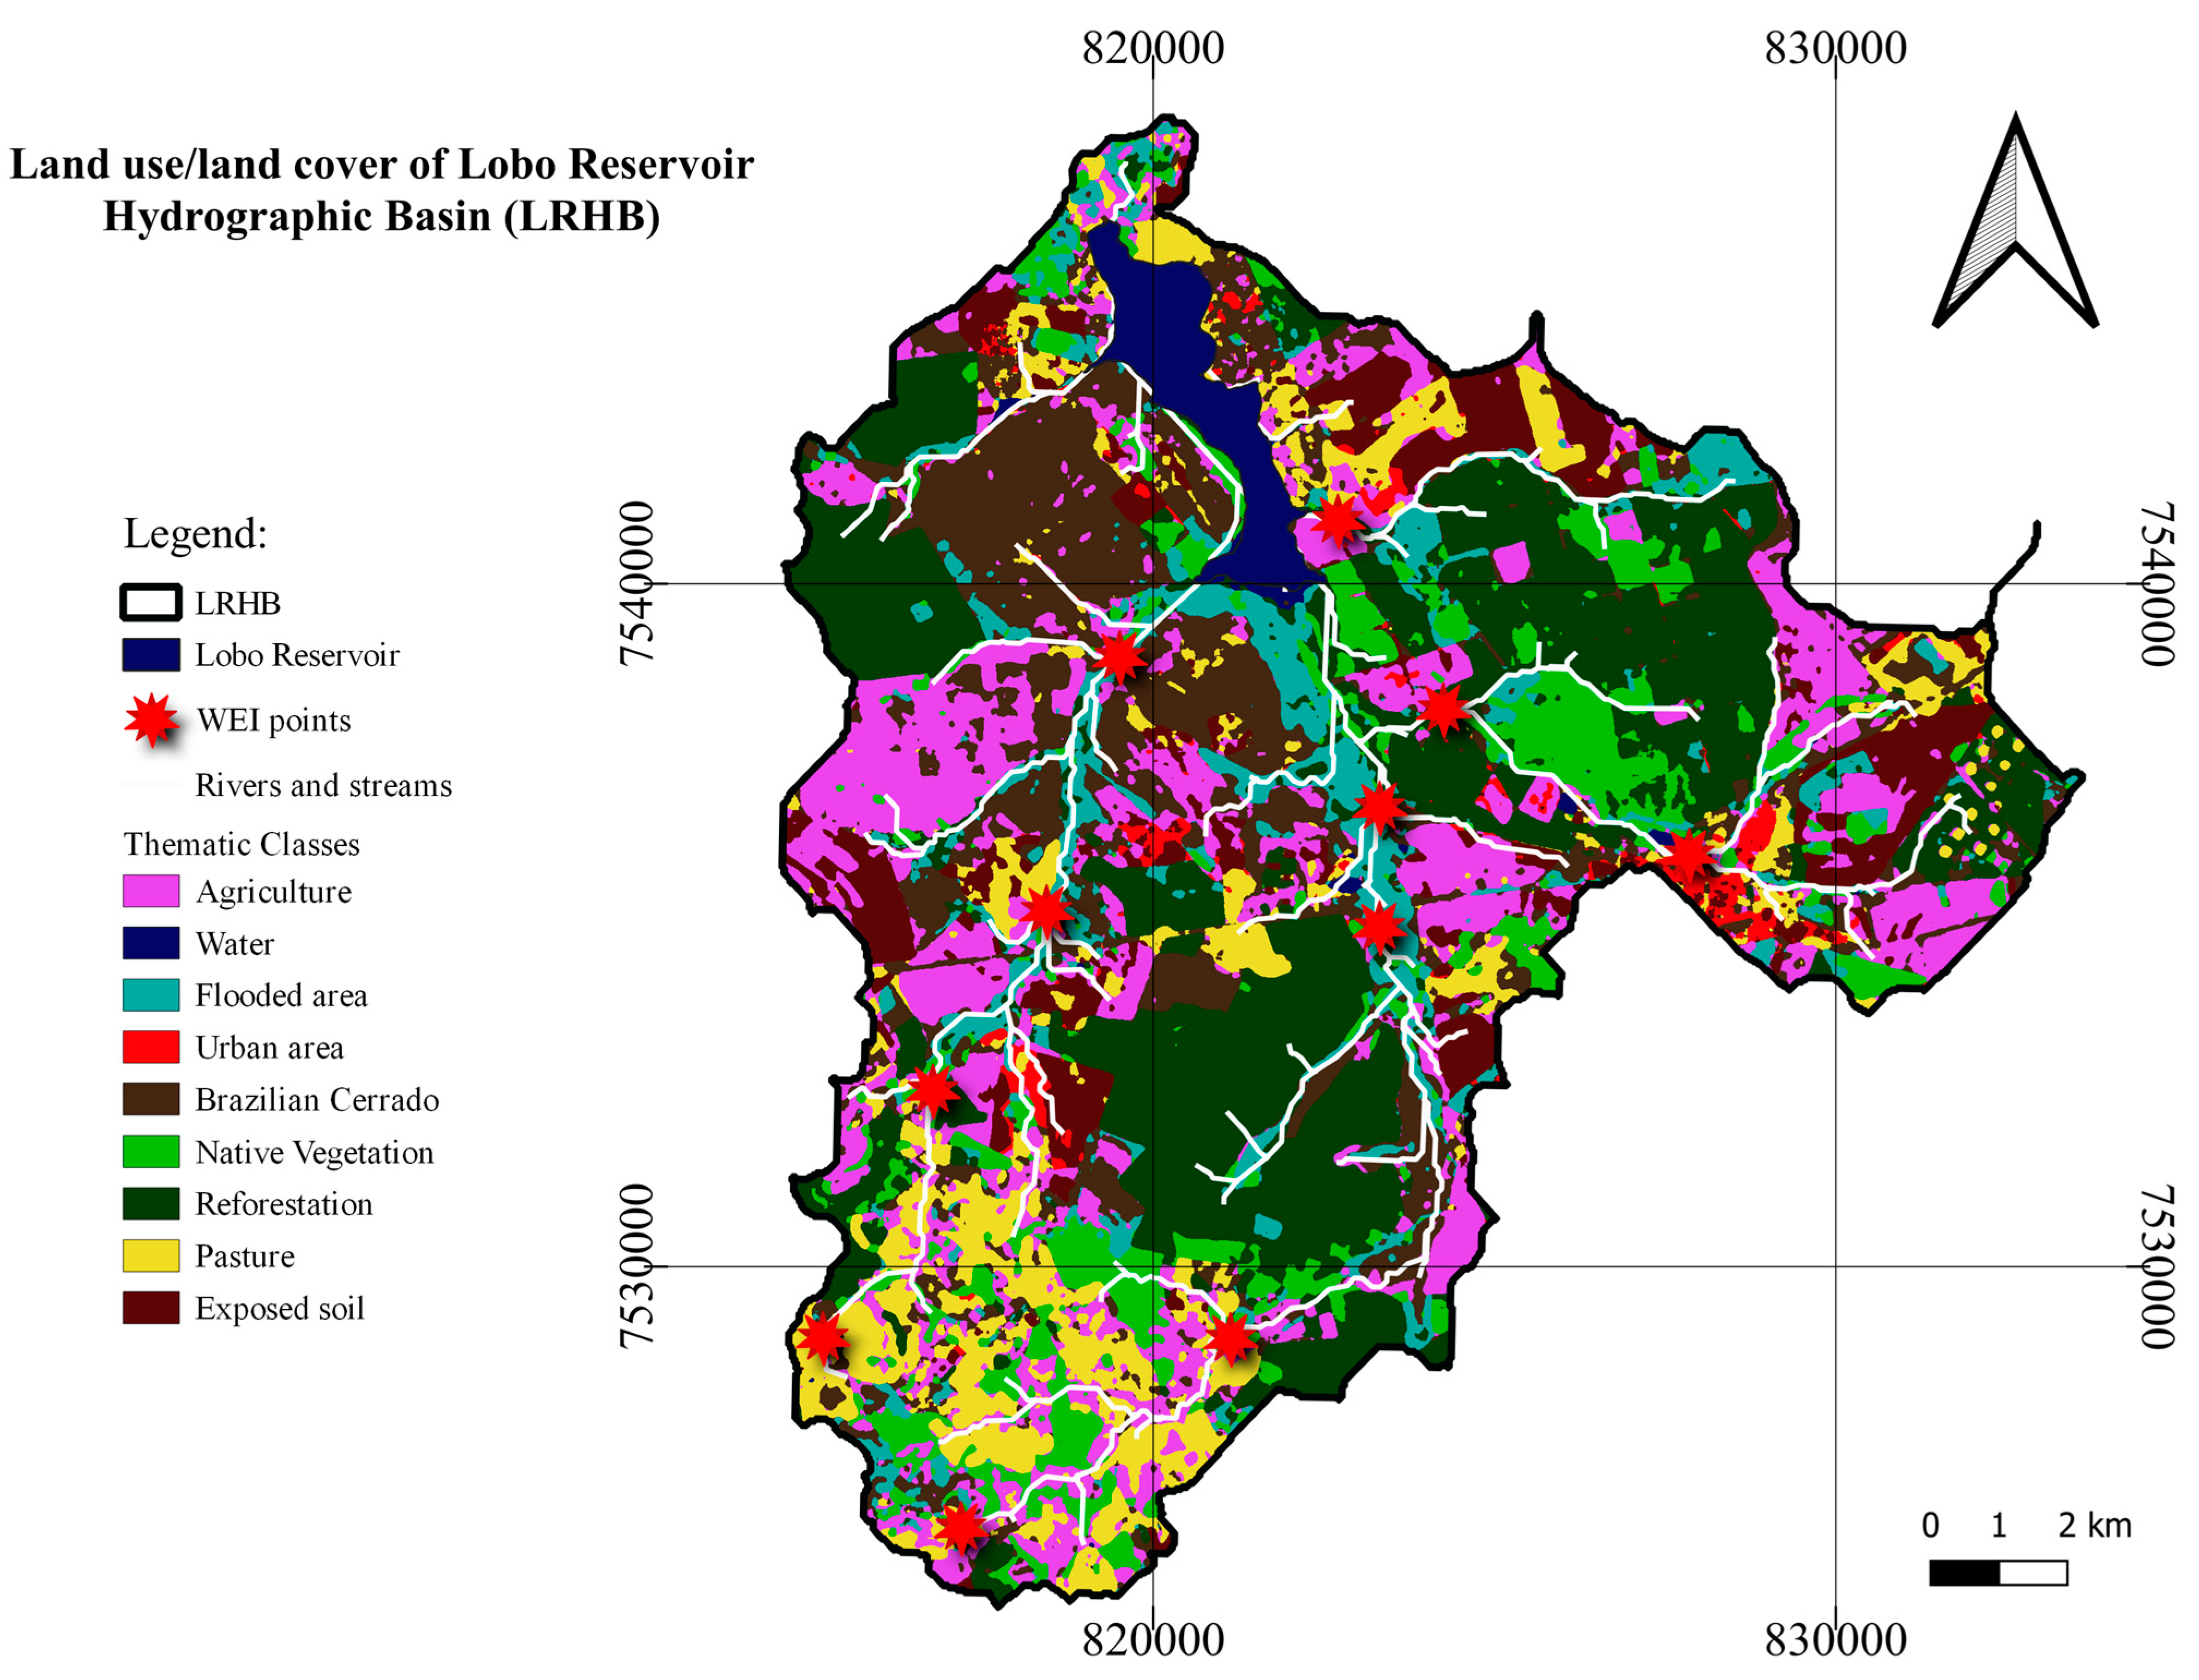
4.1. Spatial Evaluation of LULC in the Transitional Cerrado–Atlantic Forest Interface

An analysis of the results attained with the classification of the basin’s LULC was conducted using the confusion matrix. The global accuracy was 99.43%. Figure 2 depicts the relation between producer (PA) and user (UA) accuracy and between omission (OE) and inclusion (IE) errors for each thematic class. In general, the thematic classes obtained high PA and UA values, except for Urban and Flooded areas. The rates for the Urban area were 34.78% (PA) and 88.89% (UA), and 85.71% (PA) and 100% (UA) for the Flooded area. The errors in the transition matrix indicated some confusion in identifying these classes. For the Urban area, seven pixels were classified as Exposed Soil, five pixels as Agriculture, two pixels as Brazilian Cerrado, and one pixel as Pasture, yielding an OE of 65.22%, while for the Flooded area, six pixels were classified as Native Vegetation and one pixel as Reforestation, yielding an OE of 14.29%.
Table 6 presents the basin’s areas and occupancy. The identified classes were Agriculture, Water, Flooded area, Urban area, Brazilian Cerrado, Native Vegetation, Pasture, Reforestation, and Exposed Soil, with a prevalence of Exposed Soil, Reforestation, and Pasture, with approximately 51, 39, and 34 km2, respectively. The least common classes were Agriculture, Water, and Flooded area, with some 6, 6, and 19 km2, respectively. LRHB` LULC comprise 20.88% of Native Vegetation (Atlantic Forest) and Brazilian Cerrado. Government conservation and preservation actions were identified through research at the Itirapina Experimental Station, with Reforestation activity occupying 17.62% of the watershed. Human activities were present in half (approximately 50.23%) of the basin, comprising Agriculture, Urban area, Pasture, and Exposed Soil.
Figure 3 depicts the basin’s land use and occupation, with the integrated basin protocol’s application points and the drainage network of the water courses. The LULC map was used as a field reference for applying the integrated base protocol.
Figure 4 presents a scatterplot to demonstrate the association between the field results and the LULC map. Table 7 demonstrates the comparison between the data obtained from the WEI protocol (LULC) and the data obtained from the spatial analysis. Of the eleven field collection points, six points were identified as containing pairs of equal land-use classes. Therefore, on the scatterplot it was only possible to visualize five points containing different land-use class pairs. However, the results showed a favorable correlation coefficient (0.79) and determination coefficient (0.63).

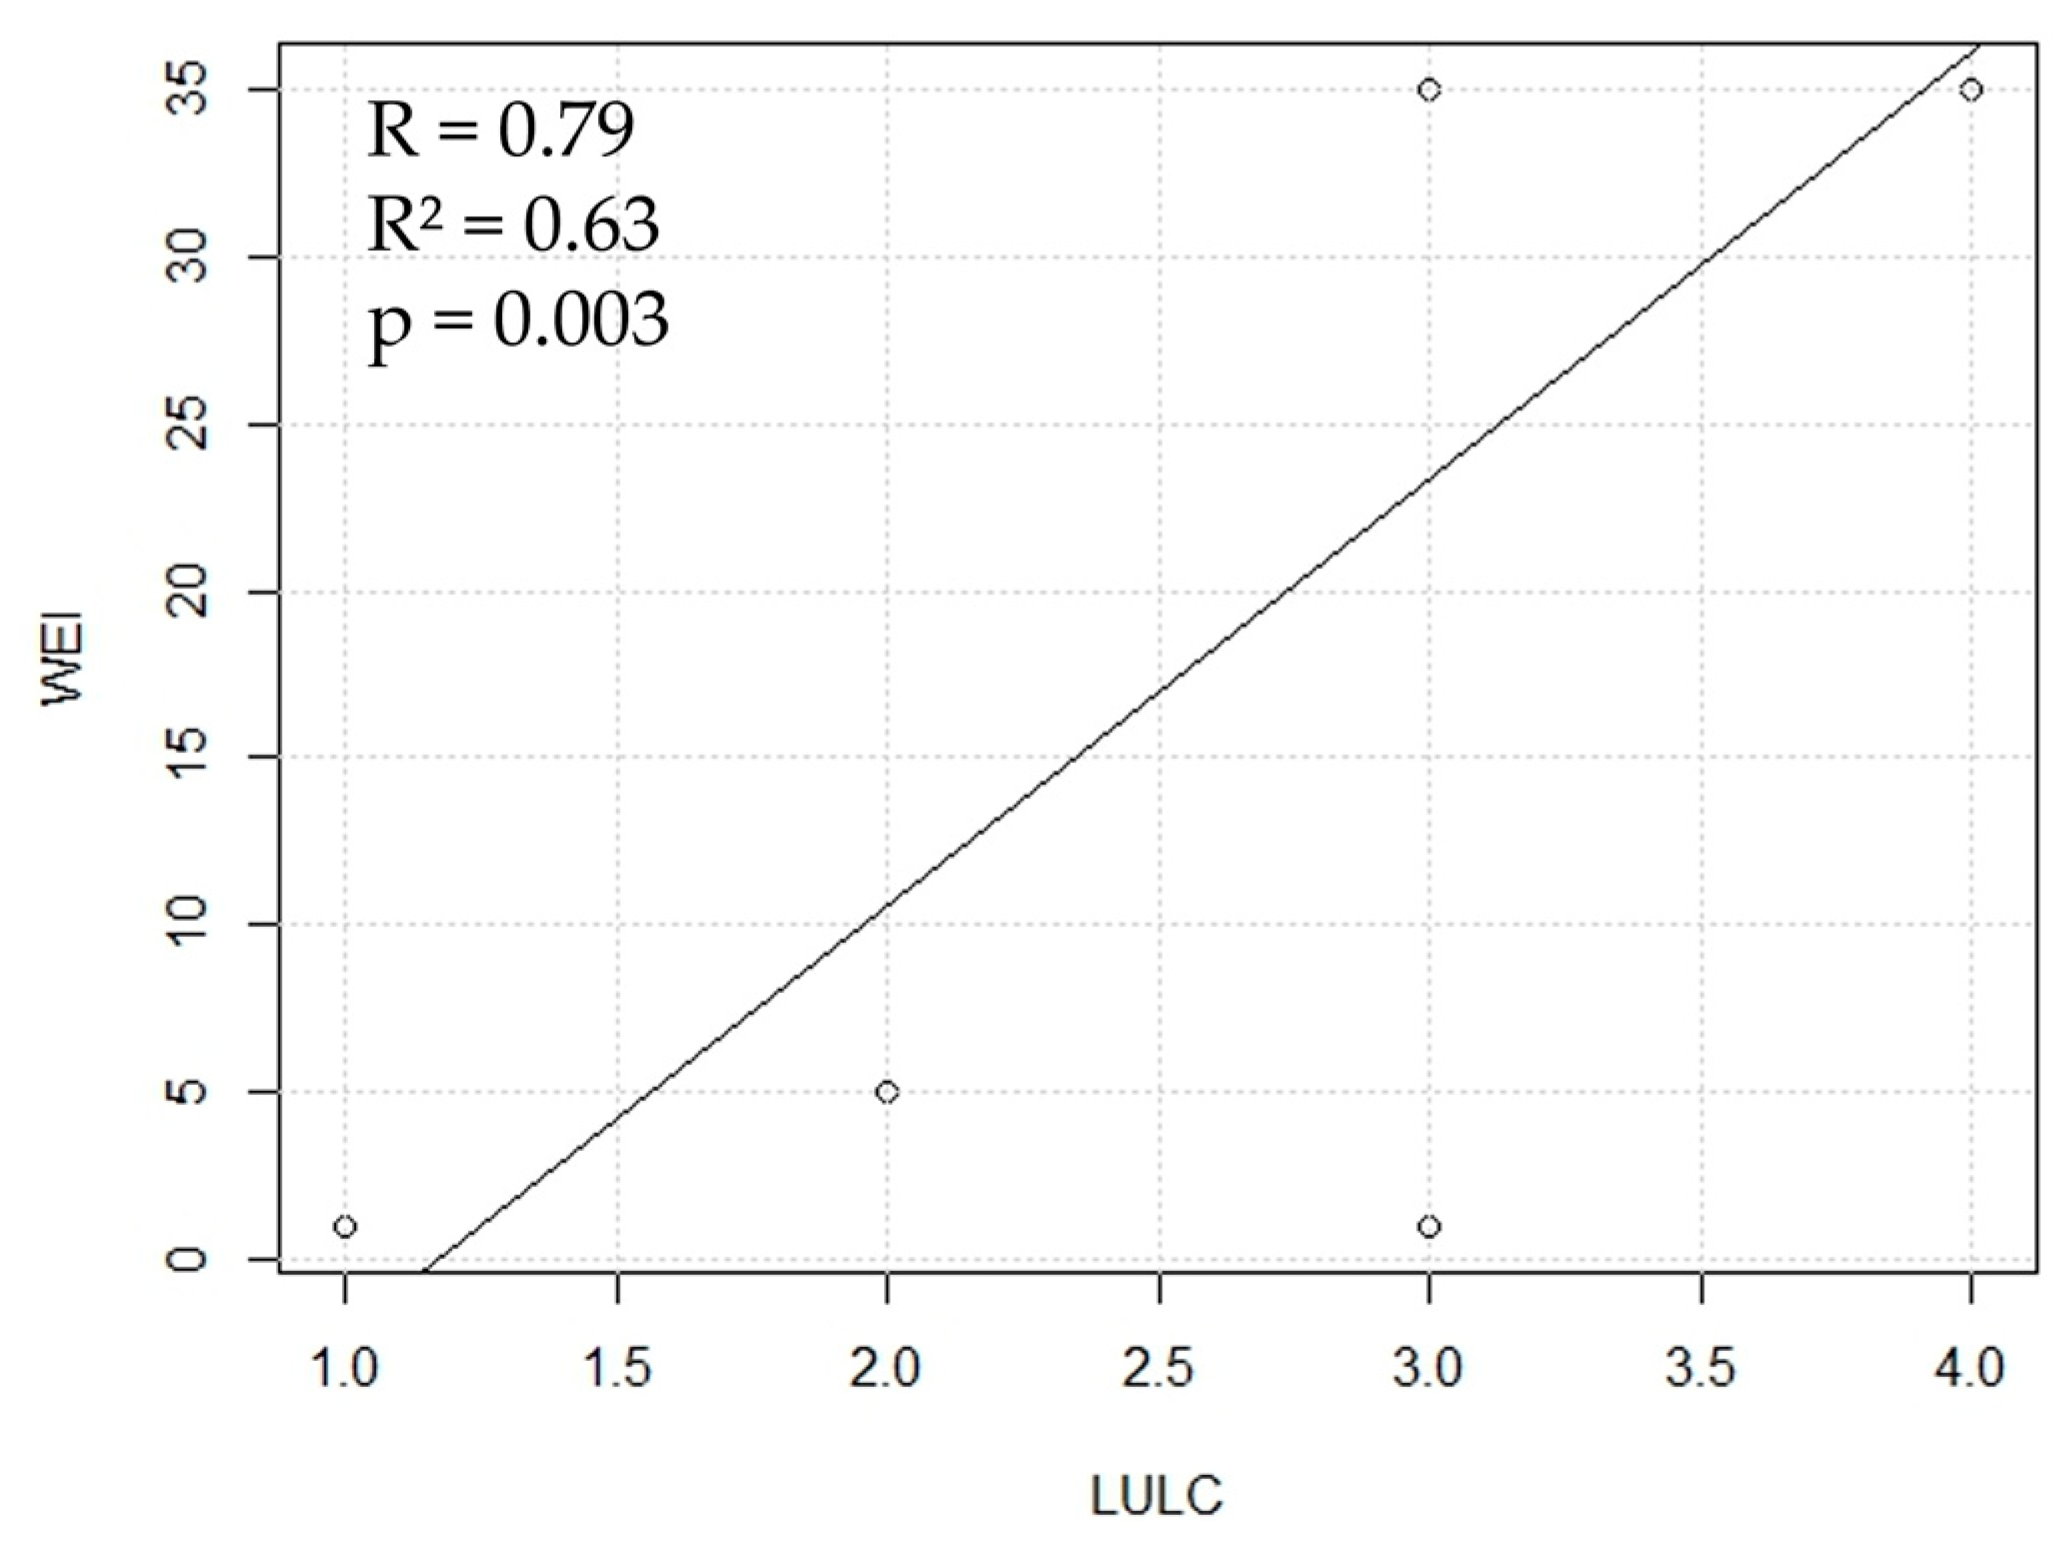
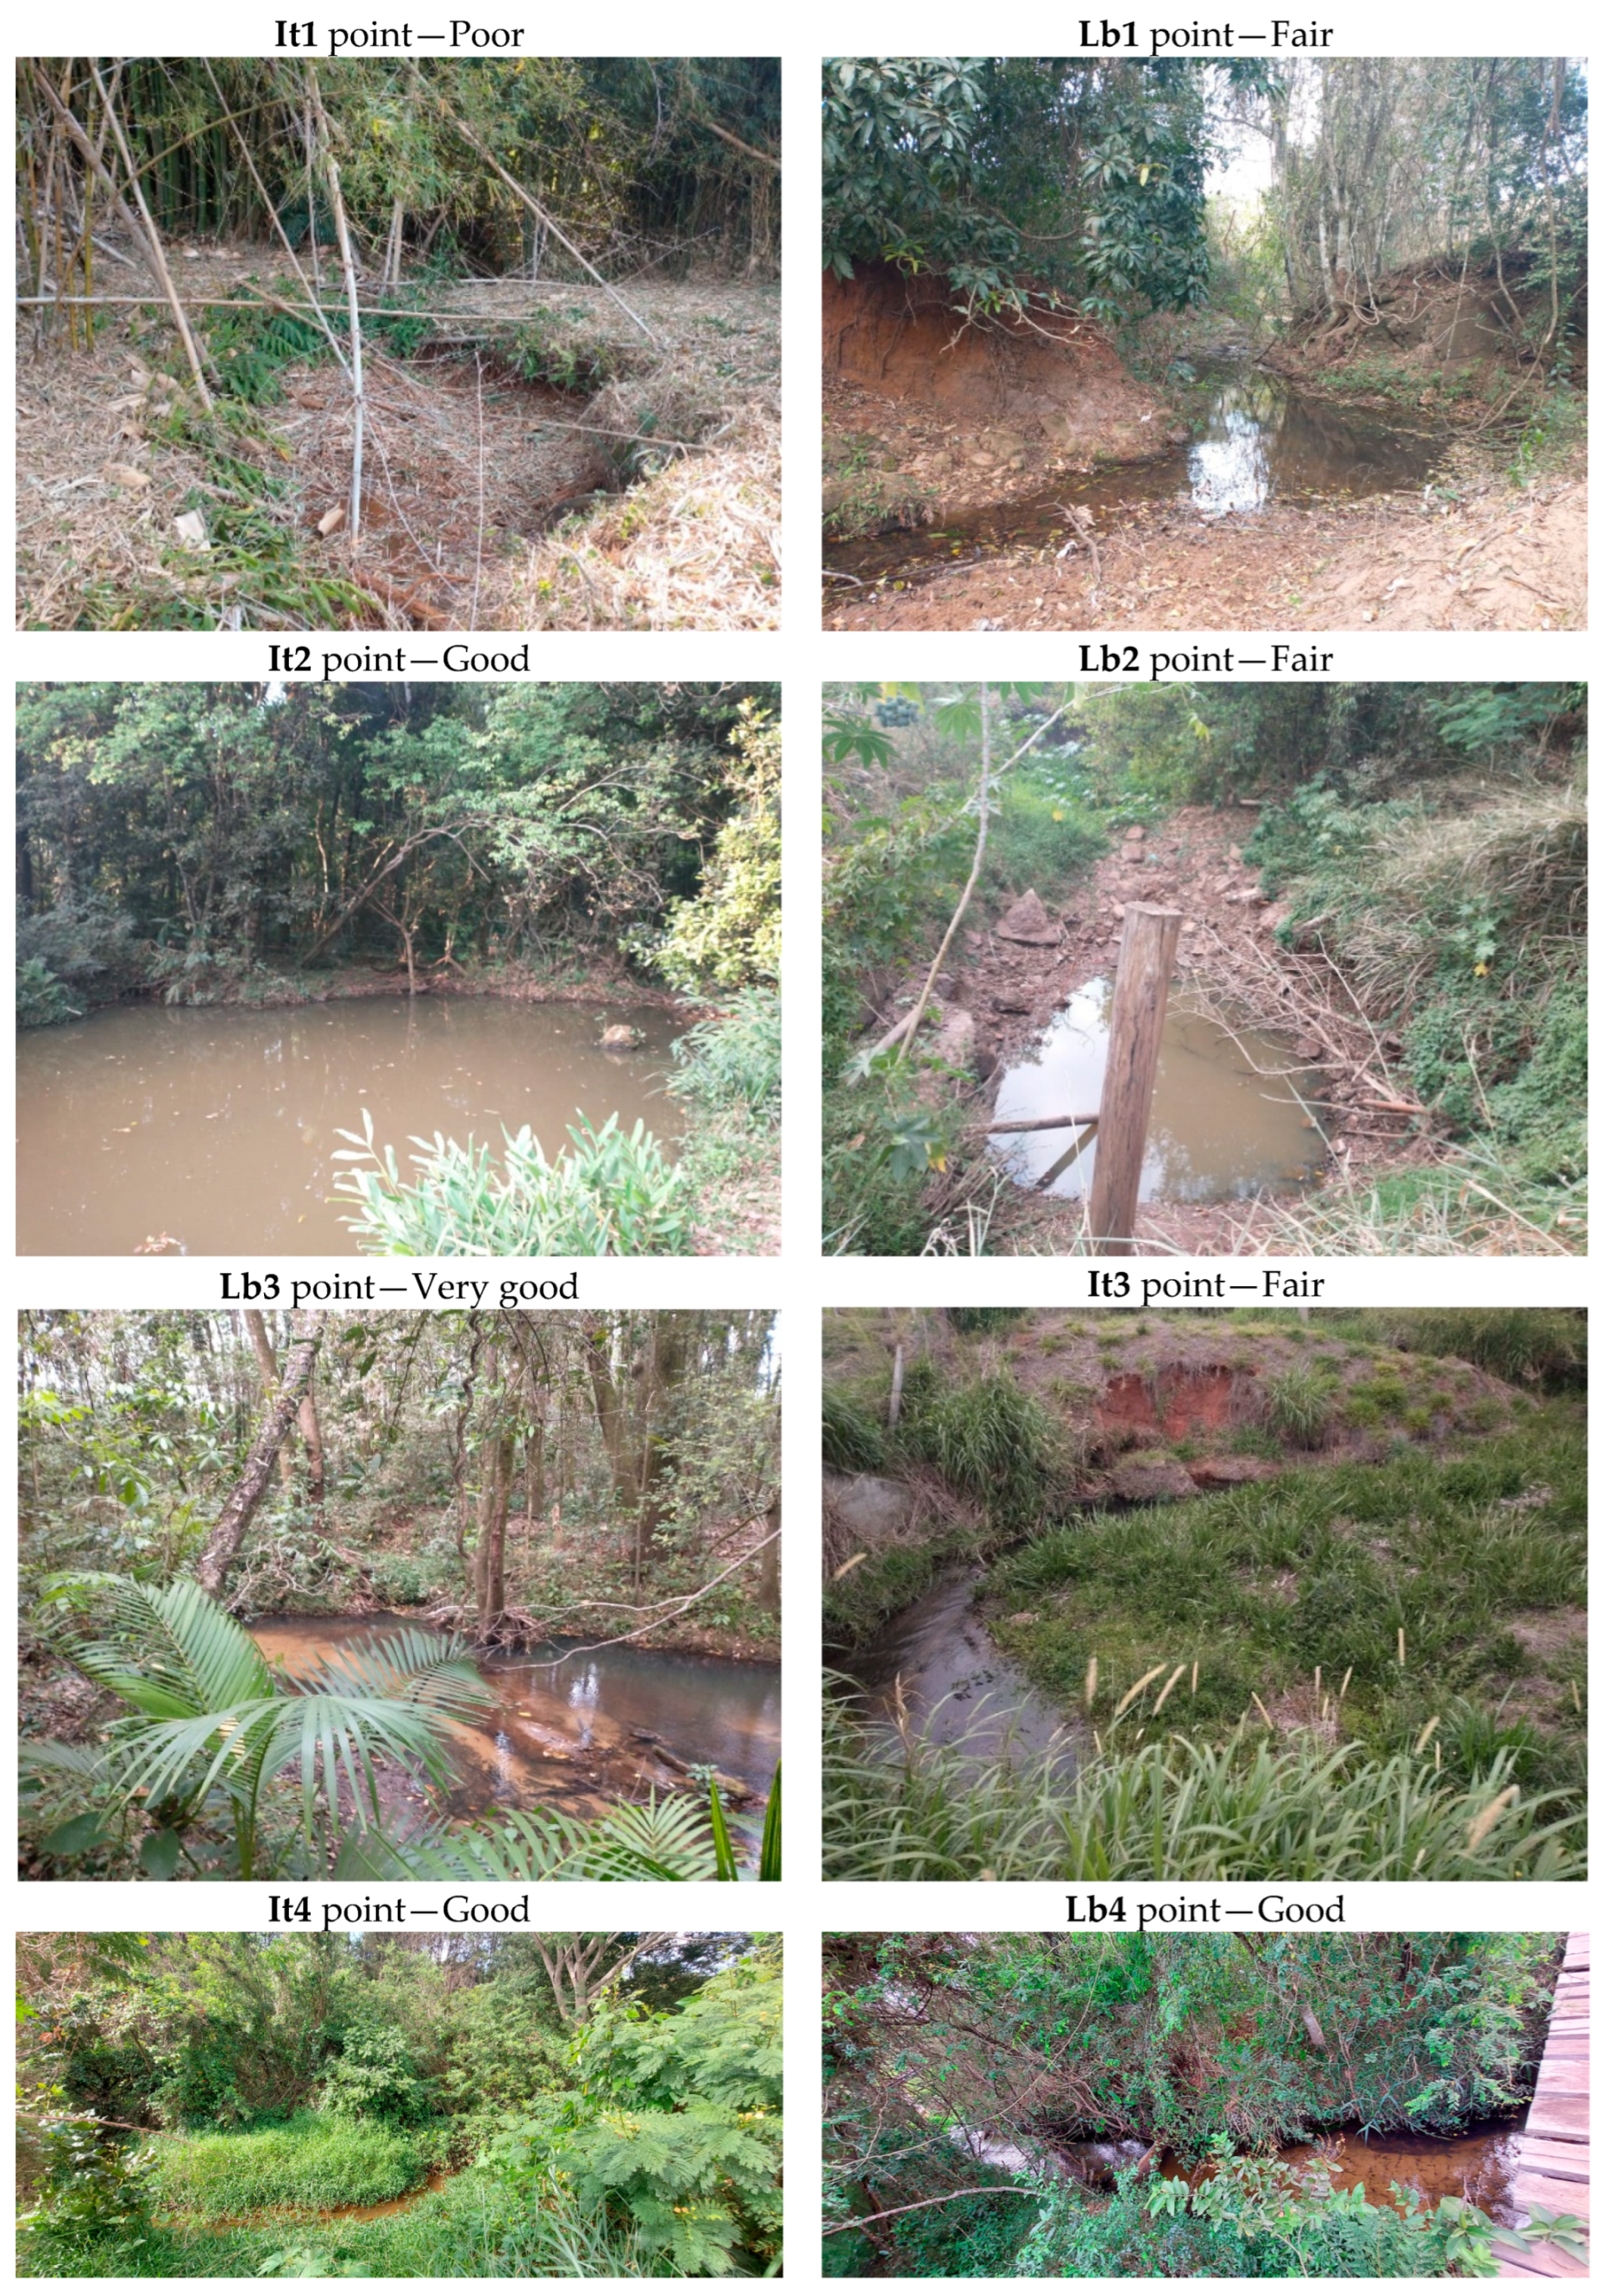
4.2. Evaluation of Water Ecosystem Integrity in the Lobo Reservoir Hydrographic Basin

Figure 5 shows the score obtained from applying the integrated basin protocol WEI for each point and photographs of the application points. The head springs of the main contributors to the Lobo Reservoir were in the south of the basin in the upper reaches of the Itaqueri River and Lobo Stream water courses, as depicted in Figure 1. The locations of the head springs were verified in the field and corresponded to points Itaqueri 1 (It1) with poor and Lobo 1 (Lb1) with regular scores. The two regions constituted the LULC classes of Pasture and Agriculture, which corresponded to alteration of the landscape and ecosystem environment from anthropic activities. At point It1, changes were found in the drainage channel and water dam, making the site dry. At point Lb1, evidence of cattle access was found, such as footprints, erosion, and reduced stream flow.
Points It2, It3, It4, Lb2, Lb3, and Lb4 corresponded to the middle and lower course of the Itaqueri River and Lobo Stream water courses. The sites evidenced greater integrity than the head spring points. Points It2 and Lb3 were rated as good and very good, respectively, with a greater presence of water, less traces of cattle access, less alteration of the landscape from anthropic activities, and less PPA degradation. Points Lb2 and It3, on the other hand, were rated with a fair score, reflecting changes in the landscape from the construction of roads and highways, access by cattle, and lack of conservation activity to safeguard the PPA integrity.

5. Discussion

The basin can be considered as a well-preserved watershed, except for its southern region. The results presented in this study indicate that 20.88% of the watershed is composed of native vegetation (Atlantic Forest) and Brazilian Cerrado. In addition, 17.62% is made up of a reforestation area (Itirapina Experimental Station) dedicated to scientific research. Native vegetation, Brazilian Cerrado, and reforestation occupy a total of 38.5% of the hydrographic basin and correspond to the remaining conservation areas.
The basin’s southern region, however, where the courses of the Itaqueri River and Lobo Stream waterways lie, has two points with severe levels of environmental degradation from anthropic activities. During the application of the integrated basin protocol WEI at point It1, landscape completely altered and devoid of native vegetation was seen, and at point Lb1, the native vegetation corresponded to secondary forest in an initial-to-medium stage of regeneration. The points observed in the places of head springs (It1 and Lb1) had poor and fair conservation levels, representing the worst states of ecosystem integrity in the LRHB. In addition, fragments of remaining native vegetation were found, and applying the integrated basin protocol identified their state of ecological succession. According to the National Environmental Council (CONAMA in Portuguese) resolution [49], primary vegetation is represented by maximal local expression with broad biological diversity, minimal anthropic effects to the point of not significantly affecting its original characteristics of species and structure, while secondary or regenerating vegetation is the result of natural succession processes following total or partial suppression of primary vegetation, in which the remnants of primary vegetation may occur.
The points rated as poor, fair, and good by the integrated basin protocol indicate regions that require governmental intervention for the restoration, recovery, maintenance, and improvement of the ecosystems. Brazilian environmental legislation is broad and provides conditions for rural landowners to carry out recovery plans for such areas. Modern and innovative methods include payment for environmental services, in which management is based on the economic valuation of nature and, consequently, on the distribution of financial incentives to those responsible for environmental preservation [50]. The maintenance of preserved areas, often perceived as a loss, thus becomes profitable. The Water Producer Program uses the incentives in its projects as a way of valuing the work of the rural producers in ensuring proper conservation practices in rural properties and reforestation areas [50].

Methodological Discussion

The WHEBIP provides the rapid assessment of water ecosystem integrity in watersheds with riverine and sub-basin features derived primarily from aerial imagery and topographic maps. Its calibration is based on the relationship between the WHEBIP scores, and field data collected in the French Creek watershed, NY [12]. Further research conducted in the Cussewago Creek watershed (PA) indicates that the WHEBIP can be used as a quick assessment tool for generalized water course integrity. However, as it is a protocol based on observations from remote sensing data, it is subject to subjectivism, and it is necessary to consider uncertainties. For this reason, [12] recommend that the protocol be used primarily as a stratification tool to guide the classification of the integrity of water courses in watersheds. In the present study, the WHEBIP was applied in conjunction with the RAP to form the integrated basin protocol, WEI. Thus, the WHEBIP parameters were observed in the field work of the WEI protocol, reducing the uncertainties of the applied methodology. Furthermore, it was possible to validate the LULC map from spatial evaluation (confusion matrix) and correlation indices between field data and data obtained from GIS.
As assessed with category metrics in some studies, in general, the integrity of water courses gradually decreases as anthropic effects increase [21,51]. This pattern is particularly noticeable along the middle and lower part of rivers and their tributaries where anthropic pressure is most evident [21]. An analogous pattern of decline has also been observed in other studies [51,52]. According to the latter study, the ecological conditions, and the diversity of habitats in the stretches of the basin showed that, as it is an urban stream, the anthropic influence has become an important factor for the low levels of maintenance of the watersheds. These same ecological conditions were identified at most sampling stations along the Vermelho Stream in Minas Gerais, Brazil [52]. The results of the present study demonstrated the opposite. In the basin, the regions identified with poor and fair ecosystem integrity are close to the head springs of its principal rivers in the basin, while those corresponding to the medium and lower water courses are well-preserved due to the existence of environmental conservation activities protected by decrees. This demonstrates the effectiveness of the integrated protocol assessment WEI in identifying the parts with low conditions of ecosystem integrity in the rivers and streams, thus pointing out the places where the actions of restoration and maintenance of the habitat diversity need to be intensified.
The most frequently mentioned anthropogenic pressures are changes in natural cover, increased intensity in land use, impermeable surfaces, and hydromorphological disturbances [10,11]. Increased human pressures impair water quality and physical habitat quality and ultimately lead to changes in stream communities [8]. According to [52], assessing habitat diversity is an important tool in addressing the health of aquatic ecosystems due to the strong relationship between habitat availability and aquatic diversity. In addition, combining information from biophysical characterization with spatial analysis provides evidence for the ability of a stream to support a healthy aquatic community and the presence of chemical and organic pollution in the aquatic ecosystem.
As a suggestion for future work, we emphasize the importance of applying the methodology at other scales, such as, for example, integrating biological condition data with landscape integrity information at a multiscale level; relate stream condition to three different scales of landscape integrity (stream reach, catchment scale, and watershed scale) [53] and associate the WEI protocol to different types of landscape indicators.

6. Conclusions

This study developed a methodology based on GIS and field evaluation to identify ecosystem integrity in water courses in a transitional Brazilian Cerrado–Atlantic Forest interface. The method was used efficiently and effectively to inform land-use planning and management to sustain the ecosystem. The authors applied the integrated basin protocol WEI in the field, obtaining additional data on ecosystem integrity for each water course comprising the basin. While springs were identified in an intense process of degradation from anthropic activities, the basin also evidenced significant environmental conservation activities from the middle to lower courses of its waterways, which has maintained a considerable portion of its vegetal remnant. Furthermore, the Brazilian Cerrado, once deemed in the process of extinction, has been preserved through a conservation unit protected by Brazilian environmental legislation.
The integrated basin protocol WEI has proven to be effective and efficient in identifying regions that require government action in collaboration with landowners to promote economic development that supports environmental sustainability. The protocol enabled the verification of the general environmental conservation status of the Lobo Reservoir Hydrographic Basin, while identifying adverse impacts to the ecological integrity of its water course.

Author Contributions

A.R.S.: Conceptualization, Methodology, Formal analysis, Investigation, Writing—Original draft, Writing—Review and editing, Funding acquisition. M.A.G.A.B.: Conceptualization, Methodology, Formal analysis, Investigation, Writing—review and editing, Funding acquisition. T.B.: Conceptualization, Methodology, Formal analysis, Investigation, Writing—Review and editing, Funding acquisition. R.R.: Conceptualization, Methodology, Formal analysis, Investigation, Writing—Review and editing, Funding acquisition. P.S.A.: Conceptualization, Methodology, Formal analysis, Investigation, Writing—Review and editing, Funding acquisition. F.F.M.: Resources, Project administration, Supervision. All authors have read and agreed to the published version of the manuscript.

Funding

We would like to thank the University of São Paulo (USP) and Graduate Program in Environmental Engineering Sciences (PPG-SEA in Portuguese) for funding the APC.

Institutional Review Board Statement

Not applicable.

Informed Consent Statement

Not applicable.

Data Availability Statement

Not applicable.

Acknowledgments

We would like to thank the National Council of Scientific and Technological Development (CNPq in Portuguese) and Coordination for the Improvement of Higher Education Personnel (CAPES in Portuguese) for the scholarships given.

Conflicts of Interest

The authors declare no conflict of interest.

References

  1. WWF. Cerrado, the Brazilian Savanna. 2020. Available online: https://wwf.panda.org/discover/knowledge_hub/where_we_work/cerrado/ (accessed on 19 September 2022).
  2. Lewis, K.; de V. Barros, F.; Cure, M.B.; Davies, C.A.; Furtado, M.N.; Hill, T.C.; Hirota, M.; Martins, D.L.; Mazzochini, G.G.; Mitchard, E.T.A.; et al. Mapping native and non-native vegetation in the Brazilian Cerrado using freely available satellite products. Sci. Rep. 2022, 12, 1588. [Google Scholar] [CrossRef] [PubMed]
  3. Strassburg, B.B.N.; Brooks, T.; Feltran-Barbieri, R.; Iribarrem, A.; Crouzeilles, R.; Loyola, R.; Latawiec, A.E.; Oliveira Filho, F.J.B.; Scaramuzza, C.A.d.M.; Scarano, F.R.; et al. Moment of truth for the Cerrado hotspot. Nat. Ecol. Evol. 2017, 1, 99. [Google Scholar] [CrossRef]
  4. de Lima, R.A.F.; Oliveira, A.A.; Pitta, G.R.; de Gasper, A.L.; Vibrans, A.C.; Chave, J.; Ter Steege, H.; Prado, P.I. The erosion of biodiversity and biomass in the Atlantic Forest biodiversity hotspot. Nat. Commun. 2020, 11, 6347. [Google Scholar] [CrossRef] [PubMed]
  5. Oliveira, U.; Soares-Filho, B.S.; Paglia, A.P.; Brescovit, A.D.; De Carvalho, C.J.B.; Silva, D.P.; Rezende, D.T.; Leite, F.S.F.; Batista, J.A.N.; Barbosa, J.P.P.P.; et al. Biodiversity conservation gaps in the Brazilian protected areas. Sci. Rep. 2017, 7, 9141. [Google Scholar] [CrossRef] [PubMed] [Green Version]
  6. Rosa, M.R.; Brancalion, P.H.S.; Crouzeilles, R.; Tambosi, L.R.; Piffer, P.R.; Lenti, F.E.B.; Hirota, M.; Santiami, E.; Metzger, J.P. Hidden destruction of older forests threatens Brazil’s Atlantic Forest and challenges restoration programs. Sci. Adv. 2021, 7, eabc4547. [Google Scholar] [CrossRef]
  7. Periotto, N.A.; Tundisi, J.G. Serviĉos Ecossistêmicos do reservatório da UHE Carlos Botelho (Lobo-Broa): Uma nova abordagem para o gerenciamento e planejamento dos múltiplos usos de represas. Braz. J. Biol. 2013, 73, 471–482. [Google Scholar] [CrossRef] [Green Version]
  8. Tundisi, J.G.; Tundisi, T.M. Integrating ecohydrology, water management, and watershed economy: Case studies from Brazil. Ecohydrol. Hydrobiol. 2016, 16, 83–91. [Google Scholar] [CrossRef]
  9. Calijuri, M.L.; de Siqueira Castro, J.; Costa, L.S.; Assemany, P.P.; Alves, J.E.M. Impact of land use/land cover changes on water quality and hydrological behavior of an agricultural subwatershed. Environ. Earth Sci. 2015, 74, 5373–5382. [Google Scholar] [CrossRef]
  10. Mishra, P.K.; Rai, A.; Rai, S.C. Land use and land cover change detection using geospatial techniques in the Sikkim Himalaya, India. Egypt. J. Remote Sens. Space Sci. 2020, 23, 133–143. [Google Scholar] [CrossRef]
  11. Peng, J.; Liu, Y.; Liu, Z.; Yang, Y. Mapping spatial non-stationarity of human-natural factors associated with agricultural landscape multifunctionality in Beijing–Tianjin–Hebei region, China. Agric. Ecosyst. Environ. 2017, 246, 221–233. [Google Scholar] [CrossRef]
  12. Goforth, R.R.; Bain, M.B. Assessing stream integrity based on interpretations of map-based riparian and subbasin properties. Landsc. Ecol. Eng. 2012, 8, 33–43. [Google Scholar] [CrossRef]
  13. Anjinho, P.d.S.; Takaku, L.Y.R.B.; Barbosa, C.C.; Periotto, N.A.; Hanai, F.Y.; Mauad, F.F. Analysis of Susceptibility to Degradation of Water Ecosystem Services as a Tool for Land Use Planning: A Case Study in a Small Brazilian Watershed. Environ. Manag. 2022, 70, 990–1003. [Google Scholar] [CrossRef] [PubMed]
  14. Dos Santos, A.R.; Anjinho, P.d.S.; Neves, G.L.; Barbosa, M.A.G.A.; de Assis, L.C.; Mauad, F.F. Dynamics of environmental conservation: Evaluating the past for a sustainable future. Int. J. Appl. Earth Obs. Geoinf. 2021, 102, 102452. [Google Scholar] [CrossRef]
  15. Barbour, M.T. Rapid Bioassessment Protocols for Use in Wadeable Streams and Rivers: Periphyton, Benthic Macroinvertebrates and Fish; US Environmental Protection Agency, Office of Water: Washington, DC, USA, 1999.
  16. Neves, G.L.; Guimarães, T.T.; Anjinho, P.S.; Barbosa, M.A.G.A.; dos Santos, A.R.; Virgens Filho, J.S.; Mauad, F.F. Spatial and Seasonal Assessment of Water Quality in the Lobo Stream River Basin, Brazil Using Multivariate Statistical Techniques. An. Acad. Bras. Cienc. 2021, 93 (Suppl. 4). [Google Scholar] [CrossRef]
  17. Southerland, M.T.; Vølstad, J.H.; Weber, E.D.; Klauda, R.J.; Poukish, C.A.; Rowe, M.C.; Southerland, M.T.; Vølstad, J.H.; Weber, E.D.; Klauda, R.J.; et al. Application of the probability-based Maryland Biological Stream Survey to the state’s assessment of water quality standards. Environ. Monit. Assess. 2008, 150, 65–73. [Google Scholar] [CrossRef] [PubMed]
  18. Steedman, R.J. Modification and assessment of an index of biotic integrity to quantify stream quality in southern Ontario. Can. J. Fish. Aquat. Sci. 1988, 45, 492–501. [Google Scholar] [CrossRef]
  19. Doll, B.; Jennings, G.; Spooner, J.; Penrose, D.; Usset, J.; Blackwell, J.; Fernandez, M. Can Rapid Assessments Predict the Biotic Condition of Restored Streams? Water 2016, 8, 143. [Google Scholar] [CrossRef] [Green Version]
  20. Iverson, L.R.; Szafoni, D.L.; Baum, S.E.; Cook, E.A. A Riparian Wildlife Habitat Evaluation Scheme Developed Using GIS. Environ. Manag. 2001, 28, 639–654. [Google Scholar] [CrossRef]
  21. Jovanovska, D.; Slavevska-Stamenković, V.; Avukatov, V.; Hristovski, S.; Melovski, L. Applicability of the ‘Watershed Habitat Evaluation and Stream Integrity Protocol’ (WHEBIP) in assessment of the stream integrity in Bregalnica River Basin. Int. J. River Basin Manag. 2019, 17, 209–218. [Google Scholar] [CrossRef]
  22. Karr, J.R. Assessment of Biotic Integrity Using Fish Communities. Fisheries 1981, 6, 21–27. [Google Scholar] [CrossRef]
  23. Kosnicki, E.; Sites, R.W. Least-Desired Index for Assessing the Effectiveness of Grass Riparian Filter Strips in Improving Water Quality in an Agricultural Region. Environ. Entomol. 2007, 36, 713–724. [Google Scholar] [CrossRef]
  24. Ladson, A.R.; White, L.J.; Doolan, J.A.; Finlayson, B.L.; Hart, B.T.; Lake, P.S.; Tilleard, J.W. Development and testing of an Index of Stream Condition for waterway management in Australia. Freshw. Biol. 1999, 41, 453–468. [Google Scholar] [CrossRef]
  25. Petersen, R.C. The RCE: A Riparian, Channel, and Environmental Inventory for small streams in the agricultural landscape. Freshw. Biol. 1992, 27, 295–306. [Google Scholar] [CrossRef]
  26. Roset, N.; Grenouillet, G.; Goffaux, D.; Pont, D.; Kestemont, P. A review of existing fish assemblage indicators and methodologies. Fish. Manag. Ecol. 2007, 14, 393–405. [Google Scholar] [CrossRef]
  27. Rankin, E.T. The Qualitative Habitat Evaluation Index (QHEI)—Rationale, Methods, and Application: Ohio Environmental Protection Agency; Division of Water Quality, Ecological Assessment Section: Columbus, OH, USA, 1989. [Google Scholar]
  28. Maxwell, A.E.; Warner, T.A.; Fang, F. Implementation of machine-learning classification in remote sensing: An applied review. Int. J. Remote Sens. 2018, 39, 2784–2817. [Google Scholar] [CrossRef] [Green Version]
  29. Chaves, M.E.D.; Picoli, M.C.A.; Sanches, I.D. Recent Applications of Landsat 8/OLI and Sentinel-2/MSI for Land Use and Land Cover Mapping: A Systematic Review. Remote Sens. 2020, 12, 3062. [Google Scholar] [CrossRef]
  30. Chen, D.; Li, J.; Zhou, Z.; Liu, Y.; Li, T.; Liu, J. Simulating and mapping the spatial and seasonal effects of future climate and land -use changes on ecosystem services in the Yanhe watershed, China. Environ. Sci. Pollut. Res. 2018, 25, 1115–1131. [Google Scholar] [CrossRef] [PubMed]
  31. Meraj, G.; Singh, S.K.; Kanga, S.; Islam, M.N. Modeling on comparison of ecosystem services concepts, tools, methods and their ecological-economic implications: A review. Model. Earth Syst. Environ. 2022, 8, 15–34. [Google Scholar] [CrossRef]
  32. Wen, D.; Ma, S.; Zhang, A.; Ke, X. Spatial Pattern Analysis of the Ecosystem Services in the Guangdong-Hong Kong-Macao Greater Bay Area Using Sentinel-1 and Sentinel-2 Imagery Based on Deep Learning Method. Sustainability 2021, 13, 7044. [Google Scholar] [CrossRef]
  33. Wolff, S.; Schulp, C.J.E.; Verburg, P.H. Mapping ecosystem services demand: A review of current research and future perspectives. Ecol. Indic. 2015, 55, 159–171. [Google Scholar] [CrossRef]
  34. Diniz, J.M.F.d.S.; Gama, F.F.; Adami, M. Evaluation of polarimetry and interferometry of sentinel-1A SAR data for land use and land cover of the Brazilian Amazon Region. Geocarto Int. 2020, 37, 1482–1500. [Google Scholar] [CrossRef]
  35. EPA. Biological Criteria for the Protection of Aquatic Life, Division of Water Quality Monitoring and Assessment; EPA: Columbus, OH, USA, 1987.
  36. Hannaford, M.J.; Barbour, M.T.; Resh, V.H. Training reduces observer variability in visual-based assessments of stream habitat. J. N. Am. Benthol. Soc. 1997, 16, 853–860. [Google Scholar] [CrossRef]
  37. Callisto, M.; Ferreira, W.; Moreno, P.; Goulart, M.; Petrucio, M.M. Aplicação de um protocolo de avaliação rápida da diversidade de habitats em atividades de ensino e pesquisa. Acta Limnol. Bras. 2002, 14, 91–98. Available online: https://www.researchgate.net/publication/320258459_Aplicacao_de_um_protocolo_de_avaliacao_rapida_da_diversidade_de_habitats_em_atividades_de_ensino_e_pesquisa_MG-RJ (accessed on 30 December 2020).
  38. Chagas, F.B.; Rutkoski, C.F.; Bieniek, G.B.; Vargas, G.D.L.P.; Hartmann, P.A.; Hartmann, M.T. Utilização da estrutura de comunidades de macroinvertebrados bentônicos como indicador de qualidade da água em rios no sul do Brasil. Rev. Ambient. Agua 2017, 12, 416–425. [Google Scholar] [CrossRef] [Green Version]
  39. Cordeiro, G.G.; Guedes, N.d.M.; Kisaka, T.B.; Nardoto, G.B. Avaliação rápida da integridade ecológica em riachos urbanos na bacia do rio Corumbá no Centro-Oeste do Brasil. Rev. Ambient. Agua 2016, 11, 702–710. [Google Scholar] [CrossRef] [Green Version]
  40. Rodrigues, A.S.d.L.; Malafaia, G.; Costa, A.T.; Nalini Junior, H.A. Adequacao e avaliacao da aplicabilidade de um Protocolo de Avaliação Rápida na bacia do rio Gualaxo do Norte, Leste-Sudeste do Quadrilatero Ferrifero, MG, Brasil. Ambient. Agua—Interdiscip. J. Appl. Sci. 2012, 7, 231–244. [Google Scholar] [CrossRef] [Green Version]
  41. Campregher, R.; Martins, R.C. O “Modelo Broa” e a produção de conhecimento científico sobre o meio ambiente. Desenvolv. Meio Ambient. 2017, 40, 141–158. [Google Scholar] [CrossRef] [Green Version]
  42. Governo do Estado. Declara Área de Proteção Ambiental Regiões Situadas em Diversos Municípios, Dentre os Quais Corumbatai, Botucatu e Tejupa; Governo do Estado: Sao Paulo, Brasil, 1983.
  43. Fundação Florestal. Plano de Manejo Integrado das Estações Ecológica e Experimetnal de Itirapina/SP; Fundação Florestal: São Paulo, Brasil, 2006. [Google Scholar]
  44. United States Geological Survey. Sentinel 2A Satellite Image; Copernicus Open Access Hub Eur. Sp. Agency: United Sates 2022. Available online: https://www.usgs.gov/ (accessed on 10 February 2021).
  45. United States Geological Survey. Digital Elevation Model (DEM), Advanced Spaceborne Thermal Emission and Reflection Radiometer (ASTER); Copernicus Open Access Hub Eur. Sp. Agency: United States 2015. Available online: https://www.usgs.gov/ (accessed on 10 February 2021).
  46. Abd El-Kawy, O.R.; Ismail, H.A.; Yehia, H.M.; Allam, M.A. Temporal detection and prediction of agricultural land consumption by urbanization using remote sensing. Egypt. J. Remote Sens. Space Sci. 2019, 22, 237–246. [Google Scholar] [CrossRef]
  47. Heidarlou, H.B.; Shafiei, A.B.; Erfanian, M.; Tayyebi, A.; Alijanpour, A. Effects of preservation policy on land use changes in Iranian Northern Zagros forests. Land Use Policy 2019, 81, 76–90. [Google Scholar] [CrossRef]
  48. Congalton, R.G.; Green, K. Assessing the Accuracy of Remotely Sensed Data: Principles and Practices. p. 328. Available online: https://www.perlego.com/book/1605289/assessing-the-accuracy-of-remotely-sensed-data-principles-and-practices-third-edition-pdf (accessed on 25 January 2023).
  49. CONAMA. Resolução CONAMA n° 10, de 1° de Outubro de 1993; CONAMA: Brasilia, Brazil, 1993. [Google Scholar]
  50. ANA. Water National Agency. Manual Operativo do Programa Produtor de Água; ANA: Brasília, Brazil, 2012. [Google Scholar]
  51. Bruno, D.; Belmar, O.; Sánchez-Fernández, D.; Guareschi, S.; Millán, A.; Velasco, J. Responses of Mediterranean aquatic and riparian communities to human pressures at different spatial scales. Ecol. Indic. 2014, 45, 456–464. [Google Scholar] [CrossRef]
  52. Menezes, J.P.C.; Oliveira, L.F.C.; Salla, M.R. Metrics of benthic communities and habitat quality associated to different types of land use. Eng. Sanit. Ambient. 2019, 24, 737–746. [Google Scholar] [CrossRef] [Green Version]
  53. Riato, L.; Leibowitz, S.G.; Weber, M.H. The use of multiscale stressors with biological condition assessments: A framework to advance the assessment and management of streams. Sci. Total Environ. 2020, 737, 139699. [Google Scholar] [CrossRef] [PubMed]
Figure 1. Lobo Reservoir Hydrographic Basin (LRHB) location. (A) South America and Brazil states; (B) São Paulo State; (C) Waterway drainage system and hydrographic basin contour lines of LRHB, with water courses and Water Ecosystem Integrity (WEI) points.
Water 15 00775 g001
Figure 2. Accuracy of the transition matrix for each thematic class of LRHB, including Producer and User accuracies, and Omission and Inclusion errors.
Water 15 00775 g002
Figure 3. LULC map with integrated basin protocol WEI application points.
Water 15 00775 g003
Figure 4. Associations between scores on the LULC map and results of land use extracted from the WEI protocol.
Water 15 00775 g004
Figure 5. Integrated basin protocol WEI score for each application point with photographs for each location visited.
Water 15 00775 g005aWater 15 00775 g005b
Table 1. Data type, date of acquisition, source, acquisition, and scale or resolution of spatial data used to identify Water Ecosystem Integrity of rivers and streams.
Data TypeDate of
Acquisition
SourceAcquisition Scale or
Resolution
LULCSeptember
2022
Satellite image
Sentinel-2A
USGS [44]10 m/20 m
Waterway
drainage system
2015Digital Elevation Model (DEM), Advanced Spaceborne Thermal Emission and Reflection Radiometer (ASTER) United States Geological Survey (USGS) [45]1:50,000
Hydrographic
basin contour lines
Table 2. Watershed Habitat Evaluation and Biotic Integrity Protocol (WHEBIP) adapted to land use/land cover of the LRHB characteristics and Brazilian legislation.
ParametersDescriptionRating
1. Dominant riverine land coverNative vegetation, Brazilian Cerrado 35
Flooded area, reforestation25
Pasture, agriculture5
Urban area, residential/commercial construction, exposed soil1
2. Estimated PPA width; mark all
other ground cover as 1.
>30 m35
5–30 m25
<5 m1
3. Continuity of riparian canopy
along waterway
Without breaks35
Breaks comprise up to 10%25
Breaks comprise between 10% and 50% 10
Breaks comprise between 50% and 100% 1
4. Succession stage of native vegetation of riparian forest along water coursePrimary forest, secondary forest in
advanced regeneration
50
Secondary forest in initial-to-medium regeneration 25
Degraded forest, any land use1
5. WetlandsWetlands dominate riparian area20
Wetlands comprise up to 50% of riparian area10
Absence of wetlands 5
6. Estimated percent of land cover
beyond riverside area, such as agriculture, urban areas, roadways, or industrialization
<25%25
25–49%15
50–74%5
>75%1
7. Estimated percent of land cover beyond riparian area
as native vegetation.
>75%35
Between 50% and 75%20
25–49%10
<25%1
8. Riverine coverage for upstream segments, including tributaries converging into water courseNative vegetation, Brazilian Cerrado50
Wetland, reforestation40
Pasture, agriculture10
Urban area, residential/commercial
construction, exposed soil
1
9. Sub-basin land cover for upstream segments, including tributaries converging into water>75% intact30
50–75% intact20
25–49% intact10
<25% intact1
10. Flow segment sub-basin land gradientLow20
Moderate15
High10
11. Point source pollution, e.g., sewage treatment plants, mines, construction, stockyards, cattle trailsNo probable identified25
Point source likely in drainage area10
Point source likely adjacent to flow1
12. Roads, e.g., logging, farm, gravel, crossings with bridges or culvertsWithout roads25
Roads within 30 m of stream
or crossing with bridges or culverts
10
Stream bed crossings or active construction1
13. Conservation measures, such as riverside fencing, soil conservation, set-aside. Rate areas dominated by forests and wetlands at 25 rating.Conservation measures for more than 10 years25
Conservation measures for 5–10 years15
Conservation measures for less than 5 years10
Absence of conservation measures1
Adapted from [12].
Table 3. Rapid Assessment Protocol for Habitat Diversity (RAP) adapted to tropical regions of transitory Brazilian Cerrado–Atlantic Forest interface.
ParametersDescriptionRating
14. Erosion at or near margins
and silting of water course bed
Absent35
Moderate25
Significant1
15. Water odorNone35
Sewer (rotten egg)10
Oil/industrial1
16. Type of bottom of the riverOil/industrial35
Mud and/or sand25
Cement/plumbing1
17. Habitat types of the bottom of the riverHabitat > 50% diversified
(Submerged trunk/gravel)
50
Habitat between 30% and 50% diverse, suitable
to sustain aquatic populations
40
Habitat between 10% and 30% diverse,
insufficient with substrata modification
10
Habitat <10% diverse, evidently deficient with unstable rocky substrate for fixation of organisms1
18. Extensive rapidsWell-developed rapids, as wide as
the water course and twice its width in length
50
Equal in width to water course
but less than twice its width in length
40
Fast stretches may be absent and are not as wide as water course and less than twice its width in length10
Absence of rapids1
19. Frequency of rapidsRelatively frequent, with distance between rapids divided by water course width between 5 and 750
Infrequent, with distance between rapids
divided by water course width between 7 and 15
40
Occasional, with distance between rapids
divided by water course width between 15 and 25
10
Generally, with smooth water or shallow rapids,
with distance divided by water course width > 25
1
20. Sedimentary depositLess than 5% of by water course bed with mud deposits and absence of deposition in backwaters35
Some evidence of bottom modification, mainly as gravel, sand, or mud build-up, with 5–30% of bed affected and mild deposition in backwaters20
Moderate deposit of gravel, sand, or mud on banks with 30–50% of bed affected and
moderate deposition in backwaters
10
Large mud deposits and increased bank development with > 50% of bed modified and backwaters absent
due to significant sediment deposition
1
21. Channel alterationNormal by water course pattern with channeling (rectification) or dredging absent or minimal35
Some channeling, usually near bridge construction, evidence of changes over decades20
Some modification on both banks
with 40–80% of the by water course altered
10
Bank modifications affecting > 80% of waterway1
22. Flow characteristicsRelatively equal flow across the by water course width
with minimal exposed substrate
40
Water depth > 75% of by water course channel
or < 25% exposed substrate
20
Water depth 25–75% of channel and/or
most substrate in rapids exposed
10
Water depth scarce and present only in backwaters1
23. PlantsSmall aquatic macrophytes, mosses,
or both distributed over bed
40
Aquatic macrophytes, filamentous algae, or mosses in waterway with substrate with periphyton30
Filamentous or macrophyte algae on few rocks or some backwaters with abundant periphyton and biofilm20
Absence of aquatic vegetation on bed
or large macrophyte banks such as water hyacinth
10
Adapted from [35,36,37].
Table 4. Water course integrity via LULC interpretations of waterside, sub-basins, and field visits.
PoorFairGood Very GoodExcellent
Riparian zoneIntensive land use with or sparse woody riparian zoneNarrow woody riparian corridor or pasture with intensive land use and frequent breaksRiparian corridor > 10 m wide with moderate use and occasional breaksRiparian corridor > 30 m wide with low to moderate use and few breaksForested riparian corridor > 50 m wide with few or no breaks
Drainage canalUnstable with sediment bars, plumbing and/or low unstable benchesLargely unstable with gravel bars and low unstable banksLargely stable with gravel bars and moderately stable banks with some undercuttingStable, with occasional gravel bars and largely stable banks with little undercuttingStable with sparse gravel bars and stable banks with little undercutting without support
SubstrateDominated by fine, largely homogenous particles Gravel and embedded cobblestones with few gapsGravel and cobblestones with obvious sediment and gapsGravel, cobblestones and boulders with light sediment and obvious gapsGravel, cobblestone, and boulders with little or no sediment and obvious gaps
Biotic integrityMats of macrophytes or algae, sparse rheophilic fish, and low benthic species richnessMats of macrophytes or algae, few rheophilic fish, benthos-tolerant with moderate species richnessSparse macrophyte or algae patches, some Theophilus fish, moderate benthic species richnessSome algae and/or moss stains, common rheophilic fish, high benthic species richness Some algae and/or moss stains, common rheophilic fish, high richness of benthic species
Adapted from [12,25].
Table 5. Integrated basin protocol WEI application points.
PointDescriptionWater CourseGeographic Coordinates
It1Head spring (farm)Itaqueri22°20′27.60″ S47°55′17.72″ O
Lb1Head spring (farm)Lobo22°18′42.03″ S47°56′15.59″ O
It2Proximate to dirt road Itaqueri22°18′43.50″ S47°52′47.80″ O
Lb2Proximate to dirt road Lobo22°17′20.50″ S47°55′35.30″ O
Lb3Proximate to highwayLobo22°15′54.23″ S47°54′42.36″ O
It3Proximate to highwayItaqueri22°15′29.90″ S47°51′53.20″ O
It4Ecological Station (Itirapina)Itaqueri22°13′27.79″ S47°54′03.56″ O
Lb4Experimental Station (Itirapina)Lobo22°14′41.57″ S47°51′43.08″ O
Ab1City of Itirapina, SPÁgua Branca22°14′56.69″ S47°49′08.47″ O
Ab2Proximate to highwayÁgua Branca22°13′52.90″ S47°51′12.10″ O
GProximate to highwayGeraldo22°12′22.70″ S47°52′16.90″ O
Table 6. Area and basin occupancy rate for each LULC class of the LRHB.
ClassArea (km2)Occupancy
Agriculture5.852.64%
Water 5.872.65%
Flooded area19.108.62%
Urban area20.269.14%
Brazilian Cerrado 22.7310.26%
Native Vegetation23.5410.62%
Pasture34.2415.45%
Reforestation 39.0517.62%
Exposed Soil50.9623.00%
Total221.60100%
Table 7. Land-use classes identified during the application of the WEI protocol (Field Analysis) in comparison with the land-use classes identified in the spatial analysis.
PointField AnalysisSpatial Analysis
It1Pasture or AgriculturePasture or Agriculture
Lb1Pasture or AgriculturePasture or Agriculture
It2Native Vegetation or Brazilian CerradoNative Vegetation or Brazilian Cerrado
Lb2Native Vegetation or Brazilian CerradoNative Vegetation or Brazilian Cerrado
It3Urban Area or Exposed SoilFlooded Area or Reforestation
Lb3Native Vegetation or Brazilian CerradoFlooded Area or Reforestation
It4Native Vegetation or Brazilian CerradoFlooded Area or Reforestation
Lb4Native Vegetation or Brazilian CerradoNative Vegetation or Brazilian Cerrado
Ab1Urban Area or Exposed SoilUrban Area or Exposed Soil
Ab2Native Vegetation or Brazilian CerradoNative Vegetation or Brazilian Cerrado
GNative Vegetation or Brazilian CerradoUrban Area or Exposed Soil
Disclaimer/Publisher’s Note: The statements, opinions and data contained in all publications are solely those of the individual author(s) and contributor(s) and not of MDPI and/or the editor(s). MDPI and/or the editor(s) disclaim responsibility for any injury to people or property resulting from any ideas, methods, instructions or products referred to in the content.

