Article

Research on the Change in Prediction of Water Production in Urban Agglomerations on the Northern Slopes of the Tianshan Mountains Based on the InVEST–PLUS Model

1
School of Geography and Tourism, Xinjiang Normal University, Urumqi 830054, China
2
Xinjiang Key Laboratory of Lake Environment and Resources in Arid Zone, Urumqi 830054, China
3
Research Centre for Urban Development of Silk Road Economic Belt, Xinjiang Normal University, Urumqi 830054, China
*
Author to whom correspondence should be addressed.
Water 2023, 15(4), 776; https://doi.org/10.3390/w15040776
Submission received: 3 December 2022 / Revised: 4 February 2023 / Accepted: 12 February 2023 / Published: 16 February 2023
(This article belongs to the Section Urban Water Management)

Abstract

:
Assessing how land use change will affect water production ecosystem services is essential to developing sound water resource management and ecosystem conservation. The results of a coordination analysis of land-use intensity and water yield based on future land-use simulation projections are useful for future land-use planning. To effectively assess water production rates, the PLUS and InVEST models were used to dynamically assess the changes in water production occurring in the urban agglomeration on the northern slopes of the Tianshan Mountains from 2000 to 2030 under different scenarios of land-use change. The results show that the water-production rates in the study area from 2000 to 2020 were 517.26 × 10⁶ m3, 582.28 × 10⁶ m3, and 456 × 106 m3, showing an increasing and then decreasing trend, with the water production function decreasing from the foothills of the Tianshan Mountains to the north and south, with values of 509.10 × 10⁶ m33, 510.90 × 10⁶ m3, and 502.28 × 10⁶ m3 being presented for the three scenarios in 2030. The rapid economic development scenario presents the lowest water yield values and the ecological conservation development scenario presents the highest water yield values. Changes in water production rates are closely related to changes in land use, which can be verified further by an analysis of the coordination between land- use intensity and water production. For this study area, the ecological conservation development scenario may be more in line with the future urban development pattern, and the results of the present study can provide some scientific references for land-use planning.

1. Introduction

Water is the basis for human survival and social development, and the relationship between people and water has an important impact on the coordination of human–earth systems [1]. With the increase in water demand and water shortages occurring due to the deterioration of the water environment, there is a threat to the water-holding capacity of regional ecosystems [2], which severely hinders food production and energy development [3]. In order to achieve sustainable development goals and maintain harmony between human beings and land systems, the trade-off between urban development and water ecosystem security is crucial [4,5]. As an important way in which ecosystems participate in hydrological regulation processes, water yield refers to the process and capacity of ecosystems to store and hold water in a given time and space [6], the drainage that occurs during the non-rainy season, and the recharge of the ecological base flow of a watershed to ensure water for human life and social development [7]. Quantitative assessments and visualizations of water yield are therefore increasingly observed as means of elucidating human–water interactions [8], which can help us to achieve the effective management and conservation of water resources, with important implications for sustainable development and human well-being at a regional scale [9].
Water production reflects the renewable capacity of regional water resources and the carrying capacity of the water environment. The contradiction between water supply and demand poses an increasing challenge to human production and life [10]. Regional water-retention capacity is related to vegetation, species survival, and various aspects of social life, and it is necessary to explore the delineation of water-saving ecological space under the guidance of water resources management in order to alleviate the conflicts between water use, water environments, water ecology, and resource development [11,12]. In recent years, many scholars have conducted a large number of studies at different levels regarding the relationship and mechanisms between human activities and water resource changes [13,14]. Water resource changes at the basin scale are significantly influenced by climate change and human activities [15]. At the urban scale, the impact of human activity on the water-producing functions of the ecosystem is more evident, and its effects are mainly reflected in the different land-use scenarios that change the formation of the watershed. Land-cover types change according to people’s needs, and these alter the physical and chemical properties of the substrate, ultimately affecting hydrological components, such as surface runoff, soil-water content, and evapotranspiration, and threatening the water security of the area [16,17]. Models are commonly used to assess water production, and the SWAT, PLOAD, HSPF, and InVEST models are commonly used in research practice [18]. Taking into account the geographical characteristics of the study area, the InVEST model is more applicable to the water production simulation of this study than former three models [19]. In addition, the model takes into account natural conditions, human activities [20], land-use [21], and water use trade-offs [22], making it more comprehensive. The InVEST model has been used to assess water production in geographically diverse areas, such as Hawaii, Indonesia, and China [23,24]. In previous studies, it has been observed that changes in water yield values by site type over recent years in the study area are generally consistent with the trends in area change [25], suggesting that climate and land-use changes are the main reasons for the decline in water yield services [26]. This also suggests that spatial variations in land-use driven by human activities are an important factor influencing the spatial and temporal variations in water yield. In practice, parameter settings need to be corrected in order to integrate them into the decision-making process. An important parameter that must be entered into the InVEST model when estimating water yield is the Z-parameter. Z is an empirical constant that reflects local precipitation patterns and hydrogeological characteristics, with typical values ranging from 1 to 30. The calibration of the Z-parameter can also be performed by comparing model data with observed data. Its primary role in the model is to influence estimates of water yield based on local precipitation patterns and hydrogeological characteristics. However, it is determined by comparing observed streamflow data, which can lead to a high degree of subjectivity and is unlikely to reflect the surface characteristics of the catchment [27]. Water production is an important ecosystem service that provides the basis for human survival and development, and water production distributions must be calculated and mapped with scientific accuracy. We have done extensive experiments in setting Z-parameters. Comparisons were made with government water resource bulletins to ensure the accuracy of the parameters. Predicting changes in the ecosystem of water production provides new ideas for studying future land-use change and the evolution of water production. Land-use change provides a clearer understanding of the ecological changes and their characteristics resulting from the interaction between human activities and the natural environment. The impact of land-use change on ecosystem services can be better reflected using land-use scenario simulations. In 2021, a raster-based Patch Generation Land-use Simulation (PLUS) model was developed to reveal the potential drivers and their different contributions to change. Rules for land use change were identified to improve the model’s ability to simulate realistic landscape patterns. The model has become one of the common support methods used by policymakers and managers. Scholars have used the model to conduct research [28]. These studies provide a valuable reference for regional water resources management and ecological planning. We found that, in addition to considering the impact of land type conversion on changes in water yield, considering also the harmonious relationship between land-use intensity and water yield functions in arid and semi-arid regions would facilitate a more systematic and comprehensive assessment of the impact of land-use change on regional water yield. In addition, the scientific validity of the model output depends on the accuracy of the input parameters. This study proposes a feasible and replicable framework for land use decision-making in ecologically fragile areas based on land use modeling techniques and a coordination degree model. It not only contributes to an in-depth understanding of the future urban growth patterns of the Tianshan North Slope urban agglomeration but also helps to inform different land-use stakeholders. The study will reveal the underlying patterns of water production evolution in the Tianshan north slope urban agglomeration, driven by the “Belt and Road” construction, to provide scientific reference for the sustainable development of the Tianshan north slope urban agglomeration and for the environmental protection of its ecosystem.
The overall objective of this study is to project future land-use changes under three different scenarios in 2030 and to analyze the impact of land-use on the water-producing functions of urban agglomerations to achieve a balance between economic growth and ecological conservation in ecologically fragile areas. The specific objectives of the study are (1) to project future land-use and water production changes in 2030 under three scenarios and assess the mechanisms of their interaction by coupling the InVEST and PLUS models, and (2) to determine the combined impacts and relative importance of land-use changes on changes in ecosystem services.

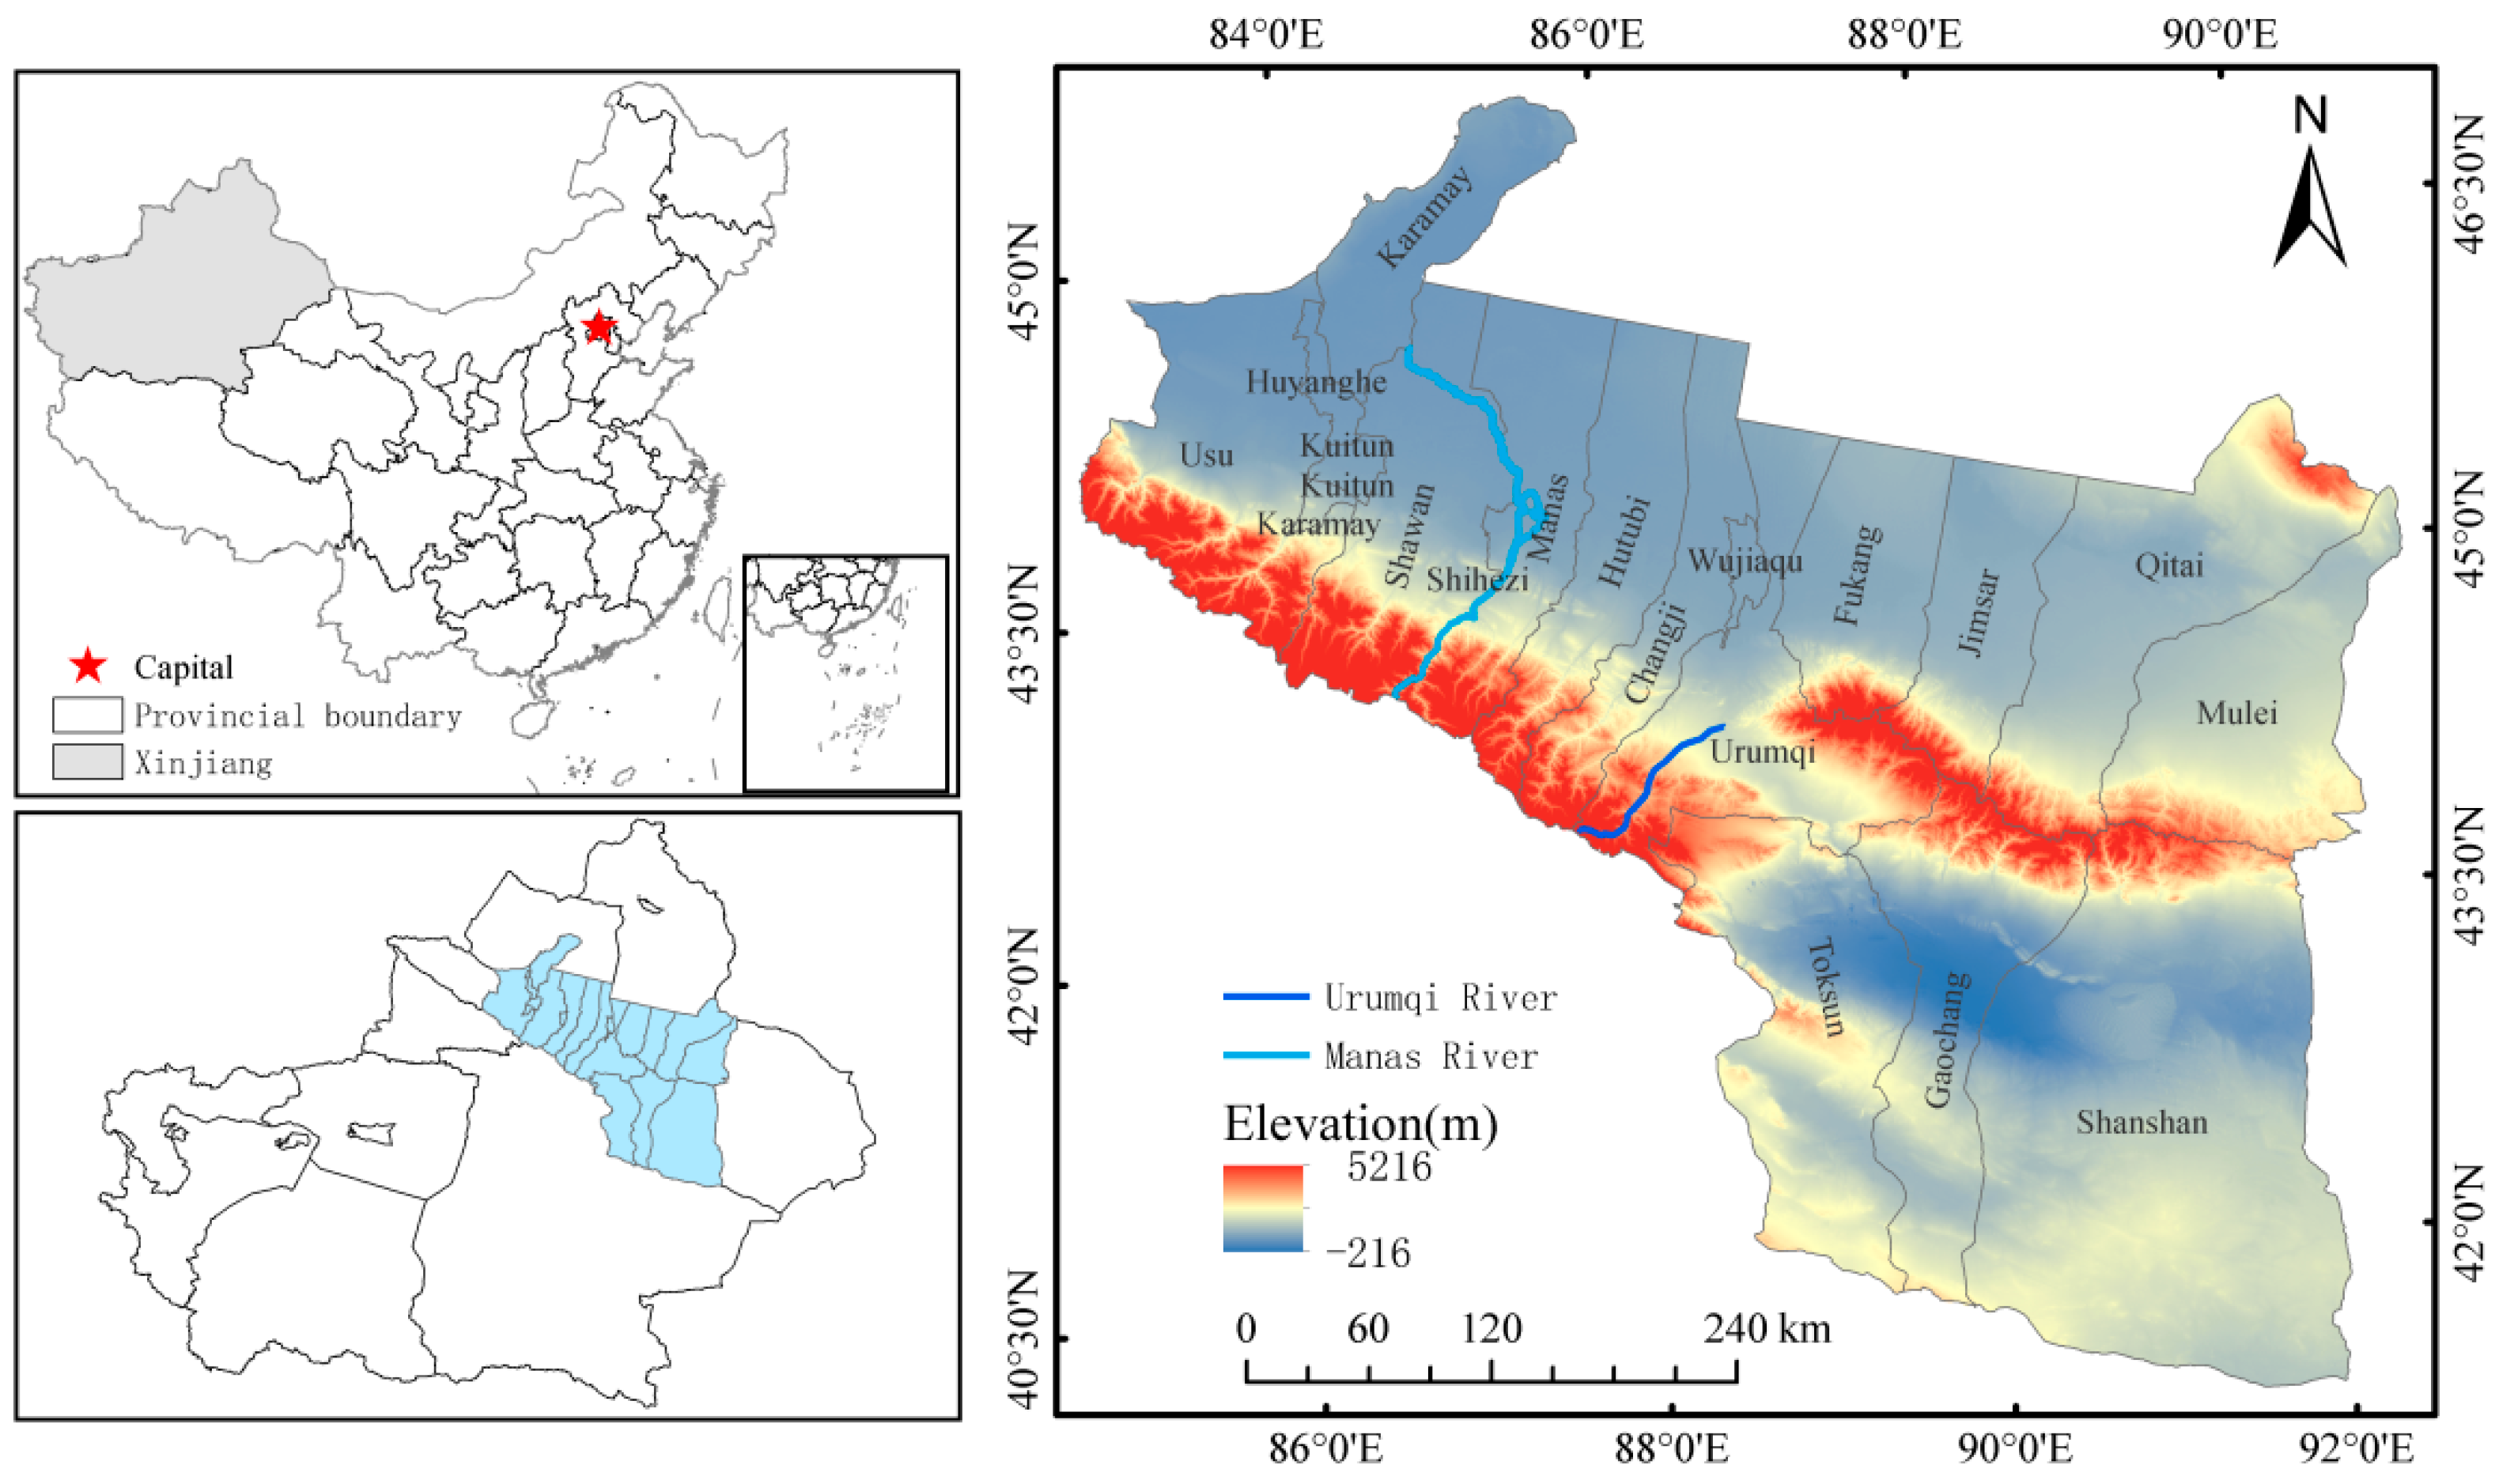
2. Overview of the Study Area

The urban agglomeration on the northern slopes of the Tianshan Mountains is located in the southern area of the Junggar Basin, between 42°78′ and 45°59′ N, 84°33′ and 90°32′ E, south of the Tianshan Mountains and north of the Gurbantunggut Desert (Figure 1; the mapping space referenced is WGS_1984_UTM_Zone_45N). The main natural vegetation consists of grassland and shrubs, and the woodland is dominated by evergreen coniferous forests in the southern mountains. The main soil types are brown calcareous soils, wind-sanded soils, salt soils, irrigated silts, and gray desert soils, and glacial and permafrost soils are widely distributed in the middle- and high-mountain areas. Under the combined influence of human activities and the natural climate, the salt desertification of the oasis margins in the region is significant, glacier retreat is severe, and the fragile ecological environment in the region can constrain sustainable socio-economic development.

3. Data Sources and Research Methodology
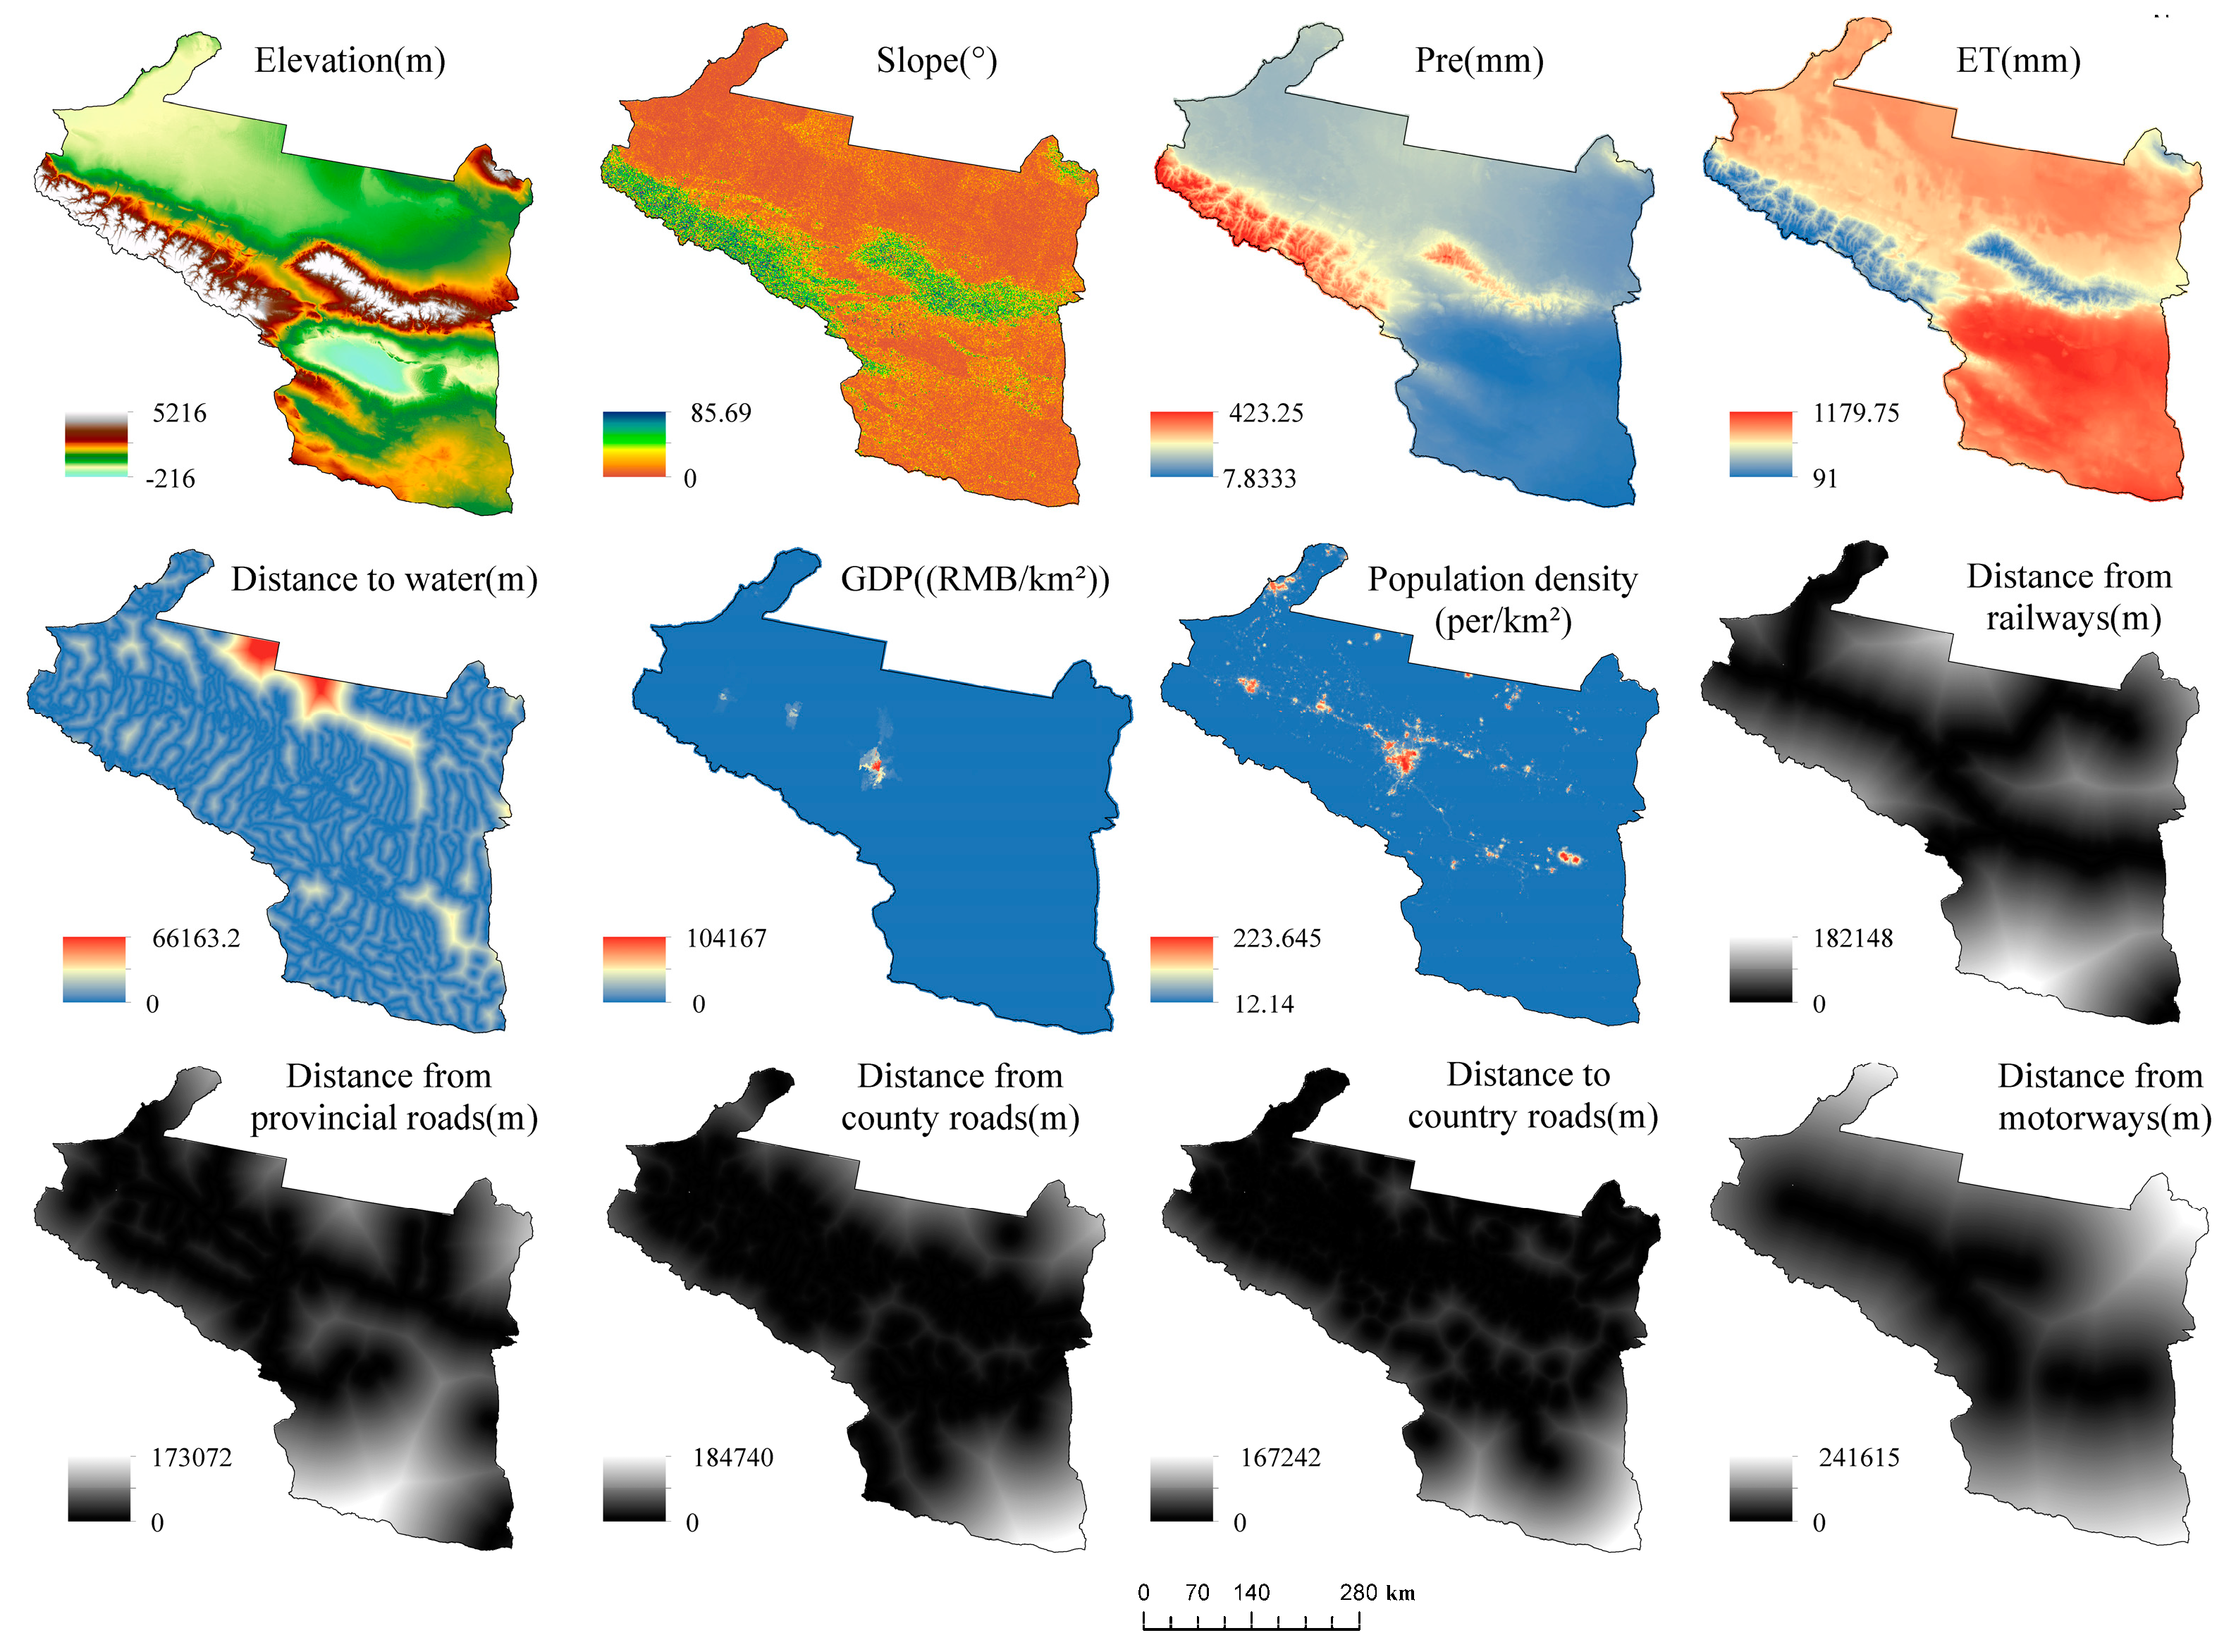
3.1. Data Sources

The data covered in this study include land-use data from 2000 to 2020 for the formation of Tianshan North Slope. The drivers of land-use change include natural conditions, accessibility, and socio-economic factors, of which elevation, slope and slope direction, average annual temperature, and rainfall data were selected for the natural conditions. Accessibility factors include distance vector data from rivers, railways, highways, national roads, provincial roads, county roads, etc., obtained by calculating Euclidean distances. Socio-economic factors were selected as the population density and nighttime light index, which were extracted using NPP/VIIRS nighttime light data (from the NOAA website). NDBSI data for the urban agglomeration on the northern slopes of the Tianshan Mountains were calculated based on MODIS Aqua surface reflectance data using MYD09A1, and NDVI data were calculated using the Google Remote Sensing cloud computing platform, calling the annual average data calculated from the 2020 continuity index MYD13A1V6 a 500-m resolution product. The above data were transformed into 1 km × 1 km raster data after a series of data pre-processing work such as projection transformation, cropping, and resampling in the ArcGIS analysis software.

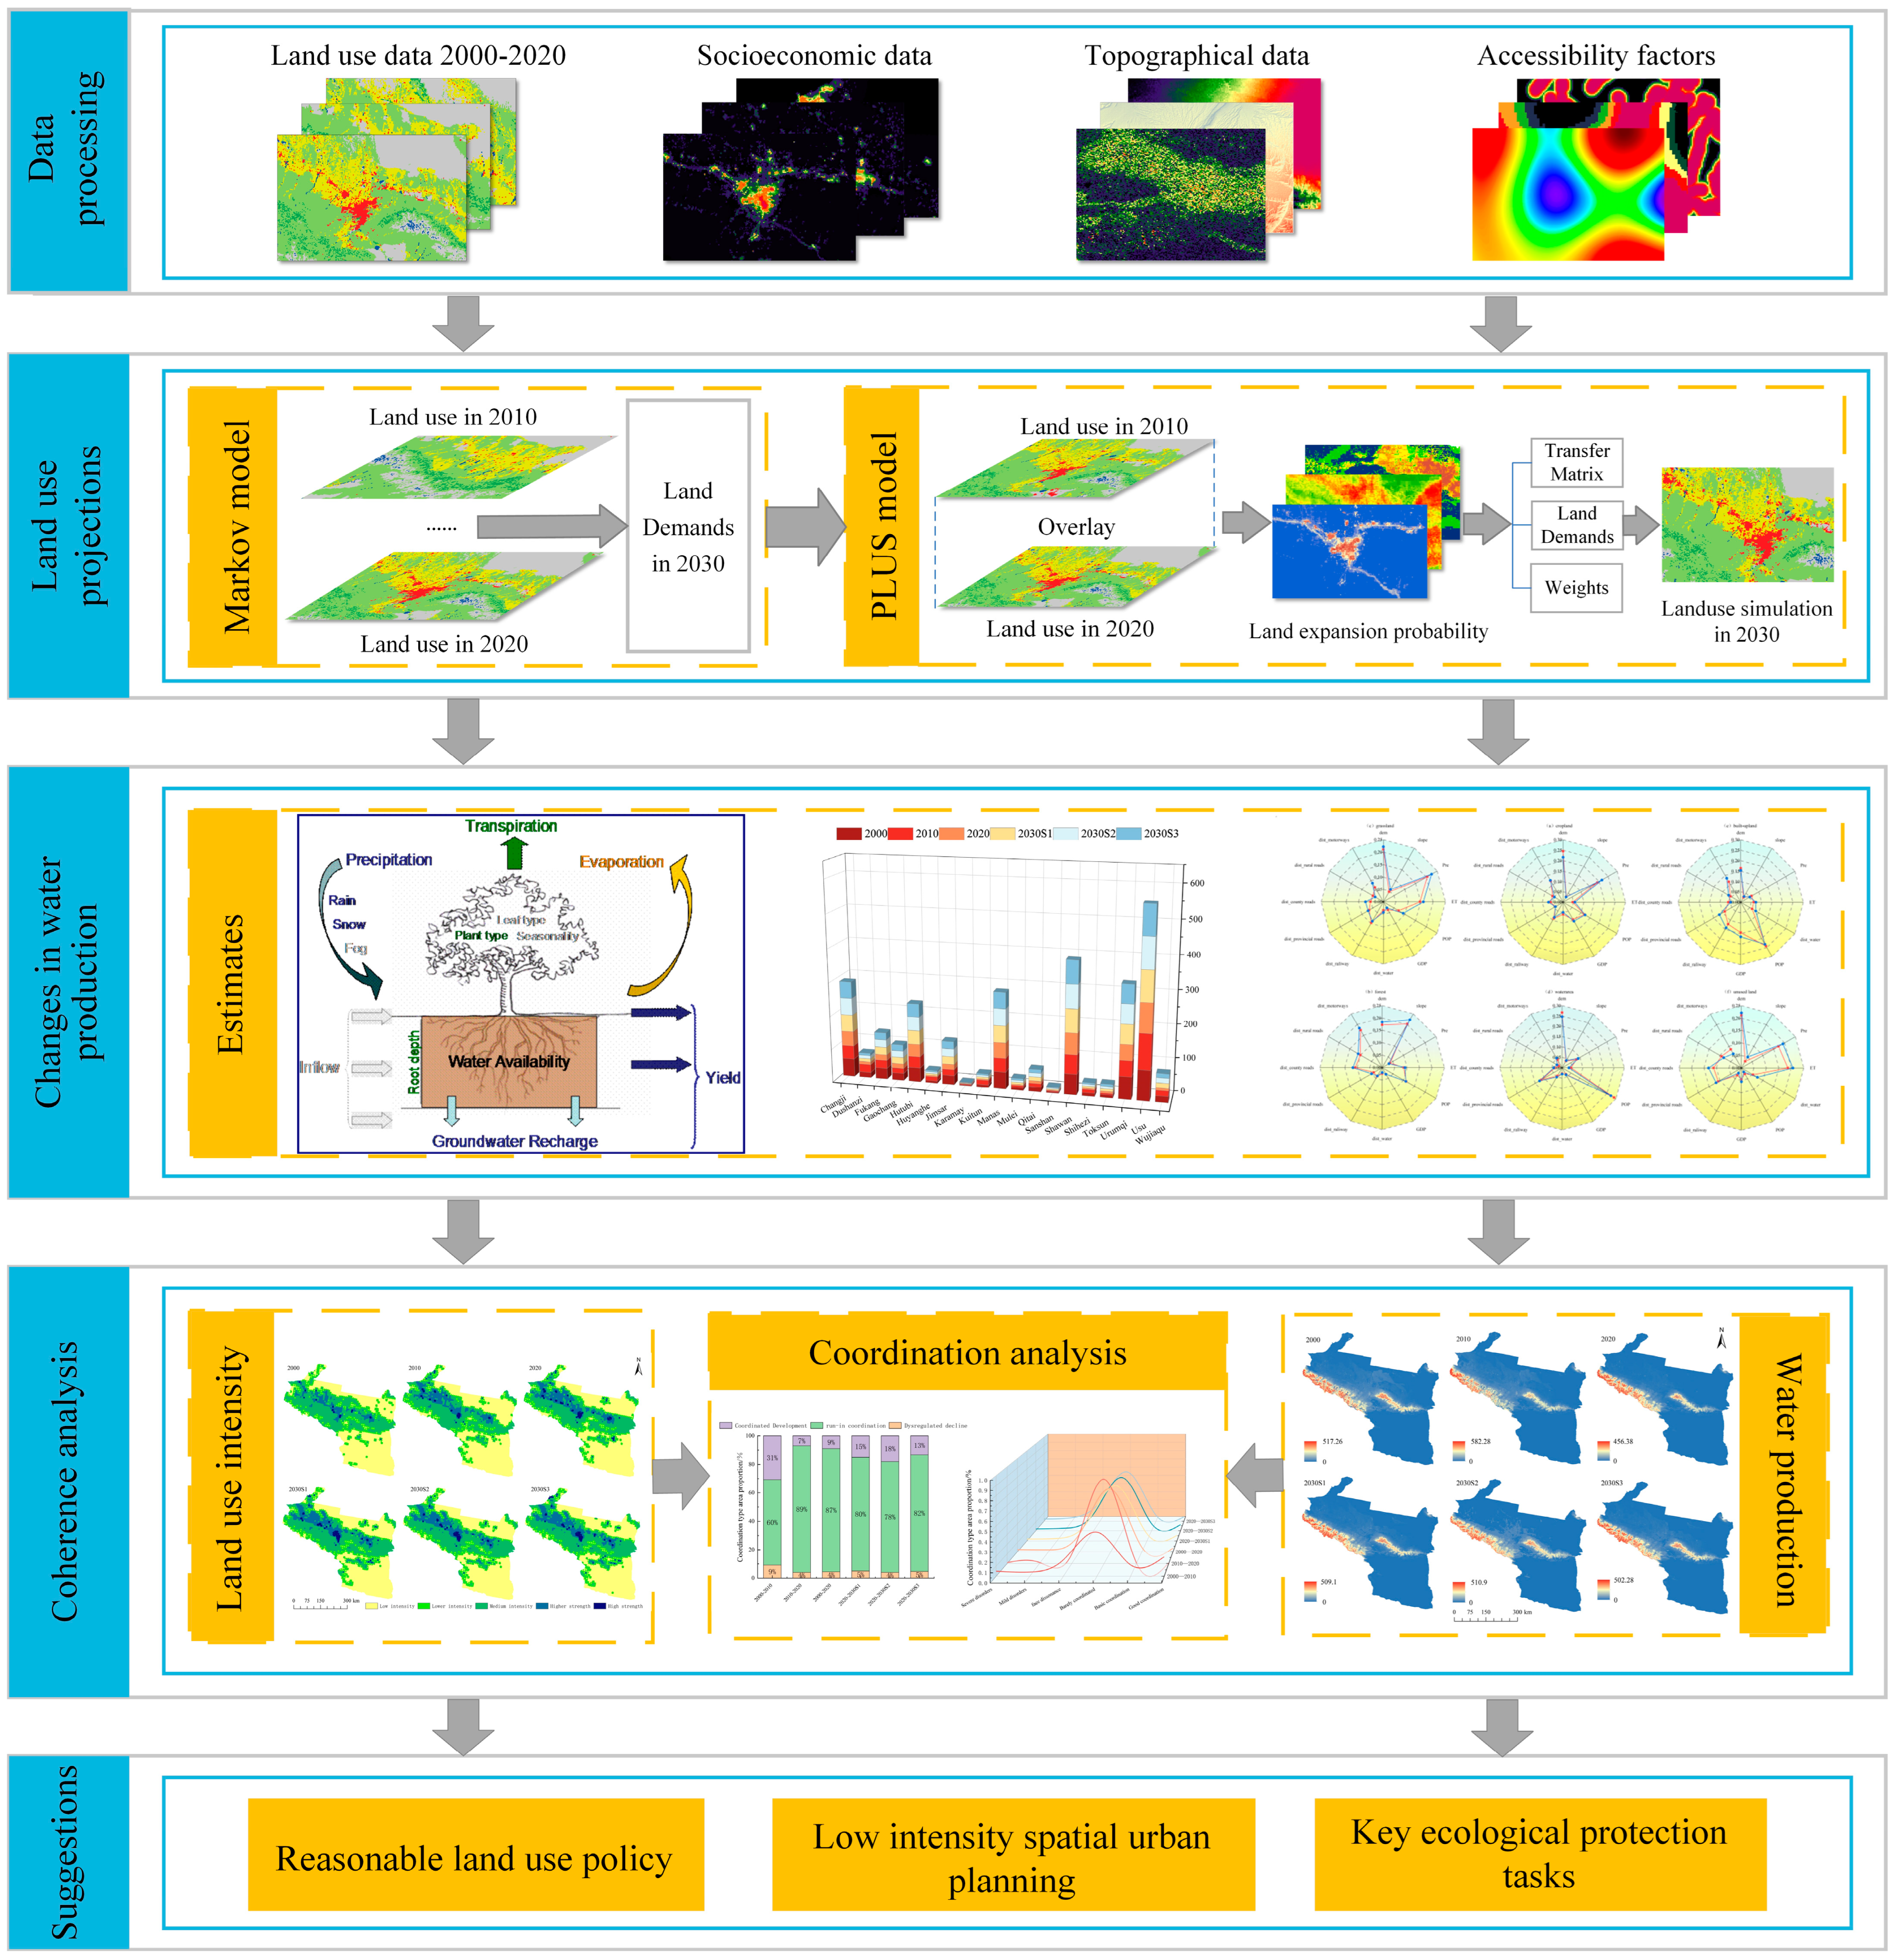
3.2. Research Methodology

The framework of this study is presented in Figure 2. Firstly, historical LUCC data were used to predict future land use scenarios through the PLUS model, followed by the estimation of water yield in the study area through the InVEST model, and finally the analysis of the factors influencing the change in water yield values.

3.2.1. Spatial and Temporal Land-Use Changes and Scenario Simulations

In this study, the PLUS model was used to simulate the land use changes for the year 2030 under different scenarios of the urban agglomeration occurring on the northern slopes of the Tianshan Mountains. The model contained two main modules based on the land-expansion-analysis strategy (LEAS) and a CA model based on multi-type stochastic patch seeding (CARS). The basic principle of the model is to extract part of the land-use expansion for each type of land-use between the two periods of land-use change, calculate the degree of influence of each driver on the expansion of different land-use types using the random forest algorithm, and obtain the development probability of each type of land-use. Based on this, the spatial distribution of land-use in the initial year was used as the simulation benchmark, and the development probability was used as the constraint to simulate the land-use-change pattern dynamically in time and space. The model combines the CA model with the patch-generation simulation strategy to improve the ability to simulate real landscape patterns, and therefore the model is widely used in the field of land-use simulation and prediction [28].
The process is as follows:
(1) Selecting the driver.
Taking into account the spatial and temporal accessibility and quantifiability of various types of data, a total of 12 natural conditions related to accessibility and socio-economic factors, such as elevation, slope, evaporation (ET), precipitation (Pre), population density, GDP, distance from highways, distance from provincial roads, distance from county roads, distance from township roads, distance from railways, and distance from river systems, were selected according to the scale characteristics and geographical features of the study area. Factors taken as predictor variables and policy and urban planning taken as scenario principles and constraints [29] were used for the simulations and predictions. At the same time, the LEAS module of the PLUS model was combined with the site-expansion factor-contribution analysis presented in Figure 3, which can effectively reflect the contribution of different influencing factors in each land category and, to a certain extent, the reasonableness of the selected influencing factors. In this study, the elevation and climate factors presented a greater influence on forested grassland and cultivated land than other factors, and the roads had the greatest influence on urban growth. Finally, future land-use simulations of the study area were performed based on the factors presented in Figure 4.
(2) Land-use area weighting-parameter setting.
Neighborhood weights can reflect the difficulty coefficient of the mutual conversion of each land type, which is mainly influenced by the reversibility of each land type change, with values between 0 and 1. The larger the value, the higher the stability and the lower the probability of conversion [30]. This study referred to and compared the results of previous studies on other similar areas, combined the proportion of the extended area and land-use change characteristics of each land-use type in the study area from 2010 to 2020, inferred the difficulty of mutual conversion through the proportion of the extended area, and debugged the model to obtain the neighborhood weight values of each land-use type in the study area (Table 1).
(3) Future land-use simulation scenario setting.
This study referenced the Tianshan North Slope Urban Agglomeration Development Plan (2017–2030) and the previous relevant studies of the study area, and was based on the policies related to economic development and ecological protection in the study area, the requirements for sustainable development, and the various possibilities for its future development, based on the land-use change characteristics of the Tianshan north slope urban agglomeration in the past and its future regional spatial development plan. Three typical scenarios, natural development (S1), ecological protection (S2), and rapid economic development (S3), were set up from the perspectives of the urban expansion rate and ecological protection, respectively, to predict the number and spatial distribution of land-use types in the Tianshan north slope urban group in 2030. Under the natural development scenario, the land use situation in 2030 was predicted by the Markov model based on the transfer probability matrix from 2010 to 2020; under the ecological protection scenario, reference was made to the “natural forest protection project” and ”basic farmland protection” policies, and the land-use situation in 2030 was also predicted by the Markov model. The ecological protection scenario was obtained by referring to the “natural forest protection project” and ”basic farmland protection” policies, adjusting them according to the historical natural development pattern; the rapid economic scenario was obtained by referring to the urban planning and development projections of the Tianshan north slope urban agglomerations.
(4) Simulation accuracy validation.
Using the PLUS model, the 2020 land-use map of the study area was simulated based on the 2010 land-use model and compared with the actual land-use status in 2020. As shown in Figure 5, the 2020 land-use map based on the 2010 simulation differs to some extent from the actual land-use map in 2020 as changes in the policy of returning farmland to forest and grass had affected the regional landscape of the study area. To verify accuracy of these findings, Kappa indices were calculated for both periods using the validation module of the PLUS model. The average Kappa coefficient for the six land-use types was 0.864, with an overall accuracy of 0.918, indicating that the accuracy of the model simulation can meet the accuracy requirements.

3.2.2. Analysis of Land-Use Intensity Change

Land-use intensity is closely related to ecosystems and is an important factor contributing to changes in ecosystem services. The equations are as follows [31] (Equation (1)). In this study, the land-use intensity of different land types was classified with reference to previous studies on land-use intensity indices [32,33,34] (Table 2):
L = 100 × i = 1 n P i × Q i
where L is the composite index of land-use intensity; Pi is the land-use intensity of class i; and Qi is the area share of class i.

3.2.3. Assessment of Water Production

The principle of the water supply module is based on a water balance approach that takes into account factors such as temperature, vegetation, soil, and topography. In Equation (2), it is the amount of water produced per unit area by a raster cell over a certain period of time, i.e., it is the difference between the amount of precipitation per unit area by the raster cell and the actual evapotranspiration that is subtracted to obtain the water supply for each raster cell (which includes the surface runoff, the flow in the soil, and the amount of water held by interception and deadfall generated by the canopy), which is modeled using the following equations [18] (Equations (2)–(6)):
Y x = 1 A E T x p x × p x
where AETx is the actual evapotranspiration produced by each grid cell x (in mm); Yx is the annual water production produced on each grid cell x (in mm); Px is the average annual precipitation produced on each grid cell x (in mm).
A E T x P x = 1 + P E T x P x 1 + P E T x P x w 1 / w
P E T x = K c x E T o x
W x = A W C x Z P x + 1.25
A W C x = min ( max S o i l x , R o o t D e p t h x ) P A W C x
where PET(x) represents the actual potential evapotranspiration produced by each raster cell x (in mm); Kc(x) represents the reference evapotranspiration coefficient for each crop type; ET0 (x) represents the evapotranspiration produced by each vegetation type (in mm); W(x) represents the empirical non-physical parameter; AWC(x) represents the available water content for each vegetation type; Z represents the Zhang coefficient; Root Depth(x) represents the effective root depth for each vegetation type; Max Soil Depth(x) represents the maximum soil profile depth for each vegetation type.
The model sets parameters for different root depths based on different land-use data and the “Guide to calculating crop evapotranspiration—crop water requirements”; reference values for evapotranspiration coefficients (Kc) were set according to the Food and Agriculture Organization of the United Nations (FAO) to obtain the biophysical parameters needed for this study. The water yield assessment and validation process is as follows: by comparing with the water resources bulletin, repeated experiments are conducted to obtain the simulated value closest to the real value, and then the final input parameters of the model are obtained based on the results. The government’s water resources bulletin shows that in 2010 the surface water resources in Xinjiang were 1063 × 106 m3. The modal water yield was calculated from the water resources bulletin, and when Z = 1, the modeled value for 2010 was 891 × 106 m3, which is the closest to the actual value. Therefore, this study uses this value as the basis for the next step of the analysis.

3.2.4. Coordination Degree Model

To reflect the level of coordination between land-use intensity and water production, this study applied a coordination model to analyze the degree of coordination between the two variables, with the coordination degree taking on a value range of 0 to 1; the closer the value is to 1, the better the degree of coupling coordination. Firstly, land-use intensity and water production data were normalized and gridded, the study area was divided into 1 km × 1 km grids, and the mean values of land-use intensity and water production in each grid cell were extracted to calculate the coordination of the average annual growth rate between the two factors (Table 3) [35]. The calculation was done as follows [36] (Equation (7)):
O = x + y ÷ 2 x 2 + y 2
where O is the coefficient of the coordination of changes in land-use intensity and water production; x and y are the average annual growth rates of land-use intensity and water production, respectively. The breakdown of the data used in this study is shown in Table 4.

4. Results and Analysis

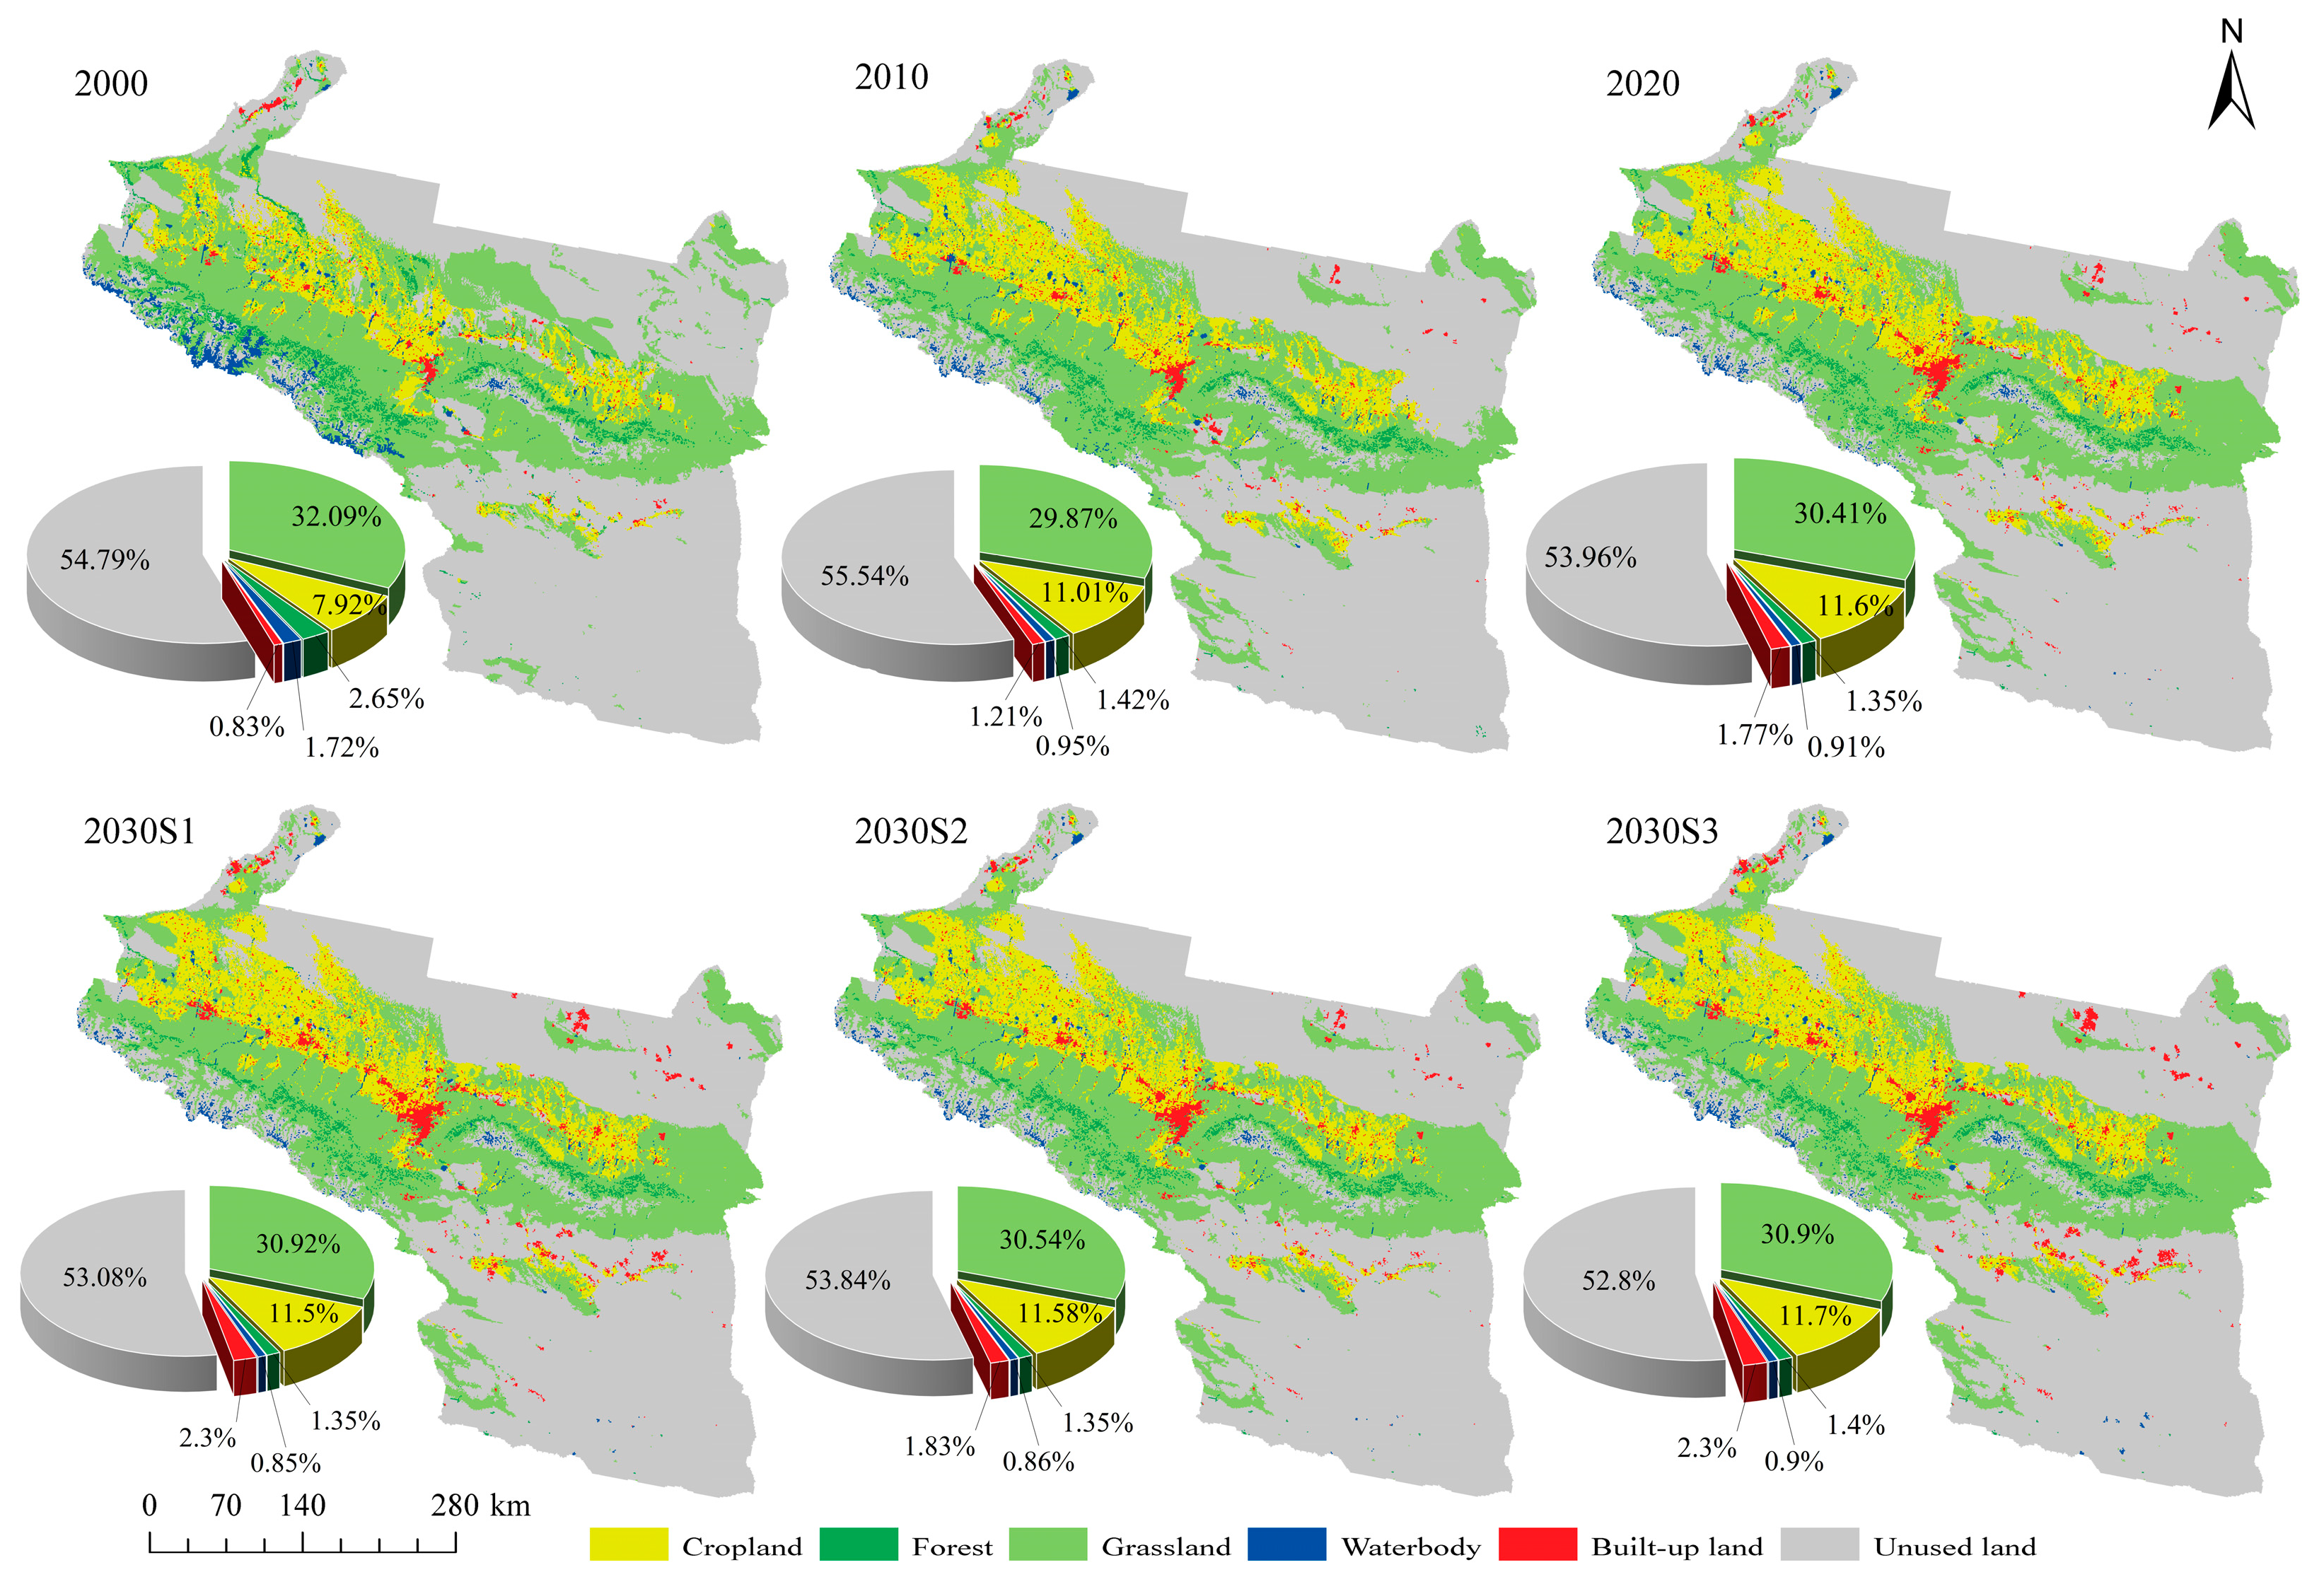
4.1. Analysis of Spatial and Temporal Changes in Land-Use and Projections for the Study Area

The accuracy of the future land-use projection simulations has been verified to meet the accuracy requirements. The verification process is described in the methods. The land-use type of the urban agglomeration from 2000 to 2020 was dominated by unused land, which accounted for more than 50% of the total area, followed by arable land and grassland. The area of water bodies, forest land, and construction land only accounted for a small part of the study area (Figure 6). The total area of woodland and water bodies had decreased, with the area of woodland decreasing by 2526 km2 and the share of water bodies decreasing by approximately 47.52% over a 20-year period. The grassland showed a decreasing trend followed by an increase, probably due to the fact that during the period 2000 to 2010, a large area of grassland in the central plains of the study area was converted for the purpose of economic development during the implementation of the “Western Development” strategy and the “One Belt, One Road” initiative. This had a significant impact on the local economy and simultaneously had a particular impact on the environment, which was later protected and restored through the relevant policies of “returning forests to grass and grazing” and environmental protection regulations. The largest increase in the area of land used for construction was from 0.83% to 1.77% of the original area (Table 5).
In the S1 scenario, the area of grassland and built-up land will increase by 604 km2 and 1007 km2, respectively, in 2030, compared to 2020, while the area of other land-use types will decrease. The area of arable land, water, and unused forest will decrease by 359 km2, 123 km2, and 2398 km2, respectively, while the area of forest land will hardly change. The S2 scenario is based on the historical land-use change pattern of urban agglomeration and ecological protection as the dominant factor; therefore, land-use in this scenario will not change much compared to 2020. In the S3 scenario, the areas of forest land, grassland, and water will be 2609 km2, 59,676 km2 and 1767 km2, respectively, and the area of unused land will change the most, from 104,825 km2 in 2020 to 101,939 km2 in 2030, while other land-use areas will change less.

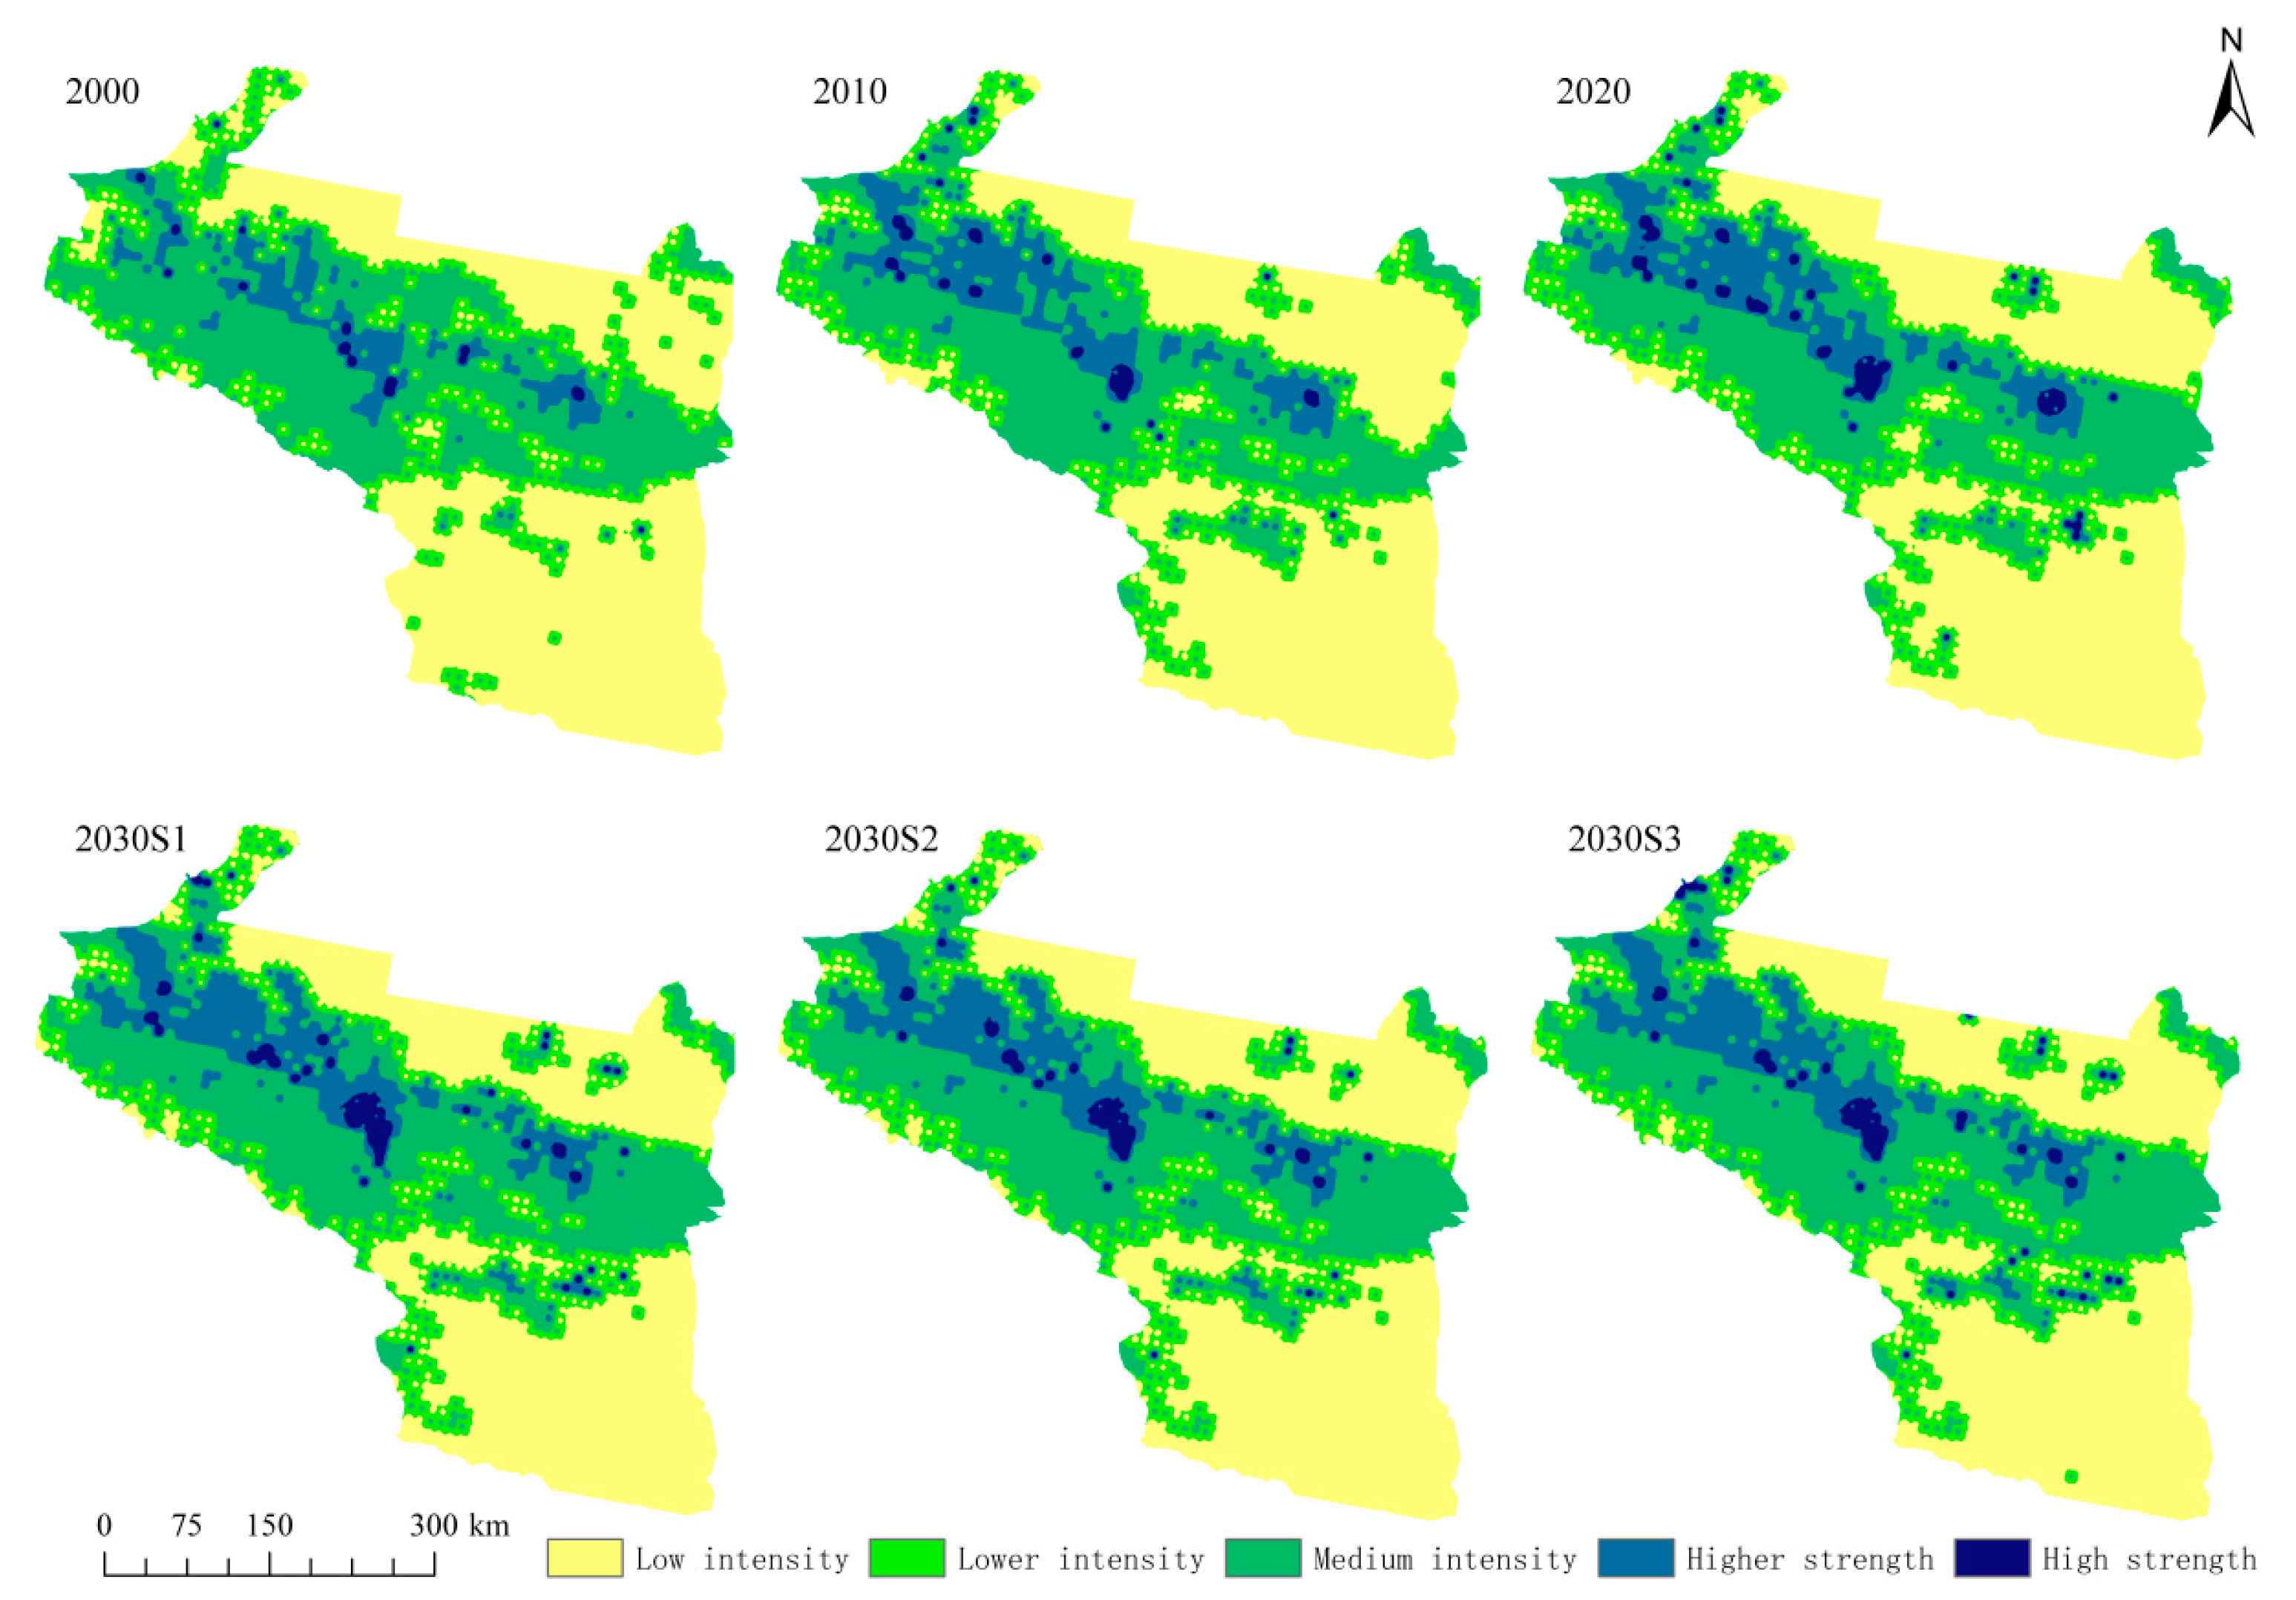
4.2. Analysis of Land-Use-Intensity Changes in the Study Area

The most direct manifestation of the difference in the degree of human input and the use of different land resources is the difference in land-use intensity. In this study, according to the size of the study area and the calculation volume, the comprehensive land-use-intensity index was calculated separately for each grid, using 10 km × 10 km as a cell. The reasons for this spatial distribution are the following: the relatively high population density in these areas, the concentrated distribution of urban residential and arable lands, and the high interference of human activities, as well as the high concentration of human settlements and industrial activities. The intensity of land-use is relatively high in areas with the highest concentration of human and industrial activities. In terms of the general trends (Figure 7), land-use intensity from 2000 to 2030 is accompanied by an expansion of urban and rural construction land and an expansion of the high-intensity zone, with the area of the high-intensity zone being smaller in the S2 scenario than in the other two scenarios.

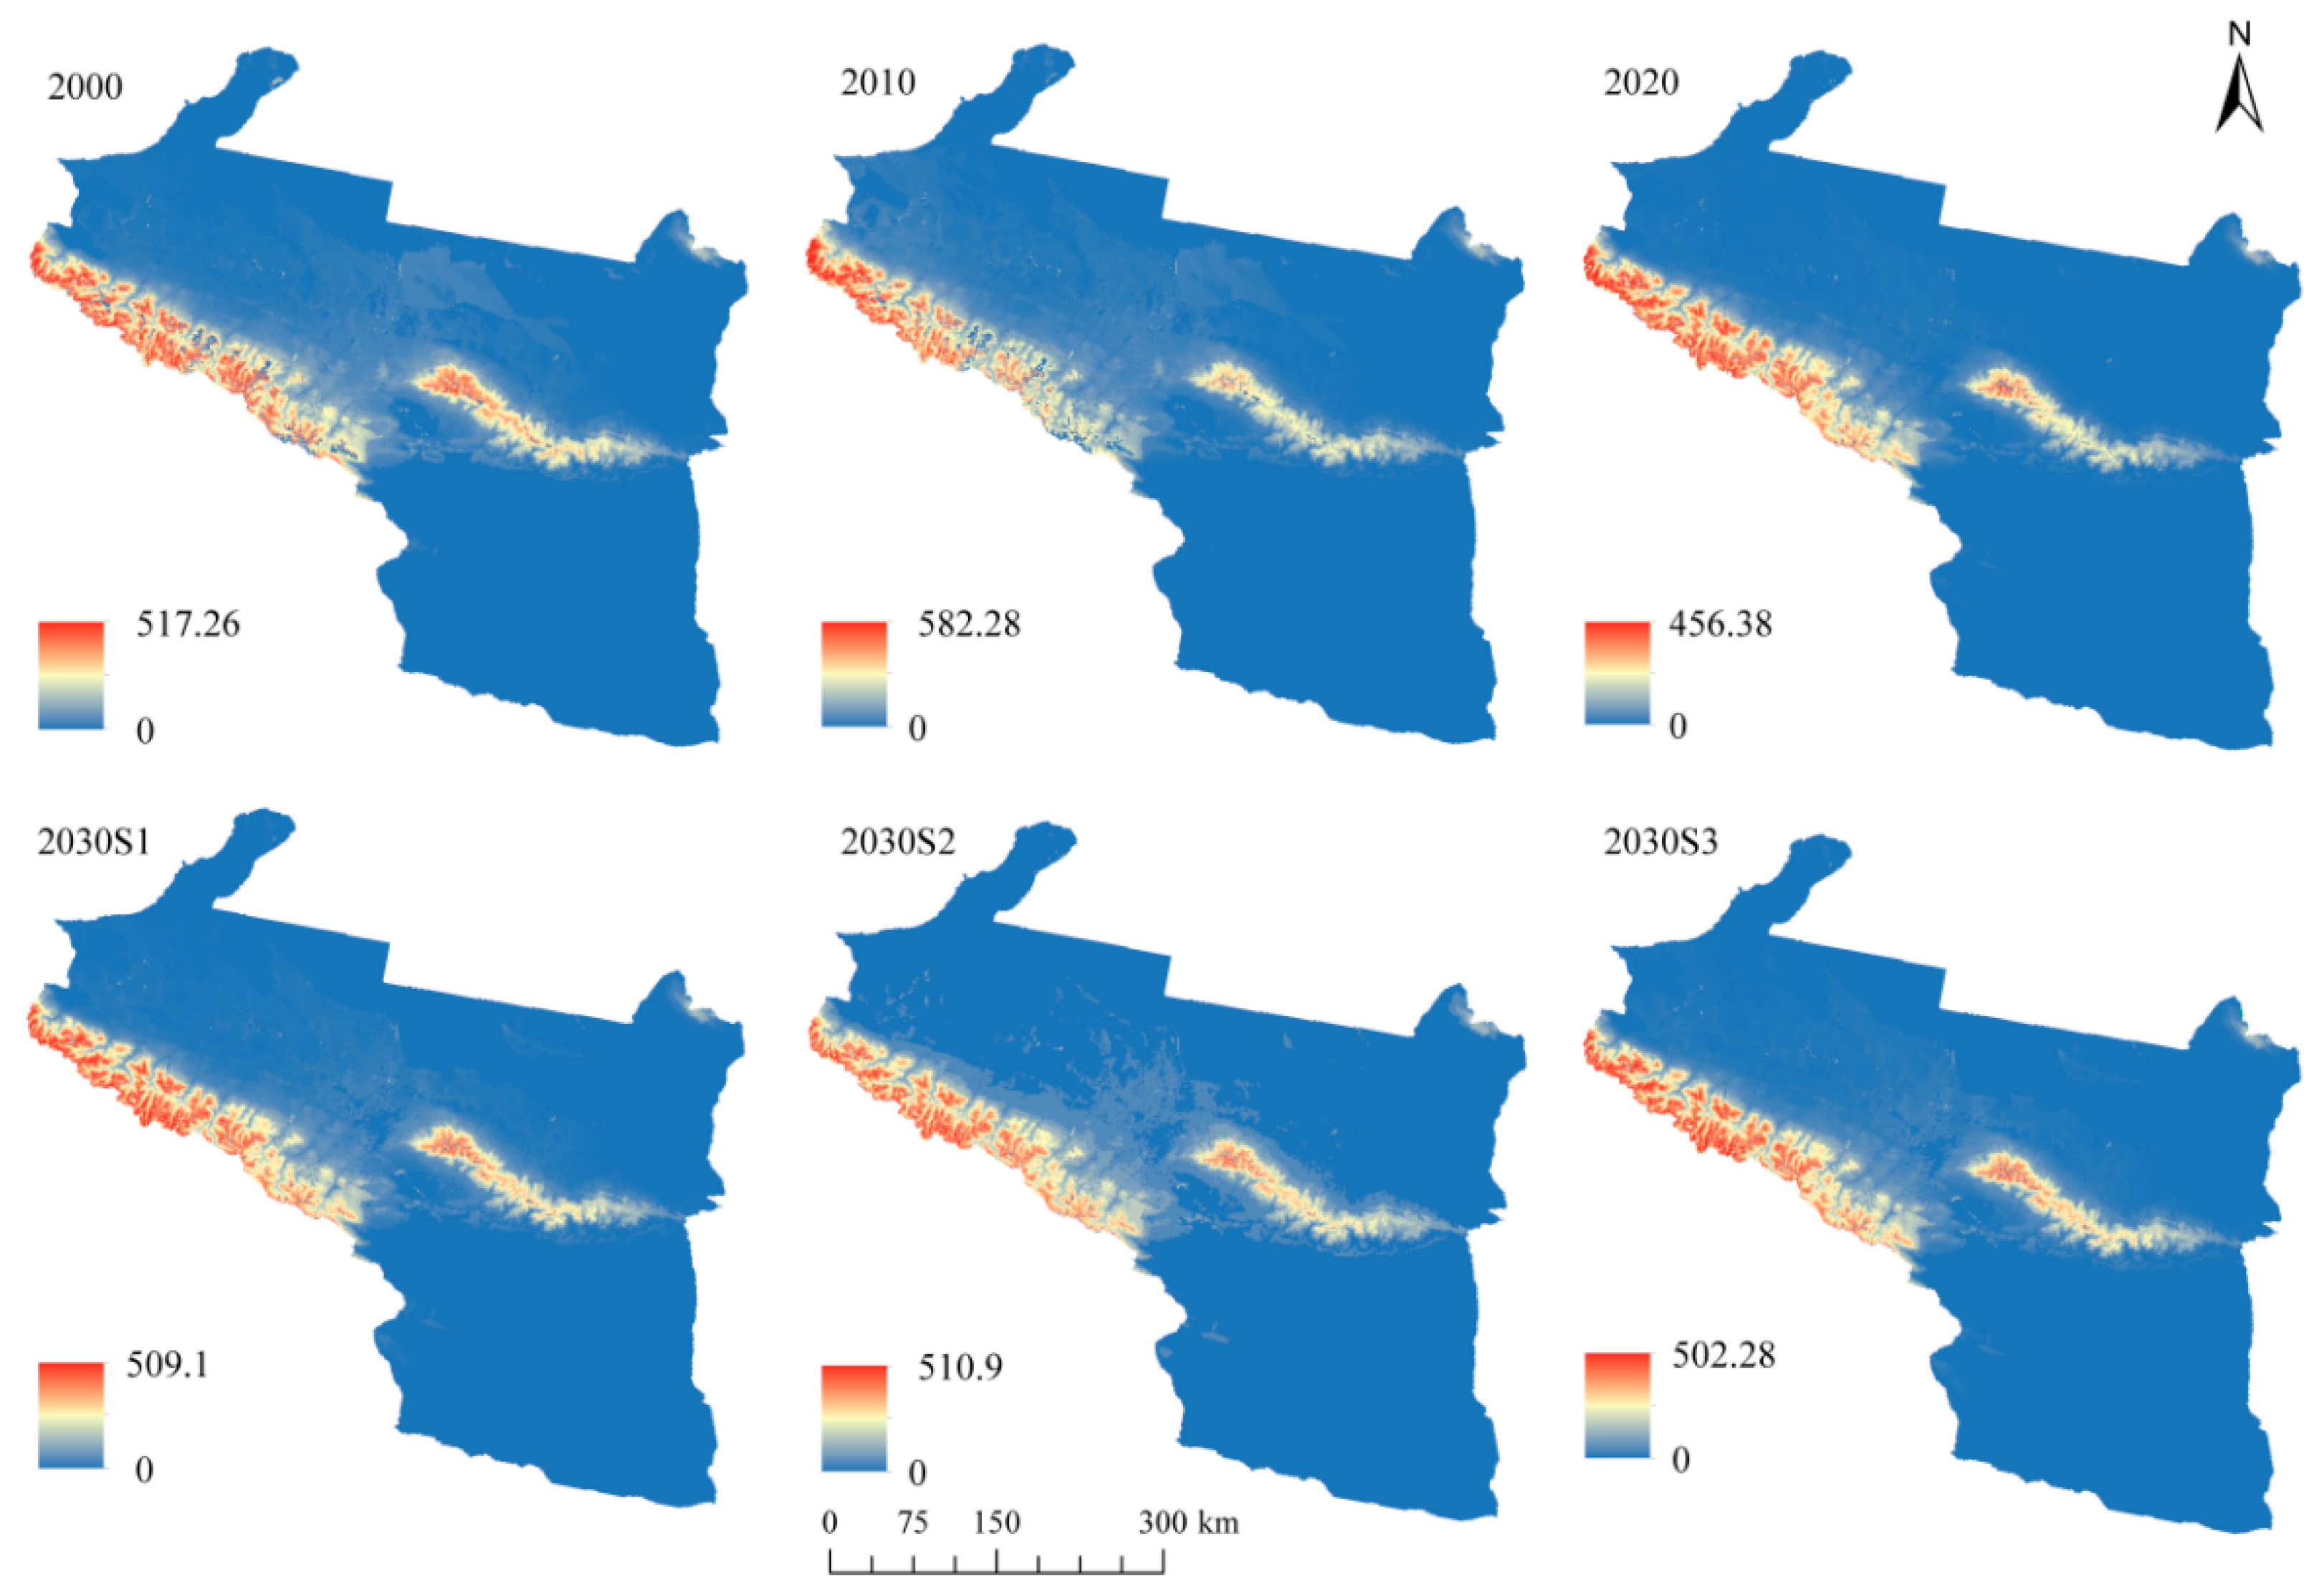
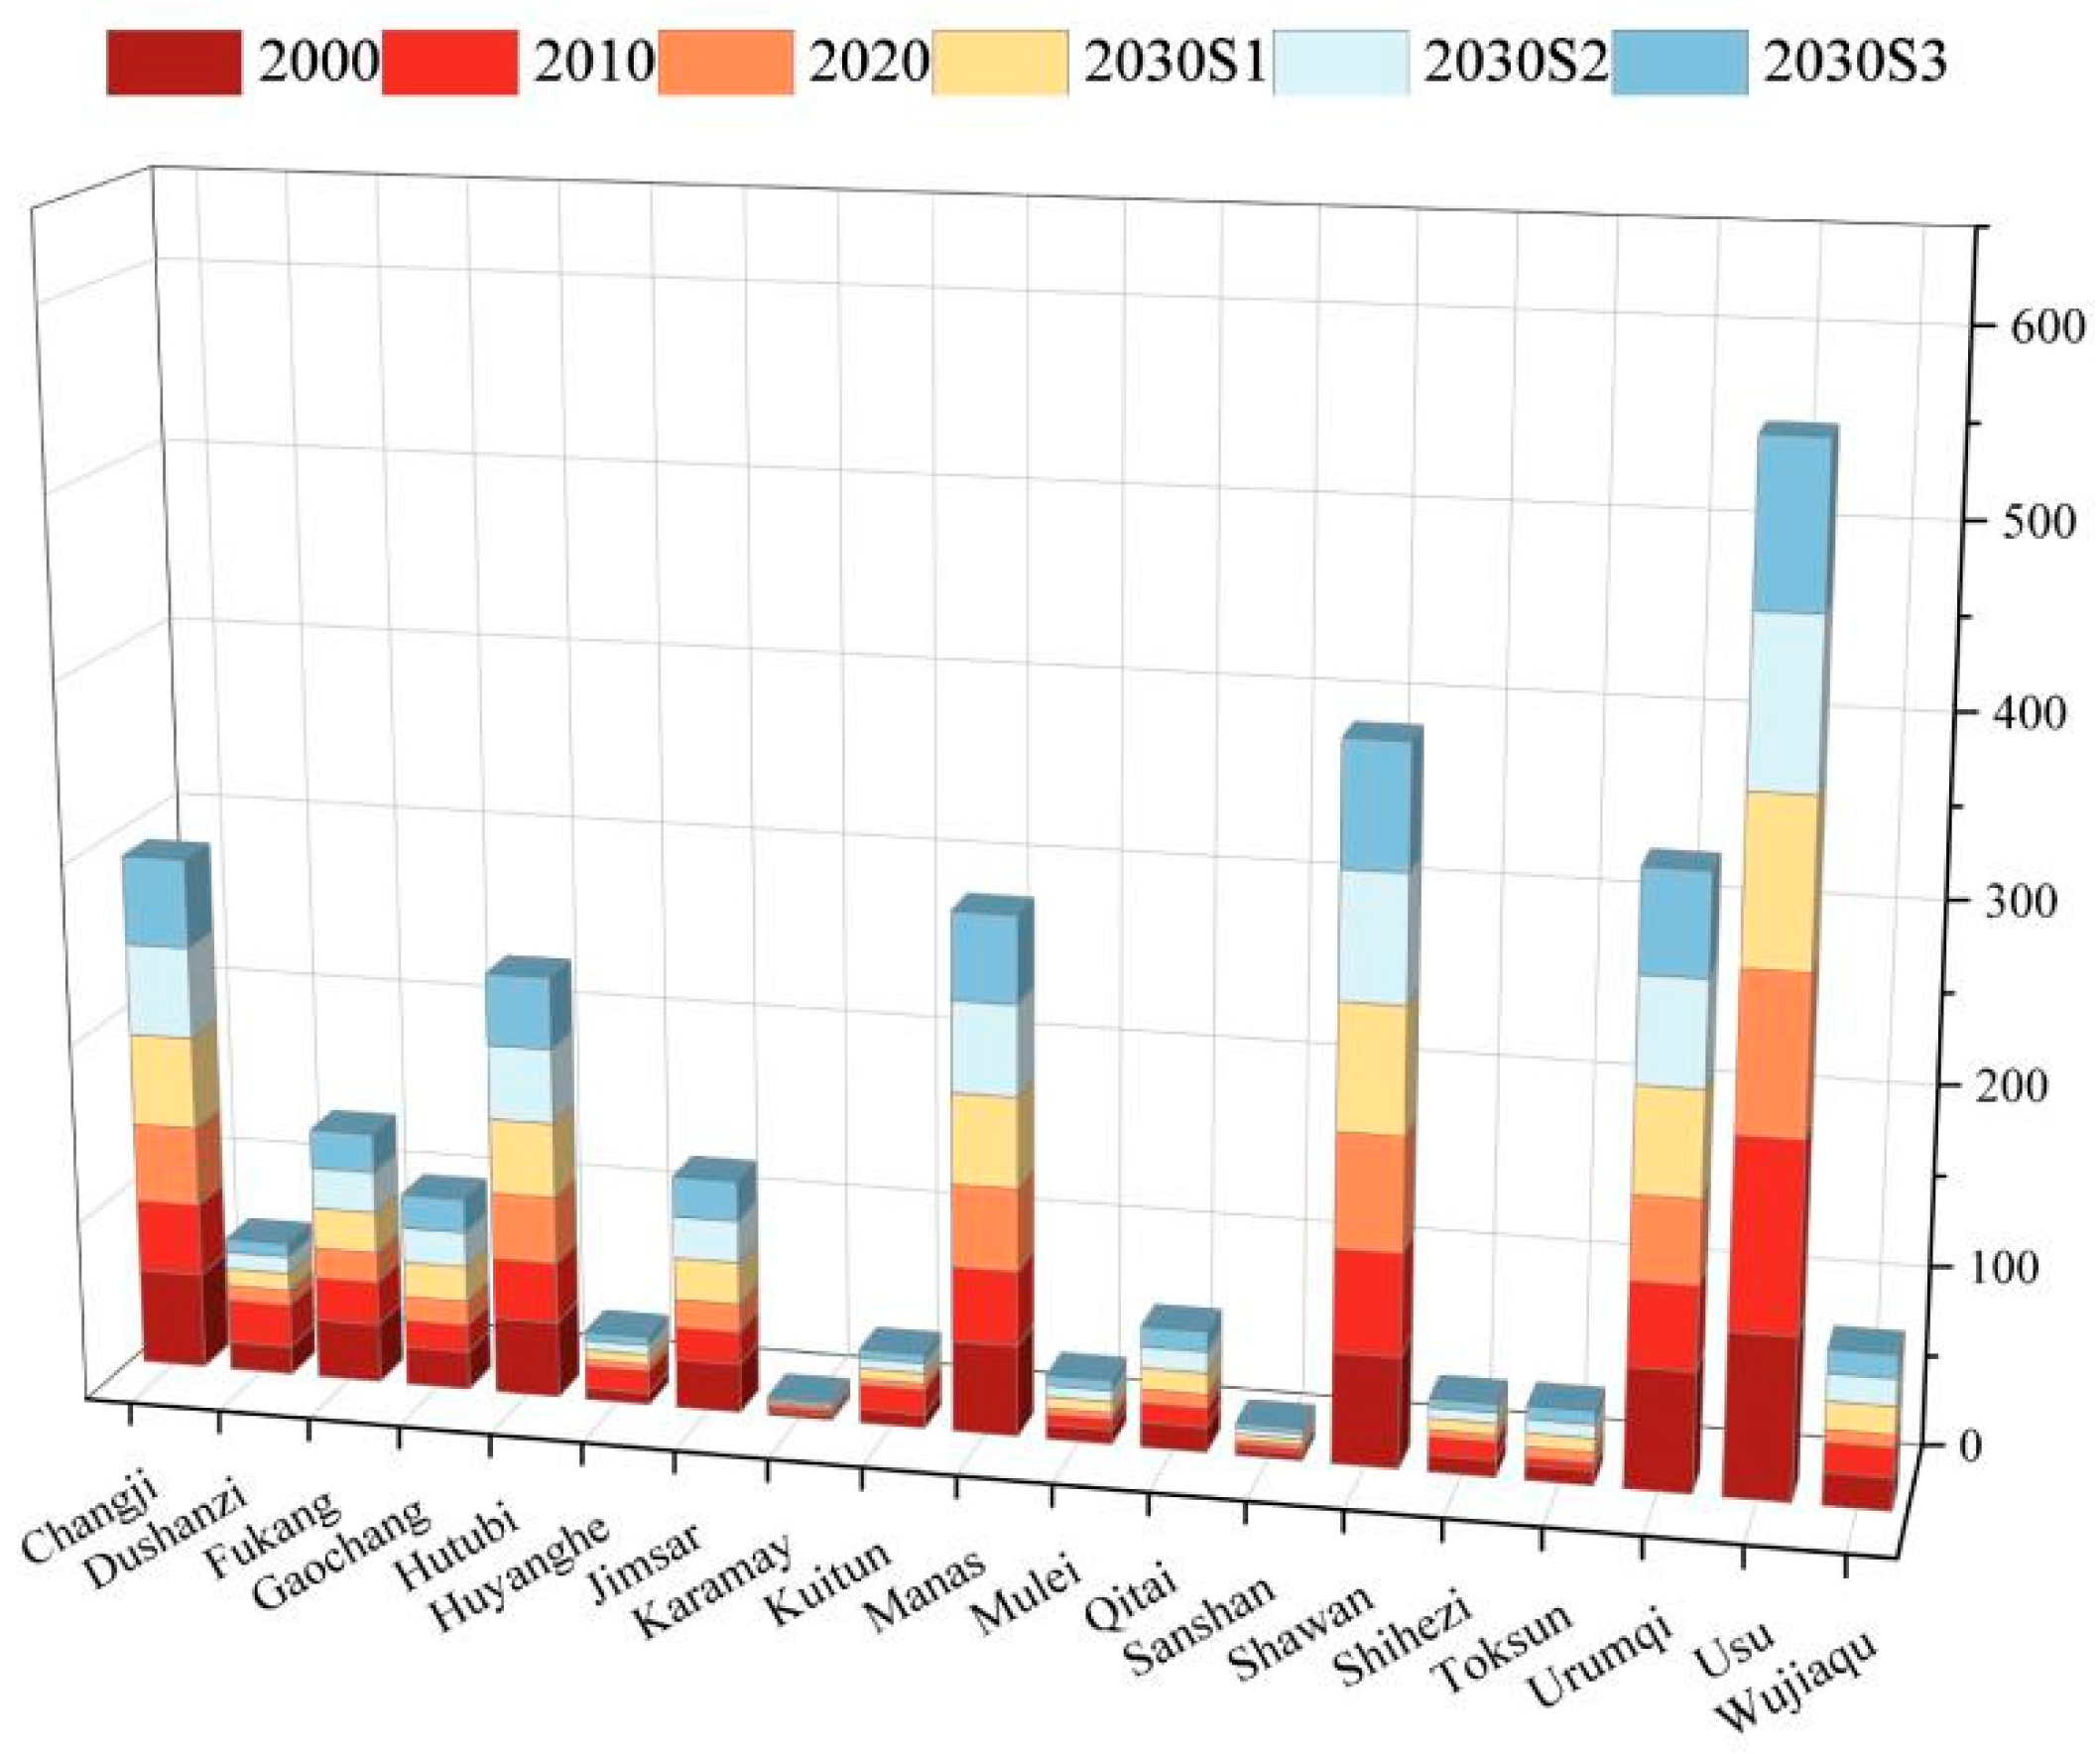
4.3. Analysis of the Change in Water Production of the Study Area

As can be observed in Figure 8, the water production in the Tianshan north slope urban agglomeration in 2000, 2010, and 2020 is 517.26 × 10⁶ m3, 582.28 × 10⁶ m3, and 456.38 × 10⁶ m3, respectively, showing an increasing trend followed by a decreasing trend; water production decreased by a total of 60.88 × 10⁶ m3 in 20 years. The water production values in scenarios S1, S2, and S3 in 2030 are 509.10 × 10⁶ m3, 510.90 × 10⁶ m33, and 502.28 × 10⁶ m3, respectively. Compared to 2020, water production in 2030 will increase by 52.72 × 10⁶ m3, 54.52 × 10⁶ m3, and 45.90 × 10⁶ m3 in the three scenarios, respectively. Spatially, this presents a trend of high water production rates in the east, low water production rates in the west, high water production rates occurring again in the north, and low water production rates in the south, with the water-production function decreasing from the foothills of the Tianshan Mountains to the north and south during the study time period. In terms of land-use types, the contribution of different land-use types to the total regional water production rate is in descending order: grassland, cropland, forest land, construction land, and unused land. The area of grassland accounts for approximately 32% of the total area of the region and produces approximately 40% of the total water in the region, with a decreasing trend in the area but still increasing in water production, making it the most important water producing area in the region. Due to the small distribution of water in the study area, the area was one of high water production rates during the study time period. These trends continue over time from 2020 to 2030, with a decreasing trend in water production in the arable, forest, and unused lands and an increasing trend in water production in the grassland area in the three scenarios for 2020–2030. In the S2 scenario, the total water yield in the study area increased by 54.52 × 10⁶ m3.
The water production of cities within the Tianshan North Slope urban agglomeration also varies between 2000 and 2030, as shown in Figure 9. The high values of water production are mainly found in the western and north-central regions, with Shihezi and Fukang having higher water production in 2000 and Kuitun, Huyanghe, and Dushanzi having more than 32% of the water production by 2010. The lower values of water production were mainly in the northern and eastern areas of Shanshan and Tokson, where the average annual water production was around 16%. This distribution is related to the special geographical location of the study area.

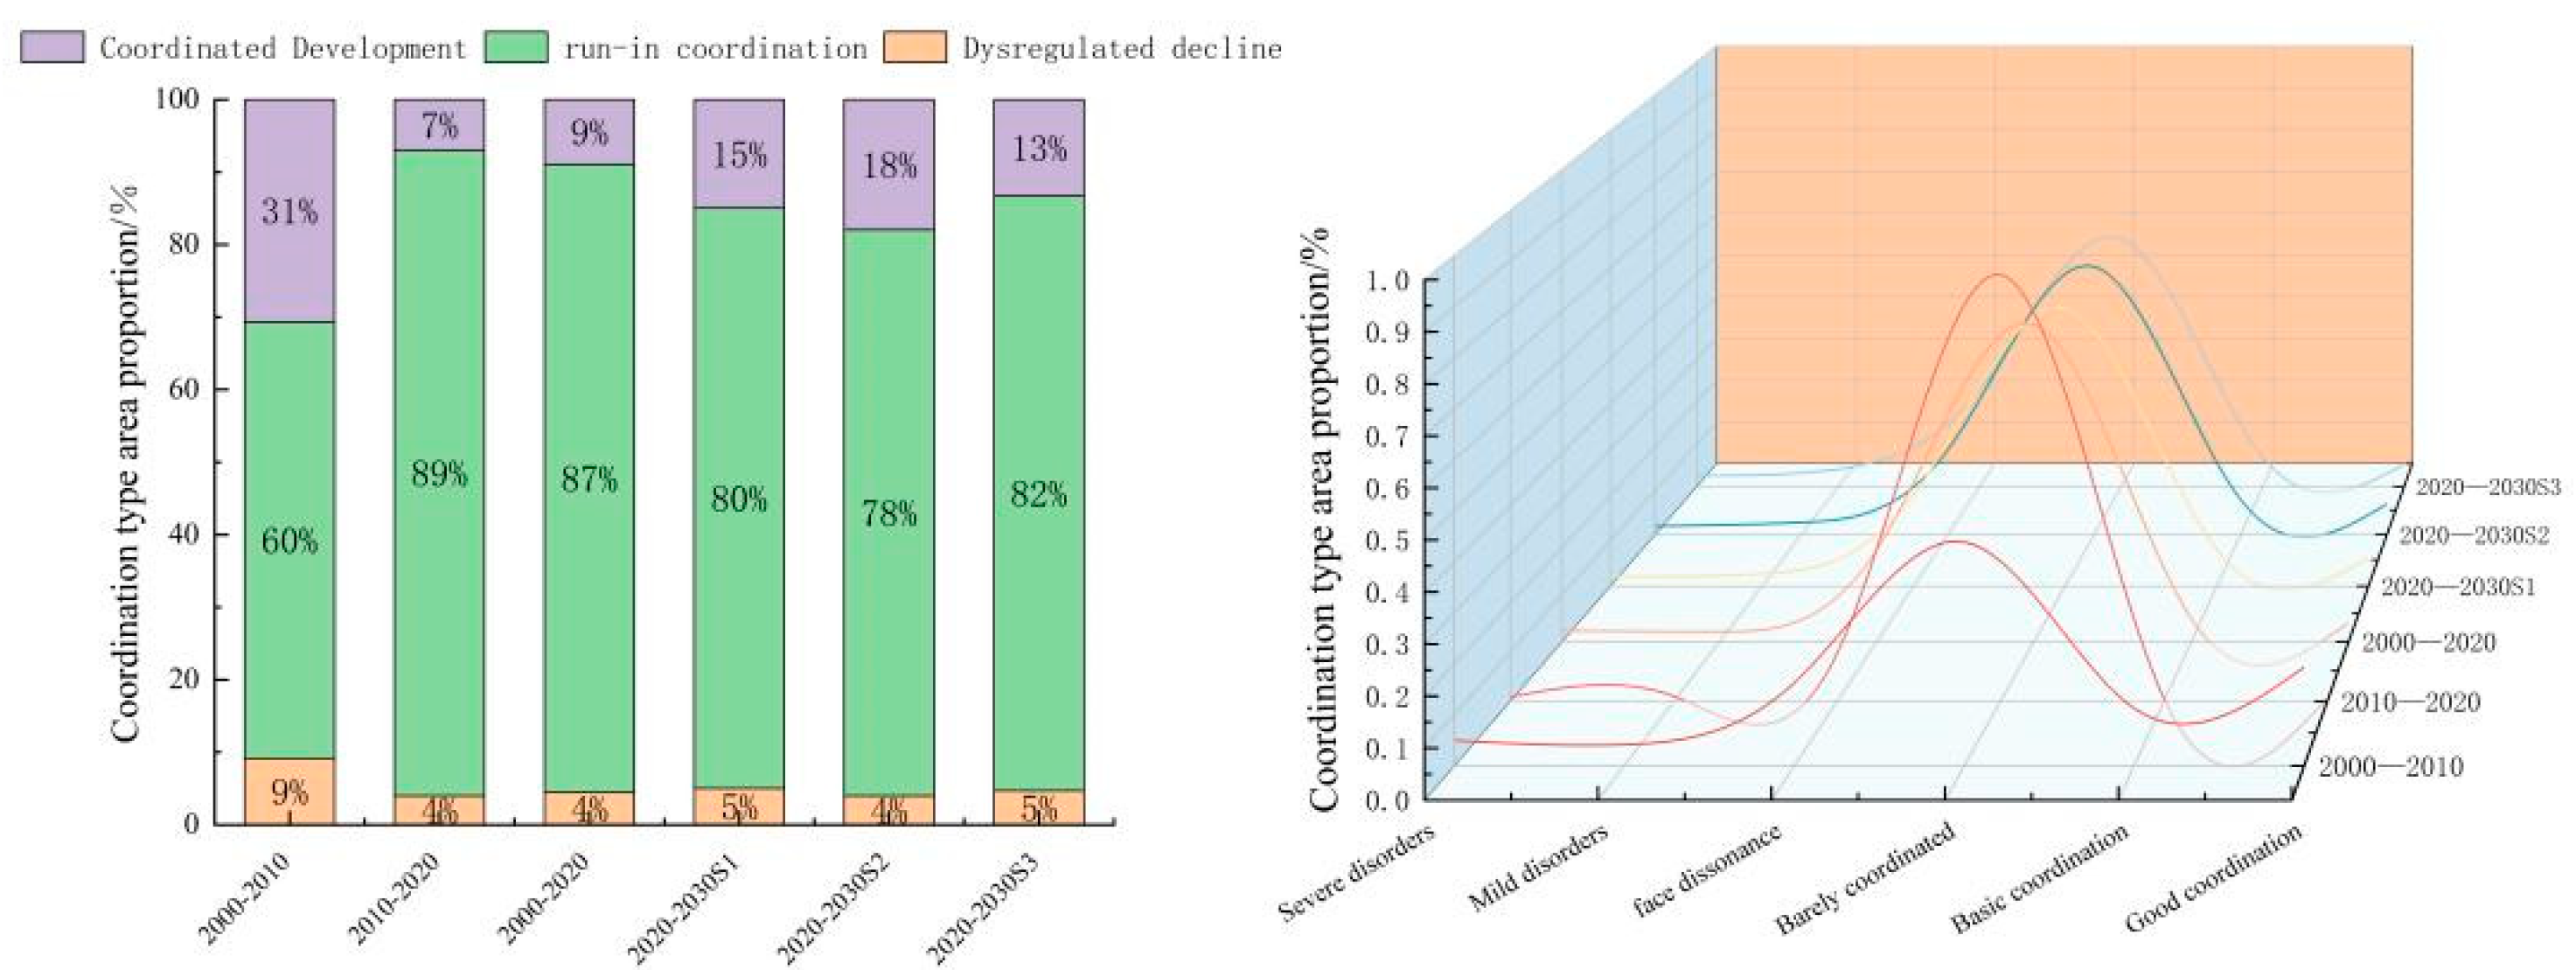
4.4. Analysis of Changes in the Coordination between Land-Use Intensity and Water Production

From an overall perspective (Figure 10), the coordination type accounted for the largest proportion of the three scenarios, with an increasing then decreasing trend, accounting for 60%, 89%, and 87% in the periods 2000–2010, 2010–2020, and 2000–2020, respectively. From 2000 to 2010, the area of high land-use intensity in the study area expanded, land-use intensity was rapidly increasing at a quicker rate than water production, and both land-use intensity and water production rates significantly increased. From 2010 to 2020, land-use intensity stabilized, and the main source land types of regional water production changed relatively slightly, presenting a trend of coordinated over-expansion. The trends of the various types of coordination for the three scenarios in 2030 were roughly the same as those in the previous time periods, and the proportion of coordination occurring in the S2 scenario was better compared to that of the other scenarios. Due to the complex topography of the study area, the distance of forest land, the water areas, and unused land from built-up areas, the difficulty of development and construction, and the low level of human activities, the changes in land-use intensity and water production in the distribution areas of these land-use types were relatively limited; thus, the growth rates of both were basically synergistic and the coordination types were not prone to change, while unused land, as the main land-use type in the study area, accounted for approximately 55% of the study area. The coordination between land-use intensity and water production rates therefore present a more stable characteristic overall over the study time period.

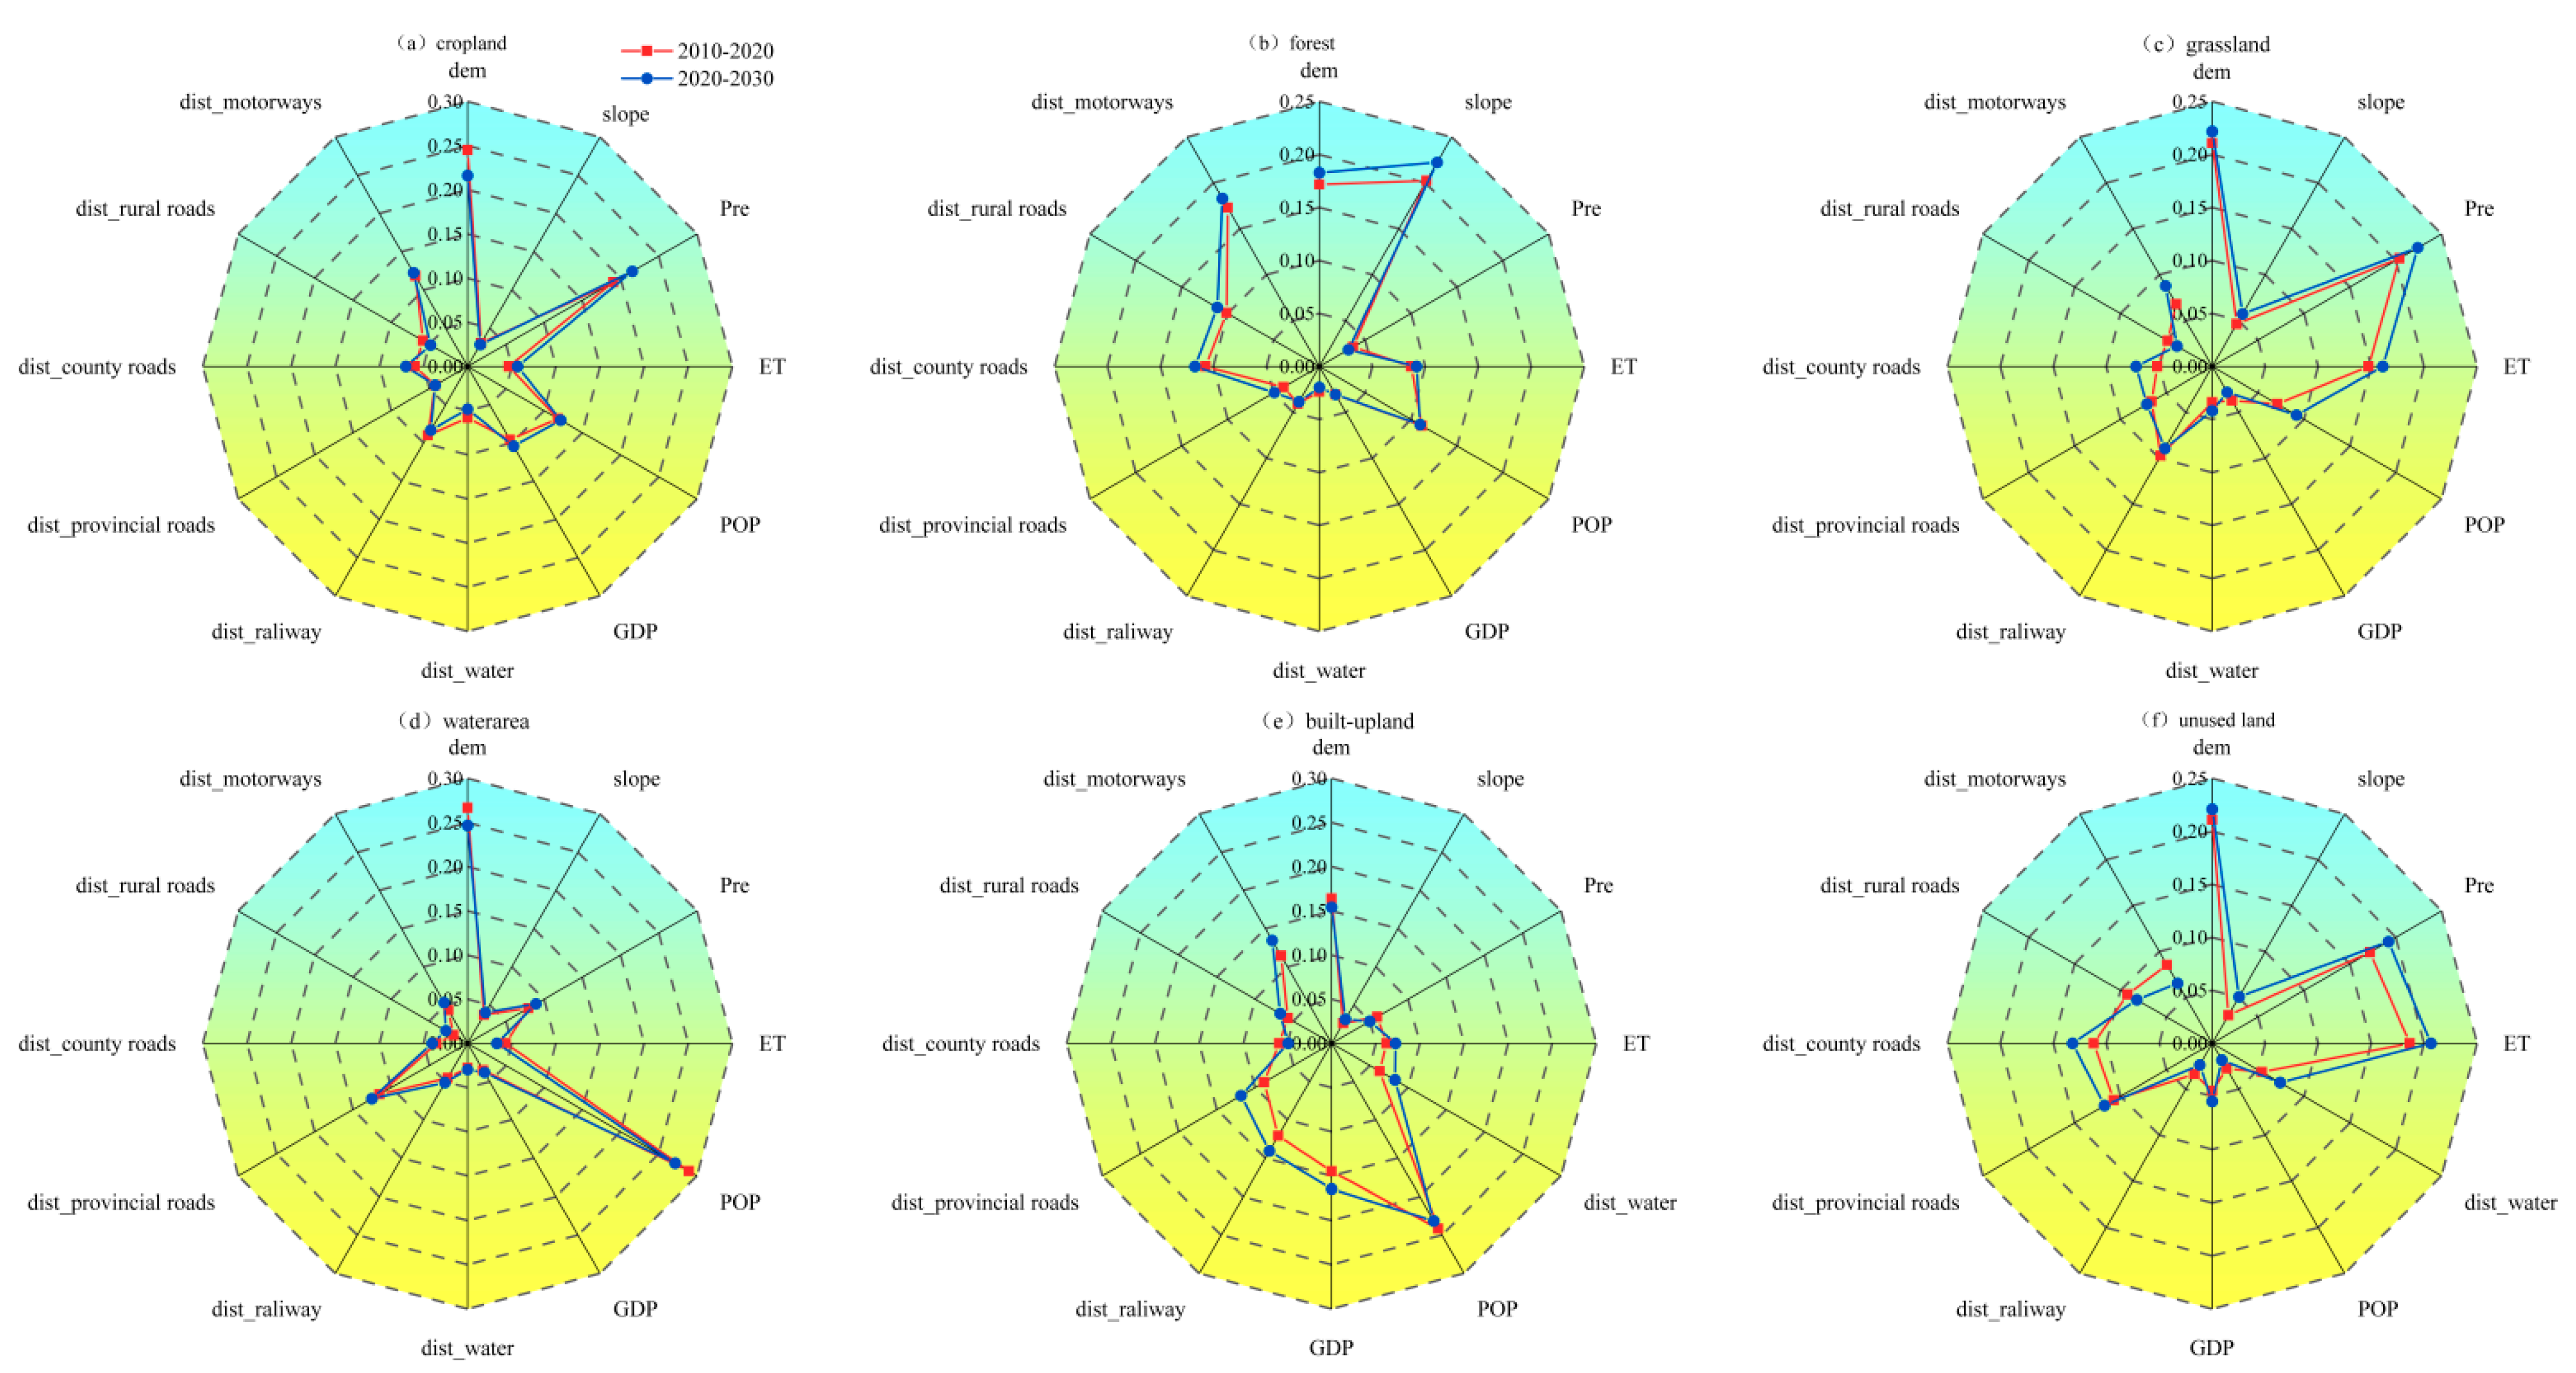
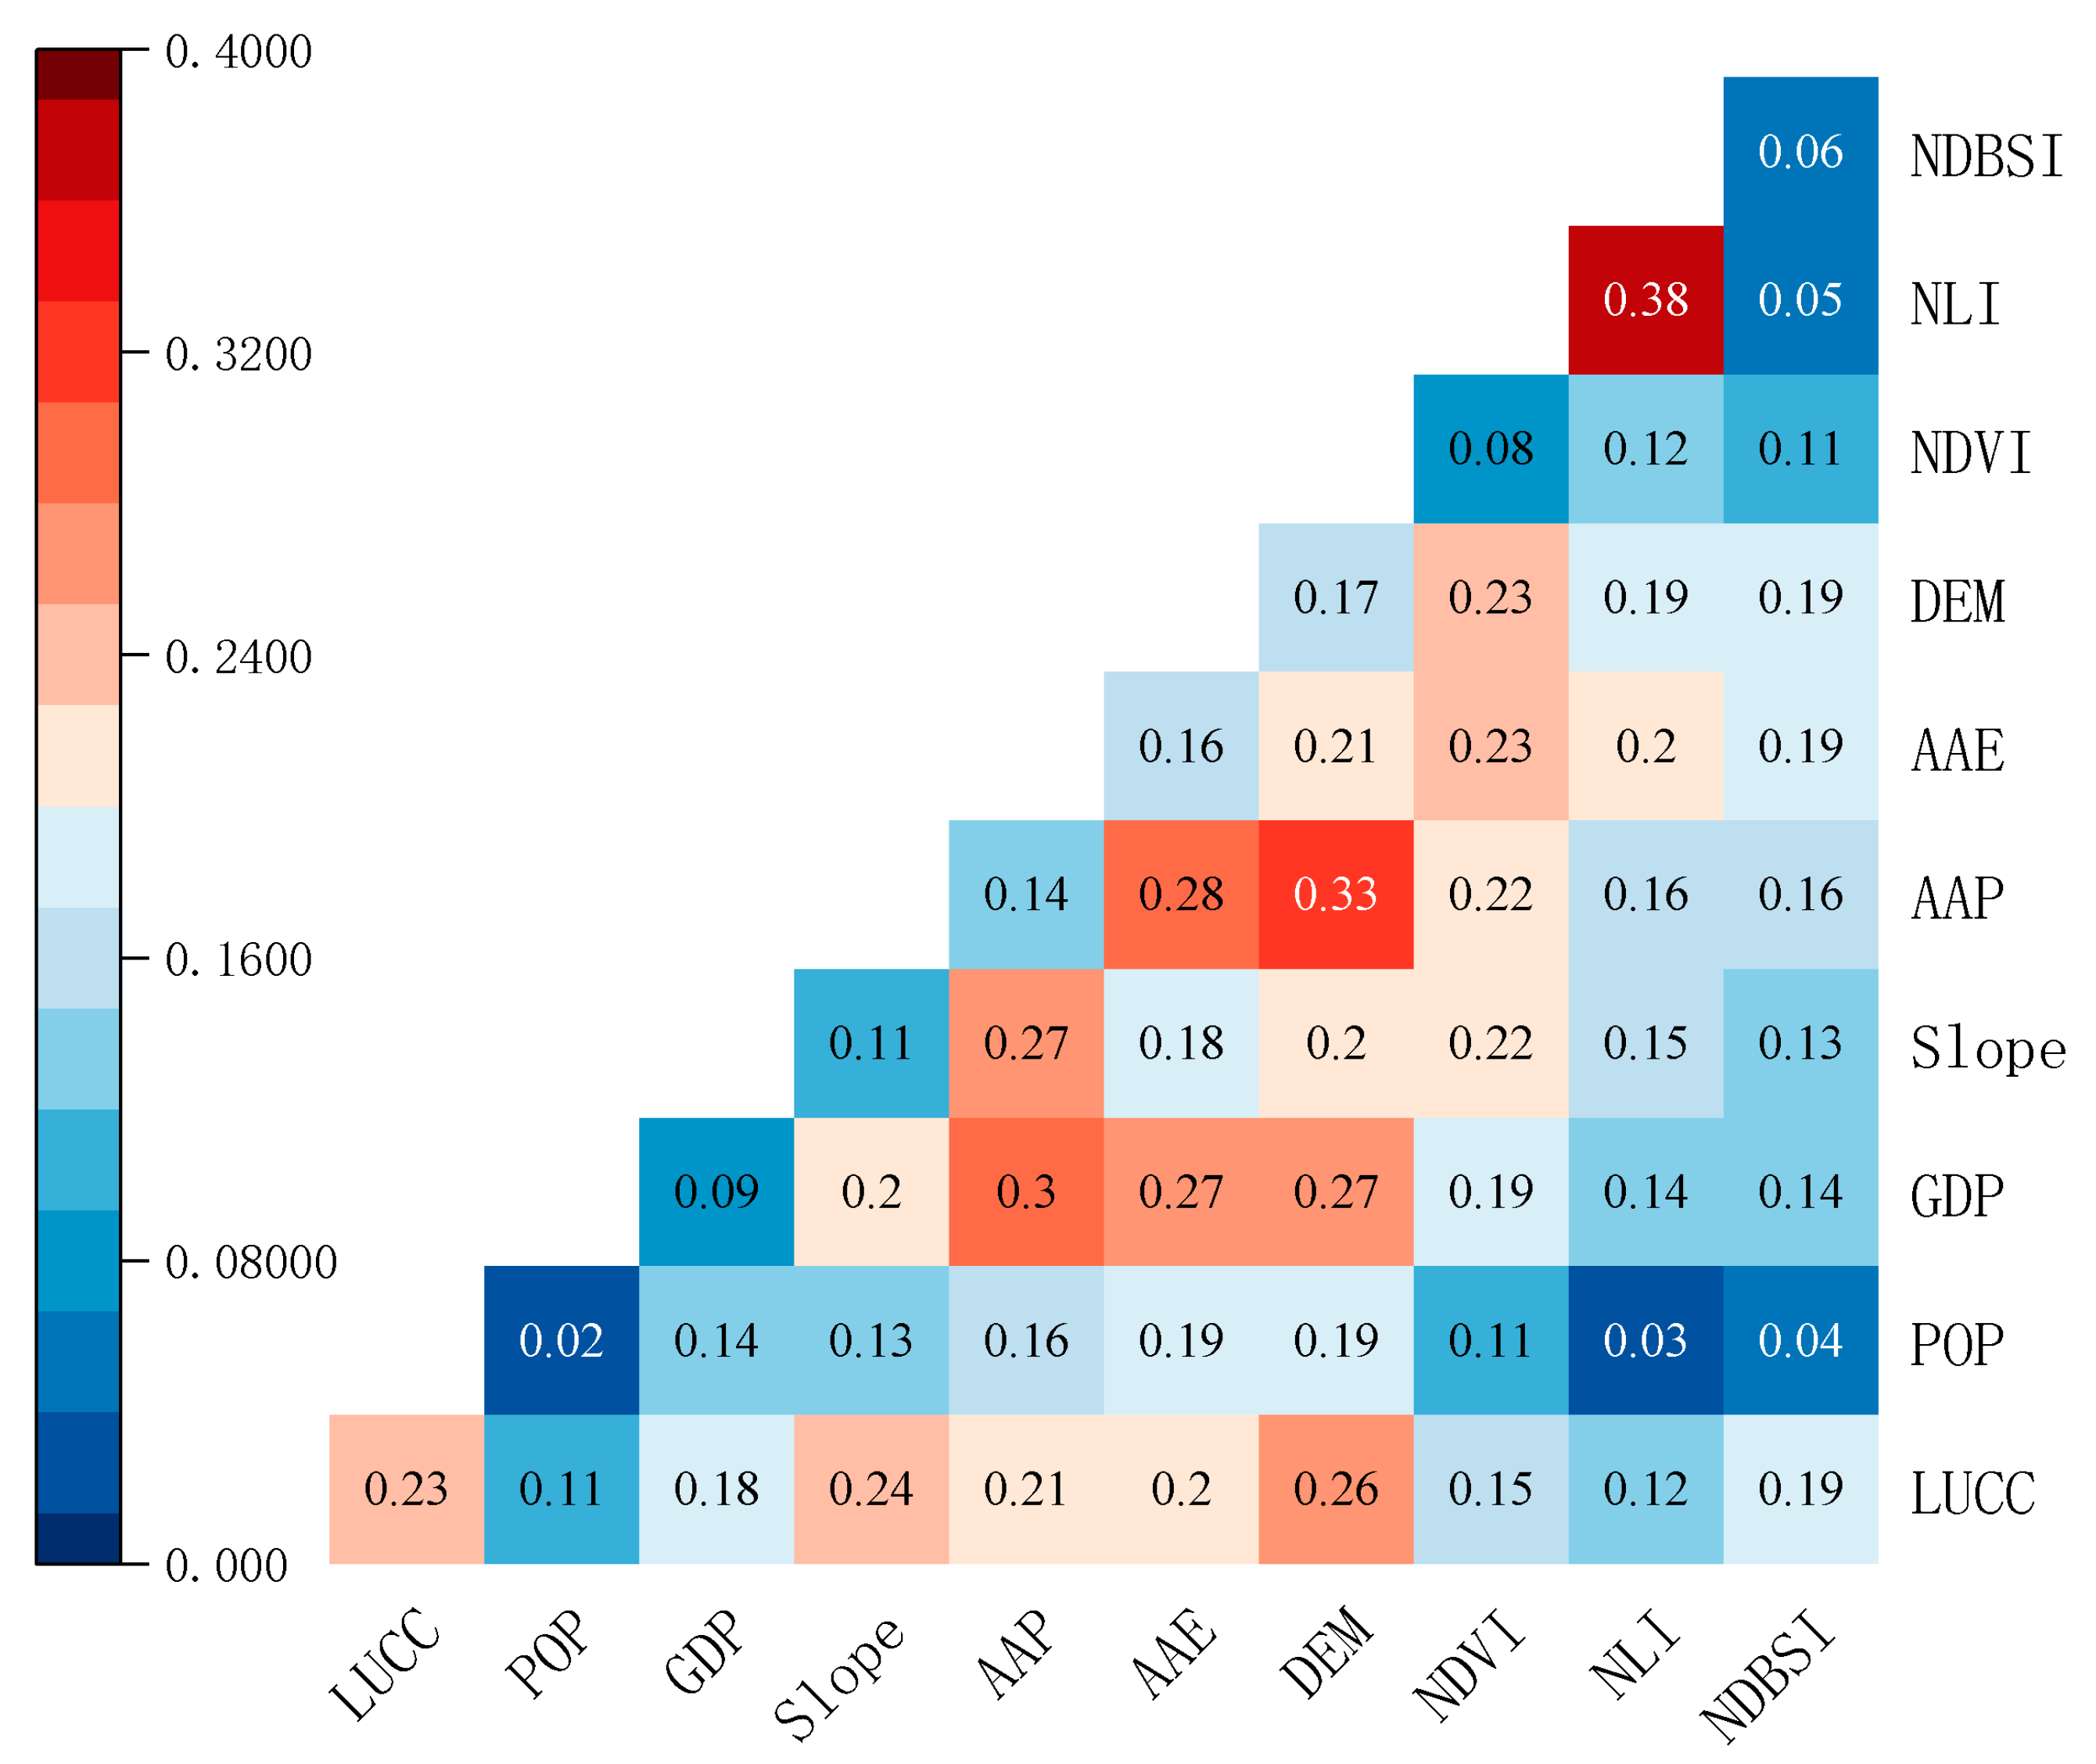
4.5. Analysis of Factors Influencing Changes in Water Production Rates in the Study Area

This study was based on the spatial and temporal distributions of water production in the Tianshan north slope urban agglomeration and its variation patterns, combining natural and anthropogenic factors for quantitative research [37]. Using the data for 2020 as an example, the natural and anthropogenic data were gridded using the grid method to create 2098 grid points at a size of 10 km × 10 km within the study area, and were used to match the water yield (detection factor) with influencing factors (explanation factor). The interaction between the various factors and water production rates in the urban agglomeration of the northern slopes of the Tianshan Mountains, and whether there were significant differences between them, thus revealed the main driving forces influencing the spatial distribution.
As can be observed in Figure 10, the different factors are ranked in descending order of q-values in terms of their determinants of water production: NLI (0.38) > LUCC (0.23) > DEM (0.17) > AAE (0.16) > APP (0.14) > slope (0.11) > GDP (0.09) > NDVI (0.08) > NDBSI (0.06) > POP (0.02). From the results of the factor detection, we can observe that the first dominant factor affecting the spatial variation of water production is NLI, with a contribution rate of 0.38, followed by LUCC, DEM, AAE, and other factors with equal influences, while the remaining factors present a relatively small contribution rate to the spatial variation of water production.
In terms of the magnitude of the interaction (Figure 11), this can be observed by the following values: DEM ∩ AAP (0.33), AAP ∩ GDP (0.30), AAE ∩ AAP (0.28), DEM ∩ GDP (0.27), DEM ∩ LUCC (0.26), slope ∩ LUCC (0.24), AAP ∩ LUCC (0.21), and AAE ∩ LUCC (0.20). The interaction between the other factors and land-use types in the study area was significant, and the interaction was more pronounced than the interaction between other factors as different land-use type structures determine the distribution patterns of different ecosystem types, making the interaction between the LUCC factor and other factors more pronounced than other factors’ interactions, with the distribution of land-use types playing a major role in the changes in water production rates. The interaction of DEM, AAP, and AAE with other factors was also obvious, indicating that the topography and climatic conditions of the study area had a certain influence on the water yield in the study area.

5. Discussion

5.1. Future Projections of Land-Use Changes

Land is the basis for human survival and social development, and rational land-use is necessary to achieve the goal of sustainable urban development [38]. The ecological changes and their characteristics resulting from the interaction between human activities and the natural environment can be reflected more clearly through land-use changes [39]. In this study, from 2000 to 2020, arable and construction lands in the study area presented an increasing trend, forest land and water areas presented a decreasing trend, and grassland and unused land presented a decreasing trend followed by an increasing trend. In the early years of the “Western Development” strategy, a large number of new industrial and commercial areas, excessive groundwater exploitation, and overgrazing led to the natural degradation of forest and grass vegetation and a reduction in land coverage. This is consistent with the results obtained by the majority of scholars [40]. For the present study, area land-use changes occurring in 2030 under different scenarios were mainly dominated by construction-based land expansion, arable land degradation and grassland expansion, but the degree of change varied depending on the scenario. The economic development scenario presented the largest increase in built-up land area, while the ecological conservation scenario exhibited the largest increase in forest land area. However, it was predicted that such results may depend on the impact factor, and we therefore recommend that similar studies are conducted by researchers.
In simulating and predicting future land-use patterns, this study selected the PLUS model, which applies a new analysis strategy to better explore the causal factors of various types of land-use change. This strategy combines the advantages of the existing TAS and PAS, avoiding the need to analyze the types of transformations that exponentially increase alongside the number of categories and retaining the model’s ability to analyze the mechanisms of land-use change over a certain period of time. It helped us to achieve high-accuracy simulation data in the shortest period of time [28]. The PLUS model parameters’ transition matrix and neighborhood weights were used in the calibration process. The transtion matrix was adjusted empirically. Neighborhood weights were calculated as a percentage of the land-use extension for each land-use type. The above parameters were used to improve the accuracy of the simulations during the model calibration process. The increased intensity of human activity led to increased ecological pressures with serious implications for the global ecosystem [41,42,43]. Accurately predicting future urban development patterns is vital for managers and policy makers. The scientific validity of the data is linked to the techniques used. This study reduced the objectivity of the modelling results by considering the contribution of influencing factors.

5.2. Variation in Water Production and Its Influencing Factors

From 2000 to 2030, the water production rate in the urban agglomeration on the northern slopes of the Tianshan Mountains presents an annual decrease and a trend of high values in the east, low values in the west, high values in the north, and low values in the south, with the water production function decreasing from the foothills of the Tianshan Mountains to the north and south during the study period. Forests and grasslands are the most important water-producing areas in the region and play a more important role than other lands do in the study area. According to the analysis of the impact of land-use change on water production rates, it can be observed from the results that the change in water production rates was mainly due to the change in grassland and water areas, and that the change in land-use intensity and water production rates from 2000 to 2030 are in harmony. This conclusion can be verified further by the results of the analysis of the coordination between land-use change and water production rates from 2000 to 2030. The results of this study, combined with the analysis of land-use development and water yield changes in the study area, suggest that land-use change can have a positive impact on the ecosystem’s water yield to a certain extent, and that for the study area, the ecological conservation development scenario may be more in line with the future urban development model, with the construction of a good ecological environment as a basic guarantee for the development of urban agglomerations, which is conducive to the comprehensive and sustainable development of urban agglomerations. Our approach helps to identify hotspots of gains and losses in the ecosystem of water yield functions by using two simple models to assess the relative importance and combined impacts of land-use change on water yield functions, which can be used for more informed environmental investment decisions. Based on our results, a pronounced impact of land-use change on the urban scale can be identified. Our results suggest that wise land-use management can improve ecosystem services.

5.3. Research Limitations and Future Studies

Predicting the changes in an ecosystem’s water yield provides a novel way of observing the evolution of land-use change and of water yield in the future. As described in the methodological framework (Figure 2), the main elements of our approach were factor selection, water production function assessment, and factor analysis. Our method provides a straightforward way to explore the possible impacts of land-use change on ecosystem services. The method is simple and can be used in other regions. In this study, the impact of the changes in land-use intensity on water yield was taken into account to further validate the results of the study and to produce more reasonable and scientific conclusions. The PLUS and InVEST models could clearly reflect the future changes in the water-yield values in the region, and the prediction of the changes in the ecosystem’s water yield figures provided a novel way of studying the evolution of land-use and of water yield in the future. However, several uncertainties still remained in the study. Firstly, the method used to calculate future land demand in a more reasonable way by integrating various natural and social factors is one of the key ways to improving the accuracy of future land-use pattern predictions. Secondly, the InVEST model’s results are highly sensitive to the input parameters. As the Z parameter is the main input in the model, it must be set in conjunction with the measured data. In addition to the fact that land-use change is the dominant factor that influences water production, the present study verified this conclusion through the use of a coordinated model, and further research is required to achieve an insight into the model’s performance following land-use change. The use of a large amount of measured data to obtain dynamic water-yield coefficients can improve the accuracy of assessments of an ecosystem’s water yield, and the continuous monitoring of sample sites in the study area should be performed for many years to verify the reasonableness of the water yield coefficients.

6. Conclusions

This study is based on land-use modeling techniques and a coordination degree model, which not only helps to provide insight into future urban growth patterns in the Tianshan North Slope urban agglomeration but also helps to inform different land-use stakeholders. The study provides a spatial assessment of the water production function of ecosystems in arid and semi-arid regions, which helps in understanding the impact of land-use change on the water production function of the urban agglomeration on the northern slopes of the Tianshan Mountains. The combined impacts and relative importance of land-use change in terms of changes in ecosystem services were identified. A feasible and replicable framework was proposed for land-use decision-making in ecologically fragile areas. The results show that, at the scale of urban agglomerations, land-use change has a greater impact on water-producing functions than climate change does. In most of the areas we studied, land-use change had a dampening effect on water-producing functions at the urban scale. Our study also supports the hypothesis that rational land-use will, to some extent, have a positive impact on the water-producing function of ecosystems and that effective management can help managers to develop more comprehensive spatial plans. A combination of PLUS model scenario analysis, geo-probing, and consistency analysis can assess the impact of drivers on ecosystem services. Despite the limitations of this study, the findings are practical, methodological, and policy-relevant, and can support the use of ecosystem service information in land planning and the development of more effective ecosystem conservation strategies. Finally, this study in can serve as a reference for sustainable ecosystem services planning in the Tianshan North Slope urban agglomeration and other similar areas.

Author Contributions

Writing—original draft preparation, R.R.; methodology, B.W.; software, Y.Z. and X.D.; Conceptualization and funding acquisition, A.K. All authors have read and agreed to the published version of the manuscript.

Funding

This research was funded by the Special Project for Construction of Innovation Environment in Autonomous Region-Construction of Science and Technology Innovation Base (Open Subject of Key Laboratory) Project: Two-way Coupling Process and Mechanism of Urbanization and Water Resources in Bosten Lake Basin (No. 2022D04007); Postgraduate Research and Innovation Project of Xinjiang Normal Universitas, grant number XSY202201001.

Data Availability Statement

Not applicable.

Acknowledgments

We thank the two anonymous reviewers for their very constructive comments and suggestions, which have contributed to the improvement of the original manuscript. We also thank the editorial staff.

Conflicts of Interest

The authors declare no conflict of interest.

References

  1. Jiao, W.; Wang, L.; Smith, W.K.; Chang, Q.; Wang, H.; D’Odorico, P. Observed increasing water constraint on vegetation growth over the last three decades. Nat. Commun. 2021, 12, 1–9. [Google Scholar] [CrossRef] [PubMed]
  2. Mahmoodi, N.; Kiesel, J.; Wagner, P.D.; Fohrer, N. Integrating water use systems and soil and water conservation measures into a hydrological model of an Iranian Wadi system. J. Arid. Land 2020, 12, 545–560. [Google Scholar] [CrossRef]
  3. Leal Filho, W.; Totin, E.; Franke, J.A.; Andrew, S.M.; Abubakar, I.R.; Azadi, H.; Nunn, P.D.; Ouweneel, B.; Williams, P.A.; Simpson, N.P. Understanding responses to climate-related water scarcity in Africa. Sci. Total Environ. 2022, 806, 150420. [Google Scholar] [CrossRef] [PubMed]
  4. Deng, C.; Zhu, D.; Nie, X.; Liu, C.; Zhang, G.; Liu, Y.; Li, Z.; Wang, S.; Ma, Y. Precipitation and urban expansion caused jointly the spatiotemporal dislocation between supply and demand of water provision service. J. Environ. Manag. 2021, 299, 113660. [Google Scholar] [CrossRef] [PubMed]
  5. Gerten, D.; Heck, V.; Jägermeyr, J.; Bodirsky, B.L.; Fetzer, I.; Jalava, M.; Kummu, M.; Lucht, W.; Rockström, J.; Schaphoff, S. Feeding ten billion people is possible within four terrestrial planetary boundaries. Nat. Sust. 2020, 3, 200–208. [Google Scholar] [CrossRef]
  6. Návar, J. Fitting rainfall interception models to forest ecosystems of Mexico. J. Hydrol. 2017, 548, 458–470. [Google Scholar] [CrossRef]
  7. Zhou, G.; Wei, X.; Luo, Y.; Zhang, M.; Li, Y.; Qiao, Y.; Liu, H.; Wang, C. Forest recovery and river discharge at the regional scale of Guangdong Province, China. Water Resour. Res. 2010, 46. [Google Scholar] [CrossRef] [Green Version]
  8. Bastiaanssen, W.G.M.; Karimi, P.; Rebelo, L.-M.; Duan, Z.; Senay, G.; Muthuwatte, L.; Smakhtin, V. Earth observation based assessment of the water production and water consumption of Nile Basin agro-ecosystems. Remote Sens. 2014, 6, 10306–10334. [Google Scholar] [CrossRef] [Green Version]
  9. Ouyang, Z.; Zhu, C.; Yang, G.; Xu, W.H.; Zheng, H.; Zhang, Y.; Xiao, Y. Gross ecosystem product concept accounting framework and case study. Acta Ecol. Sin. 2013, 33, 6747–6761. [Google Scholar] [CrossRef]
  10. Mittal, N.; Bhave, A.G.; Mishra, A.; Singh, R. Impact of human intervention and climate change on natural flow regime. Water Resour. Manag. 2016, 30, 685–699. [Google Scholar] [CrossRef] [Green Version]
  11. Zheng, H.; Li, Y.; Robinson, B.E.; Liu, G.; Ma, D.; Wang, F.; Lu, F.; Ouyang, Z.; Daily, G.C. Using ecosystem service trade-offs to inform water conservation policies and management practices. Front. Ecol. Environ. 2016, 14, 527–532. [Google Scholar] [CrossRef]
  12. Wang, H.; Zhang, C.; Li, L.; Yun, W.; Ma, J.; Gao, L. Delimitating the Ecological Spaces for Water Conservation Services in Jilin Province of China. Land 2021, 10, 1029. [Google Scholar] [CrossRef]
  13. Su, C.; Fu, B. Evolution of ecosystem services in the Chinese Loess Plateau under climatic and land use changes. Global Planet Chang. 2013, 101, 119–128. [Google Scholar] [CrossRef]
  14. Bai, Y.; Zheng, H.; Ouyang, Z.; Zhuang, C.; Jiang, B. Modeling hydrological ecosystem services and tradeoffs: A case study in Baiyangdian watershed, China. Environ. Earth. Sci. 2013, 70, 709–718. [Google Scholar] [CrossRef]
  15. Bai, Y.; Ochuodho, T.O.; Yang, J. Impact of land use and climate change on water-related ecosystem services in Kentucky, USA. Ecol. Indic. 2019, 102, 51–64. [Google Scholar] [CrossRef]
  16. Woldesenbet, T.A.; Elagib, N.A.; Ribbe, L.; Heinrich, J. Hydrological responses to land use/cover changes in the source region of the Upper Blue Nile Basin, Ethiopia. Sci. Total Environ. 2017, 575, 724–741. [Google Scholar] [CrossRef]
  17. Pan, T.; Zuo, L.; Zhang, Z.; Zhao, X.; Sun, F.; Zhu, Z.; Liu, Y. Impact of land use change on water conservation: A case study of Zhangjiakou in Yongding River. Sustainability 2020, 13, 22. [Google Scholar] [CrossRef]
  18. Jia, G.; Hu, W.; Zhang, B.; Li, G.; Shen, S.; Gao, Z.; Li, Y. Assessing impacts of the Ecological Retreat project on water conservation in the Yellow River Basin. Sci. Total Environ. 2022, 828, 154483. [Google Scholar] [CrossRef]
  19. Redhead, J.W.; Stratford, C.; Sharps, K.; Jones, L.; Ziv, G.; Clarke, D.; Oliver, T.H.; Bullock, J.M. Empirical validation of the InVEST water yield ecosystem service model at a national scale. Sci. Total Environ. 2016, 569, 1418–1426. [Google Scholar] [CrossRef] [Green Version]
  20. Awotwi, A.; Anornu, G.K.; Quaye-Ballard, J.; Annor, T.; Forkuo, E.K. Analysis of climate and anthropogenic impacts on runoff in the Lower Pra River Basin of Ghana. Heliyon 2017, 3, e00477. [Google Scholar] [CrossRef] [Green Version]
  21. Daneshi, A.; Brouwer, R.; Najafinejad, A.; Panahi, M.; Zarandian, A.; Maghsood, F.F. Modelling the impacts of climate and land use change on water security in a semi-arid forested watershed using InVEST. J. Hydrol. 2021, 593, 125621. [Google Scholar] [CrossRef]
  22. Lim, C.-H.; Song, C.; Choi, Y.; Jeon, S.W.; Lee, W.-K. Decoupling of forest water supply and agricultural water demand attributable to deforestation in North Korea. J. Environ. Manag. 2019, 248, 109256. [Google Scholar] [CrossRef] [PubMed]
  23. Canqiang, Z.; Wenhua, L.; Biao, Z.; Moucheng, L. Water yield of Xitiaoxi River Basin based on INVEST modeling. J. Resour. Ecol. 2012, 3, 50–54. [Google Scholar] [CrossRef]
  24. Scordo, F.; Lavender, T.M.; Seitz, C.; Perillo, V.L.; Rusak, J.A.; Piccolo, M.; Perillo, G.M. Modeling Water Yield: Assessing the Role of Site and Region-Specific Attributes in Determining Model Performance of the InVEST Seasonal Water Yield Model. J. Water 2018, 10, 1496. [Google Scholar] [CrossRef] [Green Version]
  25. Liu, J.; Lang, X.; Su, J.; Liu, W.; Liu, H.; Tian, Y. Evaluation of water conservation function in the dry-hot valley area of Jinsha River Basin based on InVEST model. Acta Ecol. Sin. 2021, 41, 8099–8111. [Google Scholar]
  26. Liu, D.; Cao, E.; Zhang, J.; Gong, J.; Yan, L. Spatiotemporal pattern of water conservation and its influencing factors in Bailongjiang Watershed of Gansu. J. Nat. Resour. 2020, 35, 1728–1743. [Google Scholar]
  27. Yang, D.; Liu, W.; Tang, L.; Chen, L.; Li, X.; Xu, X. Estimation of water provision service for monsoon catchments of South China: Applicability of the InVEST model. Landsc. Urban Plan 2019, 182, 133–143. [Google Scholar] [CrossRef]
  28. Liang, X.; Guan, Q.F.; Clarke, K.C.; Liu, S.S.; Wang, B.Y.; Yao, Y. Understanding the drivers of sustainable land expansion using a patch-generating land use simulation (PLUS) model: A case study in Wuhan, China. J. Comput. Environ. Urban Systems. 2021, 85, 101569. [Google Scholar] [CrossRef]
  29. Zhang, X.Y.; Zhang, X.; Li, D.H.; Lu, L.; Yu, H. Multi-Scenario Simulation of the Impact of Urban Land Use Change on Ecosystem Service Value in Shenzhen. Acta Ecologica. Sinica. 2022, 42, 2086–2097. [Google Scholar]
  30. He, X.H.; Xu, Y.T.; Fan, X.F.; Geng, Q.L.; Tian, Z.H. Temporal and spatial variation and prediction of regional carbon storage in Zhongyuan Urban Agglomeration. China Environ. Sci. 2022, 42, 2965–2976. [Google Scholar]
  31. Zhang, B.; Li, L.; Xia, Q.Y.; Dong, J. Land use change and its impact on carbon storage under the constraints of “ three lines”: A case stud A case stud y of Wuhan City Circle. J. Acta Ecologica Sinica. 2022, 42, 2265–2280. [Google Scholar]
  32. Han, Z.L.; Meng, Q.Q.; Yan, X.L.; Zhao, W.Z. Spatial and temporal relationships between land use intensity and the value of Ecosystem Services in northern Liaodong Bay over the past 30 years. J. Acta Ecologica Sinica. 2020, 40, 2555–2566. [Google Scholar]
  33. Lange, M.; Feilhauer, H.; Kühn, I.; Doktor, D. Mapping land-use intensity of grasslands in Germany with machine learning and Sentinel-2 time series. J. Remote Sens. Environ. 2022, 277, 112888. [Google Scholar] [CrossRef]
  34. Yin, L.; Dai, E.; Xie, G.P.; Zhang, B.L. Effects of Land-Use Intensity and Land Management Policies on Evolution of Regional Land System: A Case Study in the Hengduan Mountain Region. J. Land 2021, 10, 528. [Google Scholar] [CrossRef]
  35. Liu, X.; Liu, Y.; Wang, Y.; Liu, Z. Evaluating potential impacts of land use changes on water supply–demand under multiple development scenarios in dryland region. J. Hydrol. 2022, 610, 127811. [Google Scholar] [CrossRef]
  36. Yang, Z.; Chen, Y.; Qian, Q.; Wu, Z.; Zheng, Z.; Huang, Q. The coupling relationship between construction land expansion and high-temperature area expansion in China’s three major urban agglomeration. Int. J. Remote Sens. 2019, 40, 6680–6699. [Google Scholar] [CrossRef]
  37. Liu, J.; Xu, Q.; Yi, J.; Huang, X. Analysis of the heterogeneity of urban expansion landscape patterns and driving factors based on a combined Multi-Order Adjacency Index and Geodetector model. Ecol. Indic. 2022, 136, 108655. [Google Scholar] [CrossRef]
  38. Tsou, J.Y.; Gao, Y.; Zhang, Y.; Sun, G.; Ren, J.; Li, Y. Evaluating urban land carrying capacity based on the ecological sensitivity analysis: A case study in Hangzhou, China. Remote Sens 2017, 9, 529. [Google Scholar] [CrossRef] [Green Version]
  39. Rukeya, R.; Alim, K.; Halmurat, A. Construction of Ecological Security Pattern in Tumshuk City Based on MSPA and MCR Model. Environ. Sci. Technol 2021, 44, 229–237. [Google Scholar]
  40. Fang, C.L.; Liu, H.M.; Li, G.H. International progress and evaluation on interactive coupling effects between urbanization and the eco-environment. J. Geogr. Sci. 2016, 26, 1081–1116. [Google Scholar] [CrossRef]
  41. Liu, S.; Lei, G.; Wang, D.; Li, H.; Li, W.; Gao, J. Reoccupying Ecological Land for Excessively Expanded Rust Belt Cities in Traditional Grain Bases: An Eco-Economic Trade-Off Perspective. Land 2020, 9, 297. [Google Scholar] [CrossRef]
  42. Zhang, H.; Xu, E. An evaluation of the ecological and environmental security on China’s terrestrial ecosystems. Sci. Rep. 2017, 7, 1–12. [Google Scholar] [CrossRef] [PubMed] [Green Version]
  43. Yao, L.; Yu, Z.; Wu, M.; Ning, J.; Lv, T. The spatiotemporal evolution and trend prediction of ecological wellbeing performance in China. Land 2020, 10, 12. [Google Scholar] [CrossRef]
Figure 1. Schematic diagram of the urban agglomeration on the northern slope of Tianshan Mountain.
Water 15 00776 g001
Figure 2. Technology road map.
Water 15 00776 g002
Figure 3. Contribution of future land-use-projection impact factors.
Water 15 00776 g003
Figure 4. Map of impact factors for future land-use projections.
Water 15 00776 g004
Figure 5. 2020 actual land-use map compared to simulation results.
Water 15 00776 g005
Figure 6. Distribution map of land-use change in urban agglomeration on the northern slope of Tianshan Mountains from 2000 to 2030.
Water 15 00776 g006
Figure 7. Distribution map of land-use intensity change in urban agglomeration on the northern slope of Tianshan Mountains from 2000 to 2030.
Water 15 00776 g007
Figure 8. Distribution of changes in water production rates in the urban agglomeration on the northern slopes of the Tianshan Mountains from 2000 to 2030.
Water 15 00776 g008
Figure 9. Distribution of changes in water production rates by city in the Tianshan north slope urban agglomeration from 2000 to 2030.
Water 15 00776 g009
Figure 10. Distribution of changes in coordination between land-use intensity and water production rates.
Water 15 00776 g010
Figure 11. Interaction of the effects of different factors on water yield.
Water 15 00776 g011
Table 1. Field weight parameters of each land-use type in the urban agglomeration on the northern slopes of the Tianshan Mountains.
Land-Use TypesCroplandForestGrasslandWaterbodyBuilt-Up LandUnused Land
Neighborhood weight0.80.50.80.50.81.0
Table 2. Intensity index of land-use types in urban agglomeration on the northern slope of Tianshan Mountains.
Land-Use TypesCroplandForestGrasslandWaterbodyBuilt-Up LandUnused Land
Power level3.02.04.01.0
Table 3. Classification of coordination types.
Coordination RangeCategory DivisionCoordination-Type AreaDescription
[0, 0.5)Severely dysfunctionalDysregulated declineLand-use intensity and water production growth in a state of dysfunctional decline
[0.5, 0.6)Mildly disordered
[0.6, 0.7)face dissonanceRun-in coordinationLand-use intensity and water production growth in harmony
[0.7, 0.8)Barely coordinated
[0.8, 0.9)Basic coordinationCoordinated developmentRepresents a coordinated and rapid increase in land-use intensity and water production
[0.9, 1)Good coordination
Table 4. Data sources and notes for this study.
No.DatasetsDataData Resources
1Land-use/cover datasetsLand-use/cover datahttp://www.resdc.cn/data.aspx?DATAID=252 (accessed on 20 January 2021)
2Vector datasetsAdministrative district boundarieshttps://xinjiang.tianditu.gov.cn (accessed on 15 March 2022)
3Meteorological data setsAverage annual precipitationhttp://data.tpdc.ac.cn (accessed on 15 March 2022)
Average annual temperature
4Social datasetsPopulationhttp://www.resdc.cn/data.aspx?DATAID=252 (accessed on 20 January 2021)
Gross domestic producthttp://www.resdc.cn/data.aspx?DATAID=252 (accessed on 20 January 2021)
5Road network data setsDistance from railwayshttps://www.webmap.cn/main.do?method=index (accessed on 15 March 2022) calculated by Euclidean distance
Distance from motorways
Distance from provincial roads
Distance from county roads
Distance to country roads
Distance to water
6Topographic factor datasetElevationhttp://www.gscloud.cn/#page1/2- (accessed on 20 January 2021)
Slope
Slope direction
7Impact factor datasetNighttime lighting indexGEE (accessed on 15 March 2022)
Normalized difference vegetation indexMODISTerra vegetation index data MYD13A1 16-day products
Normalized difference building soil indexMODISA qua surface reflectance data MYD09A1 8-day products
8Soil datasetsClay, silt, sandHWSD v1.2
Table 5. Land-use area from 2000 to 2020 and predicted area under three different in 2030 (km2).
2000201020202030
S1S2S3
Land-use types15,38721,38622,54222,18322,34522,541
Forest513927632613260726042609
Grassland62,32558,02459,07259,67658,93459,676
Water body333818511762163916681767
Built-up land161123463432443935334439
Unused land106,428107,861104,825102,427103,887101,939
Disclaimer/Publisher’s Note: The statements, opinions and data contained in all publications are solely those of the individual author(s) and contributor(s) and not of MDPI and/or the editor(s). MDPI and/or the editor(s) disclaim responsibility for any injury to people or property resulting from any ideas, methods, instructions or products referred to in the content.

