
The Assessment of the Quality and Quantity of Water Retained in Closed Granite Quarries with the View to Mitigate the Effects of Droughts in Agriculture

1
Department of Landscape Architecture, Wrocław University of Environmental and Life Sciences, ul. Grunwaldzka 55, 50-357 Wrocław, Poland
2
Department of Environmental Protection and Development, Wrocław University of Environmental and Life Sciences, pl. Grunwaldzki 24, 50-363 Wrocław, Poland
*
Author to whom correspondence should be addressed.
Water 2023, 15(4), 782; https://doi.org/10.3390/w15040782
Submission received: 18 January 2023
/
Revised: 9 February 2023
/
Accepted: 11 February 2023
/
Published: 16 February 2023
(This article belongs to the Special Issue New Challenges in the Planning, Design, Construction and Operation of Reservoirs in the Context of Climate Change)
Abstract
:This paper presents the results of bathymetric measurements of quarry lakes located in inactive granite quarries (Poland, Lower Silesia, County Strzelin), which were used, among other reasons, to determine the surface area, depth, and volume of water retained in the analysed quarry lakes. The usability of water in quarry lakes for agricultural irrigation was also assessed, based on the FAO Guidelines and the PN-84/C-04635 standard. The average surface area of the analysed quarry lakes was 0.99 ha, the average depth was 6.0 m, and the maximum depth was 14.3 m. At the same time, the total volume of the retained water amounted to 307.8 thousand m3, which accounts for 10.6% of the retention capacity of water reservoirs situated in the catchment of the Oława River. The average values of water quality indicators were as follows: electrical conductivity—0.332 mS × cm−1; sodium adsorption ratio—0.56; total dissolved solids—212.4 mg/L; water pH—7.8; BOD5—2.4 mgO2/L. The mean concentrations of ions had the following values: nitrates—0.91 mgN-NO3−/L; sulphates—176.3 mg SO42−/L; chlorides—36.56 mg Cl−/L; sodium ions—14.8 mg Na+/L; calcium—41.3 mg Ca2+/L; magnesium—7.48 mg Mg2+/L; manganese—0.1 mg Mn/L; and iron—0.01 mg Fe/L. The concentrations of water quality indicators that were recorded for the analysed Strzelin quarry lakes were similar to those observed in natural lakes and uncharged water bodies. Water from the analysed quarry lakes met (with some minor limitations) the requirements that enable them to be used for agricultural irrigation. The volume of the water retained in the analysed quarry lakes constitutes an important element of the total balance of water retained in all the reservoirs, ponds, and all Strzelin quarry lakes situated in the catchment of the Oława River, accounting for 10.6% of the total volume of retained water. The article presents the innovative concept of the possibility of using water from quarry lakes in agriculture, based on their quantity and quality and the requirements for the purpose for which they will be used, e.g., for agricultural irrigation.
1. Introduction
At the beginning of the twenty-first century, the deficit of fresh water, including the water for agricultural and industrial needs was estimated at 230 km3/year; by 2025, this planetary deficit will increase to 1300–2000 km3/year [1]. According to estimations, by the year 2050, 3.9 billion people, i.e., over 40% of the world’s population, will live in severely water-stressed river basins [2]. The total amount of freshwater resources in Europe is approximately 2270 km3/year [3], of which the freshwater resources in Poland are estimated to amount to 56.9 km3/year (average from the period 2000–2020) [4], with a decreasing trend noted in recent years [4,5,6,7,8,9]. According to estimations, European water resources amount, on average, to approx. 4.7–5.0 thousand m3 /year per person and in Poland to 1.4–1.5 thousand m3/year per person [4,10,11].
Shaping and protecting the water resources from periodical excessive amounts of water (snowmelt and rainfall in the spring and short but intensive rainfalls in the summer) or water deficit (at the end of spring and all summer), which is realised, among others, by water retention in reservoirs, is essential especially in areas/regions with low water resources [10,12]. The total capacity of 133 Polish retention reservoirs (existing ones and those still under construction) is approx. 3.5–3.6 km3 [12]. Furthermore, approx. 32,000 small retention reservoirs may retain about 0.63–0.85 km3 of water [4,12], which, in total, accounts for approximately 6% of Polish water resources. At the same time, about 7000 large reservoirs could be found across Europe, with a total capacity representing about 2.0% of the total freshwater resources [2].
In many cases the water is characterised as low quality [13]. Water deficits and poor water quality (e.g., for irrigation) require the solution of several problems—such as increasing the effectiveness of using water resources and reducing the influence of irrigation on the environment, by using various sources of water for irrigation [14,15]. This is why it may be important to use quarry lakes as sources of water for irrigation, in particular in areas with poor water resources [16,17,18,19,20,21,22].
The global extent of land area impacted by mining and quarrying is estimated at approx. 421 thousand km2 in Europe, exclusive of Russia, while the estimated area impacted by active mining is about 40 thousand km2 [23]. Their spatial distribution is rather varied, because it depends on the location of deposits of mineral resources [24]. In Poland, mining areas occupy approx. 422 km2 out of which open-pit mines account for approx. 347 km2 [8]. Some of the latter are open-pit basins. These are former excavations of clay, sand and gravel [18,25,26,27], stone quarries [20,26,27,28,29,30], open-cast coal [18,25,26,27,31,32,33,34] and lignite mines [26,27,31,32,33,34,35,36,37], as well as open-cast ore metal mines [18,25,27,34]. When the mining process, and thus the dewatering of the pit, is discontinued, they often fill with groundwater, rainfall and surface runoff, which results in the emergence of mine or quarry lakes [17,20,21,36,38,39,40,41,42,43,44,45,46,47,48,49].
Depending on the type of the excavated resources and the mining technology used, mine and quarry lakes may vary in depth, surface area, and volume, retaining even up to hundreds of millions of cubic meters of water [17,20,28,32,33,35,39,42,43,48,50,51,52,53,54,55,56,57,58]. Usually, the largest mine lakes emerge in former lignite mines [24,35,59,60], which even led to the creation of an Anthropogenic Lake District [60,61].
Most mine lakes are located in Australasia, Europe, and North America [16,25,27,62,63]. In particular, most pit lakes were formed in Canada [25,27,31,44,64], the USA [25,27,38,65,66], the Czech Republic [27,63], Australia [22,27,34,44] and Germany [22,27,34,35,39,42,44,67,68]. But in recent decades, hundreds of new mine or quarry lakes have been created, including in many other countries, e.g., China [24,69,70], Italy [19,48], Indonesia [63] Ireland [22], France [52], Poland [22,27,37,49,60,63], Sweden [51], the U.K. [31], South Africa [25], Greece [34] and Spain [27,59,63].
Mine or quarry lakes may be used for various purposes, among others: recreation and tourism [27,31,40,70,71,72,73,74], wildlife habitats [16,17,70,71,72], aquaculture and fish farming [17,19,27,71,75,76], water management [17,20,27,31,72,76], floating photovoltaic systems [77], as a source of low-cost thermal energy (i.e., for greenhouses, agribusiness factories) [48], water reservoirs in hydro storage power plants [78], greenhouse carbon fixation [27], potable and industrial water reservoirs or irrigation water storage for agriculture and horticulture [17,19,21,28,31,72,74,76,79], capturing flood waters, or improving the flow rate in water courses during droughts [29,35,80].
The potential use of mine and quarry lake water depends, however, on the water quantity and quality [16,17,21,32,35,39,44,46,50,52,67,72,79,81,82,83,84]. The volume of water retained in quarry lakes or small mine lakes varies and it may range from several thousand m3 to several (or more than ten) million m3 [20,22,27,34,40,47,48,49,59,78,80,85]. However, most of the publications on mine lakes in the subject literature discuss coal and lignite mines, where the volume of the retained water ranges from 30–60 million m3, sometimes exceeding 100 million m3, and often reaching even up to 330–350 million m3 [27,32,36,44,63,67,81,86,87,88,89,90].
In many cases, the mine and quarry lakes contain fresh and clean water [19,21,28,37,40,46,58,60,79,91,92,93,94]. However, the risks related to water quality often apply to lignite mines or open-cast ore metal mines, and they are usually connected with increased salination, concentration of heavy metals, acidification that increases the mobility of heavy metals, as well as the oxidation of sulphide minerals, especially pyrite [16,18,25,27,32,33,59,60,84,95].
The reclamation of the closed mine pits in the water direction and creating mine or quarry lakes may be an element of the realisation of the tasks related to counteracting the effects of drought and reducing water deficits [12,96,97,98]. The creation of mine and quarry lakes may also be a partial answer to meeting the goals of the EU Water Framework Directive [22,96]. Furthermore, it may become an important activity for increasing water resources and their sustainable and reasonable management both in local and regional terms [10,20,22,47,49,75,99,100,101,102,103,104,105,106]. In this approach, mine and quarry lakes may be used, for among other purposes, to collect and retain water that is later used, for example, as a source of potable or industrial water supply, for aquaculture and fish farming and for irrigation in agriculture and horticulture [19,21,27,28,29,31,35,67,70,71,74,76,79].
One of the main problems in agricultural regions (including, among others, Strzelin County) is limited resources of surface waters. In many cases, the water retained in the analysed Strzelin quarry lakes was not included in the balance of reservoirs retention capacity in the catchment of the Oława River [20,49]. Therefore, it is not taken into consideration in the water management programmes that concern water retention and distribution, especially with the aim to mitigate the effects of droughts in agriculture. Currently, the availability of water retained in quarry lakes in Strzelin County for agriculture is poor and the water is used only to a limited extent, because of the lack of reasonable proposals concerning the use of the water retained in Strzelin quarry lakes. Officially, none of them is a source of water supply for agricultural irrigation. The new idea presented in this article is addressed first of all to water authorities, farmers and scientist, as well as teachers. It concerns the possibility of using the water retained in quarry lakes to improve the availability of surface waters for agricultural purposes. The possibility of using water from quarry lakes in agriculture will be determined by its quantity and quality. It is important that the water from quarry lakes should meet the quality requirements for the purpose for which it will be used, e.g., for agricultural irrigation.
The aim of this paper was to estimate the volume of water retained in selected Strzelin quarry lakes that formed in closed granite quarries, as well as to assess the quality of water in the analysed flooded quarries in terms of its usability for agricultural irrigation. The article is a continuation, extension, supplement and discussion of the earlier articles by its authors [20,21,47,49,79], concerning the subject of water resources retained in quarry lakes and the assessment of their suitability for agricultural irrigation. The research subject will be continued in the future.
2. Materials and Methods
The subject of the study are closed granite quarries flooded with water that are situated in Strzelin County (Figure 1) [20,21,46,47,49,79], Lower Silesian Voivodeship (Poland, Central Europe), in the area of the Strzelin Hills [107,108], and in the catchment of the Oława River, in the basin of the Oder River [109]. The description of Strzelin County and of the geological structure of the research area was published, among others, in articles [20,21,46,47,49,79].
Samples of water for laboratory tests were collected from the superficial layer of water, at a depth of 0.5 m [110], approximately 5–7 m from the reservoir coast, at 8–10 h a.m., once every quarter (spring, summer, autumn, winter—with and without ice cover), in the period from December 2016 to March 2018 [21,46,79]. In total, 30 samples were collected. The collection of samples and the results of the chemical analysis of the water from the superficial layer of mine and quarry lakes are presented in contemporary publications [22,33,58,59]. The water was analysed at the laboratory [21,46,79], following reference test methodologies and/or Polish Reference Standards [111]. The content of nitrates (NO3−—spectrophotometric method), sulphates (SO42−—gravimetric method), chlorides (titration method (Mohra method)), Na, Ca, Mg, Fe, and Mn (all: atomic absorption spectrometry (AAS) method) was determined, as well as the values of BOD5 (titration method), pH (potentiometric method), and ECw (electrical conductivity of water (conductivity method)). The SAR index (sodium adsorption ratio—potential sodium hazard from irrigation water) and TDS (total dissolved solids) were also measured. The SAR and TDS were calculated with the use of Equations (1) and (2) [112,113,114]. The mean pH reaction was calculated from the average value of the concentration of [H+] ions obtained from the conversion of the initial pH value. The obtained results were classified according to FAO Guidelines [114] and to the Polish Reference Standard PN-84/C-04635 [115,116]. The evaluation was based on the average values from the measurement period, while the value adopted for the overall evaluation was the worst of all the analysed indicators.
Source: FAO [114]
where:
- h = 640 for ECw < 5 mS × cm−1
- h = 800 for ECw > 5 mS × cm−1
Research on the morphological properties of mining and post-mining pits often uses GIS tools [20,47,117,118], where the output data are obtained with use of traditional geodesic methods (total station, GNSS) measurements that employ LiDAR techniques (TLS, ALS, MLS, UAV), or a combination of the GNSS and network real-time kinematic (NRTK) methods [20,47,119,120,121,122,123,124,125,126,127]. On the other hand, bathymetric surveys of flooded quarries are mostly carried out using single-beam sonar probes [57,60], including low-cost sonar systems [33,128], although LiDAR techniques may also be used for the purposes of such studies [129,130]. The authors used orthophotomaps (Figure 2) that are available free of charge according to art. 40a of the Act-Geodesic and Cartographic Law [131] from the Chief Land Surveyor of the Country, on the website https://mapy.geoportal.gov.pl (accessed on 1 October 2022). The digital terrain model (DTM) of Strzelin County (Figure 1) was created based on LiDAR ALS data (licence no. DIO.7211.160.2018_PL_N) by B. Jawecki [49]. The survey was conducted with use of a single-beam Deeper CHIRP+ sonar equipped with a GPS receiver (scanning depth: 0.15–100 m, three CHIRP frequencies: 675 kHz (cone angle 7°), 240 kHz (cone angle 20°), and 100 kHz (cone angle 47°), scanning rate: 15 refreshments per second). The analysed quarry lakes were scanned in July, September, and October 2021. The bottoms of the quarry lakes were scanned with use of a remotely controlled boat equipped with a sonar with a beam of the frequency of 240 kHz and an angle of the scanning cone of 20°. The obtained data were then analysed and processed with the use of GIS tools in order to create bathymetric maps of the surveyed quarry lakes and to estimate the water table surface area and the volume of water retained in the basins of the flooded quarries. The potential differences between the data concerning the surface of the quarry lakes and their depths obtained from field measurements and those read in the available orthophotomaps, NMT, etc., may result, among others, from: the presence of trees overgrowing the shores of the analysed water reservoirs that hinder the measurement of the coastline of the quarry lake, the presence of reed and bushes growing out of the water, sunken and dry trees protruding out of the water, waste floating on the surface of the water that created obstacles preventing the drone from moving freely across the reservoir and thus establishing the determination of its surface area and depth, and finally, the seasonal fluctuations in the water level in the reservoir.
The volume of the water retained in the analysed quarry lakes was estimated with use of the QGIS and Saga Gis open source software, based on the created spatial data base. The initial stage of processing measurement data consisted in their verification in order to identify any potential errors that may result, e.g., from the recording inaccuracy of the used GPS receiver, tilting of the boat and rippling of the water, etc. The visual assessment, based, among others, on the orthophotomap and the NMT, was the basis for eliminating outlier data on the depth and position. As a result, SHP layers were created that contained, depending on the surface area of the analysed reservoir, from 6118 to 65,528 points per object, which corresponds to a sampling density ranging from 0.96 to 2.23 points per 1 m2, on average 1.6 points per 1 m2. Then, based on the discrete layers: the point layer that contained depth layers obtained from direct measurements, continuous, raster layers were generated that reflected the variability of the position of the bottoms of specific pits in reference to the level of the water table. This was performed with use of the commonly used geostatistical method based on Kriging algorithms. Based on the results, spatial models of the bottom formation of a resolution of 1.0 m were created. This enabled us to calculate the capacity of individual quarry lakes as the average value of specific raster layers and to generate bathymetric maps.
Tests were conducted in six flooded quarries of granitoides, whose basic characteristics are presented in Table 1. Quarries Q1–2 and Q4–6 are non-runoff quarries, while part of the water from quarry Q3 is discharged gravitationally to the drainage ditch, whose bottom at the quarry lake is positioned on the ordinate of approx. 174.7 m a.s.l. In the long-term perspective, seasonal fluctuations in the water level of the analysed reservoirs range from approx. 0.3 m to approx. 1.0 m. Based on the criteria defined in the Ordinance of the Minister of Infrastructure [132] they were classified as artificial reservoirs and their types were defined as (Table 1): WSm_a—a lake on calcareous substrate, with a low Schindler factor, stratified; WSd_a—a lake on calcareous substrate, with a high Schindler factor, stratified; WSd_b—a lake on calcareous substrate, with a high Schindler factor, polymictic; K_a—siliceous lake, low alkaline, stratified. It should be borne in mind that the typology and classification of lakes and water reservoirs adopted in Poland do not take into consideration the specificity of such bodies as mines or quarry lakes. Due to this, it seems justified to urge for the introduction of another type of surface water, including artificial water reservoirs, to the draft amendment to the Water Management Plan in the Oder River Basin [133].
3. Results and Discussion
3.1. The Quantity of Water Retained in Closed Strzelin Granite Quarries
The results of sonar measurements became the basis for creating bathymetric maps of the analysed quarry lakes (Figure 2), which allowed for the determination of the length and width of quarry lakes, the surface area of the water reservoir, its depth and the volume of retained water (Table 2).
The average surface area of the surveyed quarry lakes (Table 2) is 0.99 ha and falls in the range of 0.10–2.93 ha, while their average length is 173.3 m (ranging from 44–347 m), and width is 88.0 m (ranging from 42–220 m). The surface area of these quarry lakes is relatively small in comparison to that of mine and quarry lakes that emerge in the basins of lignite, coal or metal open pit mines and large quarries of cohesive rock material, which may reach even tens or hundreds of hectares [17,18,20,28,32,33,35,42,43,47,49,51,52,54,55,80,83,84,85].
Most of the analysed quarry lakes are also relatively shallow, with an average depth of approx. 6 m, ranging from 1.7 to 10.0 m, while the average maximum depth is approx. 14 m, ranging from 4.3 to 28.4 m (Table 2). These values are similar to the parameters of shallow quarry lakes that are formed in quarries of cohesive rock materials and lignite, coal or metal open pit mines whose depth reaches 10–15 m [21,28,33,55,80,83], but they differ significantly from the depth of mine lakes in lignite [35,42,43,54,85], coal [18,32,52] or metal open pit mines [18,46,51,85], and even of quarry lakes [20,21,47,49], whose depths may significantly exceed 30 m.
The total volume of water retained in the analysed quarry lakes, calculated based on bathymetric measurements, amounts to 0.3078 million m3 and ranges from 0.0017–0.1227 million m3 (Table 2). Due to their geomorphological parameters, quarry lakes that are formed as a result of anthropogenic activity determined by the geological structure and resource mining technology, the volume of water retained in the analysed quarry lakes is lower than that of water retained in lakes that emerge in quarries of cohesive rock materials [20,40,47,49,80,85], or in smaller mine lakes that emerged in the area of the Adamów Lignite Mine [90,134]. However, a majority of the mine lakes discussed in the literature are lakes formed in coal and lignite mines, where the average volume of retained water usually falls into the range of 30–60 million m3 [32,36,44,54,81,88,89,90]. At the same time, the volume of water retained in the analysed quarry lakes will increase the total volume of water retained in the catchment of the Oława River and the balance catchment WR09 Nysa Kłodzka by 11.1% and 0.29%, respectively [20,47,49]. It accounts for 10.6% of all the water resources retained in the water reservoirs, ponds, and Strzelin quarry lakes in the catchment of the Oława River [49].
The calculated results of water volume presented here, which were based on field bathymetric analyses of the water retained in the surveyed quarry lakes, provide a verification of the algorithm/model that was proposed for the purposes of calculating the volume of water retained in quarry lakes, proportionally to the quarry lakes that are formed in inactive granite quarries [49].
The total volume of water retained in the analysed quarry lakes located in closed granite quarries, which was calculated with the use of the algorithm (Equations (1) and (2)) [49] amounted to 0.4279 million m3 and it was 39% larger than the volume of water calculated based on bathymetric measurements. The differences between the values of water volume calculated with use of the algorithm and based on bathymetric surveys for individual quarry lakes fall into the range of 2.6–43.5% (on average 30.2%). In most of the cases, the values calculated with use of the algorithm were higher than those based on field bathymetric studies. Only in quarry lake Q2 was the value calculated based on the results of field measurements higher (by 32.9%) than that calculated with use of the algorithm. This may be explained by the fact that the older and deeper part of the flooded pit has a surface area of approx. 0.27 ha and a depth of approx. 10–11 m, while the newer, shallower part has a surface area of 2.66 ha and a depth of approx. 2 m, which was taken into account in calculating the volume of water based on the proposed algorithm [49]. The most similar values of the calculated volumes of water were noted in Q6 where the difference was only 2.6%.
In order to minimise the differences between the values of the volume of water retained in quarry lakes that are located in the granite quarry that has been closed for about 20 years, which were determined based on bathymetric measurements and the values calculated with use of the algorithm, the authors propose [49] to add a reduction coefficient for quarry lakes in inactive quarries (CQL) to Equation (1). This coefficient should have the value of 0.642 or to reduce the RF coefficient in Equation (2) [49] to 0.407. This action will result in decreasing the volume of water calculated with use of the algorithm by the average value (35.8%) of the absolute difference between the water volume calculated with the algorithm and the value based on bathymetric surveys, which will result in reducing the potential differences between these values to approx. 7%.
Taking into account the volume of water retained in the inactive Strzelin granite quarries, calculated based on bathymetric studies, will lead to a slight decrease in the total volume of water (2.635 million m3) retained in the Strzelin quarry lakes [49] by 4.6% and a decrease in the volume of water retained in the reservoirs, ponds, and Strzelin quarry lakes in the catchment of the Oława River (5.297 million m3) and the balance catchment WR09 Nysa Kłodzka (107.595 million m3) [49], by 2.2% in the catchment of the Oława River and by 0.1% in the balance catchment WR09 Nysa Kłodzka. It should be emphasised that the major part of the total volume of water resources retained in the Strzelin quarry lakes is retained in quarry lakes that are situated in active quarries (Strzelin, Sobótka, Gębczyce, and Jegłowa), which account for about 70% of the retained water [49]. However, these lakes are characterised by high dynamics, due to the periodical discharges of the retained water [20,47,49].
3.2. The Quality of Water Retained in Closed Strzelin Granite Quarries
3.2.1. The pH
The pH of the water from flooded quarries fell into the range 7.1–9.3 (Table 3). The average pH values fell into the range of 7.61–7.98 (Figure 3), where the highest values (pH 9.0 and 9.3) were noted in the eutrophic [46,135] granite quarries Q3 and Q5. Such pH values were noted in the spring and summer, which means that they are probably linked to strong photosynthesis in the summer season, where a rapid growth of phytoplanctone and intensified photosynthesis may lead to alkalinisation and, thus, an increase in the pH of the water [136,137]. Similar results (pH 7.7–8.4 (max. 9.7)) were obtained by other authors in flooded marble, limestone, and quartzite quarries in Poland [21,30,40,46,79] and the USA [138]. The average values of pH in the analysed quarry lakes fell into the range that is characteristic for natural lakes (pH 6.5–8.5). However, in most of the analysed quarry lakes (with the exception of Q2) pH values exceeding 8.5 were noted at least once, and in quarries Q3 and Q5 these values reached or even exceeded pH 9.0. The average pH values fell into the range of pH 6.5–8.4, which is recommended by the FAO [114] for waters used for irrigation. However, in each of the analysed quarry lakes, the pH value reached or even exceeded the maximum acceptable level according to the FAO at least once. This happened most often in quarry lakes Q3 and Q5. The average reaction values were below the value of pH 8.0 that is recommended for irrigation in Poland (PL) [115,116]. However, in 60% of the analysed water samples (usually in the summer) pH values above 8.0 were noted, usually in quarry lakes Q2, Q3, Q5, and Q6.
3.2.2. The Electrical Conductivity of Water
The water in the analysed quarry lakes is characterised by low ECw, below 0.5 mS × cm−1 (Table 3), which is characteristic of 80% of lakes [139,140]. In the analysed quarry lakes, the average value of ECw fell into the range 0.194–0.456 mS × cm−1 (Figure 3). The maximum value of 0.481 mS × cm−1 was noted for Q5 (Table 3). The selected Strzelin quarry lakes are characterised by ECw values below 0.7 mS × cm−1 [21,46]. Mine or quarry lakes are often salinized, with the consequence that the ECw exceeds 1 mS × cm−1, reaching 3 mS × cm−1. and even exceeding 20 mS × cm−1 [32,35,40,51,52]. For example, the ECw in marble and limestone quarry lakes ranges from 0.481–0.653 mS × cm−1 [21,30,46], while in a silica sand quarry lake it is 1.2 mS × cm−1 [18], and in quartzites and quartzitic sandstones quarry lakes 1.10–5.57 mS × cm−1 [141]. The selected Strzelin quarry lakes (Poland) are characterised by ECw values below 0.7 mS × cm−1 [21,46]. According to the guidelines on the suitability of water for irrigation [116], water in quarry lake Q6 had a low degree of salination (0–0.25 mS × cm−1), and the other flooded granite quarries are characterised by a medium degree of salination (0.25–0.75 mS × cm−1).
3.2.3. The Total Dissolved Solids and the Sodium Adsorption Ratio
The value of the TDS indicator fell into the range of 115.2–307.8 mg/L. with average values in the range of 123.9–291.8 mg/L (Figure 3). The highest values were noted (Table 3) in quarry lake Q5 (on average 291.8 mg/L; range 277.12–307.8 mg/L), while the lowest ones were found in Q6 (on average 123.9 mg/L; range 115.2–128.6 mg/L). The SAR index of the waters in the analysed quarries fell into the range of 0.22–1.21 (Table 3), with the average values ranging from 0.30–1.08 (Figure 3). The water in all analysed quarry lakes does not exceed the value of ECw 0.7 mS × cm−1 and TDS 450 mg/L, which means that it may be used for irrigation without any restrictions [112,113,116]. However assessment of the sodium hazard of irrigation water based on SAR and ECw, evaluated using ECw and SAR together [112,113,114], demonstrates that, in spite of a low SAR index (<3) of the analysed water reservoirs and low ECw values (0.2–0.7 mS × cm−1), the waters from quarry lakes Q1–Q5 may be subject to slight to moderate restrictions, and from quarry lake Q6 (<0.2 mS × cm−1) even severe restrictions in using water for irrigation, in particular for specific types of crops and soils, e.g., if applied to soils containing more than 30% smectite clay [112].
3.2.4. The Biological Oxygen Demand Index (BOD5)
The average value of the BOD5 index fell into the range of 1.10–4.02 mgO2/L (Figure 3, Table 3), and the highest concentrations were noted in the flooded closed quarry Q5 (average 4.02 mgO2/L, max 5.80 mgO2/L). The higher values of BOD5 were noted in the spring and summer, which means that they are probably linked to the surface runoff, because in the spring and summer snowmelt and more intensive rainfall usually occur. These values were similar to those noted in natural lakes or artificial water reservoirs in Poland [46,142,143] and demonstrated that contamination with organic substances was low. Significant fluctuations and the highest values of BOD5 that were found in quarry lakes Q1, Q3–Q5 may point to high productivity and eutrophication of their waters [46,142]. As the BOD5 value in the analysed quarry lakes was below 12.0 mgO2/L, their waters may be used for irrigation [115].
3.2.5. Nitrates
In the analysed quarry lakes, the average nitrate content in the water fell into the range of 0.43–2.25 mgNO3−/L (Figure 4), where in Q3 no nitrates at all were found in the spring of 2017 (Table 3), and the highest value of 5.14 mg NO3−/L was noted in Q1 (Table 3). In the different analysed quarries, higher contents of nitrates were noted in different seasons of the year: in Q1 and Q4 in the summer and autumn, in Q2, Q3, Q5 in the spring and summer, and in Q6 in the summer and winter. The obtained results show that the higher content of nitrates in quarries was observed in summer, but high concentrations of nitrates were also noted in other seasons of the year. This subject requires further research. In most cases (Q2–Q6), the content of nitrates in the waters of the analysed quarry lakes was similar to the concentrations that were found in other Strzelin quarry lakes (Poland)—0.30–0.58 mg NO3−/L [21,46] and lower than the values noted in post-mining lakes—0.824–1.771 mg NO3−/L) [21,35,40,46]. Moreover, it was several times lower than in artificial water reservoirs (1.7–26.0 mg NO3−/L) [110,144] or natural lakes (0.44–32.27 mg NO3−/L) [140,142]. The concentration of nitrates in the waters of quarry lake Q-1 (average 2.25 mgNO3−/L) diverged from the nitrate content values found in the other quarry lakes analysed here, and from some of the analysis results noted for other Strzelin quarry lakes (Poland) [21,46]. The flooded Q1 quarry is situated in an urban area, in the vicinity of an active mine (where excavations are conducted with use of explosives) and a sugar factory (remnants of deposit tanks) as well as intensively cultivated fields. The higher concentration of nitrates in the water is likely to result from washing out the residue of explosive materials to the water reservoir, as well as superficial and underground supply from the surrounding area [21,46,51]. However, the content of nitrates in the waters of the analysed quarry lakes (Table 3) does not exceed 5 mgN-NO3−/L. and thus, according to the guidelines concerning the influence of nitrate content on the usability of water for irrigation [113,114,116], the water may be used without any limitations.
3.2.6. Sulphates
The average sulphate content in the waters of the analysed quarry lakes fluctuated in the range 143.18–233.48 mgSO42−/L (Figure 4). The lowest measured value (5.80 mgSO42−/L) was found in quarry Q6 (Table 3), while the highest one (626.60 mgSO42−/L) in quarry Q4 (Table 3). Higher values of sulphates were noted in the winter and spring. This is probably linked to snow fall and rainfall, because acid rains occurred in Strzelin County in the winter and spring season [145]. These values are similar to the concentrations of sulphates that are found in natural lakes: 0.7–186.4 mgSO42−/L [51,142,146] and in the waters of flooded mines (quarries) of rock materials, the concentration values fluctuated in the range of 236–503 mgSO42−/L [18,21,40]. The content of sulphates in the analysed quarry lakes was lower than the values noted in mine lakes in metal ore excavation pits, where it fell into the range of approx. 400–25,000 mgSO42−/L [18,51]. On the other hand, the concentration of sulphates in mine lakes in open-cast lignite and coal mines varied significantly within the range of approx. 30–100 mgSO42−/L [18,35], 230–770 (900) mgSO42−/L [32,35,42,52], 1800–2600 mgSO42−/L [42,44], reaching even up to 25,000 mgSO42−/L [18]. The concentration of sulphates in the analysed Strzelin quarry lakes is significantly lower than the values in the waters of acidic lakes that emerged in coal mining pits, especially lignite mines. The average concentration of sulphates in the waters of the analysed quarry lakes allows us to consider that they meet the requirements for being used in irrigation. However, the maximum values that were noted in April 2017 exceeded the maximum acceptable limit of 400 mgSO42−/L [115].
3.2.7. Chlorides
The average content of chlorides in the analysed quarry lakes fell into the range from 15.20 to 56.92 mgCl−/L (Figure 4). Higher concentrations of chlorides were noted in the summer and spring. The lowest values, in the range of 13.40–16.60 mgCl−/L, were noted in quarry Q2 (Table 3), and the highest ones, ranging from 47.60 to 60.40 mgCl−/L, in quarry Q3 (Table 3). At the same time, the content of chlorides in natural lakes fell into the range of 70–100 mgCl−/L [142,146], while in quartzite schist, marble and limestone quarry lakes this content was, respectively, 22.04 mgCl−/L–39.44 mgCl−/L [21] and 175 mgCl−/L [40], and in mine lakes in metal ore excavation pits it ranged, approximately, from 2.2 to 2.8 mgCl−/L [51], while in lignite mine lakes from 0 to 100 mgCl−/L [35]. In coal mine lakes, the values fell into the range of 780–880 mgCl−/L [32]. The concentration of chlorides in the analysed Strzelin quarry lakes was below the threshold value (400 (300 for greenhouses) mgCl−/L) defined in the Polish Norm [115,116] and did not exceed the threshold value of (140 (100 for sprinkler irrigation) mgCl−/L) as provided in the FAO Guidelines [113,114]. This means that no restrictions apply for the use in irrigation and the water met the requirements that enable it to be used in irrigation in terms of chloride content.
3.2.8. Sodium
The average sodium content in the analysed quarry lakes fluctuated in the range of 8.54–29.20 mgNa+/L (Figure 4). The higher concentrations of sodium were noted in the spring and summer. The highest values, ranging from 23.90 to 33.80 mgNa+/L, were noted in quarry Q5 (Table 3), and the lowest ones, between 5.90 and 10.00 mgNa+/L), in quarry Q4 (Table 3). In quarry lakes Q1, Q2, Q4, and Q6, the content of sodium ions was similar to the average concentration (10–11 mgNa+/L) in natural Polish lakes [147], whereas in Q3 and Q5 it fell into the lower ranges of threshold sodium concentrations (~21.0–60.0 mgNa+/L) noted in quarry lakes and quarry ponds [148]. In the analysed quarry lakes, the concentration of sodium ions was decidedly lower than that noted for coal mine lakes ~450 mgNa+/L [32]. At the same time, it was lower than the content of sodium ions found in retention reservoirs (~45–55 mgNa+/L) that are used for irrigation [149] and significantly lower than the concentration of sodium ions in certain lakes (~138–178 mgNa+/L) that are the source of water for irrigation [149]. Although the concentration of sodium in the waters of the analysed quarry lakes is relatively low, the application of these waters in surface irrigation will be subject to severe restrictions on use for Q1–Q3, Q5–Q6 and for Q4 to slight to moderate restrictions, due to their toxicity for certain types of crops [113,114]. However, the water from the analysed quarry lakes may be used for sprinkler irrigation without any limitations [113,114]. The water from the analysed quarry lakes contained less than 140 mgNa+/L, which means that it meets the requirements provided in the Polish Norm [115], and the requirements for usability in irrigation defined in the study by Kaniszewski and Treder [116]. The concentration of sodium ions was the basis for the determination of the SAR index which was discussed above.
3.2.9. Calcium
In the waters of the analysed quarry lakes, the mean calcium content fell into the range of 21.44–52.84 mgCa2+/L (Figure 4). The highest concentrations (47.30–58.60 mgCa2+/L) of calcium were found in Q4 (Table 3), and the lowest ones (21.00–22.60 mgCa2+/L) in Q6 (Table 3). The higher content of calcium was noted in the spring. The other Strzelin quarry lakes have rather poor calcium content [21,46]. In most of the discussed cases (quarry lakes Q1–Q4), the observed values of calcium content were similar to the lowest values noted in natural lakes (~50.0–124.0 mgCa2+/L) or even lower (Q5–Q6) [142,147,150]. They were also below the bottom threshold of calcium content (~50–180 mgCa2+/L) that was noted in other quarry lakes or quarry ponds in [21,32,40,148]. Additionally, the concentrations of calcium that were noted in the analysed quarry lakes were similar to the values found in a retention reservoir that is used for irrigation (~15–37 mgCa2+/L), and, at the same time, lower than the concentrations (~132–161 mgCa2+/L) noted in a natural lake that is also used for irrigation [149]. The calcium content in the analysed quarry lakes (Q1-Q6) was higher than in some of the coal mine lakes ~6.0–35.0 mgCa2+/L [18,32]. However, some coal and lignite mine lakes were characterised by higher concentrations of ~100–500 mgCa2+/L [18,35]. On the other hand, in mine lakes that emerged in metal ore excavation pits, the calcium load fell into the range of approx. ~330–1120 mgCa2+/L [18], which was decidedly higher than in the analysed Strzelin granite quarry lakes. The calcium ion content was also used to determine the SAR index discussed in another section of this article.
3.2.10. Magnesium
The average magnesium content in the analysed quarry lake waters fell into the range of 3.08–12.62 mgMg2+/L (Figure 4). In the analysed quarries, the concentrations of magnesium were similar in all seasons of the year. The highest average loads (11.90–13.70 mgMg2+/L) were noted in Q5 (Table 3), and the lowest ones (2.90–3.50 mgMg2+/L) in Q6 (Table 3). The magnesium concentrations noted in selected natural lakes in Poland fell into the range of ~9.5–40.0 mgMg2+/L [142,147,150], which allows us to state that the magnesium load in Strzelin quarry lakes was similar to the lower and medium values found in these lakes, and in the lower ranges of calcium load (~4–58 mgMg2+/L) that were observed in other quarry lakes or quarry ponds [21,40,148]. Additionally, they were lower than or similar to the concentrations of magnesium (~14–20 mgMg2+/L) noted in the retention reservoir and lower than the concentration (~24–45 mgMg2+/L) found in a natural lake, where both the reservoir and the lake were used for irrigation [149]. The magnesium load in quarry lakes Q1–Q6 was lower than or similar to the lower values observed in certain coal and lignite mine lakes (~10–200 (2240) mgMg2+/L) and significantly lower than the high and maximum values [18,32,35]. The magnesium load that was found in mine lakes that emerged in metal ore excavation pits (~860–1240 (3150) mgMg2+/L) was even several hundred times higher [18] than the concentrations observed in the analysed Strzelin quarry lakes. The magnesium ion content was also used to determine the SAR index discussed above.
3.2.11. Iron
The average iron content in the analysed quarry lakes fell into the range of 0.002–0.255 mg Fe/L (Table 3). The higher content of iron was noted in the winter. The highest value (0.620 mg mg Fe/L) was noted in quarry lake Q1. In 33% of the analysed samples, no presence of iron was detected at all, while in four analysed samples from Q3 iron was not found, and in Q1 and Q4 the presence of iron was detected in all the analysed samples. Similar loads of iron (0.016–0.5 mg Fe/L) were noted in natural lakes [142,151]. However, in some cases, the concentration of iron (3.93–49.0 mg Fe/L) in lake waters was higher than that in the analysed quarry lakes [42,152], similar to the concentrations of iron (0.062–12.0 mg Fe/L) that were noted in artificial water reservoirs [153,154]. Research on the iron load in the waters of a silica sand quarry lake in Poland revealed a concentration of 0.14 mg Fe/L [18], while in quartzites and quartzitic sandstone quarry lakes the value fell into the range of 5.2–23.3 (860) mg Fe/L [141], which was significantly higher than in the analysed quarry lakes (Q1–Q6). However, in the other analysed Strzelin quarry lakes: quartzite schist (average 0.078 mg Fe/L), granite (average 0.016 mg Fe/L) marble (average 0.040 mg Fe/L) [21], the concentration of iron in the water was usually similar. The iron loads in flooded inactive metal ore excavation pits quite often reached 2.5–3.23 mg Fe/L or even up to 248 mg Fe/L [18,51], with the lower values in the range of 0.05–0.575 mg Fe/L [18], i.e., similar to the values noted in the analysed Strzelin quarry lakes. On the other hand, the iron loads measured in coal and lignite mine lakes ranged from 14.2–206.0 mg Fe/L to 690.0–2463.248 mg Fe/L [18,42,44], although in certain objects the values were decidedly lower, ranging from 0.003–1.1 mg mg Fe/L [18,32,35,42,45]. Values similar to these lower ranges were obtained in the Strzelin quarry lakes. The water from the analysed quarry lakes met the requirements of the FAO (<5.0 mg Fe/L [114]) as well as those provided in the Polish Norm (<10.0 mg Fe/L [115]) in terms of iron content, which means that the water may be used for irrigation. Occasionally, in quarry lakes Q1, Q2, and Q3, iron loads in the range of 0.1–1.5 mg Fe/L were noted. This implies slight to moderate restrictions to use in drip irrigation due to the possibility of clogging the drip nozzle [113,116]. However, in most of the cases, the water in the analysed quarry lakes was characterised by concentrations below <0.1 mg Fe/L, which means that it is less likely to clog the drip nozzle and that drip irrigation may be applied without any restrictions [113,116].
3.2.12. Manganese
The average manganese content in the analysed quarry lakes in the Strzelin area fell into the range of 0.024–0.200 mgMn/L (Table 3). A higher content of manganese was noted in the winter. The highest values were noted in quarry lake Q1: 0.51 mgMn/L (Table 3). In the summer of 2017, the presence of manganese was not detected in quarry lakes Q1–Q3 and Q6. The concentration of manganese in the analysed waters (Table 3) was similar to the content (0.007–0.200 (1.32) mgMn/L) noted in natural lakes [151,152]. Higher manganese loads than in the analysed quarry lakes (~4.5–81 mgMn/L) were found in the waters of quarry lakes that emerged in metal ore mines [18,51]. The concentration of manganese in mine lakes that were formed in coal and lignite mines fell into the range of 0.0002–1.8 mgMn/L, reaching up to 11.8–13.0 mgMn/L or even 150.0 mgMn/L [18,35,45,155], where the values above 0.55 mgMn/L significantly exceed those noted in the analysed Strzelin quarry lakes. In other Strzelin quarry lakes: quartzite schist (average 0.030 mgMn/L), granite (average 0.008 mgMn/L), and marble (average 0.090 mgMn/L) [21], the values of manganese load in the water were mostly similar to or lower than the results obtained in the analysed quarry lakes. On the other hand, in quartzite and quartzitic sandstone quarry lakes it fell into the range of 1.062–6.317 mgMn/L [141], which was higher than in the analysed quarry lakes. In the silica sand quarry lake, the manganese load was <0.01 mgMn/L [18] and was similar to most of the results from individual samples, although it was lower than the average values in the analysed Strzelin quarry lakes. The water from the analysed quarry lakes met the requirements of the Polish Norm (<0.08 mgMn/L) [115] in terms of manganese load, which means that it may be used for irrigation. As far as the FAO requirements are concerned (<0.2 mgMn/L [114]), the water in quarry lake Q1 (in terms of the average (0.200 mgMn/L) and maximum value (0.510 mgMn/L)) did not meet the requirements that would enable its use for irrigation. Some individual samples from quarry lakes Q3–Q5 (maximum values of 0.370 mgMn/L, 0.120 mgMn/L, and 0.390 mgMn/L, respectively) did not meet the requirements provided in the FAO Gguidelines for water to be used in irrigation, either. Moreover, in quarry lakes Q1 and, occasionally, in Q3, manganese loads in the range of 0.1–1.5 mgMn/L were noted. This implies slight to moderate restrictions to use in drip irrigation due to the possibility of clogging the drip nozzle [113,116]. On the other hand, in quarry lake Q2 and in most cases, in Q3–Q6, the manganese load in the water from the analysed quarry lakes was <0.1 mgMn/L, which means that it was less likely to clog the drip nozzle and that water may be used for drip irrigation without any limitations [113,116].
3.3. The Comparison of Selected Water Indicators of the Strzelin Quarry Lakes vs. Other Mine Lakes and Quarry Lakes and Ponds
The water quality indicators of the analysed quarry lakes were decidedly lower in comparison to those in quarry lakes and quarry ponds, pit lakes and mine lakes, in particular acidic mining lakes, in Poland [21,30,40,46,79,141,148] and other countries, for example: Germany [35,42,155], Australia [18,32,45], Sweden [51], France [52] and the USA [138]. The range of the averages values and concentrations of water indicators in selected Strzelin quarry lakes—closed granite quarries (gSQLs) vs. other mines lakes, and quarry lakes and ponds, was presented in Table 4.
3.4. The Evaluation of the Usability of Quarry Lake Water for Irrigation
The average pH of the water in the analysed quarry lakes did not exceed pH 8.0. However, periodically (typically in the summer) it exceeded pH 8.5, usually in the eutrophic quarry lakes Q3 and Q5. The average pH values met the requirements of the recommended Polish standards of the quality of water used in irrigation and were in the pH range recommended by the FAO (Table 5). However, the average pH value indicates medium restrictions in using water for drip irrigation due to the probability of clogging the nozzles (Table 5). It should be noted that in 60% of the analysed water samples (usually in the summer), pH values above 8.0 were noted, mainly in quarry lakes Q2, Q3, Q5, and Q6. The water in the analysed quarry lakes is characterised by low and medium salination (ECw < 0.5 mS × cm−1), and therefore does not require any restrictions in use connected with salination. Thus, it meets the requirements for usability in irrigation according to the FAO Gguidelines and the standards that are applicable in Poland (Table 5). The value of the TDS index in the analysed quarry lakes does not exceed 450 mg/L, and therefore does not indicate the need to apply any restrictions connected with the risk of salination or restrictions in the use of water for drip irrigation resulting from the risk of clogging the nozzles (Table 5). The assessment of the usability of water for irrigation revealed a low sodium hazard in irrigation water based on SAR. However, the assessment of sodium hazard in irrigation water based on SAR and ECw suggests severe restrictions in using water from Q6 for irrigation and slight to moderate restrictions in using the water from quarry lakes Q1–Q5 for irrigation. According to the FAO Guidelines, the sodium content points to severe restrictions on using the water from quarry lakes Q1–Q3 and Q5–Q6 for surface irrigation and slight to moderate restrictions on using the water from quarry lake Q4 for surface irrigation (Table 5) due to its potential toxicity for certain types of crops. However, neither restrictions are required for the use of water in sprinkler irrigation. The average concentrations of water quality parameters: BOD5, nitrates, sulphates, manganese, and iron meet the requirements and recommendations provided in the applicable Polish standards and the FAO Guidelines (Table 5). On the other hand, the concentration of iron and manganese in quarry lake Q1 and of manganese in quarry lake Q5 points to medium restrictions in using the water in drip irrigation due to the likelihood of clogging the drip nozzles (Table 5).
4. Summary and Conclusions
The analysed quarry lakes were formed in inactive granite quarries, as a result of flooding, mainly with rainwater, surface runoff and underground discharge from the direct catchment of the quarries. They are characterised by relatively low surface areas (0.1–2.93 ha) and varied depth, although, considering the maximum depths of 4.3–28.4 m, they may be considered as relatively deep. The volume of water in the analysed reservoirs, determined based on bathymetric measurements, indicates that the volume of water retained in specific pits of inactive quarries is relatively low and falls into the range from 1.7 thousand m3 to 122.7 thousand m3. The total volume of water retained in the analysed quarry lakes amounts to 307.8 thousand m3, which constitutes a significant element in the retention capacity balance of the water reservoirs, ponds, and Strzelin quarry lakes, particularly in those objects that are located in the catchment of the Oława River (10.6%).
The performed calculations of the volume of water retained in the quarry lake based on field bathymetric studies and geospatial analysis allowed for the verification of the volume of water determined with use of the algorithm [49]. For the Strzelin quarry lakes that are located in granite quarries which were closed about 20 years ago, it was proposed to reduce the volume of water calculated with use of the algorithm by 35.8%. As a result, the differences between the water volume calculated in this way and that obtained in field bathymetric measurements will decrease to approximately 7%.
Most of the analysed quarry lakes are located in agricultural or forest areas, but none of them are a source of water supply for agricultural irrigation. Taking the quarry lakes into account in the balance of reservoir water retention that is prepared by water authorities will enable us to include them in the water management programmes, the actions related to the development and renovation of the infrastructure for distributing water from quarry lakes to potential places of use. However, due to their location, the potential use of the analysed quarry lakes in water management will be mainly of local importance. The cost of building infrastructure to transport the water over longer distances, e.g., outside Strzelin County, may be too high and economically unjustified. The focus on the potential of the water retention possibilities offered by quarries and the good quality of water retained in quarry lakes should translate into the appropriate water management of quarries that are being shut down. This may be quite important, not only from the local aspect but also from the regional point of view, as, for example, Lower Silesia is home to dozens of active quarries as well as hundreds of inactive ones, some of which are flooded.
The quality of water in the analysed quarry lakes was similar to the parameters of natural lakes and unloaded artificial water reservoirs. At the same time, the water quality indicators were decidedly lower in comparison to those in most mine lakes, in particular acidic mining lakes. Most of the quality parameters in the analysed quarry lakes met the Polish and international requirements provided in the guidelines on the usability of water for irrigation.
The conducted research allowed the authors to formulate the following conclusions:
- The total volume of water retained in the analysed quarry lakes (307.8 thousand m3), constitutes a significant element in the retention capacity balance of the water reservoirs, ponds, and Strzelin quarry lakes that are located in the catchment of the Oława River (10.6% of the total capacity).
- The quarry lakes discussed in this study were characterised by values of water quality parameters that are similar to those of natural lakes. A major part of the quality parameters in the analysed quarry lakes met most of the Polish and international requirements provided in the guidelines on the usability of water for irrigation.
- All quarry lakes were characterised by low sodium hazard of irrigation water based on SAR. However, quarry lakes show the assessment of sodium hazard of irrigation water based on SAR and ECw, where water from quarry lakes Q1–Q5 should be subject to slight to moderate restrictions in the use for irrigation, and water from Q6 to severe restrictions in such use.
- In terms of the assessment of potential toxicity, the noted sodium content points to no need to apply any restrictions in the use of the water from the analysed quarry lakes for sprinkler irrigation, and severe restriction on the use of water from quarry lakes Q1–Q3 and Q5–Q6 for surface irrigation, as well as slight to moderate restriction on the use of water from quarry lake Q4 for surface irrigation.
- The concentrations of manganese and iron in lake Q1, manganese in Q5, and the pH values in Q1–Q6 point to medium restrictions in the use of water for drip irrigation, connected with the risk of clogging the drip nozzles.
5. Limitations
The conducted research allowed us to estimate the static water resources retained in the analysed open-mine pits. In order to determine their actual usability for agricultural irrigation, complete balance analyses are required that will allow the determination of the potential capacity and the principles of usage taking into consideration the rate of recreation of the retained water resources. A precise quantitative estimation will be possible if top-class measuring equipment is used, which will allow for the creation of 3D models of a higher level of precision and detail. The assessment of the hydrological and chemical parameters should be extended to include samples collected at various depths.
Author Contributions
Conceptualization, B.J.; methodology, B.J. and T.K.; software, B.J. and T.K.; validation, B.J.; formal analysis, B.J.; investigation, B.J.; resources, B.J.; data curation, B.J. and T.K.; writing—original draft preparation, B.J.; writing—review and editing, B.J. and T.K.; visualization, B.J. and T.K.; supervision, B.J.; project administration, B.J.; funding acquisition, B.J. and T.K. All authors have read and agreed to the published version of the manuscript.
Funding
The APC/BPC is financed/co-financed by Wroclaw University of Environmental and Life Sciences.
Data Availability Statement
All data generated during this study are included in this published article. The data (DTM and orthophotomaps) were made available for authors upon a licence by the Chief Land Surveyor of the Country, Warsaw, Masovian Voivodeship, Poland (licence No. DIO.7211.160.2018_PL_N, DIO.7211.204.2019_PL_N). Currently, the ortophotomaps and DTM are made available free of charge according to to art. 40a of the Act-Geodesic and Cartographic Law [Journal of Laws of 2021, item 1990 including further amendments] by the Chief Land Surveyor of the Country, on the Geoportal of Spatial Information Infrastructure guided by the Head Office of Geodesy and Cartography (https://mapy.geoportal.gov.pl/imap/Imgp_2.html?gpmap=gp0 (accessed on 1 October 2022)).
Acknowledgments
The subject of the article was presented at the 5th Scientific and Technical Conference: Exploitation and Impact of Water Reservoirs. 28–30 September 2022, Mikorzyn-Jeziorsko, Poland.
Conflicts of Interest
The authors declare no conflict of interest.
References
- Domashenko, Y.; Vasilyev, S. Agroecological Substantiation for the Use of Treated Wastewater for Irrigation of Agricultural Land. J. Ecol. Eng. 2018, 19, 48–54. [Google Scholar] [CrossRef]
- Guppy, L.; Anderson, K. Water Crisis Report; United Nations University Institute for Water, Environment and Health: Hamilton, ON, Canada, 2017. [Google Scholar]
- EEA Report No 2/2009. Water Resources across Europe—Confronting Water Scarcity and Drought; Office for Official Publications of the European Communities: Luxembourg, 2009. [CrossRef]
- Statistics Poland. Environment 2021; Statistics Poland: Warszawa, Poland, 2021. [Google Scholar]
- Central Statistical Office. Environment 2016; Central Statistical Office: Warszawa, Poland, 2016. [Google Scholar]
- Central Statistical Office. Environment 2017; Central Statistical Office: Warszawa, Poland, 2017. [Google Scholar]
- Statistics Poland. Environment 2018; Statistics Poland: Warszawa, Poland, 2018. [Google Scholar]
- Statistics Poland. Environment 2019; Statistics Poland: Warszawa, Poland, 2019. [Google Scholar]
- Statistics Poland. Environment 2020; Statistics Poland: Warszawa, Poland, 2020. [Google Scholar]
- Łabędzki, L. Actions and measures for mitigation drought and water scarcity in agriculture. J. Water Land Dev. 2016, 29, 3–10. [Google Scholar] [CrossRef] [Green Version]
- Walczykiewicz, T. Scenarios of water resources development in Poland up to 2030. Water Resour. 2014, 41, 763–773. [Google Scholar] [CrossRef]
- Dz.U. 2021, poz. 1615. Plan przeciwdziałania skutkom suszy (Journal of Laws 2016, item 1178. Drought Effects Counteracting Plan). Available online: https://dziennikustaw.gov.pl/DU/rok/2021/pozycja/1615 (accessed on 5 April 2022).
- Patro, M.; Zubala, T. Possibilities of shaping the water retention in agricultural landscape. Teka Kom. Ochr. Kszt. Środ. Przyr.—OL PAN 2012, 9, 143–152. [Google Scholar]
- Tarjuelo, J.M.; De-Juan, J.A.; Moreno, M.A.; Ortega, J.F. Review. Water resources deficit and water engineering. Span. J. Agric. Res. 2010, 8, 102–121. [Google Scholar] [CrossRef]
- Lykhovyd, P.V.; Lavrenko, S.; Lavrenko, N.; Dementiieva, O. Agro-environmental evaluation of irrigation water from different sources, together with drainage and escape water of rice irrigation systems, according to its impact on maize. J. Ecol. Eng. 2019, 20, 1–7. [Google Scholar] [CrossRef]
- Doupé, R.G.; Lymbery, A.J. Environmental Risks Associated with Beneficial End Uses of Mine Lakes in Southwestern Australia. Mine Water Environ. 2005, 24, 134–138. [Google Scholar] [CrossRef]
- McCullough, C.D.; Lund, M.A. Opportunities for sustainable mining pit lakes in Australia. Mine Water Environ. 2006, 25, 220–226. [Google Scholar] [CrossRef]
- Kumar, R.N.; McCullough, C.D.; Lund, M.A. Water Resources in Australian Mine Pit Lakes. Min. Technol. 2009, 118, 204–211. [Google Scholar] [CrossRef]
- Ravazzani, G.; Giudici, I.; Schmidt, C.; Mancini, M. Evaluating the Potential of Quarry Lakes for Supplemental Irrigation. J. Irrig. Drain. Eng. 2011, 137, 564–571. [Google Scholar] [CrossRef]
- Jawecki, B.; Dąbek, P.B.; Pawęska, K.; Wei, X. Estimating water retention in post-mining excavations using LiDAR ALS data for the Strzelin Quarry, in Lower Silesia. Mine Water Environ. 2018, 37, 744–753. [Google Scholar] [CrossRef] [Green Version]
- Jawecki, B.; Kowalczyk, T.; Feng, Y. The evaluation of the possibility to use water from quarry lakes for irrigation. J. Ecol. Eng. 2019, 20, 188–201. [Google Scholar] [CrossRef]
- Staniszewski, R.; Frankowski, P.; Kayzer, D.; Zbierska, J.; Achtenberg, K. Reconstruction of Ancient Lake after Peat Excavation—A Case Study about Water Quality. Appl. Sci. 2021, 11, 4213. [Google Scholar] [CrossRef]
- Cherlet, M.; Hutchinson, C.; Reynolds, J.; Hill, J.; Sommer, S.; von Maltitz, G. (Eds.) World Atlas of Desertification; Publication Office of the European Union: Luxembourg, 2018. [Google Scholar]
- Chen, Z.; Yang, Y.; Zhou, L.; Hou, H.; Zhang, Y.; Liang, J.; Zhang, S. Ecological restoration in mining areas in the context of the Belt and Road initiative: Capability and challenges. Environ. Impact Assess. Rev. 2022, 95, 106767. [Google Scholar] [CrossRef]
- Castendyk, D.; Eary, T. The nature and global distribution of pit lakes. In Mine Pit Lakes: Characteristics, Predictive Modeling, and Sustainability; Castendyk, D., Eary, T., Park, B., Eds.; Society for Mining Engineering: Englewood, CO, USA, 2009; pp. 1–11. [Google Scholar]
- Kasztelewicz, Z. Rekultywacja Terenów Pogórniczych w Polskich Kopalniach Odkrywkowych; (Reclamation of Post-Mining Areas in Polish Open-Cast Mines); Fund. Nauka i Tradycje Górn; AGH: Kraków, Poland, 2010. [Google Scholar]
- McCullough, C.D.; Schultze, M.; Vandenberg, J. Realizing Beneficial End Uses from Abandoned Pit Lakes. Minerals 2020, 10, 133. [Google Scholar] [CrossRef] [Green Version]
- Singleton, V.L.; Jacob, B.; Feeney, M.T.; Little, J.C. Modeling a Proposed Quarry Reservoir for Raw Water Storage in Atlanta, Georgia. J. Environ. Eng. 2013, 139, 70–78. [Google Scholar] [CrossRef]
- Ceppi, A.; Ravazzani, G.; Corbari, C.; Salerno, R.; Meucci, S.; Mancini, M. Real-time drought forecasting system for irrigation management. Hydrol. Earth Syst. Sci. 2014, 18, 3353–3366. [Google Scholar] [CrossRef] [Green Version]
- Czerniawska-Kusza, I.; Brożonowicz, A. Zoobenthos in post-exploitation reservoirs of marls and limestone in Opole Silesia. Pol. J. Nat. Sci. 2014, 29, 307–318. [Google Scholar]
- Soni, A.K.; Mishra, B.; Singh, S. Pit lakes as an end use of mining: A review. J. Min. Environ. 2014, 5, 99–111. [Google Scholar]
- Kumar, N.R.; McCullough, C.D.; Lund, M.A.; Larranaga, S.A. Assessment of factors limiting algal growth in acidic pit lakes—A case study from Western Australia, Australia. Environ. Sci. Pollut. Res. 2016, 23, 5915–5924. [Google Scholar] [CrossRef]
- Molenda, T.; Ciupa, T.; Suligowski, R. The properties of reservoir water in post-mining excavations of Cambrian and Devonian quartzite sandstones (Holy Cross Mountains). Environ. Earth Sci. 2020, 79, 310. [Google Scholar] [CrossRef]
- Sakellari, C.; Roumpos, C.; Louloudis, G.; Vasileiou, E. A Review about the Sustainability of Pit Lakes as a Rehabilitation Factor after Mine Closure. Mater. Proc. 2021, 5, 52. [Google Scholar] [CrossRef]
- Schultze, M.; Pokrandt, K.-H.; Hille, W. Pit lakes of the Central German lignite mining district: Creation, morphometry and water quality aspects. Limnol. (Limnol.—Ecol. Manag. Inland Waters) 2010, 40, 148–155. [Google Scholar] [CrossRef] [Green Version]
- Szczepański, J. The significance of groundwater flow modeling study for simulation of opencast mine dewatering, flooding, and the environmental impact. Water 2019, 11, 848. [Google Scholar] [CrossRef] [Green Version]
- Oszkinis-Golon, M.; Frankowski, M.; Jerzak, L.; Pukacz, A. Physicochemical Differentiation of the Muskau Arch Pit Lakes in the Light of Long-Term Changes. Water 2020, 12, 2368. [Google Scholar] [CrossRef]
- Brugam, R.B.; Chakraverty, S.; Lamkin, J. Sediment chemistry of lakes formed by surface-mining for coal in the midwestern U.S.A. Hydrobiologia 1988, 164, 221–233. [Google Scholar] [CrossRef]
- Axler, R.; Yokom, S.; Tikkanen, C.; McDonald, M.; Runke, H.; Wilcox, D.; Cady, B. Restoration of a Mine Pit Lake from Aquacultural Nutrient Enrichment. Restor. Ecol. 1998, 6, 1–19. [Google Scholar] [CrossRef]
- Galas, J. Limnological Study on a Lake Formed in a Limestone Quarry (Kraków, Poland). I. Water Chemistry. Pol. J. Environ. Stud. 2003, 12, 297–300. [Google Scholar]
- Filippova, K.A.; Deryagin, V.V. Chemical Hydrology of Mine Pit Lakes of the Bakala Geotechnic System (Southern Urals). Water Resour. 2005, 32, 427–433. [Google Scholar] [CrossRef]
- Kleeberg, A.; Grüneberg, B. Phosphorus mobility in sediments of acid mining lakes, Lusatia, Germany. Ecol. Eng. 2005, 24, 89–100. [Google Scholar] [CrossRef]
- Nixdorf, B.; Lessmann, D.; Deneke, R. Mining lakes in a disturbed landscape: Application of the EC Water Framework Directive and future management strategies. Ecol. Eng. 2005, 24, 67–73. [Google Scholar] [CrossRef]
- McCullough, C.D. Approaches to remediation of acid mine drainage water in pit lakes. Int. J. Min. Reclam. Environ. 2008, 22, 105–119. [Google Scholar] [CrossRef]
- Hinwood, A.L.; Heyworth, J.; Tanner, H.; McCullough, C. Recreational use of acidic pit lakes-human health considerations for post closure planning. J. Water Resour. Prot. 2012, 4, 1061–1070. [Google Scholar] [CrossRef] [Green Version]
- Jawecki, B.; Mirski, J. Wstępna ocena zawartości biogenów w wodach zalanych nieczynnych kamieniołomów położonych na terenach wiejskich (Preliminary evaluation of nutrients concentration in quarry lakes located on the rural areas). Inżynieria Ekol. 2018, 19, 1–13. [Google Scholar] [CrossRef]
- Jawecki, B.; Szewrański, S.; Stodolak, R.; Wang, Z. The Use of Digital Terrain Models to Estimate the Pace of Filling the Pit of a Central European Granite Quarry with Water. Water 2019, 11, 2298. [Google Scholar] [CrossRef] [Green Version]
- Chicco, J.M.; Comeau, F.-A.; Casasso, A.; Comina, C.; Giordano, N.; Mandrone, G.; Raymond, J. Alternative Use of Artificial Quarry Lakes as a Source of Thermal Energy for Greenhouses. Water 2021, 13, 3560. [Google Scholar] [CrossRef]
- Jawecki, B. The influence of Strzelin Quarry Lakes on small reservoir retention resources in the regional catchments. Sci. Rep. 2022, 12, 14642. [Google Scholar] [CrossRef]
- Doyle, G.A.; Runnells, D.D. Physical limnology of existing mine pit lakes. Min. Eng. 1997, 49, 76–80. [Google Scholar]
- Ramstedt, M.; Carlsson, E.; Lövgren, L. Aqueous geochemistry in the Udden pit lake, northern Sweden. Appl. Geochem. 2003, 18, 97–108. [Google Scholar] [CrossRef]
- Denimal, S.; Bertrand, C.; Mudry, J.; Paquette, Y.; Hochart, M.; Steinmann, M. Evolution of the aqueous geochemistry of mine pit lakes –Blanzy–Montceau-les-Mines coal basin (Massif Central, France): Origin of sulfate contents, effects of stratification on water quality. Appl. Geochem. 2005, 20, 825–839. [Google Scholar] [CrossRef]
- Molenda, T. Górnicze środowiska akwatyczne—Obiekty obserwacji procesów hydrologiczno-biologicznych (Mining aquatic environments as the objects of hydrological and biological processes). Pr. Nauk. Inst. Górnictwa Politech. Wroc. 2006, 117, 239–250. [Google Scholar]
- Kołodziejczyk, U. Hydrological, geological and geochemical conditions determining reclamation of post—Mine land in the region of Łęknica. Gospod. Surowcami Miner. 2009, 25, 190–201. [Google Scholar]
- Chudzik, W. The process of mined land reclamation in natural aggregate quarries exemplified by the sand and gravel quarry Dębina Łętowska. AGH J. Min. Geoengin. 2012, 36, 89–96. [Google Scholar]
- Tokarczyk-Dorociak, K.; Lorenc, M.W.; Jawecki, B.; Zych-Głuszyńska, K. Post-industrial landscape transformationand its application for geotourism, education and recreation—An example of the Wide Mt. near Strzegom, Lower Silesia/ Poland. Z. Dtsch. Ges. Geowiss. 2015, 166, 195–203. [Google Scholar]
- Bajcar, A.; Szczepiński, J.; Rogosz, B. Bathymetry Surveys of Post-Mining Pit Lakes Formed after Exploitation of Lignite. Mater. Proc. 2021, 5, 117. [Google Scholar] [CrossRef]
- Blanchette, M.L.; Lund, M.A. Aquatic Ecosystems of the Anthropocene: Limnology and Microbial Ecology of Mine Pit Lakes. Microorganisms 2021, 9, 1207. [Google Scholar] [CrossRef]
- van der Graaf, C.M.; Sánchez-España, J.; Yusta, I.; Ilin, A.; Shetty, S.A.; Bale, N.J.; Villanueva, L.; Stams, A.J.M.; Sánchez-Andrea, I. Biosulfidogenesis Mediates Natural Attenuation in Acidic Mine Pit Lakes. Microorganisms 2020, 8, 1275. [Google Scholar] [CrossRef]
- Oszkinis-Golon, M.; Frankowski, M.; Pukacz, A. Macrophyte Diversity as a Response to Extreme Conditions in the Post-Mining Lakes of the Muskau Arch (West Poland). Water 2021, 13, 2909. [Google Scholar] [CrossRef]
- Koźma, J. Anthropogenic landscape changes connected with the old brown coalmining based on the example of the Polish part of the Muskau Arch area. Gór. Odkryw. 2016, 57, 1–13. [Google Scholar]
- McCullough, C.D.; Hunt, D.; Evans, L.H. Sustainable Development of Open Pit Mines: Creating Beneficial End Uses for Pit Lakes. In Mine Pit Lakes: Characteristics, Predictive Modeling, and Sustainability; Castendyk, D.N., Eary, L.E., Eds.; Society for Mining, Metallurgy, and Exploration (SME): Englewood, CO, USA, 2009; pp. 249–268. [Google Scholar]
- Tuheteru, E.J.; Gautama, R.S.; Kusuma, G.J.; Kuntoro, A.A.; Pranoto, K.; Palinggi, Y. Water Balance of Pit Lake Development in the Equatorial Region. Water 2021, 13, 3106. [Google Scholar] [CrossRef]
- Duval, T.P.; Waddington, J.M.; Branfireun, B.A. Towards calcareous wetland creation in flooded abandoned aggregate quarries: A 3-year field mesocosm study. Ecol. Eng. 2010, 36, 586–595. [Google Scholar] [CrossRef]
- Castro, J.M.; Moore, J.N. Pit lakes: Their characteristics and the potential for their remediation. Environ. Geol. 2000, 39, 1254–1260. [Google Scholar] [CrossRef]
- Townsend, F.A.; Helmers, D.P.; Kingdon, C.C.; McNeil, B.E.; de Beurs, K.M.; Eshleman, K.N. Changes in the extent of surface mining and reclamation in the Central Appalachians detected using a 1976–2006 Landsat time series. Remote Sens. Environ. 2009, 113, 62–72. [Google Scholar] [CrossRef]
- Klapper, H.; Geller, W. Water quality management of mining lakes—A new field of applied hydrobiology. Acta Hydrochim. Hydrobiol. 2001, 29, 363–374. [Google Scholar] [CrossRef]
- Krüger, B.; Kadler, A.; Fischer, M. The Creation of Post-Mining Landscapes of Lignite Mining in the New Federal States. Surf. Min.—Braunkohle Other Miner. 2002, 54, 161–169. [Google Scholar]
- Dong-Dong, Z.; Yu-shan, S.; Le, L. Study on sustainable landscape design of abandoned quarries, An example: Zhushan ecological park in Xuzhou. Procedia Earth Planet. Sci. 2009, 1, 1107–1113. [Google Scholar] [CrossRef] [Green Version]
- Cao, X. Regulating mine land reclamation in developing countries: The case of China. Land Use Policy 2007, 24, 472–483. [Google Scholar] [CrossRef]
- Kemmis, T.J.; Bauer, R.A.; Lasemi, Z., III. Surface Mine Reclamation. In Geology of Illinois; Kolata, D.R., Nimz, C.K., Eds.; Illinois State Geological Survey: Champaign, IL, USA, 2010. [Google Scholar]
- Castendyk, D.N.; Mauk, J.L.; Webster, J.G. A mineral quantification method for wall rocks at open pit mines, and application to the Martha Au–Ag mine, Waihi, New Zealand. Appl. Geochem. 2005, 20, 135–156. [Google Scholar] [CrossRef]
- Zawadzki, D. Wykorzystanie zalanych kamieniołomów i wyrobisk pokopalnianych w turystyce specjalistycznej—Nurkowanie rekreacyjne (Use of flooded quarries and pit lakes in skilled tourism—SCUBA diving). In Współczesne Problemy Badań Geograficznych; Borówka, R.K., Cedro, A., Kavetskyy, I., Eds.; Uniwersytet Szczeciński, Wydział Nauk o Ziemi, Szczecin, wyd. PPH ZAPOL Dmochowski, Sobczyk: Szczecin, Poland, 2013; pp. 255–267. [Google Scholar]
- Mollema, P.; Antonellini, M.; Hubeek, A.; Van Diepenbeek, P.M.J. A The effect of artificial recharge on hydrochemistry: A comparison of two fluvial gravel pit lakes with different post-excavation uses in the Netherlands. Water 2016, 8, 409. [Google Scholar] [CrossRef] [Green Version]
- Lazar, M.; Faur, F. Research on the possibility of the development and water filling of the remaining hole of Urdari open pit. Min. Rev. 2012, 18, 18–22. [Google Scholar]
- Kivinen, S. Sustainable post-mining land use: Are closed metal mines abandoned or re-used space? Sustainability 2017, 9, 1705. [Google Scholar] [CrossRef] [Green Version]
- Song, J.; Choi, Y. Analysis of the Potential for Use of Floating Photovoltaic Systems on Mine Pit Lakes: Case Study at the Ssangyong Open-Pit Limestone Mine in Korea. Energies 2016, 9, 102. [Google Scholar] [CrossRef] [Green Version]
- Wessel, M.; Madlener, R.; Hilgers, C. Economic Feasibility of Semi-Underground Pumped Storage Hydropower Plants in Open-Pit Mines. Energies 2020, 13, 4178. [Google Scholar] [CrossRef]
- Jawecki, B.; Pawłowska, K. Evaluation of the Influence of the Heavy Metals Content on the Possibility to Use the Waters from selected Strzelin Quarry Lakes for Agricultural Irrigation. J. Ecol. Eng. 2021, 22, 1–10. [Google Scholar] [CrossRef]
- Kasperek, R.; Wiatkowski, M.; Rosik-Dulewska, C. Investigations of hydrological regime changes in an area adjacent to a mine of rock raw materials. Annu. Set Environ. Prot. Rocz. Ochr. Sr. 2015, 17, 256–274. [Google Scholar]
- Grünewald, U. Water resources management in river catchments influenced by lignite mining. Ecol. Eng. 2001, 17, 143–152. [Google Scholar] [CrossRef]
- Hüttl, R.F.; Gerwin, W. Landscape and ecosystem development after disturbance by mining. Ecol. Eng. 2005, 24, 1–3. [Google Scholar] [CrossRef]
- Clews, E.; Low, E.; Belle, C.C.; Todd, P.A.; Eikaas, H.S.; Ng, P.K.L. A pilot macroinvertebrate index of the water quality of Singapore’s reservoirs. Ecol. Indic. 2014, 38, 90–103. [Google Scholar] [CrossRef]
- Vandenberg, J.A.; McCullough, C.D.; Bolan, N.; Kirkham, M.; Ok, Y. Key Issues in Mine Closure Planning for Pit Lakes. In Spoil to Soil; Informa UK Limited: Colchester, UK, 2017; pp. 175–188. [Google Scholar]
- Polak, K.; Różkowski, K.; Pawlecka, K.; Kaznowska-Opala, K.; Chudzik, W. Prognoza zatapiania wyrobiska poeksploatacyjnego Świerki (Forecast of flooding of the post-mining excavation Swierki). Prz. Gór. 2014, 70, 31–36. [Google Scholar]
- Kołodziejczyk, U.; Węclewski, S. Wykorzystanie wód powierzchniowych do rekultywacji wyrobisk pokopalnianych na przykładzie kopalni Berzdorf (The use of surface water for the remediation of mining excavations on the example of mine Berzdorf). Zesz. Nauk. Uniw. Zielonogór. 2004, 131, 189–195. [Google Scholar]
- Kasztelewicz, Z.; Kaczorowski, J. Rekultywacja i rewitalizacja kopalń węgla brunatnego na przykładzie kopalni “Bełchatów” (Lignite mines revitalization based on the example of Bełchatów Lignite Mine). Gór. Geoinż. 2009, 33, 187–212. [Google Scholar]
- Wachowiak, G.; Wachowiak, A. Zbiornik w wyrobisku końcowym Odkrywki “Pątnów” Kopalni Węgla Brunatnego “Konin” i jego bilans wodny za okres 2003–2004 (Reservoir at the Closing Excavation of the open pit “Pątnów” of the lignite opencast mine “Konin” and its water balance in 2003–2004). Bad. Fizjogr. Pol. Zach. Ser. A Geogr. Fiz. 2005, 56, 157–176. [Google Scholar]
- Wachowiak, G. Bilans wodny zbiornika w zalewanym wyrobisku końcowym likwidowanej odkrywki “Lubstów” PAK Kopalnia Węgla Brunatnego Konin, S.A. (Water balance of a reservoir in the flooded, abandoned, open pit “Lubstów” PAK Lignite Opencast Mine Konin, S.A.). Gór. Odkryw. 2015, 56, 68–79. [Google Scholar]
- Stachowski, P.; Kraczkowska, K.; Liberacki, D.; Oliskiewicz-Krzywicka, A. Water Reservoirs as an Element of Shaping Water Resources of Post-Mining Areas. J. Ecol. Eng. 2018, 19, 217–225. [Google Scholar] [CrossRef]
- Geller, W.; Schultze, M.; Kleinmann, R.; Wolkersdorfer, C. Acidic Pit Lakes—The Legacy of Coal and Metal Surface Mines; Springer: Berlin/Heidelberg, Germany, 2013. [Google Scholar]
- Blanchette, M.L.; Lund, M.A. Pit lakes are a global legacy of mining: An integrated approach to achieving sustainable ecosystems and value for communities. Curr. Opin. Environ. Sustain. 2016, 23, 28–34. [Google Scholar] [CrossRef]
- Apostu, I.-M.; Lazar, M.; Faur, F.A. Model to Evaluate the Flooding Opportunity and Sustainable Use of Former Open-Pits. Sustainability 2020, 12, 9275. [Google Scholar] [CrossRef]
- Maest, A.; Prucha, R.; Wobus, C. Hydrologic and Water Quality Modeling of the Pebble Mine Project Pit Lake and Downstream Environment after Mine Closure. Minerals 2020, 10, 727. [Google Scholar] [CrossRef]
- Eary, T.; Castendyk, D. Hardrock Metal Mine Pit Lakes: Occurrence and Geochemical Characteristics. In Acidic Pit Lakes—Legacies of Surface Mining on Coal and Metal Ores; Geller, W., Schultze, M., Kleinmann, R.L.P., Wolkersdorfer, C., Eds.; Springer: Berlin/Heidelberg, Germany, 2012; pp. 75–106. [Google Scholar]
- DIRECTIVE 2000/60/EC of the European Parliament and of the Council of 23 October 2000 establishing a framework for Community action in the field of water policy. Off. J. Eur. Union 2000, 327, 1–73. Available online: https://eur-lex.europa.eu/legal-content/EN/TXT/?uri=celex%3A32000L0060 (accessed on 5 April 2022).
- Ministry of the Environment. Strategiczny plan adaptacji dla sektorów i obszarów wrażliwych na zmiany klimatu do roku 2020, z perspektywą do roku 2030. Warszawa 2013. Available online: https://bip.mos.gov.pl/fileadmin/user_upload/bip/strategie_plany_programy/Strategiczny_plan_adaptacji_2020.pdf (accessed on 4 April 2022).
- Regional Water Management Authority in Wrocław (Regionalny Zarząd Gospodarki Wodnej we Wrocławiu). Plan przeciwdziałania skutkom suszy w regionach wodnych Środkowej Odry, Izery, Metuje, Łaby i Ostrożnicy (Upa), Orlicy i Morawy (Plan to Counteract the Effects of Drought in the Water Regions of the Middle Odra, Jizera, Metuje, Labe and Ostrożnica (Upa), Orlica and Morava), Warszawa 2017. Available online: https://wroclaw.rzgw.gov.pl/files_mce/SUSZA%202017/ppss_wroc_aw_31.08.2017.pdf (accessed on 29 December 2019).
- Kowalewski, Z. Actions for small water retention undertaken in Poland. J. Water Land Dev. 2008, 12, 155–167. [Google Scholar] [CrossRef] [Green Version]
- Gromiec, M.; Winnicki, T. Projekt polityki wodnej państwa a diagnoza stanu gospodarki wodnej (Draft of water policy of the state and diagnosis of a status of water economy). Annu. Set Environ. Prot. Rocz. Ochr. Sr. 2011, 13, 283–302. [Google Scholar]
- Mioduszewski, W. Small (natural) water retention in rural areas. J. Water Land Dev. 2014, 20, 19–29. [Google Scholar] [CrossRef] [Green Version]
- Mioduszewski, W.; Querner, E.P.; Kowalewski, Z. The analysis of the impact of small retention on water resources in the catchment. J. Water Land Dev. 2014, 23, 41–51. [Google Scholar] [CrossRef] [Green Version]
- Szczykowska, J.; Siemieniuk, A. The present condition of small water retention and the prospects of its development using the example of the Podlaskie Voivodeship. J. Ecol. Eng. 2014, 15, 90–96. [Google Scholar] [CrossRef]
- Bernaciak, A.; Spychała, M.; Korytowski, M.; Powolna, P. Mała retencja wodna w programach ochrony środowiska gmin nadwarciańskich (Small water retention in local environmental protection programs of Warta river municipalities). Inżynieria Ekol. Ecol. Eng. 2015, 44, 121–130. [Google Scholar] [CrossRef]
- Linnerooth-Bayer, J.; Dubel, A.; Sendzimir, J.; Hochrainer-Stigler, S. Challenges for mainstreaming climate change into EU flood and drought policy: Water retention measures in the Warta River Basin, Poland. Reg. Environ. Chang. 2015, 15, 1011–1023. [Google Scholar] [CrossRef]
- Szwed, M. The Elements of Water Balance in the Changing Climate in Poland. Adv. Meteorol. 2015, 13, 149674. [Google Scholar] [CrossRef]
- Kondracki, J. Geografia Regionalna Polski (Regional Geography of Poland); PWN: Warszawa, Poland, 2002. [Google Scholar]
- Lower Silesian Geoportal—Module of Environmental Maps (Geoportal Dolnego Śląska—Moduł Przyroda). Available online: https://geoportal.dolnyslask.pl/imap/?gpmap=gp80#gpmap=gp80 (accessed on 6 April 2022).
- State Water Holding—Polish Waters (Państwowe Gospodarstwo Wodne—Wody Polskie). System Informacyjnego Gospodarowania Wodami -Mapa Podziału Hydrograficznego Polski 2021 (The Water Management Information System—The Watershed Map of Poland). Available online: https://wody.isok.gov.pl/imap_kzgw/?gpmap=gpSIGW (accessed on 6 April 2022).
- Brysiewicz, A.; Wesołowski, P.; Rawicki, K. Porównanie stężenia składników chemicznych w wodzie ze śródpolnego oczka wodnego oraz w wodzie gruntowej z przylegających terenów rolniczych (Concentrations of chemical components in water from midfield pond and in ground water from adjacent agricultural areas—A comparison). Woda-Sr.-Obsz. Wiej. 2013, 13, 17–31. [Google Scholar]
- Dz.U. 2016, poz. 1178. Rozporządzenie Ministra Środowiska z dnia 19 lipca 2016 r. w sprawie form i sposobu prowadzenia monitoringu jednolitych części wód powierzchniowych i podziemnych (Journal of Laws 2016, item 1178. Regulation of the Minister of the Environment of 19 July 2016 on the forms and methods of monitoring surface and groundwater bodies). Available online: https://dziennikustaw.gov.pl/DU/rok/2016/pozycja/1178 (accessed on 5 April 2022).
- Bauder, J.W.; Bauder, T.A.; Waskom, R.M.; Scherer, T.F.; Assessing the Suitability of Water (Quality) for Irrigation—Salinity and Sodium. Retrieved from Northern Plains and Mountains Regional Water Program. 2010. Available online: http://region8water.colostate.edu/PDFs/Assessing%20the%20Suitablity%20of%20Water%20Quality%20for%20Irrigation.pdf (accessed on 19 July 2019).
- Saha, U.; Butcher, S.; Porter, W.; Sonon, L.; Hawkins, G.; Lessl, J. Irrigation Water Quality for Agriculture. UGA Extension Bulletin: Athens, GA, USA, 2015; p. 1448. [Google Scholar]
- Ayers, R.S.; Westcott, D.W. Water Quality for Agriculture; FAO Irrigation and Drainage Paper, No. 29; FAO: Rome, Italy, 1985. [Google Scholar]
- PN-84/C-04635; Woda do nawadniania roślin na użytkach rolnych oraz do ich opryskiwania chemicznymi środkami ochrony roślin (Water for Irrigation of Plants on Agricultural Land and For Spraying Them with Chemical Plant Protection Products). FAO: Rome, Italy, 2012. Available online: https://documents1.worldbank.org/curated/en/816801468045845434/pdf/E12320v30EA0P00266B0AFR0PMP0P084148.pdf (accessed on 8 February 2023).
- Kaniszewski, S.; Treder, W. Jakość wody do nawadniania i fertygacji, metody uzdatniania (Water quality for irrigation and fertigation, treatment methods). In Ograniczenie Zanieczyszczenia Azotem Pochodzenia Rolniczego Metodą Poprawy Jakości Wód (Reducing Nitrogen Pollution from Agricultural Sources by Improving Water Quality); Walczak, J., Ed.; Fundacja na rzecz Rozwoju Polskiego Rolnictwa: Warszawa, Poland, 2018; pp. 67–71. [Google Scholar]
- Walczykiewicz, P.; Szostak, M.; Krzaklewski, W.; Pająk, M.; Pierzchalski, M.; Szwed, P.; Hawryło, P.; Ratajczak, M. Landscape monitoring of post-industrial areas using LiDAR and GIS technology. Geod. Cartogr. 2015, 64, 125–137. [Google Scholar]
- Xiang, J.; Li, S.; Xiao, K.; Chen, J.; Sofia, G.; Tarolli, P. Quantitative Analysis of Anthropogenic Morphologies Based on Multi-Temporal High-Resolution Topography. Remote Sens. 2019, 11, 1493. [Google Scholar] [CrossRef] [Green Version]
- Labant, S.; Staňková, S.; Weiss, R. Geodetic determining of stockpile volume of mineral excavated in open pit mine. GeoSci. Eng. 2013, 59, 30–40. [Google Scholar] [CrossRef]
- Witt, E.C. Use of lidar point cloud data to support estimation of residual trace metals stored in mine chat piles in the Old Lead Belt of southeastern, Missouri. AIMS Environ. Sci. 2016, 3, 509–524. [Google Scholar] [CrossRef]
- Wajs, J. Research on surveying technology applied for DTM modelling and volume computation in open pit mines. Min. Sci. 2015, 22, 75–83. [Google Scholar]
- Tong, X.; Liu, X.; Chen, P.; Liu, S.; Luan, K.; Li, L.; Liu, S.; Liu, X.; Xie, H.; Jin, Y.; et al. Integration of UAV-Based Photogrammetry and Terrestrial Laser Scanning for the Three-Dimensional Mapping and Monitoring of Open-Pit Mine Areas. Remote Sens. 2015, 7, 6635–6662. [Google Scholar] [CrossRef] [Green Version]
- Esposito, G.; Matano, F.; Sacchi, M. Detection and Geometrical Characterization of a Buried Landfill Site by Integrating Land Use Historical Analysis, Digital Photogrammetry and Airborne Lidar Data. Geosciences 2018, 8, 348. [Google Scholar] [CrossRef] [Green Version]
- Sayab, M.; Aerden, D.; Paananen, M.; Saarela, P. Virtual Structural Analysis of Jokisivu Open Pit Using ‘Structure-from-Motion’ Unmanned Aerial Vehicles (UAV) Photogrammetry: Implications for Structurally-Controlled Gold Deposits in Southwest Finland. Remote Sens. 2018, 10, 1296. [Google Scholar] [CrossRef] [Green Version]
- Gong, C.; Lei, S.; Bian, Z.; Liu, Y.; Zhang, Z.; Cheng, W. Analysis of the development of an erosion gully in an open-pit coal mine dump during a winter freeze-thaw cycle by using Low-Cost UAVs. Remote Sens. 2019, 11, 1356. [Google Scholar] [CrossRef] [Green Version]
- Xu, Z.; Xu, E.; Wu, L.; Liu, S.; Mao, Y. Registration of Terrestrial Laser Scanning Surveys Using Terrain-Invariant Regions for Measuring Exploitative Volumes over Open-Pit Mines. Remote Sens. 2019, 11, 606. [Google Scholar] [CrossRef] [Green Version]
- Pepe, M.; Costantino, D. Measurement in Network-RTK for the Survey and Representation of A Quarry: Potentials And Limits. Int. J. Eng. Trends Technol. 2022, 70, 233–239. [Google Scholar] [CrossRef]
- Laks, I.; Walczak, Z. Assessment of the accuracy of river bathymetry mapping using low-cost sonar systems. In Ekspolatacja i Oddziaływanie Zbiorników Wodnych (Exploitation and Impact of Water Reservoirs); Wicher-Dysarz, J., Kałuża, T., Nowak, B., Eds.; Book of Abstracts; Wydawnictwo Uniwersytetu Przyrodniczego w Poznaniu: Poznań, Poland, 2022. [Google Scholar]
- Kogut, T.; Niemeyer, J. Wykorzystanie LiDARu batymetrycznego do monitoringu wybrzeża morskiego (Utilisation of bathymetric LIDAR data for sea coastal zones monitoring). Prz. Geod. 2014, 86, 3–7. [Google Scholar]
- Kerfoot, W.C.; Hobmeier, M.M.; Swain, G.; Regis, R.; Raman, V.K.; Brooks, C.N.; Grimm, A.; Cook, C.; Shuchman, R.; Reif, M. Coastal Remote Sensing: Merging Physical, Chemical, and Biological Data as Tailings Drift onto Buffalo Reef, Lake Superior. Remote Sens. 2021, 13, 2434. [Google Scholar] [CrossRef]
- Dz. U. z 2021 r. poz. 1990. Ustawa z dnia 17 maja 1989 r. Prawo geodezyjne i kartograficzne (tekst jednolity). (Journal of Laws 2021, item 1990. Act of May 17, 1989. Geodetic and cartographic law (consolidated text)). Available online: https://dziennikustaw.gov.pl/DU/rok/2021/pozycja/1990 (accessed on 5 April 2022).
- Dz.U. 2021 poz. 1475. Rozporządzenie Ministra Infrastruktury z dnia 25 czerwca 2021 r. w Sprawie Klasyfikacji Stanu Ekologicznego, Potencjału Ekologicznego i Stanu Chemicznego Oraz Sposobu Klasyfikacji Stanu Jednolitych Części Wód Powierzchniowych, a Także Środowiskowych Norm Jakości dla Substancji Priorytetowych (Journal of Laws 2021, item 1475. Regulation of the Minister of Infrastructure of June 25, 2021 on the Classification of Ecological Status, Ecological Potential and Chemical Status and the Method of Classifying the Status of Surface Water Bodies, as Well as Environmental Quality Standards for Priority Substances). Available online: https://dziennikustaw.gov.pl/DU/rok/2021/pozycja/1475 (accessed on 5 April 2022).
- Ministry of Infrastructure, State Water Holding—Polish Waters. 2021; Projekt Drugiej Aktualizacji Planu Gospodarowania Wodami na Obszarze Dorzecza Odry. Available online: https://www.apgw.gov.pl/static/cms/doc/2021/Odra/Projekt_IIaPGW_OD_ODRA.pdf (accessed on 21 April 2022).
- Kasztelewicz, Z.; Sypniowski, S. Rekultywacja w polskim górnictwie odkrywkowym węgla brunatnego (Reclamation in Polish opencast brown coal mining). Gór. Geoinż. 2010, 34, 289–304. [Google Scholar]
- Ejsmont-Karabin, J. Rotifer occurrence in relation to age, depth and trophic state of quarry lakes. Hydrobiologia 1995, 313, 21–28. [Google Scholar] [CrossRef]
- Puczyńska, I.; Skrzypski, J. Integracja działań biologicznych i technicznych jako podstawa intensyfikacji procesów samooczyszczania się zbiorników zaporowych (na przykładzie Zbiornika Sulejowskiego) (The integration of biological and technical actions as a basis of the intensification of dam reservoirs’ self-purification (Sulejów reservoir). Ecol. Chem. Eng. S 2009, 16, 221–235. [Google Scholar]
- Wiejaczka, Ł. Wpływ zbiornika wodnego “Klimkówka” na abiotyczne elementy środowiska przyrodniczego w dolinie Ropy (Influence of the Klimkówka Water Reservoir on the Abiotic Elements of the Natural Environment in the Ropa River Valley); Prace geograficzne #229; IGiPZ PAN: Warszawa, Poland, 2011. [Google Scholar]
- Mayne, C.D. The Limnology of Three Limestone Rock Quarries in East-Central Nebraska and Western Iowa. Trans. Neb. Acad. Sci. 1994, 21, 1–7. [Google Scholar]
- Hobot, A. (Ed.) Aktualizacja wykazu JCWP i SCWP dla potrzeb kolejnej aktualizacji planów w latach 2015–2021 wraz z weryfikacją typów wód części wód—ETAP I—Metodyka (Updating the List of JCWP and SCWP for the Purposes of the Next Update of Plans in the Years 2015–2021 along with the Verification of Water Types of Water Bodies—STAGE I—Methodology); KZGW: Gliwice, Poland; Warszwa, Poland, 2014. [Google Scholar]
- Chrobak, G.; Kowalczyk, T.; Fischer, T.B.; Szewrański, S.; Chrobak, K.; Kazak, J.K. Ecological state evaluation of lake ecosystems revisited: Latent variables with kSVM algorithm approach for assessment automatization and data comprehension. Ecol. Indic. 2021, 125, 107567. [Google Scholar] [CrossRef]
- Migaszewski, Z.M.; Gałuszka, A.; Dołęgowska, S. Rare earth and trace element signatures for assessing an impact of rock mining and processing on the environment: Wiśniówka case study, south-central Poland. Environ. Sci. Pollut. Res. 2016, 23, 24943–24959. [Google Scholar] [CrossRef] [Green Version]
- Przybyła, C.; Zbierska, Z.; Dwornikowska, Ż. Ocena zmian jakości wody w wybranych jeziorach Pojezierza Poznańskiego w latach 2004–2009. Rocz. Ochr. Sr. 2011, 13, 723–746. [Google Scholar]
- Wiatkowski, M.; Rosik-Dulewska, C.; Kuczewski, K.; Kasperek, R. Ocena jakości wody zbiornika Włodzienin w pierwszym roku funkcjonowania (Water Quality Assessment of Włodzienin Reservoirin the First Year of Its Operation). Annu. Set Environ. Prot. Rocz. Ochr. Sr. 2013, 15, 2667–2682. [Google Scholar]
- Siemieniuk, A.; Szczykowska, J.; Wiater, J. Sezonowe zmiany stanu troficznego zbiorników retencyjnych. Ekon. Sr. 2013, 2, 107–116. [Google Scholar]
- Jawecki, B.; Burszta-Adamiak, E. Seasonal variability of basic pollution parameters in atmospheric precipitation in Strzelin. J. Water Land Dev. 2014, 20, 31–37. [Google Scholar] [CrossRef] [Green Version]
- Fiszer, M.; Michałkiewicz, M. Ocena stanu zanieczyszczenia Jeziora Lednica na podstawie badań fizyko-chemicznych epilimnionu i hypolimnionu (Evaluation of the pollution status of Lake Lednica on the basis of physicochemical tests of the epilimnion and hypolimnion). Stud. Lednickie 1998, 5, 269–282. [Google Scholar]
- Kajak, Z. Hydrobiologia-Limnologia. Ekosystemy Wód Śródlądowych (Hydrobiology-Limnology. Inland Water Ecosystems); Wydawnictwo Naukowe PWN: Warszawa, Poland, 2001. [Google Scholar]
- Orzepowski, W.; Pulikowski, K. Magnesium, calcium, potassium and sodium content in groundwater and surface water in arable lands in the commune (gmina) of Kąty Wrocławskie. J. Elementol. 2008, 13, 605–614. [Google Scholar]
- Ravikumar, P.; Aneesul Mehmood, M.; Somashekar, R.K. Water quality index to determine the surface water quality of Sankey tank and Mallathahalli lake, Bangalore urban district, Karnataka, India. Appl. Water Sci. 2013, 3, 247–261. [Google Scholar] [CrossRef] [Green Version]
- Potasznik, A.; Szymczyk, S. Magnesium and calcium concentrations in the surface water and bottom deposits of a river-lake system. J. Elem. 2015, 20, 677–692. [Google Scholar] [CrossRef]
- Gwoździński, K.; Mazur, J.; Pieniążek, A. Concentrations of metals in water of unmonitored lakes near a landscape park. Pol. J. Environ. Stud. 2014, 23, 1317–1321. [Google Scholar]
- Elzwayie, A.; Afan, H.A.; Allawi, M.F.; El-Shafie, A. Heavy metal monitoring, analysis and prediction in lakes and rivers: State of the art. Environ. Sci. Pollut. Res. 2017, 24, 12104–12117. [Google Scholar] [CrossRef]
- Avila-Pérez, P.; Balcázar, M.; Zarazúa-Ortega, G.; Barceló-Quintal, I.; Díaz-Delgado, C. Heavy metal concentrations in water and bottom sediments of a Mexican reservoir. Sci. Total Environ. 1999, 234, 185–196. [Google Scholar] [CrossRef]
- Karadede, H.; Ünlü, E. Concentrations of some heavy metals in water, sediment and species from the Atatürk Dam Lake (Euphrates), Turkey. Chemosphere 2000, 41, 1371–1376. [Google Scholar] [CrossRef]
- Stottmeister, U.; Glässer, W.; Klapper, H.; Weißbrodt, E.; Eccarius, B.; Kennedy, C.; Schultze, M.; Wendt-Potthoff, K.; Frömmichen, R.; Schreck, P.; et al. Strategies for Remediation of Former Opencast Mining Areas in Eastern Germany. In Environmental Impacts of Mining Activities; Azcue, J.M., Ed.; Environmental Science; Springer: Berlin/Heidelberg, Germany, 1999. [Google Scholar] [CrossRef]
Figure 1.
Position of the analysed quarries (DTM created by B. Jawecki [49], modified by the author B.J.).
Figure 1.
Position of the analysed quarries (DTM created by B. Jawecki [49], modified by the author B.J.).

Figure 2.
Sample bathymetric maps created for quarry lakes Q2 Gęsiniec-Gliczyny and Q3 Biały Kościół Dębniki (left side: DTM with a bathymetric map of the quarry lake, right side: orthophotomap with terrain formation and bathymetric map with isobates) (author T.K.).
Figure 2.
Sample bathymetric maps created for quarry lakes Q2 Gęsiniec-Gliczyny and Q3 Biały Kościół Dębniki (left side: DTM with a bathymetric map of the quarry lake, right side: orthophotomap with terrain formation and bathymetric map with isobates) (author T.K.).

Figure 3.
The average and range of variability values of the indicators that characterise the usability of water from selected quarry lakes in the Strzelin granitoids quarry lakes for agricultural irrigation (author B.J.).
Figure 3.
The average and range of variability values of the indicators that characterise the usability of water from selected quarry lakes in the Strzelin granitoids quarry lakes for agricultural irrigation (author B.J.).

Figure 4.
The average and range of variability concentration of selected ions in the water of the analysed Strzelin granitoids quarry lakes (author B.J.).
Figure 4.
The average and range of variability concentration of selected ions in the water of the analysed Strzelin granitoids quarry lakes (author B.J.).


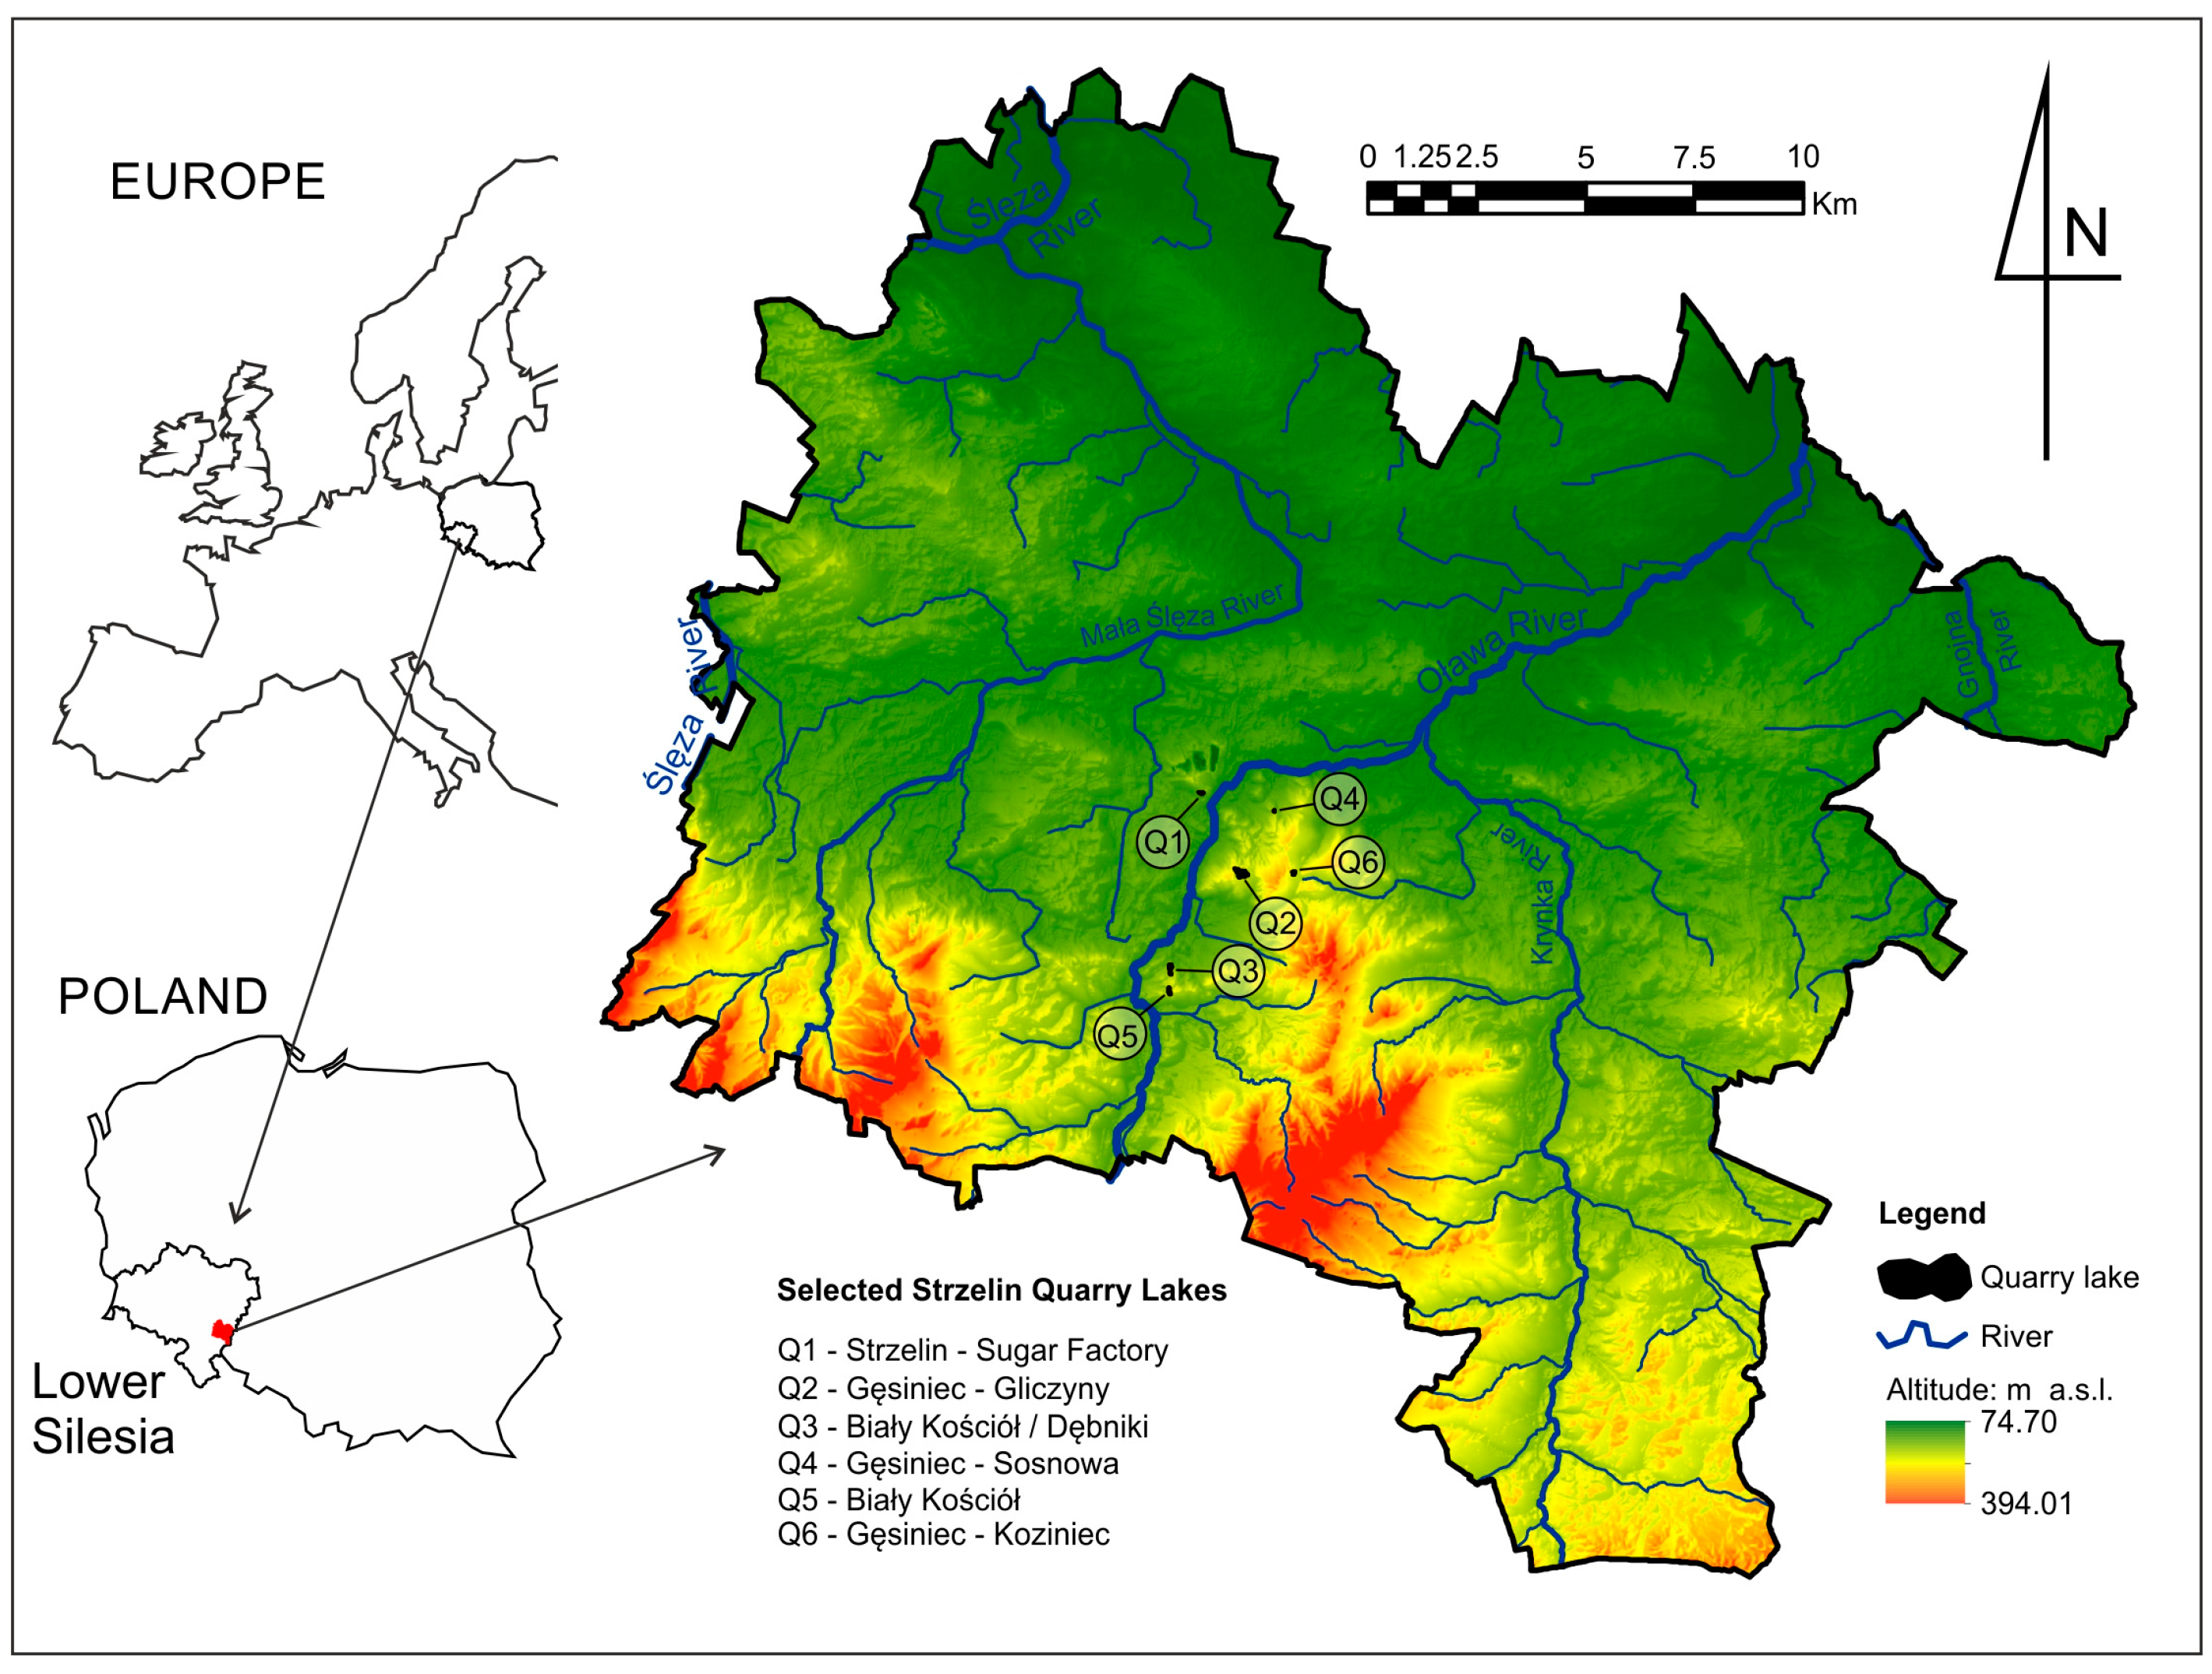
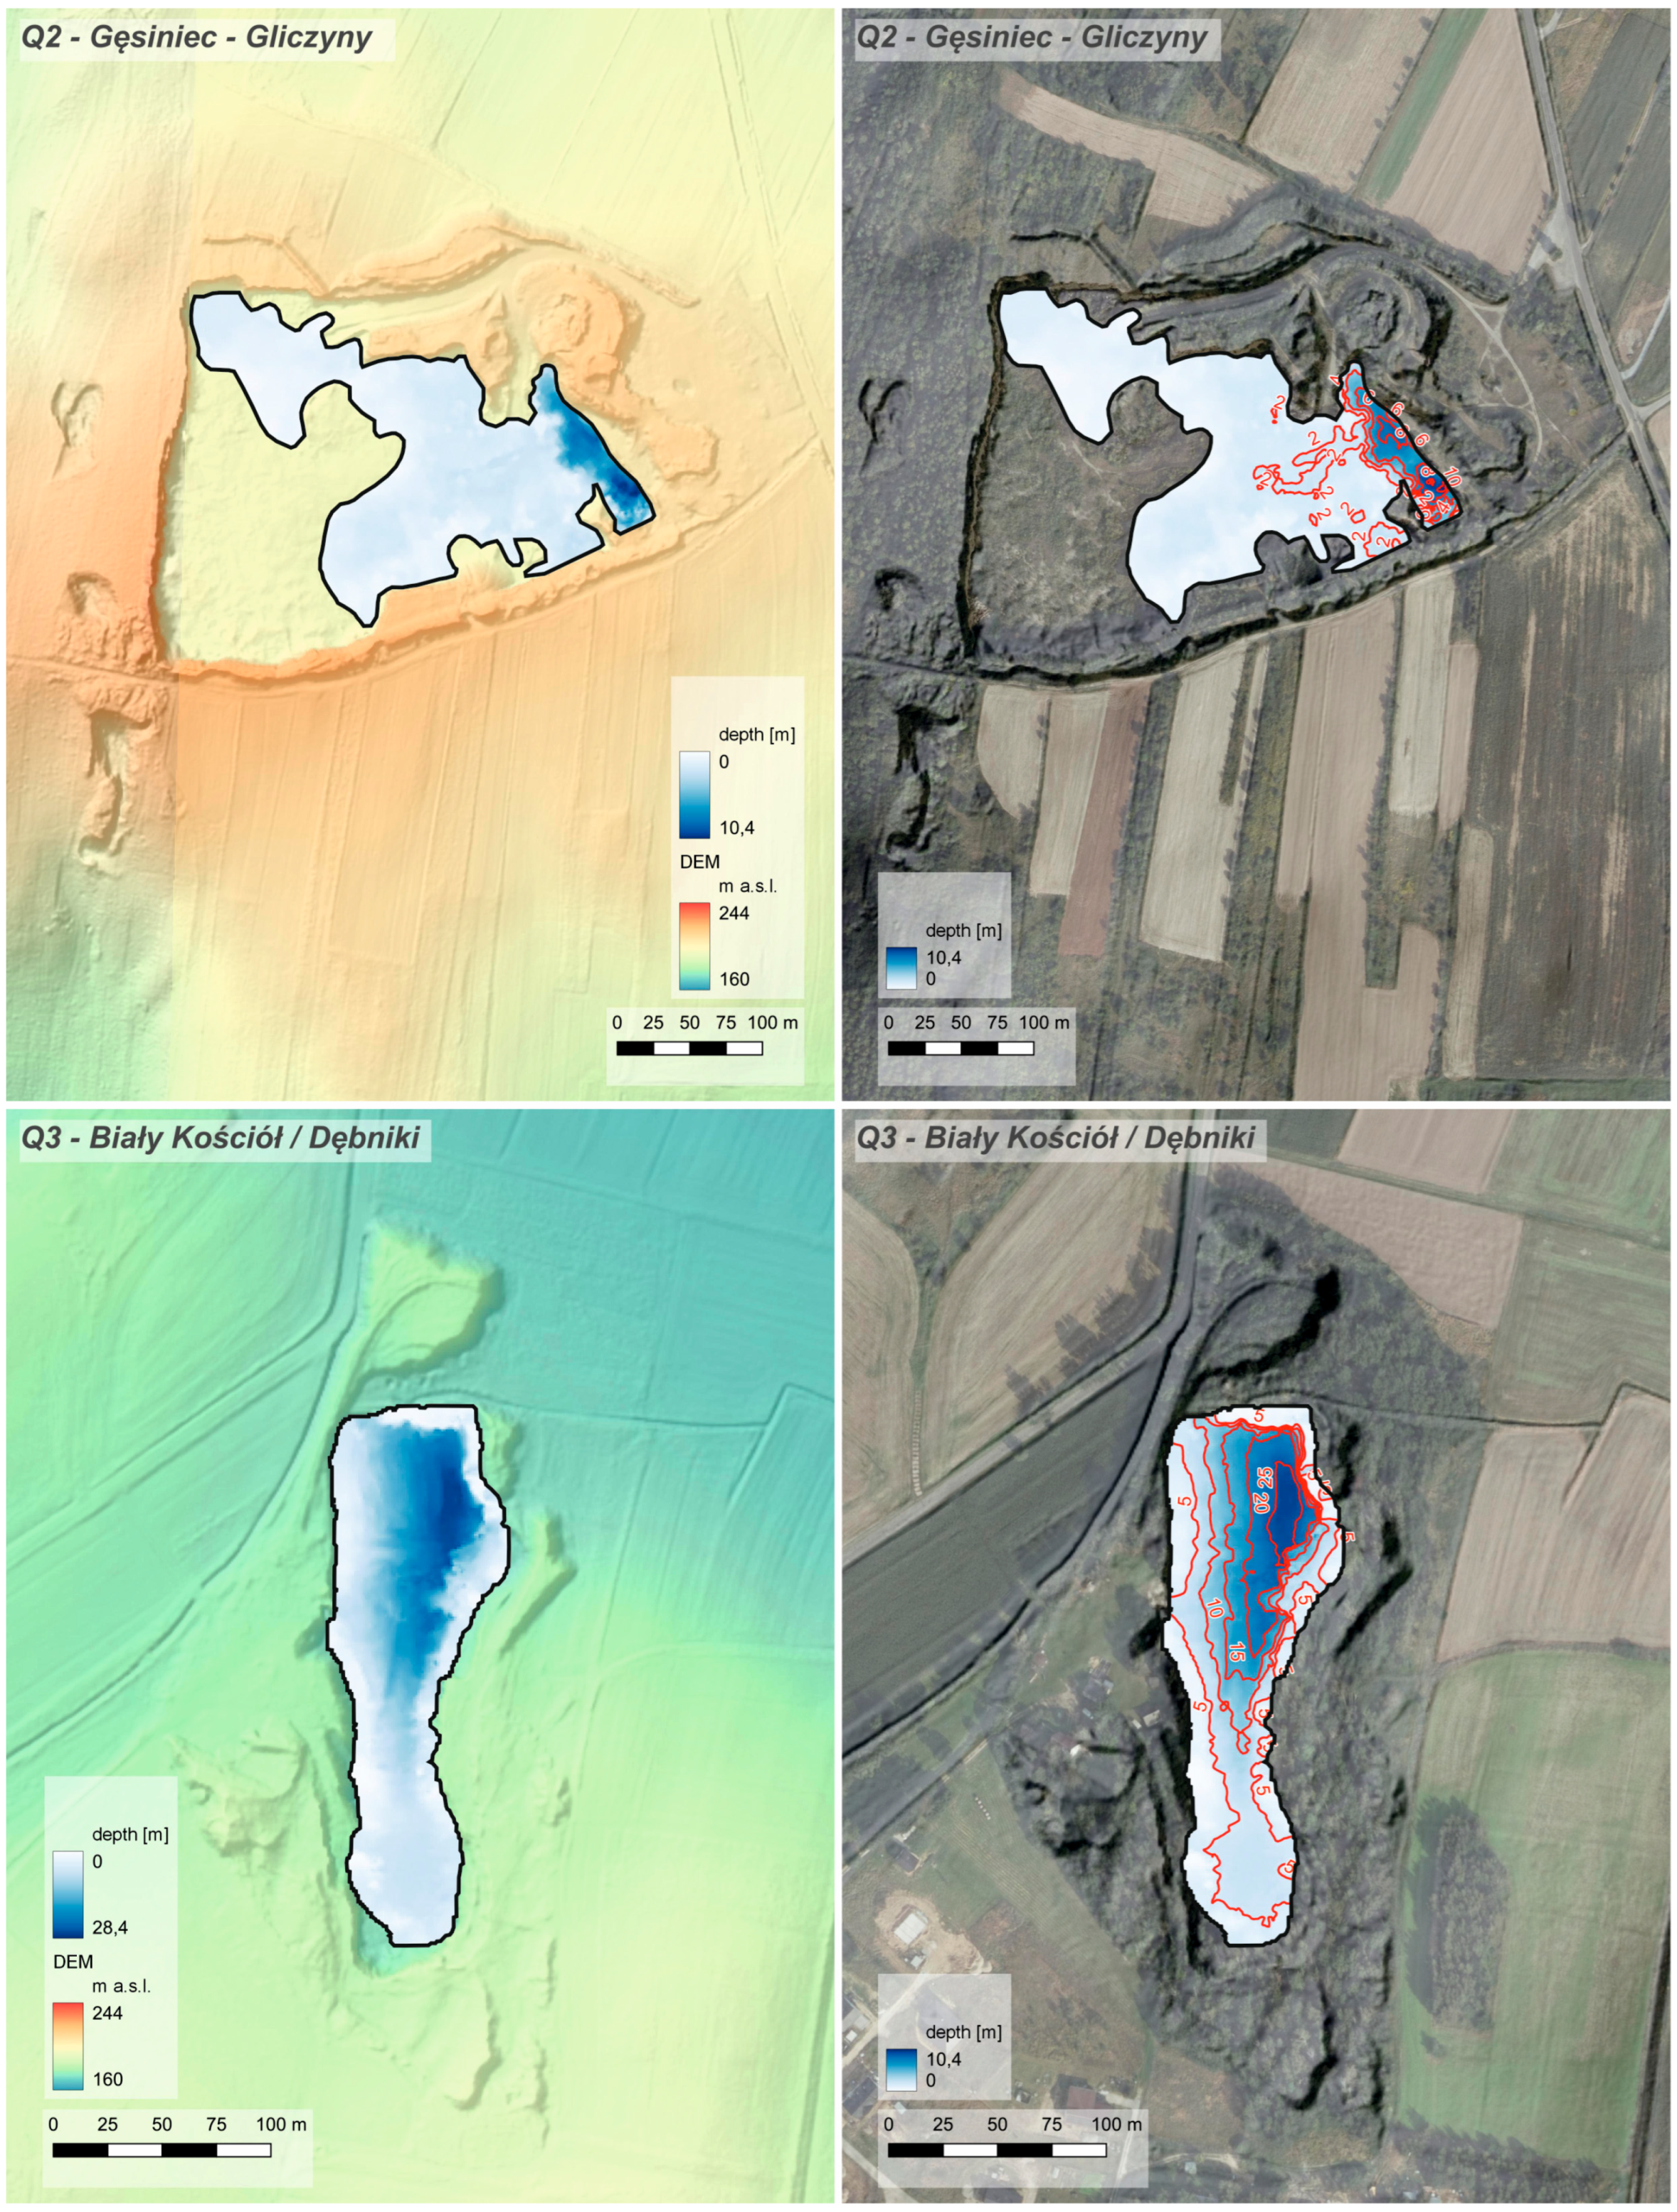
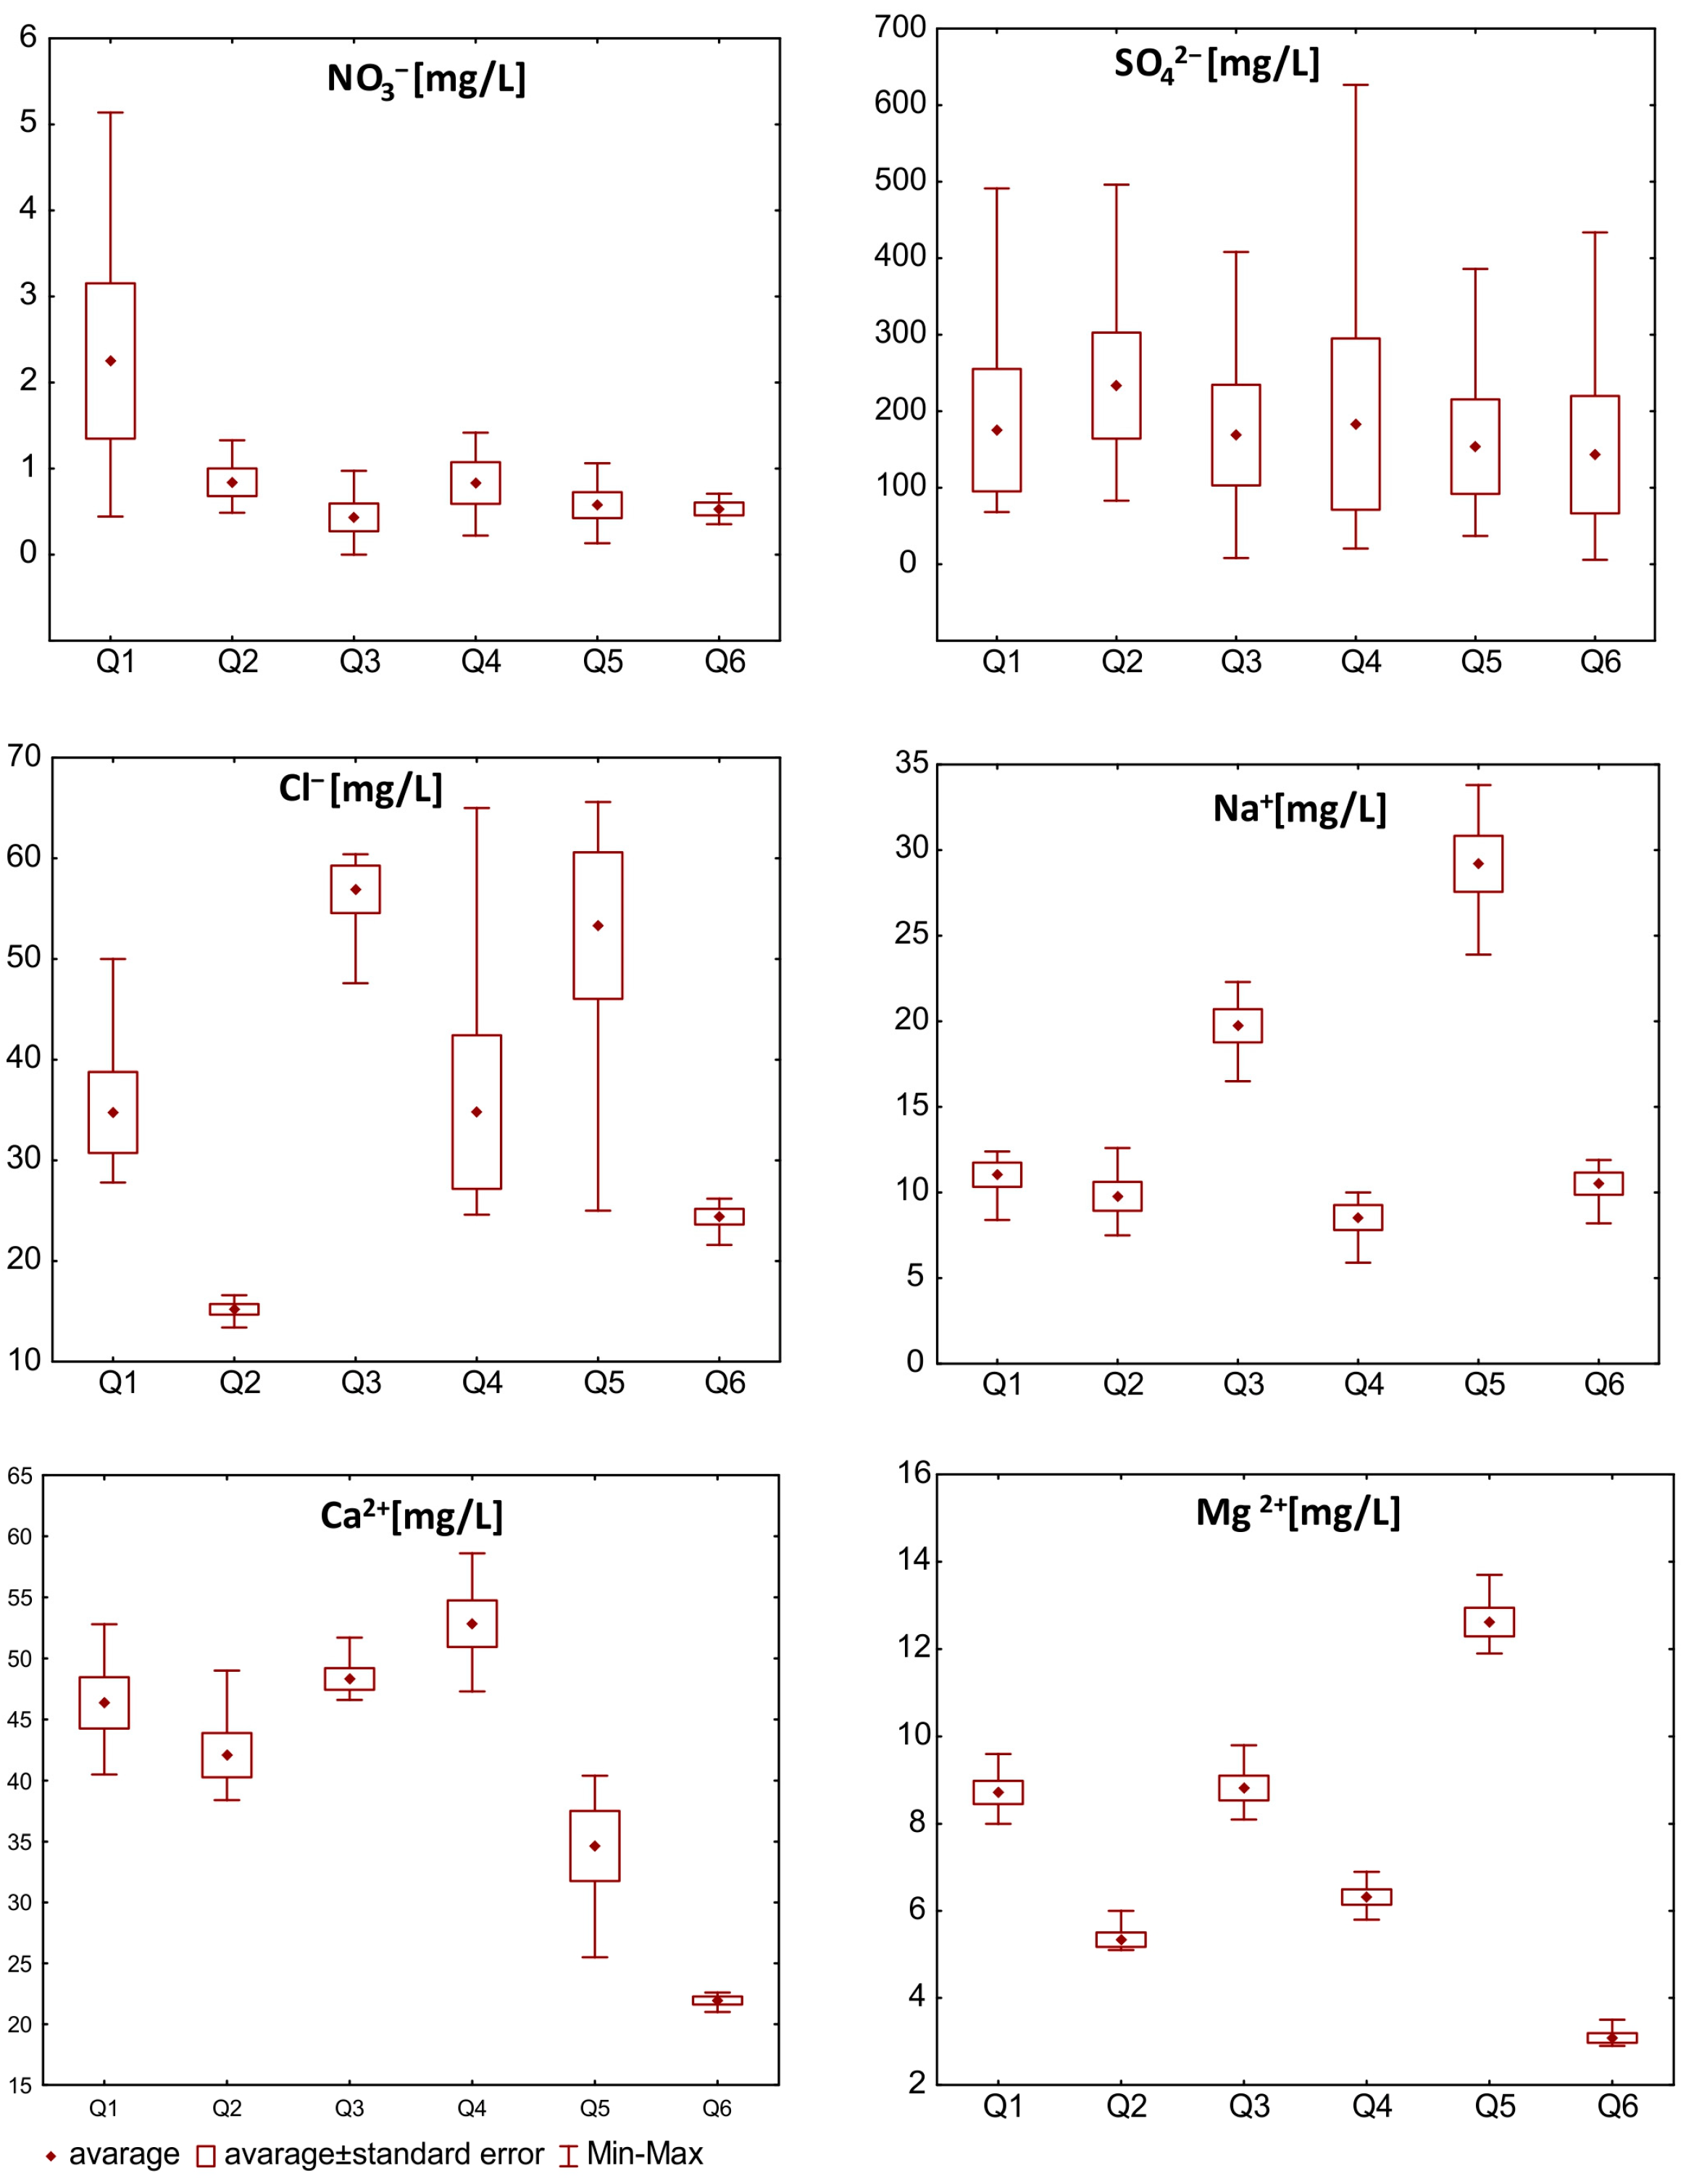
Table 1.
Characteristics of the analysed quarry lakes (author B.J.).
| Quarry Lake | Code on the Map (Figure 1) | Location Coordinates | Resources Mined | Catchment of JCWP 1 | Type of Reservoir 2 |
|---|---|---|---|---|---|
| Strzelin-Sugar Factory | Q1 | N 5°46′18″ S 17°3′°5″ | Granite | Oława from Podgródka to Krynka Code: PLRW6000191334199 | WSd_a |
| Gęsiniec-Gliczyny | Q2 | N 5°45′15″ S 17°3′56″ | Tonalite, Diorite, Granite | WSm_a | |
| Biały Kościół/Dębniki | Q3 | N 5°44′°8″ S 17°2′32″ | Granite | WSm_a | |
| Gęsiniec-Sosnowa | Q4 | N 5°46′°7″ S 17°4′29″ | Granite | WSd_b | |
| Biały Kościół | Q5 | N 5°43′51″ S 17°4′54″ | Granite | WSm_a | |
| Gęsiniec-Koziniec | Q6 | N 5°45′21″ S 17°2′32″ | Granite | K_a |
Notes: 1 Surface Water Body; 2 Classified according to the Guidelines in the Ordinance of the Minister of Infrastructure [132].
Table 2.
Characteristics of the selected bathymetric and morphological parameters of the analysed quarry lakes (author B.J.).
Table 2.
Characteristics of the selected bathymetric and morphological parameters of the analysed quarry lakes (author B.J.).
| Quarry Lake | Code on the Map | Reservoir Length [m] | Reservoir Width [m] | Surface of the Water Table [ha] | Maximum Depth [m] | Average Depth [m] | Water Volume [million m3] |
|---|---|---|---|---|---|---|---|
| Strzelin-Sugar Factory | Q1 | 126 | 57 | 0.39 | 10.0 | 5.0 | 0.0194 |
| Gęsiniec-Gliczyny | Q2 | 347 | 220 | 2.93 | 10.4 | 1.8 | 0.0527 |
| Biały Kościół/Dębniki | Q3 | 242 | 77 | 1.23 | 28.4 | 10.0 | 0.1227 |
| Gęsiniec-Sosnowa | Q4 | 44 | 42 | 0.10 | 4.3 | 1.7 | 0.0017 |
| Biały Kościół | Q5 | 171 | 51 | 0.73 | 17.7 | 8.3 | 0.0604 |
| Gęsiniec-Koziniec | Q6 | 110 | 81 | 0.55 | 15.0 | 9.4 | 0.0509 |
| Average/Total | 173.3 | 88.0 | 0.99 | 14.3 | 6.0 | ∑0.3078 | |
Table 3.
Average, minimum and maximum value of the analysed water quality indicators in selected Strzelin granitoid quarry lakes (author B.J.).
Table 3.
Average, minimum and maximum value of the analysed water quality indicators in selected Strzelin granitoid quarry lakes (author B.J.).
| Parameter | Q1 | Q2 1 | Q3 1 | Q4 | Q5 | Q6 |
|---|---|---|---|---|---|---|
| avg. ± standard error min.–max. | ||||||
| pH (−) | 7.61 7.1–8.8 | 7.98 7.6–8.4 | 7.73 7.2–9.0 | 7.75 7.3–8.7 | 7.81 7.2–9.3 | 7.88 7.4–8.7 |
| ECw (mS/cm) | 0.351 ± 0.024 0.310–0.444 | 0.288 ± 0.007 0.270–0.311 | 0.384 ± 0.008 0.369–0.407 | 0.318 ± 0.024 0.287–0.346 | 0.456 ± 0.009 0.433–0.481 | 0.194 ± 0.004 0.180–0.201 |
| SAR (−) | 0.39 ± 0.02 0.31–0.45 | 0.38 ± 0.03 0.30–0.49 | 0.69 ± 0.03 0.58–0.77 | 0.30 ± 0.02 0.22–0.35 | 1.08 ± 0.06 0.93–1.21 | 0.56 ± 0.03 0.44–0.62 |
| TDS (mg/L) | 224.9 ± 15.49 198.4–284.2 | 184.2 ± 4.64 172.8–199.0 | 245.9 ± 4.83 236.2–260.5 | 203.4 ± 6.11 183.6–221.4 | 291.8 ± 5.84 277.1–307.8 | 123.9 ± 2.33 115.2–128.6 |
| BOD5 (mg O2/L) | 2.52 ± 0.35 1.60–3.40 | 1.54 ± 0.37 0.90–2.90 | 2.04 ± 0.55 1.00–4.10 | 3.38 ± 0.53 2.10–4.80 | 4.02 ± 0.83 2.00–5.80 | 1.10 ± 0.27 0.50–2.00 |
| Nitrates (mg NO3–/L) | 2.25 ± 0.90 0.44–5.14 | 0.84 ± 0.16 0.49–1.33 | 0.43 ± 0.16 0.00–0.97 | 0.83 ± 0.24 0.22–1.42 | 0.58 ± 0.15 0.13–1.06 | 0.53–0.07 0.35–0.71 |
| (mg N-NO3−/L) | 0.51 ± 0.20 0.10–1.16 | 0.19 ± 0.04 0.11–0.3 | 0.10 ± 0.03 0.00–0.22 | 0.19 ± 0.05 0.05–0.32 | 0.13 ± 0.03 0.03–0.24 | 0.12–0.02 0.08–0.16 |
| Sulphates (mg SO42−/L) | 175.24 ± 79.99 68.30–491.20 | 233.48 ± 69.27 83.10–496.10 | 168.82 ± 65.71 8.20–408.10 | 183.22 ± 111.92 50.50–626.60 | 153.70 ± 61.78 37.00–385.90 | 143.18 ± 76.72 5.80–433.60 |
| Chlorides (mg Cl−/L) | 34.76 ± 4.02 27.80–50.00 | 15.20 ± 0.52 13.40–16.60 | 56.92 ± 2.36 47.60–60.40 | 34.80 ± 7.63 24.60–65.00 | 53.32 ± 7.28 25.00–65.60 | 24.40 ± 0.77 21.60–26.20 |
| Sodium (mg Na+/L) | 11.04 ± 0.71 8.40–12.40 | 9.78 ± 0.84 7.50–12.60 | 19.74 ± 0.97 16.50–22.30 | 8.54 ± 0.73 5.90–10.00 | 29.20 ± 1.63 23.90–33.80 | 10.52 ± 0.65 8.20–11.90 |
| Calcium (mg Ca2+/L) | 46.36 ± 2.10 40.50–52.80 | 42.08 ± 1.81 38.40–49.00 | 48.32 ± 0.88 46.60–51.70 | 52.84 ± 1.90 47.30–58.60 | 34.64 ± 2.88 25.50–40.40 | 21.94 ± 0.33 21.00–22.60 |
| Magnesium (mg Mg2+/L) | 8.72 ± 0.27 8.00–9.60 | 5.34 ± 0.17 5.10–6.00 | 8.82 ± 0.28 8.10–9.80 | 6.32 ± 0.18 5.80–6.90 | 12.62 ± 0.33 11.90–13.70 | 3.08 ± 0.11 2.90–3.50 |
| Manganese (mg Mn/L) | 0.200 ± 0.088 0.000–0.51 | 0.024 ± 0.008 0.000–0.040 | 0.089 ± 0.071 0.000–0.370 | 0.062 ± 0.019 0.010–0.120 | 0.158 ± 0.071 0.030–0.390 | 0.046 ± 0.028 0.000–0.140 |
| Iron (mg Fe/L) | 0.255 ± 0.115 0.030–0.620 | 0.060 ± 0.038 0.000–0.210 | 0.002 ± 0.002 0.000–0.010 | 0.090 ± 0.022 0.020–0.160 | 0.060 ± 0.2 0.030–0.090 | 0.028 ± 0.019 0.000–0.100 |
Note: 1 source: Jawecki et al. [21].
Table 4.
The comparison of the range of averages values and concentrations of selected water indicators in the analysed Strzelin quarry lakes (gSQL) vs. other mines lakes, and quarry lakes and ponds. (author B.J.).
Table 4.
The comparison of the range of averages values and concentrations of selected water indicators in the analysed Strzelin quarry lakes (gSQL) vs. other mines lakes, and quarry lakes and ponds. (author B.J.).
| Parameter | gSQL 1 Q1–Q6 | Mines and Quarry Lakes in Different Countries | |||||||
|---|---|---|---|---|---|---|---|---|---|
| Poland [21,30,40,46,79,141,148] | Germany [35,42,155] | Australia [18,32,45] | Sweden [51] | France [52] | USA [138] | ||||
| Ore Type | Rock Raw Materials | Rock Raw Materials | Lignite | Coal | Metal | Sand | Metal | Coal | Rock Raw Materials |
| pH (−) | 7.61–7.98 | 2.2–3.4 6.9–9.0 | ~2.8–4.4 ~6.2–9.4 | 1.5–5.5 6.8–8.8 | 2.8–8.6 | 8.5 | 2.7–5.9 | 6.8–9.3 | 7.37–9.74 |
| ECw (mS × cm−1) | 0.194–0.456 | 0.163–5.57 | ~0.200–6.400 | 0.42–28.0 | 0.89–11.0 | 1.2 | 0.295–1.84 | ~1.3–2.4 | 0.409–1.929 |
| (mg N-NO3−/L) | 0.10–0.51 | 0.00–7.79 | ~0.1–4.8 | – | – | – | – | – | – |
| Sulphates (mg SO42−/L) | 143.18–233.48 | 7.40–606.40 | ~200.0–2700 | 31–25,000 | 782–12,000 | 296 | 148–1270 | 500–1200 | – |
| Chlorides (mg Cl−/L) | 15.20–56.92 | 16.60–1099.0 | ~0.5–250 (1250) | 300–8000 | – | – | ~2.2–3.0 | – | – |
| Sodium (mg Na+/L) | 8.20–23.90 | 5.80–55.90 | – | ~440–460 | – | – | – | – | |
| Calcium (mg Ca2+/L) | 21.94–52.84 | 19.60–189.0 | ~0.20–500.0 | 2.3–800 | 0.02–1120 | 67 | – | – | 10.15–29.23 |
| Magnesium (mg Mg2+/L) | 3.08–12.62 | 3.60–37.0 | ~5.0–160.0 | 0.077–120 | 115–3150 | 58 | ~4.2–5.8 | – | 13.82–53.33 |
| Manganese (mg Mn/L) | 0.024–0.200 | 0.000–0.310 1.064–6.317 | ~0.2–11.5 | 0.0002–150 | 0.041–81 | – | ~2.5 | ~0.001–0.37 (4.5) | 0.0076–0.00961 |
| Iron (mg Fe/L) | 0.002–0.255 | 0.000–860 | ~0.2–195 | 0.0003–2463 | 0.05–248 | 0.14 | – | ~0.001–0.30 | 0.138–0.502 |
Note: 1 range of average values.
Table 5.
Evaluation of the usability of quarry lake water for irrigation purposes (author B.J.).
| Parameter | Q1 | Q2 | Q3 | Q4 | Q5 | Q6 | |||||||
|---|---|---|---|---|---|---|---|---|---|---|---|---|---|
| PL | FAO | PL | FAO | PL | FAO | PL | FAO | PL | FAO | PL | FAO | ||
| pH 2,3 | DM | DM | DM | DM | DM | DM | DM | DM | DM | DM | DM | DM | |
| ECw1,3,4 | |||||||||||||
| SAR4 | SH-L | SH-L | SH-L | SH-L | SH-L | SH-L | |||||||
| SAR/ECw3,4 | |||||||||||||
| TDS1,3,4 | DL | DL | DL | DL | DL | DL | DL | DL | DL | DL | DL | DL | |
| BOD5 2 | |||||||||||||
| Nitrates 1,3,4 | |||||||||||||
| Sulphates 2 | |||||||||||||
| Chlorides 1,2,3,4 | |||||||||||||
| Sodium 1,2,3,4 | SU.I | ||||||||||||
| SP.I | |||||||||||||
| Manganese 1,4 | DM | DM | DL | DL | DL | DL | DL | DL | DM | DM | DL | DL | |
| Iron 1,4 | DM | DM | DL | DL | DL | DL | DL | DL | DL | DL | DL | DL | |
| Requirements of the standard PN-84/C-04635 | Met | Failed | No guidelines available | ||||||||||
| Degree of restriction on use water to irrigation | None | Slight to moderate | Severe | No guidelines available | |||||||||
| SU.I—Surface irrigation, SP.I—Sprinkler irrigation SH-L—low, SH-M—medium, SH-H—high, SH-VH—very high-the sodium hazard of irrigation water based on SAR [113]. | |||||||||||||
Disclaimer/Publisher’s Note: The statements, opinions and data contained in all publications are solely those of the individual author(s) and contributor(s) and not of MDPI and/or the editor(s). MDPI and/or the editor(s) disclaim responsibility for any injury to people or property resulting from any ideas, methods, instructions or products referred to in the content. |
© 2023 by the authors. Licensee MDPI, Basel, Switzerland. This article is an open access article distributed under the terms and conditions of the Creative Commons Attribution (CC BY) license (https://creativecommons.org/licenses/by/4.0/).
Share and Cite
MDPI and ACS Style
Jawecki, B.; Kowalczyk, T. The Assessment of the Quality and Quantity of Water Retained in Closed Granite Quarries with the View to Mitigate the Effects of Droughts in Agriculture. Water 2023, 15, 782. https://doi.org/10.3390/w15040782
AMA Style
Jawecki B, Kowalczyk T. The Assessment of the Quality and Quantity of Water Retained in Closed Granite Quarries with the View to Mitigate the Effects of Droughts in Agriculture. Water. 2023; 15(4):782. https://doi.org/10.3390/w15040782
Chicago/Turabian StyleJawecki, Bartosz, and Tomasz Kowalczyk. 2023. "The Assessment of the Quality and Quantity of Water Retained in Closed Granite Quarries with the View to Mitigate the Effects of Droughts in Agriculture" Water 15, no. 4: 782. https://doi.org/10.3390/w15040782
Note that from the first issue of 2016, this journal uses article numbers instead of page numbers. See further details here.