
Potential of Sentinel Images to Evaluate Physicochemical Parameters Concentrations in Water Bodies—Application in a Wetlands System in Northern Colombia
 , , and
Abstract
:1. Introduction
2. Materials and Methods
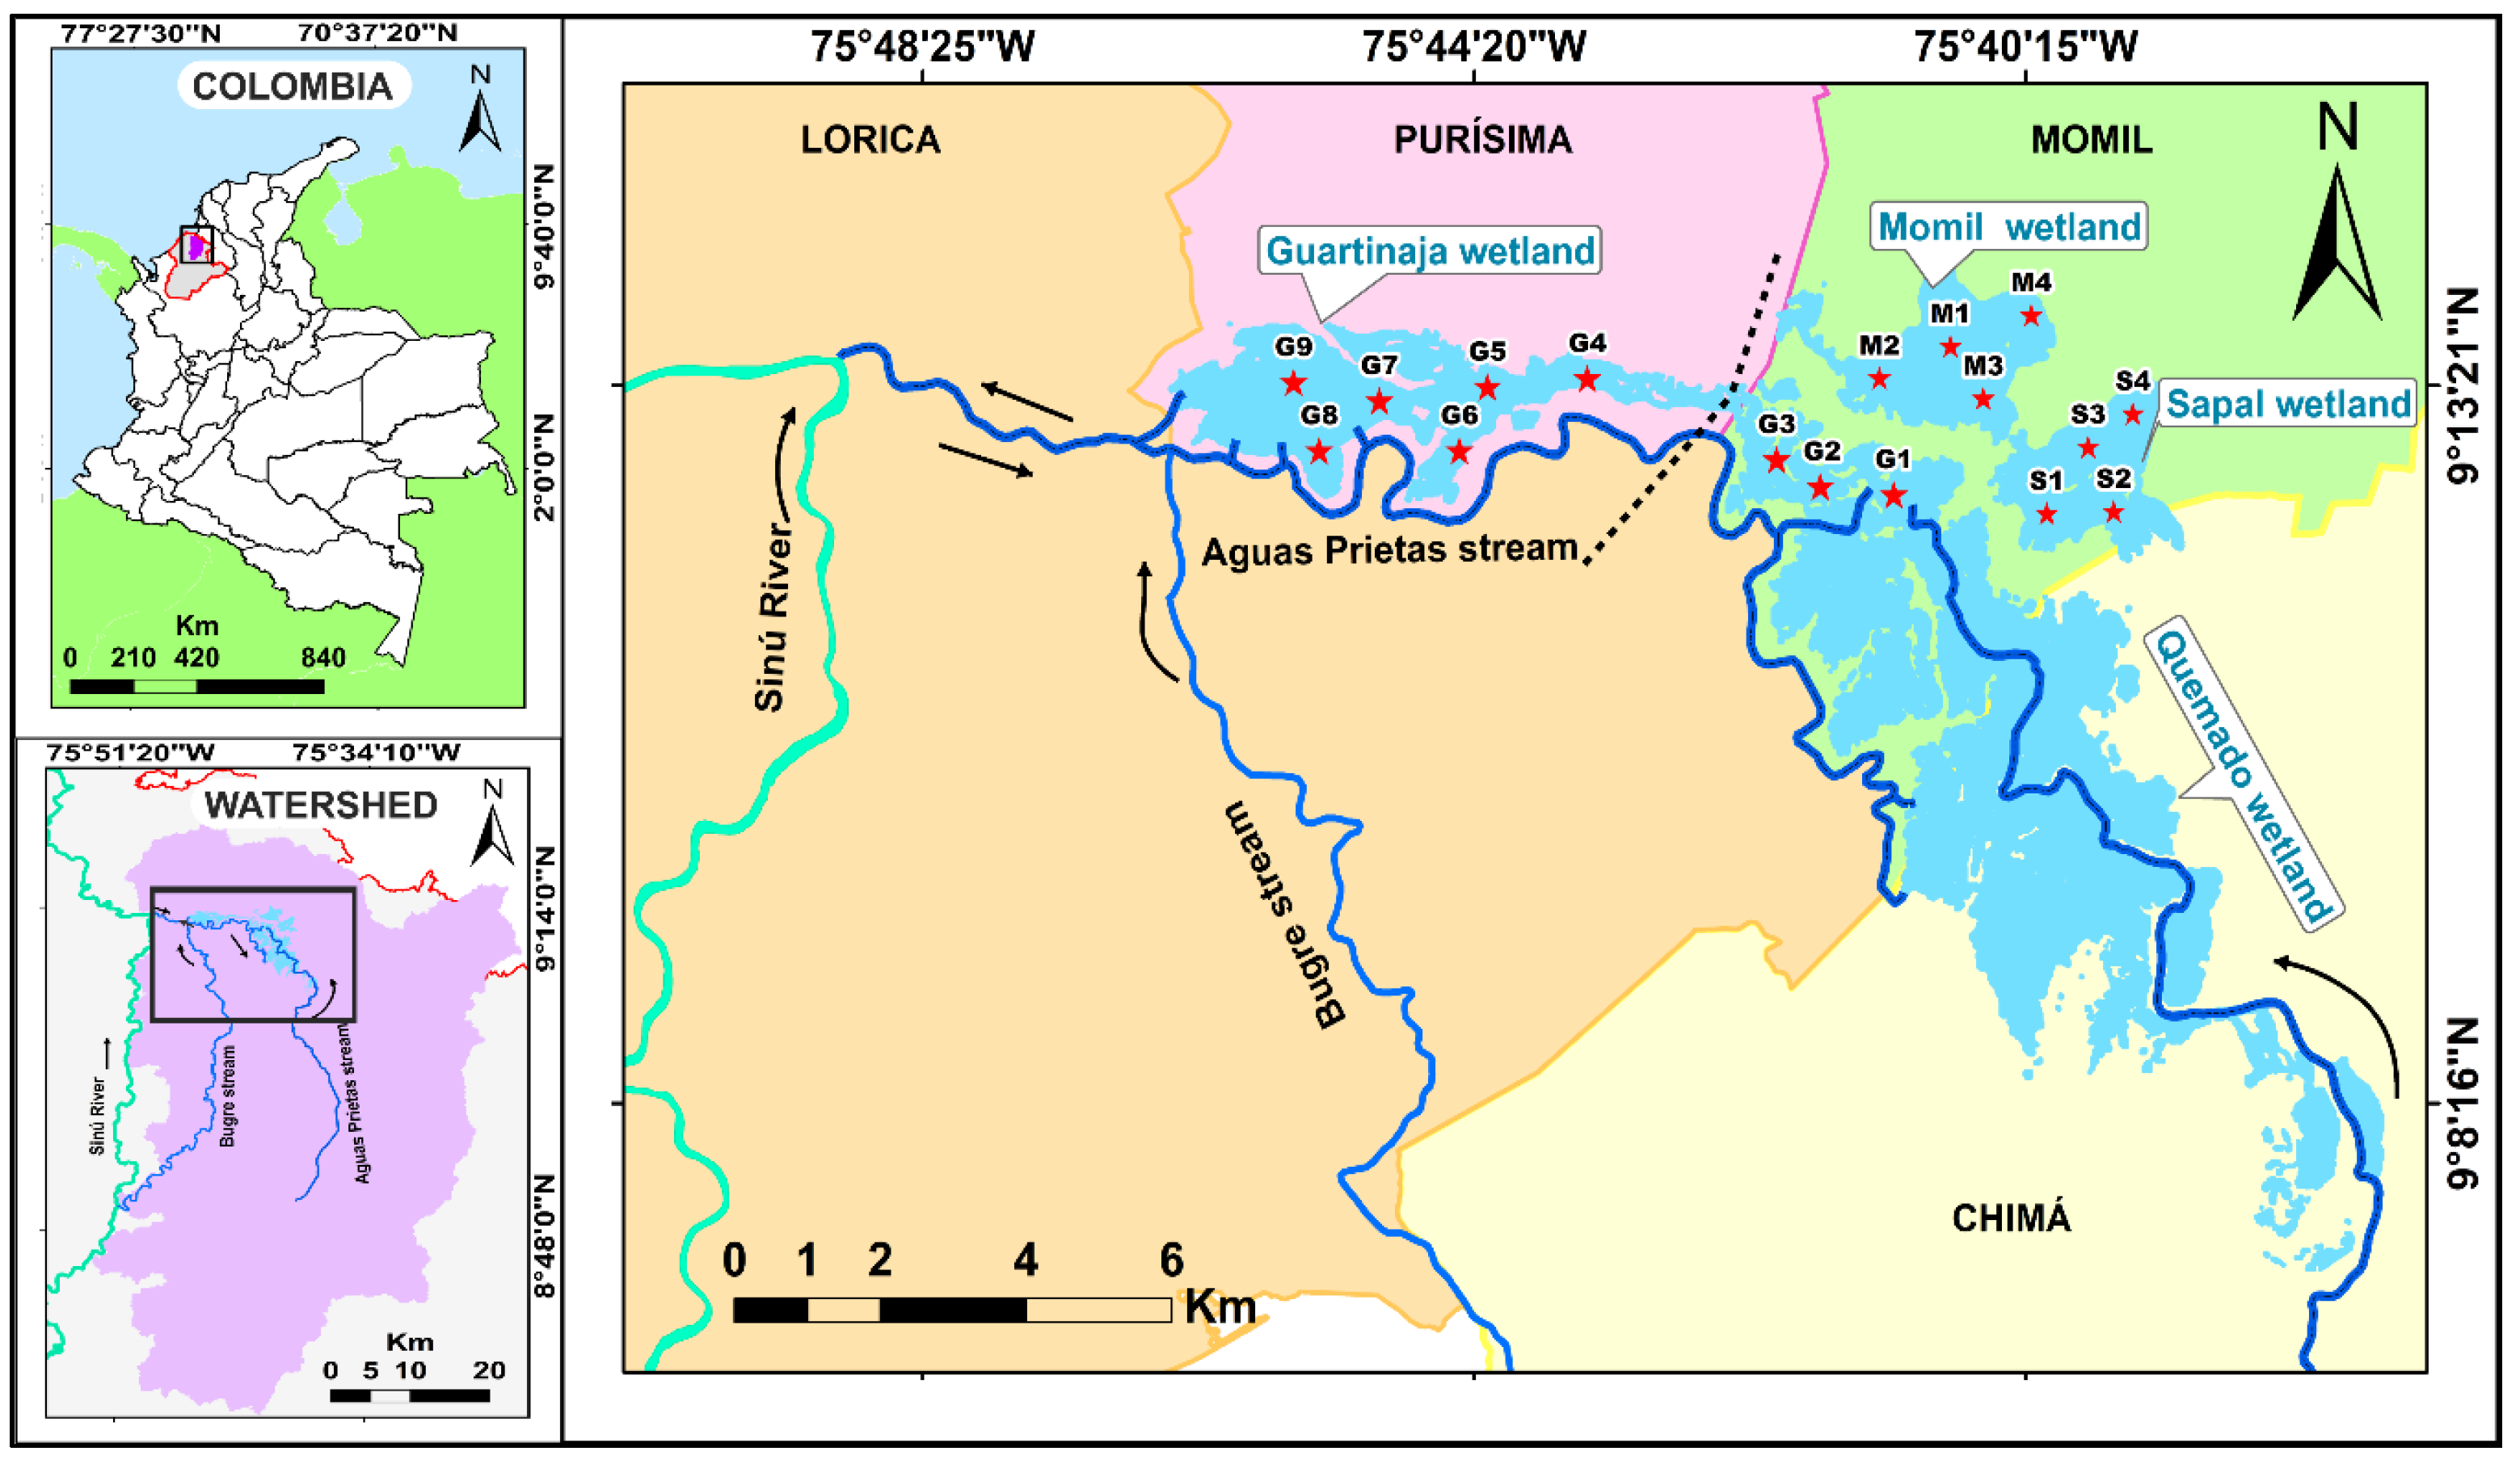
2.1. Study Area
2.2. Environmental Data Analysis
2.3. Satellite Data Source
2.4. Statistical Analysis
2.5. Water Quality Parameters Maps
3. Results
3.1. Water Quality Parameters
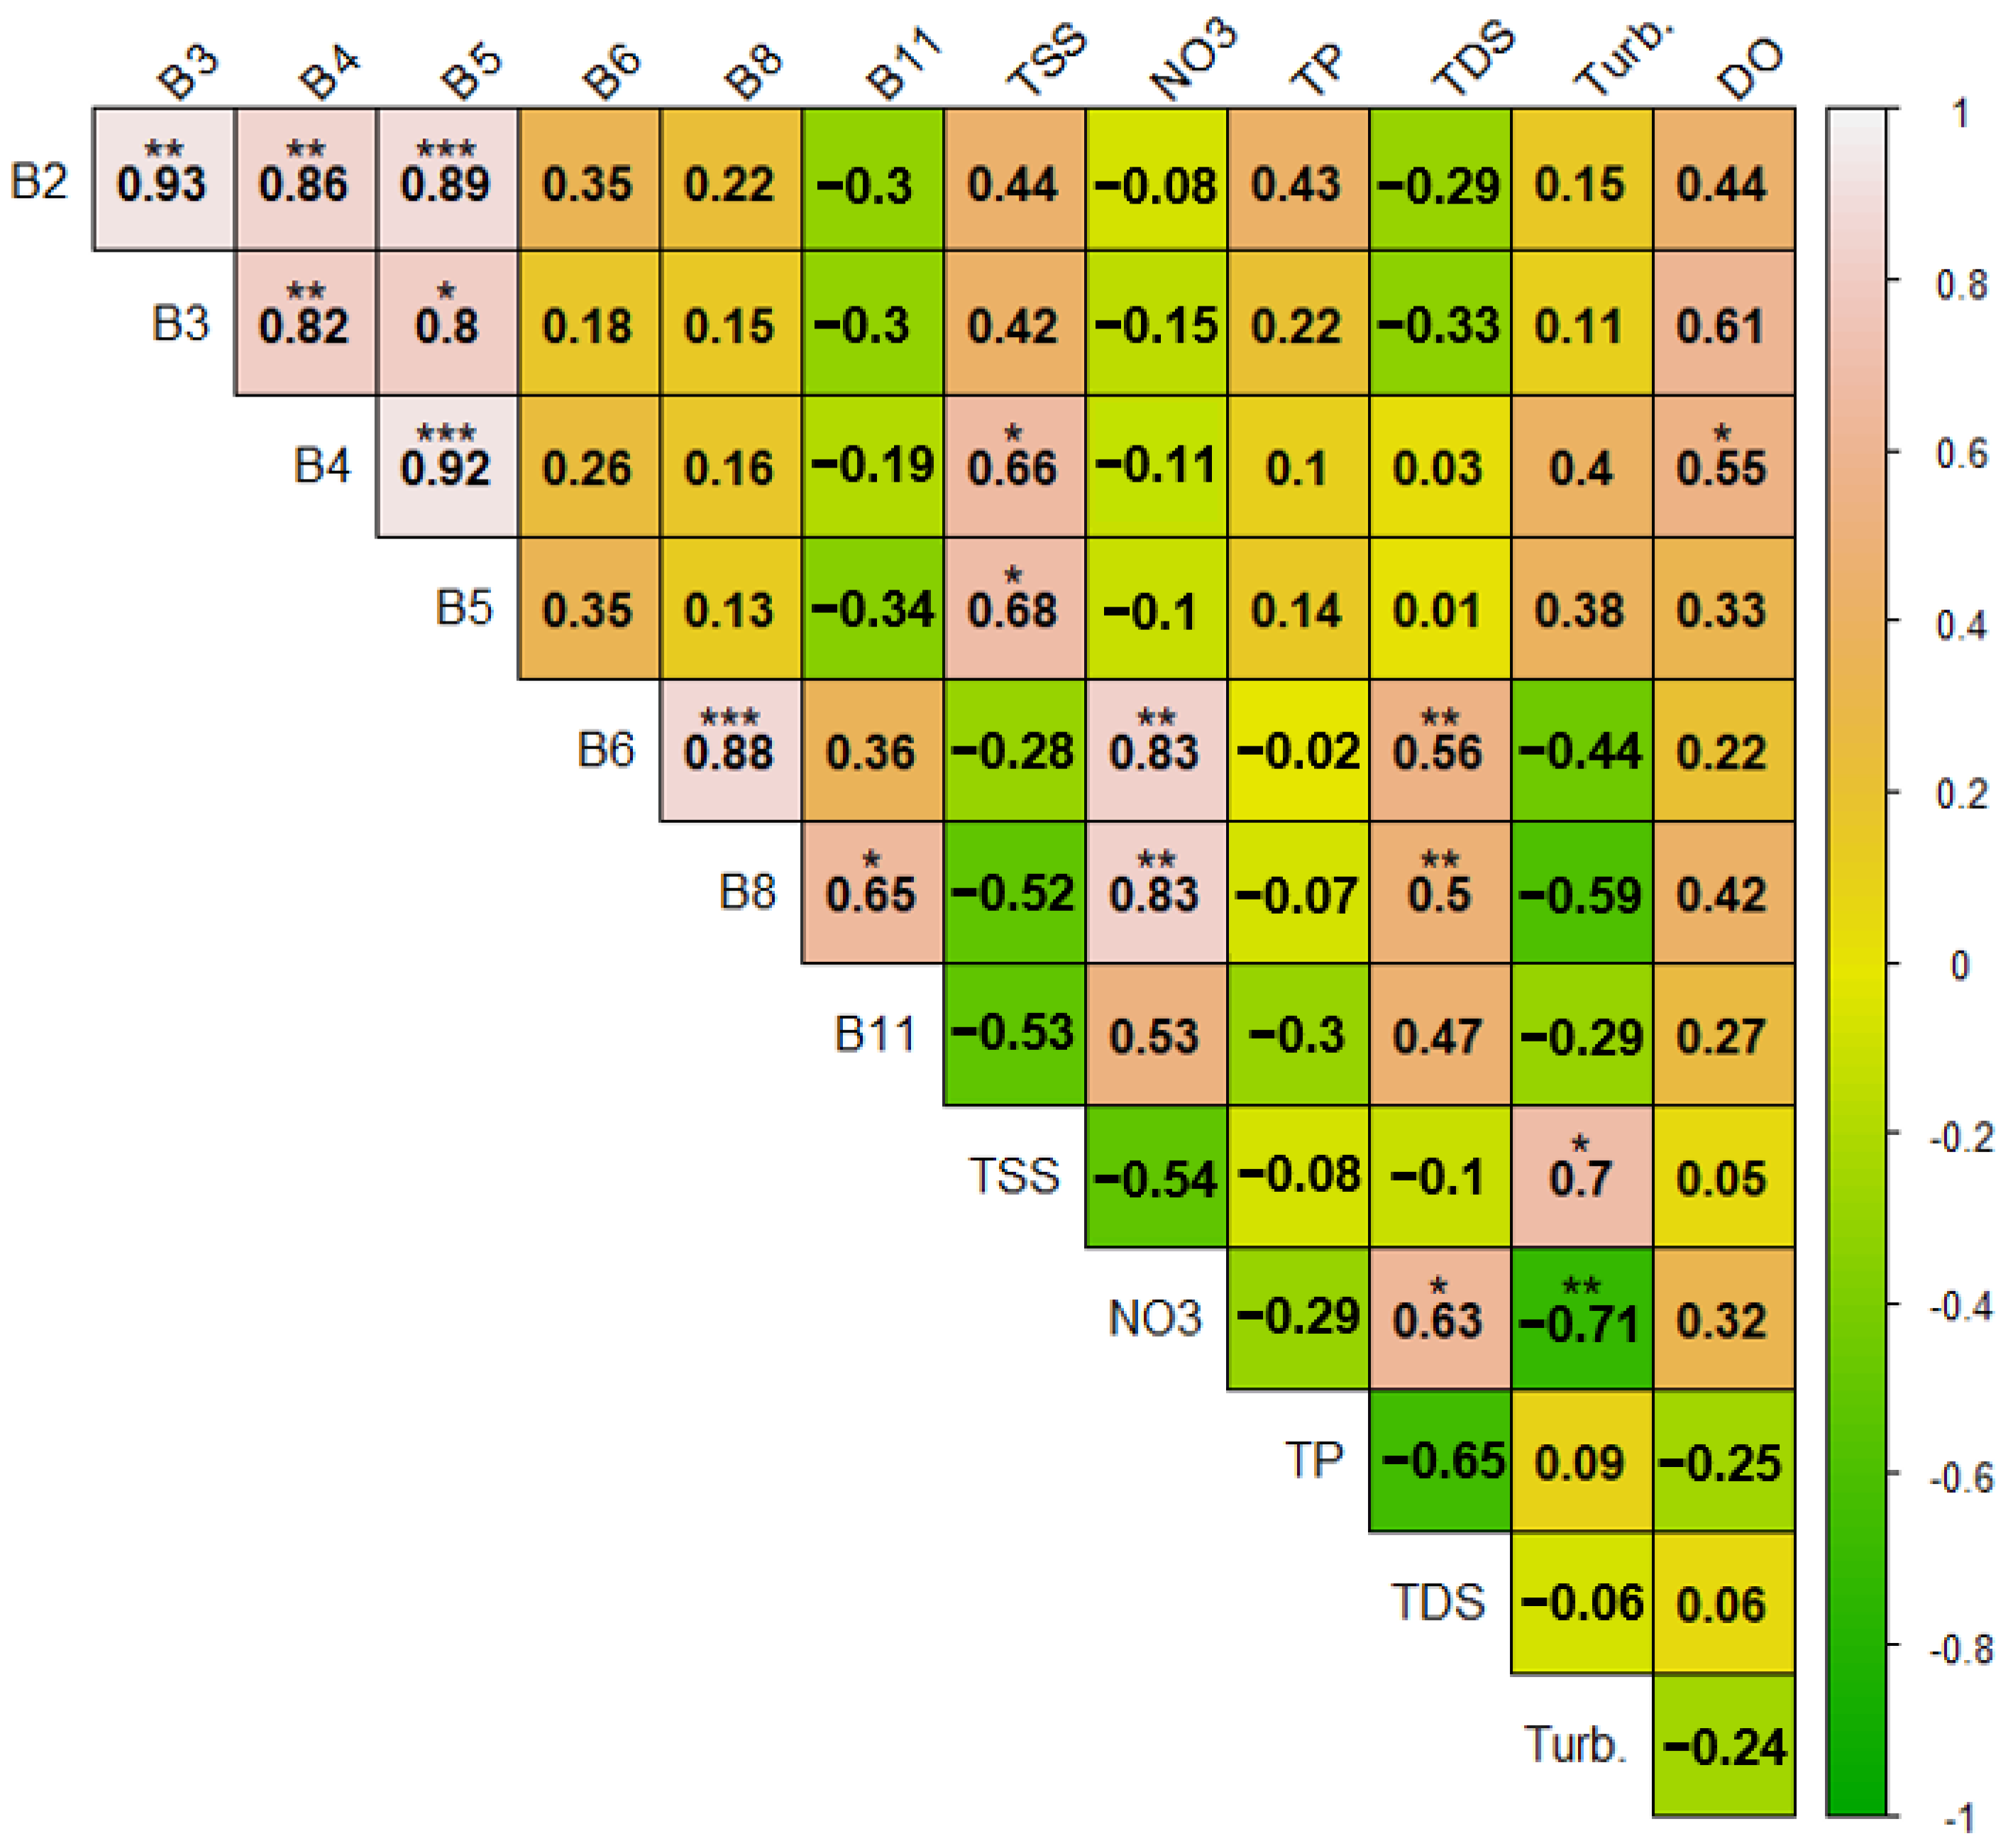
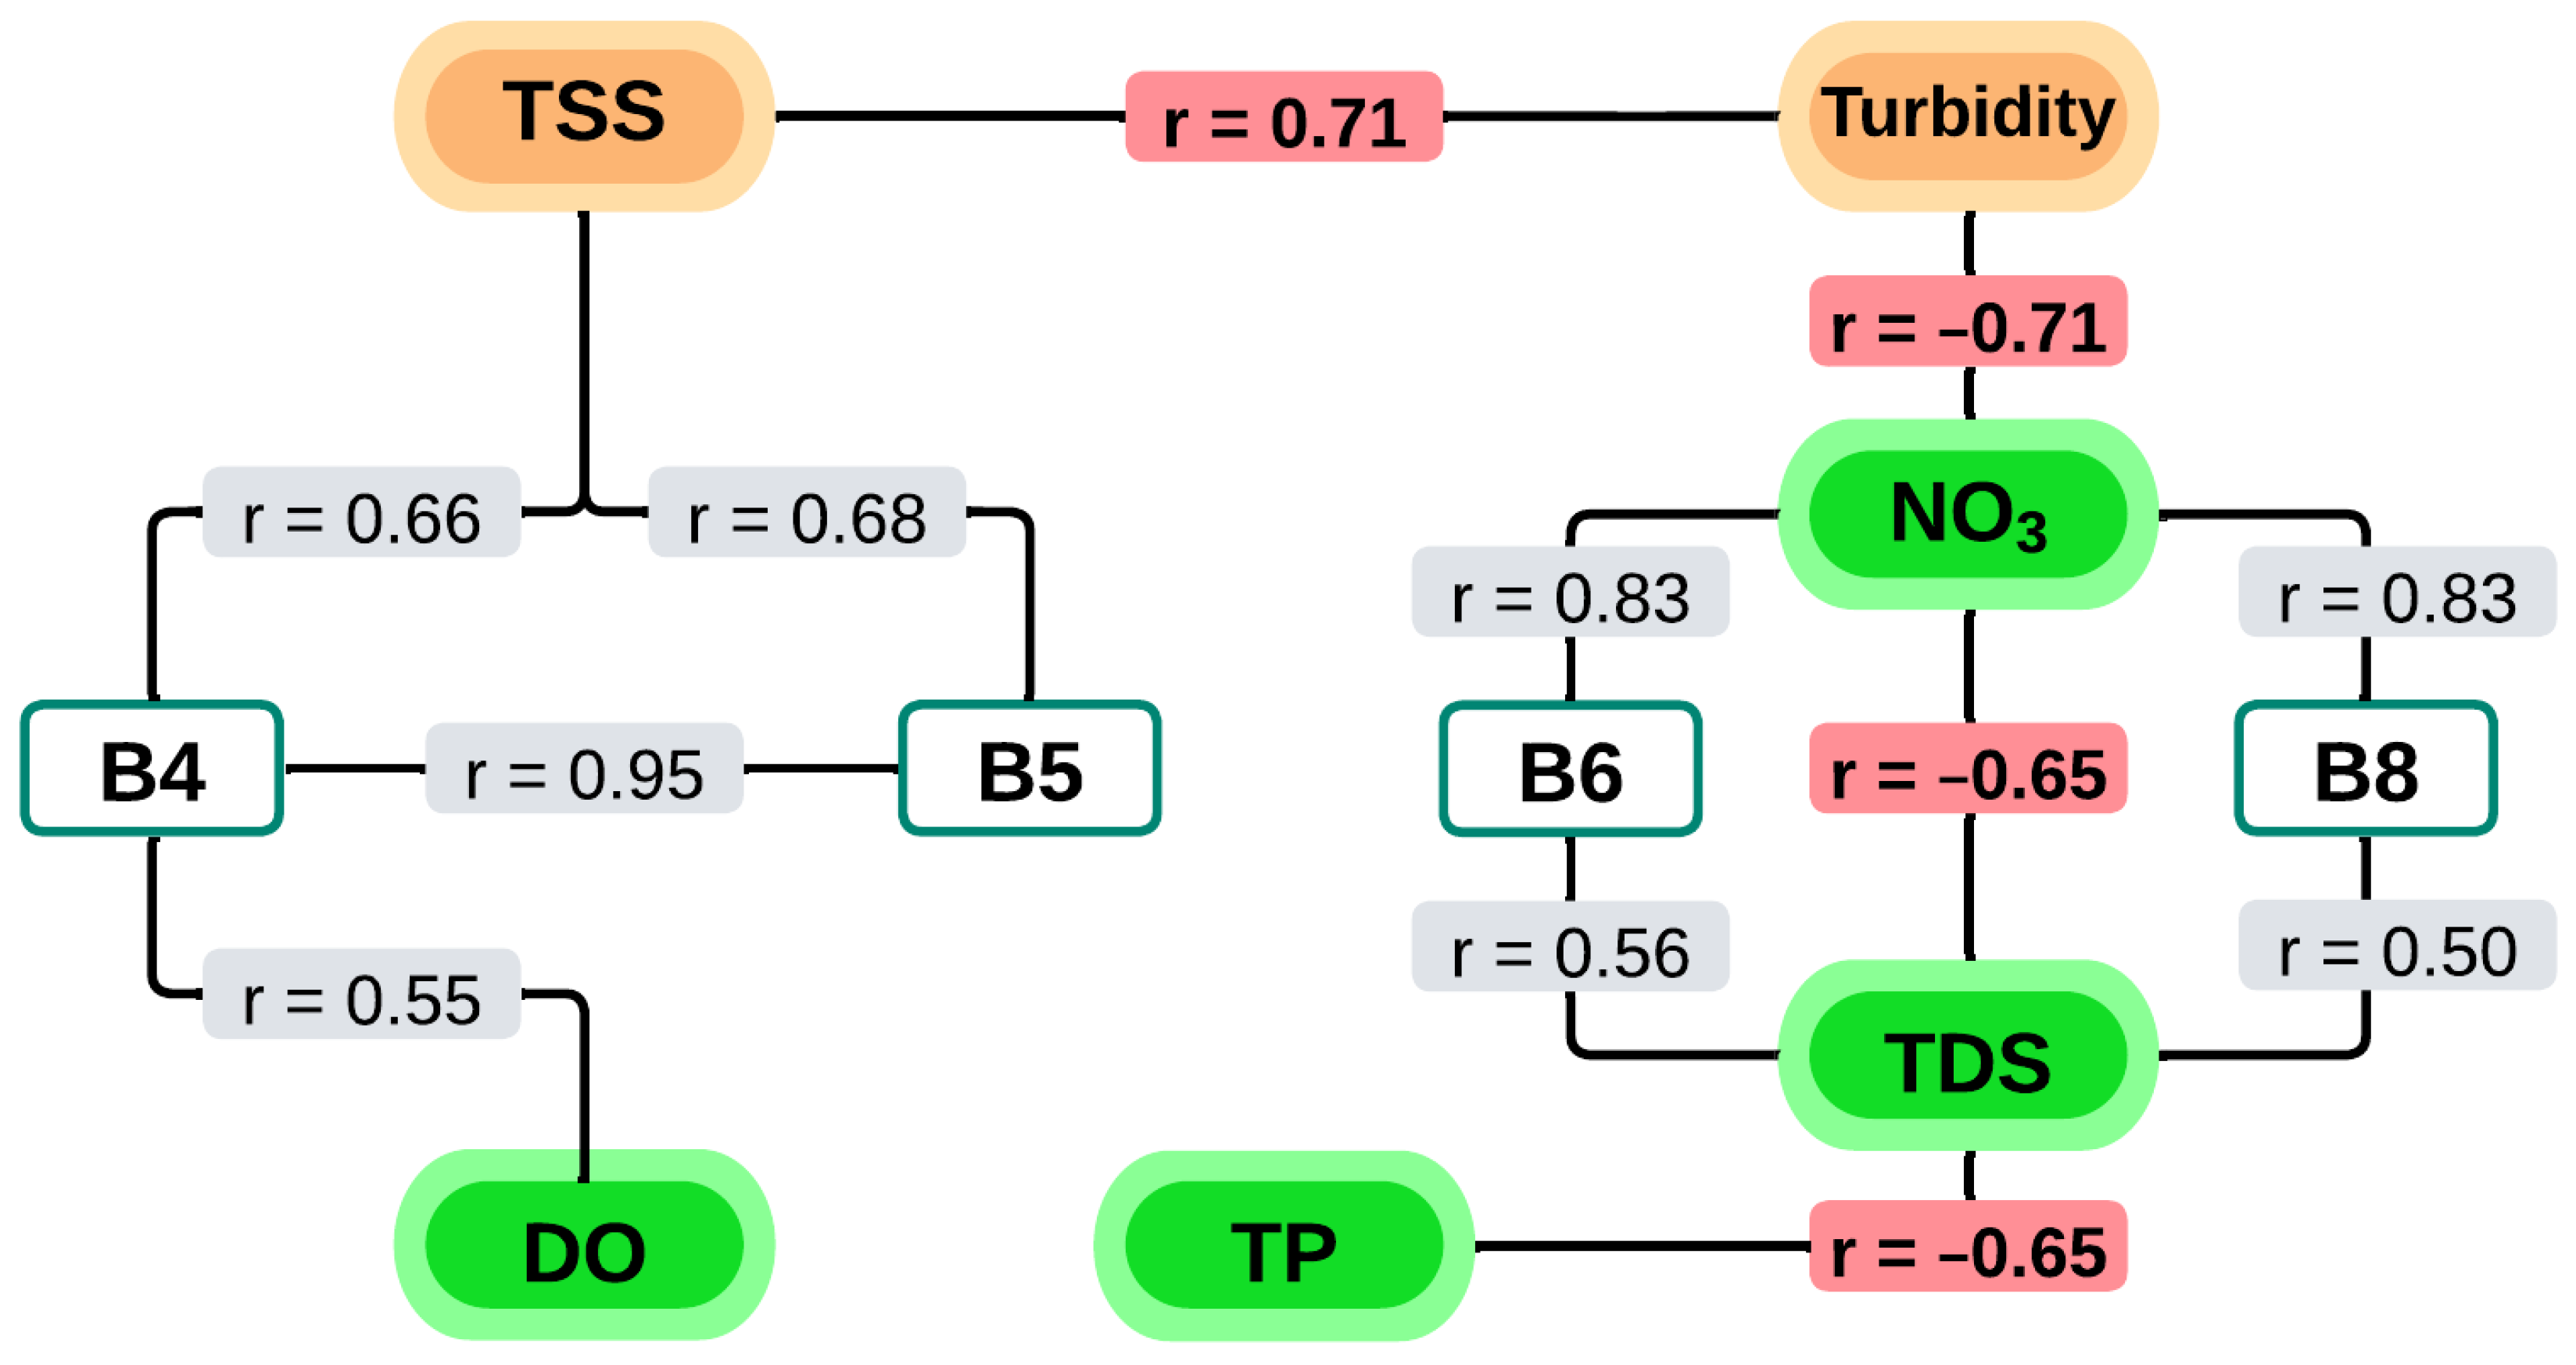
3.2. Correlation Analysis of Water Quality Parameters
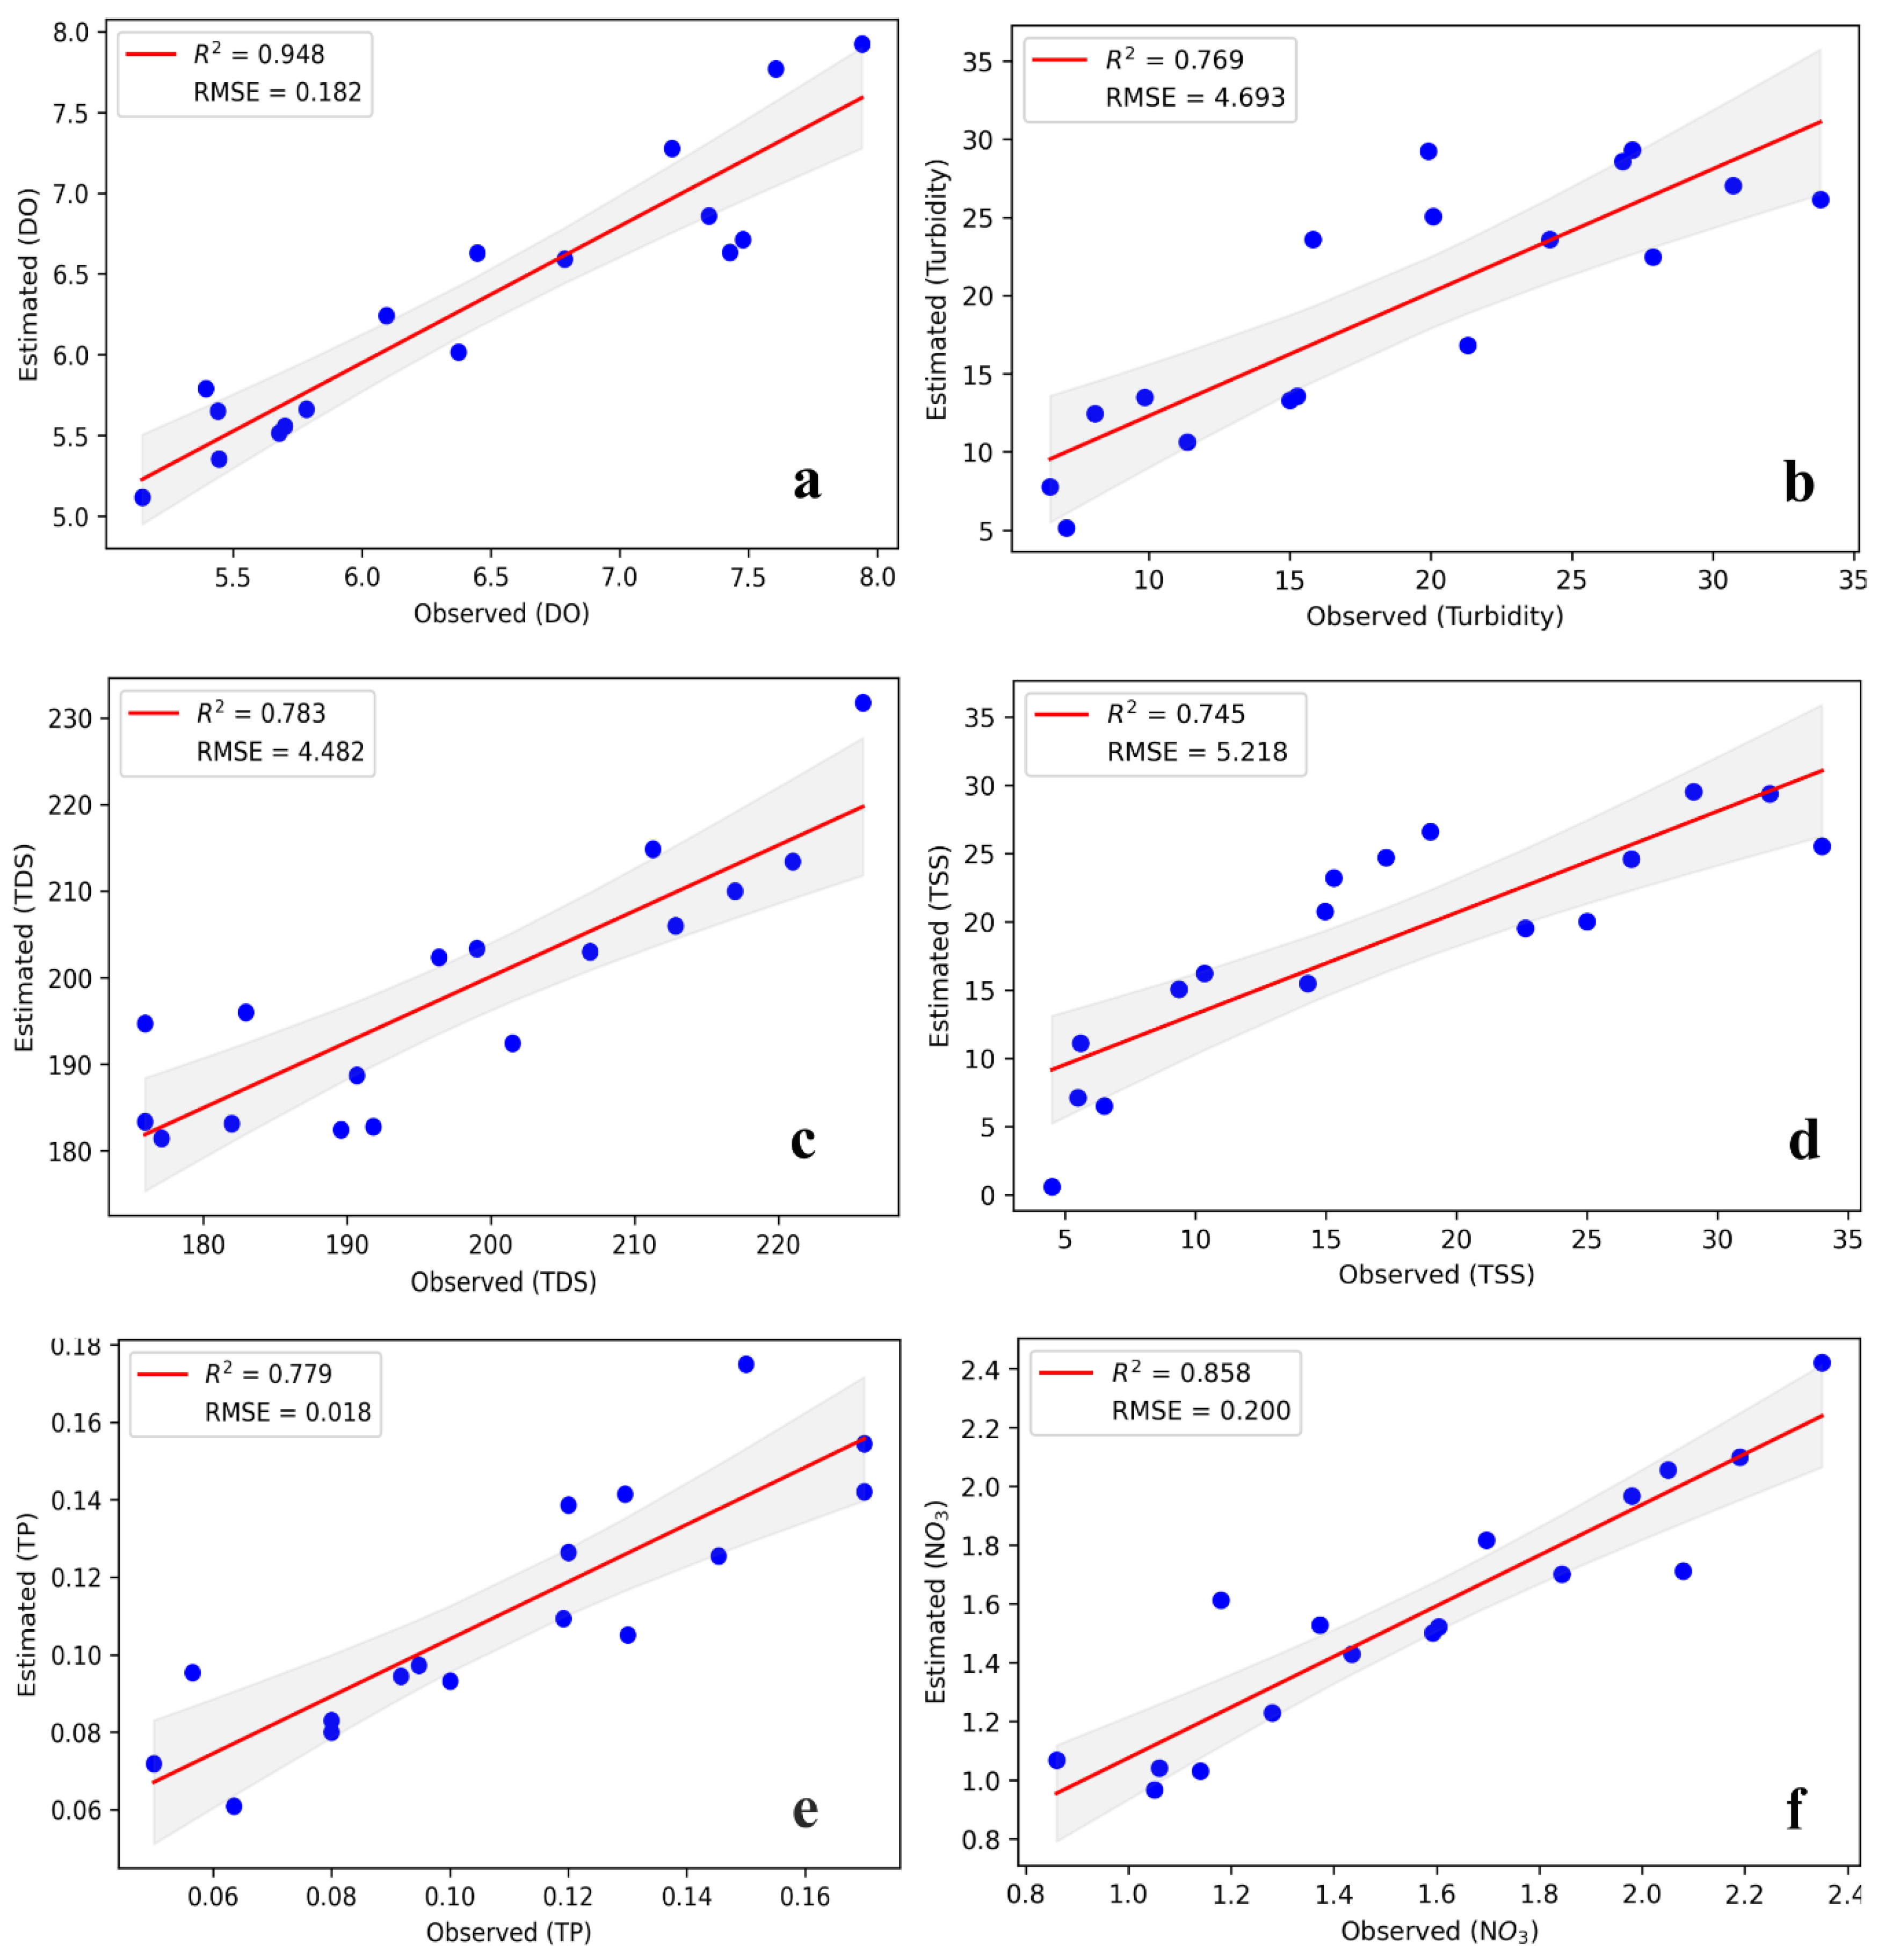
3.3. Regression Models
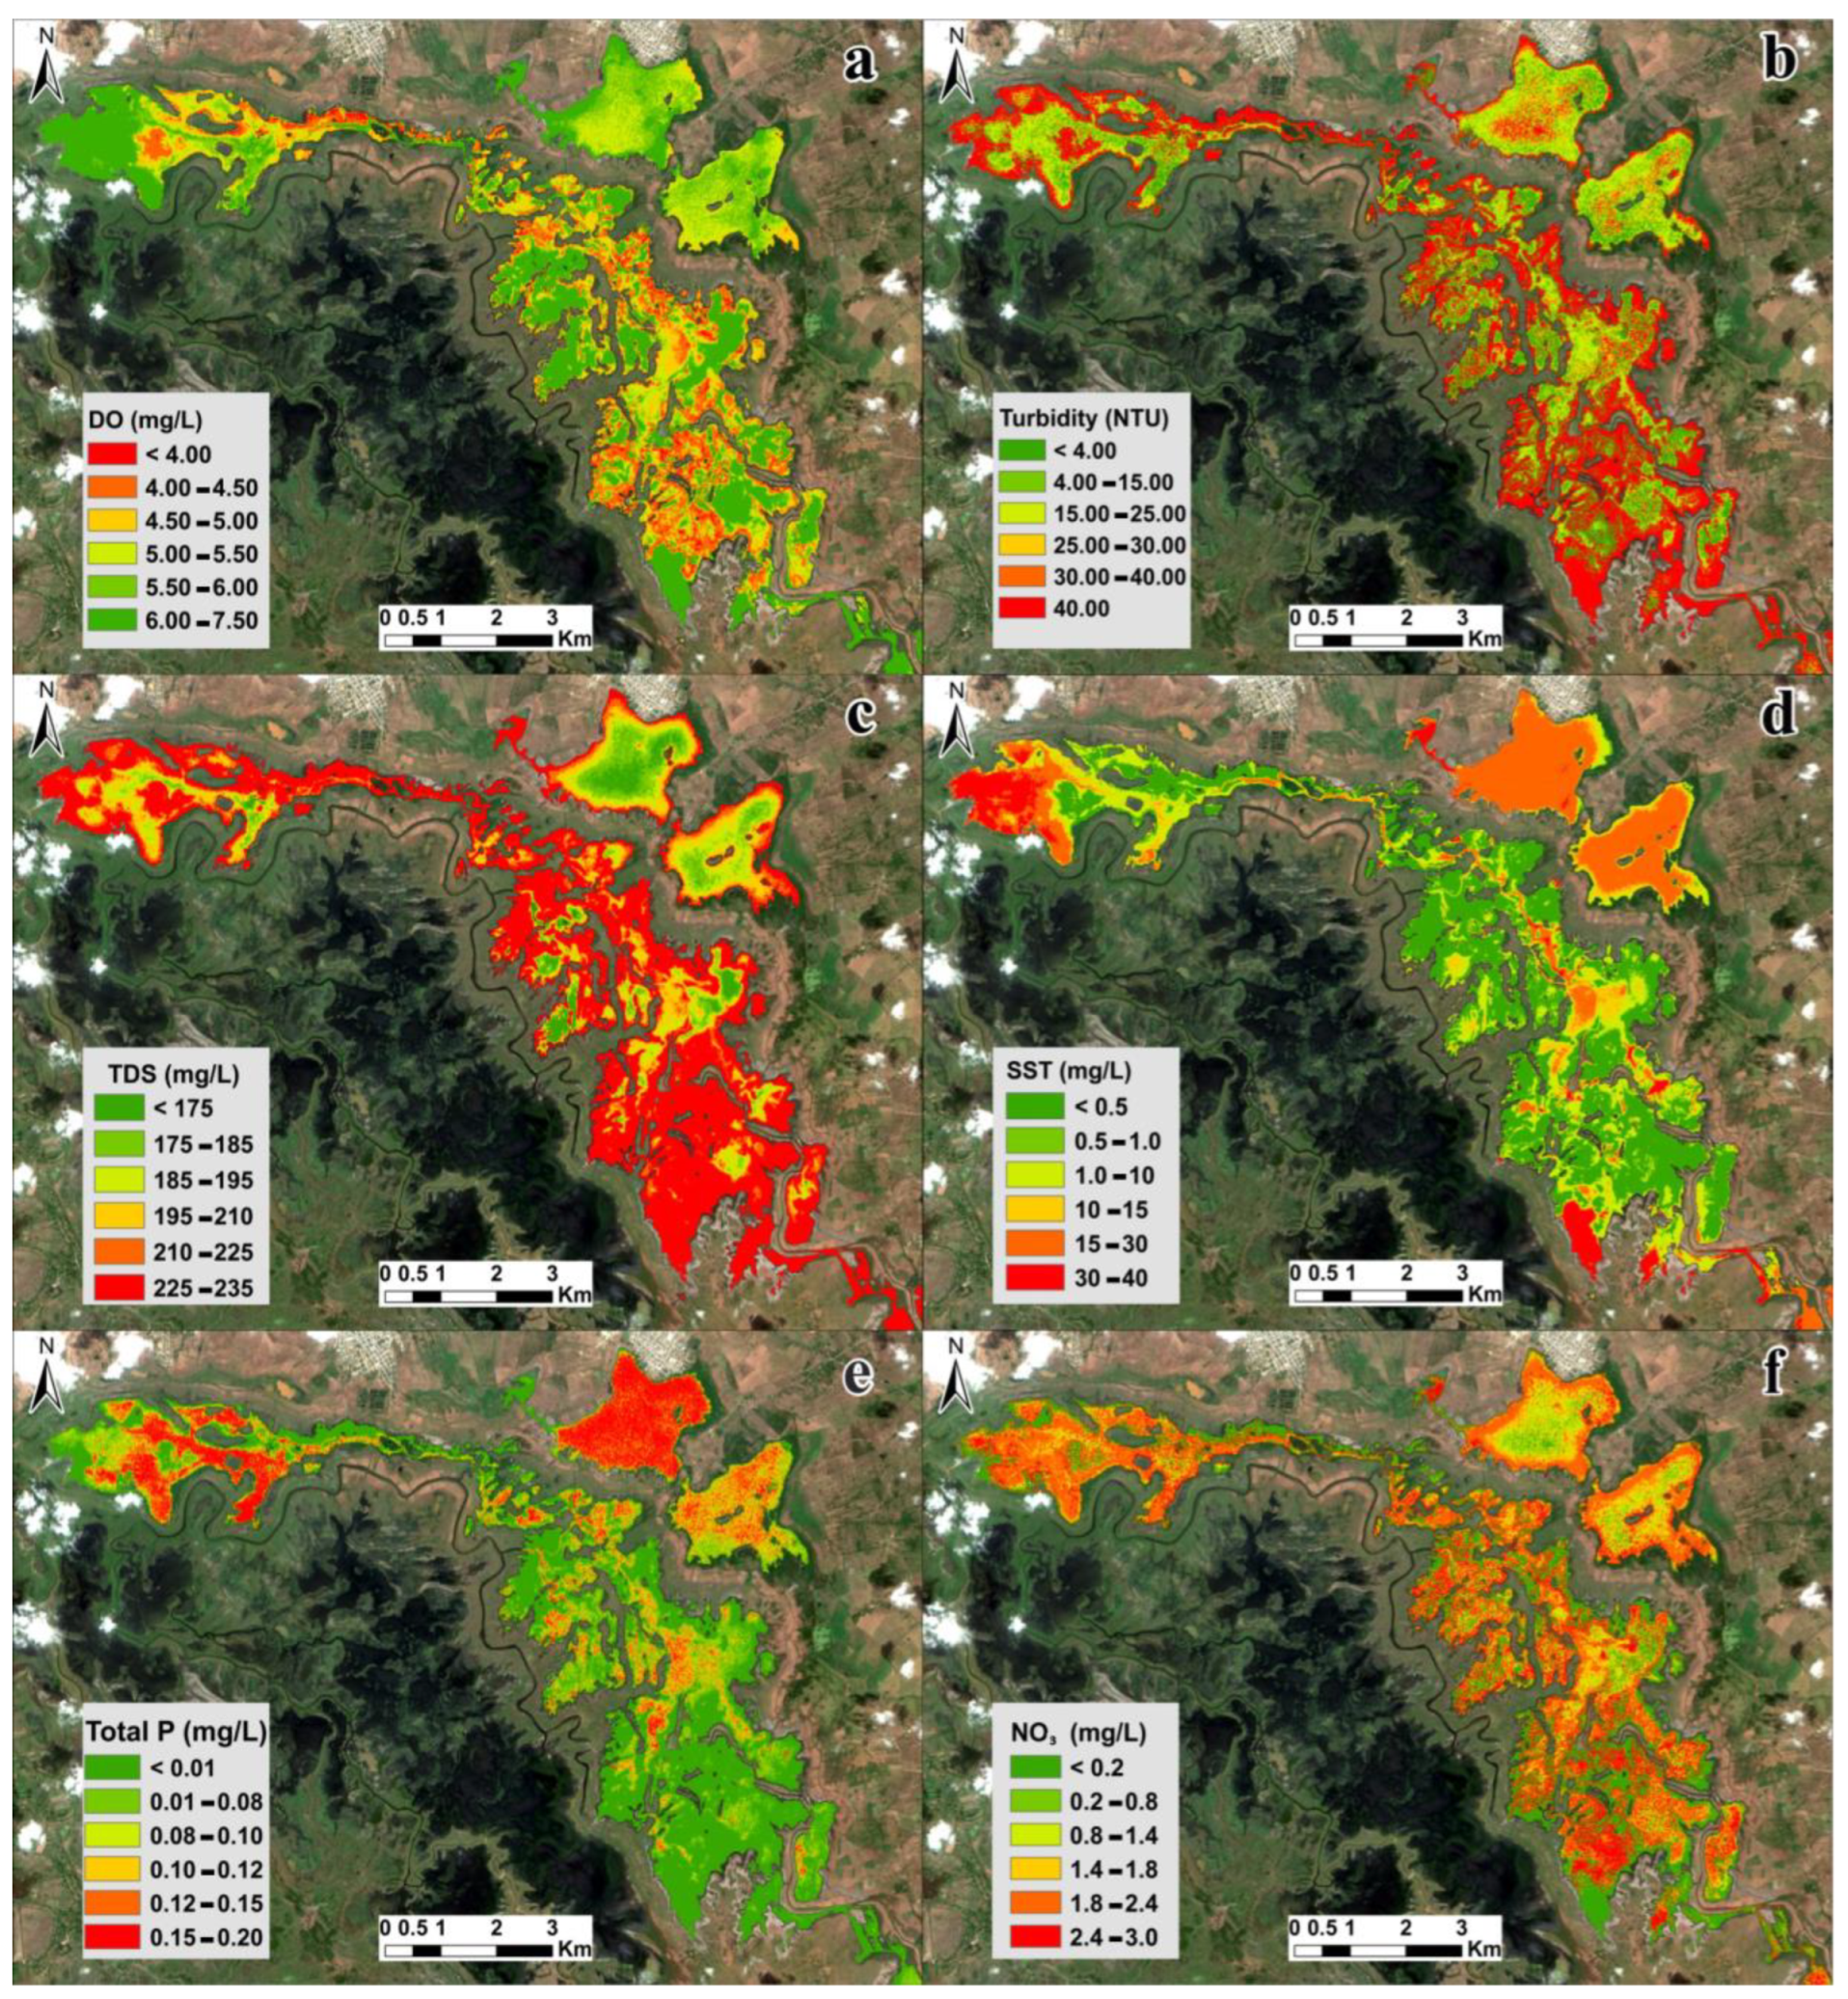
3.4. Concentration Distribution Maps
4. Discussions
4.1. Statistical Correlations between Physicochemical Parameters and Sentinel 2 Bands
4.2. Water Quality Analysis
5. Conclusions
Author Contributions
Funding
Data Availability Statement
Acknowledgments
Conflicts of Interest
References
- Groot, D.; Brander, L.; Finlayson, M. Wetland Ecosystem Services. In The Wetland Book; Finlayson, C.M., Everard, M., Irvine, K., McInnes, R.J., Middleton, B.A., van Dam, A.A., Davidson, N.C., Eds.; Springer Netherlands: Dordrecht, The Netherlands, 2016; pp. 1–11. ISBN 978-94-007-6172-8. [Google Scholar]
- Ritchie, W.; Neal, W.J.; Bush, D.; Pilkey, O.; Blasco, F.; Aizpuru, M.; Besnehard, J.; Bird, E.; Din, N.; Morton, R.A.; et al. Encyclopedia of Coastal Science; Encyclopedia of Earth Sciences Series; Springer International Publishing: New York, NY, USA, 2019; ISBN 978-3-319-93805-9. [Google Scholar]
- Abiye, T. The Role of Wetlands Associated to Urban Micro-Dams in Pollution Attenuation, Johannesburg, South Africa. Wetlands 2015, 35, 1127–1136. [Google Scholar] [CrossRef]
- Marotta, H.; Bento, L.; Esteves, F.D.A.; Enrich-Prast, A. Whole Ecosystem Evidence of Eutrophication Enhancement by Wetland Dredging in a Shallow Tropical Lake. Estuaries Coasts 2009, 32, 654–660. [Google Scholar] [CrossRef] [Green Version]
- Palmer-Felgate, E.J.; Acreman, M.C.; Verhoeven, J.T.; Scholz, M.; Maltby, E.; Stratford, C.J.; Newman, J.; Miller, J.; Coughlin, D. How Effective Are Reedbeds, Ponds, Restored and Constructed Wetlands at Retaining Nitrogen, Phosphorus and Suspended Sediment from Agricultural Pollution in England? Environ. Evid. 2013, 2, 1. [Google Scholar] [CrossRef] [Green Version]
- Sok, T.; Oeurng, C.; Kaing, V.; Sauvage, S.; Lu, X.; Pérez, J.M.S. Nutrient Transport and Exchange between the Mekong River and Tonle Sap Lake in Cambodia. Ecol. Eng. 2022, 176, 1645–1651. [Google Scholar] [CrossRef]
- Rao, K.; Zhang, X.; Yi, X.-J.; Li, Z.-S.; Wang, P.; Huang, G.-W.; Guo, X.-X. Interactive Effects of Environmental Factors on Phytoplankton Communities and Benthic Nutrient Interactions in a Shallow Lake and Adjoining Rivers in China. Sci. Total Environ. 2018, 619–620, 1661–1672. [Google Scholar] [CrossRef]
- Chang, N.-B.; Imen, S.; Vannah, B. Remote Sensing for Monitoring Surface Water Quality Status and Ecosystem State in Relation to the Nutrient Cycle: A 40-Year Perspective. Crit. Rev. Environ. Sci. Technol. 2015, 45, 101–166. [Google Scholar] [CrossRef]
- Jia, Z.; Chang, X.; Duan, T.; Wang, X.; Wei, T.; Li, Y. Water Quality Responses to Rainfall and Surrounding Land Uses in Urban Lakes. J. Environ. Manag. 2021, 298, 113514. [Google Scholar] [CrossRef]
- Nausch, M.; Woelk, J.; Kahle, P.; Nausch, G.; Leipe, T.; Lennartz, B. Phosphorus Fractions in Discharges from Artificially Drained Lowland Catchments (Warnow River, Baltic Sea). Agric. Water Manag. 2017, 187, 77–87. [Google Scholar] [CrossRef]
- Nikolaidis, N.P.; Phillips, G.; Poikane, S.; Várbíró, G.; Bouraoui, F.; Malagó, A.; Lilli, M.A. River and Lake Nutrient Targets That Support Ecological Status: European Scale Gap Analysis and Strategies for the Implementation of the Water Framework Directive. Sci. Total Environ. 2022, 813, 151898. [Google Scholar] [CrossRef]
- Zheng, Z.; Xu, Y.; Wang, J.; Li, Y.; Gu, B. Environmental Stress and Eutrophication in Freshwater Wetlands: Evidence from Carbon and Nitrogen Stable Isotopes in Cattail (Typha Domingensis Pers.). Ecol. Process. 2019, 8, 1–8. [Google Scholar] [CrossRef] [Green Version]
- Breitburg, D.L.; Craig, J.K.; Fulford, R.S.; Rose, K.A.; Boynton, W.R.; Brady, D.C.; Ciotti, B.J.; Diaz, R.J.; Friedland, K.D.; Hagy, J.D.; et al. Nutrient Enrichment and Fisheries Exploitation: Interactive Effects on Estuarine Living Resources and Their Management. Hydrobiologia 2009, 629, 31–47. [Google Scholar] [CrossRef]
- Poikane, S.; Portielje, R.; Denys, L.; Elferts, D.; Kelly, M.; Kolada, A.; Mäemets, H.; Phillips, G.; Søndergaard, M.; Willby, N.; et al. Macrophyte Assessment in European Lakes: Diverse Approaches but Convergent Views of ‘Good’ Ecological Status. Ecol. Indic. 2018, 94, 185–197. [Google Scholar] [CrossRef]
- Wang, Q.; Rogers, M.J.; Ng, S.S.; He, J. Fixed Nitrogen Removal Mechanisms Associated with Sulfur Cycling in Tropical Wetlands. Water Res. 2021, 189, 116619. [Google Scholar] [CrossRef]
- Hes, E.M.A.; van Dam, A.A. Modelling Nitrogen and Phosphorus Cycling and Retention in Cyperus Papyrus Dominated Natural Wetlands. Environ. Model. Softw. 2019, 122, 104531. [Google Scholar] [CrossRef]
- Li, H.; Ma, X.; Zhou, B.; Ren, G.; Yuan, D.; Liu, H.; Wei, Z.; Gu, X.; Zhao, B.; Hu, Y.; et al. An Integrated Migration and Transformation Model to Evaluate the Occurrence Characteristics and Environmental Risks of Nitrogen and Phosphorus in Constructed Wetland. Chemosphere 2021, 277, 130219. [Google Scholar] [CrossRef] [PubMed]
- Campo-Daza, G.A.; Zumaqué, L.; Torres-Bejarano, F.M. Efficiency Assessment of Constructed Wetlands for Fuel Contaminated Water Treatment. Int. J. Environ. Sci. Technol. 2021, 19, 12. [Google Scholar] [CrossRef]
- González-Márquez, L.C.; Torres-Bejarano, F.M.; Rodríguez-Cuevas, C.; Torregroza-Espinosa, A.C.; Sandoval-Romero, J.A. Estimation of Water Quality Parameters Using Landsat 8 Images: Application to Playa Colorada Bay, Sinaloa, Mexico. Appl. Geomat. 2018, 10, 147–158. [Google Scholar] [CrossRef]
- Elsayed, S.; Ibrahim, H.; Hussein, H.; Elsherbiny, O.; Elmetwalli, A.H.; Moghanm, F.S.; Ghoneim, A.M.; Danish, S.; Datta, R.; Gad, M. Assessment of Water Quality in Lake Qaroun Using Ground-Based Remote Sensing Data and Artificial Neural Networks. Water 2021, 13, 3094. [Google Scholar] [CrossRef]
- Germán, A.; Shimoni, M.; Beltramone, G.; Rodríguez, M.I.; Muchiut, J.; Bonansea, M.; Scavuzzo, C.M.; Ferral, A. Space-Time Monitoring of Water Quality in an Eutrophic Reservoir Using SENTINEL-2 Data-A Case Study of San Roque, Argentina. Remote Sens. Appl. Soc. Environ. 2021, 24, 100614. [Google Scholar] [CrossRef]
- Momen, B.; Eichler, L.W.; Boylen, C.W.; Zehr, J.P. Application of Multivariate Statistics in Detecting Temporal and Spatial Patterns of Water Chemistry in Lake George, New York. Ecol. Model. 1996, 91, 183–192. [Google Scholar] [CrossRef]
- Mattikalli, N.M.; Richards, K.S. Estimation of Surface Water Quality Changes in Response to Land Use Change: Application of the Export Coefficient Model Using Remote Sensing and Geographical Information System. J. Environ. Manag. 1996, 48, 263–282. [Google Scholar] [CrossRef]
- Wu, C.; Wu, J.; Qi, J.; Zhang, L.; Huang, H.; Lou, L.; Chen, Y. Empirical Estimation of Total Phosphorus Concentration in the Mainstream of the Qiantang River in China Using Landsat TM Data. Int. J. Remote Sens. 2010, 31, 2309–2324. [Google Scholar] [CrossRef]
- Al-Shaibah, B.; Liu, X.; Zhang, J.; Tong, Z.; Zhang, M.; El-Zeiny, A.; Faichia, C.; Hussain, M.; Tayyab, M. Modeling Water Quality Parameters Using Landsat Multispectral Images: A Case Study of Erlong Lake, Northeast China. Remote Sens. 2021, 13, 1603. [Google Scholar] [CrossRef]
- Deutsch, E.S.; Alameddine, I.; El-Fadel, M. Monitoring Water Quality in a Hypereutrophic Reservoir Using Landsat ETM+ and OLI Sensors: How Transferable Are the Water Quality Algorithms? Environ. Monit. Assess. 2018, 190, 141. [Google Scholar] [CrossRef] [PubMed]
- González-Márquez, L.C.; Torres-Bejarano, F.M.; Torregroza-Espinosa, A.C.; Hansen-Rodríguez, I.R.; Rodríguez-Gallegos, H.B. Use of LANDSAT 8 Images for Depth and Water Quality Assessment of El Guájaro Reservoir, Colombia. J. S. Am. Earth Sci. 2018, 82, 231–238. [Google Scholar] [CrossRef]
- Olmanson, L.G.; Bauer, M.E.; Brezonik, P.L. A 20-Year Landsat Water Clarity Census of Minnesota’s 10,000 Lakes. Remote Sens. Environ. 2008, 112, 4086–4097. [Google Scholar] [CrossRef]
- Robert, E.; Grippa, M.; Kergoat, L.; Pinet, S.; Gal, L.; Cochonneau, G.; Martinez, J.-M. Monitoring Water Turbidity and Surface Suspended Sediment Concentration of the Bagre Reservoir (Burkina Faso) Using MODIS and Field Reflectance Data. Int. J. Appl. Earth Observ. Geoinf. 2016, 52, 243–251. [Google Scholar] [CrossRef]
- Torregroza-Espinosa, A.C.; Restrepo, J.C.; Correa-Metrio, A.; Hoyos, N.; Escobar, J.; Pierini, J.; Martínez, J.-M. Fluvial and Oceanographic Influences on Suspended Sediment Dispersal in the Magdalena River Estuary. J. Mar. Syst. 2020, 204, 103282. [Google Scholar] [CrossRef]
- Maciel, D.A.; Barbosa, C.C.F.; de Moraes Novo, E.M.L.; Júnior, R.F.; Begliomini, F.N. Water Clarity in Brazilian Water Assessed Using Sentinel-2 and Machine Learning Methods. ISPRS J. Photogramm. Remote Sens. 2021, 182, 134–152. [Google Scholar] [CrossRef]
- Sòria-Perpinyà, X.; Vicente, E.; Urrego, P.; Pereira-Sandoval, M.; Ruíz-Verdú, A.; Delegido, J.; Soria, J.M.; Moreno, J. Remote Sensing of Cyanobacterial Blooms in a Hypertrophic Lagoon (Albufera of València, Eastern Iberian Peninsula) Using Multitemporal Sentinel-2 Images. Sci. Total Environ. 2020, 698, 134305. [Google Scholar] [CrossRef]
- Torres-Bejarano, F.M.; Arteaga-Hernández, F.; Rodríguez-Ibarra, D.; Mejía-Ávila, D.; González-Márquez, L.C. Water Quality Assessment in a Wetland Complex Using Sentinel 2 Satellite Images. Int. J. Environ. Sci. Technol. 2021, 18, 2345–2356. [Google Scholar] [CrossRef]
- Casal, G. Assessment of Sentinel-2 to Monitor Highly Dynamic Small Water Bodies: The Case of Louro Lagoon (Galicia, NW Spain). Oceanologia 2022, 64, 88–102. [Google Scholar] [CrossRef]
- Petus, C.; Waterhouse, J.; Lewis, S.; Vacher, M.; Tracey, D.; Devlin, M. A Flood of Information: Using Sentinel-3 Water Colour Products to Assure Continuity in the Monitoring of Water Quality Trends in the Great Barrier Reef (Australia). J. Environ. Manag. 2019, 248, 109255. [Google Scholar] [CrossRef] [PubMed]
- Mortula, M.; Ali, T.; Bachir, A.; Elaksher, A.; Abouleish, M. Towards Monitoring of Nutrient Pollution in Coastal Lake Using Remote Sensing and Regression Analysis. Water 2020, 12, 1954. [Google Scholar] [CrossRef]
- Torregroza-Espinosa, A.C.; Restrepo, J.C.; Escobar, J.; Brenner, M.; Newton, A. Nutrient Inputs and Net Ecosystem Productivity in the Mouth of the Magdalena River, Colombia. Estuar. Coast. Shelf Sci. 2020, 243, 106899. [Google Scholar] [CrossRef]
- Bonansea, M.; Ledesma, M.; Bazán, R.; Ferral, A.; German, A.; O’Mill, P.; Rodriguez, C.; Pinotti, L. Evaluating the Feasibility of Using Sentinel-2 Imagery for Water Clarity Assessment in a Reservoir. J. S. Am. Earth Sci. 2019, 95, 102265. [Google Scholar] [CrossRef]
- Isenstein, E.M.; Park, M.-H. Assessment of Nutrient Distributions in Lake Champlain Using Satellite Remote Sensing. J. Environ. Sci. 2014, 26, 1831–1836. [Google Scholar] [CrossRef]
- Gao, Y.; Gao, J.; Yin, H.; Liu, C.; Xia, T.; Wang, J.; Huang, Q. Remote Sensing Estimation of the Total Phosphorus Concentration in a Large Lake Using Band Combinations and Regional Multivariate Statistical Modeling Techniques. J. Environ. Manag. 2015, 151, 33–43. [Google Scholar] [CrossRef]
- Trinh, L.; Zablotskii, V.; Nguyen, T. Determining the Concentration of Suspended Sediment in the Lower Đáy River (Northern Vietnam) Using MSI Sentinel 2 High Spatial Resolution Data. Izv. Atmos. Ocean. Phys. 2020, 56, 1645–1651. [Google Scholar] [CrossRef]
- Poikane, S.; Phillips, G.; Birk, S.; Free, G.; Kelly, M.G.; Willby, N.J. Deriving Nutrient Criteria to Support ‘good’ Ecological Status in European Lakes: An Empirically Based Approach to Linking Ecology and Management. Sci. Total Environ. 2019, 650, 2074–2084. [Google Scholar] [CrossRef]
- Lasso, C.A.; Gutiérrez, F.D.P.; Morales, B.D. Humedales Interiores de Colombia: Identificación, Caracterización y Establecimiento de Límites Según Criterios Biológicos y Ecológicos; Instituto de Investigacion de Recursos Biológicos Alexander von Humboldt: Bogotá, Colombia, 2014; ISBN 978-958-8889-28-3. [Google Scholar]
- Ministerio del Medio Ambiente. Política Nacional Para Humedales Interiores de Colombia 2002. Available online: https://faolex.fao.org/docs/pdf/col191716.pdf (accessed on 27 January 2013).
- CVS Acuerdo de Consejo Directivo No. 76 2007. Available online: https://runap.parquesnacionales.gov.co/area-protegida/520 (accessed on 19 September 2022).
- DANE. Serie Municipal de Población Por Área, Para El Periodo 2018–2035; Departamento Administrativo Nacional de Estadística: Bogotá, Columbia, 2020. [Google Scholar]
- Barrientos Zuluaga, A.E.; Estrada Posada, A.J.; Vélez Flórez, G.L.; Vélez Upegui, J.I.; Racero Casarrubia, J.; Rios Góme, J.; Posada, J.A.; Caballero Acosta, J.H.; Giraldo, J.F.; Rios, L.; et al. Plan de manejo y ordenamiento ambiental del complejo cenagoso del bajo Sinú; Universidad Nacional, Sede Medellín: Medellín, Colombia, 2008; ISBN 978-958-8256-87-0. [Google Scholar]
- Correa, P.; Vélez, J.; Smith, R.; Vélez, A.; Barrientos, A.; Gómez, J. Metodología de Balance Hídrico y de Sedimentos Como Herramienta de Apoyo Para La Gestión Integral Del Complejo Lagunar Del Bajo Sinú. Av. Recur. Hidrául. 2006, 14, 71–86. [Google Scholar]
- Ávila, D.M.; Torres-Bejarano, F.M.; Lara, Z.M. Spectral Indices for Estimating Total Dissolved Solids in Freshwater Wetlands Using Semi-Empirical Models. A Case Study of Guartinaja and Momil Wetlands. Int. J. Remote Sens. 2022, 43, 2156–2184. [Google Scholar] [CrossRef]
- Instituto De Hidrología, Meteorología Y Estudios Ambientales De Colombia. IDEAM Guía Para El Monitoreo de Descargas, Aguas Superficiales y Subterráneas; Instituto De Hidrología, Meteorología Y Estudios Ambientales De Colombia: Bogotá, Columbia, 2017. [Google Scholar]
- Gascon, F.; Bouzinac, C.; Thépaut, O.; Jung, M.; Francesconi, B.; Louis, J.; Lonjou, V.; Lafrance, B.; Massera, S.; Gaudel-Vacaresse, A.; et al. Copernicus Sentinel-2A Calibration and Products Validation Status. Remote Sens. 2017, 9, 584. [Google Scholar] [CrossRef] [Green Version]
- Olatunji, S.O. Modeling Optical Energy Gap of Strontium Titanate Multifunctional Semiconductor Using Stepwise Regression and Genetic Algorithm Based Support Vector Regression. Comput. Mater. Sci. 2021, 200, 110797. [Google Scholar] [CrossRef]
- Rhyma, P.P.; Norizah, K.; Hamdan, O.; Faridah-Hanum, I.; Zulfa, A.W. Integration of Normalised Different Vegetation Index and Soil-Adjusted Vegetation Index for Mangrove Vegetation Delineation. Remote Sens. Appl. Soc. Environ. 2020, 17, 100280. [Google Scholar] [CrossRef]
- Qu, X.; Chen, Y.; Liu, H.; Xia, W.; Lu, Y.; Gang, D.D.; Lin, L.S. A Holistic Assessment of Water Quality Condition and Spatiotemporal Patterns in Impounded Lakes along the Eastern Route of China’s South-to-North Water Diversion Project. Water Res. 2020, 185, 116275. [Google Scholar] [CrossRef] [PubMed]
- Wu, J.-L.; Ho, C.-R.; Huang, C.-C.; Srivastav, A.; Tzeng, J.-H.; Lin, Y.-T. Hyperspectral Sensing for Turbid Water Quality Monitoring in Freshwater Rivers: Empirical Relationship between Reflectance and Turbidity and Total Solids. Sensors 2014, 14, 22670–22688. [Google Scholar] [CrossRef] [Green Version]
- Brezonik, P.; Menken, K.D.; Bauer, M. Landsat-Based Remote Sensing of Lake Water Quality Characteristics, Including Chlorophyll and Colored Dissolved Organic Matter (CDOM). Lake Reserv. Manag. 2005, 21, 373–382. [Google Scholar] [CrossRef]
- Butler, B.A.; Ford, R.G. Evaluating Relationships between Total Dissolved Solids (TDS) and Total Suspended Solids (TSS) in a Mining-Influenced Watershed. Mine Water Environ. 2018, 37, 18–30. [Google Scholar] [CrossRef]
- Adusei, Y.Y.; Quaye-Ballard, J.; Adjaottor, A.A.; Mensah, A.A. Spatial Prediction and Mapping of Water Quality of Owabi Reservoir from Satellite Imageries and Machine Learning Models. Egypt. J. Remote Sens. Sp. Sci. 2021, 24, 825–833. [Google Scholar] [CrossRef]
- Geng, M.; Wang, K.; Yang, N.; Li, F.; Zou, Y.; Chen, X.; Deng, Z.; Xie, Y. Spatiotemporal Water Quality Variations and Their Relationship with Hydrological Conditions in Dongting Lake after the Operation of the Three Gorges Dam, China. J. Clean. Prod. 2021, 283, 124644. [Google Scholar] [CrossRef]
- Ji, G.; Havens, K. Periods of Extreme Shallow Depth Hinder but Do Not Stop Long-Term Improvements of Water Quality in Lake Apopka, Florida (USA). Water 2019, 11, 538. [Google Scholar] [CrossRef] [Green Version]
- Pérez-Vásquez, N.D.S.; Arias-Rios, J.; Quirós-Rodríguez, J.A. Variación Espacio-Temporal de Plantas Vasculares Acuáticas en el Complejo Cenagoso del Bajo Sinú, Córdoba, Colombia. Acta Biol. Colomb. 2015, 20, 155–165. [Google Scholar] [CrossRef]
- Hou, X.; Feng, L.; Duan, H.; Chen, X.; Sun, D.; Shi, K. Fifteen-Year Monitoring of the Turbidity Dynamics in Large Lakes and Reservoirs in the Middle and Lower Basin of the Yangtze River, China. Remote Sens. Environ. 2017, 190, 107–121. [Google Scholar] [CrossRef]
- Balasubramanian, S.V.; Pahlevan, N.; Smith, B.; Binding, C.; Schalles, J.; Loisel, H.; Gurlin, D.; Greb, S.; Alikas, K.; Randla, M.; et al. Robust Algorithm for Estimating Total Suspended Solids (TSS) in Inland and Nearshore Coastal Waters. Remote Sens. Environ. 2020, 246, 111768. [Google Scholar] [CrossRef]
- Salcedo-Hernández, M.J.; Duque, S.R.; Palma, L.; Torres-Bejarano, A.; Montenegro, D.; Bahamón, N.; Lagos, L.; Alvarado, L.F.; Gómez, M.; Alba, A.P. Ecología del fitoplancton y dinámica hidrológica del sistema lagunar de Yahuarcaca, Amazonas, Colombia: Análisis integrado de 16 años de estudio. Mundo Amazón. 2012, 3, 9–41. [Google Scholar]
- Torres-Bejarano, A.M.; Duque, S.R.; Caraballo-Gracia, P.R. Heterogeneidad Espacial y Temporal de las Condiciones Físicas y Químicas de dos Lagos de Inundación en la Amazonia Colombiana. Actual. Biol. 2013, 35, 63–76. [Google Scholar] [CrossRef]
- Torres-Bejarano, F.M.; Torregroza-Espinosa, A.C.; Martinez-Mera, E.; Castañeda-Valbuena, D.; Tejera-Gonzalez, M.P. Hydrodynamics and Water Quality Assessment of a Coastal Lagoon Using Environmental Fluid Dynamics Code Explorer Modeling System. Glob. J. Environ. Sci. Manag. 2020, 6, 289–308. [Google Scholar] [CrossRef]
- Duque, G.; Gamboa-García, D.E.; Molina, A.; Cogua, P. Effect of Water Quality Variation on Fish Assemblages in an Anthropogenically Impacted Tropical Estuary, Colombian Pacific. Environ. Sci. Pollut. Res. 2020, 27, 25740–25753. [Google Scholar] [CrossRef]
- Aguirre, S.E.; Piraneque, N.V.; Linero-Cueto, J. Concentración de metales pesados y calidad fisicoquímica del agua de la Ciénaga Grande de Santa Marta. Rev. U.D.C.A Actual. Divulg. Cient. 2021, 24, 1–10. [Google Scholar] [CrossRef]
- Muñoz-López, C.L.; Rivera-Rondón, C.A. Diatom Response to Environmental Gradients in the High Mountain Lakes of the Colombia’s Eastern Range. Aquat. Sci. 2021, 84, 15. [Google Scholar] [CrossRef]
- Torres-Bejarano, F.; García-Gallego, J.; Salcedo-Salgado, J. Numerical Modeling of Nutrient Transport to Assess the Agricultural Impact on the Trophic State of Reservoirs. Int. Soil Water Conserv. Res. 2023, 11, 197–212. [Google Scholar] [CrossRef]
- Das, R.; Krishnakumar, A.; Kumar, M.R.; Thulseedharan, D. Water Quality Assessment of Three Tropical Freshwater Lakes of Kerala, SW India, with Special Reference to Drinking Water Potential. Environ. Nanotechnol. Monit. Manag. 2021, 16, 100588. [Google Scholar] [CrossRef]
- Gopal, V.; Achyuthan, H.; Jayaprakash, M. Hydrogeochemical Characterization of Yercaud Lake Southern India: Implications on Lake Water Chemistry through Multivariate Statistics. Acta Ecol. Sin. 2018, 38, 200–209. [Google Scholar] [CrossRef]
- Li, S.-L.; Xu, S.; Wang, T.-J.; Yue, F.-J.; Peng, T.; Zhong, J.; Wang, L.-C.; Chen, J.-A.; Wang, S.-J.; Chen, X.; et al. Effects of Agricultural Activities Coupled with Karst Structures on Riverine Biogeochemical Cycles and Environmental Quality in the Karst Region. Agric. Ecosyst. Environ. 2020, 303, 107120. [Google Scholar] [CrossRef]
- Zhao, Y.; Xia, X.H.; Yang, Z.F.; Wang, F. Assessment of Water Quality in Baiyangdian Lake Using Multivariate Statistical Techniques. Procedia Environ. Sci. 2012, 13, 1213–1226. [Google Scholar] [CrossRef] [Green Version]
- Shi, Z.; Xu, J.; Huang, X.; Zhang, X.; Jiang, Z.; Ye, F.; Liang, X. Relationship between Nutrients and Plankton Biomass in the Turbidity Maximum Zone of the Pearl River Estuary. J. Environ. Sci. 2017, 57, 72–84. [Google Scholar] [CrossRef]
- Smith, V.H.; Shapiro, J. Chlorophyll-Phosphorus Relations in Individual Lakes. Their Importance to Lake Restoration Strategies. Environ. Sci. Technol. 1981, 15, 444–451. [Google Scholar] [CrossRef]
- Quinlan, R.; Filazzola, A.; Mahdiyan, O.; Shuvo, A.; Blagrave, K.; Ewins, C.; Moslenko, L.; Gray, D.K.; O’Reilly, C.M.; Sharma, S. Relationships of Total Phosphorus and Chlorophyll in Lakes Worldwide. Limnol. Oceanogr. 2021, 66, 392–404. [Google Scholar] [CrossRef]
- Pu, J.; Wang, S.; Ni, Z.; Wu, Y.; Liu, X.; Wu, T.; Wu, H. Implications of Phosphorus Partitioning at the Suspended Particle-Water Interface for Lake Eutrophication in China’s Largest Freshwater Lake, Poyang Lake. Chemosphere 2021, 263, 128334. [Google Scholar] [CrossRef]
- Chawla, I.; Karthikeyan, L.; Mishra, A.K. A Review of Remote Sensing Applications for Water Security: Quantity, Quality, and Extremes. J. Hydrol. 2020, 585, 124826. [Google Scholar] [CrossRef]
- Kulshreshtha, A.; Shanmugam, P. Assessment of Trophic State and Water Quality of Coastal-Inland Lakes Based on Fuzzy Inference System. J. Great Lakes Res. 2018, 44, 1010–1025. [Google Scholar] [CrossRef]
- Li, W.; Dou, Z.; Cui, L.; Wang, R.; Zhao, Z.; Cui, S.; Lei, Y.; Li, J.; Zhao, X.; Zhai, X. Suitability of Hyperspectral Data for Monitoring Nitrogen and Phosphorus Content in Constructed Wetlands. Remote Sens. Lett. 2020, 11, 495–504. [Google Scholar] [CrossRef]
- Salama, M.S.; Radwan, M.; van der Velde, R. A Hydro-Optical Model for Deriving Water Quality Variables from Satellite Images (HydroSat): A Case Study of the Nile River Demonstrating the Future Sentinel-2 Capabilities. Phys. Chem. Earth Parts A/B/C 2012, 50–52, 224–232. [Google Scholar] [CrossRef]
- Sharaf, E.; Zhang, Y.; Suliman, A. Mapping Concentrations of Surface Water Quality Parameters Using a Novel Remote Sensing and Artificial Intelligence Framework. Int. J. Remote Sens. 2017, 38, 1023–1042. [Google Scholar] [CrossRef]
- Chi, L.; Song, X.; Yuan, Y.; Wang, W.; Cao, X.; Wu, Z.; Yu, Z. Main Factors Dominating the Development, Formation and Dissipation of Hypoxia off the Changjiang Estuary (CE) and Its Adjacent Waters, China. Environ. Pollut. 2020, 265, 115066. [Google Scholar] [CrossRef] [PubMed]
- Vakili, T.; Amanollahi, J. Determination of Optically Inactive Water Quality Variables Using Landsat 8 Data: A Case Study in Geshlagh Reservoir Affected by Agricultural Land Use. J. Clean. Prod. 2020, 247, 119134. [Google Scholar] [CrossRef]
- Li, Y.; Zhang, Y.; Shi, K.; Zhu, G.; Zhou, Y.; Zhang, Y.; Guo, Y. Monitoring Spatiotemporal Variations in Nutrients in a Large Drinking Water Reservoir and Their Relationships with Hydrological and Meteorological Conditions Based on Landsat 8 Imagery. Sci. Total Environ. 2017, 599–600, 1705–1717. [Google Scholar] [CrossRef] [PubMed]
- Lehmann, M.K.; Schütt, E.M.; Hieronymi, M.; Dare, J.; Krasemann, H. Analysis of Recurring Patchiness in Satellite-Derived Chlorophyll a to Aid the Selection of Representative Sites for Lake Water Quality Monitoring. Int. J. Appl. Earth Observ. Geoinf. 2021, 104, 102547. [Google Scholar] [CrossRef]
- Li, S.; Song, K.; Wang, S.; Liu, G.; Wen, Z.; Shang, Y.; Lyu, L.; Chen, F.; Xu, S.; Tao, H.; et al. Quantification of Chlorophyll-a in Typical Lakes across China Using Sentinel-2 MSI Imagery with Machine Learning Algorithm. Sci. Total Environ. 2021, 778, 146271. [Google Scholar] [CrossRef]
- Kim, T.; Sheng, Y.P.; Park, K. Modeling Water Quality and Hypoxia Dynamics in Upper Charlotte Harbor, Florida, U.S.A. during 2000. Estuar. Coast. Shelf Sci. 2010, 90, 250–263. [Google Scholar] [CrossRef]
- Kim, Y.H.; Son, S.; Kim, H.C.; Kim, B.; Park, Y.G.; Nam, J.; Ryu, J. Application of Satellite Remote Sensing in Monitoring Dissolved Oxygen Variabilities: A Case Study for Coastal Waters in Korea. Environ. Int. 2020, 134, 105301. [Google Scholar] [CrossRef] [PubMed]
- Randall, G.W.; Goss, M.J. Nitrate Losses to Surface Water Through Subsurface, Tile Drainage. Nitrogen Environ. 2008, 145–175. [Google Scholar] [CrossRef]
- Camargo, J.A.; Alonso, Á. Ecological and Toxicological Effects of Inorganic Nitrogen Pollution in Aquatic Ecosystems: A Global Assessment. Environ. Int. 2006, 32, 831–849. [Google Scholar] [CrossRef]
- Weber-Scannell, P.; Duffy, L. Effects of Total Dissolved Solids on Aquatic Organisms: A Review of Literature and Recommendation for Salmonid Species. Am. J. Environ. Sci. 2007, 3, 1–6. [Google Scholar] [CrossRef] [Green Version]
- Weber-Scannell, P.K.; Jacobs, L. Effects of Total Dissolved on Aquiatic Organisms; Technical Report No. 01–06; Alaska Department of Fish and Game Division of Habitat and Restoration: Anchorage, AK, USA, 2001. [Google Scholar]
- WHO. Guidelines for Drinking Water Quality, 4th ed.; World Health Organization: Geneva, Switzerland, 2017. [Google Scholar]
- Hanson, J.M.; Leggett, W.C. Empirical Prediction of Fish Biomass and Yield. Can. J. Fish. Aquat. Sci. 1982, 39, 257–263. [Google Scholar] [CrossRef]
- Lim, J.; Choi, M. Assessment of Water Quality Based on Landsat 8 Operational Land Imager Associated with Human Activities in Korea. Environ. Monit. Assess. 2015, 187, 384. [Google Scholar] [CrossRef]
- Amarnath, G.; Matheswaran, K.; Pandey, P.; Alahacoon, N.; Yoshimoto, S. Flood Mapping Tools for Disaster Preparedness and Emergency Response Using Satellite Data and Hydrodynamic Models: A Case Study of Bagmathi Basin, India. Proc. Natl. Acad. Sci. India Sect. A Phys. Sci. 2017, 87, 941–950. [Google Scholar] [CrossRef]
- Hu, M.; Wang, Y.; Du, P.; Shui, Y.; Cai, A.; Lv, C.; Bao, Y.; Li, Y.; Li, S.; Zhang, P. Tracing the Sources of Nitrate in the Rivers and Lakes of the Southern Areas of the Tibetan Plateau Using Dual Nitrate Isotopes. Sci. Total Environ. 2019, 658, 132–140. [Google Scholar] [CrossRef]
- Nevada Division of Environmental Protection. NDEP Nevada’s Nutrient Criteria Strategy–Version 2; Nevada Division of Environmental Protection Bureau of Water Quality Planning: Carson, Nevada, 2009. [Google Scholar]
- Zou, W.; Zhu, G.; Cai, Y.; Vilmi, A.; Xu, H.; Zhu, M.; Gong, Z.; Zhang, Y.; Qin, B. Relationships between Nutrient, Chlorophyll a and Secchi Depth in Lakes of the Chinese Eastern Plains Ecoregion: Implications for Eutrophication Management. J. Environ. Manag. 2020, 260, 109923. [Google Scholar] [CrossRef]
- Rak, A.E.; Kari, Z.A.; Ramli, M.Z.; Harun, H.C.; Sukri, S.A.M.; Khalid, H.N.M.; Abdullah, F.; Dawood, M.A.O.; Wee, W.; Wei, L.S. The Impact of Water Quality on the Asian Clam, Corbicula Fluminea, Distribution in Pergau Lake, Kelantan, Malaysia. Saudi J. Biol. Sci. 2022, 29, 2348–2354. [Google Scholar] [CrossRef] [PubMed]
- Powers, S.M.; Bruulsema, T.W.; Burt, T.P.; Chan, N.I.; Elser, J.J.; Haygarth, P.M.; Howden, N.J.K.; Jarvie, H.P.; Lyu, Y.; Peterson, H.M.; et al. Long-Term Accumulation and Transport of Anthropogenic Phosphorus in Three River Basins. Nat. Geosci. 2016, 9, 353–356. [Google Scholar] [CrossRef]
- Smolders, A.J.P.; Lucassen, E.C.H.E.T.; Bobbink, R.; Roelofs, J.G.M.; Lamers, L.P.M. How Nitrate Leaching from Agricultural Lands Provokes Phosphate Eutrophication in Groundwater Fed Wetlands: The Sulphur Bridge. Biogeochemistry 2010, 98, 1–7. [Google Scholar] [CrossRef] [Green Version]


| Band | Function | Wavelength (nm) | Bandwidth (nm) | Resolution (m) |
|---|---|---|---|---|
| 1 | Coastal aerosol | 443 | 20 | 60 |
| 2 | Blue | 490 | 65 | 10 |
| 3 | Green | 560 | 35 | 10 |
| 4 | Red | 665 | 30 | 10 |
| 5 | infrared- NIR 1 | 705 | 15 | 20 |
| 6 | NIR 2 | 740 | 15 | 20 |
| 7 | NIR 3 | 783 | 20 | 20 |
| 8 | NIR 4 | 842 | 115 | 10 |
| 8A | infrared narrow (NIRn) | 865 | 20 | 20 |
| 9 | Water vapor | 945 | 20 | 60 |
| 10 | Cirrus | 1380 | 30 | 60 |
| 11 | SWIR 1 | 1610 | 90 | 20 |
| 12 | SWIR 2 | 2190 | 180 | 20 |
| Main Statistics | Turbidity | TDS | DO | TSS | TP | NO3 |
|---|---|---|---|---|---|---|
| NTU | mg/L | mg/L | mg/L | mg/L | mg/L | |
| Maximum | 33.8 | 225.9 | 7.9 | 34.0 | 0.170 | 2.35 |
| Minimum | 6.5 | 175.9 | 5.1 | 4.5 | 0.050 | 0.86 |
| Mean | 18.8 | 202.1 | 5.9 | 18.1 | 0.117 | 1.62 |
| Median | 20.6 | 206.9 | 5.7 | 16.3 | 0.120 | 1.63 |
| SD | 10.3 | 19.1 | 0.8 | 10.9 | 0.040 | 0.56 |
| WQP | Model Derived from Regression Analysis | R2 | RMSE |
|---|---|---|---|
| DO | −39.2556 + 0.8061/B4 + 4288.3263 × (B4 × B5) + 19.4829 × (B4/B5) | 0.948 | 0.182 |
| −3.7611 + 57.4864 × B4 + 109.5176 × B8 + 4.0720 × (B4/B5) | 0.754 | 0.394 | |
| Turbidity | 2787.4155 − 67370 × B6 + 76850 × B8 − 3160.9521 × (B8/B6) | 0.769 | 4.693 |
| 191.1427 − 11.3280 × (1/B5) + 6150.3974 × (B4) − 96330 × (B4 × B5) | 0.629 | 2.459 | |
| TDS | 191.4556 + 3475.4249 × B6 − 1449.3128 × B8 − 58.0480 × (B2/B8) | 0.783 | 4.482 |
| 175.0792 + 2384.3749 × B6 − 50.7716 × (B2/B8) | 0.773 | 8.66 | |
| TSS | −52.5628 + 536.2086 × B5 + 30.2611 × (B4/B8) | 0.745 | 5.218 |
| 30.2457 + 649.2762 × B4 − 80.0834 × (B8/B5) + 11.2173 × (B8/B4) | 0.738 | 5.281 | |
| TP | 1.6130 − 0.030 × (1/B2) − 12.1973 × B6 − 0.2562 × (B4/B8) | 0.779 | 0.018 |
| 1.4349 − 0.0276 × (1/B2) − 11.2153 × B8 − 0.2337 × (B4/B8) | 0.688 | 0.021 | |
| NO3 | −88.3612 + 2119.4812 × B6 − 2338.2696 × B8 + 99.7217 × (B8/B6) | 0.858 | 0.200 |
| 1.8516 + 50.4735 × B6 + 9.1044 × B8 − 1.8144 × (B2/B8) | 0.833 | 0.217 |
Disclaimer/Publisher’s Note: The statements, opinions and data contained in all publications are solely those of the individual author(s) and contributor(s) and not of MDPI and/or the editor(s). MDPI and/or the editor(s) disclaim responsibility for any injury to people or property resulting from any ideas, methods, instructions or products referred to in the content. |
© 2023 by the authors. Licensee MDPI, Basel, Switzerland. This article is an open access article distributed under the terms and conditions of the Creative Commons Attribution (CC BY) license (https://creativecommons.org/licenses/by/4.0/).
Share and Cite
Padilla-Mendoza, C.; Torres-Bejarano, F.; Campo-Daza, G.; González-Márquez, L.C. Potential of Sentinel Images to Evaluate Physicochemical Parameters Concentrations in Water Bodies—Application in a Wetlands System in Northern Colombia. Water 2023, 15, 789. https://doi.org/10.3390/w15040789
Padilla-Mendoza C, Torres-Bejarano F, Campo-Daza G, González-Márquez LC. Potential of Sentinel Images to Evaluate Physicochemical Parameters Concentrations in Water Bodies—Application in a Wetlands System in Northern Colombia. Water. 2023; 15(4):789. https://doi.org/10.3390/w15040789
Chicago/Turabian StylePadilla-Mendoza, César, Franklin Torres-Bejarano, Gabriel Campo-Daza, and Luis Carlos González-Márquez. 2023. "Potential of Sentinel Images to Evaluate Physicochemical Parameters Concentrations in Water Bodies—Application in a Wetlands System in Northern Colombia" Water 15, no. 4: 789. https://doi.org/10.3390/w15040789