
Climate Water Balance in the Warm Half-Year and Its Circulation Conditions in the Sudetes Mountains and Their Foreland (Poland and Czechia)

Institute of Meteorology and Water Management—National Research Institute, Parkowa 30, 51-616 Wrocław, Poland
Water 2023, 15(4), 795; https://doi.org/10.3390/w15040795
Submission received: 14 December 2022
/
Revised: 2 February 2023
/
Accepted: 12 February 2023
/
Published: 17 February 2023
(This article belongs to the Special Issue Climate, Water, and Soil)
Abstract
:Mountains are one of the most sensitive regions in terms of climate changes. This also concerns water balance, which plays an important role, especially in the context of the ecological state. Furthermore, numerous studies indicate the atmospheric circulation as one of the crucial factors affecting climate conditions. Therefore, the goal of the paper is to examine the impact of the atmospheric circulation on the changes in climate water balance (CWB) in the Sudetes Mountains and their foreland. The analysis was carried out based on the 1981–2020 data derived from the Polish and Czech meteorological stations. The impact of the circulation factor was examined using the Lityński classification, while the calculation of evapotranspiration based on the Penman–Monteith equation. The results showed that despite positive trends for evapotranspiration, the changes in CWB in 1981–2020 were generally statistically insignificant. The only exception was the increase in CWB under the eastern circulation and its negative tendency for the western and southern sectors for some of the stations. This corresponds to the changes in the frequency of the circulation types. The results of the study can be used in further research on water balance in the region.
1. Introduction
Water resources are one of the most crucial problems related to the current economic and social conditions. Increasing water demands along with the progressing climate changes contribute to diminishing water amounts for both social and economic purposes, especially for agriculture and industry [1,2,3]. Considering the climate influence, the most important factors are changes in precipitations and evapotranspiration. Water resources can be limited by a potential decrease in precipitation totals and their frequency, as well as the rising occurrence of heat stress conditions, which intensify evaporation. Thus, one of the most important indices that presents the impact of these two factors is climate water balance (CWB), defined as the difference between precipitation totals and water losses in the process of evapotranspiration. Research carried out for Europe indicated that the central regions of the continent are less vulnerable to changes in precipitation conditions if compared to the areas located in the north or south [4,5,6,7]. Nevertheless, in some cases, negative trends for the warm half-year and the positive ones for the cold period can be found in Central Europe [8,9,10].
Because of relatively low precipitation totals and higher values of air temperature, the regions representing lowlands are vulnerable to water limitations. This concerns especially the warm half-year when dry conditions and high evapotranspiration rates often contribute to the excessive water loss from soil. Annually, on a global scale, more than 60% of rainwater evaporates from the ground or transpires from vegetation [11]. Mountain regions, characterized by higher precipitation and lower air temperature, are less vulnerable to water deficit. However, the increasing water demands resulting from the development of tourism, hydropower plants, and progressing climate changes (especially in thermal conditions) make these areas vulnerable to risks related to water balance. The Sudetes Mountains and their foreland are the example of a region where appropriate water management plays an important role in the transborder cooperation between Poland and Czechia. Considering the significant geographic variability of the region (resulting in the differentiation of CWB), the examination of the impact of climate change on CWB could provide important information on water-related issues in this area and consequently improve local water management.
Regarding precipitation totals, research on this variable in Poland and Czechia showed that multiannual trends were usually statistically insignificant [12,13,14,15,16,17,18,19,20,21,22,23]. Some of the studies indicated a slightly decreasing tendency in south Poland for both annual [15,16,17] and summer precipitations [24]. It should also be emphasized that negative, statistically significant trends were found for the spring-summer period for some of the stations representing Southwest Poland, including the summit zones of the Sudetes Mountains [17,18]. In Czechia, positive trends dominated in 1982–2010 in all seasons except for winter, reaching the rate of 4–12% per decade [25]. In the previous studies (1961–2012), such a tendency was found for winter and summer, while a decrease was noticed for spring [26]. A seasonal variability was also observed for the neighboring German region (Saxony), where winter and summer seasons were characterized by positive and negative trends, respectively [27,28]. The research carried out in the transborder Polish–Saxon region indicated positive trends for the warm half-year in the lower hypsometric zones and the negative ones in the highest parts of the mountains [29,30,31]. In the case of the annual frequency of precipitations, statistically significant and positive trends were noticed for Southwest Poland, including most of the Sudetes Mountains [16]. The directions of trends for 1961–2019 in Czechia were not homogenous and were characterized by a negative tendency in the April–June period and a positive one from July to September [21].
In the last decades, changes in the variables affecting evaporation have also been observed. In Czechia, the rising tendency for sunshine duration and air temperature corresponded to the decrease in relative air humidity and wind speed [22,23]. Similar results were carried out for Poland [32,33], where a significant increase in sunshine duration was observed, noticeably in spring and summer [32]. This contributed to the growth in potential evapotranspiration in the April–October period, especially in the southwestern regions, where the rate of changes exceeded 8 mm per decade [32]. In Northwest Poland, the increase in the warm half-year varied at 12–27 mm per decade [33], while the analysis of annual values for Czechia showed that potential evapotranspiration in 1961–2007 rose at the rate of 7–11 mm per decade [34]. The Czech and Polish studies concerning evapotranspiration also emphasized the significant role of land use [35,36], which indicated a strong increase in evapotranspiration in the warm half-year months [37,38], and examined various methods of evapotranspiration estimation for the Czech and Polish conditions [39,40,41].
According to the research on CWB in Europe, its projections are characterized by a significant spatial and seasonal variability. The analysis indicates that the most significant decrease in the future can be observed in the warm season, especially in the mountain regions, where CBW can be reduced by 60–90% [42]. In Czechia and South Poland, the values of CWB can significantly decrease in the warm half-year of the following decades by about 5–30%. The most dynamic decline is projected for the Eastern Sudetes where CWB can drop by more than 30% [42]. This shows that mountain regions, including the Sudetes Mountains, are sensitive to CWB changes and require detailed research in these terms. In the Polish lowlands, the values of CBW in the warm half-year of 1971–2015 decreased by more than 5 mm per decade [43]. Furthermore, the papers devoted to this problem considered its future projections [44], extreme values [45], spatial distribution, and regionalization [46,47,48]. They also presented the impact of the precipitation/evapotranspiration ratio on agriculture and drought occurrence [35,49,50]. In the case of mountains, including the Slovak and German (Saxon) regions, the analysis focused on the evaluation of the dependence of CWB on altitude [51,52,53], assessment of CWB for the growing season in the Carpathians [54], temporal variability of CWB in the Opawskie Mountains [55], and the methods of determining CWB in the mountain areas [52,56].
The relationship between the atmospheric circulation and selected meteorological variables in the discussed region was usually examined for thermal and precipitation conditions [22,57,58,59,60,61,62,63,64,65,66,67,68,69,70,71,72,73,74,75,76]. Special attention was also paid to the problem of the impact of the circulation factor on sunshine duration [22,73,74], humidity and wind speed [22], evaporation [77], droughts [75,78,79], and floods [80]. In the Sudetes Mountains and their surroundings, the studies mainly focused on the influence of circulation conditions on heat stress, air temperature, precipitation totals, cloudiness, pollen concentrations, and agriculture [31,81,82,83,84,85]. On the other hand, very few elaborations assessed the relationship between the atmospheric circulation and CWB. In the discussed region, the analysis focused on the changes in extreme CWB values depending on the circulation issues, especially the NAO (North Atlantic Oscillation) index [45]. The progressing changes in this circulation index reflect in a higher zonal flow regime [86,87]. This can contribute to a significant growth in the frequency of anticyclonic circulation and, consequently, an increase in drought occurrence in Western and Central Europe. Furthermore, such changes also cause a decline in the frequency of the Scandinavian blocking system [87]. In Central Europe, changes in the anticyclonic type occurrence can be observed for various seasons and their magnitude depends on applied circulation classification [22,57,88]. In 1871–2010, the annual number of days with some of the anticyclonic weather types over East-Central Europe was characterized by a statistically significant increase [89]. The research carried out for the Czech Republic, based on two different circulation classifications, indicated a positive tendency for the frequency of the anticyclonic weather in winter, spring, and summer, as well as the opposite trends of the westerlies for the autumn–winter and spring–summer periods [71]. On the other hand, negative trends were found for the number of days with the cyclonic weather for 1961–2020, especially in spring and summer, whereas the frequency of directional circulation types was characterized by relatively stable conditions [22]. In the case of Poland, the analysis carried out by Niedźwiedź and Ustrnul [90] showed a slightly positive trend for the westerlies (on an annual scale), along with its weakening in the last ten years of 1951–2018, especially in the summertime. In this season, a positive trend was also found for the southern circulation [90]. A potential increase in the frequency of anticyclonic types and the negative tendency for the cyclonic weather are crucial in the context of droughts, as this phenomenon mainly occurs under the anticyclonic conditions [75]. One of the possibilities presenting the influence of atmospheric circulation on meteorological variables in the Polish conditions is the Lityński classification [91] and its modifications [92,93,94,95]. The classification defines various types of circulation, based on the zonal, meridional, and cyclonality indices. This method was used in the analysis focused on the evaluation of thermal conditions [96,97], precipitations [98], bioclimate [99], and cloudiness [100].
The most crucial aspects of the considered problem are significant changes in the evapotranspiration-related variables, sensitivity of the mountain regions to CWB changes, and a low number of analyses focused on the relationship between the atmospheric circulation and CWB. Therefore, the main goal of this paper was to examine the impact of the atmospheric circulation on the multiannual changes in CWB in the Polish and Czech part of the Sudetes Mountains and their foreland. As most of the water balance problems are usually observed in the summer months, the analyses were carried out for the hydrological warm half-year (May–October) of 1981–2020. The importance of such research is also emphasized because of a significant impact of the circulation conditions on precipitations in the morphologically varied regions [101].
2. Materials and Methods
The evaluation of CWB was carried out for the Sudetes Mountains, which are located in Central Europe and follow a border between Poland and Czechia (Figure 1). The analysis concerned the mountain areas and their foreland, also including the adjacent lowlands. The considered region is characterized by a significant geographic variability, especially in terms of altitude, which varies from about 100 m a.s.l. in the north (Silesian Lowlands) to 1603 m a.s.l. (Śnieżka) in the summits of the Giant Mountains in the western part of the region. In the higher hypsometric zones, the Karkonosze National Park is located, which favors the predominance of forests areas. On the other hand, a major part of the mountain foreland and the adjacent lowlands are used for agriculture purposes and are characterized by a relatively high density of urban areas. Such a variability, especially in terms of altitude, contributes to the significant differentiation in climate conditions. This also reflects in the values of such indices as precipitation totals, evapotranspiration, and CWB.
For the purposes of the analysis, meteorological data from both Polish and Czech parts of the region were used, including the records from five Polish and eight Czech meteorological stations, which represented various hypsometric zones (Table 1). The series considered daily values of precipitation totals and the variables used for the calculation of evapotranspiration: daily mean, maximum and minimum air temperature, relative humidity, wind speed, and sunshine duration. The records concerned the hydrological warm half-year (May–October) of 1981–2020 and they were examined from the perspective of their homogeneity using the Standard Normal Homogeneity Test (SNHT) [102,103]. Additionally, the correlation coefficient was calculated for the data series between the considered stations and the Polish and Czech stations located in the neighboring area—Zielona Góra (192 m a.s.l.) and Doksany (158 m a.s.l.). In all cases, a strong relationship was found, characterized by a high level of statistical significance.
Based on the daily data of air temperature, relative humidity, wind speed, and sunshine duration, the evaluation of evapotranspiration was carried out using the ETo calculator [104]. This tool was developed by the FAO (Food and Agriculture Organization of the United Nations) and considers the Penman–Monteith equation in the process of the calculation. The method was selected by the FAO because it considered both physiological and aerodynamic parameters and a close approximation of grass evapotranspiration in a given area [105]. The detailed description of this method can be found in the FAO sources [104,105]. Using the ETo calculator, evapotranspiration rates were calculated for each day of the considered period. It should be emphasized that according to the applied method, the calculation of evapotranspiration concerned the values characteristic for grassy areas. Therefore, the calculated rates could be, to a certain extent, different from the actual values for such terrains as forests or agriculture lands. Thus, the results of the calculations should be analyzed more in terms of their approximate changes under universal land use conditions than in the context of information on the actual distribution in the region.
Subsequently, the values of CWB were assessed based on the differences between precipitation totals (RR) and evapotranspiration (Ep). The results of calculations for the particular warm half-year periods of 1981–2020 were the base for the evaluation of multiannual changes in RR, Ep, and CWB in the region. The trends of the considered indices were examined in terms of their statistical significance at the level of 0.05. In this case, the linear regression analysis was applied, additionally verified using the Mann–Kendall test.
The analysis of the circulation conditions concerned the frequency and multiannual changes of the particular types of circulation in the warm half-year of 1981–2020. Furthermore, the course of RR, Ep, and CWB was examined for the selected types of circulation, which consequently enabled the evaluation of the dependence of CWB-related problems on the circulation factor. Circulation conditions and their influence of CWB were evaluated based on the Lityński classification [91] and its modification [92]. This classification has often been used by the Polish weather service and in scientific research and has been considered in 15% of the Polish studies related to circulation issues [106,107]. This objective method considers zonal and meridional indices, which are calculated based on geostrophic wind velocity within 40–65° N and 0–35° E. According to the initial principles [91], the zonal and meridional indices are calculated using the following formulas:
where:
Ws = 6.1 (P40 − P65)/25 Wp = 10.0 (P35 − P0)/35
Ws—zonal index.
Wp—meridional index.
P40, P65—mean air pressure at the parallels of 40° N and 65° N, calculated with a 5° step for the 0–35° E zone.
P35, P0—mean air pressure at the meridians of 0° and 35° E, calculated with a 5° step for the 40–65° N zone.
The positive Ws indicates the western circulation, while the negative one refers to the eastern sector. In the case of Wp, the positive values are related to the southern circulation, whereas the negative rates indicate the northern direction [91]. Based on the analysis on advections, eight main circulation sectors are defined (N, NE, E, SE, S, SW, NW), along with the indetermined class (0) for non-advection conditions. Considering the basic methods of this classification, the cyclonality index can be also specified, based on air pressure in Warsaw (Poland), which is reduced to the sea level and decreased by 1000 hPa. This enables the classification of given weather conditions to three classes of cyclonality: anticyclonic (a), cyclonic (c), and transitional (o). While developing the calendar of circulation types, the classes of cyclonality are assigned to each of the eight main advection sectors and to the indetermined class. As a result, 27 circulation types are selected in total, which are classified in the following groups: northern (Na, Nc, No), northeastern (NEa, NEc, NEo), eastern (Ea, Ec, Eo), southeastern (SEa, SEc, SEo); southern (Sa, Sc, So), southwestern (SWa, SWc, SWo), western (Wa, Wc, Wo), northwestern (NWa, NWc, NWo), and indetermined (0a, 0c, 0o).
Current analysis on the Lityński classification is based on the NCEP/NCAR reanalysis of sea level pressure for 12:00 UTC [108]. For the purposes of this study, the calendar of daily circulation types according to the Lityński classification was used [109]. This bases on the modification carried out by Pianko [92], which defines the central point as the grid which is closest to Warsaw (52.5° N, 20.0° E) and assumes a change in the thresholds related to the circulation index classes. In this case, the thresholds are assessed based on the calculations of mean values and standard deviations for each month. They separate three classes (positive, indifferent and negative) and are calculated using the following formulas: tl = − 0.433σ (lower threshold) and tu = + 0.43σ (upper threshold), where refers to the arithmetic mean value, while σ indicates standard deviation [92,95]. The calculated rates are assigned to the middle day of each month and are followed by the interpolation for the remaining days.
The Lityński classification is one of the most important methods used in the Polish studies [95] and was often considered in the analysis on circulation conditions on both national and regional/local scale. Although the spatial range of the analysis concerns almost all of Europe, the central point used for the evaluation of cyclonality is located in Poland. Thus, the classification can be used for the circulation analysis for Poland and the adjacent areas, including the Polish–Czech Sudetes Mountains and their foreland. Considering a high importance of this method in the Polish studies, the Lityński classification was chosen for the analysis regarding the discussed region. Consequently, the results of the research can be compared with other outcomes carried out using this classification and be a basis for further analysis on the circulation conditions for Southwest Poland and North Czechia.
3. Results
3.1. RR, Ep, and CWB in the Warm Half-Year of 1981–2020
In 1981–2020, mean RR for the hydrologic warm half-year varied from 354 to 642 mm. The lowest values were observed in the Silesian Lowlands, represented by the stations of Wrocław and Legnica (Figure 2). Relatively low RR were also noticed for Hradec Králové, while the stations located in the mountains were characterized by more intensive precipitation. In this case, the factors of altitude and geographic location were the most crucial in shaping the spatial distribution of RR. Besides the upper zones, significant RR were also noticed at the stations located lower down in the western part of the region. This situation was particularly observed in the Izera Mountains (the Western Sudetes), which are the first orographic barrier in the west for piling up humid air masses. As a result, exceptionally high totals occur in this region. Such conditions are even observed at the lower altitudes, where the presence of shallow and relatively small valleys contributes to the minimization of the rain shadow effect [110]. Therefore, RR in the Izera Mountains can be even higher than in the summits of the neighboring Giant Mountains [31,110]. This concerns especially the station of Hejnice, where the mean RR for the warm half-year of 1981–2020 reached 594 mm, significantly exceeding the rates for the other stations located at the similar altitude. In the case of the remaining stations of the Western Sudetes (Jelenia Góra, Liberec, and Desná-Souš), RR were higher if compared to the eastern region—Kłodzko, Ústí nad Orlicí, Luka, or Světlá Hora. On the other hand, relatively low RR in the summits of the Giant Mountains (Śnieżka) are the effect of the wind factor, which contributes to the underestimation of precipitation totals in this zone [17,111]. According to Kwiatkowski [111], wind conditions in the summits can decrease annual totals by 30%, with lower differences observed for the warm half-year.
The values of Ep were determined b” air temperature (and consequently humidity), wind speed, and sunshine duration, changing with the increasing altitude (Table 2). In the May–October period, they varied from 551–575 mm in the regions located lower down to 307 mm in the summits. In Liberec, Ústí nad Orlicí, and Luka, Ep was relatively high because of stronger wind if compared to Hejnice, Jelenia Góra, or Kłodzko. In Luka, the additional factor affecting Ep was higher sunshine duration, which contributed to the increase in Ep to 570 mm. The summits were characterized by the lowest rate, due to different thermal, humidity, wind, and cloudiness conditions, in the comparison to the lower hypsometric zones.
Such a distribution of RR and Ep reflected in the variability of CWB. In the lowlands, the deficit of CWB amounted to 200 mm, while the positive balance was noticed for the stations located at the highest altitude (Desná-Souš and Śnieżka), where the surplus exceeded 200–250 mm. The values of CWB reaching almost 100 mm were also observed in Hejnice, where they were contributed by very high RR. It should also be emphasized that the stations located in the lower mountain zones in the west (Jelenia Góra, Liberec) were characterized by a minor CWB deficit if compared to the eastern areas (Kłodzko, Ústí nad Orlicí, Luka), mainly due to the significantly higher RR.
In the multiannual period of 1981–2020, the minimum values of CWB for the entire warm half-year were usually noticed during the most intensive droughts in 2015 and 2018. This concerns especially the episode of 2018 when extreme drought conditions were observed in Southwest Poland. As indicated in Table 3, the deficit of water could exceed 400 mm, mainly in the lower part of the region. Regarding the maximum values of CWB in the lower hypsometric zones, most of them were observed in either 2010 or 2020. In the case of the highest parts, the maximum was noticed in 1981 when the surplus exceeded 550–600 mm.
3.2. Multiannual Changes of RR, Ep, and CWB
Regarding multiannual changes of the selected indices, the course of RR did not show any statistically significant tendency (Table 4). In the regions located lower down, the trends were usually positive, reaching the largest values in the mountain basins (Jelenia Góra, Kłodzko). On the other hand, the negative tendency was predominant in the highest zones, where the most intensive changes were observed in Světlá Hora. A different tendency was observed for the index of Ep. In this case, statistically significant trends were noticed for most of the stations, except for Desná-Souš. Most of the region, especially the areas located lower down, was characterized by an exceptional increase, exceeding 22–23 mm per decade. In Wrocław, the rate of changes was the highest and reached as much as 28 mm per decade.
Such trends of Ep were mainly caused by noticeable changes in air temperature (which also resulted in the modification of humidity conditions) and sunshine duration (Figure 3, Table 5). In the case of thermal conditions, strong, statistically significant, and positive trends were found for the entire region for all the considered indices. The most intensive changes were noticed for the maximum air temperature, which rose at the rate of 0.35–0.55 °C per decade. In terms of mean air temperature, the growth varied at 0.17–0.54 °C per decade, while the increase in minimum values differed from 0.14 °C per decade in Liberec to 0.58 °C per decade in Červená. The increase in air temperature also resulted in the negative, statistically significant trends of relative humidity for the majority of the stations. Most of the region was also characterized by a relevant growth in sunshine duration, reaching as much as 107 h per decade (Jelenia Góra) (Table 5).
The trends for both RR and Ep contributed to the changes in CWB. In the May–October period, a vast majority of the stations were characterized by the negative tendency, with the most intensive changes noticed in Hradec Králové (23 mm per decade), Luka (almost 20 mm per decade), and Śnieżka (more than 18 mm per decade) (Table 4). On the other hand, the trends for three stations representing the medium altitudes (Kłodzko, Hejnice, Ústí nd Orlicí) were positive and varied at 1.4–5.5 mm per decade. Nevertheless, neither of the trends was statistically significant (Table 4). This shows that despite a noticeable increase in Ep, the changes in CWB cannot be precisely defined because of the irrelevant tendency of RR. Considering the insignificant trends of CWB, the changes did not indicate any dependence of CWB on altitude or location of the selected stations, except for the positive tendency for the medium altitudes (Kłodzko, Hejnice, Ústí nd Orlicí).
3.3. RR, Ep, CWB, and Circulation Conditions
In terms of the atmospheric circulation in the May–October period, the anticyclonic types were the most frequent [109]. According to the calendar of circulation types, they occurred on 43% of days, while the frequency of cyclonic and transitional circulation amounted to 31% and 26% respectively. Regarding the anticyclonic circulation, the highest frequency was observed for the northern (N, NE, NW) and eastern (E, NE, SE) classes, whereas the western (W, NW, SW) and northern sectors were predominant under the cyclonic and transitional conditions (Figure 4). The types of Na and Nwa were the most frequent anticyclonic classes, while the SWc prevailed in terms of the cyclonic weather. The lowest frequency was observed for the types of SE and E [109].
In 1981–2020, changes in the frequency of circulation conditions were in most cases statistically insignificant [109]. In terms of the vorticity types, the negative tendency was noticed for the anticyclonic weather, while the number of days with the cyclonic and transitional types increased (Table 6). Regarding the particular sectors, the only statistically significant trend was noticed for the frequency of the eastern types, which rose at the rate of 4 days per decade. Such a tendency was mainly caused by a significant increase in the eastern-transitional circulation, which reached the intensity of 1 day per 6 years (Table 7). A similar rate was also observed for the trend related to the eastern-cyclonic types, which indicated statistical significance at the level of 0.1. The changes in the northern, southern, western, and indetermined circulation were characterized by the negative tendency, without statistical significance [109].
Circulation conditions had a significant impact on both RR and Ep in the discussed region. In 1981–2020, most of precipitations were measured during the cyclonic weather (Figure 5). The mean percentage of RR for this type of circulation reached as much as 56% and ranged from 53% in the eastern part of the region (Kłodzko, Luka, Světlá Hora) to more than 61% in the west (Desná-Souš). The highest RR were noticed for the stations representing various hypsometric zones of the Western Sudetes. In Desná-Souš, Śnieżka, Hejnice, and Liberec, the totals varied at 280–394 mm. On the other hand, minimum rates were observed for the lower zones—in Wrocław, Legnica, and Hradec Králové (just above 200 mm). It should be noted that relatively low RR also occurred at the stations located in the east (Kłodzko, Luka, Světlá Hora). Such conditions result from the minor vulnerability of the eastern areas to the advections of humid air masses from the west and consequently contribute to the decrease in RR in the Eastern Sudetes and the neighboring regions. In the case of the anticyclonic circulation, the highest fraction of RR (22%) was observed in Kłodzko and Světlá Hora, while the mean percentage for the entire region exceeded 19%. RR differed from 66–67 mm in the lowlands (Wrocław and Legnica) to 103 mm in Desná-Souš and 116 mm on Śnieżka. The fraction for the transitional circulation at the selected stations varied at 23–26%, whereas RR reached below 90 mm in the lowest zones and 141–145 mm in Hejnice and the highest parts of the mountains.
Unlike RR, the highest rates of Ep were observed for the anticyclonic circulation (Figure 6). Nearly half of the total Ep was noticed for this type of weather, while the percentage for the cyclonic and transitional circulation amounted to 26% each. The highest Ep under the anticyclonic conditions was noticed at the stations located lower down and in Liberec, Ústí nd Orlicí, and Luka, where they amounted to 257–277 mm. In the higher zones, the values were noticeably lower, reaching 210–242 mm in Světlá Hora, Červená, and Desná-Souš and 165 mm on Śnieżka. Relatively low Ep rates were also noticed in the mountain valleys (Jelenia Góra, Kłodzko).
The distribution of RR and Ep resulted in the significant variability of CWB in terms of its dependence on the atmospheric circulation. All the considered stations were characterized by the negative values of CWB under the anticyclonic conditions and the positive rates for the cyclonic circulation (Figure 7). The highest deficit for the anticyclonic weather were observed in the lowest zones, as well as in Liberec, Ústí nd Orlicí, and Luka, where the high Ep was the crucial factor. In this case, the shortage of water exceeded 190–200 mm in the lowlands and reached 168–188 mm in Liberec, Ústí nd Orlicí, and Luka. Regarding the cyclonic circulation, the highest surplus was observed in the highest zones (Desná-Souš and Śnieżka) and in the western region (Hejnice, Liberec). In the lowlands, CWB reached 50–52 mm. The values of CWB for the transitional circulation indicated either positive or negative balance. The surplus was noticed for Hejnice, Desná-Souš, and Śnieżka, reaching 13 mm, 34 mm, and 64 mm respectively. The remaining stations were characterized by a deficit ranging from 7 mm in Světlá Hora to 61 mm in Hradec Králové.
Considering the values of CWB for various circulation sectors, they were mostly negative (Table 8). Two stations located at the highest altitude, Desná-Souš and Śnieżka, were the only sites where the positive CWB was noticed for all the circulation types. On the other hand, three stations representing the lowest parts (Wrocław, Legnica, Hradec Králové) and two stations located in the eastern areas (Ústí nad Orlicí, Luka) were characterized by the negative balance for each of the circulation sectors. In the Western Sudetes, the lowest deficit (or the highest surplus) was observed for the northern circulation (N, NE, NW). Such a situation took place in Jelenia Góra, Hejnice, Liberec, Desná-Souš, and Śnieżka. In the lowlands and at the stations of Ústí nad Orlicí and Luka, the maximum CWB was noticed for the indetermined type of circulation (0-type). Taking into account all the types, the highest mean values of CWB for all the considered stations were observed for the northern (N, NE, NW) and eastern (E, NE, SE) circulation (more than 5 mm), while the southern (S, SE, SW) and western (W, NW, SW) types were characterized by the lowest CWB, reaching as low as −30 mm. One of the most characteristic features was the high CWB for the E-types in Hejnice. This mainly resulted from the extreme precipitation event that occurred on 7 August 2010 in the Izera Mountains, causing disastrous floods and numerous damages [112]. That day, RR in Hejnice reached 179 mm, which was the highest daily rate for all the considered stations in 1981–2020. This episode occurred during the SEc circulation. Taking into account a relatively low frequency of the E-types, such high RR values, that contributed to the exceptionally high CWB in Hejnice, if compared to the other stations located at the similar altitude.
3.4. Changes in RR, Ep, and CWB Depending on the Circulation Conditions
Changes in RR, Ep, and CWB under particular circulation conditions were in most cases characterized by statistically insignificant trends. Nevertheless, the analysis for some stations indicated noticeable tendencies, especially for Ep. Regarding RR in relation to the vorticity types (a, c, o), neither of the stations was characterized by statistically significant changes (Table 9). The only exception was Ústí nad Orlicí, where the trend for the anticyclonic circulation indicated statistical significance at the level of 0.1 and reached the intensity of more than 6 mm per decade. More dynamic changes were observed for the S- and E-types. In the case of the southern circulation, statistical significance at the level of 0.05 was noticed for two Czech stations located in the eastern part of the region—Světlá Hora and Červená. The trends of RR for these stations were negative and reached the intensity of 15–17 mm per decade. A higher number of stations with such a level of statistical significance was observed for the E-types. A vast majority of the stations indicated significant changes, except for Hradec Králové and Śnieżka (the level of 0.1 was noticed for Luka). In all cases, the changes were positive and were characterized by a similar rate. The intensity varied from 0.31 mm per decade in Světlá Hora to 0.46 mm per decade in Legnica. However, it should be noted that the rates of changes were noticeably lower than for the N-, S-, and W-types and could not significantly affect the total balance of RR and CWB. Regarding the remaining types, the changes were statistically insignificant. The level of 0.1 was only noticed in Červená for the N-types, where RR increased at the rate of more than 15 mm per decade.
Statistically significant and positive changes in Ep, presented in Table 4, reflected in the multiannual course of Ep for particular types of the atmospheric circulation. Most of the stations were characterized by significant trends for both cyclonic and transitional circulation, as well as for the E-types (Table 10). The most noticeable changes were noted for the summit zone represented by Śnieżka. In this area, statistically significant trends were found for the cyclonic and transitional circulation. In both cases, they were positive and indicated the intensity of more than 7–8 mm per decade. Similar rates were also noticed for the changes for the S-, W-, and E-types. In terms of the cyclonic and transitional circulation, the statistically significant increase in Ep was found for eight and nine stations, respectively. The most dynamic changes were noticed in the lowlands (10–11 mm per decade), while at the higher altitudes, the rates ranged from 7 mm to 9 mm per decade. Furthermore, the rising tendency, significant at the level of 0.1, was also indicated for Hradec Králové and Světlá Hora during the cyclonic weather and in Hejnice, Ústí nad Orlicí, and Světlá Hora under the transitional circulation.
Regarding the selected circulation sectors, noticeable changes were found for the N-types in Wrocław and Jelenia Góra, where Ep increased at the rate of about 0.3–0.4 mm per decade. Major changes were noticed for the E-types. In this case, statistically significant trends were found for eight stations, mainly located in the lower hypsometric zones. The intensity varied from around 8 mm per decade on Śnieżka to more than 15 mm per decade in Wrocław. It should also be noted that the changes for four stations (Hejnice, Ústí nad Orlicí, Světlá Hora, and Červená) were statistically significant at the level of 0.1 and indicated the increase reaching 9–10 mm per decade.
In the case of CWB, the most noticeable changes were found for the S- and E-types and were characterized by the negative (S-types) and positive (E-types) trends (Table 11). Regarding the S-types, a statistically significant decrease was observed for the stations located in the eastern part of the region (Luka, Světlá Hora, and Červená), reaching the intensity of 17–23 mm per decade. Such trends were the result of the decline in RR noticed for these stations. The tendency of CWB under the E-types was significant for three stations and indicated positive changes. The increase in CWB in Ústí nad Orlicí exceeded 16 mm per decade, while the rates for the Western Sudetes (Desná-Souš and Hejnice) reached up to 28–34 mm per decade. Furthermore, a significant trend was found for the W-types in Liberec, where CWB declined by 16 mm per decade. It is worth mentioning that the trends for six stations (Wrocław, Legnica, Jelenia Góra, Hejnice, Luka, and Světlá Hora) were statistically significant at the level of 0.1 and indicated a decrease varying from about 10 mm per decade in Jelenia Góra to more than 15 mm per decade in Hejnice.
Statistically insignificant trends were also predominant in terms of the changes of CWB for the N-, S-, W-, and E-types under particular vorticity categories (Table 12, Table 13 and Table 14). In the case of the anticyclonic circulation, neither of the stations was characterized by a statistically significant tendency for any of the types (Table 12). Such trends also dominated during the cyclonic weather. The only exceptions were the stations of Luka and Červená, where relevant, negative trends were observed for the S-types (Figure 8). In this case, the rate of CWB changes reached 11–13 mm per decade. In addition, statistical significance at the level of 0.1 was noticed for the negative trends related to the S-types (Desná-Souš) and W-types (Legnica, Liberec, Červená). Such a level was also found for the positive tendency under the E-types in the Western Sudetes (Hejnice and Desná-Souš), where CWB rose with the intensity of 18–27 mm per decade (Table 13).
Regarding the transitional types of circulation, the only statistically significant change was found in Wrocław, where the negative trend for the W-types was characterized by the intensity exceeding 5 mm per decade (Figure 9). A similar rate for this type of circulation was observed in Světlá Hora, where the trend was significant at the level of 0.1. Such a level was also noticed for the negative tendency in Hradec Králové and Červená (S-types) and for the positive trend in Světlá Hora (E-types). In the case of these stations, the reduction in CWB for the S-types amounted to 6–7 mm per decade, whereas the increase for the E-types reached up to 5 mm per decade (Table 14).
The presented trends of CWB under particular types of circulation indicate that the most dynamic changes were noticed for the E- and S-types, usually for the cyclonic circulation. The decline of CWB for the E-types mainly concerned the eastern part of the region, while the increase for the S-types was typical for the Western Sudetes. Therefore, the differences in CWB between the Eastern and Western Sudetes have intensified for the last decades. Taking into account the opposite trends for the frequency of these two types of circulation, the differences in CWB between these two subregions can potentially increase in the following years.
4. Discussion and Conclusions
The results presented in the study showed that CWB in the Sudetes Mountains and their foreland, based on the calculations of grass reference evapotranspiration, is usually characterized by its deficit, especially in the lower hypsometric zones. Such a situation is mainly caused by a high rate of Ep, which exceeds precipitation totals in the warm half-year. This confirms the outcomes for the lowlands of Poland, where the negative balance was found for the growing season [43,47]. In the foreland of the Sudetes Mountains, the deficit of CWB reached 200 mm, which is comparable to the values observed for the stations representing the lowland part of Poland [47,48,50]. The positive CWB was noticed for the regions located in the highest parts of the mountains and in the lower zones of the Izera Mountains in the west—mainly due to exceptionally high precipitation totals. This confirms the previous analysis that this part of the Sudetes Mountains is characterized by extraordinary precipitation conditions if compared to other regions [110]. The results for the mountains correspond to those obtained for the Carpathian region and the Opawskie Mountains, where CWB in the warm half-year amounted to 150–220 mm [54,55]. The positive CWB was also noticed for the previous decades in the mountain part of Slovakia [52]. The analysis carried out for Czechia indicated that the negative values of CWB in the regions located lower down were also noticed on an annual scale [34,49].
In terms of precipitation totals, the trends carried out for the Sudetes Mountains and their surroundings in 1981–2020 were statistically insignificant, which confirmed the previous results for Czechia and Poland [12,13,14,15,16,17,18,19,20,21,22]. On the other hand, the changes in evapotranspiration were characterized by statistically significant and positive trends for most of the stations. The increase reached the intensity of 8–28 mm per decade, which was similar to the results obtained for Northwest Poland [33], higher than for 1961–2007 in Czechia [34], and lower if compared to Southwest Poland in 1951–2000 and 1971–2010 [33,113]. The rising tendency of potential evapotranspiration was mainly caused by the increase in air temperature, resulting in the decline in relative humidity, as well as by the growth in sunshine duration. In the region of the Sudetes Mountains, all the thermal indices significantly increased in 1981–2020. Mean air temperature rose with the intensity of 0.17–0.54 °C per decade, while the rates for maximum and minimum values amounted to 0.35–0.55 °C and 0.14–0.58 °C per decade, respectively. The positive tendency was also noticed in the Western Sudetes [17] and other regions of Czechia [14,22,23] and Poland [14,60,114]. In the case of sunshine duration, the observed increase corresponds to the positive tendency noticed for both these countries [22,23,32]. Mean values of relative humidity in the discussed region decreased by 0.7–2.1% per decade, exceeding the rate observed for the seasonal, monthly, and annual values for the entire Czechia in 1961–2020 [22] and for Northwest Poland in 1952–2018 [33]. The decline in relative humidity was also observed in the Giant Mountains in 1951–2015 [17].
Insignificant trends for CWB indicate that water resources in the region of the Sudetes Mountains, evaluated based on precipitation totals and evapotranspiration, have not changed noticeably over the last decades. Thus, the analysis did not confirm the outcomes for the lowlands of Poland, where CWB in 1971–2015 decreased by 5–8 mm [43]. Simultaneously, the results were also different from the projections for this region, which simulate a major decline in CWB in the following decades [42]. The changes also differed from the results obtained for the Polish–Saxon region in 1971–2010, when the negative and statistically significant trends were observed for April–September in the entire hypsometric profile [29,30]. It should also be noted that the analysis for Poland showed that the decrease in CWB in the Sudetes Mountains and their foreland progress slower than in the lowlands [50]. A significant variability of CWB in the warm half-year in discussed region was also found for the multiannual period (1891–2003) in Wrocław [45].
Taking into consideration the multiannual changes of CWB in relation to the circulation conditions, the reduction of CWB under the southern and western types and the positive tendency during the eastern circulation were the most noticeable features. This corresponded to the changes in the frequency of these types of circulation. Furthermore, a noticeable growth in Ep was also observed for some of the circulation conditions, especially for the cyclonic, transitional, and eastern types. This shows that potential changes in CWB depend, to a certain extent, on the circulation factor. Such a relationship was already found in the lowland part of the region, where the dependence of RR, Ep, and CWB on the North Atlantic Oscillation (NAO) was detected [45]. It should be emphasized that the decrease in the frequency of the southern and western circulation reflected in the negative trends of CWB for some stations for the cyclonic—western and southern types. Consequently, this can have a crucial influence on water resources in the region, considering the fact that most of precipitation totals are related to these circulation types [31,57,59,115]. On the other hand, insignificant changes in the frequency of the anticyclonic circulation contributed to the irrelevant trends of the discussed indices (including CWB) under this type of weather. However, it should be remembered that according to other classifications, the frequency of the anticyclonic types has noticeably risen over the last decades [22,31,57], which may increase the risk of dry periods occurring [59,75].
The results presented in the study based on the data from the considered meteorological stations and are characterized by some limitations. The distribution of both precipitation totals and evapotranspiration can significantly differ, especially in the mountain areas. Therefore, the results of CWB carried out in this study can be limited to a certain extent due to a relatively low number of stations. This especially concerns the higher parts of the Sudetes Mountains, represented only by one measuring site. The other factors are related to a significant variability of altitude, morphology, and land use in the region, which may additionally affect the values of the chosen indices. A special attention should be paid to land use, which modifies evapotranspiration conditions. The research carried out for the Malše River basin (the Czech Republic) and Wielkopolska region (Poland) showed that the differences in actual evapotranspiration between meadows and deciduous forest can exceed 15–20% [35,116]. Simultaneously, the values for cereal crops surpass the rate for meadows by about 8% [116]. As the calculation of evapotranspiration in this study was carried out for grassy areas, the intensity of evapotranspiration for forests and some of the agriculture lands (which are predominant in the region) can be higher than the values obtained using the ETo calculator. It is worth mentioning that land use (and consequently evapotranspiration conditions) in the discussed region were also influenced by acid rains, which affected the Sudetes Mountains in the 1980s [117], especially their western parts [118]. They caused significant damage to the forests and contributed to the changes in land use in some regions. The deforestation covered about 15 000 ha and was mainly observed in the western and southwestern slopes of the mountains [118]. Currently, these areas have been forested again [118], bringing back the land use conditions similar to those observed before the disaster.
Special attention should be paid to the results obtained for the summits. It is worth mentioning that precipitation totals measured in this zone are limited to a certain extent by the wind factor [111], which can consequently underestimate CWB values. Furthermore, approximately 300 days of fog annually occur in the summits of the Giant Mountains [110], contributing to the additional water income. Snow cover is another factor. Although the analysis was carried out for the warm season, snow cover in the highest hypsometric zone is still present in May and October and can also occasionally occur in the other months of this half-year [119,120]. Thus, all these factors can have an impact on water-related conditions and may increase the values of CWB. Taking into account the aspects mentioned above, the structure of CWB in the summit zone of the Sudetes Mountains tends to be more complex and requires further investigation in this field.
In terms of circulation conditions, the level of relationship between CWB and the atmospheric circulation can differ depending on the applied circulation classification. Considering the discussed region, the classification developed for Czechia (such as the CHMI classification) could be used to verify the current results related to the dependence of CWB on the circulation factor, especially for the southern part of the Sudetes and their southern foreland. However, it should be emphasized that the CHMI objective method, similarly to the Lityński classification, does not define specific circulation types that may locally occur in a given region [59].
Nevertheless, despite all the mentioned limitations, the analysis of the dependence of CWB on the circulation conditions presents the range of potential changes of CWB in the last decades under certain land use conditions. Although CWB values can potentially differ on a local scale due to the factors mentioned above, the results of the research can provide important information on the magnitude of changes in CWB and its components in the multiannual period. They can also enable the evaluation of the relationship between CWB and particular types of circulation, especially under changing circulation conditions.
Considering all the results presented in the study, the following conclusions can be expressed:
- CWB has not significantly changed over the last decades in the Sudetes Mountains and their foreland. However, the positive trend for Ep can potentially contribute to the decrease in CWB in the future if such a trend continues.
- The rates of Ep in the warm half year of 1981–2020 have noticeably increased in all the hypsometric zones. Consequently, a further increase can have a crucial effect on the ecological state of the summit zone and for the agriculture production in the regions located lower down.
- The significant changes in CWB under the eastern, western, and southern circulation are generally the result of the negative/positive trend for the frequency of these types of circulation. The negative trends of CWB for the southern circulation concern the eastern part of the region, while the increase under the eastern types mainly affects the Western Sudetes. Such a distribution can additionally intensify differences in CWB between the Eastern and Western Sudetes.
- Taking into account both changes in CWB for the southern, western, and eastern circulation and non-significant trends for the vorticity types, it can be assumed that changes in CWB can be more related to the influence of circulation sectors than to the vorticity.
- Considering the fact that extreme precipitations in the Sudetes Mountains often occur under the eastern circulation (such as SEc), the positive trend for this type of weather can contribute to the further intensification of heavy rainfall episodes.
- Taking into account the sensitivity of mountain regions to the CWB changes, the results of this study can be applied in the planning process related to the local water management and ecological activities. They can also be used in the analysis concerning the hydrological aspects of water balance in the Sudetes Mountains and their foreland.
Funding
Internal IMGW-PIB project DS.-4/2023 (Task 10: Climate water balance of the upper and middle Odra river basin and its circulation conditions in the light of climate change).
Data Availability Statement
Not applicable.
Conflicts of Interest
The author declares no conflict of interest.
References
- OECD. Water, Growth and Finance. Policy Perspectives. OECD Better Policies for Better Lives. 2016; p. 36. Available online: https://www.oecd.org/environment/resources/Water-Growth-and-Finance-policy-perspectives.pdf (accessed on 25 January 2023).
- Kubiak-Wójcicka, K.; Machula, S. Influence of Climate Changes on the State of Water Resources in Poland and Their Usage. Geosciences 2020, 10, 312. [Google Scholar] [CrossRef]
- Turral, H.; Burke, J.; Faurès, J.-M. Climate Change Water and Food Security; FAO Water Reports: Rome, Italy, 2011; Volume 200, Available online: https://www.fao.org/3/i2096e/i2096e.pdf (accessed on 25 January 2023).
- Kundzewicz, Z.W.; Jania, J.A. Extreme Hydro-meteorological Events and their Impacts. From the Global down to the Regional Scale. Geogr. Pol. 2007, 75, 9–24. [Google Scholar]
- IPCC. AR5 Synthesis Report: Climate Change 2014. Contribution of Working Groups I, II and III to the Fifth Assessment Report of the Intergovernmental Panel on Climate Change, Geneva, Switzerland. 2014; p. 151. Available online: https://archive.ipcc.ch/report/ar5/syr/ (accessed on 13 September 2022).
- EC, Regions. The Climate Change Challenge for European Regions. European Commission, Directorate-General Regional Policy, Policy Development, Conception, Forward Studies, Impact Assessment, 2009, Brussels, Belgium. 2020. Available online: https://climate-adapt.eea.europa.eu/metadata/publications/regions-2020-the-climate-challenge-for-european-regions (accessed on 13 September 2022).
- Dankers, R.; Hiederer, R. Extreme Temperatures and Precipitation in Europe: Analysis of a High-Resolution Climate Change Scenario; JRC Scientific and Technical Reports; European Comission, Institute for Environment and Sustainability: Mestreech, The Netherlands, 2008; Volume 82. [Google Scholar]
- Anders, I.; Stagl, J.; Auer, I.; Pavlik, D. Climate Change in Central and Eastern Europe. In Managing Protected Areas in Central and Eastern Europe Under Climate Change; Rannov, S., Neubert, M., Eds.; Spring: Cham, Switzerland, 2014; Volume 58, pp. 17–30. [Google Scholar] [CrossRef] [Green Version]
- Nilsen, I.B.; Fleig, A.K.; Tallaksen, M.; Hisdal, H. Recent trends in monthly temperature and precipitation patterns in Europe. In Hydrology in a Changing World: Environmental and Human Dimensions; Ben Ammar, S., Taupin, J.D., Zouari, K., Eds.; IAHS Publication: Montpellier, France, 2014; Volume 363, pp. 132–137. [Google Scholar]
- Jaagus, J.; Aasa, A.; Aniskevich, S.; Boincean, B.; Bojariu, R.; Briede, A.; Danilovich, I.; Castro, F.D.; Dumitrescu, A.; Labuda, M.; et al. Long-term changes in drought indices in eastern and central Europe. Int. J. Clim. 2021, 42, 225–249. [Google Scholar] [CrossRef]
- Lejcuś, K.; Dąbrowska, J.; Garlikowski, D.; Kordas, D. Water Loss from Soil and Water Absorbing Geocomposite. In Proceedings of the 6th International Conference on Environmental Science and Technology, Singapore, Republic of Singapore, 23–25 May 2015; Volume 84, pp. 123–127. [Google Scholar] [CrossRef]
- Marosz, M.; Wójcik, R.; Biernacik, D.; Jakusik, E.; Pilarski, M.; Owczarek, M.; Miętus, M. Zmienność klimatu Polski od połowy XX wieku. Rezultaty projektu Klimat (Poland’s climate variability 1951–2008. KLIMAT project’s results). Pr. I Stud. Geogr. 2011, 47, 51–66. [Google Scholar]
- Brázdil, R.; Zahradníček, P.; Pišoft, P.; Štěpánek, P.; Bělínová, M.; Dobrovolný, P. Temperature and precipitation fluctuations in the Czech Republic during the period of instrumental measurements. Theor. Appl. Clim. 2012, 110, 17–34. [Google Scholar] [CrossRef]
- Łupikasza, E.; Niedźwiedź, T.; Pinskwar, I.; Ruiz-Villanueva, V.; Kundzewicz, Z.W. Observed Changes in Air Temperature and Precipitation and Relationship between them. In the Upper Vistula Basin; Springer International Publishing: Berlin, Germany, 2016. [Google Scholar] [CrossRef]
- Ziernicka-Wojtaszek, A.; Kopcińska, J. Variation in Atmospheric Precipitation in Poland in the Years 2001–2018. Atmosphere 2020, 11, 794. [Google Scholar] [CrossRef]
- Łupikasza, E.; Małarzewski, Ł. Precipitation Change. In Climate Change in Poland; Falarz, M., Ed.; Springer: Cham, Switzerland, 2021; pp. 349–373. [Google Scholar]
- Błażejczyk, K. Sezonowa i wieloletnia zmienność niektórych elementów klimatu w Tatrach i Karkonoszach w latach 1951–2015 (Seasonal and multiannual variability of selected elements of climate in the Tatra and Karkonosze Mts over the 1951–2015 period). Przegl. Geogr. 2019, 91, 41–62. [Google Scholar] [CrossRef]
- Pińskwar, I.; Choryński, A.; Graczyk, D.; Kundzewicz, Z. Observed changes in precipitation totals in Poland. Geografie 2019, 124, 237–264. [Google Scholar] [CrossRef]
- Tomczyk, A.M.; Szyga-Pluta, K. Variability of thermal and precipitation conditions in the growing season in Poland in the years 1966–2015. Theor. Appl. Clim. 2018, 135, 1517–1530. [Google Scholar] [CrossRef] [Green Version]
- Krajewski, A.; Sikorska-Senoner, A.E.; Ranzi, R.; Banasik, K. Long-Term Changes of Hydrological Variables in a Small Lowland Watershed in Central Poland. Water 2019, 11, 564. [Google Scholar] [CrossRef] [Green Version]
- Brázdil, R.; Zahradníček, P.; Dobrovolný, P.; Štěpánek, P.; Trnka, M. Observed changes in precipitation during recent warming: The Czech Republic, 1961–2019. Int. J. Clim. 2021, 41, 3881–3902. [Google Scholar] [CrossRef]
- Brázdil, R.; Zahradníček, P.; Dobrovolný, P.; Řehoř, J.; Trnka, M.; Lhotka, O.; Štěpánek, P. Circulation and Climate Variability in the Czech Republic between 1961 and 2020: A Comparison of Changes for Two “Normal” Periods. Atmosphere 2022, 13, 137. [Google Scholar] [CrossRef]
- Brázdil, R.; Chromá, K.; Dobrovolný, P.; Tolasz, R. Climate fluctuations in the Czech Republic during the period 1961–2005. Int. J. Clim. 2008, 29, 223–242. [Google Scholar] [CrossRef]
- Szwed, M. Variability of precipitation in Poland under climate change. Theor. Appl. Clim. 2018, 135, 1003–1015. [Google Scholar] [CrossRef] [Green Version]
- Rulfová, Z.; Kyselý, J. Trends of Convective and Stratiform Precipitation in the Czech Republic, 1982–2010. Adv. Meteorol. 2014, 2014, 1–11. [Google Scholar] [CrossRef] [Green Version]
- Beranová, R.; Kyselý, J. Trends of precipitation characteristics in the Czech Republic over 1961-2012, their spatial patterns and links to temperature and the North Atlantic Oscillation. Int. J. Clim. 2017, 38, e596–e606. [Google Scholar] [CrossRef]
- Franke, J.; Goldberg, V.; Eichelmann, U.; Freydank, E.; Bernhofer, C. Statistical analysis of regional climate trends in Saxony, Germany. Clim. Res. 2004, 27, 145–150. [Google Scholar] [CrossRef]
- Hansel, S.; Matschullat, J. Precipitation variability and changes in Saxony between 1901 and 2012. In Environmental Changes and Adaptation Strategies; Šiška, B., Ed.; Slovenská bioklimatologická spoločnosť, Česká bioklimatologická společnost: Skalica, Slovakia, 11 September 2013. [Google Scholar]
- Lünich, K.; Pluntke, T.; Prasser, M. (Eds.) Lausitzer Neiße-Charakteristik und Klima der Region (Lusatian Neisse–Characteristics and Climate of the Region); Sächsisches Landesamt für Umwelt, Landwirtschaft und Geologie: Dresden, Germany, 2014; p. 75. [Google Scholar]
- Pluntke, T.; Schwarzak, S.; Kuhn, K.; Lünich, K.; Adynkiewicz-Piragas, M.; Otop, I.; Miszuk, B. Climate analysis as a basis for a sustainable water management at the Lusatian Neisse. Meteorol. Hydrol. Water Manag. 2016, 4, 3–11. [Google Scholar] [CrossRef]
- Miszuk, B. Changes in Precipitation Conditions in the Warm Half-Year in the Polish–Saxon Border Region in Relation to the Atmospheric Circulation. Atmosphere 2022, 13, 720. [Google Scholar] [CrossRef]
- Kożuchowski, K.; Degirmendžić, J. Contemporary changes of climate in Poland: Trends and variation in thermal and solar conditions related to plant vegetation. Pol. J. Ecol. 2005, 53, 283–297. [Google Scholar]
- Okoniewska, M.; Szumińska, D. Changes in Potential Evaporation in the Years 1952–2018 in North-Western Poland in Terms of the Impact of Climatic Changes on Hydrological and Hydrochemical Conditions. Water 2020, 12, 877. [Google Scholar] [CrossRef] [Green Version]
- Poznikova, G. The Drought Indication Based on the Ratio between Potential Evapotranspiration and Precipitation at Different Sites in the Czech Republic over the Last 50 Years. In Environmental Changes and Adaptation Strategies; Šiška, B., Ed.; Slovenská bioklimatologická spoločnosť, Česká bioklimatologická společnost: Skalica, Slovakia, 2013. [Google Scholar]
- Košková, R.; NĚMEČKOVÁ, S. Assessment of evapotranspiration simulations in the Malše basin. Soil Water Res. 2009, 4, S111–S122. [Google Scholar] [CrossRef] [Green Version]
- Somorowska, U. Czasowa zmienność i przestrzenne zróżnicowanie ewapotranspiracji w zlewni nizinnej rzeki Łasicy (Spatial-temporal patterns of evapotranspiration in the Łasica catchment). Pactr. Stud. Geogr. 2021, 66, 35–46. [Google Scholar] [CrossRef]
- Mozny, M.; Trnka, M.; Vlach, V.; Vizina, A.; Potopova, V.; Zahradnicek, P.; Stepanek, P.; Hajkova, L.; Staponites, L.; Zalud, Z. Past (1971–2018) and future (2021–2100) pan evaporation rates in the Czech Republic. J. Hydrol. 2020, 590, 125390. [Google Scholar] [CrossRef]
- Somorowska, U. Changes in Terrestrial Evaporation across Poland over the Past Four Decades Dominated by Increases in Summer Months. Resources 2022, 11, 6. [Google Scholar] [CrossRef]
- Remrová, M.; Císlerová, M. Analysis of climate change effects on evapotranspiration in the watershed Uhlířská in the Jizera Mountains. Soil Water Res. 2010, 5, 28–38. [Google Scholar] [CrossRef] [Green Version]
- Bogawski, P.; Bednorz, E. Comparison and Validation of Selected Evapotranspiration Models for Conditions in Poland (Central Europe). Water Resour. Manag. 2014, 28, 5021–5038. [Google Scholar] [CrossRef] [Green Version]
- Struzik, P.; Kepinska-Kasprzak, M. Use of conventional and satellite data for estimation of evapotranspiration spatial and temporal pattern. Meteorol. Hydrol. Water Manag. 2016, 4, 3–13. [Google Scholar] [CrossRef] [Green Version]
- Stagl, J.; Mayr, E.; Koch, H.; Hattermann, F.F.; Huang, S. Effects of Climate Change on the Hydrological Cycle in Central and Eastern Europe. In Managing Protected Areas in Central and Eastern Europe Under Climate Change; Rannov, S., Neubert, M., Eds.; Spring: Cham, Switzerland, 2014; Volume 58, pp. 31–43. [Google Scholar]
- Radzka, E. Klimatyczny bilans wodny okresu wegetacyjnego (według wzoru Iwanowa) w środkowowschodniej Polsce (Climatic Water Balance for the Vegetation Season (according to Iwanow’s equation) in Central-Eastern Poland). Water-Environ.-Rural. Areas 2014, 14, 67–76. [Google Scholar]
- Szwed, M. The Elements of Water Balance in the Changing Climate in Poland. Adv. Meteorol. 2015, 2015, 1–13. [Google Scholar] [CrossRef]
- Bryś, K.; Bryś, T. Ekstremalne wartości klimatycznych bilansów wodnych we Wrocławiu-Swojcu (Extreme values of climatic water balances in Wrocław-Swojec). Water-Environ.-Rural. Areas 2005, 2, 11–29. [Google Scholar]
- Ziernicka-Wojtaszek, A. Klimatyczny bilans wodny na obszarze Polski w świetle współczesnych zmian klimatu (Climatic Water Balance in Poland in the light of the present day climate changes). Water-Environ.-Rural. Areas 2015, 4, 93–100. [Google Scholar]
- Kasperska-Wołowicz, W.; Łabędzki, L. Climatic and agricultural water balance for grasslands in Poland using the Penman-Monteith method. Annals of Warsaw Agricultural University–SGGW. Land Reclam. 2006, 37, 93–100. [Google Scholar]
- Kołodziej, J. Kształtowanie się klimatycznego bilansu wodnego na terenie Polski w latach 1981-2000 (Forming of climatic water balance in Poland in the years 1981-2000). Infrastruct. Ecol. Rural. Areas 2008, 5, 85–97. [Google Scholar]
- Pivec, J.; Brant, V.; Moravec, D. Analysis of the potential evapotranspiration demands in the Czech Republic between 1961–1990. Biologia 2006, 61, S294–S299. [Google Scholar] [CrossRef] [Green Version]
- Urban, G.; Kuchar, L.; Kępińska-Kasprzak, M.; Łaszyca, E.Z. A Climatic Water Balance Variability during the Growing Season in Poland in the Context of Modern Climate Change. Meteorol. Z 2022. Available online: https://www.schweizerbart.de/papers/metz/detail/prepub/101803/ (accessed on 29 September 2022). [CrossRef]
- Kuźniar, A.; Twardy, S.; Kowalczyk, A.; Kostuch, M. An assessment of the water requirements of a mountain pasture sward in the Polish Western Carpathians. J. Water Land Dev. 2011, 15, 193–208. [Google Scholar] [CrossRef]
- Hlasny, T.; Balaz, P. The climatic water balance of Slovakia based on the FAO Penman-Monteith potential evapotranspiration. Geogr Cas. 2008, 60, 15–30. [Google Scholar]
- Der Geoportal, B.F.G. Mean Annual Climatic Water Balance. Available online: https://geoportal.bafg.de/dokumente/had/214ClimaticWaterBalance.pdf (accessed on 15 September 2022).
- Durło, G.B. Climatic Water Balance for vegetation periods in Western Beskid Mountains. Acta Agrophys. 2007, 10, 553–562. [Google Scholar]
- Durło, G.B. Climatic water balance in the Góry Opawskie Landscape Park. Sylwan 2019, 163, 802–810. [Google Scholar] [CrossRef]
- Kowanetz, L. On the method of determining the climatic water balance in mountainous area, with an example from the Polish Carpathians. Pr. Geogr. 2000, 105, 137–164. [Google Scholar]
- Hoy, A.; Feske, N.; Štěpánek, P.; Skalák, P.; Schmitt, A.; Schneider, P. Climatic Changes and Their Relation to Weather Types in a Transboundary Mountainous Region in Central Europe. Sustainability 2018, 10, 2049. [Google Scholar] [CrossRef] [Green Version]
- Šípek, V. The influence of large-scale climatic patterns on precipitation, temperature, and discharge in Czech river basins. J. Hydrol. Hydromech. 2013, 61, 278–285. [Google Scholar] [CrossRef] [Green Version]
- Řehoř, J.; Brázdil, R.; Lhotka, O.; Trnka, M.; Balek, J.; Štěpánek, P.; Zahradníček, P. Precipitation in the Czech Republic in Light of Subjective and Objective Classifications of Circulation Types. Atmosphere 2021, 12, 1536. [Google Scholar] [CrossRef]
- Degirmendžić, J.; Kożuchowski, K.; Żmudzka, E. Changes of air temperature and precipitation in Poland in the period 1951-2000 and their relationship to atmospheric circulation. Int. J. Clim. 2004, 24, 291–310. [Google Scholar] [CrossRef]
- van Ulden, A.P.; van Oldenborgh, G.J. Large-scale atmospheric circulation biases and changes in global climate model simulations and their importance for climate change in Central Europe. Atmos. Chem. Phys. 2006, 6, 863–881. [Google Scholar] [CrossRef] [Green Version]
- Lupikasza, E. Relationships between occurrence of high precipitation and atmospheric circulation in Poland using different classifications of circulation types. Phys. Chem. Earth 2010, 35, 448–455. [Google Scholar] [CrossRef]
- Twardosz, R.; Niedźwiedź, T.; Łupikasza, E. The influence of atmospheric circulation on the type of precipitation (Kraków, southern Poland). Theor. Appl. Clim. 2010, 104, 233–250. [Google Scholar] [CrossRef] [Green Version]
- Twardosz, R.; Niedźwiedź, T.; Łupikasza, E. Temporal Variability in the Form and Type of Precipitation Kraków in Relation to Circulation Patterns; Jagiellonian University: Kraków, Poland, 2011; p. 177. [Google Scholar]
- Niedźwiedź, T.; Twardosz, R.; Walanus, A. Long-term variability of precipitation series in east central Europe in relation to circulation patterns. Theor. Appl. Clim. 2009, 98, 337–350. [Google Scholar] [CrossRef]
- Hoy, A.; Schucknecht, A.; Sepp, M.; Matschullat, J. Large-scale synoptic types and their impact on European precipitation. Theor. Appl. Clim. 2013, 116, 19–35. [Google Scholar] [CrossRef]
- Nowosad, M.; Stach, A. Relation between extensive extreme precipitation in Poland and atmospheric circulation. Quaest. Geogr. 2014, 33, 115–129. [Google Scholar] [CrossRef] [Green Version]
- Wibig, J.; Piotrowski, P. Impact of the air temperature and atmospheric circulation on extreme precipitation in Poland. Int. J. Clim. 2018, 38, 4533–4549. [Google Scholar] [CrossRef]
- Rulfová, Z.; Beranová, R.; Kyselý, J. Climate change scenarios of convective and large-scale precipitation in the Czech Republic based on EURO-CORDEX data. Int. J. Clim. 2016, 37, 2451–2465. [Google Scholar] [CrossRef]
- Zahradníček, P.; Brázdil, R.; Řehoř, J.; Lhotka, O.; Dobrovolný, P.; Štěpánek, P.; Trnka, M. Temperature extremes and circulation types in the Czech Republic, 1961–2020. Int. J. Clim. 2022, 42, 4808–4829. [Google Scholar] [CrossRef]
- Cahynová, M.; Huth, R. Changes of atmospheric circulation in central Europe and their influence on climatic trends in the Czech Republic. Theor. Appl. Clim. 2009, 96, 57–68. [Google Scholar] [CrossRef]
- Tomczyk, A.M. Thermal Conditions Relative to Atmospheric Circulation in the Christmas Period in Poland. Quaest. Geogr. 2016, 35, 47–56. [Google Scholar] [CrossRef] [Green Version]
- Bartoszek, K.; Matuszko, D. The influence of atmospheric circulation over Central Europe on the long-term variability of sunshine duration and air temperature in Poland. Atmos. Res. 2020, 251, 105427. [Google Scholar] [CrossRef]
- Urban, G.; Migała, K.; Pawliczek, P. Sunshine duration and its variability in the main ridge of the Karkonosze Mountains in relation to with atmospheric circulation. Theor. Appl. Clim. 2017, 131, 1173–1189. [Google Scholar] [CrossRef] [Green Version]
- Araźny, A.; Bartczak, A.; Maszewski, R.; Krzemiński, M. The influence of atmospheric circulation on the occurrence of dry and wet periods in Central Poland in 1954–2018. Theor. Appl. Clim. 2021, 146, 1079–1095. [Google Scholar] [CrossRef]
- Rulfová, Z.; Beranová, R.; Plavcová, E. Compound Temperature and Precipitation Events in the Czech Republic: Differences of Stratiform versus Convective Precipitation in Station and Reanalysis Data. Atmosphere 2021, 12, 87. [Google Scholar] [CrossRef]
- Wypych, A.; Czekierda, D.; Rösler, A.; Chmal, M.; Chmal, T. Air humidity and evaporation conditions in Poland in relation to atmospheric circulation patterns. Aerul Şi Apa Compon. Ale Mediu. 2013, 2013, 103–110. [Google Scholar]
- Bartczak, A.; Araźny, A.; Krzemiński, M.; Maszewski, R. Hydrological Dry Periods versus Atmospheric Circulations in the Lower Vistula Basin (Poland) in 1954–2018. Quaest. Geogr. 2022, 41, 107–125. [Google Scholar] [CrossRef]
- Řehoř, J.; Brázdil, R.; Trnka, M.; Lhotka, O.; Balek, J.; Možný, M.; Štěpánek, P.; Zahradníček, P.; Mikulová, K.; Turňa, M. Soil drought and circulation types in a longitudinal transect over central Europe. Int. J. Clim. 2020, 41, E2834–E2850. [Google Scholar] [CrossRef]
- Bednorz, E.; Wrzesiński, D.; Tomczyk, A.M.; Jasik, D. Classification of Synoptic Conditions of Summer Floods in Polish Sudeten Mountains. Water 2019, 11, 1450. [Google Scholar] [CrossRef] [Green Version]
- Miszuk, B. Multi-Annual Changes in Heat Stress Occurrence and Its Circulation Conditions in the Polish–Saxon Border Region. Atmosphere 2021, 12, 163. [Google Scholar] [CrossRef]
- Szyga-Pluta, K. Variation of cloudiness in the mountain region on the example of the Sudetes. Bad. Fizjogr. Ser. A Geogr. Fiz. 2017, A68, 205–221. [Google Scholar] [CrossRef]
- Migała, K.; Urban, G.; Tomczyński, K. Long-term air temperature variation in the Karkonosze mountains according to atmospheric circulation. Theor. Appl. Clim. 2015, 125, 337–351. [Google Scholar] [CrossRef] [Green Version]
- Ojrzyńska, H.; Bilińska, D.; Werner, M.; Kryza, M.; Malkiewicz, M. The influence of atmospheric circulation conditions on Betula and Alnus pollen concentrations in Wrocław, Poland. Aerobiologia 2020, 36, 261–276. [Google Scholar] [CrossRef] [Green Version]
- Bryś, K.; Bryś, T. Multi-annual variability of global solar radiation in the agricultural part of Lower Silesia (SW Poland) and its relationship to the North Atlantic Oscillation. Meteorol. Hydrol. Water Manag. 2019, 7, 13–25. [Google Scholar] [CrossRef]
- Visbeck, M.H.; Hurrell, J.W.; Polvani, L.; Cullen, H.M. The North Atlantic Oscillation: Past, present, and future. Proc. Natl. Acad. Sci. USA 2001, 98, 12876–12877. [Google Scholar] [CrossRef] [Green Version]
- Rousi, E.; Selten, F.; Rahmstorf, S.; Coumou, D. Changes in North Atlantic Atmospheric Circulation in a Warmer Climate Favor Winter Flooding and Summer Drought over Europe. J. Clim. 2021, 34, 2277–2295. [Google Scholar] [CrossRef]
- Kyselý, J.; Huth, R. Changes in atmospheric circulation over Europe detected by objective and subjective methods. Theor. Appl. Clim. 2005, 85, 19–36. [Google Scholar] [CrossRef]
- Bartoszek, K. The main characteristics of atmospheric circulation over East-Central Europe from 1871 to 2010. Meteorol. Atmos. Phys. 2016, 129, 113–129. [Google Scholar] [CrossRef] [Green Version]
- Niedźwiedż, T.; Ustrnul, Z. Change of Atmospheric Circulation. In Climate Change in Poland; Falarz, M., Ed.; Springer: Cham, Switzerland, 2021; pp. 123–150. [Google Scholar]
- Lityński, J. Liczbowa klasyfikacja typów cyrkulacji i typów pogody dla Polski (A numerical classification of circulation types and weather types for Poland). Pr. PIHM 1969, 97, 3–14. [Google Scholar]
- Pianko-Kluczyńska, K. Nowy kalendarz typów cyrkulacji atmosfery według J. Lityńskiego (New calendar of atmosphere circulation types according to J. Lityński). Wiadomości Meteorol. Hydrol. Gospod. Wodnej 2007, I, 65–85. [Google Scholar]
- Nowosad, M. Kalendarz Wskaźników Cyrkulacji i Typów Cyrkulacji nad Polską Według Formuły Lityńskiego. Zbiór Komputerowy (Calendar of Circulation Indicators and Circulation Types over Poland according to the Lityński Formula. Digital Collection); Department of Meteorology and Climatology, Maria Curie Skłodowska University: Lublin, Poland, 2017. [Google Scholar]
- Kulesza, K. Nowe spojrzenie na klasyfikację typów cyrkulacji atmosfery J. Lityńskiego (New look on the classification of atmospheric circulation types by J. Lityński). Pr. Geogr. 2017, 150, 79–94. [Google Scholar] [CrossRef] [Green Version]
- Kulesza, K. Modified, threshold-based circulation type classification for Central Europe, on the basis of Lityński’s classification. Misc. Geogr.-Reg. Stud. Dev. 2019, 23, 53–62. [Google Scholar] [CrossRef] [Green Version]
- Kossowska-Cezak, U.; Twardosz, R. Uwarunkowania cyrkulacyjne temperatury powietrza w Warszawie w miesiącach o skrajnych wartościach wskaźnika NAO (1951-2015) (Impact of atmospheric circulation on air temperaturę in Warsaw during months with extreme values of the NAO index (1951–2015)). Pr. Geogr. 2018, 153, 69–87. [Google Scholar] [CrossRef]
- Wiątek, M. Uwarunkowania cyrkulacyjne występowania ciepłych miesięcy zimowych na obszarze Pobrzeży Południowobałtyckich (Circulation conditions of the occurrence of warm winter months in the southern Baltic coast). Pr. Geogr. 2014, 139, 43–56. [Google Scholar] [CrossRef]
- Pianko-Kluczyńska, K. Związek między cyrkulacją atmosferyczną według Lityńskiego i sezonowymi opadami w Polsce (The relationship between atmospheric circulation by Lityński and seasonal rainfall in Poland). Prz. Nauk. Inż. Kszt. Środ. 2015, 68, 67–177. [Google Scholar]
- Nowosad, M.; Rodzik, B.; Wereski, S.; Dobek, M. The UTCI Index in Lesko and Lublin and its circulation determinants. Geogr. Pol. 2013, 86, 29–36. [Google Scholar] [CrossRef] [Green Version]
- Szyga-Pluta, K. Typy cyrkulacji atmosfery a rodzaje chmur w Poznaniu (Atmosphere circulation categories and the clouds types in Poznań). Bad. Fizjogr. Pol. Zach. Ser. A 2009, 60, 133–145. [Google Scholar] [CrossRef]
- Hänsel, S.; Matschullat, J. Monthly trends of daily heavy precipitation indicators from lowland to mountainous regions in Saxony, Germany. In Proceedings of the Conference: Sustainable Development and Bioclimate, Stará Lesna, Slovakia, 5–9 October 2009. [Google Scholar]
- Alexandersson, H. A homogeneity test applied to precipitation data. J. Clim. 1986, 6, 661–675. [Google Scholar] [CrossRef]
- Alexandersson, H.; Moberg, A. Homogenization of Swedish temperature data. Part I: Homogeneity test for linear trends. Int. J. Clim. 1997, 17, 25–34. [Google Scholar] [CrossRef]
- ETo Calculator. Available online: https://www.fao.org/land-water/databases-and-software/eto-calculator/en/ (accessed on 27 September 2022).
- Allen, R.G.; Pereira, L.S.; Raes, D.; Smith, M. Crop Evapotranspiration-Guidelines for Computing Crop Water Requirements-FAO Irrigation and Drainage Paper 56. FAO. 1998. Available online: https://www.fao.org/3/X0490E/X0490E00.htm (accessed on 27 September 2022).
- Kaszewski, B. Wykorzystanie Typologii Cyrkulacji Atmosfery w Badaniach Klimatologicznych (The Use of Typology of Atmospheric Circulation in Climatological Research); Rocznik fizyczno-geograficzny: Uniwersytet Gdański, Poland, 2001; Volume VI, pp. 13–26. [Google Scholar]
- Nowosad, M. O problemach związanych z wyznaczaniem typów cyrkulacji Lityńskiego (Problems related to the determination of Litynski atmospheric circulation types). Przegl. Geogr. 2019, 159, 49–66. [Google Scholar] [CrossRef]
- Kalnay, E.; Kanamitsu, M.; Kistler, R.; Collins, W.; Deaven, D.; Gandin, L.; Iredell, M.; Saha, S.; White, G.; Woollen, J.; et al. The NCEP/ NCAR 40-Year Reanalysis Project. Bull. Am. Meteorol. Soc. 1996, 77, 437–470. [Google Scholar] [CrossRef]
- Pianko-Kluczyńska, K. (IMGW-PIB, Warsaw, Poland); Ustrnul, Z. (IMGW-PIB, Cracow, Poland). Calendar of the circulation conditions, according to the Lityński classification, 2022. Unpublished work. Obtained directly from the authors.
- Błaś, M.; Sobik, M. Osobliwości klimatu Karkonoszy i Gór Izerskich (Climatic peculiarities of the Izera and Giant Mountains (Western Sudetes)). In Rola Stacji Terenowych w Badaniach Geograficznych; Bokwa, A., Ed.; IGiGP UJ: Kraków, Poland, 2005; pp. 109–121. [Google Scholar]
- Kwiatkowski, J. Opady rzeczywiste w Sudetach (Actual precipitations in the Sudetes Mountains). Przegl. Geofiz. 1978, 23, 35–44. [Google Scholar]
- Kostecki, S.; Banasiak, R. The Catastrophe of the Niedów Dam—The Causes of the Dam’s Breach, Its Development, and Consequences. Water 2021, 13, 3254. [Google Scholar] [CrossRef]
- Łabędzki, L.; Bąk, B.; Smarzyńska, K. Spatio-Temporal Variability and Trends of Penman-Monteith Reference Evapotranspiration (FAO-56) in 1971-2010 under Climatic Conditions of Poland. Pol. J. Environ. Stud. 2014, 23, 2083–2091. [Google Scholar] [CrossRef] [Green Version]
- Ustrnul, Z.; Wypych, A.; Czekierda, D. Air Temperature Change. In Climate Change in Poland; Falarz, M., Ed.; Springer: Cham, Switzerland, 2021; pp. 275–330. [Google Scholar]
- Brieber, A.; Hoy, A. Statistical analysis of very high-resolution precipitation data and relation to atmospheric circulation in Central Germany. Adv. Sci. Res. 2019, 16, 69–73. [Google Scholar] [CrossRef] [Green Version]
- Szwed, M. Projections of changes of areal evapotranspiration for different land-use units in the Wielkopolska Region (Poland). Theor. Appl. Clim. 2016, 130, 291–304. [Google Scholar] [CrossRef] [Green Version]
- Mazurski, R.M. The Destruction in Forests in the Polish Sudetes Mountains by Industrial Emissions. For. Ecol. Manag. 1986, 17, 301–315. [Google Scholar] [CrossRef]
- Bałazy, R.; Ciesielski, M.; Waraksa, P.; Zasada, M.; Zawiła-Niedźwiecki, T. Deforestation Processes in the Polish Mountains in the Context of Terrain Topography. Forests 2019, 10, 1027. [Google Scholar] [CrossRef] [Green Version]
- Urban, G. Zaleganie pokrywy śnieżnej i jego zmienność w polskiej części Sudetów i na ich przedpolu (Duration of snow cover and its variability in the Polish part of the Sudetes Mts. and their foreland). Przegl. Geogr. 2015, 87, 497–516. [Google Scholar] [CrossRef] [Green Version]
- Urban, G. Snow cover and its variability in the Polish Sudetes Mts. and the Sudetic Foreland. Geografie 2016, 121, 32–53. [Google Scholar] [CrossRef] [Green Version]
Figure 1.
Location of the meteorological stations in the Sudetes Mountains and their foreland.

Figure 2.
Mean values of evapotranspiration (Ep), precipitation totals (RR), and climate water balance (CWB) in the warm half-year (May–October) of 1981–2020 in the Sudetes Mountains and their foreland.
Figure 2.
Mean values of evapotranspiration (Ep), precipitation totals (RR), and climate water balance (CWB) in the warm half-year (May–October) of 1981–2020 in the Sudetes Mountains and their foreland.

Figure 3.
Changes in mean air temperature in the warm half-year of 1981–2020 at the selected stations of the Sudetes Mountains and their foreland.
Figure 3.
Changes in mean air temperature in the warm half-year of 1981–2020 at the selected stations of the Sudetes Mountains and their foreland.

Figure 4.
Frequency of particular circulation sectors and classes (a—anticyclonic, c—cyclonic, o—transitional) in the warm half-year of 1981–2020 in the Sudetes Mountains and their foreland; according to the calendar of circulation conditions [109].
Figure 4.
Frequency of particular circulation sectors and classes (a—anticyclonic, c—cyclonic, o—transitional) in the warm half-year of 1981–2020 in the Sudetes Mountains and their foreland; according to the calendar of circulation conditions [109].

Figure 5.
Mean precipitation totals (RR) in the warm half-year (May–October) of 1981–2020 at the selected meteorological stations (left) and the mean fraction of precipitation totals (right) under the anticyclonic (a), cyclonic (c), and transitional (o) conditions in the Sudetes Mountains and their foreland.

Figure 6.
Mean potential evapotranspiration (Ep) in the warm half-year (May–October) of 1981–2020 at the selected meteorological stations (left) and the mean fraction of potential evapotranspiration (right) under the anticyclonic (a), cyclonic (c), and transitional (o) conditions in the Sudetes Mountains and their foreland.

Figure 7.
Mean values of climate water balance (CWB) in the warm half-year (May–October) of 1981–2020 under anticyclonic (a), cyclonic (c), and transitional (o) conditions at the selected meteorological stations in the Sudetes Mountains and their foreland.
Figure 7.
Mean values of climate water balance (CWB) in the warm half-year (May–October) of 1981–2020 under anticyclonic (a), cyclonic (c), and transitional (o) conditions at the selected meteorological stations in the Sudetes Mountains and their foreland.

Figure 8.
Mean values of CWB and their trend in the warm half-year (May–October) of 1981–2020 in Luka and Červená under the S-types of the cyclonic circulation.
Figure 8.
Mean values of CWB and their trend in the warm half-year (May–October) of 1981–2020 in Luka and Červená under the S-types of the cyclonic circulation.

Figure 9.
Mean values of CWB and their trend in the warm half-year (May–October) of 1981–2020 in Wrocław under the W-types of the transitional circulation.
Figure 9.
Mean values of CWB and their trend in the warm half-year (May–October) of 1981–2020 in Wrocław under the W-types of the transitional circulation.


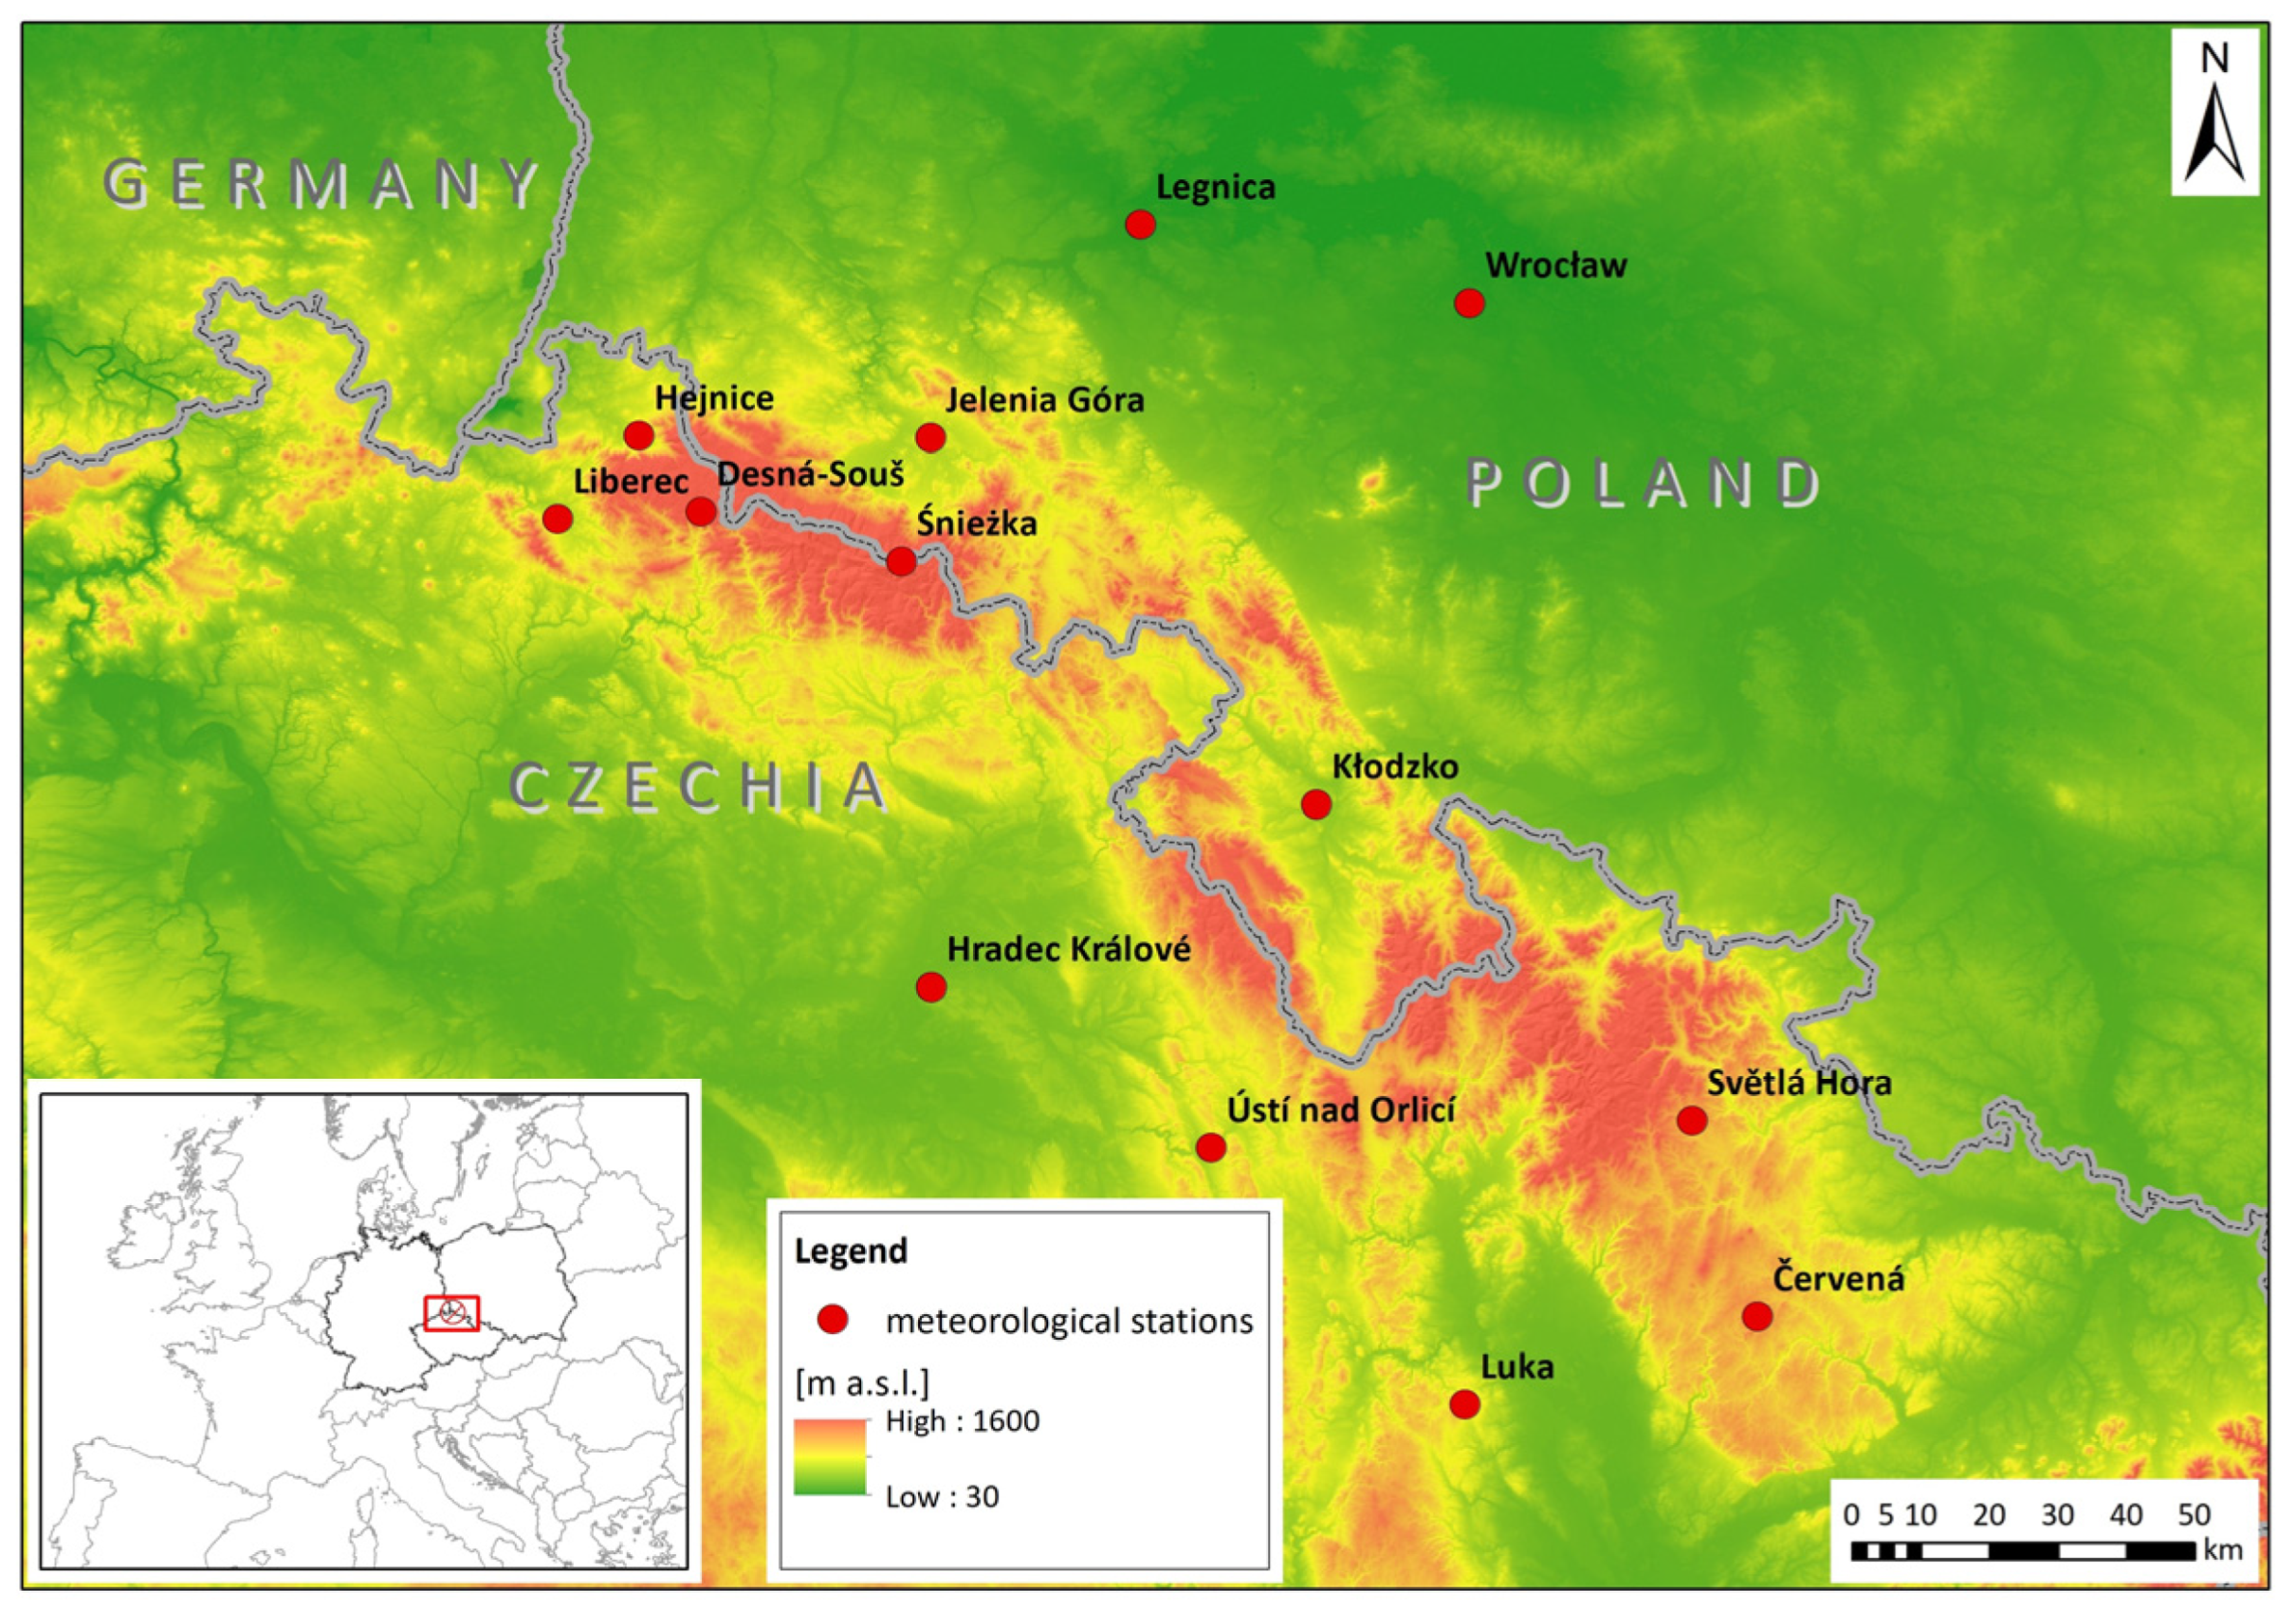
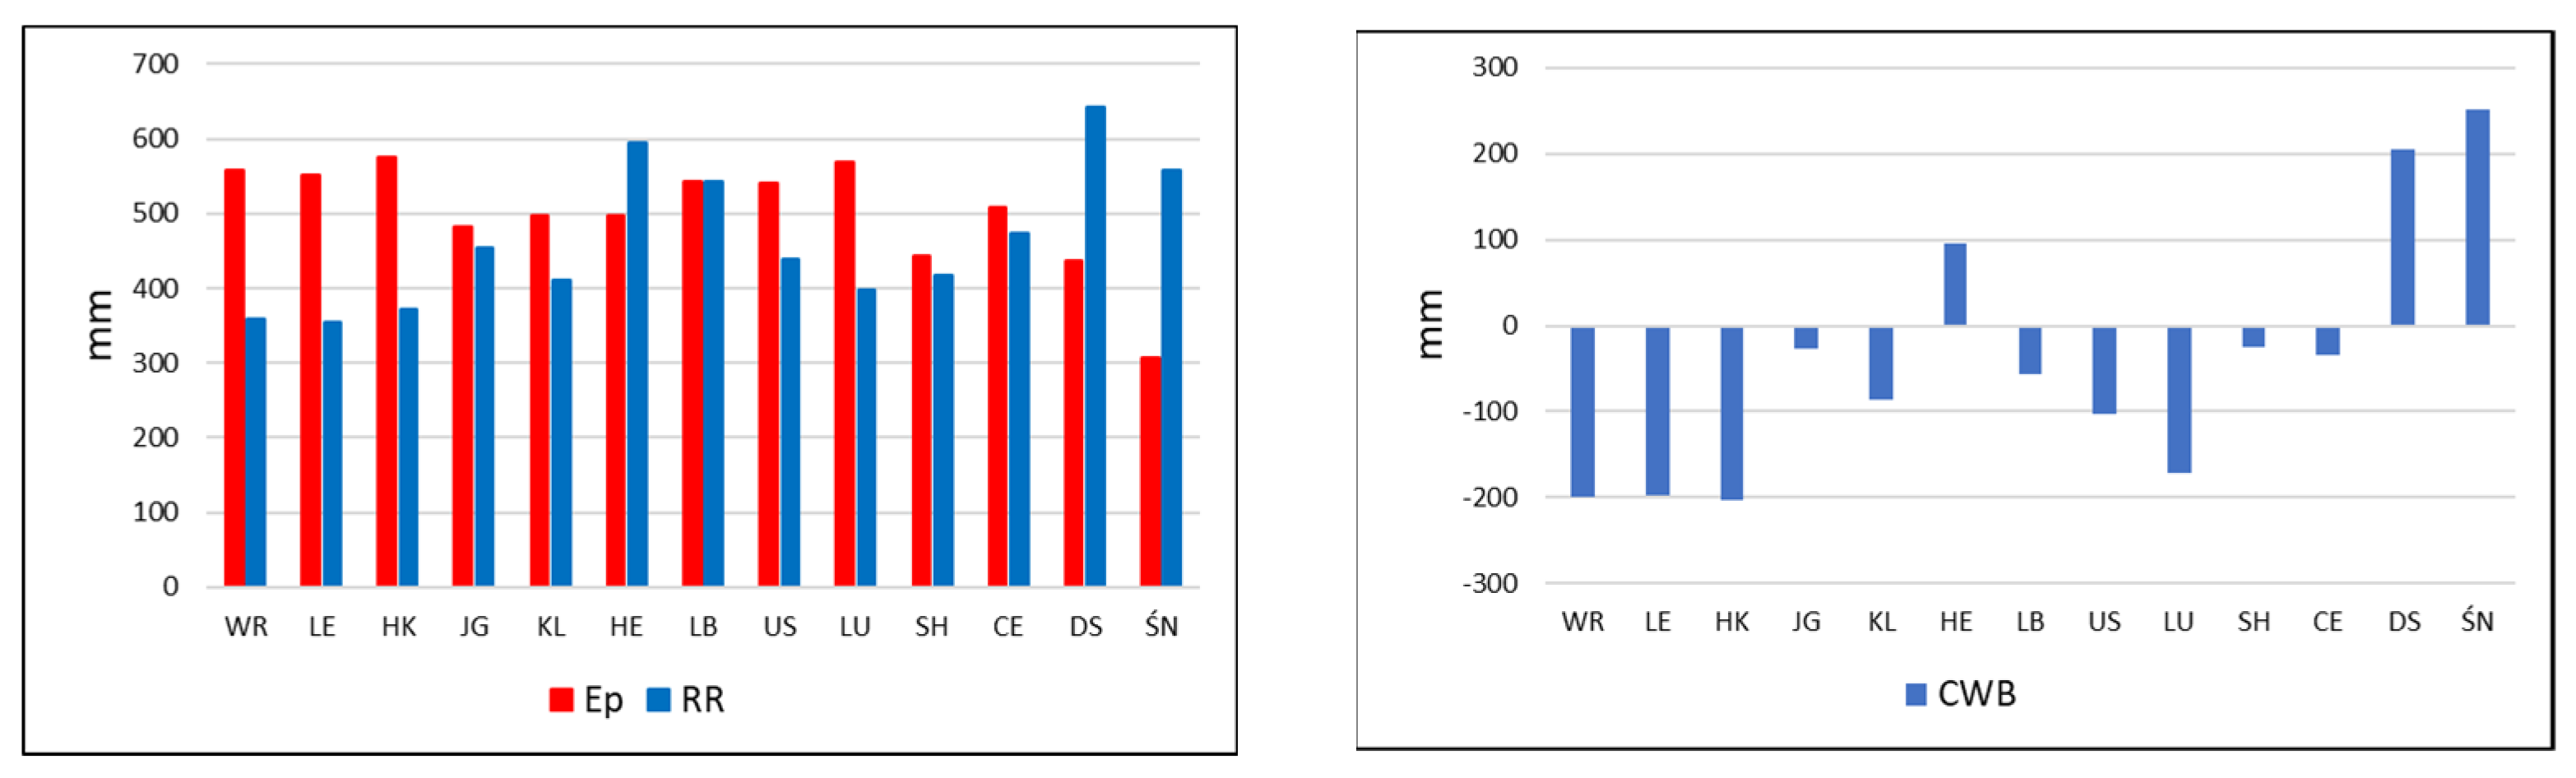
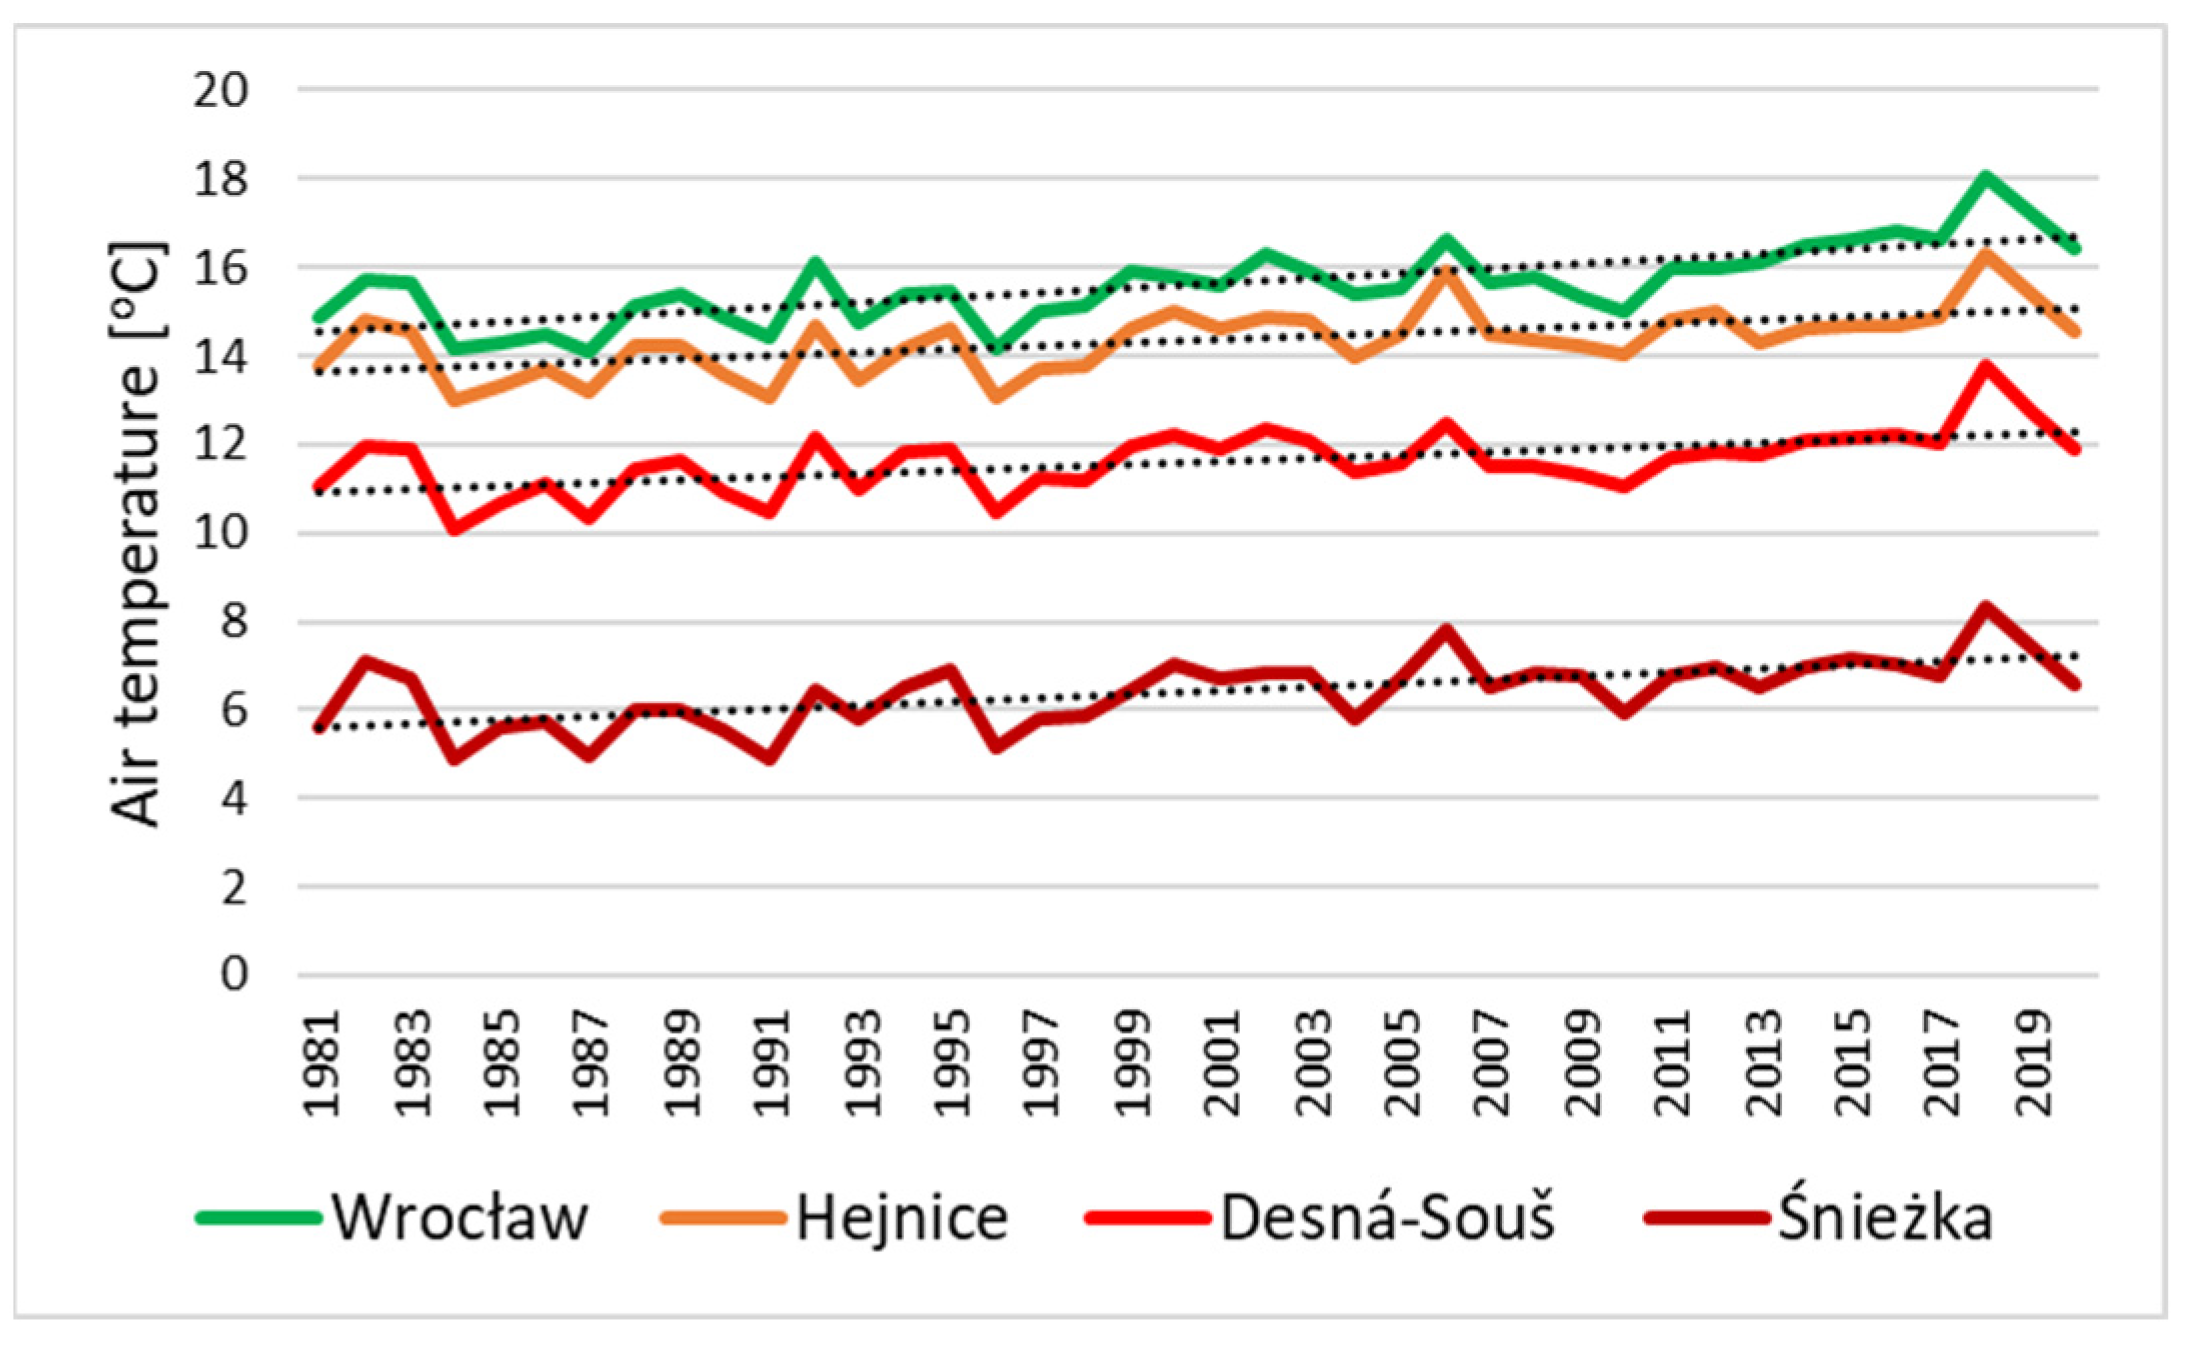
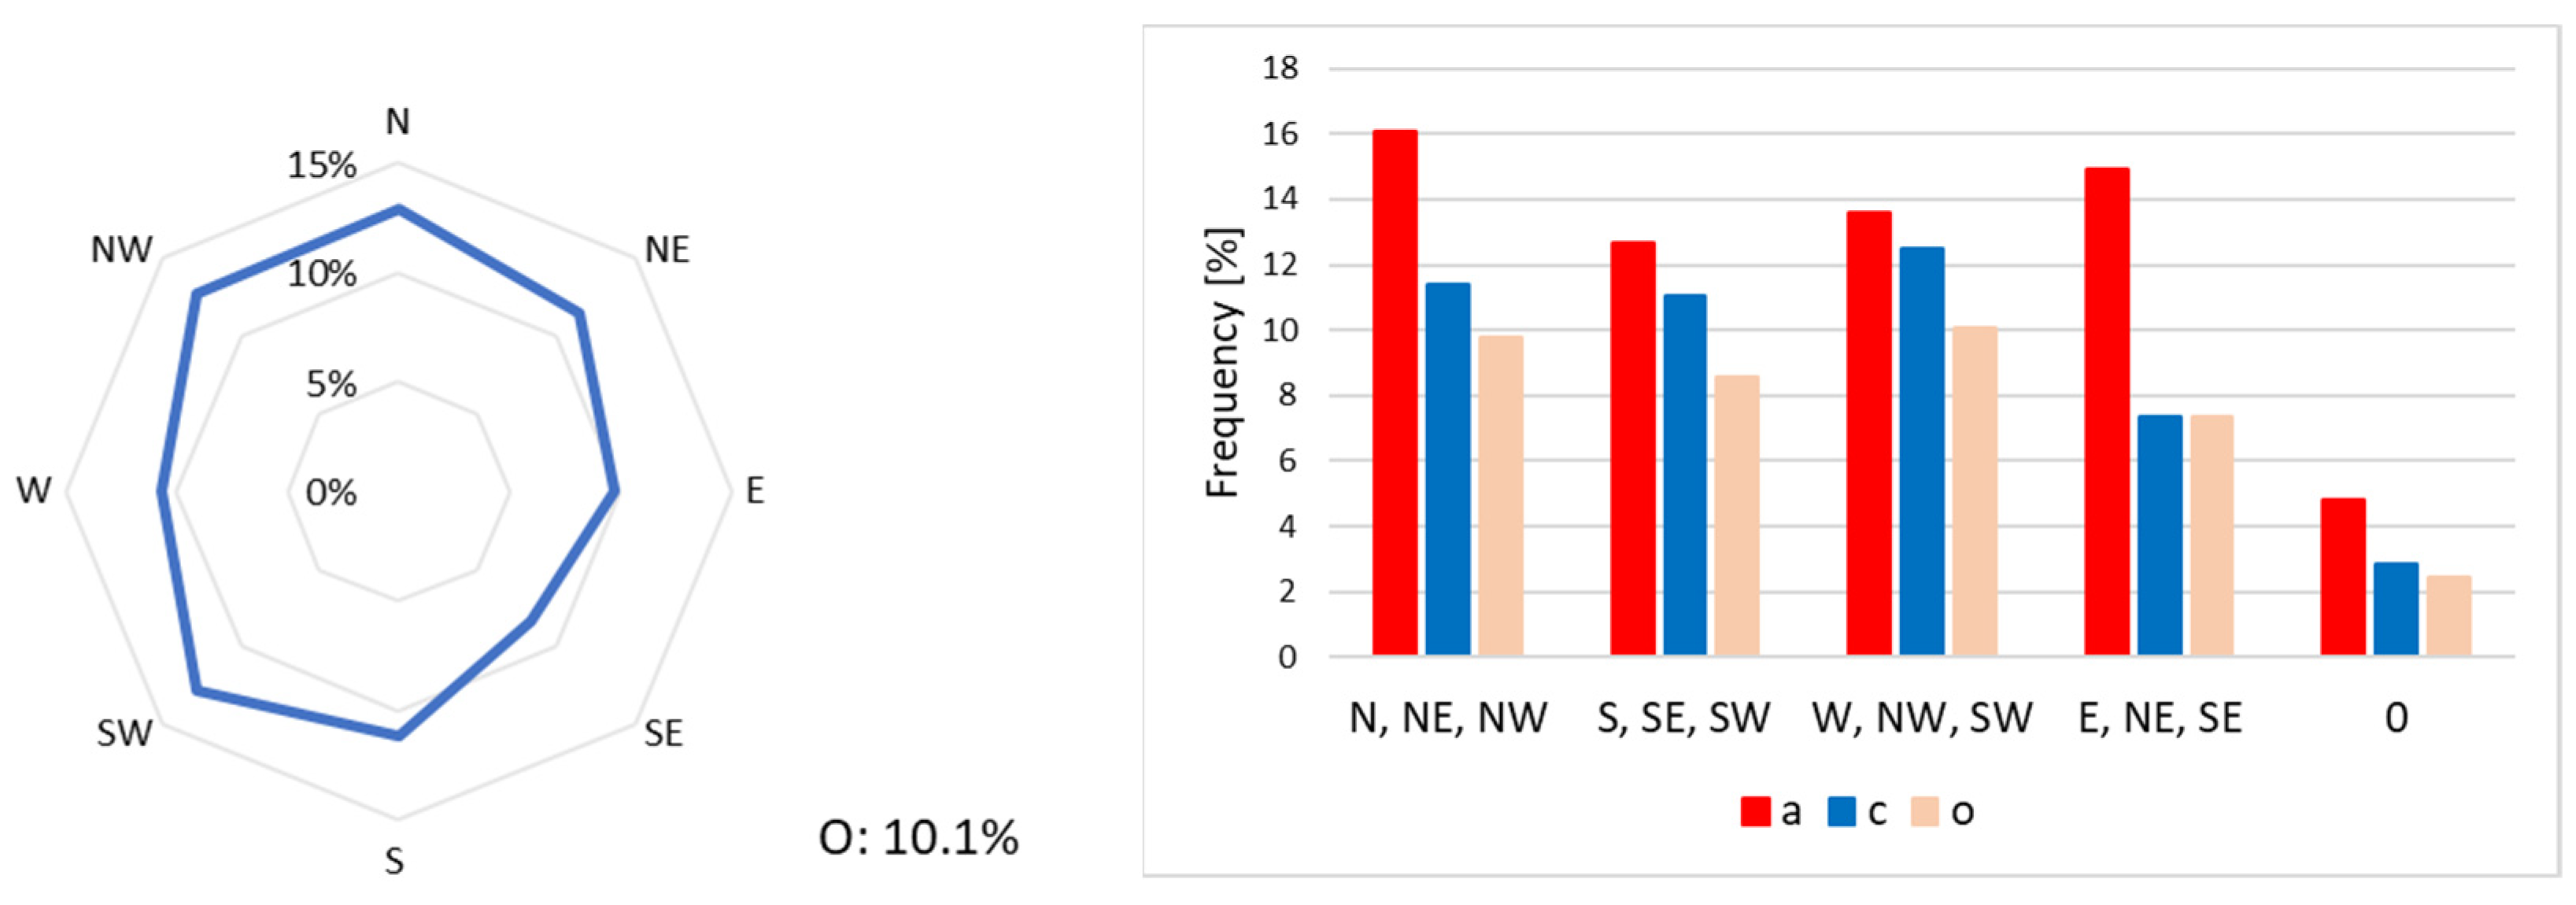
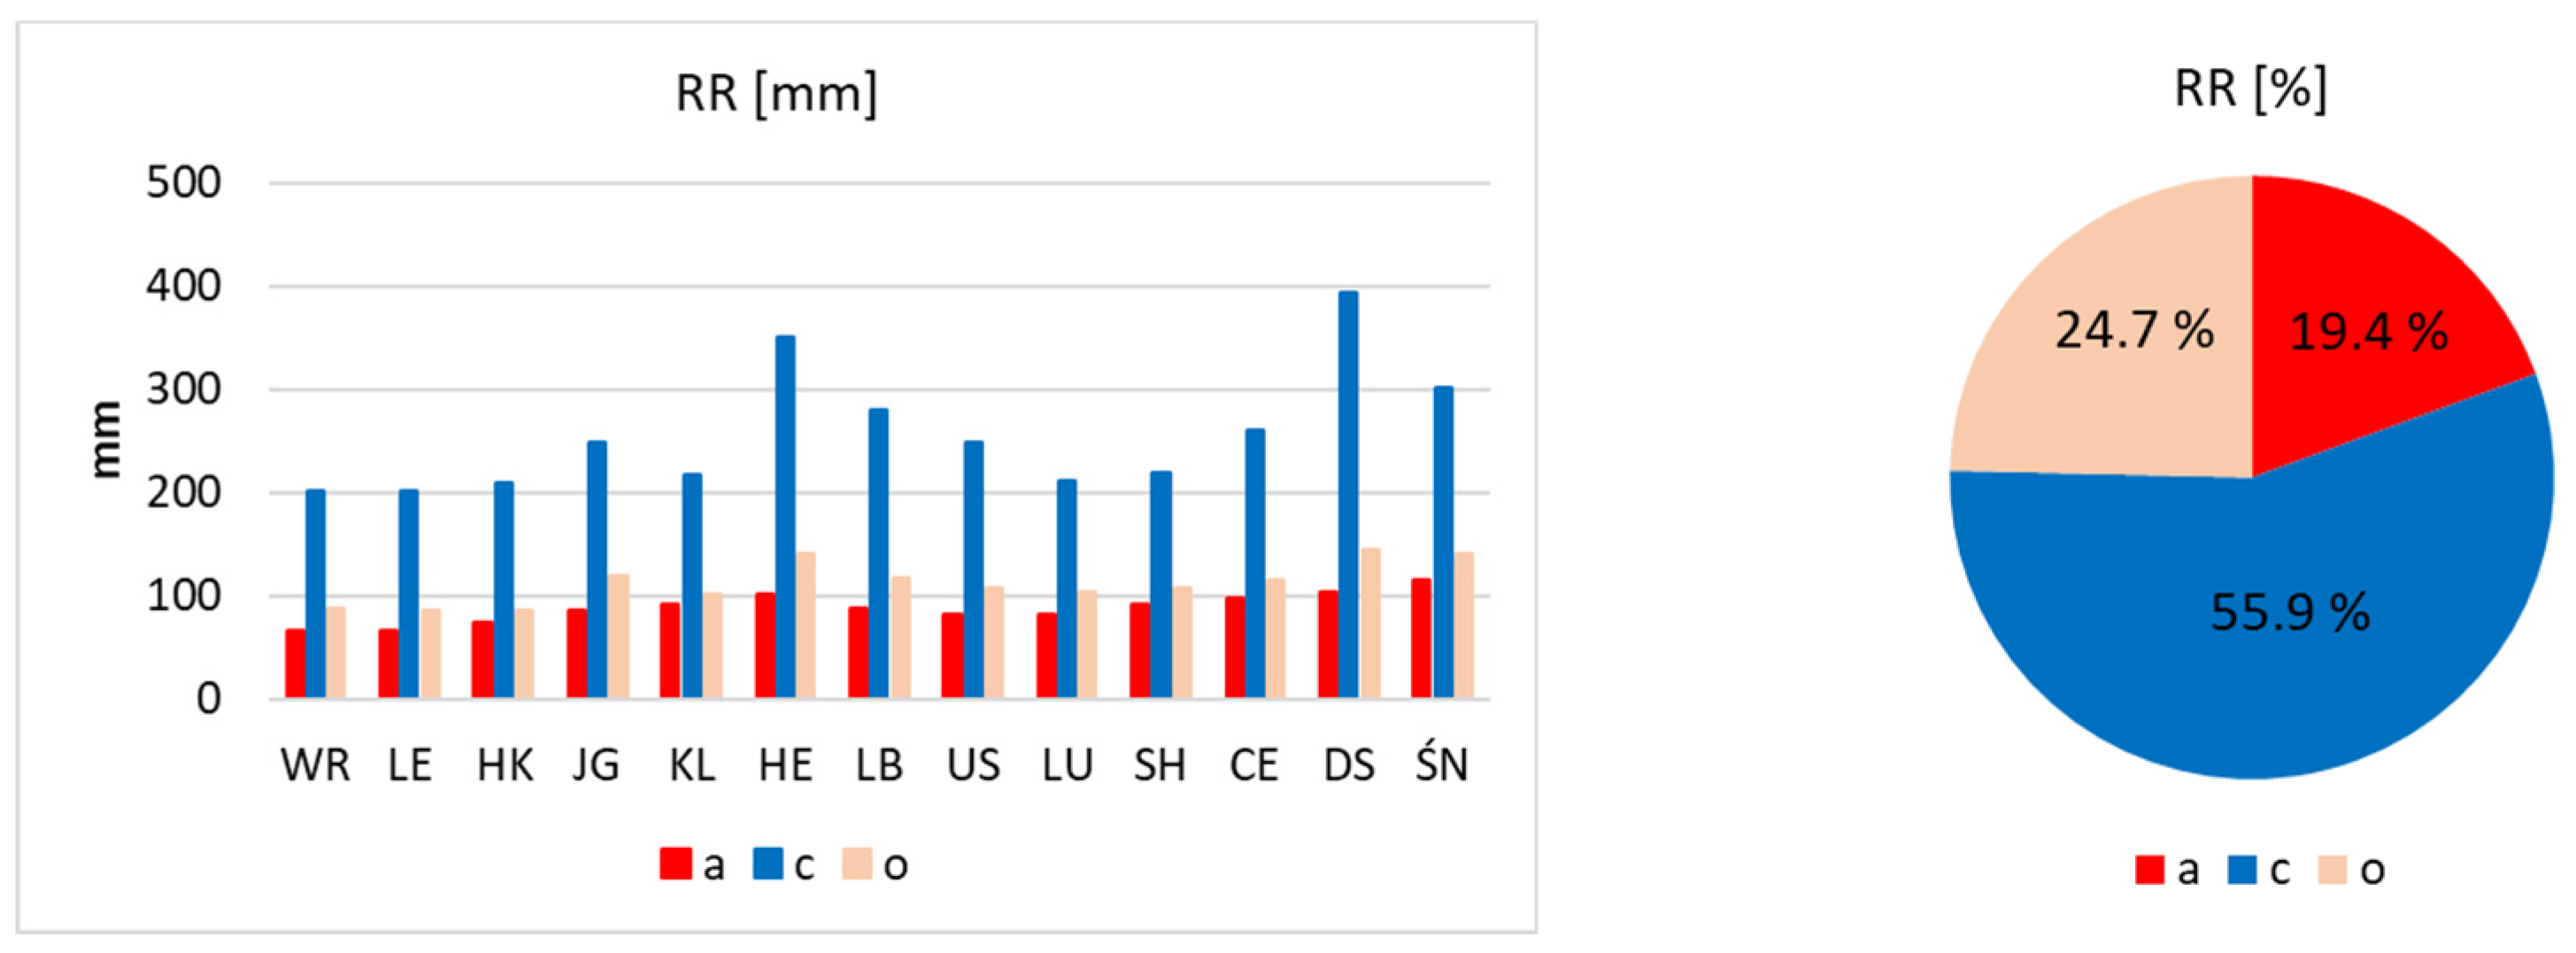
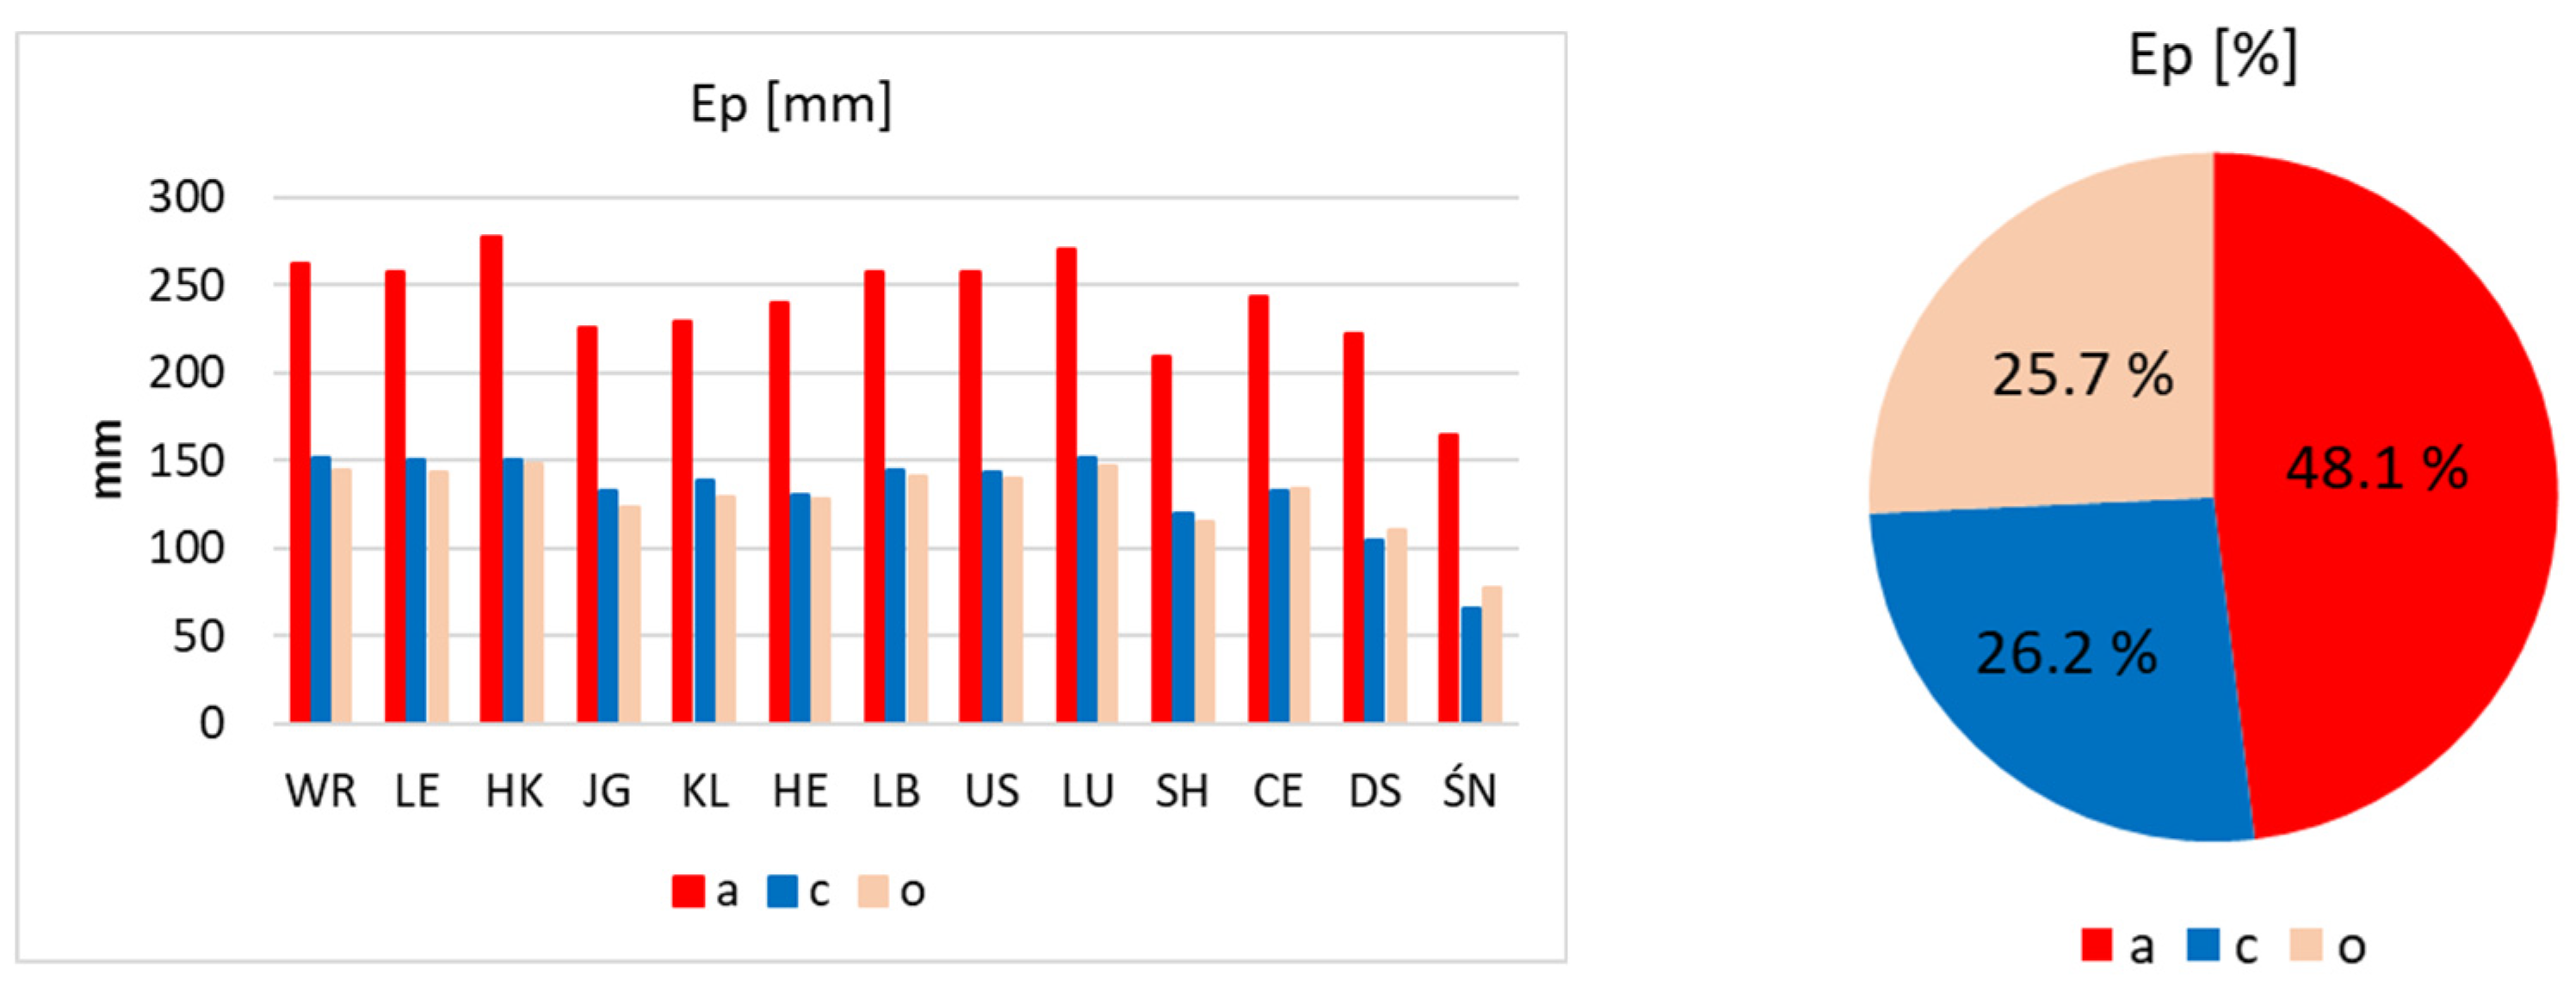
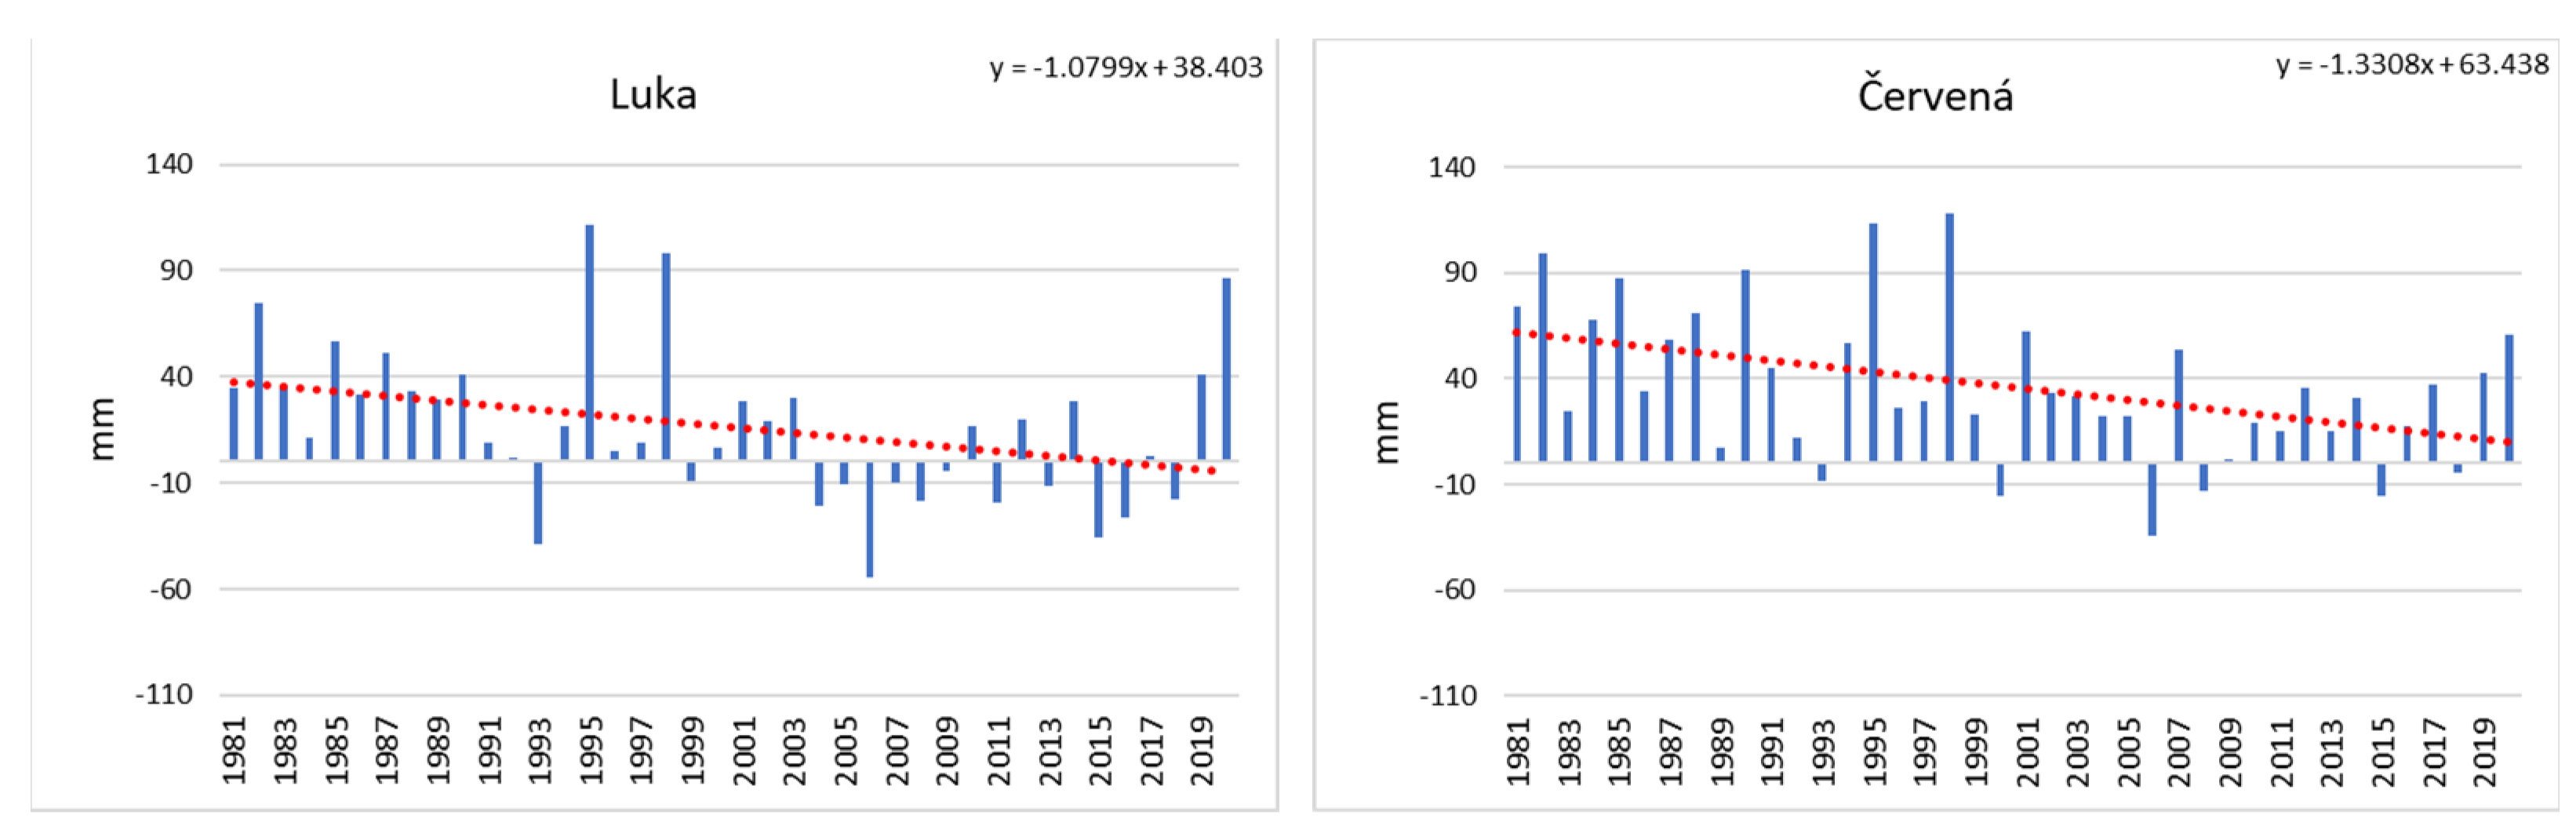
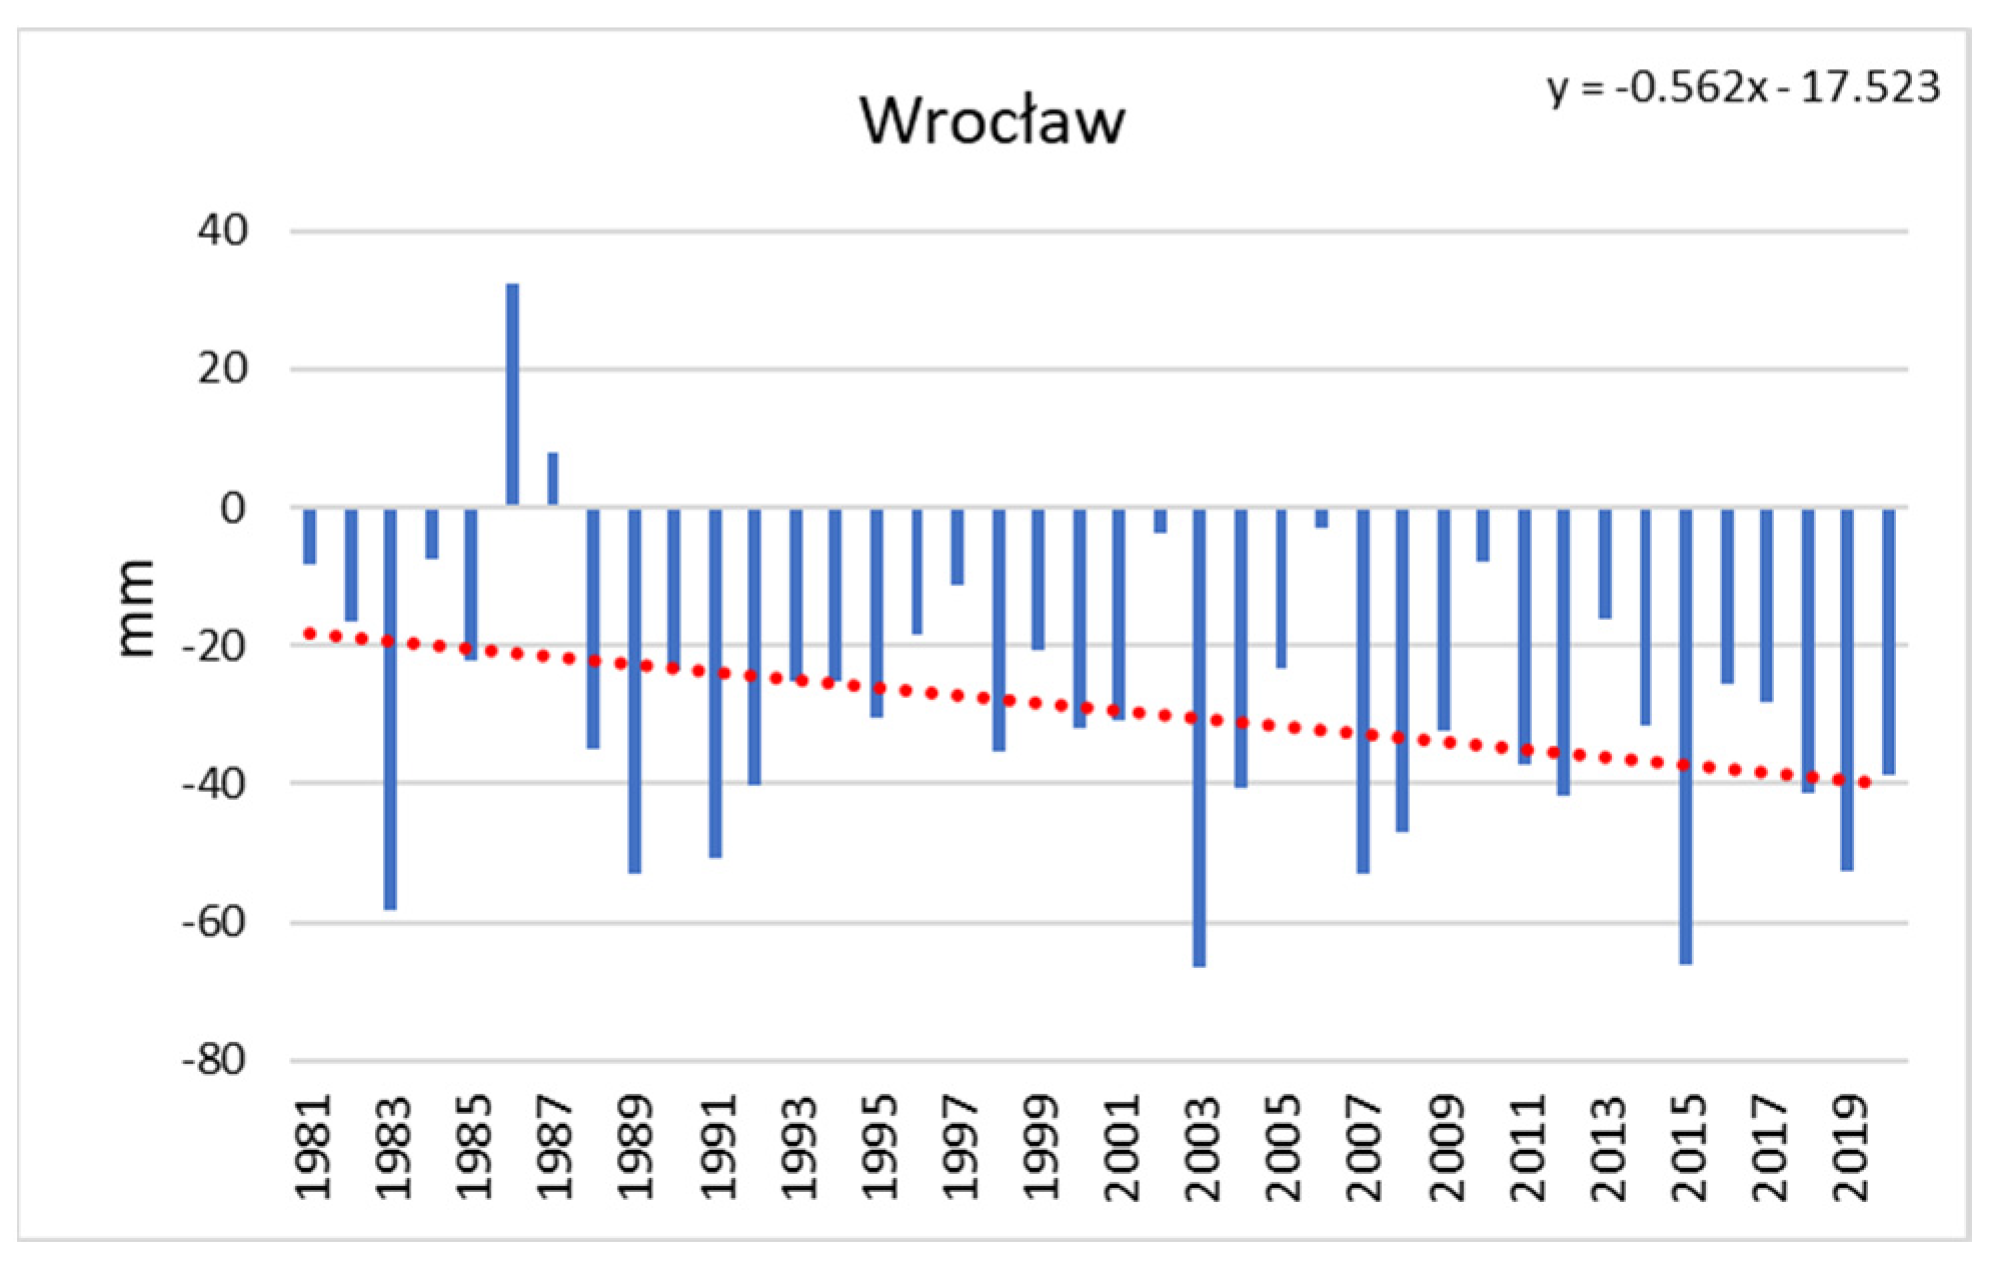
Table 1.
Polish and Czech meteorological stations in the Sudetes Mountains and their foreland.
| Station | Abbreviation | Location | Altitude [m] |
|---|---|---|---|
| Wrocław | WR | Poland | 120 |
| Legnica | LE | Poland | 122 |
| Hradec Králové | HK | Czechia | 278 |
| Jelenia Góra | JG | Poland | 342 |
| Kłodzko | KL | Poland | 356 |
| Hejnice | HE | Czechia | 396 |
| Liberec | LB | Czechia | 398 |
| Ústí nad Orlicí | US | Czechia | 402 |
| Luka | LU | Czechia | 510 |
| Světlá Hora | SH | Czechia | 593 |
| Červená | CE | Czechia | 748 |
| Desná-Souš | DS | Czechia | 772 |
| Śnieżka | ŚN | Poland | 1603 |
Table 2.
Mean values of maximum (Tmax), average (T), and minimum (Tmin) air temperature; relative humidity (U); wind speed (v); and sunshine duration (SD) in the warm half-year of 1981–2020 in the Sudetes Mountains and their foreland.
Table 2.
Mean values of maximum (Tmax), average (T), and minimum (Tmin) air temperature; relative humidity (U); wind speed (v); and sunshine duration (SD) in the warm half-year of 1981–2020 in the Sudetes Mountains and their foreland.
| Station | Tmax | T | Tmin | U | v | SD |
|---|---|---|---|---|---|---|
| WR | 21.2 | 15.6 | 10.2 | 74 | 2.8 | 1244 |
| LE | 21.1 | 15.5 | 10.1 | 75 | 3.1 | 1204 |
| HK | 21.5 | 15.8 | 10.5 | 71 | 2.6 | 1217 |
| JG | 19.8 | 13.8 | 7.9 | 78 | 2.0 | 1131 |
| KL | 19.6 | 14.0 | 8.8 | 78 | 2.2 | 1166 |
| HE | 19.9 | 14.3 | 9.6 | 75 | 2.1 | 1043 |
| LB | 19.5 | 14.0 | 9.1 | 74 | 2.7 | 1080 |
| US | 20.2 | 14.5 | 9.1 | 74 | 2.9 | 1170 |
| LU | 19.3 | 14.4 | 10.1 | 72 | 3.9 | 1208 |
| SH | 18.7 | 12.7 | 6.7 | 83 | 1.9 | 1087 |
| CE | 17.2 | 12.8 | 9.2 | 76 | 3.5 | 1164 |
| DS | 16.6 | 11.6 | 7.4 | 81 | 2.6 | 1052 |
| ŚN | 9.2 | 6.4 | 4.2 | 88 | 10.3 | 923 |
Table 3.
Maximum and minimum values of CWB in the warm half-year of 1981–2020 in the Sudetes Mountains and their foreland.
Table 3.
Maximum and minimum values of CWB in the warm half-year of 1981–2020 in the Sudetes Mountains and their foreland.
| Station | Max | Year | Min | Year |
|---|---|---|---|---|
| WR | 31.5 | 2020 | −417.6 | 2015 |
| LE | 50.1 | 2001 | −421.2 | 2018 |
| HK | 39.7 | 1987 | −485.9 | 2018 |
| JG | 263.2 | 1997 | −308.1 | 2018 |
| KL | 171.7 | 2020 | −358.8 | 2015 |
| HE | 592.0 | 2010 | −290.7 | 2018 |
| LB | 425.2 | 2010 | −386.7 | 2018 |
| US | 291.0 | 2020 | −346.4 | 2018 |
| LU | 39.8 | 2010 | −411.8 | 2018 |
| SH | 153.6 | 2020 | −254.2 | 2015 |
| CE | 189.4 | 1997 | −260.9 | 1992 |
| DS | 602.8 | 1981 | −115.3 | 2018 |
| ŚN | 555.8 | 1981 | −29.0 | 2003 |
Table 4.
Changes (mm per decade) in precipitation totals (RR), evapotranspiration (Ep), and climate water balance (CWB) in the warm half year of 1981–2020 in the Sudetes Mountains and their foreland (statistically significant trends marked in bold).
Table 4.
Changes (mm per decade) in precipitation totals (RR), evapotranspiration (Ep), and climate water balance (CWB) in the warm half year of 1981–2020 in the Sudetes Mountains and their foreland (statistically significant trends marked in bold).
| Station | RR | Ep | CWB |
|---|---|---|---|
| WR | 12.9 | 27.7 | −14.8 |
| LE | 11.9 | 22.6 | −10.7 |
| HK | −3.1 | 19.9 | −23.0 |
| JG | 18.8 | 23.8 | −5.0 |
| KL | 18.4 | 17.1 | 1.4 |
| HE | 14.5 | 8.9 | 5.6 |
| LB | 12.3 | 18.3 | −6.1 |
| US | 16.9 | 12.1 | 4.8 |
| LU | 4.1 | 23.6 | −19.5 |
| SH | −5.8 | 8.3 | −14.0 |
| CE | 5.8 | 16.6 | −10.8 |
| DS | −0.3 | −0.1 | −0.2 |
| ŚN | −0.1 | 18.3 | −18.4 |
Table 5.
Changes in mean relative humidity (U) and sunshine duration (SD) in the warm half-year of 1981–2020 in the Sudetes Mountains and their foreland (statistically significant trends marked in bold).
Table 5.
Changes in mean relative humidity (U) and sunshine duration (SD) in the warm half-year of 1981–2020 in the Sudetes Mountains and their foreland (statistically significant trends marked in bold).
| Station | U [% per Decade] | SD [Hours per Decade] |
|---|---|---|
| WR | −1.3 | 84.1 |
| LE | −1.2 | 83.6 |
| HK | −0.8 | 43.2 |
| JG | −0.4 | 107.5 |
| KL | −0.7 | 40.1 |
| HE | −1.0 | 29.8 |
| LB | −1.7 | 42.1 |
| US | −0.3 | 31.8 |
| LU | −1.0 | 22.3 |
| SH | −2.1 | 2.5 |
| CE | −0.4 | 4.9 |
| DS | −0.1 | −20.0 |
| ŚN | −0.9 | 52.2 |
Table 6.
Changes in the frequency of circulation conditions in the warm half-year of 1981–2020 in the Sudetes Mountains and their foreland (statistically significant trends marked in bold); according to the calendar of circulation conditions [109].
Table 6.
Changes in the frequency of circulation conditions in the warm half-year of 1981–2020 in the Sudetes Mountains and their foreland (statistically significant trends marked in bold); according to the calendar of circulation conditions [109].
| Change | Anticyclonic | Cyclonic | Transitional | N-Types (N, NE, NW) | S-Types (S, SE, SW) | W-Types (W, NW, SW) | E-Types (E, NE, SE) | 0-Type |
|---|---|---|---|---|---|---|---|---|
| (days/ decade) | −1.30 | 0.47 | 0.83 | −0.34 | −0.73 | −0.75 | 4.02 | −0.36 |
Table 7.
Changes (days per decade) in the frequency of circulation types for the anticyclonic, cyclonic, and transitional conditions in the warm half-year of 1981–2020 in the Sudetes Mountains and their foreland (statistically significant trends marked in bold); according to the calendar of circulation conditions [109].
| Vorticity Types | N-Types (N, NE, NW) | S-Types (S, SE, SW) | W-Types (W, NW, SW) | E-Types (E, NE, SE) | 0-Type |
|---|---|---|---|---|---|
| Anticyclonic | −1.52 | 0.20 | −0.60 | 0.72 | −0.25 |
| Cyclonic | 1.44 | −0.81 | 0.02 | 1.54 | −0.23 |
| Transitional | −0.25 | −0.11 | −0.17 | 1.76 | 0.12 |
Table 8.
The values of CWB (mm) under particular types of atmospheric circulation in the warm half-year (May–October) of 1981–2020 in the Sudetes Mountains and their foreland.
Table 8.
The values of CWB (mm) under particular types of atmospheric circulation in the warm half-year (May–October) of 1981–2020 in the Sudetes Mountains and their foreland.
| Station | N-Types (N, NE, NW) | S-Types (S, SE, SW) | W-Types (W, NW, SW) | E-Types (E, NE, SE) | 0-Type |
|---|---|---|---|---|---|
| WR | −57.0 | −81.2 | −86.6 | −38.7 | −22.2 |
| LE | −58.8 | −76.8 | −96.1 | −35.4 | −21.7 |
| HK | −67.7 | −67.6 | −76.2 | −53.3 | −24.5 |
| JG | 20.6 | −33.8 | −41.3 | 12.7 | 0.0 |
| KL | −16.7 | −43.0 | −57.3 | 4.0 | −13.0 |
| HE | 81.4 | −5.7 | 9.2 | 51.6 | 12.2 |
| LB | 0.6 | −28.9 | −27.4 | −5.0 | −8.6 |
| US | −25.9 | −40.8 | −43.9 | −19.9 | −10.0 |
| LU | −58.8 | −64.8 | −77.9 | −25.8 | −19.0 |
| SH | −6.1 | −13.1 | −22.3 | 16.1 | −8.8 |
| CE | 4.6 | −27.0 | −24.3 | 18.1 | −11.8 |
| DS | 125.6 | 42.1 | 92.9 | 42.2 | 16.5 |
| ŚN | 130.0 | 57.7 | 65.9 | 105.9 | 21.9 |
Table 9.
Changes (mm per decade) in RR under particular types of the atmospheric circulation in the warm half-year (May–October) of 1981–2020 in the Sudetes Mountains and their foreland (statistically significant trends marked in bold).
Table 9.
Changes (mm per decade) in RR under particular types of the atmospheric circulation in the warm half-year (May–October) of 1981–2020 in the Sudetes Mountains and their foreland (statistically significant trends marked in bold).
| Station | Anticyclonic | Cyclonic | Transitional | N-Types (N, NE, NW) | S-Types (S, SE, SW) | W-Types (W, NW, SW) | E-Types (E, NE, SE) | 0-Type |
|---|---|---|---|---|---|---|---|---|
| WR | −0.11 | 6.10 | 6.87 | 9.97 | −4.28 | −3.39 | 0.39 | 1.02 |
| LE | −0.26 | 7.75 | 4.44 | 11.29 | −3.17 | −4.67 | 0.46 | 1.30 |
| HK | −4.41 | 0.59 | 0.78 | 3.13 | −11.04 | −4.30 | 0.25 | −2.54 |
| JG | −1.67 | 10.32 | 10.16 | 7.98 | 0.68 | −1.78 | 0.40 | 0.44 |
| KL | 1.27 | 10.51 | 6.67 | 10.53 | −0.49 | −5.52 | 0.39 | −0.04 |
| HE | 0.18 | 11.94 | 2.40 | 11.93 | −4.02 | −13.27 | 0.39 | −1.18 |
| LB | 2.45 | 4.00 | 5.83 | 6.69 | −3.15 | −9.90 | 0.35 | 1.46 |
| US | 6.66 | 2.74 | 7.52 | 7.77 | −5.19 | −2.37 | 0.45 | 3.69 |
| LU | 3.22 | −5.24 | 6.09 | 9.71 | −9.81 | −4.52 | 0.28 | 1.82 |
| SH | 0.86 | −8.02 | 1.37 | 4.96 | −14.75 | −12.32 | 0.31 | 0.09 |
| CE | 5.02 | −3.01 | 3.75 | 15.51 | −17.39 | −6.06 | 0.38 | 1.28 |
| DS | 1.96 | −0.87 | −1.38 | 9.87 | −8.27 | −15.12 | 0.40 | −1.18 |
| ŚN | −5.30 | 4.79 | 0.41 | −4.05 | 1.19 | 5.06 | 0.21 | −2.18 |
Table 10.
Changes (mm per decade) in Ep under particular types of the atmospheric circulation in the warm half-year (May–October) of 1981–2020 in the Sudetes Mountains and their foreland (statistically significant trends marked in bold).
Table 10.
Changes (mm per decade) in Ep under particular types of the atmospheric circulation in the warm half-year (May–October) of 1981–2020 in the Sudetes Mountains and their foreland (statistically significant trends marked in bold).
| Station | Anticyclonic | Cyclonic | Transitional | N-Types (N, NE, NW) | S-Types (S, SE, SW) | W-Types (W, NW, SW) | E-Types (E, NE, SE) | 0-Type |
|---|---|---|---|---|---|---|---|---|
| WR | 5.89 | 11.42 | 10.36 | 0.32 | 7.16 | 9.00 | 15.22 | 3.14 |
| LE | 3.82 | 10.14 | 8.64 | 0.26 | 5.77 | 6.74 | 13.54 | 2.69 |
| HK | 3.43 | 7.71 | 8.81 | 0.23 | 4.75 | 6.37 | 13.15 | 2.37 |
| JG | 4.95 | 9.60 | 9.30 | 0.36 | 5.88 | 7.97 | 12.88 | 2.97 |
| KL | 1.92 | 8.07 | 7.10 | 0.25 | 4.20 | 5.47 | 11.17 | 1.79 |
| HE | −1.41 | 5.14 | 5.17 | 0.14 | 0.46 | 1.90 | 9.12 | 1.58 |
| LB | 0.86 | 9.50 | 7.98 | 0.25 | 3.82 | 6.04 | 11.73 | 2.12 |
| US | −0.39 | 6.34 | 6.19 | 0.16 | 2.41 | 3.66 | 10.16 | 1.26 |
| LU | 5.33 | 9.07 | 9.17 | 0.24 | 7.29 | 7.85 | 14.12 | 2.23 |
| SH | −2.03 | 5.88 | 4.40 | 0.12 | 2.20 | 2.56 | 8.50 | 0.56 |
| CE | 1.35 | 7.68 | 7.57 | 0.16 | 5.96 | 6.26 | 10.54 | 1.62 |
| DS | −8.01 | 4.59 | 3.31 | −0.02 | −1.33 | −0.28 | 5.11 | 0.26 |
| ŚN | 2.52 | 7.40 | 8.37 | 0.25 | 6.77 | 7.22 | 8.19 | 2.33 |
Table 11.
Changes (mm per decade) in CWB under particular types of the atmospheric circulation in the warm half-year (May–October) of 1981–2020 in the Sudetes Mountains and their foreland (statistically significant trends marked in bold).
Table 11.
Changes (mm per decade) in CWB under particular types of the atmospheric circulation in the warm half-year (May–October) of 1981–2020 in the Sudetes Mountains and their foreland (statistically significant trends marked in bold).
| Station | Anticyclonic | Cyclonic | Transitional | N-Types (N, NE, NW) | S-Types (S, SE, SW) | W-Types (W, NW, SW) | E-Types (E, NE, SE) | 0-Type |
|---|---|---|---|---|---|---|---|---|
| WR | −6.00 | −5.32 | −3.49 | 0.87 | −11.44 | −12.39 | 10.22 | −2.12 |
| LE | −4.08 | −2.39 | −4.19 | 3.56 | −8.94 | −11.42 | 11.43 | −1.39 |
| HK | −7.84 | −7.13 | −8.03 | −3.31 | −15.78 | −10.67 | −0.77 | −4.92 |
| JG | −6.62 | 0.73 | 0.86 | −0.55 | −5.20 | −9.75 | 17.80 | −2.53 |
| KL | −0.65 | 2.44 | −0.43 | 4.79 | −4.69 | −10.99 | 14.30 | −1.83 |
| HE | 1.59 | 6.80 | −2.76 | 8.74 | −4.49 | −15.17 | 33.72 | −2.76 |
| LB | 1.59 | −5.50 | −2.15 | −0.09 | −6.97 | −15.94 | 19.71 | −0.66 |
| US | 7.05 | −3.60 | 1.33 | 3.59 | −7.61 | −6.02 | 16.71 | 2.44 |
| LU | −2.11 | −14.31 | −3.08 | 2.13 | −17.10 | −12.36 | 0.22 | −0.41 |
| SH | 2.89 | −13.89 | −3.03 | 2.52 | −16.95 | −14.88 | 8.47 | −0.47 |
| CE | 3.67 | −10.69 | −3.82 | 11.33 | −23.36 | −12.32 | 15.63 | −0.34 |
| DS | 9.97 | −5.46 | −4.69 | 10.42 | −6.93 | −14.85 | 27.91 | −1.44 |
| ŚN | −7.83 | −2.61 | −7.96 | −8.64 | −5.58 | −2.16 | 5.94 | −4.51 |
Table 12.
Changes (mm per decade) in CWB under the anticyclonic circulation in the warm half-year (May–October) of 1981–2020 in the Sudetes Mountains and their foreland (no statistically significant trends reported).
Table 12.
Changes (mm per decade) in CWB under the anticyclonic circulation in the warm half-year (May–October) of 1981–2020 in the Sudetes Mountains and their foreland (no statistically significant trends reported).
| Station | N-Types (N, NE, NW) | S-Types (S, SE, SW) | W-Types (W, NW, SW) | E-Types (E, NE, SE) | 0-Type |
|---|---|---|---|---|---|
| WR | −0.75 | −4.96 | −1.80 | 1.04 | −3.44 |
| LE | −0.84 | −1.82 | −2.80 | 1.51 | −1.77 |
| HK | −0.58 | −5.25 | −4.40 | 0.11 | −3.56 |
| JG | −2.57 | −1.85 | −2.82 | −0.27 | −2.52 |
| KL | 1.04 | −4.45 | −2.18 | 3.45 | −1.97 |
| HE | 1.54 | 1.42 | −2.02 | 4.38 | −2.52 |
| LB | −0.05 | 0.28 | −2.43 | 3.83 | −0.62 |
| US | 3.04 | −2.71 | −1.27 | 6.13 | 1.18 |
| LU | 1.91 | −5.97 | −4.57 | 2.77 | 0.17 |
| SH | 4.23 | −4.97 | −1.12 | 2.49 | −0.03 |
| CE | 5.25 | −3.33 | −1.87 | 4.99 | −0.24 |
| DS | 5.07 | 3.67 | −1.34 | 9.10 | −0.84 |
| ŚN | −4.80 | −3.21 | −2.71 | −3.00 | 0.36 |
Table 13.
Changes (mm per decade) in CWB under the cyclonic circulation in the warm half-year (May–October) of 1981–2020 in the Sudetes Mountains and their foreland (statistically significant trends marked in bold).
Table 13.
Changes (mm per decade) in CWB under the cyclonic circulation in the warm half-year (May–October) of 1981–2020 in the Sudetes Mountains and their foreland (statistically significant trends marked in bold).
| Station | N-Types (N, NE, NW) | S-Types (S, SE, SW) | W-Types (W, NW, SW) | E-Types (E, NE, SE) | 0-Type |
|---|---|---|---|---|---|
| WR | 2.69 | −3.91 | −5.10 | 8.20 | −0.11 |
| LE | 3.93 | −2.14 | −6.04 | 10.51 | −0.23 |
| HK | −0.63 | −4.64 | −5.25 | 2.24 | −0.59 |
| JG | 3.79 | −2.45 | −3.38 | 14.60 | −0.88 |
| KL | 5.32 | −0.58 | −5.38 | 9.47 | −0.78 |
| HE | 13.07 | −4.51 | −7.86 | 27.00 | −0.97 |
| LB | 3.67 | −5.20 | −8.58 | 13.50 | −0.51 |
| US | 2.44 | −3.39 | −3.35 | 8.39 | −2.60 |
| LU | 4.35 | −10.53 | −5.11 | −1.18 | −2.58 |
| SH | 1.65 | −7.83 | −8.59 | 1.06 | −1.54 |
| CE | 8.18 | −12.98 | −8.61 | 7.44 | −1.36 |
| DS | 10.34 | −9.29 | −8.39 | 18.14 | −2.47 |
| ŚN | 5.48 | −0.18 | 1.45 | 10.86 | −4.81 |
Table 14.
Changes (mm per decade) in CWB under the transitional circulation in the warm half-year (May–October) of 1981–2020 in the Sudetes Mountains and their foreland (statistically significant trends marked in bold).
Table 14.
Changes (mm per decade) in CWB under the transitional circulation in the warm half-year (May–October) of 1981–2020 in the Sudetes Mountains and their foreland (statistically significant trends marked in bold).
| Station | N-Types (N, NE, NW) | S-Types (S, SE, SW) | W-Types (W, NW, SW) | E-Types (E, NE, SE) | 0-Type |
|---|---|---|---|---|---|
| WR | −1.08 | −2.57 | −5.48 | 0.98 | 1.43 |
| LE | 0.46 | −4.98 | −2.58 | −0.59 | 0.61 |
| HK | −2.10 | −5.90 | −1.03 | −3.12 | −0.77 |
| JG | −1.76 | −0.90 | −3.55 | 3.47 | 0.87 |
| KL | −1.57 | 0.34 | −3.42 | 1.38 | 0.92 |
| HE | −5.86 | −1.39 | −5.29 | 2.34 | 0.72 |
| LB | −3.72 | −2.05 | −4.93 | 2.37 | 0.47 |
| US | −1.90 | −1.51 | −1.41 | 2.18 | 3.86 |
| LU | −4.13 | −0.60 | −2.69 | −1.36 | 2.00 |
| SH | −3.35 | −4.15 | −5.16 | 4.91 | 1.09 |
| CE | −2.10 | −7.05 | −1.84 | 3.19 | 1.27 |
| DS | −4.99 | −1.32 | −5.12 | 0.66 | 1.87 |
| ŚN | −9.32 | −2.19 | −0.90 | −1.91 | −0.06 |
Disclaimer/Publisher’s Note: The statements, opinions and data contained in all publications are solely those of the individual author(s) and contributor(s) and not of MDPI and/or the editor(s). MDPI and/or the editor(s) disclaim responsibility for any injury to people or property resulting from any ideas, methods, instructions or products referred to in the content. |
© 2023 by the author. Licensee MDPI, Basel, Switzerland. This article is an open access article distributed under the terms and conditions of the Creative Commons Attribution (CC BY) license (https://creativecommons.org/licenses/by/4.0/).
Share and Cite
MDPI and ACS Style
Miszuk, B. Climate Water Balance in the Warm Half-Year and Its Circulation Conditions in the Sudetes Mountains and Their Foreland (Poland and Czechia). Water 2023, 15, 795. https://doi.org/10.3390/w15040795
AMA Style
Miszuk B. Climate Water Balance in the Warm Half-Year and Its Circulation Conditions in the Sudetes Mountains and Their Foreland (Poland and Czechia). Water. 2023; 15(4):795. https://doi.org/10.3390/w15040795
Chicago/Turabian StyleMiszuk, Bartłomiej. 2023. "Climate Water Balance in the Warm Half-Year and Its Circulation Conditions in the Sudetes Mountains and Their Foreland (Poland and Czechia)" Water 15, no. 4: 795. https://doi.org/10.3390/w15040795
Note that from the first issue of 2016, this journal uses article numbers instead of page numbers. See further details here.