Article

SARS-CoV-2 Wastewater Surveillance in Ten Cities from Mexico

by
Astrid Schilmann
1,†,
Andrés Sánchez-Pájaro
1,†,
Marbella T. Ovilla-Muñoz
1,
Juan Téllez-Sosa
2,
Sugey Bravo-Romero
2,
Sara Yuvisela Bahena-Reyes
2,
Margarita Lobato
3,
Jesús Martínez-Barnetche
2,
Celia Mercedes Alpuche-Aranda
2,
Héctor Lamadrid-Figueroa
1 and
Tonatiuh Barrientos-Gutiérrez
1,*
1
Center for Population Health Research, National Institute of Public Health, Av. Universidad #655 Col. Sta. Ma. Ahuacatitlan, Cuernavaca 62100, Mexico
2
Center for Infectious Diseases Research, National Institute of Public Health, Av. Universidad #655 Col. Sta. Ma. Ahuacatitlan, Cuernavaca 62100, Mexico
3
National Reference Laboratory, National Water Commission, Av. Insurgentes Sur #2416, Copilco el Bajo, Coyoacán, Mexico City 04340, Mexico
*
Author to whom correspondence should be addressed.
These authors contributed equally to this work.
Water 2023, 15(4), 799; https://doi.org/10.3390/w15040799
Submission received: 18 November 2022 / Revised: 10 January 2023 / Accepted: 19 January 2023 / Published: 17 February 2023
(This article belongs to the Special Issue Wastewater-Based Epidemiology (WBE) Research)

Abstract

:
We aimed to estimate the lead time and infection prevalence from SARS-CoV-2 wastewater (WW) monitoring compared with clinical surveillance data in Mexico to generate evidence about the feasibility of a large-scale WW surveillance system. We selected 10 WW treatment plants (WWTP) and 5 COVID-19 hospitals in major urban conglomerates in Mexico and collected biweekly 24-h flow-adjusted composite samples during October–November 2020. We concentrated WW samples by polyethylene glycol precipitation and employed quantitative PCR (RT-qPCR) assays, targeting the nucleoprotein (N1 and N2) genes. We detected and quantified SARS-CoV-2 RNA in 88% and 58% of the raw WW samples from WWTPs and COVID-19 hospitals, respectively. The WW RNA daily loads lead the active cases by more than one month in large and medium WWTP sites. WW estimated that cases were 2 to 20-fold higher than registered active cases. Developing a continuous monitoring surveillance system for SARS-CoV-2 community transmission through WW is feasible, informative, and recognizes three main challenges: (1) WW system data (catchment area, population served), (2) capacity to maintain the cold-chain and process samples, and (3) supplies and personnel to ensure standardized procedures.

Graphical Abstract

1. Introduction

The emergence of SARS-CoV-2 marked the start of the largest pandemic in more than a century. Mexico reported its first confirmed COVID-19 case on 28 February 2020, and experienced two waves that reached their peak in July and December 2020 [1]. Early in the pandemic, Mexico monitored the progression of the pandemic through sentinel surveillance, using reverse transcriptase polymerase chain reaction (RT-PCR) tests in clinical cases that fulfilled an epidemiological case definition [2]. After 28 October 2020, rapid antigen (Ag-T) tests for SARS-CoV-2 infections were additionally included [3]. Surveillance systems rely on people seeking medical care and overrepresent symptomatic cases, providing an incomplete picture of COVID-19 cases. Among seropositive people, 67.3% were asymptomatic in Mexico from August to November 2020 [1]. The clinical surveillance is also subjected to reporting delays, failing to provide an early warning system.
Wastewater-based surveillance has been proposed as a complementary system to detect early changes in the epidemic dynamic and to estimate the burden of infection. SARS-CoV-2 infection is accompanied by viral shedding through stools by asymptomatic, symptomatic, and recovered individuals, which are all captured by wastewater [4,5,6,7,8,9]. The scientific community has been studying the presence of SARS-CoV-2 in the water cycle since the beginning of the pandemic, showing non-infective RNA of SARS-CoV-2 detection and quantification in hospital discharges, raw and treated wastewater, and primary sludges from WWTP across the world [10].
In Mexico, there have been several reports quantifying SARS-CoV-2 RNA in different environmental samples during the first year of the pandemic. During the first months of the pandemic, SARS-CoV-2 RNA was quantified in influent and secondary sludge from two WWTP in Querétaro (Central Mexico) [11]. The WW-based infection prevalence was 6.5 to 260 times higher compared to the government-reported cases in the five central municipalities in the state of Hidalgo (Central Mexico) in the mid-2020s [12]. The viral titers found in three out of four WWTPs in the Monterrey Metropolitan Area (Northern Mexico) were associated with clinical COVID-19 surveillance indicators preceding two–seven days of the rise of reported clinical cases, and the WW-based infection prevalence was significantly higher than active cases reported by health authorities between June and December 2020 [13]. Higher concentrations of SARS-CoV-2 RNA were quantified in water samples collected from rivers near human settlements and in WWTPs than in samples collected from rivers outside Tapachula city, (Southern Mexico) between September 2020 and January 2021 [14]. All groundwater samples from sinkholes were negative for the detection of SARS-CoV-2 RNA in the state of Quintana Roo from August 2020 to January 2021, whereas most of the raw WW samples were positive [15].
In Mexico and other countries, the SARS-CoV-2 RNA concentrations in raw WW have been correlated with different clinical COVID-19 surveillance indicators to establish the lead time of the early warning signal and the infection prevalence estimation provided by environmental surveillance. Different clinical surveillance indicators have been used, such as weekly COVID-19 case rate in the USA [16], weekly COVID-19 cases in Argentina [17], newly hospitalized patients in Sweden [18], showing a lead of one–two weeks with respect to the official confirmed cases in India [19], and a lead of two–three days for positive cases in Canada [20].
The ability of WW-based surveillance to provide informative data depends on various factors, including population coverage of WWTPs, dilution of wastewater from industrial or pluvial sources, and losses of water in the system, among others [21]. A review showed that reports around the world are not comparable, in terms of gene copies detected and lag-time between monitored RNA and reported cases, because of varying sewerage systems and climatic conditions that impact virus degradation rate. The lead time for the early warning signal can be better applicable to places having well-connected sewerage systems to the sampled WWTP [22]. Mexico is a middle-income country with high subnational inequality. More than 90% (92.42%) of the population uses at least basic sanitation services, but this is lower in the Southern regions compared to the Central and Northern regions of Mexico.
The present study systematizes the comparison with clinical surveillance data and the infection prevalence estimation from WW monitoring in ten cities in Mexico. A two-month raw WW sampling campaign conducted between October and November 2020 allowed us (1) to evaluate the presence of SARS-CoV-2 RNA in WW from WWTP influents and COVID-19 hospitals effluents, (2) to analyze the lead time of WW-based surveillance compared to a clinical indicator up to 50 days, and (3) to estimate the number of infected subjects in cities under different epidemic stages, in order to generate evidence about the feasibility of a large-scale WW surveillance system in a middle-income country.

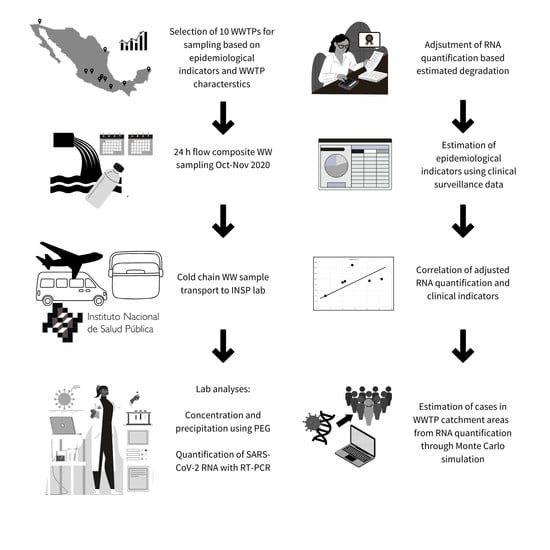
2. Materials and Methods

2.1. Instruments and Processes Standardization

We developed four instruments to register data: (1) WWTP information form (Supplementary Table S1), (2) Hospital information form (Supplementary Table S1), (3) Sampling form (Supplementary Figure S1), and (4) Chain of custody form (Supplementary Figure S2). We also developed two process standardization guides: (1) Sampling process guideline, which explained the sampling process at WWTP influent/effluent and hospital effluent points, including the use of sampling procedures and storage and the use of personal protection equipment, and (2) Transportation process guideline, which explained the transport process from the sampling point to the lab while maintaining the cold chain. We undertook a two-week pilot phase in three WWTPs—two in Mexico City (Cerro de la Estrella and Ciudad Deportiva) and one in Cuernavaca (Acapantzingo)—to adjust data collection instruments, sampling processes, logistics (e.g., cold chain), and lab processes (i.e., sample concentration with polyethylene glycol and RNA extraction). During this phase, we collected 20 wastewater samples—12 raw and 8 treated samples.

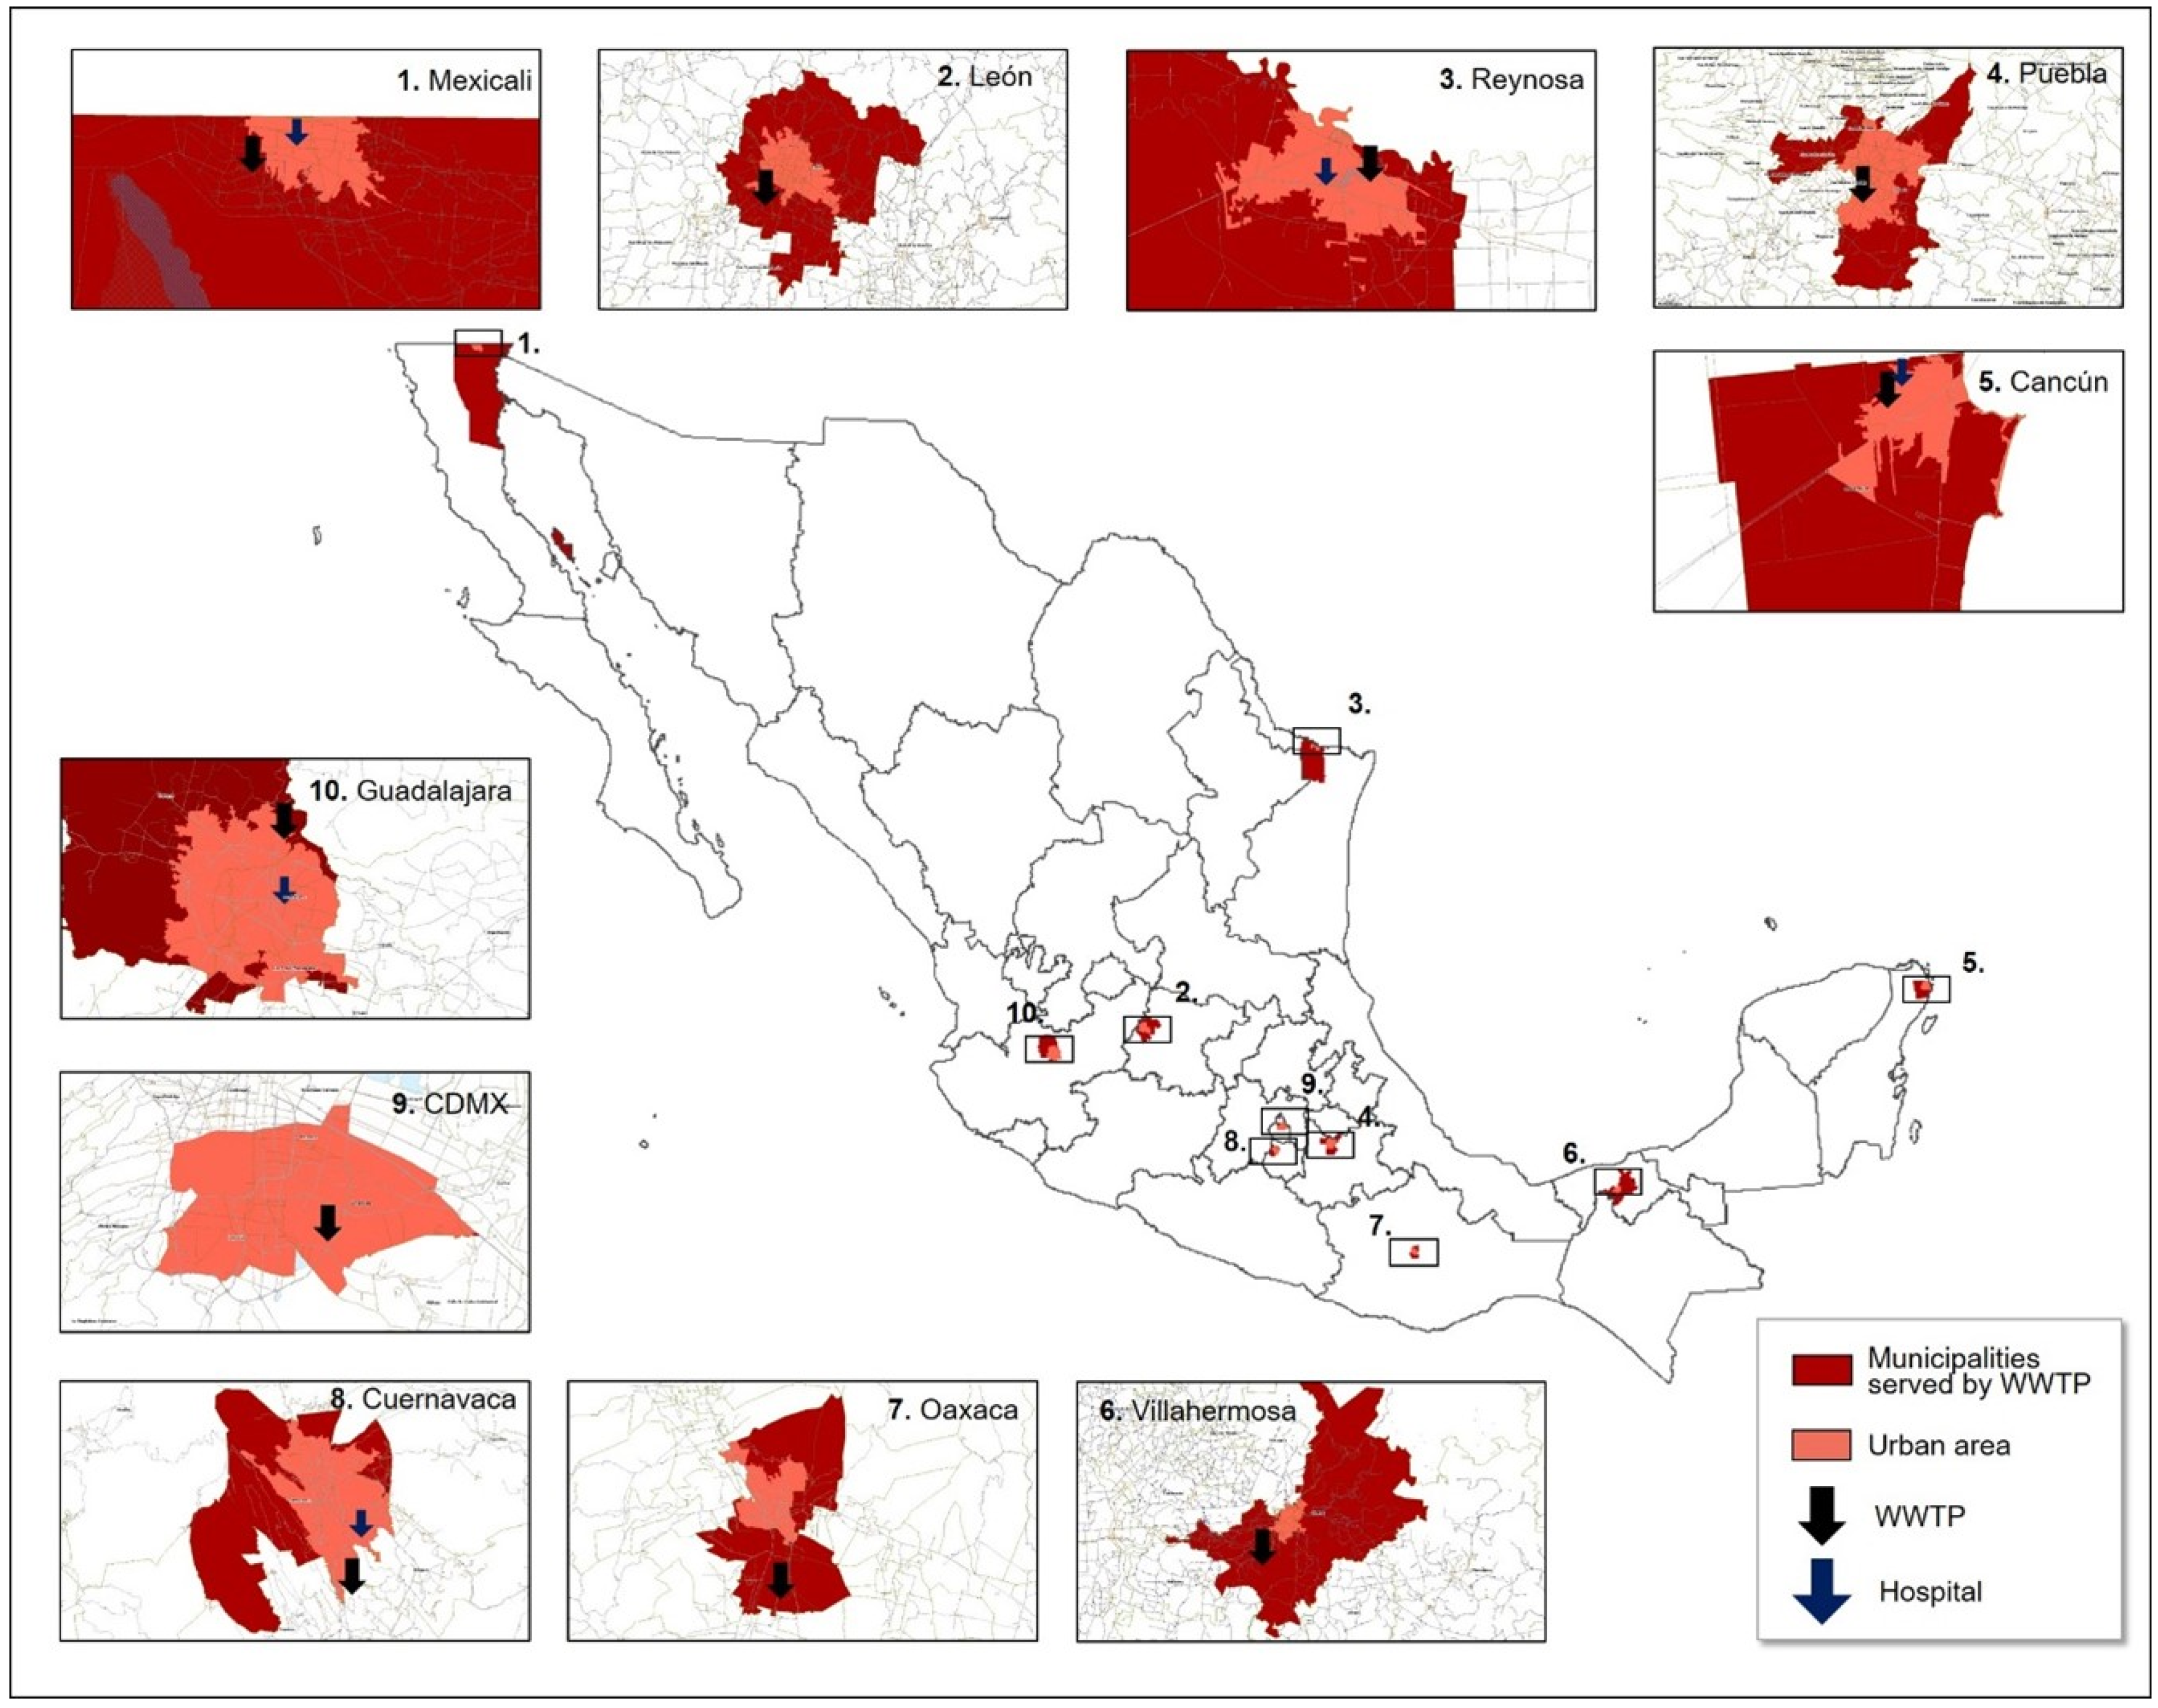
2.2. Sampling Sites Selection

We selected 10 WWTPs for sampling using the following inclusion criteria: (1) located in a major urban conglomerate (>100,000 inhabitants), (2) located in a municipality within the 90th percentile of municipalities by COVID-19 attack rate (confirmed cases per 1000 inhabitants), and (3) influent flow above 10 L/s (to minimize viral load variability due to flow changes). We identified municipalities that fulfilled the criteria using the official COVID-19 dashboard from the National Institute of Public Health [https://www.insp.mx/informacion-institucional-covid-19.html (accessed on 30 September 2020)], and the official WWTP inventory from the National Water Commission (CONAGUA). The selected WWTPs were: Agua Prieta (Guadalajara Metropolitan Area), Cerro de la Estrella (Mexico City), San Francisco (Puebla Metropolitan Area), Zaragoza (Mexicali), León (León), Reynosa I (Reynosa), Norponiente (Cancún), Acapantzingo (Cuernavaca), La Raya (Oaxaca Metropolitan area). WWTPs personnel were contacted and asked to collaborate in the study through the official channels of CONAGUA; all selected WWTPs agreed to collaborate. We then selected 5 hospitals for effluent sampling using the following inclusion criteria: (1) designated for COVID-19 patients, (2) located within the catchment area of one of the selected WWTPs, and (3) held 50% or more of the COVID patient beds in the WWTP’s catchment area, which we estimated using official data from the Health Ministry. The 5 selected hospitals were in Guadalajara, Mexicali, Reynosa, Cancún, and Cuernavaca. Hospital personnel were contacted and asked to collaborate in the study by local CONAGUA personnel; all 5 hospitals agreed to participate. Sampled sites are shown in Figure 1.

2.3. WW Sampling

Sampling personnel manually collected 12 grab samples to obtain 24-h flow-adjusted composite WW samples, hourly registering wastewater temperature, electrical conductivity, color, smell, pH, and ambient temperature. We sampled all 15 sites twice weekly (Wednesdays and Sundays) from 7 October to 30 November 2020. Samples were sent to the lab in Cuernavaca by air or land courier, depending on location, in containers at 4 °C. Composite samples were obtained on 23, 27, and 30 September in two WWTPs (pilot phase) and on 21 and 28 October in eight WWTPs were analyzed to determine five-day biochemical oxygen demand (BOD5), chemical oxygen demand (COD), total nitrogen (N) and phosphorus (P).

2.4. Sample Concentration

We conducted viral particle harvesting by separation in two phases and precipitation with Polyethylene glycol (PEG) and NaCl [23]. As a safety measure, the 250 mL containers were pasteurized in a water bath at 60 °C for 90 min before opening. The container was then subjected to centrifugation at 8500 rpm for 30 min, to remove larger solid particles. The resulting supernatant was filtered through a 0.45 µm membrane (Merck, Millipore, Burlington, MA, USA, Cat. HAWP04700), and the flux was collected in sterile containers. Then, 40 mL of a sterile solution of PEG 8000 (50% w/v) (Sigma, Aldrich, St. Louis, MO, USA, Cat. 89510) and NaCl (0.3 M) (Merck, Cat. 106404) were added to 200 mL of filtered residual water. The containers were mixed by gentle inversion until homogenized and kept at 4 °C overnight. Samples were then centrifuged at 8500 rpm for 2 h or until a pellet was visible. The supernatant was discarded, and the pellet was resuspended in 140 µL with nuclease-free sterile distilled water, to continue with the extraction of the viral genome.

2.5. Viral RNA Extraction, Detection, and Quantification

Viral RNA was purified with the commercial QIAamp Viral RNA Mini kit according to the manufacturer’s instructions (Qiagen, Cat. 52906). The detection of SARS-CoV-2 RNA was performed by reverse transcriptase quantitative polymerase chain reaction (RT-qPCR) with the Go Taq® Probe 1- Step RT-qPCR System kit (Promega, Madison, WI, USA, Cat. A6121) and the RT-qPCR 2019-nCoV diagnostic kit that includes primers targeting the N1 and N2 regions of the SARS-CoV-2 nucleocapsid (N) gene, commercialized by Integrated DNA Technologies (IDT, Coralville, IA, USA, Cat. 10006770), validated by the US Centers for Disease Control and Prevention [24] and by the Mexican Institute for Diagnosis and Epidemiological Reference (InDRE, DGE-DSAT-04663-2020). The RT-qPCR reactions were carried out on the CFX96 Real-Time PCR Detection System (Bio-Rad, Hercules, CA, USA). For absolute quantification, we used the positive control 2019-nCoV-N (IDT, Cat. 10006625), supplied at 200,000 copies/µL, a plasmid that contains the complete N gene of SARS-CoV-2 and with which we made serial dilutions (base 10) to generate the standard curve. The number of copies of the SARS-CoV-2 N gene present in the WW samples was quantified by titration of the N1 and N2 gene segments. We, therefore, defined the RNA concentration in the sample as the highest quantified result for N1 and N2 gene segments and reported the Log10 transformation. Each RNA sample, standard curve, and recommended controls were analyzed in triplicate, and cycle threshold values (Ct) were used to calculate the average SARS-CoV-2 N gene copies/mL of each sample. Ct values <40 cycles were considered positive for SARS-CoV-2, as previously proposed [25]. The data obtained by technical replicas showed low dispersion and were reproducible. However, those RNA samples whose technical replicates showed values with a discrepancy greater than 50% were re-assayed. The limit of RNA detection for our method was 0.001 copies/mL, and the non-detectable samples were assigned a value of LOD/2, resulting in a Log10 value of −3.3. The viral load of N gene copies in WW samples was adjusted by WW flow, temperature, and mean travel time to the WWTP, as explained in Section 2.9 [26].

2.6. Recovery Efficiency Test

To evaluate the viral particle harvesting protocol, we used the ɸITL-1 DNA bacteriophage of the Podoviridae family that lacks an envelope, and it is lytic for the Ralstonia solanacearum bacterium. The ɸITL-1 was propagated, harvested, purified, and titrated to obtain a solution of 3.3 × 10⁵ PFU (Plate Forming Units) per milliliter. With one milliliter of this solution, 17 wastewater samples were contaminated and processed following the viral particle harvesting protocol described above. DNA extraction from ɸITL-1 was performed with the phenol-chloroform method.
To have a reference template to generate a standard DNA curve of ɸITL-1 and to determine the number of genomic copies in water samples, we amplified three regions of the ɸITL-1 genome by endpoint PCR and independently cloned them into pCR2.1. The plasmid DNA of the three constructs was purified (with the alkaline lysis technique), quantified by fluorometry and the number of copies was calculated using the online tool “DNA Calculator” [http://www.molbiotools.com/dnacalculator.html (accessed on 30 April 2021)]. We then generated 10-fold serial dilutions in the order of unique copies up to 1 × 10⁵ (6 standards) of each of the three constructs. Subsequently, the qPCR performance of the three pairs of oligonucleotides was evaluated in conjunction with their corresponding standards. The qPCR reactions were performed with the BRYT Green kit (Promega, Cat. A6001) in the CFX96 Real-Time PCR Detection System (Bio-Rad). Together these experiments indicated that the ITL1-TR2 oligonucleotide pair exhibited excellent qPCR performance, as shown in the Supplementary Methods and Table S2. Finally, each genomic DNA sample of the bacteriophage ɸITL-1 (purified from the contaminated sewage samples), standards, and controls were analyzed by qPCR in triplicate with the ITL1-TR2 oligonucleotides. Cycle threshold values (Ct) were used to calculate the percent recovery of the method. The mean recovery efficiency of the viral particles from the concentration method used for the 17 analyzed samples was 29.2% (range 4.5 to 53.1%).

2.7. Clinical-Based Surveillance Data

We obtained data for the number of COVID-19 cases from the Epidemiological Surveillance System for Viral Respiratory Disease (SISVER). Briefly, this is a central government system that registers all confirmed COVID-19 cases from public and private healthcare units in the country. During the study period, in public healthcare units, a confirmatory diagnostic test (RT-PCR and antigen test) was only applied to patients who fulfilled the criteria for Severe Acute Respiratory Infection (suspected case plus at least one sign: dyspnea, chest pain, or desaturation), except on 475 units which applied a diagnostic test to 10% of outpatient cases as part of a sentinel surveillance system. Therefore, the surveillance system does not include asymptomatic or pauci-symptomatic cases [27]. We used active cases as the epidemiological indicator from SISVER, following the operational definition from Mexico: Confirmed cases that started symptoms within 14 days from the sampling date. We decided not to include daily deaths among confirmed cases as an indicator, because of the delay in the update of this information in the Epidemiological Surveillance System at that time. We registered the testing rate per 100,000 for the municipality where the WWTP is located, at the end of the sampling period from the COVID-19 monitoring dashboard nested in the National Institute of Public Health site.

2.8. Lead Time of WW-Based Surveillance

For RNA concentrations in WW to be an early warning marker for COVID-19 cases, we expected RNA concentrations as a function of time to be displaced to the left, relative to the COVID-19 metric function. Therefore, the early warning time would correspond to the magnitude of the displacement of the RNA function that brings it most in harmony with the case function. Thus, we looked for optimal harmonization by locating the maximum of Pearson’s Rho between the two functions for a given lag in days.
The procedure to locate the maximum Rho was implemented in three steps: firstly, to displace the RNA function in one-day increases, we linearly interpolated values of log10 RNA daily adjusted copies between observed bi-weekly values, by WWTP. Secondly, by WWTP, we estimated Rho by one-day displacements of the active case function (COV), from 0 to 50 days. Lastly, to estimate the maximum jointly analyzing all sites, we fitted fixed-effects linear models of the form:
l o g 10 R N A i , t = β 0 + β 1 log C O V i , t d N i + j = 2 8 β j S j 1 + ε i , t
where l o g 10 R N A i , t is the log base 10 number of daily adjusted copies of RNA ( S A R S C o V 2   q u a n t i f i c a t i o n c o p i e s m L × W W T P   f l o w m L d a y D e g r a d a t i o n   f a c t o r × R e c o v e r y   p e r c e n t a g e ), as shown below, at the i-th site at t-th day, C O V i , t + l is the COVID-19 metric (active cases) at the municipality, where the i-th site resides displaced d days to the left of the t-th day, N i is the population size at the municipality, where the i-th sites resides, and S j 1 are dummy variables for the sites. We, thus, fitted 51 models, corresponding with displacements of the COV function to the left, of 0 to 50 days, and identified the maximum of the Rho value. We used Stata 16.1 (StataCorp. 2019. Stata Statistical Software: Release 16. College Station, TX: StataCorp LLC) for these calculations.

2.9. Infection Prevalence Estimation

We estimated SARS-CoV-2 infection prevalence in the WWTP catchment area using a Monte Carlo approach [28]. We ran 1000 estimations for each sample and obtained the median and interquartile range. Four parameters were obtained from the literature: f e c a l   e x c r e t i o n   r a t e   c o p i e s m L , n o r m a l   f e c a l   l o a d   g d a y × p e r s o n , f e c a l   d e n s i t y   g m L and %   o f   i n f e c t e d   w h o   s h e d   S A R S C o V 2   f e c a l l y . The rest of the parameters were measured on-site by field personnel.
Our overall equation was the following:
S A R S C o V 2   q u a n t i f i c a t i o n c o p i e s m L × W W T P   f l o w m L d a y D e g r a d a t i o n   F a c t o r × R e c o v e r y   p e r c e n t a g e n o r m a l   f e c a l   l o a d   g d a y × p e r s o n × f e c a l   e x c r e t i o n   r a t e   c o p i e s m L f e c a l   d e n s i t y   g m L %   o f   i n f e c t e d   w h o   s h e d   S A R S C o V 2   f e c a l l y
where S A R S C o V 2   q u a n t i f i c a t i o n is the virus quantification from the 24-h composite sample, W W T P   f l o w is the mean daily inflow at the WWTP (mL/day) of the 12 measurements taken at the time of sampling, and D e g r a d a t i o n   F a c t o r is the SARS-CoV-2 degradation factor in wastewater, which was estimated through the following equation [29]:
D e g r a d a t i o n   F a c t o r = 0.5 [ M e a n   t r a v e l t i m e ]   h [ H a l f   l i f e   i n s a m p l i n g   c o n d i t i o n s ] h
where, [ M e a n   t r a v e l t i m e ]   h was estimated through the following calculation:
[ M e a n   t r a v e l t i m e ]   h = [ M e a n   t r a v e l d i s t a n c e ]   m [ M e a n   d a i l y f l o w ]   m 3 s [ C r o s s s e c t i o n a l   a r e a o f   s a m p l i n g   p o i n t ] m 2 3600
And [ H a l f   l i f e   i n s a m p l i n g   c o n d i t i o n s ] h was estimated through the following equation:
[ H a l f   l i f e   i n s a m p l i n g   c o n d i t i o n s ] h = t 1 2 , 1 × l n 2 ln 2 × Q 10 T 2 T 1 10 °   C
where t 1 2 , 1 is the known half-life (11.8 h) [30], T 1 is the temperature at which said half-life was originally estimated (20 °C), T 2 is the day mean wastewater temperature (of the 12 measurements taken at grab sampling times), and Q 10 is a temperature-dependent adjustment factor (2.5) [29]. For R e c o v e r y   p e r c e n t a g e we used a value of 0.292, our mean virus recovery, as previously explained.
We obtained four variables from the literature: f e c a l   e x c r e t i o n   r a t e   c o p i e s m L [31]; n o r m a l   f e c a l   l o a d   g d a y × p e r s o n [32] (value for middle and low income countries); f e c a l   d e n s i t y   g m L [33]; and %   o f   i n f e c t e d   w h o   s h e d   S A R S C o V 2   f e c a l l y [34]. The distributions, mean values, and standard errors we used are shown in Supplementary Table S3.
From the information provided by WWTP personnel, we identified the municipalities served by each WWTP and obtained their populations from the data of the 2015 intercensal survey. Afterward, we used the measured values of BOD5, COD, total nitrogen, and phosphorus to estimate the populations served by each WWTP, according to the methodology initially described by Van Nuijs [35]. Briefly, this method multiplies the measured parameter by the flow and divides the result by a constant, which is 59 for BOD5, 128 for COD, 12.5 for total nitrogen, and 1.7 for phosphorus.

3. Results

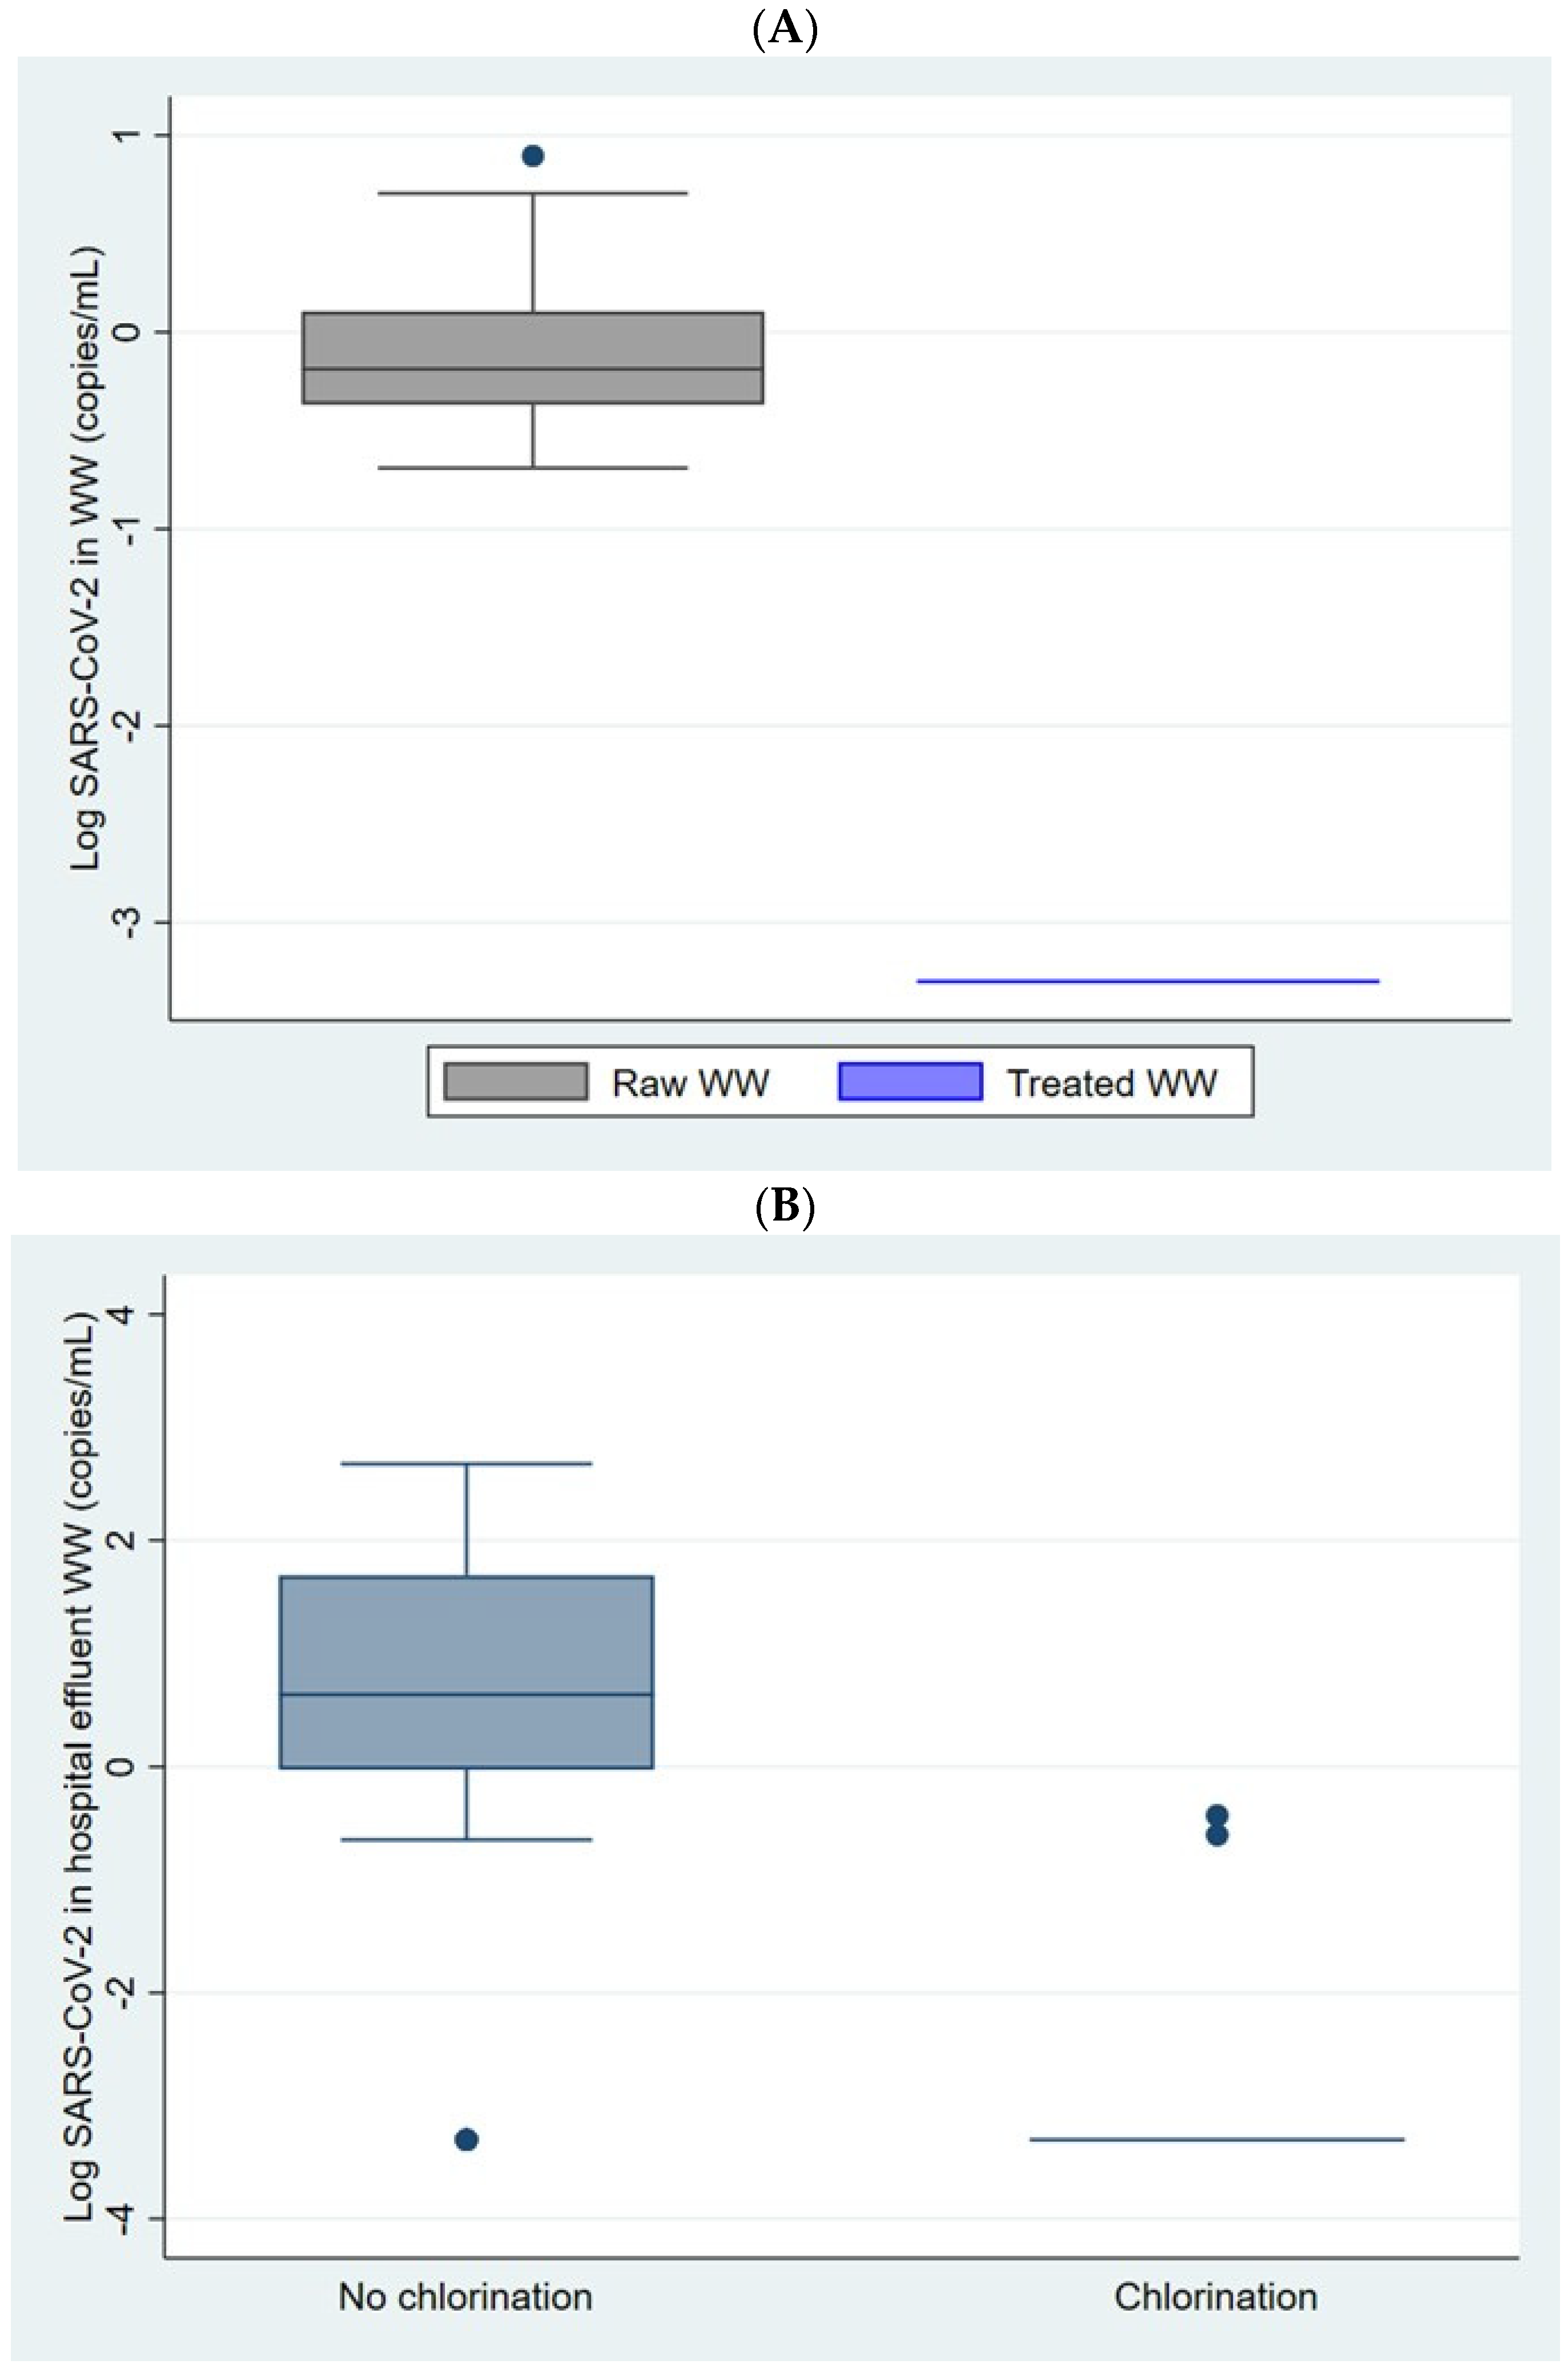
3.1. SARS-CoV-2 RNA in WW of WWTPs and COVID-19 Hospitals

Table 1 shows median, minimum, and maximum SARS-CoV-2 RNA quantification, average daily flow (L/s), WW temperature (°C), and WW distance traveled (km) by WWTP, as well as a sewage system and WW characteristics and reported hospital WW chlorination. SARS-CoV-2 RNA was detected and quantified in all WWTPs, except Zona Noreste (Villahermosa), which operated at maximum capacity throughout the sampling period, in a heavy rainfall scenario. Zaragoza (Mexicali), Reynosa I (Reynosa), and Acapantzingo (Cuernavaca) had at least one sample with undetectable RNA; on the remaining six WWTPs, we detected and quantified SARS-CoV-2 RNA in all samples. Complete data of RNA quantification by date is available in Supplementary Table S4.
In Mexico, sewage provision and water treatment are not homogenous across cities or areas. The WWTPs sampled operate in cities of different sizes and characteristics that are known to have an association with RNA degradation in the environment. Agua Prieta in Guadalajara Metropolitan Area is the biggest sampled WWTP with 4009 to 5331 L/s average inflow for a ca. 3.5 million population in the metropolitan area in a state reporting a high proportion of basic sanitation services and in the municipality with the lowest testing rate. The second biggest WWTP is Cerro de la Estrella in Mexico City, population ca. 3.2 million, a high proportion of basic sanitation services, and a high test rate. The third WWTP is San Francisco in Puebla. Mexicali, León, and Reynosa are middle-size WWTP in middle-size cities. In contrast, La Raya (Oaxaca) had the lowest 28 to 38 L/s average inflow, reporting 80% runoff in the state, reporting the lowest proportion of basic sanitation services, for the second smallest population, ca. 500,000, but the highest test rate. Acapantzingo in Cuernavaca and Norponiente in Benito Juárez are smaller WWTP for smaller populations.
We measured the highest WW temperatures at the Norponiente WWTP in Cancun (27.7 to 30.3 °C), followed by the WWTP in Mexicali and Reynosa. The lowest temperatures appeared at Cerro de la Estrella in Mexico City, San Francisco in Puebla, and Acapantzingo in Cuernavaca (19, 20, and 21 °C). The average WW travel distance was the longest (16.5 km) in the WWTP Cerro de la Estrella (Mexico City) and the shortest (2 km) in the WWTP Zona Noreste (Villahermosa).
The results of the quantification of the virus RNA in log10 copies/mL during the pilot phase in Cuernavaca and Mexico City are shown in Figure 2A. All raw wastewater samples were positive, while all treated wastewater samples were non-detectable.
SARS-CoV-2 RNA was quantified in 58% of hospital effluent samples. The highest RNA concentrations were quantified in the samples from hospitals that reported no disinfection method for their discharges. In contrast, hospitals reporting discharge chlorination had no detectable results, except for one sample each (Figure 2B).

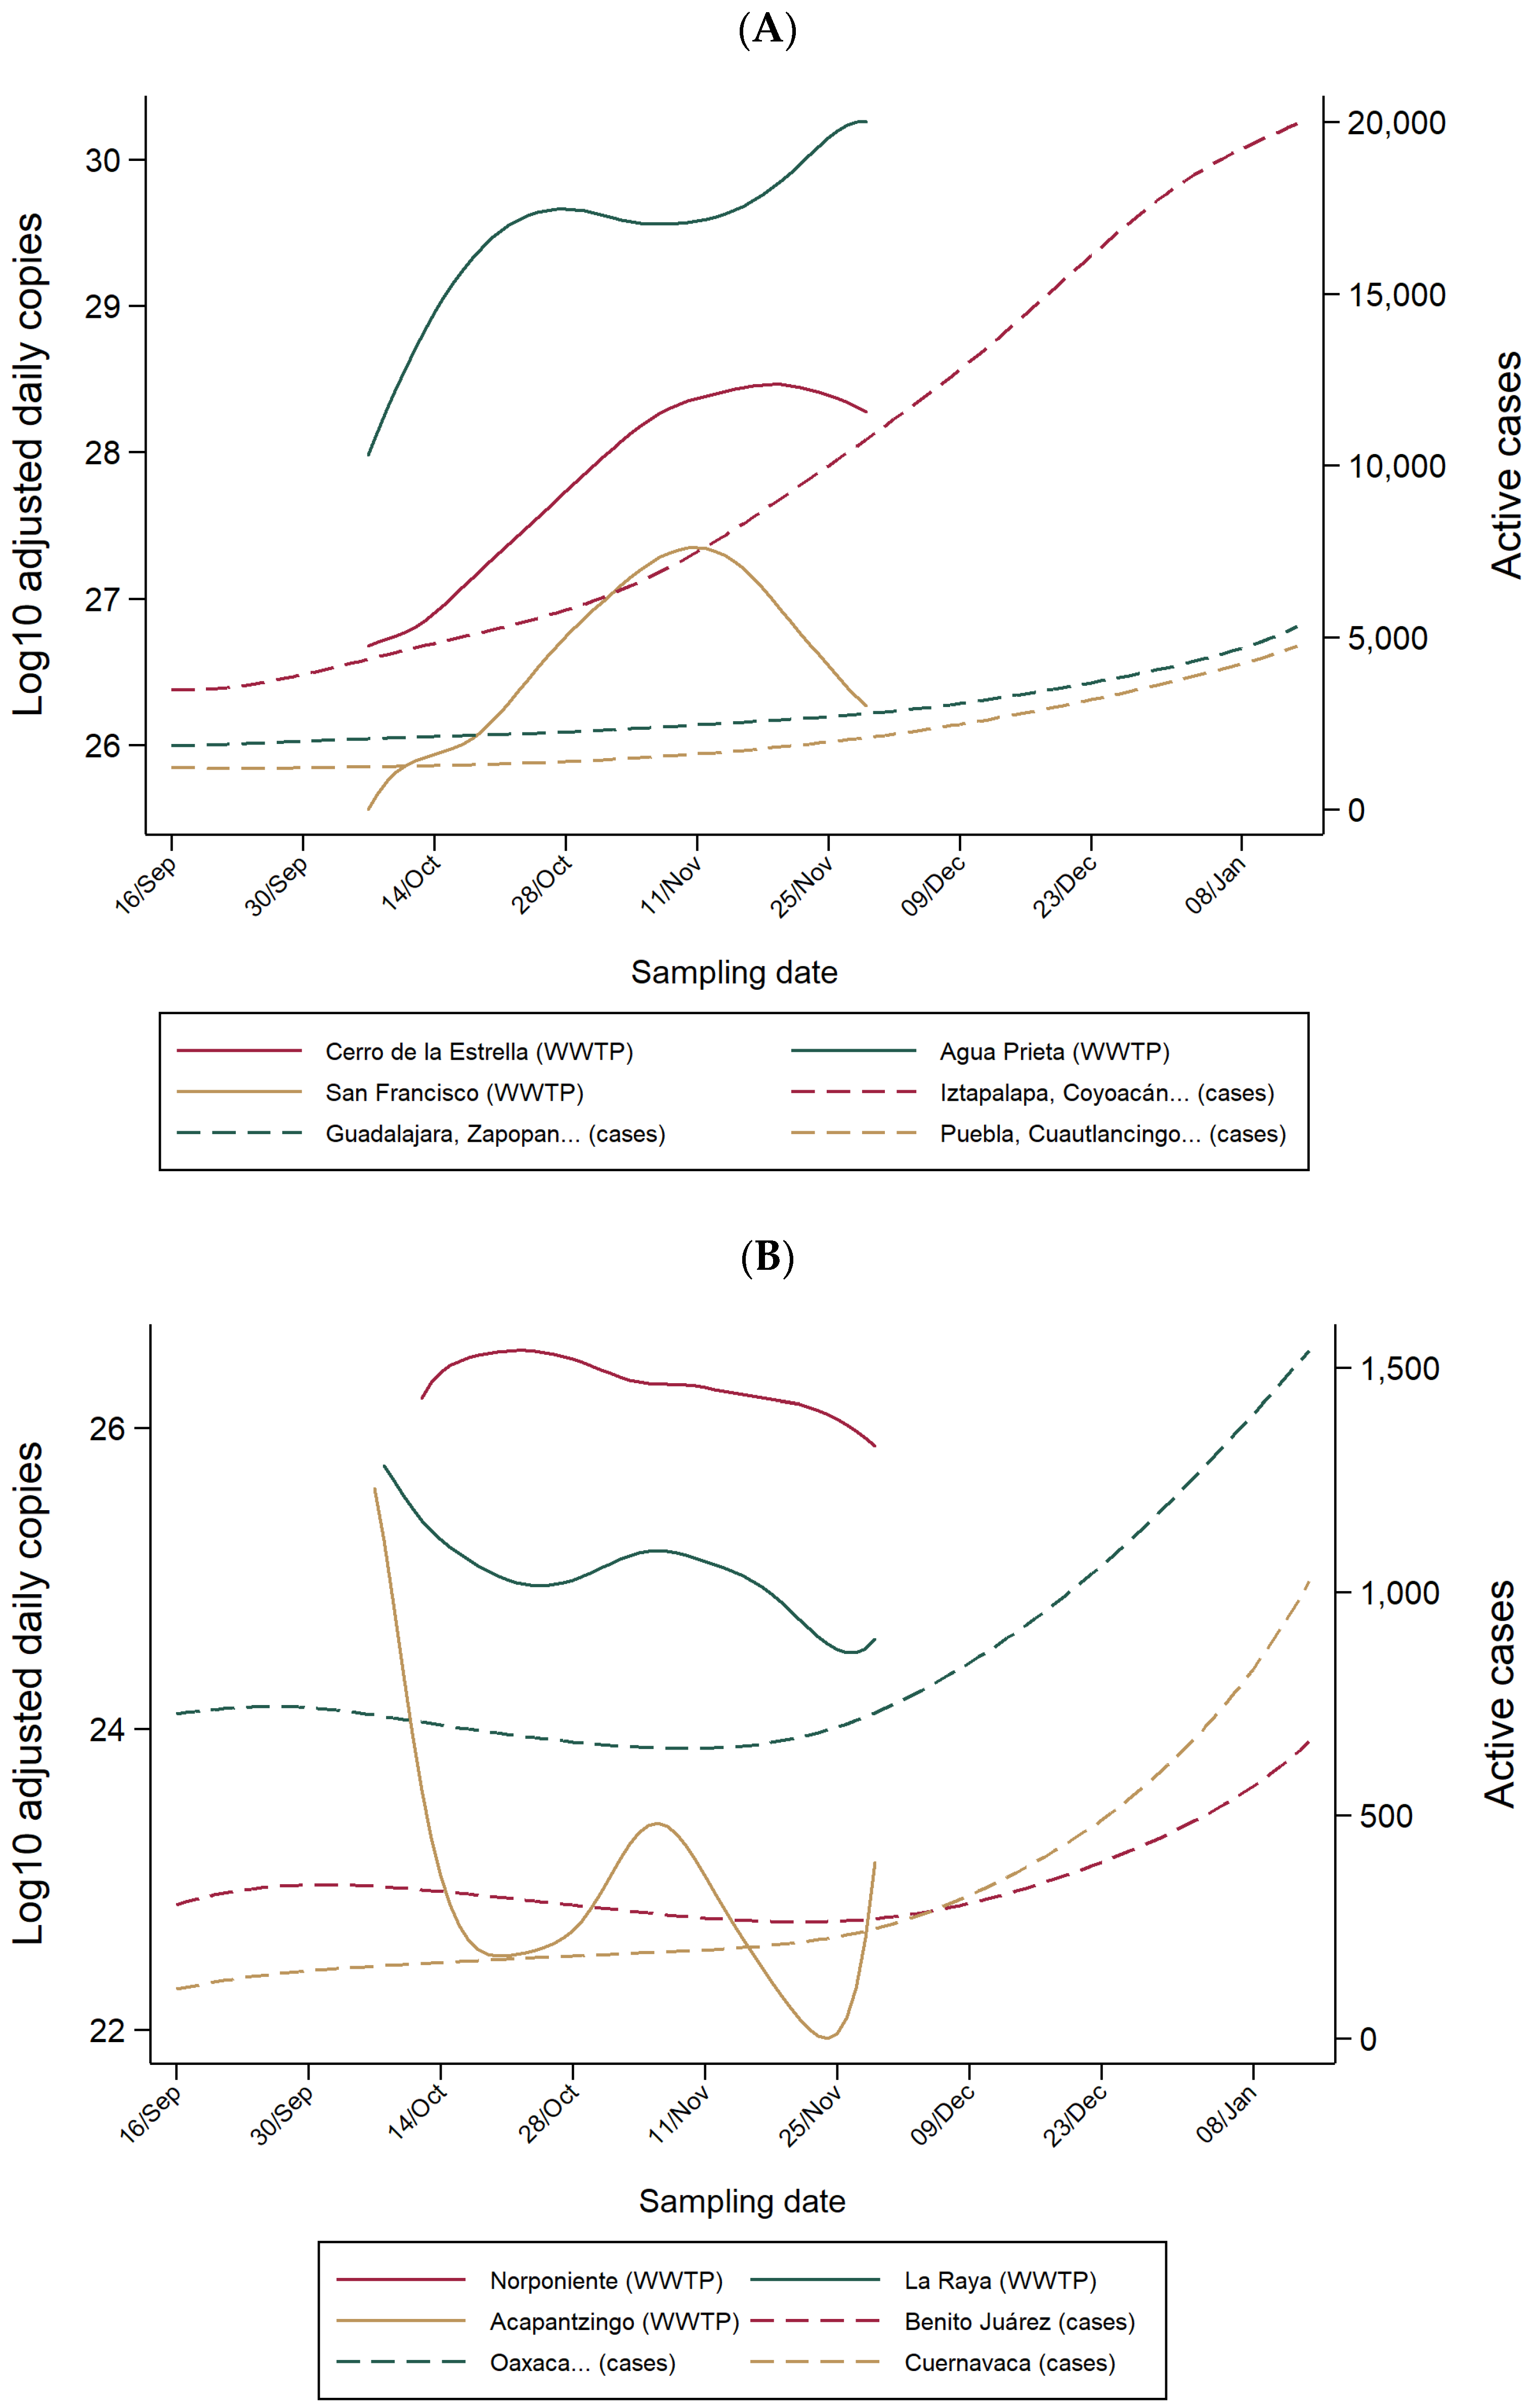
3.2. Lead Time of WW-Based Surveillance Compared to Clinical-Based Surveillance

Figure 3 shows the temporal trend of both environmental adjusted Log10 SARS-CoV-2 RNA daily loads and clinical surveillance active cases for nine sites stratified as big, medium, and small WWTPs.
Table 2 shows the correlation coefficients (Rho) and corresponding lead time days for RNA daily loads compared to active cases by the site. We found a lag time of over a month for all sites and each big and medium WWTP site. The correlation was stronger for all the sites and for Mexico City, Guadalajara, and León. A modest correlation was found for Puebla, Mexicali, and Reynosa. The small WWTP sites were not included in Table 2 because the resulting Rho was small, and the trends were not clear, as can be seen in Figure 3C. In some cases, the Rho vs. lag days was bimodal; thus, we present the two lag days corresponding to the two highest correlations observed. The first lead time occurred over the first days for Guadalajara, Mexico City, and Mexicali. The second lead time ranged from 35 to 43 days for active cases. Complete correlation series of rho vs. lag days for adjusted Log10 SARS-CoV-2 RNA daily loads with active cases are shown in Supplementary Figure S3.

3.3. WW-Based COVID-19 Estimated Cases

Table 3 shows the summary of WW-based estimated cases, catchment area population, and prevalence, compared to clinical surveillance-based active cases and testing rate for each WWTP during the sampling period. Complete data by date is available in Supplementary Table S5. The ratio of estimated to active cases shows that for all sites, WW-based surveillance estimated a larger number of cases compared to clinical-based surveillance. In the Center and South of Mexico, including Mexico City, Puebla, and Oaxaca, we estimated twice as many cases based on WW compared to clinical-based surveillance. These sites had the highest test rates. In contrast, the North and West region, including Mexicali, Reynosa, and Guadalajara, had a 20-fold increase in WW-based estimated cases compared to clinical-based active cases. These sites had a lower test rate.
The WW-based prevalence was higher (7.2 to 71.2 estimated cases per 1000 people) compared to the clinical-based prevalence (0.3 to 1.6 active cases per 1000 people).
Estimates of the catchment area population calculated from the physicochemical parameters (DBO5, DQO, N, P) were 4% to 42% smaller than the municipal population for all WWTPs.

4. Discussion

We aimed to evaluate the presence of SARS-CoV-2 RNA in WW from WWTP influents and COVID-19 hospital effluents, identify the lead time of WW monitoring compared to clinical surveillance, and estimate the number of infected subjects in cities in Mexico. We detected and quantified SARS-CoV-2 RNA in 88% of influent wastewater samples; samples in heavy rainfall scenarios were all undetectable. Our results showed that an increase in adjusted SARS-CoV-2 RNA daily loads in WW had a high to moderate correlation with an increase in active cases 35 to 43 days later in sites with big and medium WWTPs. Our estimates showed that the number of infected subjects in the study period could have been 2 to 20 times higher than the number of clinical cases detected through the clinical surveillance system. Our results suggest that SARS-CoV-2 detection in WW is a feasible and informative procedure to be conducted in Mexican cities, mainly in those having a better-connected sewerage network and a higher flow WWTP.
The early warning capability of wastewater surveillance for COVID-19 has been extensively discussed in the literature [13,16,17,18,19,20,36,37]. Our study contributes to this body of work by showing a longer lead time, over one month, in the bigger and medium WWTP sites using standardized procedures and proposing a robust statistical methodology that focused on harmonizing the case and viral load distributions. Early COVID-19 studies reported highly heterogeneous and site-specific lags between changes in WW viral load and changes in clinical surveillance, ranging from some days to several weeks [38], implicating that lags cannot be compared across sites [22,26]. There are some possible explanations for our results showing a longer lead time than those previously reported. One is that we extended the analysis up to 50 days, and we have not found another paper considering such a long period. It has also been recognized that the lead time results are limited by the accuracy of the clinical data depending on the testing accessibility and seeking behavior and on the delay of the report in the clinical surveillance system [39]. WW system characteristics could also influence the results, as better-connected sewer networks provide better results [22]. In our study, the highest correlation with active cases, which ranged from 35 to 43 days, supports the conclusion that better-connected sewerage networks, in our case represented by the big and medium WWTP in states with higher coverage of basic sanitation services, provide stronger correlation coefficients. Because of the multiple factors that influence the delay of the detection of cases through the clinical surveillance system, conceptually, WW-based surveillance can provide information about COVID-19 prevalence and dynamics [40].
We chose the clinical surveillance indicator of active cases, defined as the confirmed cases that started symptoms within the previous 14 days of the sampling date, following the operational definition used in Mexico. We decided not to include the daily deaths among confirmed cases as an indicator, because of the delay in the update of this information in the Epidemiological Surveillance System at that time. While there is no consensus on the best indicator to use, other authors have used cumulative incidence and COVID-19 cases [16], COVID-19 cases per week in Argentina [17], newly hospitalized patients in Sweden [18], confirmed cases in India [19], and positive cases in Canada [20].
WW-based surveillance allowed us to estimate the number of prevalent infection cases. In our study, WW-based cases were 2 to 20-fold higher than the clinical-based active cases for the sampling period, capturing asymptomatic or mild infection cases that were shedding the virus but were not detected by hospitals and clinics. Included municipalities had dissimilar SARS-CoV-2 attack and testing rates, which could be influencing the comparison with WW-based estimates. Estimates of the catchment area population calculated from the physicochemical parameters (DBO5, DQO, N, P) were 4% to 42% smaller than the municipal population for all WWTPs, indicating that WWTPs were capturing a fraction of the municipal population. This estimation of the population that contributed to the WW sample is relevant to calculating the prevalence (number of cases/population in the catchment area). In México, Padilla-Reyes et al. [13] showed results for a WW-based case estimation for the city of Monterrey, comparing it to the clinical surveillance data. Robotto et al. [26] also estimated the cases expected according to the WW signal but failed to consider the natural degradation of the viral RNA. Hart and Halden [29] and Ahmed et al. [41] did not consider their estimation of the recovery efficiency of the method, and we did, although as a point value. Similar to recent studies [25,42,43,44], in this work, we used an unenveloped bacteriophage to calculate the recovery efficiency of viral particles. It is possible that the recovery efficiency is different between SARS-CoV-2 and bacteriophage, which could have contributed to an incorrect estimate of the amount of SARS-CoV-2 in the wastewater samples. In-sewer travel time has rarely been reported, but we adjusted our results for this variable. The shedding profile of SARS-CoV-2, including the shedding rate, the beginning, and the duration of shedding are still being studied to improve the calculations of infection prevalence and reduce the uncertainties that exist in our results [45,46].
Recent studies [47,48,49] describe that pasteurization of wastewater samples is an important factor in the degradation of SARS-CoV-2 RNA. Controversially, another study [50] reports that pasteurization may lead to a slight increase in the recovery of SARS-CoV-2 RNA. While the work of Robinson et al. [51] mentions that the pasteurization of wastewater samples did not significantly reduce the SARS-CoV-2 signal when the RNA was extracted immediately after pasteurization; on the contrary, the signal decreased significantly when the RNA was purified 24–36 h after having pasteurized the samples. In this work, we used the same procedure to pasteurize all the samples, including those that were used to calculate the percentage of viral recovery; for this reason, we believe that all the samples analyzed had the same bias. However, pasteurization may have contributed to the degradation of the viral RNA, which could lead to a lower measurement of the amount of SARS-CoV-2.
Our results showed that secondary treatment and disinfection applied to WW in treatment plants were effective in eliminating the genetic material and, therefore, the coronavirus. A previous study in Mexico coincides with this finding [11]. On the other hand, the treated wastewater analyzed in Santiago de Chile in May and June 2020 was detectable, although with a lower concentration of virus RNA compared to raw wastewater [52]. In a previous study, chlorination of COVID-19 hospital wastewater discharges was effective in removing genetic material and, therefore, coronavirus in 94% of effluent samples, as reviewed by Achack et al. [53]. An additional study carried out in China during the SARS-CoV-1 epidemic showed that SARS-CoV-1 RNA was detected in untreated wastewater, and there was only a weak sample positive after the first disinfection process. All samples were negative at the end of the disinfection process [54]. Our results are consistent with these previous findings.
Our study had several limitations that we must mention. First, Villahermosa presented heavy rainfall and flooding during the sampling period, which is likely why all our samples from that site were negative for SARS-CoV-2 RNA detection. Our observation coincides with other reports mentioning that the WW sample can be diluted in the cases of rainfall and flooding, preventing the detection of genetic material [55,56]. Additionally, WWTPs in Mexico do not have precise information about their catchment area, and we approximated it according to the census data for the served municipalities. Epidemiological data from clinical surveillance are grouped at the municipal level, while the catchment areas of the WWTPs do not necessarily coincide with the municipal boundaries. We included an estimate of the number of inhabitants in the catchment area of the WWTP, based on concentrations of nitrogen, phosphorus, and oxygen in some of the samples. Through this method, we estimated the catchment population to be a smaller fraction (5% to 40%) of the municipal population in all sites. Other research has used the design capacity of a WWTP in the back-calculations as the number of inhabitants living in the catchment area of the WWTP, but this parameter is dynamic and shows daily variations [35]. A GIS-based estimation using census population and sewer shed maps could help to provide more precise information about the population served by each facility as described for Monterrey [13]. However, even with this information, there are important population movements because of work, tourism, visits, and other phenomena, as well as other contributing sources of wastewater, so the population calculation based on physicochemical parameters can provide a better parameter to establish the denominator for the prevalence estimation. Further studies will need to employ appropriate methods to estimate and validate the population covered by the studied WWTP and consider how to incorporate the dynamics of the population into the result interpretation [45,46].

5. Conclusions

Establishing a long-term monitoring system for COVID-19 in Mexico will be a challenge, mainly due to costs and logistics. Supply lines need to be stable to acquire materials that experienced shortages during the pandemic, a challenge that we faced frequently, including overpricing. Transportation was also a challenge, since the distance to our lab from the 10 included cities, ranged from over 2000 km to only 10 km. A network of laboratories, such as those provided by the public health laboratory network in Mexico, will be needed to facilitate transportation and analysis without compromising the cold chain. While challenging, we consider a monitoring system feasible and informative if three main conditions are fulfilled: (1) adequate data regarding the WW system (catchment area, population served, WW sources), (2) capacity to maintain the cold-chain and process samples (shorten transportation times), and (3) investment in supplies and training of personnel to ensure standardized procedures. We think these challenges may be transportable to other low- and middle-income countries.

Supplementary Materials

The following supporting information can be downloaded at: https://www.mdpi.com/article/10.3390/w15040799/s1, Supplementary Table S1: Data of Wastewater Treatment Plants (WWTP) and Hospitals, collected from personnel through information forms (translated from Spanish). Supplementary Figure S1: Sampling form filled by fieldwork personnel (in Spanish). Supplementary Figure S2: Chain of custody form (in Spanish). Supplementary Methods: Supplementary Table S2: Oligonucleotides used for the recovery efficiency test. Supplementary Table S3: Distribution of variables used in Monte Carlo simulations, México, 2020. Supplementary Table S4: SARS-CoV-2 quantification by date in 10 Mexican cities, October–November 2020. Supplementary Figure S3: Correlation series of Rho for lead time in days for the functions of Log10 adjusted SARS-CoV-2 RNA daily loads with active cases, by WWTP, Mexico, October–November 2020. Supplementary Table S5: Estimated cases by WW SARS-CoV-2 RNA quantification and active cases on the clinical surveillance system. References [31,32,33,34] are cited in the Supplementary Materials.

Author Contributions

A.S.: Conceptualization, Methodology, Formal analysis, Data curation, Funding acquisition, Project administration, Supervision, Visualization, Writing—original draft, Writing–review and editing; A.S.-P.: Conceptualization, Methodology, Formal analysis, Data curation, Funding acquisition, Project administration, Supervision, Visualization, Writing—original draft, Writing—review and editing; M.T.O.-M.: Conceptualization, Methodology, Validation, Data curation, Funding acquisition, Project administration, Supervision, Writing—original draft, Writing-review and editing; J.T.-S.: Methodology, Validation, Investigation, Resources, Data curation, Supervision, Writing—review and editing; S.B.-R.: Methodology, Validation, Investigation, Data curation, Writing—review and editing; S.Y.B.-R.: Methodology, Validation, Investigation, Data curation, Writing—review and editing; M.L.: Conceptualization, Resources, Funding acquisition, Writing—review and editing; J.M.-B.: Methodology, Validation, Investigation, Resources, Supervision, Writing—review and editing; C.M.A.-A.: Methodology, Validation, Resources, Writing—review and editing; H.L.-F.: Data curation, Formal analysis, Methodology, Writing—review and editing; T.B.-G.: Conceptualization, Formal analysis, Funding acquisition, Resources, Project administration, Writing—review and editing. All authors have read and agreed to the published version of the manuscript.

Funding

This research project was supported by the Comisión Nacional del Agua CONAGUA (National Commission of Water in Mexico). CONAGUA participated in site selection and sample collection.

Institutional Review Board Statement

The study was approved by the Institutional Review Board of the National Institute of Public Health (protocol code 1693 approval date 11 September 2020).

Informed Consent Statement

Not applicable.

Data Availability Statement

The data can be found in the Supplementary Materials and upon reasonable request.

Acknowledgments

We are grateful to Jesús Hernández Romano from Universidad Politécnica del Estado de Morelos, who provided the phage ɸITL-1. We thank José Juan Mares Sámano for his support in data entry. We also thank Estefanía Andrade for her support in data collection. We thank Edith Reyes and Laura Luna for their administrative support. We would also like to thank the officials from the River Basin Organizations from the National Commission of Water for the support provided in the development of this project.

Conflicts of Interest

The authors declare no conflict of interest.

References

  1. Basto-Abreu, A.; Carnalla, M.; Torres-Ibarra, L.; Romero-Martínez, M.; Martínez-Barnetche, J.; López-Martínez, I.; Aparicio-Antonio, R.; Shamah-Levy, T.; Alpuche-Aranda, C.; Rivera, J.A.; et al. Nationally Representative SARS-CoV-2 Antibody Prevalence Estimates after the First Epidemic Wave in Mexico. Nat. Commun. 2022, 13, 589. [Google Scholar] [CrossRef] [PubMed]
  2. Corman, V.M.; Landt, O.; Kaiser, M.; Molenkamp, R.; Meijer, A.; Chu, D.K.; Bleicker, T.; Brünink, S.; Schneider, J.; Schmidt, M.L.; et al. Detection of 2019 Novel Coronavirus (2019-NCoV) by Real-Time RT-PCR. Eurosurveillance 2020, 25, 2000045. [Google Scholar] [CrossRef] [PubMed] [Green Version]
  3. Bello-Chavolla, O.Y.; Antonio-Villa, N.E.; Fernández-Chirino, L.; Guerra, E.C.; Fermín-Martínez, C.A.; Márquez-Salinas, A.; Vargas-Vázquez, A.; Bahena-López, J.P. Diagnostic Performance and Clinical Implications of Rapid SARS-CoV-2 Antigen Testing in Mexico Using Real-World Nationwide COVID-19 Registry Data. PLoS ONE 2021, 16, e0256447. [Google Scholar] [CrossRef] [PubMed]
  4. Jiang, X.; Luo, M.; Zou, Z.; Wang, X.; Chen, C.; Qiu, J. Asymptomatic SARS-CoV-2 Infected Case with Viral Detection Positive in Stool but Negative in Nasopharyngeal Samples Lasts for 42 Days. J. Med. Virol. 2020, 92, 1807–1809. [Google Scholar] [CrossRef]
  5. Liu, J.; Xiao, Y.; Shen, Y.; Shi, C.; Chen, Y.; Shi, P.; Gao, Y.; Wang, Y.; Lu, B. Detection of SARS-CoV-2 by RT-PCR in Anal from Patients Who Have Recovered from Coronavirus Disease 2019. J. Med. Virol. 2020, 92, 1769–1771. [Google Scholar] [CrossRef] [Green Version]
  6. Wu, Y.; Guo, C.; Tang, L.; Hong, Z.; Zhou, J.; Dong, X.; Yin, H.; Xiao, Q.; Tang, Y.; Qu, X.; et al. Prolonged Presence of SARS-CoV-2 Viral RNA in Faecal Samples. Lancet Gastroenterol. Hepatol. 2020, 5, 434–435. [Google Scholar] [CrossRef]
  7. Xu, Y.; Li, X.; Zhu, B.; Liang, H.; Fang, C.; Gong, Y.; Guo, Q.; Sun, X.; Zhao, D.; Shen, J.; et al. Characteristics of Pediatric SARS-CoV-2 Infection and Potential Evidence for Persistent Fecal Viral Shedding. Nat. Med. 2020, 26, 502–505. [Google Scholar] [CrossRef] [Green Version]
  8. Pan, Y.; Zhang, D.; Yang, P.; Poon, L.L.M.; Wang, Q. Viral Load of SARS-CoV-2 in Clinical Samples. Lancet Infect. Dis. 2020, 20, 411–412. [Google Scholar] [CrossRef]
  9. Zhang, Y.; Cen, M.; Hu, M.; Du, L.; Hu, W.; Kim, J.J.; Dai, N. Prevalence and Persistent Shedding of Fecal SARS-CoV-2 RNA in Patients with COVID-19 Infection: A Systematic Review and Meta-Analysis. Clin. Transl. Gastroenterol. 2021, 12, E00343. [Google Scholar] [CrossRef]
  10. Cruz-Cruz, C.; Rodríguez-Dozal, S.; Cortez-Lugo, M.; Ovilla-Muñoz, M.; Carnalla-Cortés, M.; Sánchez-Pájaro, A.; Schilmann, A. Revisión Rápida: Monitoreo de La Presencia e Infectividad Del Virus SARS-CoV-2 y Otros Coronavirus En Aguas Residuales. Salud Publica Mex. 2021, 63, 109–119. [Google Scholar] [CrossRef]
  11. Carrillo-Reyes, J.; Barragán-Trinidad, M.; Buitrón, G. Surveillance of SARS-CoV-2 in Sewage and Wastewater Treatment Plants in Mexico. J. Water Process Eng. 2020, 40, 101815. [Google Scholar] [CrossRef]
  12. González-Reyes, J.R.; Hernández-Flores, M.d.l.L.; Paredes-Zarco, J.E.; Téllez-Jurado, A.; Fayad-Meneses, O.; Carranza-Ramírez, L. Detection of SARS-CoV-2 in Wastewater Northeast of Mexico City: Strategy for Monitoring and Prevalence of COVID-19. Int. J. Environ. Res. Public Health 2021, 18, 8547. [Google Scholar] [CrossRef]
  13. Padilla-Reyes, D.A.; Álvarez, M.M.; Mora, A.; Cervantes-Avilés, P.A.; Kumar, M.; Loge, F.J.; Mahlknecht, J. Acquired Insights from the Long-Term Surveillance of SARS-CoV-2 RNA for COVID-19 Monitoring: The Case of Monterrey Metropolitan Area (Mexico). Environ. Res. 2022, 210, 112967. [Google Scholar] [CrossRef]
  14. Zarza, E.; Diego-García, E.; García, L.V.; Castro, R.; Mejía, G.; Herrera, D.; Cuevas, R.; Palomeque, Á.; Iša, P.; Guillén, K. Monitoring SARS-CoV-2 in the Wastewater and Rivers of Tapachula, a Migratory Hub in Southern Mexico. Food Environ. Virol. 2022, 14, 199–211. [Google Scholar] [CrossRef]
  15. Rosiles-González, G.; Carrillo-Jovel, V.H.; Alzate-Gaviria, L.; Betancourt, W.Q.; Gerba, C.P.; Moreno-Valenzuela, O.A.; Tapia-Tussell, R.; Hernández-Zepeda, C. Environmental Surveillance of SARS-CoV-2 RNA in Wastewater and Groundwater in Quintana Roo, Mexico. Food Environ. Virol. 2021, 13, 457–469. [Google Scholar] [CrossRef]
  16. Weidhaas, J.; Aanderud, Z.T.; Roper, D.K.; VanDerslice, J.; Gaddis, E.B.; Ostermiller, J.; Hoffman, K.; Jamal, R.; Heck, P.; Zhang, Y.; et al. Correlation of SARS-CoV-2 RNA in Wastewater with COVID-19 Disease Burden in Sewersheds. Sci. Total Environ. 2021, 775, 145790. [Google Scholar] [CrossRef]
  17. Giraud-Billoud, M.; Cuervo, P.; Altamirano, J.C.; Pizarro, M.; Aranibar, J.N.; Catapano, A.; Cuello, H.; Masachessi, G.; Vega, I.A. Monitoring of SARS-CoV-2 RNA in Wastewater as an Epidemiological Surveillance Tool in Mendoza, Argentina. Sci. Total Environ. 2021, 796, 148887. [Google Scholar] [CrossRef]
  18. Saguti, F.; Magnil, E.; Enache, L.; Churqui, M.P.; Johansson, A.; Lumley, D.; Davidsson, F.; Dotevall, L.; Mattsson, A.; Trybala, E.; et al. Surveillance of Wastewater Revealed Peaks of SARS-CoV-2 Preceding Those of Hospitalized Patients with COVID-19. Water Res. 2021, 189, 116620. [Google Scholar] [CrossRef]
  19. Kumar, M.; Joshi, M.; Patel, A.K.; Joshi, C.G. Unravelling the Early Warning Capability of Wastewater Surveillance for COVID-19: A Temporal Study on SARS-CoV-2 RNA Detection and Need for the Escalation. Environ. Res. 2021, 196, 110946. [Google Scholar] [CrossRef]
  20. D’Aoust, P.M.; Graber, T.E.; Mercier, E.; Montpetit, D.; Alexandrov, I.; Neault, N.; Baig, A.T.; Mayne, J.; Zhang, X.; Alain, T.; et al. Catching a Resurgence: Increase in SARS-CoV-2 Viral RNA Identified in Wastewater 48 h before COVID-19 Clinical Tests and 96 h before Hospitalizations. Sci. Total Environ. 2021, 770, 145319. [Google Scholar] [CrossRef]
  21. Farrell, J.A.; Whitmore, L.; Duffy, D.J. The Promise and Pitfalls of Environmental DNA and RNA Approaches for the Monitoring of Human and Animal Pathogens from Aquatic Sources. Bioscience 2021, 71, 609–625. [Google Scholar] [CrossRef]
  22. Kumar, M.; Jiang, G.; Kumar Thakur, A.; Chatterjee, S.; Bhattacharya, T.; Mohapatra, S.; Chaminda, T.; Kumar Tyagi, V.; Vithanage, M.; Bhattacharya, P.; et al. Lead Time of Early Warning by Wastewater Surveillance for COVID-19: Geographical Variations and Impacting Factors. Chem. Eng. J. 2022, 441, 135936. [Google Scholar] [CrossRef] [PubMed]
  23. Lewis, G.D.; Metcalf, T.G. Polyethylene Glycol Precipitation for Recovery of Pathogenic Viruses, Including Hepatitis A Virus and Human Rotavirus, from Oyster, Water, and Sediment Samples. Appl. Environ. Microbiol. 1988, 54, 1983–1988. [Google Scholar] [CrossRef] [PubMed] [Green Version]
  24. CDC. 2019-Novel Coronavirus (2019-NCoV) Real-Time RRT-PCR Panel Primers and Probes [WWW Document]; Centers for Disease Control and Prevention: Atlanta, GA, USA, 2020. [Google Scholar]
  25. Medema, G.; Been, F.; Heijnen, L.; Petterson, S. Implementation of Environmental Surveillance for SARS-CoV-2 Virus to Support Public Health Decisions: Opportunities and Challenges. Curr. Opin. Environ. Sci. Health 2020, 17, 49–71. [Google Scholar] [CrossRef] [PubMed]
  26. Robotto, A.; Lembo, D.; Quaglino, P.; Brizio, E.; Polato, D.; Civra, A.; Cusato, J.; Di Perri, G. Wastewater-Based SARS-CoV-2 Environmental Monitoring for Piedmont, Italy. Environ. Res. 2021, 203, 111901. [Google Scholar] [CrossRef]
  27. Ministry of Health Mexico. Lineamiento Estandarizado para la Vigilancia Epidemiológica y por Laboratorio de la Enfermedad Respiratoria Viral; Government of Mexico: Mexico City, Mexico, 2021.
  28. Li, X.; Kulandaivelu, J.; Zhang, S.; Shi, J.; Sivakumar, M.; Mueller, J.; Luby, S.; Ahmed, W.; Coin, L.; Jiang, G. Data-Driven Estimation of COVID-19 Community Prevalence through Wastewater-Based Epidemiology. Sci. Total Environ. 2021, 789, 147947. [Google Scholar] [CrossRef]
  29. Hart, O.E.; Halden, R.U. Computational Analysis of SARS-CoV-2/COVID-19 Surveillance by Wastewater-Based Epidemiology Locally and Globally: Feasibility, Economy, Opportunities and Challenges. Sci. Total Environ. 2020, 730, 138875. [Google Scholar] [CrossRef]
  30. Bivins, A.; Greaves, J.; Fischer, R.; Yinda, K.C.; Ahmed, W.; Kitajima, M.; Munster, V.J.; Bibby, K. Persistence of SARS-CoV-2 in Water and Wastewater. Environ. Sci. Technol. Lett. 2020, 7, 937–942. [Google Scholar] [CrossRef]
  31. Weiss, A.; Jellingsø, M.; Sommer, M.O.A. Spatial and Temporal Dynamics of SARS-CoV-2 in COVID-19 Patients: A Systematic Review and Meta-Analysis. EBioMedicine 2020, 58, 102916. [Google Scholar] [CrossRef]
  32. Rose, C.; Parker, A.; Jefferson, B.; Cartmell, E. The Characterization of Feces and Urine: A Review of the Literature to Inform Advanced Treatment Technology. Crit. Rev. Environ. Sci. Technol. 2015, 45, 1827–1879. [Google Scholar] [CrossRef] [Green Version]
  33. Brown, D.M.; Butler, D.; Orman, N.R.; Davies, J.W. Gross Solids Transport in Small Diameter Sewers. Water Sci. Technol. 1996, 33, 25–30. [Google Scholar] [CrossRef]
  34. Cheung, K.S.; Hung, I.F.N.; Chan, P.P.Y.; Lung, K.C.; Tso, E.; Liu, R.; Ng, Y.Y.; Chu, M.Y.; Chung, T.W.H.; Tam, A.R.; et al. Gastrointestinal Manifestations of SARS-CoV-2 Infection and Virus Load in Fecal Samples From a Hong Kong Cohort: Systematic Review and Meta-Analysis. Gastroenterology 2020, 159, 81–95. [Google Scholar] [CrossRef]
  35. Van Nuijs, A.L.N.; Mougel, J.F.; Tarcomnicu, I.; Bervoets, L.; Blust, R.; Jorens, P.G.; Neels, H.; Covaci, A. Sewage Epidemiology—A Real-Time Approach to Estimate the Consumption of Illicit Drugs in Brussels, Belgium. Environ. Int. 2011, 37, 612–621. [Google Scholar] [CrossRef]
  36. Peccia, J.; Zulli, A.; Brackney, D.E.; Grubaugh, N.D.; Kaplan, E.H.; Casanovas-Massana, A.; Ko, A.I.; Malik, A.A.; Wang, D.; Wang, M.; et al. Measurement of SARS-CoV-2 RNA in Wastewater Tracks Community Infection Dynamics. Nat. Biotechnol. 2020, 38, 1164–1167. [Google Scholar] [CrossRef]
  37. Olesen, S.W.; Imakaev, M.; Duvallet, C. Making Waves: Defining the Lead Time of Wastewater-Based Epidemiology for COVID-19. Water Res. 2021, 202, 117433. [Google Scholar] [CrossRef]
  38. Bibby, K.; Bivins, A.; Wu, Z.; North, D. Making Waves: Plausible Lead Time for Wastewater Based Epidemiology as an Early Warning System for COVID-19. Water Res. 2021, 202, 117438. [Google Scholar] [CrossRef]
  39. Maal-Bared, R.; Qiu, Y.; Li, Q.; Gao, T.; Hrudey, S.E.; Bhavanam, S.; Ruecker, N.J.; Ellehoj, E.; Lee, B.E.; Pang, X. Does Normalization of SARS-CoV-2 Concentrations by Pepper Mild Mottle Virus Improve Correlations and Lead Time between Wastewater Surveillance and Clinical Data in Alberta (Canada): Comparing Twelve SARS-CoV-2 Normalization Approaches. Sci. Total Environ. 2023, 856, 158964. [Google Scholar] [CrossRef]
  40. Gonzalez, R.; Curtis, K.; Bivins, A.; Bibby, K.; Weir, M.H.; Yetka, K.; Thompson, H.; Keeling, D.; Mitchell, J.; Gonzalez, D. COVID-19 Surveillance in Southeastern Virginia Using Wastewater-Based Epidemiology. Water Res. 2020, 186, 116296. [Google Scholar] [CrossRef]
  41. Ahmed, W.; Tscharke, B.; Bertsch, P.M.; Bibby, K.; Bivins, A.; Choi, P.; Clarke, L.; Dwyer, J.; Edson, J.; Nguyen, T.M.H.; et al. SARS-CoV-2 RNA Monitoring in Wastewater as a Potential Early Warning System for COVID-19 Transmission in the Community: A Temporal Case Study. Sci. Total Environ. 2021, 761, 144216. [Google Scholar] [CrossRef]
  42. Fongaro, G.; Stoco, P.H.; Souza, D.S.M.; Grisard, E.C.; Magri, M.E.; Rogovski, P.; Schörner, M.A.; Barazzetti, F.H.; Christoff, A.P.; de Oliveira, L.F.V.; et al. The Presence of SARS-CoV-2 RNA in Human Sewage in Santa Catarina, Brazil, November 2019. Sci. Total Environ. 2021, 778, 146198. [Google Scholar] [CrossRef]
  43. Rusiñol, M.; Zammit, I.; Itarte, M.; Forés, E.; Martínez-Puchol, S.; Girones, R.; Borrego, C.; Corominas, L.; Bofill-Mas, S. Monitoring Waves of the COVID-19 Pandemic: Inferences from WWTPs of Different Sizes. Sci. Total Environ. 2021, 787, 147463. [Google Scholar] [CrossRef] [PubMed]
  44. Sakarovitch, C.; Schlosser, O.; Courtois, S.; Proust-Lima, C.; Couallier, J.; Pétrau, A.; Litrico, X.; Loret, J.-F. Monitoring of SARS-CoV-2 in Wastewater: What Normalisation for Improved Understanding of Epidemic Trends? J. Water Health 2022, 20, 712–726. [Google Scholar] [CrossRef] [PubMed]
  45. Zhu, Y.; Oishi, W.; Maruo, C.; Saito, M.; Chen, R.; Kitajima, M.; Sano, D. Early Warning of COVID-19 via Wastewater-Based Epidemiology: Potential and Bottlenecks. Sci. Total Environ. 2021, 767, 145124. [Google Scholar] [CrossRef] [PubMed]
  46. Wade, M.J.; Lo Jacomo, A.; Armenise, E.; Brown, M.R.; Bunce, J.T.; Cameron, G.J.; Fang, Z.; Farkas, K.; Gilpin, D.F.; Graham, D.W.; et al. Understanding and Managing Uncertainty and Variability for Wastewater Monitoring beyond the Pandemic: Lessons Learned from the United Kingdom National COVID-19 Surveillance Programmes. J. Hazard. Mater. 2022, 424, 127456. [Google Scholar] [CrossRef]
  47. Islam, G.; Gedge, A.; Lara-Jacobo, L.; Kirkwood, A.; Simmons, D.; Desaulniers, J.P. Pasteurization, Storage Conditions and Viral Concentration Methods Influence RT-QPCR Detection of SARS-CoV-2 RNA in Wastewater. Sci. Total Environ. 2022, 821, 153228. [Google Scholar] [CrossRef]
  48. Markt, R.; Mayr, M.; Peer, E.; Wagner, A.O.; Lackner, N.; Insam, H. Detection and Stability of SARS-CoV-2 Fragments in Wastewater: Impact of Storage Temperature. Pathogens 2021, 10, 1215. [Google Scholar] [CrossRef]
  49. Palmer, E.J.; Maestre, J.P.; Jarma, D.; Lu, A.; Willmann, E.; Kinney, K.A.; Kirisits, M.J. Development of a Reproducible Method for Monitoring SARS-CoV-2 in Wastewater. Sci. Total Environ. 2021, 799, 149405. [Google Scholar] [CrossRef]
  50. Pecson, B.M.; Darby, E.; Haas, C.N.; Amha, Y.M.; Bartolo, M.; Danielson, R.; Dearborn, Y.; Di Giovanni, G.; Ferguson, C.; Fevig, S.; et al. Reproducibility and Sensitivity of 36 Methods to Quantify the SARS-CoV-2 Genetic Signal in Raw Wastewater: Findings from an Interlaboratory Methods Evaluation in the U.S. Environ. Sci. Water Res. Technol. 2021, 7, 504–520. [Google Scholar] [CrossRef]
  51. Robinson, C.A.; Hsieh, H.Y.; Hsu, S.Y.; Wang, Y.; Salcedo, B.T.; Belenchia, A.; Klutts, J.; Zemmer, S.; Reynolds, M.; Semkiw, E.; et al. Defining Biological and Biophysical Properties of SARS-CoV-2 Genetic Material in Wastewater. Sci. Total Environ. 2022, 807, 150786. [Google Scholar] [CrossRef]
  52. Ampuero, M.; Valenzuela, S.; Valiente-Echeverría, F.; Soto-Rifo, R.; Barriga, G.; Chnaiderman, J.; Rojas, C.; Guajardo-Leiva, S.; Díez, B.; Gaggero, A. SARS-CoV-2 Detection in Sewage in Santiago, Chile—Preliminary Results. medRxiv 2020. [Google Scholar] [CrossRef]
  53. Achak, M.; Alaoui Bakri, S.; Chhiti, Y.; M’hamdi Alaoui, F.E.; Barka, N.; Boumya, W. SARS-CoV-2 in Hospital Wastewater during Outbreak of COVID-19: A Review on Detection, Survival and Disinfection Technologies. Sci. Total Environ. 2021, 761, 143192. [Google Scholar] [CrossRef]
  54. Wang, X.W.; Li, J.; Guo, T.; Zhen, B.; Kong, Q.; Yi, B.; Li, Z.; Song, N.; Jin, M.; Xiao, W.; et al. Concentration and Detection of SARS Coronavirus in Sewage from Xiao Tang Shan Hospital and the 309th Hospital of the Chinese People’s Liberation Army. Water Sci. Technol. 2005, 52, 213–221. [Google Scholar] [CrossRef]
  55. Chavarria-Miró, G.; Anfruns-Estrada, E.; Martínez-Velázquez, A.; Vázquez-Portero, M.; Guix, S.; Paraira, M.; Galofré, B.; Sánchez, G.; Pintó, R.M.; Bosch, A. Time Evolution of Severe Acute Respiratory Syndrome Coronavirus 2 (SARS-CoV-2) in Wastewater during the First Pandemic Wave of COVID-19 in the Metropolitan Area of Barcelona, Spain. Appl. Environ. Microbiol. 2021, 87, e02750-20. [Google Scholar] [CrossRef]
  56. Gonçalves, J.; Koritnik, T.; Mioč, V.; Trkov, M.; Bolješič, M.; Berginc, N.; Prosenc, K.; Kotar, T.; Paragi, M. Detection of SARS-CoV-2 RNA in Hospital Wastewater from a Low COVID-19 Disease Prevalence Area. Sci. Total Environ. 2021, 755, 4–10. [Google Scholar] [CrossRef]
Figure 1. Map of sampled sites: WWTP and COVID-19 hospitals.
Water 15 00799 g001
Figure 2. SARS-CoV-2 RNA quantification in 24 h composite samples in (A) raw and treated wastewater from 3 WWTP (pilot phase 23 September 2020 to 4 October 2020) and (B) disinfected and no disinfected effluents from 5 COVID-19 hospital (sampling period 7 October 2020 to 29 November 2020). The points are potential outliers defined as the extreme values outside the 1.5 interquantile range of each distribution.
Water 15 00799 g002
Figure 3. Adjusted Log10 SARS-CoV-2 RNA daily load and active cases temporal trend by WWTP, Mexico, October–November 2020. (A) Large WWTP; (B) Medium WWTP; (C) Small WWTP.
Water 15 00799 g003aWater 15 00799 g003b
Table 1. SARS-CoV-2 quantification in wastewater, average measurements, and basic characteristics of sampled WWTP and COVID-19 hospitals from 10 cities, Mexico, October–November 2020.
City, StateWWTPMunicipalities Served by WWTPRNA Copies/mL Median (min; max)Average Daily Flow (L/s), RangeAverage Daily Temperature (°C), RangeAverage Distance Traveled (km)Sewage System and WW CharacteristicsSampled COVID-19 HospitalHospital RNA Copies/mL Median (min; max)Reported Hospital WW Chlorination
Guadalajara, JaliscoAgua Prieta (AP)Zapopan, Guadalajara, Tlaquepaque542 (114.6; 4396.8)4599 (4009, 5330)23.7 (22.0, 25.3)8.3No dataHospital 1209.3 (0; 32,460)No
Mexico City, Mexico CityCerro de la Estrella (CE)Iztapalapa, Iztacalco, Benito Juárez, Coyoacán377.2 (84.3; 933.8)1867 (1303, 2505)19.3 (17.7, 20.3)16.5Only domestic dischargesNSNSNS
Puebla, PueblaSan Francisco (SF)Puebla, Cuautlancingo, San Pedro Cholula150.9 (54.1; 2379.3)1107 (985, 1219)21.0 (19.3, 22.0)5.6Industrial, chemical, and tourism discharges
6% Runoffs
NSNSNS
Mexicali, Baja CaliforniaZaragoza (ZA)Mexicali616.8 (0; 2037.8)882 (693, 1303)27.7 (23.9, 30.8)3.3Industrial, chemical, and tourism dischargesHospital 21240.5 (0; 21,223.2)No
León, GuanajuatoLeón (LE)León659.3 (66.3; 1378.5)522 (166, 1017)24.5 (22.8, 26.1)6.4Industrial, chemical, and tourism discharges
Runoffs
NSNSNS
Reynosa, TamaulipasReynosa I (RE)Reynosa128.6 (0; 451.8)488 (480, 495)26.6 (25.1, 28.4)6.9Industrial, chemical, and tourism discharges
17% Runoffs
Hospital 30 (0; 74.2)Yes
Cancún, Quintana RooNorponiente (NO)Benito Juárez159.9 (56.7; 423.7)216 (123, 273)29.1 (27.7, 30.3)2.5Only domestic dischargesHospital 40 (0; 0)Yes
Cuernavaca, MorelosAcapantzingo (AC)Cuernavaca39.7 (0; 181.2)259 (225, 316)20.4 (19.1, 21.4)4.1Industrial and tourism dischargesHospital 53393.6 (195.9; 94,936.3)No
Oaxaca, OaxacaLa Raya (LR)Santa Cruz Xoxocotlán, Ánimas Trujano, San Agustín de las Juntas, San Antonio de la Cal, Santa María Coyotepec, Oaxaca de Juárez, Santa Lucía del Camino, San Raymundo Jalpan, San Simón Almolongas, San Agustín Yatareni, San Andrés Huayápam, San Jacinto Amilpas322.9 (74.7; 646.6)33 (28, 38)23.6 (22.7, 24.2)9.5Industrial and tourism discharges
80% Runoffs
NSNSNS
Villahermosa, TabascoZona NoresteCentro0 (0,0)235 (12, 250)26.7 (24.6, 28.1)2Only domestic discharges
15% Runoffs
NSNSNS
Table 2. Correlation coefficients (Rho) and corresponding lead time days for WW SARS-CoV-2 RNA load compared to the clinical surveillance metric (active cases) by site, Mexico, October–November 2020.
Active Cases
WWTPCity, StateLag (Days)Maximum Rho
All sites 390.66
APGuadalajara, Jalisco2
37
0.71
0.62
CEMexico City, Mexico City1
39
0.82
0.91
SFPuebla, Puebla350.44
ZAMexicali, Baja California0
40
0.39
0.59
LELeón, Guanajuato400.75
REReynosa, Tamaulipas18
43
0.52
0.33
Table 3. WW-based estimated cases, catchment area population, and prevalence, compared to clinical-based active cases, municipal population, and prevalence for the period October–November 2020 in Mexico.
Wastewater (WW) SurveillanceClinical Surveillance at Municipal LevelWW/Municipal Ratios
WWTPCity, StateTesting Rate per 100,000Estimated Cases Median (min; max)Estimated Catchment Area PopulationEstimated Prevalence per 1000 People Median (min; max)Active Cases Median (min; max)Municipal PopulationActive Cases Prevalence per 1000 People Median (min; max)Estimated Cases/Active Cases Ratio Median (min; max)Estimated Prevalence/Active Cases Prevalence Ratio Median (min; max)
APGuadalajara, Jalisco1528 (Zapopan)53,295 (10,533; 423,940)1,454,42836.6 (7.2; 291.5)1993 (1673; 2493)3,456,6130.6 (0.5; 0.7)24.8 (6.3; 192.4)58.9 (15.0; 457.1)
CEMexico City, Mexico City5796 (Iztapalapa)12,293 (2342; 26,321)172,61071.2 (13.6; 152.5)5317 (3274; 5782)3,244,1111.6 (1.0; 1.8)2.4 (0.6; 5.4)45.7 (10.9; 102.0)
SFPuebla, Puebla3829 (Puebla)2779 (1024; 45,157)321,5978.6 (3.2; 140.4)1181 (993; 1754)2,561,1420.5 (0.4; 0.7)2.4 (0.9; 39.7)18.8 (6.9; 316.0)
ZAMexicali, Baja California30269698 (1940; 29,811)267,81536.2 (7.2; 111.3)543 (450; 1067)988,4170.5 (0.5; 1.1)16.4 (3.4; 66.2)60.6 (12.6; 244.5)
LELeón, Guanajuato346210,240 (1264; 21,845)428,68423.9 (2.9; 51.0)1284 (788; 2669)1,578,6260.8 (0.5; 1.7)7.8 (1.6; 19.6)28.8 (5.9; 72.2)
REReynosa, Tamaulipas21932129 (471; 6870)117,47118.1 (4.0; 58.5)114 (81; 153)646,2020.2 (0.1; 0.2)20.9 (3.8; 56.7)115.0 (20.9; 312.0)
NOCancún, Quintana Roo17301066 (420; 3032)148,1807.2 (2.8; 20.5)234 (153; 287)743,6260.3 (0.2; 0.4)5.5 (1.7; 13.8)27.8 (8.6; 69.4)
ACCuernavaca, Morelos2322262 (83; 802)16,33516.1 (5.1; 49.1)139 (103; 166)366,3210.4 (0.3; 0.5)2.0 (0.6; 5.4)45.9 (13.5; 121.5)
LROaxaca, Oaxaca72381846 (405; 3840)144,70712.8 (2.8; 26.5)548 (465; 717)477,7121.1 (1.0; 1.5)3.2 (0.8; 7.4)10.4 (2.5; 24.4)
Disclaimer/Publisher’s Note: The statements, opinions and data contained in all publications are solely those of the individual author(s) and contributor(s) and not of MDPI and/or the editor(s). MDPI and/or the editor(s) disclaim responsibility for any injury to people or property resulting from any ideas, methods, instructions or products referred to in the content.

